Identification of Cellulases from the Symbiotic Protists ...
Upload
bhupinder-singhCategory
view
212download
0
ORIGINAL PAPER
Response surface optimization for enhanced productionof cellulases with improved functional characteristicsby newly isolated Aspergillus niger HN-2
Harinder Singh Oberoi • Rekha Rawat •
Bhupinder Singh Chadha
Received: 21 July 2013 / Accepted: 17 October 2013 / Published online: 25 October 2013
� Springer Science+Business Media Dordrecht 2013
Abstract Fungi isolated from partially decayed
wood log samples showing characteristic diversity
for spore colour, colony morphology and arrangement
of spores were assessed for cellulolytic enzyme
production. Isolates showing a cellulolytic index of
C2.0 were assayed for filter paper (FP) cellulase and b-
glucosidase (BGL) production. Molecular character-
ization confirmed the identity of the selected cellulo-
lytic isolate as a strain of Aspergillus niger (A. niger
HN-2). Addition of 2 % (w/v) urea enhanced FP and
BGL activity by about 20 and 60 %, respectively.
Validation studies conducted at parameters (29 �C, pH
5.4, moisture content 72 % and 66 h) optimized
through response surface methodology in a solid-state
static tray fermentation resulted in FP, BGL, cellobio-
hydrolase I (CBHI), endoglucanase (EG), xylanase
activity and protein content of 25.3 FPU/g ds, 750 IU/
g ds, 13.2 IU/g ds, 190 IU/g ds, 2890 IU/g ds and
0.9 mg/ml, respectively. In comparison, A. niger N402
which is a model organism for growth and develop-
ment studies, produced significantly lower FP, BGL,
CBHI, EG, xylanase activity and protein content of
10.0 FPU/g ds, 100 IU/g ds, 2.3 IU/g ds, 50 IU/g ds,
500 IU/g ds and 0.75 mg/ml, respectively under the
same process conditions as were used for A. niger HN-
2. Process optimization led to nearly 1.8- and 2.2-fold
increase in FP and BGL activity, respectively showing
promise for cellulase production by A. niger HN-2 at a
higher scale of operation. Zymogram analysis revealed
two isoforms each for EG and cellobiohydrolase and
three isoforms for BGL. Crude cellulase complex
produced by A. niger HN-2 exhibited thermostability
under acidic conditions showing potential for use in
biofuel industry.
Keywords Aspergillus niger HN-2 � b-
Glucosidase � Filter paper cellulase � Nitrogen
sources � Solid-state fermentation �Thermostability � Zymogram
Introduction
Cellulases have attracted worldwide attention because
of their diverse applications in various industries, such
as, textile and laundry, pulp and paper, animal feed
and fruit juice processing (Bhat 2000; Zaldivar et al.
2001). The recent thrust on bioconversion of agricul-
tural and industrial wastes to value-added products has
led to an extensive research on cellulolytic enzymes.
Cellulases are indispensable in the bioconversion of
lignocellulosic biomass to simple sugars, such as
glucose, xylose and arabinose, which can be fer-
mented to ethanol for its use as a biofuel. Today, these
H. S. Oberoi (&) � R. Rawat
Central Institute of Post-Harvest Engineering and
Technology, P.O. PAU, Ludhiana 141 004, India
e-mail: [email protected]
B. S. Chadha
Department of Microbiology, Guru Nanak Dev
University, Amritsar, India
123
Antonie van Leeuwenhoek (2014) 105:119–134
DOI 10.1007/s10482-013-0060-9

enzymes account for *20 % of the world enzyme
market, and are mostly produced through fermentation
by fungi belonging to the genera Trichoderma and
Aspergillus (Juwaied et al. 2011). Fungi can be
cultivated in a relatively short time by established
fermentation methods for regular production of the
desired enzymes. More than 14,000 fungal species
have been found to be active in degrading cellulose.
The use of improved microbial strains, media compo-
sition and process controls significantly contribute to
cellulase production (Szengyel et al. 2000).
Cellulase is a multi-enzyme system composed of
several enzymes with numerous isozymes, which act
synergistically and catalyze the hydrolysis of cellulose
and cello-oligosaccharide derivatives (Chinedu et al.
2008). The enzymatic process for the depolymeriza-
tion of cellulose involves three types of enzymes:
Endoglucanase (EG or CX), hydrolyzes internal b-1,4
glucan chains of cellulose randomly, primarily within
amorphous regions, but displays low hydrolytic
activity toward crystalline cellulose. Exoglucanase
i.e., exo-acting cellobiohydrolases (CBH), removes
cellobiose from the non-reducing end of cello-oligo-
saccharide and also from the crystalline, amorphous
and acid- or alkali-treated cellulose; Cellobiase or b-
glucosidase (BGL) hydrolyzes cellobiose to yield two
molecules of glucose which completes the depoly-
merization of cellulose. In addition to the cellulolytic
enzymes, there are also a number of auxiliary enzymes
which attack hemicellulose, such as glucuronidase,
acetylesterase, feruloyl esterase, xylanase, b-xylosi-
dase, galactomannanase and glucomannanase.
Solid-state fermentation (SSF) holds tremendous
potential in production of commercially important
enzymes. It is a process wherein an insoluble substrate
is fermented with sufficient moisture, but without free
water. The inherent advantages of SSF processes for
production of secondary metabolites have been well
documented (Holker et al. 2004). In SSF, cellulosic
substrate acts as the carbon source and might also help
induce cellulase production. The contribution of the
enzyme cost to bioethanol production cost is quite
significant (Klein-Marcuschamer et al. 2012) and one
of the ways to reduce this cost is to use the crop residues
and by-products available at either no or a very low cost
as substrates in a SSF process. In addition, the
utilization of agricultural residues for enzyme produc-
tion might not only help in establishing a commercial
use for such residues, but also mitigate the
environmental pollution problems caused by their poor
disposal in developing countries, like India. However,
most of the agricultural residues are poor sources of
nitrogen whose main function is the synthesis of plastic
and catalytic proteins, which significantly affect the
microbial physiology (Zabel and Morrell 1992).
Nitrogen sources present in different forms play an
important role in the growth of the microorganisms and
also in induction of enzymes. Thus, it is important to
evaluate different nitrogen sources for enhanced
cellulolytic enzyme production.
Different parameters such as pH, temperature,
cultivation time and moisture content can critically
influence enzyme production. Optimization of multiple
parameters is time consuming, hence response surface
methodology (RSM) can be used to evaluate the
significance of several factors, especially when inter-
actions exist among factors and are complex to
determine. Previous studies in the area of enzyme
production and bioprocessing which used RSM-opti-
mized parameters reported high product yield and
productivity (Brijwani et al. 2010; Oberoi et al. 2012). It
is strongly felt that the use of cheap, readily available
substrates coupled with the use of optimized process is
likely to have a significant impact on cellulase produc-
tion cost which in turn can influence the bioethanol
production cost from lignocellulosic biomass. Since,
microbial strains require different process conditions
for production of enzymes in optimal concentrations, it
becomes imperative to optimize the enzyme production
parameters for different isolates. Present study was
thus, aimed to screen various fungal isolates from the
partially decayed wooden log sample; conduct pre-
liminary studies to screen the most efficient cellulolytic
strain; evaluate the ideal nitrogen source for cellulase
production by the screened strain; ascertain the cellu-
lase production capability of the screened isolate using
optimized parameters by RSM; validate the optimized
parameters in a static tray SSF process; conduct the
zymogram analysis and evaluate the thermostability of
crude cellulase consortium at different pH values.
Materials and methods
Materials
Rice (Oryza sativa) straw of variety Pusa-44 was
procured from the Agronomy research fields of Punjab
120 Antonie van Leeuwenhoek (2014) 105:119–134
123
Agricultural University (PAU), Ludhiana, India. Rice
straw (RS) was cut, dried and size reduced to about
1 mm prior to its use for enzyme production. Wheat
bran (WB) was procured from a local wheat flour mill.
All the analytical grade chemicals and media ingre-
dients were procured from Hi-Media Pvt Ltd (Mum-
bai, India). The substrates used for enzyme assays
were purchased from Sigma-Aldrich (St. Louis, MO,
USA).
Isolation and screening of cellulolytic fungi
Isolation of fungi was done from the partially rotten
wood log samples. The rotten wood log sample was
procured from the agricultural fields of PAU, Ludhi-
ana, India. The protocol used for inoculum preparation
from the rotten wood log sample was the same as
described by Sandhu et al. (2012). On the basis of the
spore colour, arrangement of spores and structure of
conidiophores, distinct colonies were picked and
streaked separately on Rose-Bengal Chloramphenicol
(RBC) agar medium for obtaining pure cultures.
Cellulase production by the isolates was observed
with the use of Gram’s iodine using plate assay method
(Kasana et al. 2008). All those isolates which showed
characteristic zones were examined visually and
microscopically for colony and hyphal characteristics.
Cellulolytic index (CI) was determined and expressed
by the ratio between the diameter of the degradation
halo and the diameter of the colony (Teather and Wood
1982). Isolates showing CI of 2.0 or greater than 2.0
were further characterized for their cellulolytic ability
by filter paper (FP) cellulase and BGL assays.
SSF for cellulase production
Ten grams RS and WB in the ratio 4:1 were used as
substrate for cellulase production in 250-ml Erlen-
meyer flasks (Brijwani et al. 2010; Dhillon et al. 2011;
Oberoi et al. 2012). Out of the twelve isolates showing
morphological diversity through visual and micro-
scopic examination, only four isolates showed a CI of
C2.0. Spores from these four isolates were collected
using sterile distilled water from the 4 days old RBC
culture plates. Moisture content of 70 % (w/w) was
adjusted with the Mandel Weber (MW) medium
solution. The flasks were autoclave-sterilized for
15 min, cooled and inoculated using 1 ml inoculum
having concentration of 1 9 107 spores/ml in different
flasks. Initial pH of 5.0 was adjusted with the use of
5 N HCl and 5 N NaOH. The flasks were incubated at
30 �C in an incubator for 5 days and assayed for
cellulase production. A set of three flasks were
analyzed at a regular interval of 24-h until 120 h.
The crude enzyme was harvested by addition of
100 ml citrate buffer (50 mM, pH 5) followed by
shaking of the contents of the flasks at 150 rpm at
25 �C for 30 min to have the enzyme extract in the
solution. The contents were subsequently filtered and
centrifuged at 4 �C, 10,0009g for 15 min. Superna-
tant was assayed for FP and BGL activity. FP activity
is a relative measure of the overall cellulose hydro-
lyzing capacity of microbial cellulase preparations
(Urbanszki et al. 2000). Presence of BGL in the
cellulase mixture is necessary for conversion of
cellobiose to glucose. The isolate showing maximum
FP and BGL activity was identified through molecular
characterization and subsequently used for enzyme
production experiments.
Enzyme assays
Filter paper cellulase activity was reported in FP units
per gram dry substrate (FPU/g ds) using IUPAC
procedures recommended by Ghose (1987) and BGL
activity was determined using 5 mM, 4-nitrophenyl b-
D-glucopyranoside (pNPG). EG activity was deter-
mined according to IUPAC method using 2 % (w/v)
carboxymethyl cellulose (CMC), while xylanase
activity was determined using 2 % (w/v) birchwood
xylan as substrate. Endoglucanase I (EGI) & cello-
biohydrolase I (CBHI) were measured using 4-nitro-
phenyl-b-D-lactopyranoside with or without 10 mM
cellobiose and 100 mM glucose. The CBHI activity
was thus calculated by the subtraction method of
Bailey and Tahtiharju (2003). One unit of enzyme was
defined as the amount of enzyme required to release
1 lmol of product (glucose equivalents for FP and
CMC, p-nitrophenol for BGL and CBHI and xylose
for xylanase) from the appropriate substrates per
minute under the standard assay conditions. Total
protein content was determined by the protein dye
binding method (Bradford 1976).
Molecular characterization of the screened isolate
Genomic DNA was extracted from the selected
cellulolytic fungal isolate using fungal genomic
Antonie van Leeuwenhoek (2014) 105:119–134 121
123

DNA isolation kit (Chromous Biotech Pvt Ltd,
Bangalore, India). For molecular characterization of
the fungal strain, the D1, D2 and D3 domains of the
26 s rRNA gene were amplified using the primer set
LROR (50-ACCCGCTGAACTTAAGC-30) and LR7
(50-TACTACCACCAAGATCT-30). The PCR proto-
col applied for amplification of the 26 s rRNA gene
followed in this study has been described previously
(Sandhu et al. 2012). The 901 bp amplicon, thus
obtained was sequenced with ABI 3130 genetic
analyzer (Applied Biosystems, Foster City, CA,
USA). The sequence was then compared with the
sequences in nucleotide database (NCBI) using the
BLAST algorithm. Multiple sequence alignment was
done with CLUSTAL W. The neighbour-joining
phylogenetic analysis was carried out with MEGA
software programme (Tamura et al. 2007).
Effect of nitrogen sources on cellulase production
Different nitrogen sources, such as ammonium sul-
phate, potassium nitrate, urea, beef extract and pep-
tone were evaluated for cellulase production by the
screened strain. The above nitrogen sources were
added separately at a concentration of 0.2 % (w/w) to
the basal medium composed of the substrate and 2 g/l
KH2PO4, 0.3 g/l MgSO4�7H2O, 0.3 g/l CaCl2�2H2O
and 0.1 % Tween 80 (w/w). Initial pH of the medium
was adjusted to 5.0 using 5 N HCl or 5 N NaOH.
Flasks containing 10 g substrate impregnated with
basal medium to a moisture content of 70 % (w/w) and
the nitrogen sources mentioned previously were
autoclave-sterilized for 15 min. The flasks were
cooled and inoculated with 10 % (w/v) inoculum
having spore concentration of 1 9 107 spores/ml,
incubated at 30 �C and a set of three flasks were
removed at a regular interval of 24-h until 120 h and
analyzed for FP and BGL activity.
Statistical optimization of parameters through
RSM
All the statistical optimization experiments were per-
formed in 250 ml Erlenmeyer flasks. A four-factor
central composite design (CCD), consisting of 27
experimental runs was employed. The experimental
design consisted of a 24 factorial design, eight axial
points and three replications at central points. The
design space consisted of four independent variables:
temperature (X1, �C), initial pH (X2), incubation time
(X3, h) and moisture content (X4, %). Response
variables were FP activity (Y1, FPU/g ds) and BGL
activity (Y2, IU/g ds). The range selected for optimi-
zation was: temperature (25–35 �C); pH (4.0–7.0);
incubation time (36–96 h) and moisture content (50–
80 %). The range for the four independent variables
was selected on the basis of our preliminary studies and
previously published work (Brijwani et al. 2010). Spore
and substrate concentration mentioned previously were
used during the optimization process. On the basis of
the results obtained from experiments on screening of
nitrogen sources discussed elsewhere in this paper; urea
was added to the basal medium at a concentration of
0.2 % (w/w) during the optimization process. Actual
values and corresponding values for the four indepen-
dent variables, X1, X2, X3 and X4 are mentioned in
Table 1. Experimental data from the CCD was ana-
lyzed using RSM algorithm Design-Expert 7.1 (Sta-
tease Inc., MN, USA) and fitted according to Eq. (1) as a
second-order polynomial equation including main
effects and interaction effects for each variable:
Yn ¼ b0 þX4
i¼1
biXi þX4
i¼1
biiX2i þ
X X4
i\j¼1
biXiXj
ð1Þ
where Yn is the predicted response, b0 is the constant
coefficient, bi is the linear coefficient, bii is the
Table 1 Independent variables and their coded levels chosen for optimization through CCD
Independent variables Symbol Coded levels
-2(-a) -1 0 1 2(a)
Temperature (�C) X1 20.00 25.00 30 35 40.00
pH X2 2.50 4.00 5.50 7.00 8.50
Incubation time (h) X3 6.00 36 66 96 126.00
Moisture content (%) X4 35.00 50 65 80 95.00
122 Antonie van Leeuwenhoek (2014) 105:119–134
123

quadratic coefficient, and bij is the interaction
coefficient.
Analysis of variance (ANOVA) and surface plots
were generated using Design-Expert 7.1 software.
Optimized values of four independent variables were
obtained using the numerical optimization package
and model graphs suggested by the software.
Solid-state static tray fermentation for cellulase
production
In our previous studies, we had successfully validated
the results of the preliminary/optimization experi-
ments in the solid-state static tray fermentation,
though the preliminary/optimization experiments
were conducted in flasks (Brijwani et al. 2010; Dhillon
et al. 2011). It is noteworthy to mention here that the
tray SSF method is generally employed for commer-
cial production of enzymes. Therefore, the validation
experiments were conducted in plastic trays having
dimensions: 40 cm (length), 25 cm (breadth) and
8 cm (height) as per the procedure of Dhillon et al.
(2011). Although, the optimization experiments were
conducted in flasks, validation studies were conducted
in trays as 555 g of RS and WB (90 % dry matter)
were mixed in the ratio 4:1 in glass beakers and
supplemented with 640 ml basal medium solution
containing urea (0.2 % w/v) to achieve a moisture
content of 72 % (w/w). Initial pH for the fermentation
process was adjusted to 5.4. The contents were
thoroughly mixed and autoclave-sterilized for
15 min. The material after sterilization was spread in
trays to achieve a depth of about 2 cm and this process
was carried out under sterile air in the laminar air flow.
The trays were covered with a wet muslin cloth and
incubated in a fumigated environment chamber main-
tained at 29 �C, 90–95 % RH for 66 h. The optimized
process parameters were obtained through the analysis
of the statistically designed process described else-
where in this paper. The trays were removed after 66 h
and the crude filtrate extract was analyzed for different
enzyme activities. All the experiments were conducted
in triplicate and the mean and SD values were
determined with the MS Excel software. In order to
appraise the potential of A. niger HN-2 for cellulase
enzyme production for commercial exploitation in
future, the production capability of this isolate was
compared with the N402 strain which is generally
considered as a model A. niger strain for growth and
development studies, under the same optimum condi-
tions, that were used for A. niger HN-2. The A. niger
N402 (MTCC 271) was procured from the Microbial
Type Culture Collection and Gene Bank (MTCC),
Institute of Microbial Technology (IMTECH), Chan-
digarh, India.
Zymogram analysis of cellulase enzyme
For visualization of EG isoforms, samples were
applied to 10 % (w/v). Native-PAGE gel containing
0.2 % (w/v) CMC. Following electrophoresis, gel was
washed with 0.1 M sodium citrate buffer (pH 5.0) and
incubated at 50 �C for 30 min. The gel was then
stained with congo-red dye (0.1 %, w/v) for 15 min
and visualization of the clear zones against the red
background was facilitated by washing the gel with
1 M NaCl. Zymogram analysis of the BGL and CBH
was carried out by incubating the native gel (10 %,
w/v) after electrophoresis in 0.1 M sodium citrate
buffer (pH 5.0) containing 10 mM 4-methylumbel-
liferyl-b-D-glucoside and 4-methylumbelliferyl-b-D-
lactopyranoside, respectively. The gel was incubated
at 50 �C for 15 min and the active bands were
visualized under UV light using gel documentation
system (Syngene-GBox, UK).
Temperature and pH stability
The temperature profiles of the crude cellulase were
assessed for FP and BGL activity and were obtained
between 30 and 80 �C. The optimal pH was deter-
mined by measuring the FP and BGL activity between
pH 3.0 and 10.0, using 50 mM acetate (pH 3.0–5.0),
phosphate (pH 6.0–8.0) and glycine NaOH (pH
9.0–10.0) buffers at 50 �C on the basis of the results
obtained from enzyme characterization studies men-
tioned elsewhere in this paper. For the determination
of temperature and pH stability, the enzyme aliquots
were incubated at different temperatures and pH range
for 0–360 min and assayed for FP activity. Samples
were drawn at 60 min interval and the residual activity
was determined using the standard assay method
described previously in this paper. All the experiments
were conducted in triplicate and mean and SD values
were calculated using the MS Excel software. The
LSD values for treatment means were calculated using
the JMP software (SAS Inc., MN, USA).
Antonie van Leeuwenhoek (2014) 105:119–134 123
123
Results
Screening of cellulolytic fungal isolates
Six out of the twelve fungal isolates were found to be
cellulolytic on the basis of sharp and distinct zone
around the colonies on the CMC agar plates. However,
only four out of the six isolates which showed a CI of
2.0 or above 2.0 were identified on the basis of the
spore colour, colour of the mycelium, colony diameter
and vesicle shape. On the basis of the colony
characteristics and microscopic examination for the
arrangement of spores and vesicle shape, the four
isolates were identified as strains of A. fumigatus,
A. flavus, A. oryzae and A. niger (Table 2).
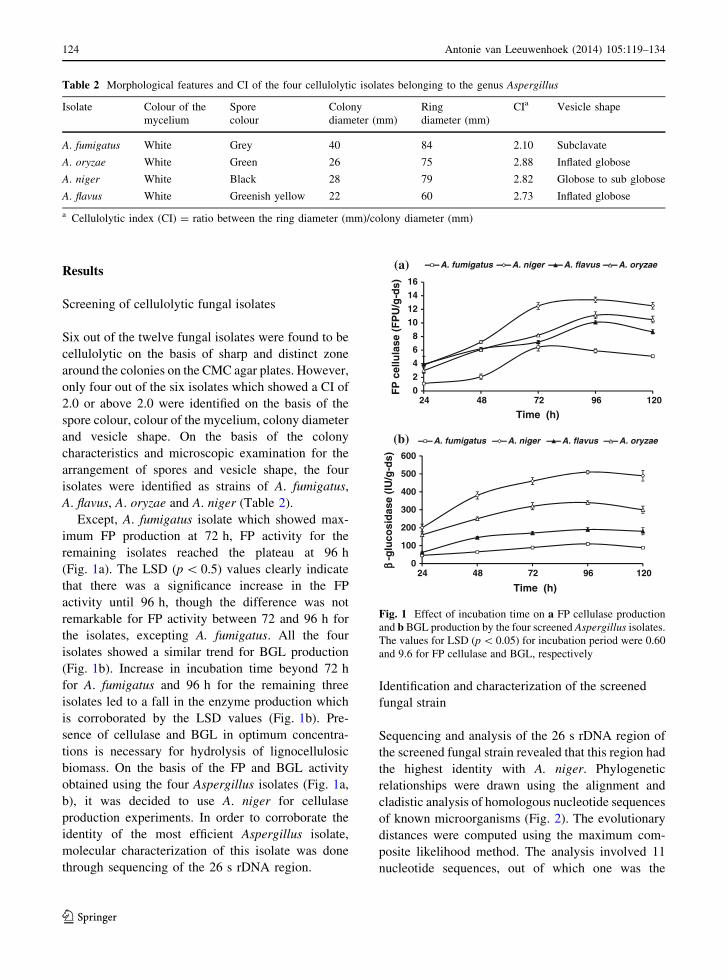
Except, A. fumigatus isolate which showed max-
imum FP production at 72 h, FP activity for the
remaining isolates reached the plateau at 96 h
(Fig. 1a). The LSD (p \ 0.5) values clearly indicate
that there was a significance increase in the FP
activity until 96 h, though the difference was not
remarkable for FP activity between 72 and 96 h for
the isolates, excepting A. fumigatus. All the four
isolates showed a similar trend for BGL production
(Fig. 1b). Increase in incubation time beyond 72 h
for A. fumigatus and 96 h for the remaining three
isolates led to a fall in the enzyme production which
is corroborated by the LSD values (Fig. 1b). Pre-
sence of cellulase and BGL in optimum concentra-
tions is necessary for hydrolysis of lignocellulosic
biomass. On the basis of the FP and BGL activity
obtained using the four Aspergillus isolates (Fig. 1a,
b), it was decided to use A. niger for cellulase
production experiments. In order to corroborate the
identity of the most efficient Aspergillus isolate,
molecular characterization of this isolate was done
through sequencing of the 26 s rDNA region.
Identification and characterization of the screened
fungal strain
Sequencing and analysis of the 26 s rDNA region of
the screened fungal strain revealed that this region had
the highest identity with A. niger. Phylogenetic
relationships were drawn using the alignment and
cladistic analysis of homologous nucleotide sequences
of known microorganisms (Fig. 2). The evolutionary
distances were computed using the maximum com-
posite likelihood method. The analysis involved 11
nucleotide sequences, out of which one was the
Table 2 Morphological features and CI of the four cellulolytic isolates belonging to the genus Aspergillus
Isolate Colour of the
mycelium
Spore
colour
Colony
diameter (mm)
Ring
diameter (mm)
CIa Vesicle shape
A. fumigatus White Grey 40 84 2.10 Subclavate
A. oryzae White Green 26 75 2.88 Inflated globose
A. niger White Black 28 79 2.82 Globose to sub globose
A. flavus White Greenish yellow 22 60 2.73 Inflated globose
a Cellulolytic index (CI) = ratio between the ring diameter (mm)/colony diameter (mm)
(a)
(b)
0
2
4
6
8
10
12
14
16
FP
cel
lula
se (
FP
U/g
-ds)
Time (h)
A. fumigatus A. niger A. flavus A. oryzae
0
100
200
300
400
500
600
24 48 72 96 120
24 48 72 96 120
ββ-g
luco
sid
ase
(IU
/g-d
s)
Time (h)
A. fumigatus A. niger A. flavus A. oryzae
Fig. 1 Effect of incubation time on a FP cellulase production
and b BGL production by the four screened Aspergillus isolates.
The values for LSD (p \ 0.05) for incubation period were 0.60
and 9.6 for FP cellulase and BGL, respectively
124 Antonie van Leeuwenhoek (2014) 105:119–134
123

sequence of the isolated Aspergillus strain and the
remaining ten were taken from the National Centre for
Biotechnology Information (NCBI). The evolutionary
analyses were conducted using MEGA 5 software and
the phylogenetic tree was prepared (Fig. 2). The
isolated fungal strain belonged to the same branch as
A. niger (NCBI Accession No. HM 008328) with
99 % homology in the 26 s rDNA region. On the basis
of the morphology and the comparison of 26 s rRNA
gene sequence, the isolated fungal strain was con-
firmed as a strain of A. niger and is henceforth referred
to as A. niger HN-2. The 26 s rRNA gene sequences
for A. niger HN-2 were submitted to GenBank under
Accession No. HQ 825091. The isolate A. niger HN-2
has been deposited with the Microbial Type Culture
Collection and Gene Bank (MTCC), Institute of
Microbial Technology (IMTECH), Chandigarh, India
with the Accession No. MTCC11098.
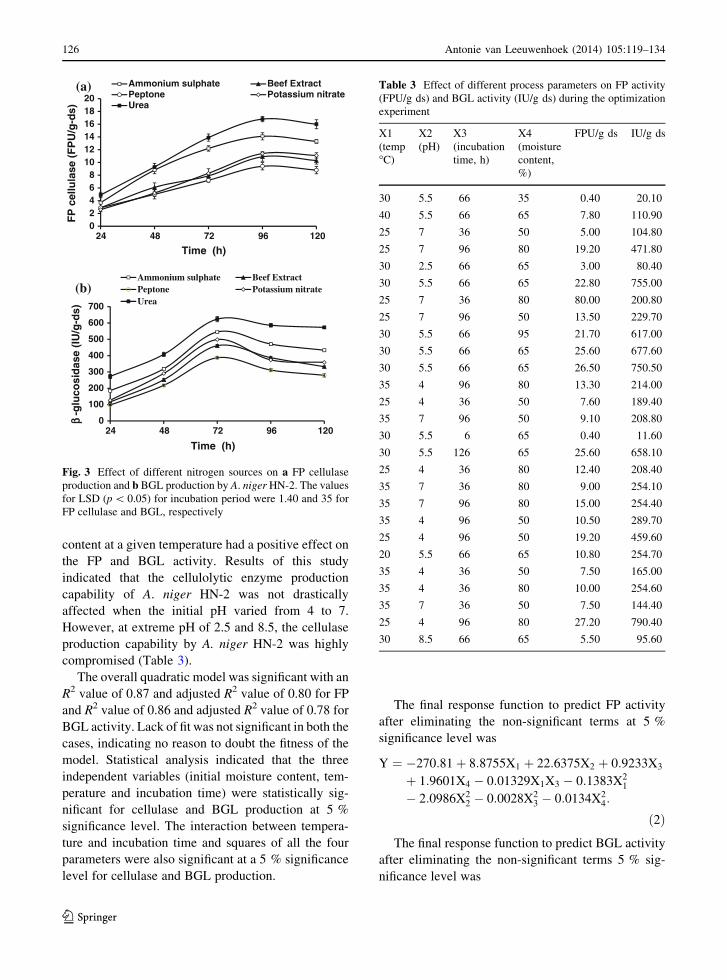
Effect of nitrogen sources on cellulase production
by A. niger HN-2
Addition of urea to the basal medium increased the FP
activity by nearly 20 %, when compared with the
activity obtained using MW medium (Fig. 3a). The
inorganic sources of nitrogen, such as ammonium
sulphate and urea significantly enhanced enzyme
production, compared to the organic nitrogenous
sources. Similar trend was observed in the case of
BGL production with the use of inorganic nitrogen
sources (Fig. 3b). The LSD (p \ 0.5) values clearly
indicate a significance increase in the FP and BGL
activity until 96 and 72 h, respectively after which a
fall in activity was seen (Fig. 3). An increase of about
33, 50 and 60 % in BGL production was observed with
the use of basal nutrient solution supplemented with
potassium nitrate, ammonium sulphate and urea,
respectively as compared to the activity obtained
using MW medium (Fig. 3b). In addition, the maxi-
mum BGL production was observed at 72 h after
incorporation of the nitrogen sources in the production
medium, leading to higher enzyme productivity. EG
and xylanase activity of 73.43 and 2,141.3 IU/g ds,
respectively were observed when urea was used as a
nitrogen source. On the basis of these results, it was
decided to use urea as nitrogen source along with the
basal nutrient solution during process optimization
through RSM.
Statistical optimization of cellulase production
by A. niger HN-2
The results presented in Table 3 showed a wide
variation from 0.40 to 27.2 FPU/g ds which reflects
the importance of process parameter optimization.
Highest FP cellulase activity (27.2 FPU/g ds) and
BGL activity (790.4 IU/g ds) were observed at 25 �C,
pH of 4.0, 80 % (w/w) moisture and incubation time of
96 h (Table 3). The data in Table 3 indicates that
increase in incubation time and higher moisture
Fig. 2 Phylogenetic
dendrogram for A. niger
HN-2 and related strains
with their accession
numbers based on the 26 s
rRNA gene sequence
Antonie van Leeuwenhoek (2014) 105:119–134 125
123
content at a given temperature had a positive effect on
the FP and BGL activity. Results of this study
indicated that the cellulolytic enzyme production
capability of A. niger HN-2 was not drastically
affected when the initial pH varied from 4 to 7.
However, at extreme pH of 2.5 and 8.5, the cellulase
production capability by A. niger HN-2 was highly
compromised (Table 3).
The overall quadratic model was significant with an
R2 value of 0.87 and adjusted R2 value of 0.80 for FP
and R2 value of 0.86 and adjusted R2 value of 0.78 for
BGL activity. Lack of fit was not significant in both the
cases, indicating no reason to doubt the fitness of the
model. Statistical analysis indicated that the three
independent variables (initial moisture content, tem-
perature and incubation time) were statistically sig-
nificant for cellulase and BGL production at 5 %
significance level. The interaction between tempera-
ture and incubation time and squares of all the four
parameters were also significant at a 5 % significance
level for cellulase and BGL production.
The final response function to predict FP activity
after eliminating the non-significant terms at 5 %
significance level was
Y ¼ �270:81þ 8:8755X1 þ 22:6375X2 þ 0:9233X3
þ 1:9601X4 � 0:01329X1X3 � 0:1383X21
� 2:0986X22 � 0:0028X2
3 � 0:0134X24:
ð2ÞThe final response function to predict BGL activity
after eliminating the non-significant terms 5 % sig-
nificance level was
(a)
(b)
02468
101214161820
FP
cel
lula
se (
FP
U/g
-ds)
Time (h)
Ammonium sulphate Beef ExtractPeptone Potassium nitrateUrea
0
100
200
300
400
500
600
700
24 48 72 96 120
24 48 72 96 120
ββ-g
luco
sid
ase
(IU
/g-d
s)
Time (h)
Ammonium sulphate Beef ExtractPeptone Potassium nitrateUrea
Fig. 3 Effect of different nitrogen sources on a FP cellulase
production and b BGL production by A. niger HN-2. The values
for LSD (p \ 0.05) for incubation period were 1.40 and 35 for
FP cellulase and BGL, respectively
Table 3 Effect of different process parameters on FP activity
(FPU/g ds) and BGL activity (IU/g ds) during the optimization
experiment
X1
(temp
�C)
X2
(pH)
X3
(incubation
time, h)
X4
(moisture
content,
%)
FPU/g ds IU/g ds
30 5.5 66 35 0.40 20.10
40 5.5 66 65 7.80 110.90
25 7 36 50 5.00 104.80
25 7 96 80 19.20 471.80
30 2.5 66 65 3.00 80.40
30 5.5 66 65 22.80 755.00
25 7 36 80 80.00 200.80
25 7 96 50 13.50 229.70
30 5.5 66 95 21.70 617.00
30 5.5 66 65 25.60 677.60
30 5.5 66 65 26.50 750.50
35 4 96 80 13.30 214.00
25 4 36 50 7.60 189.40
35 7 96 50 9.10 208.80
30 5.5 6 65 0.40 11.60
30 5.5 126 65 25.60 658.10
25 4 36 80 12.40 208.40
35 7 36 80 9.00 254.10
35 7 96 80 15.00 254.40
35 4 96 50 10.50 289.70
25 4 96 50 19.20 459.60
20 5.5 66 65 10.80 254.70
35 4 36 50 7.50 165.00
35 4 36 80 10.00 254.60
35 7 36 50 7.50 144.40
25 4 96 80 27.20 790.40
30 8.5 66 65 5.50 95.60
126 Antonie van Leeuwenhoek (2014) 105:119–134
123
Y ¼ �9288:80763þ 328:94742X1 þ 725:34861X2
þ 30:74643X3 þ 60:32403X4 � 0:45804X1X3
� 5:13937X21 � 67:63750X2
2 � 0:10052X23
� 0:42021X24:
ð3ÞThe lower p value and insignificant lack of fit
suggests the good fit of the quadratic model. A higher
coefficient of regression (R2) suggests that there was a
good agreement between the predicted and estimated
values. The results for two responses show similarity for
the significant factors and also for the significant
interaction, because production of cellulolytic enzymes
is drastically affected by process parameters, such as
moisture content, incubation time and temperature. In
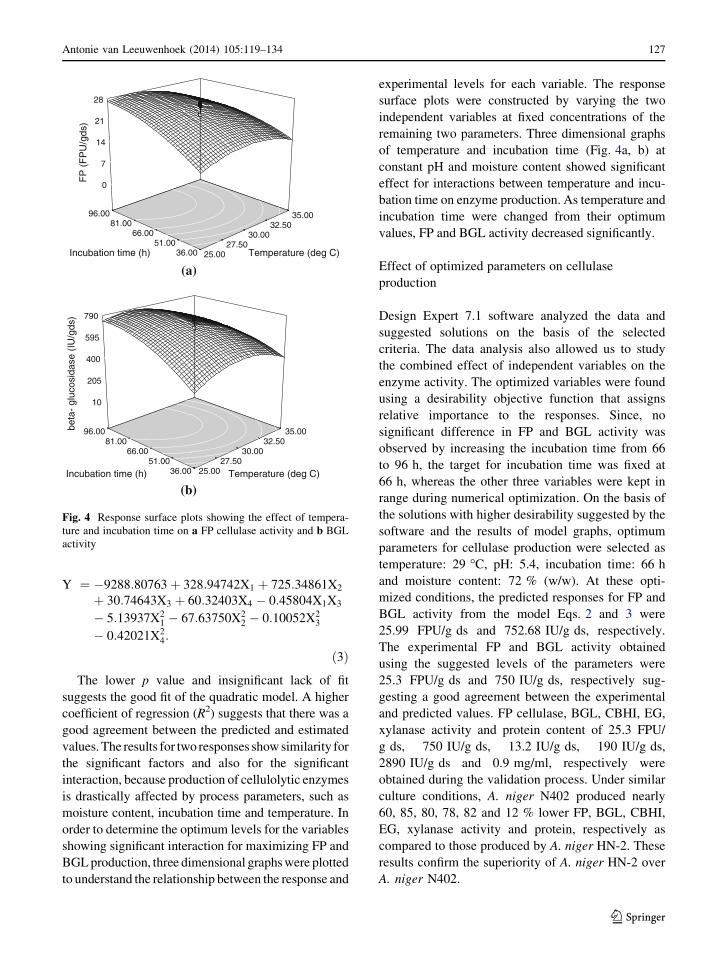
order to determine the optimum levels for the variables
showing significant interaction for maximizing FP and
BGL production, three dimensional graphs were plotted
to understand the relationship between the response and
experimental levels for each variable. The response
surface plots were constructed by varying the two
independent variables at fixed concentrations of the
remaining two parameters. Three dimensional graphs
of temperature and incubation time (Fig. 4a, b) at
constant pH and moisture content showed significant
effect for interactions between temperature and incu-
bation time on enzyme production. As temperature and
incubation time were changed from their optimum
values, FP and BGL activity decreased significantly.
Effect of optimized parameters on cellulase
production
Design Expert 7.1 software analyzed the data and
suggested solutions on the basis of the selected
criteria. The data analysis also allowed us to study
the combined effect of independent variables on the
enzyme activity. The optimized variables were found
using a desirability objective function that assigns
relative importance to the responses. Since, no
significant difference in FP and BGL activity was
observed by increasing the incubation time from 66
to 96 h, the target for incubation time was fixed at
66 h, whereas the other three variables were kept in
range during numerical optimization. On the basis of
the solutions with higher desirability suggested by the
software and the results of model graphs, optimum
parameters for cellulase production were selected as
temperature: 29 �C, pH: 5.4, incubation time: 66 h
and moisture content: 72 % (w/w). At these opti-
mized conditions, the predicted responses for FP and
BGL activity from the model Eqs. 2 and 3 were
25.99 FPU/g ds and 752.68 IU/g ds, respectively.
The experimental FP and BGL activity obtained
using the suggested levels of the parameters were
25.3 FPU/g ds and 750 IU/g ds, respectively sug-
gesting a good agreement between the experimental
and predicted values. FP cellulase, BGL, CBHI, EG,
xylanase activity and protein content of 25.3 FPU/
g ds, 750 IU/g ds, 13.2 IU/g ds, 190 IU/g ds,
2890 IU/g ds and 0.9 mg/ml, respectively were
obtained during the validation process. Under similar
culture conditions, A. niger N402 produced nearly
60, 85, 80, 78, 82 and 12 % lower FP, BGL, CBHI,
EG, xylanase activity and protein, respectively as
compared to those produced by A. niger HN-2. These
results confirm the superiority of A. niger HN-2 over
A. niger N402.
(a)
(b)
25.00 27.50
30.00 32.50
35.00
36.00 51.00
66.00 81.00
96.00
0
7
14
21
28
FP
(F
PU
/gds
)
Temperature (deg C) Incubation time (h)
25.00 27.50
30.00 32.50
35.00
36.00 51.00
66.00 81.00
96.00
10
205
400
595
790
bet
a- g
luco
sida
se (
IU/g
ds)
Temperature (deg C) Incubation time (h)
Fig. 4 Response surface plots showing the effect of tempera-
ture and incubation time on a FP cellulase activity and b BGL
activity
Antonie van Leeuwenhoek (2014) 105:119–134 127
123

Protein profile and zymogram analysis of cellulase
enzyme
Crude enzyme extract from A. niger HN-2 showed a
number of protein bands with differential intensities
indicating expression of different extracellular pro-
teins. The enzyme extract when analysed for activity
staining of different components of cellulase enzyme
complex viz., EG, CBH and BGL, showed variable
number of isoforms for each enzyme (Fig. 5). Zymo-
gram analysis for EG enzyme clearly indicated the
production of two isoforms corresponding to the
molecular size of about 55 and 42 kDa. On the other
hand, zymogram studies on CBH and BGL enzyme
revealed the presence of two and three isoforms,
respectively. The molecular weight of three isoforms
for BGL enzyme was estimated to be about 152, 130
and 51 kDa while it was 62 and 105 kDa for the two
isoforms of CBH enzyme.
Temperature, pH and stability of crude cellulase
consortium
Crude cellulases exhibited optimal FP and BGL
activity at 50 and 60 �C, respectively (Fig. 6a, b).
The pH profile showed more than 80 % FP and BGL
activity at a pH of 3.0–5.0 and 3.0–7.0, respectively
(Fig. 6b). However, decline in both FP and BGL
activity was seen at temperature beyond 70 �C and at
alkaline pH range. Crude enzyme exhibited relatively
more stability for BGL than FP activity at higher
temperature and alkaline pH range (Fig. 6a, b). The
stability of crude enzyme was studied for 360 min
within its near optimal pH range of 3.0–5.0 at
50–70 �C. At pH 3.0, the enzyme retained more than
80 % FP activity after 240 min at 50 and 60 �C,
whereas it retained only 65 % activity at 70 �C
(Fig. 7a). Crude enzyme was able to retain 100 %
FP activity after 240 min at pH of 4.0. At pH of 4.0, the
crude enzyme exhibited 83 and 70 % FP activity at 60
and 70 �C, respectively after 240 min (Fig. 7b). Crude
enzyme retained 80 % FP activity at pH of 5.0 until
180 min at 60 and 70 �C and until 240 min at 50 �C,
however, a sharp decline in enzyme activity was seen
beyond 240 min, irrespective of temperatures
(Fig. 7c).
Discussion
In order to economize the enzyme production process,
it is important to reduce the production time, so that
more number of batches could be completed in
relatively less time. In addition, the optimal time to
produce a desired concentration of enzymes also
depends upon the initial inoculum concentration,
moisture content of the medium, interaction of organ-
ism with substrate and incubation temperature. A fall
in enzyme activity after 72 or 96 h for different
isolates could possibly be due to the organism entering
Fig. 5 Molecular
characterization of cellulase
enzyme produced by A.
niger HN-2. Lane M
molecular weight markers,
Lane 1 SDS PAGE of crude
extract, Lane 2 Zymogram
analysis of EG, Lane 3 BGL,
Lane 4 CBH
128 Antonie van Leeuwenhoek (2014) 105:119–134
123

stationary phase of growth; depletion of the nutrients
and production of other by-products in the fermenta-
tion medium or combination of all of the above
mentioned factors. Initially, fungi consume the readily
available sugars and produce hydrolytic enzymes, but
due to reduction in sugar concentration with time, the
fungi begin to use these hydrolytic enzymes for
production of sugars, leading to a decline in enzyme
activity (Botella et al. 2005).
Incorporation of urea in the fermentation medium
significantly enhanced the cellulase production by
A. niger HN-2. Maeda et al. (2010) reported a
significant increase in cellulase production by Peni-
cillium funiculosum by incorporation of urea and
ammonium sulphate in the fermentation medium.
Jatinder et al. (2006) reported that addition of urea to
RS used as carbon source proved beneficial during
optimization of medium components for cellulase
production by Melanocarpus sp. MTCC 3922 under
SSF. The results obtained through the present study
indicate that supplementing the fermentation medium
with the inorganic nitrogen sources resulted in higher
cellulase production, compared to the organic sources.
This may be attributed to the fact that complex
substances like amino acids and vitamins in organic
nitrogen sources could trigger the biomass production,
thus making it unnecessary for the fungus to produce
cellulase (Reddy and Reddy 1985). The other advan-
tages associated with urea as a nitrogen source are its
easy availability, low price and buffering ability.
It is evident from the results of optimization
experiment that the initial moisture content, temper-
ature and incubation time had a significant effect on
cellulase production. Temperature is a cardinal factor
which affects the amount and rate of growth of an
organism and has profound influence on the
(a)
(b)
0
20
40
60
80
100
120
% R
elat
ive
acti
vity
Temperature (oC)
FP cellulasebeta-glucosidase
0
20
40
60
80
100
120
30 40 50 60 70 80
2 3 4 5 6 7 8 9
% R
elat
ive
acti
vity
pH
FP cellulase beta-glucosidase
Fig. 6 Activity profiles for FP cellulase and BGL at different
a temperatures and b pH range
(a)
(b)
(c)
0
20
40
60
80
100
120
% R
elat
ive
acti
vity
Time (min)
50 degC 60 deg C 70 degC
0
20
40
60
80
100
120
% R
elat
ive
acti
vity
Time (min)
50 degC 60 deg C 70 degC
0
20
40
60
80
100
120
60 120 180 240 300 360
60 120 180 240 300 360
60 120 180 240 300 360
% R
elat
ive
acti
vity
Time (min)
50 degC 60 deg C
Fig. 7 Stability of FP cellulase at different temperatures at
a pH 3.0 b pH 4.0 and c pH 5.0
Antonie van Leeuwenhoek (2014) 105:119–134 129
123

production of the desired end product. At lower
temperature, the transport of substrate across the cells
is suppressed resulting in lower product yields. At
higher temperature, the maintenance energy require-
ment for cellular growth is high due to thermal
denaturation of enzymes of the metabolic pathway
resulting in minimum product formation (Aiba et al.
1973). Moisture content of the fermentation medium is
one of the major factors that determines the success of
the process. Since, fungi are known to thrive in moist
environments; an optimum moisture level has to be
maintained for their efficient growth and production of
secondary metabolites. Lower moisture levels reduce
nutrient diffusion, microbial growth, enzyme stability
and substrate swelling, while higher moisture level
leads to particle agglomeration, gas transfer limitation
and competition from bacteria (Gowthaman et al.
1993). Gwande and Kamat (1999) reported maximum
xylanase production by A. niger when the ratio of WB
to mineral solution was kept at 1:5 (83 % moisture,
w/w). The change in pH from the initial pH value had a
little effect on FP and BGL activity within the
experimental range. Robustness against changes in
pH from its initial value during enzyme production
would be beneficial in shielding any adverse effect on
enzyme activity due to variations in pH. The optimum
pH for fungal cellulases varies from species to species,
though in most cases the optimum pH ranges from 3.0
to 6.0 (Niranjane et al. 2007). Maximum BGL
production by A. terreus was achieved at a pH in the
range of 4.0–5.5 (Pushalkar et al. 1995).
Validation studies conducted with A. niger HN-2 in
static trays using optimized parameters showed an
increase in FP and BGL activity by nearly 1.8- and 2.2-
fold, respectively. Cellulase activity obtained through
validation experiments was in close agreement with
the results predicted by the model equations, indicat-
ing successful validation of the model. In a previous
study, Soni et al. (2010) reported that A. fumigatus
fresenius strain (AMA) showed FP and BGL activity
of 9.73 FPU/g ds and 470 IU/g ds, respectively after
optimization of enzyme production parameters using
Box-Behnken design. Further, the concentrated cul-
ture extracts hydrolyzed Solka floc SW 40 and
bagasse, resulting in 90 and 87 % saccharification,
respectively. Optimization of process parameters
using the two step approach employing Plackett–
Burman and Box-Behnken designs, led to a two-fold
increase in BGL production by Paecilomyces variotii
MG3 (Job et al. 2010).
Zymogram studies revealed the presence of two
isoforms each for EG and CBH and three isoforms for
BGL. Our results are similar to the findings of some of
the recent studies wherein, multiple isoforms of EG,
CBH and BGL from Aspergillus sp. have been
reported (He et al. 2013; Kaur et al. 2013). Multiplicity
of cellulase enzyme is well known in several fungi. In
some cases, presence of multiple isoforms has been
shown to represent the products of separate genes i.e.
more than one gene encoding for proteins with EG
activity (Warren 1996). According to Willick and
Seligy (1985), some multiplicity may also be the result
of partial proteolysis during culture or storage, inter-
action and aggregation of enzymes with each other and
differential glycosylation of a common polypeptide
chain. Multiplicity in cellulases could be essential,
considering the vast and diverse roles these enzymes
play in fungal metabolism and survival. Differential
expression of the various enzymes could help the fungi
to respond positively to the rapidly changing
environments.
Thermal stability studies on crude cellulase con-
sortium produced by A. niger HN-2 showed more than
50 % retention for FP activity after 4 h at 70 �C. Half-
lives of 8 h at 60 �C and 1 h at 70 �C for crude enzyme
from A. niger has been reported previously (Aguiar
2001). Cellulases (EG) from A. fumigatus had a half
life of 330 min at 50 �C, declining slowly to 193 min
at 70 �C (Saqib et al. 2010). It is evident from the
results obtained in the present study that the crude
cellulase complex produced by A. niger HN-2 exhib-
ited better thermostability characteristics than the
crude cellulases produced by some of the other
Aspergillus strains (Aguiar 2001; Javed et al. 2009;
Saqib et al. 2010). As mentioned previously, differ-
ential expression of various enzymes as found in the
case of cellulase enzyme complex by A. niger HN-2
could be a plausible reason for adaptation of this
enzyme to varying temperature and pH conditions.
Thermostable enzymes are classified into three
groups, defined by their range of temperature stability:
moderately thermostable (45–65 �C), thermostable
(65–85 �C) and extremely thermostable ([85 �C)
(Yano and Poulos 2003). Thus, cellulase produced
by A. niger HN-2 could be classified in the category of
moderately thermostable to thermostable enzymes.
130 Antonie van Leeuwenhoek (2014) 105:119–134
123
The results obtained through this study are significant
as the crude cellulase complex exhibited thermosta-
bility at acidic pH range. The thermostability of
cellulases under acidic conditions is an important trait
for achieving simultaneous saccharification and fer-
mentation of lignocellulosic biomass to ethanol
(Senthilkumar and Gunasekaran 2005).
It is important to explore the enzymes which have
compatible pH optima with that of yeast so that
simultaneous saccharification and fermentation could
be efficiently employed for ethanol production from
lignocellulosic biomass. Advantages of simultaneous
saccharification and fermentation for ethanol produc-
tion have been well documented (Sandhu et al. 2012).
Crude enzyme stability at 50 �C, especially in the
acidic range is an important characteristic which could
be exploited for simultaneous saccharification and
fermentation.
It is clear from the results of this study that though
RS and WB are good sources of carbon and nutrients,
addition of a nitrogen source and supplementing the
fermentation medium with additional nutrients is
essential for augmenting cellulase production. How-
ever, maintenance of high humidity at a higher scale of
operation in SSF with fungi is still a challenge. Most of
the previous studies on cellulase production have not
analyzed the CBH activity which has an important role
to play in hydrolysis of cellulose. CBHI is the major
component of the cellulase system required for
degradation of crystalline cellulose and constitutes
about 60 % of the protein secreted by Trichoderma
reesei (Uusitalo et al. 1991). It is thus, important to
have all the components of cellulase in a single
enzyme mixture, thereby obviating the need for
addition of cellulase components separately. An
enzyme consortium having all the cellulase and
xylanase components might result in efficient hydro-
lysis resulting in both hexose and pentose sugars,
which could be subsequently fermented to ethanol,
which in turn is likely to have a substantial effect on
bioethanol production cost.
Gielkens et al. (1999) characterized the two CBH-
encoding genes from A. niger (cbhA and cbhB) and
reported that the overall structure of cbhB was similar
to those of fungal CBH of family 7, while cbhA lacked
the cellulose binding domain (CBD) and the linker
peptide. It is possible that cellulases with CBDs are
required in the early stages of cellulose degradation,
when most of the substrate is insoluble and at laterTa
ble
4S
um
mar
yo
fso
me
of
the
rece
ntl
yp
ub
lish
edre
sult
so
nce
llu
lase
pro
du
ctio
nu
sin
gd
iffe
ren
tsu
bst
rate
san
dm
icro
bia
lst
rain
sth
rou
gh
SS
F
Mic
rob
ial
stra
inS
ub
stra
teF
P(F
PU
/
gd
s)
EG
(IU
/
gd
s)
b-G
luco
sid
ase
(IU
/
gd
s)
Xy
lan
ase
(IU
/
gd
s)
CB
H(I
U/
gd
s)
Ref
eren
ces
Asp
erg
illu
so
ryza
eS
oy
bea
nh
ull
4.5
04
7.1
01
3.3
03
90
–B
rijw
ani
and
Vad
lan
i
(20
11
)
Asp
erg
illu
sn
iger
US
MA
I
1
Su
gar
can
eb
agas
se:
pal
mk
ern
el
cak
e(1
:1)
3.4
0–
––
–L
eeet
al.
(20
11)
Asp
erg
illu
sfu
mig
atu
sR
ice
stra
w:
wh
eat
bra
n(7
:3)
0.9
31
4.7
18
.51
42
.70
0.6
8S
her
ief
etal
.(2
01
0)
Asp
erg
illu
sfu
mig
atu
s
fres
eniu
s
Ric
est
raw
:w
hea
tb
ran
(1:3
)2
.11
40
.92
43
.70
44
4–
So
ni
etal
.(2
01
0)
Asp
erg
illu
sn
iger
MT
CC
79
56
Wh
eat
bra
n4
.55
13
5.4
42
1.3
9–
–S
uk
um
aran
etal
.(2
00
9)
Asp
erg
illu
sn
iger
NR
RL
Ap
ple
po
mac
e1
33
17
26
01
,41
2–
Dh
illo
net
al.
(20
12)
Asp
erg
illu
sn
iger
NS
2W
hea
tb
ran
17
.03
10
.03
3.0
––
Ban
sal
etal
.(2
01
2)
Asp
erg
illu
sn
iger
HQ
-1–
42
.43
05
.11
58
.5–
–Z
han
get
al.
(20
12
)
Asp
erg
illu
sn
iger
HN
-2R
ice
stra
w:
Wh
eat
bra
n(4
:1)
25
.30
19
07
50
2,8
90
13
.2P
rese
nt
stu
dy
Antonie van Leeuwenhoek (2014) 105:119–134 131
123

stages during solubilization of substrate, enzymes
without CBDs are preferred. This suggests that the A.
niger isolates can be suitable candidates for produc-
tion of the cellulase complex overcoming the limita-
tions that have been known for T. reesei for efficient
hydrolysis of lignocellulosic biomass. Most of the
previous studies conducted on the model A. niger
strain, such as N402 (ATCC 6497, MTCC 271),
extensively used for growth and development studies
have focused on strain improvement through muta-
genesis, gene cloning and expression for enhancing
cellulase and xylanase production by the recombinant
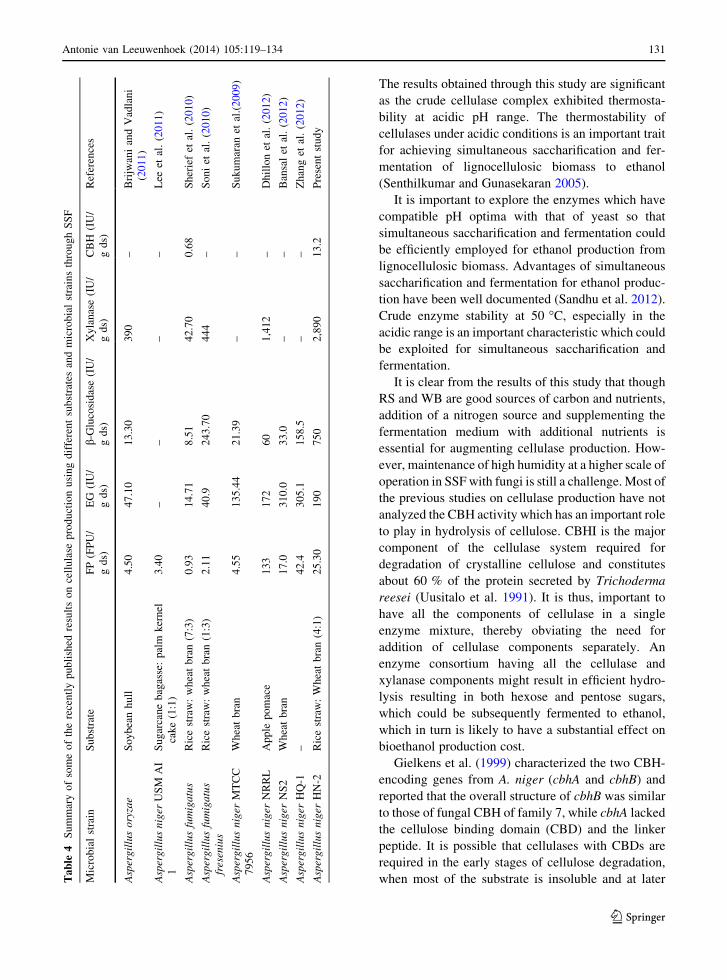
strains. Coupled with the results reported in Table 4 on
cellulolytic potential of different Aspergillus isolates
and the comparison of A. niger HN-2 with the
extensively studied model A. niger N402, it could be
inferred that the in overall terms, the cellulase activity
reported in the present study was significantly higher
than the activity reported for different cellulase
components in recently published literature. There-
fore, this study holds promise for cellulase production
using RS as a major substrate which is abundantly
available in countries like India at almost no cost. We
now plan to further manipulate the culture conditions
using metabolic foot printing methods for selective
expression of the desired isoforms and use this crude
enzyme preparation for the hydrolysis of the pre-
treated lignocellulosic biomass to evaluate its hydro-
lytic efficiency and also assess the commercial
feasibility of the crude cellulase preparation.
Conclusions
The use of agricultural residues and by-products,
optimized process parameters and use of A. niger HN-2
are likely to have a significant impact on cellulase
production as is evident from the results obtained in
this study. Experimental methods to enhance the
enzyme production are imperative for success in
biofuel industry, which uses enzymatic and microbial
fermentation platforms. Substantial increase in cellu-
lase production through statistical process optimiza-
tion using the newly isolated A. niger strain holds
promise for scale-up studies. The results obtained
through this study are significant as thermostability
under acidic conditions is required for effective ethanol
production from lignocellulosic biomass. This study
has therefore, set a platform for conducting cellulase
production studies through SSF at a higher scale of
operation using the optimized parameters and a newly
isolated A. niger HN-2 strain.
Acknowledgments Authors thankfully acknowledge the
financial assistance received under the NAIP Project (418301-
3) funded by World Bank from the Indian Council of Agricultural
Research, New Delhi, India for conducting this study.
References
Aguiar CL (2001) Biodegradation of the cellulose from sugar
cane bagasse by fungal cellulase. Ciencia e Tecnologia de
Alimentos 3:117–121
Aiba S, Humphrey AE, Millis NF (1973) Kinetics. In: Bio-
chemical Engineering. 2nd edn. New York, Academic
Press, pp 92–127
Bailey MJ, Tahtiharju J (2003) Efficient cellulose production by
Trichoderma reesei in continuous cultivation on lactose
medium with a computer-controlled feeding strategy. Appl
Microbiol Biotechnol 62:156–162
Bansal N, Tewari R, Soni R, Soni SK (2012) Production of
cellulases from Aspergillus niger NS-2 in solid state fer-
mentation on agricultural and kitchen waste residues.
Waste Manag 32:1341–1346
Bhat MK (2000) Cellulases and related enzymes in biotech-
nology. Biotechnol Adv 18:355–383
Botella C, de Ory I, Webb C, Cantero D, Blandino A (2005)
Hydrolytic enzyme production by Aspergillus awamori on
grape pomace. Biochem Eng J 26:100–106
Bradford MM (1976) A rapid and sensitive method for the quan-
tification of microgram quantities of protein utilizing the
principle of protein-dye binding. Anal Biochem 72:248–254
Brijwani K, Vadlani PV (2011) Cellulolytic enzymes produc-
tion via solid-state fermentation: effect of pretreatment
methods on physicochemical characteristics of substrate.
Enzym Res. doi:10.4061/2011/860134
Brijwani K, Oberoi HS, Vadlani PV (2010) Production of a
cellulolytic enzyme system in mixed-culture solid-state
fermentation of soybean hulls supplemented with wheat
bran. Process Biochem 45:120–128
Chinedu SN, Nwinyi OC, Okochi VI (2008) Growth and cel-
lulose activity of wild-type Aspergillus niger ANL301 in
different carbon sources. Can J Pure Appl Sci 2:357–362
Dhillon GS, Oberoi HS, Kaur S, Bansal S, Brar SK (2011) Value
addition of agricultural wastes for augmented cellulase and
xylanase production through solid-state tray fermentation
employing mixed-culture of fungi. Ind Crops Prod
34:1160–1167
Dhillon GS, Kaur S, Brar SK, Verma M (2012) Potential of
apple pomace as a solid substrate for fungal cellulase and
hemicellulase bioproduction through solid state fermenta-
tion. Ind Crops Prod 38:6–13
Ghose TK (1987) Measurement of cellulase activities. Pure
Appl Chem 59:257–268
Gielkens MM, Dekkers E, Visser J, Graaff LH (1999) Two
cellobiohydrolase-encoding genes from Aspergillus niger
132 Antonie van Leeuwenhoek (2014) 105:119–134
123

require D-xylose and the xylanolytic transcriptional acti-
vator XInR for their expression. Appl Environ Microbiol
65:4340–4345
Gowthaman MK, Raghava Rao KSMS, Ghildyal NP, Karnath N
(1993) Gas concentration and temperature gradient in a
packed bed solid state fermenter. Biotechnol Adv
11:611–620
Gwande PV, Kamat MY (1999) Production of Aspergillus xy-
lanase by lignocellulosic waste fermentation and its
application. J Appl Microbiol 87:511–519
He H, Qin Y, Chen G, Nan L, Liang Z (2013) Two-step puri-
fication of a novel b-glucosidase with high transglycosy-
lation activity and another hypothetical b-glucosidase in
Aspergillus oryzae HML366 and enzymatic characteriza-
tion. Appl Biochem Biotechnol. doi:10.1007/s12010-012-
9936-9
Holker U, Hofer M, Lenz J (2004) Biotechnological advantages
of laboratory scale solid-state fermentation with fungi.
Appl Microbiol Biotechnol 64:175–186
Jatinder K, Chadha BS, Saini HS (2006) Optimization of med-
ium components for production of cellulase by Melano-
carpus sp. MTCC 3922 under solid state fermentation.
World J Microbiol Biotechnol 22:15–22
Javed MR, Rashid MH, Nadeem H, Riaz M, Perveen R (2009)
Catalytic and thermodynamic characterization of endo-
glucanase (CMCase) from Aspergillus oryzae cmc-1. Appl
Biochem Biotechnol 157:483–497
Job J, Sukumaran RK, Jayachandran K (2010) Production of a
highly glucose tolerant b-glucosidase by Paecilomyces
variotii MG3: optimization of fermentation conditions
using Plackett–Burman and Box-Behnken experimental
designs. World J Microbiol Biotechnol 26:1385–1391
Juwaied AA, Al-amiery AAH, Abdumuniem Z, Anaam U
(2011) Optimization of cellulase production by Aspergillus
niger and Tricoderma viridae using sugar cane waste.
J Yeast Fungal Res 2:19–23
Kasana RC, Salwan R, Dhar H, Dutt S, Gulati A (2008) A rapid
and easy method for the detection of microbial cellulases
on agar plates using Gram’s Iodine. Curr Microbiol
57:503–507
Kaur B, Sharma M, Soni R, Oberoi HS, Chadha BS (2013)
Proteome-based profiling of hypercellulase-producing
strains developed through interspecific protoplast fusion
between Aspergillus nidulans and Aspergillus tubingensis.
Appl Biochem Biotechnol 169:393–407
Klein-Marcuschamer D, Oleskowicz-Popiel P, Simmons BA,
Blanch HW (2012) The challenge of enzyme cost in the
production of lignocellulosic biofuels. Biotechnol Bioengg
109:1083–1087
Lee CK, Darah I, Ibrahim CO (2011) Production and optimi-
zation of cellulase enzyme using Aspergillus niger USM
AI 1 and comparison with Trichoderma reesei via solid
state fermentation system. Biotechnol Res Int. doi:10.
4061/2011/658493
Maeda RN, da Silva MMP, Santa Anna LLM, Pereira JN (2010)
Nitrogen source optimization for cellulase production by
Penicillium funiculosum using a sequential experimental
design methodology and the desirability function. Appl
Biochem Biotechnol 161:411–422
Niranjane AP, Madhou P, Stevenson TW (2007) The effect of
carbohydrate carbon sources on the production of cellulase
by Phlebia gigantean. Enzym Microbial Technol
40:1464–1468
Oberoi HS, Sandhu SK, Vadlani PV (2012) Statistical optimi-
zation of hydrolysis process for banana peels using cellu-
lolytic and pectinolytic enzymes. Food Bioprod Process
90:257–265
Pushalkar S, Rao KK, Menon K (1995) Production of beta-glu-
cosidase by Aspergillus terrus. Curr Microbiol 30:255–258
Reddy AS, Reddy SM (1985) Production of extracellular cel-
lulase-hemicellulase complex by Macrophomina phaseo-
lina, the seed rot fungus of Sesame (Sesamum indicum).
J Indian Bot Soc 64:377–380
Sandhu SK, Oberoi HS, Dhaliwal SS, Babbar N, Kaur U, Nanda
D, Kumar D (2012) Ethanol production from Kinnow
mandarin (Citrus reticulata) peels via simultaneous sac-
charification and fermentation using crude enzyme pro-
duced by Aspergillus oryzae and the thermotolerant Pichia
kudriavzevii strain. Ann Microbiol 62:655–666
Saqib AAN, Hassan M, Khan FK, Baig S (2010) Thermosta-
bility of crude endoglucanase from Aspergillus fumigatus
grown under solid state fermentation (SSF) and submerged
fermentation (SmF). Process Biochem 45:641–664
Senthilkumar V, Gunasekaran P (2005) Bioethanol production
from cellulosic substrates: engineered bacteria process
integration challenges. J Sci Ind Res 64:845–853
Sherief AA, El-Tanash AB, Atia N (2010) Cellulase production
by Aspergillus fumigatus grown on mixed substrate of rice
straw and wheat bran. Res J Microbiol 5:199–211
Soni R, Nasir A, Chadha BS (2010) Optimization of cellulase
production by a versatile Aspergillus fumigatus fresenius
strain (AMA) capable of efficient deinking and enzymatic
hydrolysis of Solka floc and bagasse. Ind Crops Prod
31:277–283
Sukumaran RK, Singhania RR, Mathew GM, Pandey A (2009)
Cellulase production using biomass feed stock and its
application in lignocellulose saccharification for bio-etha-
nol production. Renew Energy 34:421–424
Szengyel Z, Zacchi G, Varga A, Reczey K (2000) Cellulase
production of Trichoderma reesei Rut-30 using steam-
pretreated spruce. Hydrolytic potential of cellulases on
different substrate. Appl Biochem Biotechnol 84:679–691
Tamura K, Dudley J, Nei M, Kumar S (2007) MEGA 4:
molecular evolutionary genetics analysis (MEGA) soft-
ware version 4.0. Mol Biol Evol 24:1596–1599
Teather RM, Wood PJ (1982) Use of congo red polysaccharide
interactions in enumeration and characterization of cellu-
lolytic bacteria from the bovine rumen. Appl Environ
Microbiol 43:777–780
Urbanszki K, Szakacs G, Tengerdy RP (2000) Standardization
of filter paper activity assay for solid substrate fermenta-
tion. Biotechnol Lett 22:65–69
Uusitalo JM, Nevalainen KM, Harkki AM, Knowles JK, Penttila
ME (1991) Enzyme production by recombinant Tricho-
derma reesei strains. J Biotechnol 17:35–49
Warren RAJ (1996) Microbial hydrolysis of polysaccharides.
Annu Rev Microbiol 50:183–212
Willick GE, Seligy VL (1985) Multiplicity in cellulases of
Schizophyllum commune. Eur J Biochem 151:89–96
Yano KS, Poulos TL (2003) New understandings of thermo-
stable, peizostable enzymes. Curr Opin Microbiol
14:360–365
Antonie van Leeuwenhoek (2014) 105:119–134 133
123
Zabel RA, Morrell JJ (1992) Wood microbiology, decay and its
prevention. Academic Press, San Diego, p 476
Zaldivar J, Nielsen J, Olsson L (2001) Fuel ethanol production
from lignocellulose: a challenge for metabolic engineering
and process integration. Appl Microbiol Biotechnol
56:17–34
Zhang H, Sang Q, Zhang W (2012) Statistical optimization of
cellulases production by Aspergillus niger HQ-1 in solid-
state fermentation and partial enzymatic characterization
of cellulases on hydrolyzing chitosan. Ann Microbiol
62:629–645
134 Antonie van Leeuwenhoek (2014) 105:119–134
123