Response of statically and dynamically loaded cylinders ...
128
Retrospective eses and Dissertations Iowa State University Capstones, eses and Dissertations 1964 Response of statically and dynamically loaded cylinders embedded in granular materials Douglas Charles Dowell Iowa State University Follow this and additional works at: hps://lib.dr.iastate.edu/rtd Part of the Applied Mechanics Commons is Dissertation is brought to you for free and open access by the Iowa State University Capstones, eses and Dissertations at Iowa State University Digital Repository. It has been accepted for inclusion in Retrospective eses and Dissertations by an authorized administrator of Iowa State University Digital Repository. For more information, please contact [email protected]. Recommended Citation Dowell, Douglas Charles, "Response of statically and dynamically loaded cylinders embedded in granular materials" (1964). Retrospective eses and Dissertations. 2658. hps://lib.dr.iastate.edu/rtd/2658
Transcript of Response of statically and dynamically loaded cylinders ...
Retrospective Theses and Dissertations Iowa State University Capstones, Theses andDissertations
1964
Response of statically and dynamically loadedcylinders embedded in granular materialsDouglas Charles DowellIowa State University
Follow this and additional works at: https://lib.dr.iastate.edu/rtd
Part of the Applied Mechanics Commons
This Dissertation is brought to you for free and open access by the Iowa State University Capstones, Theses and Dissertations at Iowa State UniversityDigital Repository. It has been accepted for inclusion in Retrospective Theses and Dissertations by an authorized administrator of Iowa State UniversityDigital Repository. For more information, please contact [email protected].
Recommended CitationDowell, Douglas Charles, "Response of statically and dynamically loaded cylinders embedded in granular materials" (1964).Retrospective Theses and Dissertations. 2658.https://lib.dr.iastate.edu/rtd/2658

This dissertation has been 64—10,635 microfilmed exactly as received
DO WELL, Douglas Charles, 1924— RESPONSE OF STATICALLY AND DYNAMICALLY LOADED CYLINDERS EMBEDDED IN GRANULAR MATERIALS.
Iowa State University of Science and Technology Ph.D., 1964 Engineering Mechanics
University Microfilms, Inc., Ann Arbor, Michigan

RESPONSE OF STATICALLY AND DYNAMICALLY LOADED CYLINDERS EMBEDDED
IN GRANULAR MATERIALS
by
Douglas Charles Dowell
A Dissertation Submitted to the
Graduate Faculty in Partial Fulfillment of
The Requirements for the Degree of
DOCTOR OF PHILOSOPHY
Major Subject: Engineering Mechanics
Approved :
In Charge of M'ajo Work
Head of Major Department
Dean of Graduate College
Iowa State University Of Science and Technology
Ames, Iowa
1964
Signature was redacted for privacy.
Signature was redacted for privacy.
Signature was redacted for privacy.

ii
TABLE OF CONTENTS
Page
I. INTRODUCTION 1
II. REVIEW OF LITERATURE 4
III. DIMENSIONAL ANALYSIS 7
A. General 7
B. Design of the Tests 17
IV. DESCRIPTION OF TEST EQUIPMENT 19
V. TEST PROCEDURE 41
VI. EXPERIMENTAL RESULTS 45
A. Surface Pressure-Strain Envelopes 45
B. Cycling Tests 52
C. Grain Size Tests 54
0. Comparison of Top and Bottom Gages 58
E. Flexural and Hoop Strain 58
F. Modeling 65
G. Pressure Variation 75
H. Dynamic Loading Tests 81
VII. EVALUATION AND ANALYSIS 96
A. Model Theory 96
B. Soil Bin Regions 97
C. Vertical Stress Variation 98
1. Stress transfer 98
2. Sidewall friction 100
3. Arching 102
D. Results Derived from the Analytical Model 112

ill
Page
VIII. SUMMARY AND CONCLUSIONS 115
A. Test Cylinder Behavior 115
B. Similitude Requirements 117
IX. REFERENCES CITED 119
X. ACKNOWLEDGEMENTS 122

1
I. INTRODUCTION
Since the advent of the atomic weapon as an instrument of
warfare, designers of structures which must remain operational
at all times have been increasingly interested in the use of
soil as a shield against the heat, radiation and blast effects
of these weapons. While the use of embanked surface struc
tures and partially buried structures has also oeen investi
gated, the major portion of the research work has been devoted
to the understanding of the effects of the various phenomena
on completely buried structures.
Because of the high cost of constructing and testing
full scale buried structures and because of the inaccessi
bility of atomic testing sites to most researchers, the
possible use of scale models to study the oehavior of struc
tures under dynamic loads is particularly attractive. Dropped
weights, small amounts of explosives, and shock tubes have
been used to generate the blast wave in seme studies. To
relate a model properly to its prototype, a general relation
ship between them can be developed by the use of dimensional
analysis. This technique involves the selection of the proper
variables which define the model-prototype relationship with
the subsequent development of dimensionless ratios from these
variables. These dimensionless ratios, called Pi terms, can
then be used to develop the similitude requirements between
model and prototype. In addition, this procedure assists in
the determination of how experimental tests should be conducted,

2
what data should be collected, and what factors may be
distorted.
As the result of an air blast, a shock wave is generated
which impinges upon the surface of the ground at an angle of
between 0 and 90 degrees from the vertical and penetrates in
to the subsoil. A shock tube can be used to simulate the air
blast since it also produces a shock wave which strikes the
surface of the soil and penetrates into it as a planar wave.
The angle of shock wave incidence is not easily varied over
its complete spectrum but both 0 and 90 degrees can be ob
tained with relatively simple adaptations to a shock tube.
Any structure embedded within the soil will thus experience
a dynamic loading condition.
Since dynamic tests are required to simulate the type of
shock wave loading which occurs with atomic weapons, rather
extensive facilities must usually be constructed for this
type of testing. However, if it were possible to determine
the relationship between the effects caused by dynamic and
static loads, it would be possible to conduct the somewhat
simpler static tests and then translate the resulting data
into meaningful information concerning the effect of dynami
cally applied loaas.
The principal objectives of the present investigation were :
1. To determine the variables and model design condi
tions which are pertinent to this type of problem.
2. To evaluate the model design experimentally.

3
3. To compare the effects of static and dynamic loading
on structures.
4. To determine if a small shock tube can be success
fully used as the loading device for model tests.

4
T T RFX/TFW OF T TTFRATÎÎPF
Past investigations into the effects of shock loadings on
buried structures can be grouped into two general categories :
(1) the theoretical aspects of a shock wave moving through
some medium and impinging upon a cavity or a structure, and
(2) the performance and analysis of experiments using either
full-scale structures and weapon blast effects or models with
a generated shock wave of some reduced size.
Most of the literature related to theoretical studies
concerns itself with the velocity or pressure of the shock
wave and the acceleration, velocity or displacement of the
structure upon which it impinges. In some works, such as by
Yoshihara, Robinson and Merritt (24), stresses in a buried
shell and medium are also considered. Mindlin and Bleich (11)
published in 1953 the results of a theoretical study concern
ing the effect of a plane shock wave moving through an
acoustic medium and striking a long cylindrical shell in which
dilatational, translational, and inextensional flexural modes
were considered. A following paper by Baron and Bleich (2)
included extensional effects. In 1960 Bleich (4) refined the
generalized equations describing the response of the cylinder
to the shock wave and extended the theory to other shapes
such as a parabola and a wedge. Also in 1960 a report by
Baron, Bleich and Weidlinger (3) was written which was con
cerned with the effect of ground waves caused by atomic
explosions on deep underground command posts in rock and

5
certain types of soil. At about the same time Huang, Iyengar
and Jennings (7) investigated the response of arches and domes
under dynamic loads. Soldate and Hook (19, 20) were the first
to obtain an analytical solution for the interaction of a
plane longitudinal stress wave with a hollow cylindrical shell
of finite dimensions and density and with elastic properties
different from those of the infinite elastic medium in which
it is embedded. Later, Aggarwal, Soldate and Hook (1) used a
model soil to obtain numerical solutions to the above problem
and found that after an initial jump in loading caused by the
impingement of the stress.wave on the cylinder, an unloading
and subsequent reloading occurred. Almost all of the preced
ing investigations result in equations which, even though
based on a number of simplifying assumptions, require computer
techniques to obtain a solution. The theories which can be
applied to the calculation of loads on buried structures are
for specialized cases using idealized materials ; thus their
application is limited.
A study which bridges the gap between theory and practice
was made by Newmark and Haltiwanger (15) for the Air Force
Special Weapons Center, which has sponsored a large number of
both theoretical and experimental works. This "Design Manual"
is used as a basis for the planning and design of structures
which must withstand the effects of nuclear weapons.
Within the past year there have been a number of reports
of experimental investigations concerned with the problem of

6
protecting underground structures from shock waves. Hendron
(6) investigated the behavior of sand in one-dimensional
compression to determine its stress-strain relationship and
the reasons for energy losses during a loading cycle. Luscher
and Hoeg (8) used soil cylinders, very soft metal cylinders
and a combination of the two to determine the effects of
arching and differential pressure on the cylinders while
testing them to destruction. Mason (10) used flat cylinders
of various materials to investigate arching and found that
very large overstresses are produced when a dynamic load is
applied to the soil bin containing these cylinders. Hanley
(5) investigated the effects of shock waves and static load
ings on a soil bin in which a long cylinder was embedded
vertically to serve as a model of a missile silo. In so doing,
he determined values of K, the ratio of horizontal to vertical
stress, at several depths under both static and dynamic load
ings. Marino (9) applied static pressures to embedded cylin
ders with hemispherical ends to determine the influence of
overpressure, model stiffness, and soil media on the soil-
structure interaction. The use of dimensional analysis to
correlate model and prototype behavior under the dynamic
loading of a shock tube and impacting weights is described by
Murphy, Young and Martin (14). Although many investigators
are working on this general problem, the amount of reliable
experimental data is limited. This is particularly true for
studies related to modeling.
7
III. DIMENSIONAL ANALYSIS
A. General
The use of dimensional analysis affords the possibility
of designing a model and prototype system without having to
know explicitly the exact equations which define the phenom
ena. However, it is a requirement that all the variables that
have an influence on the system must be known. If a proper
selection of variables can be made, dimensional analysis will
aid in reducing the number of variables to be investigated,
will help select a systematic method for data collection, and
also establish the principles for model design and analysis.
During the first phase of experimentation, a static air
pressure was applied to the surface of a filled soil bin in
which an instrumented cylinder was buried. The significant
variables for this problem may be separated into three
categories : (1) those related to the applied load, (2) those
describing the test structure, and (3) those related to the
soil.
If the strain < on the top of the test structure (a cyl
inder in this case) is selected as the dependent variable,
then all the independent variables which affect this strain
will be the parameters which will establish the similitude
requirements by the use of dimensional analysis. For the
static tests, the pressure p on the soil surface, and the
inside diameter s of the soil bin over which it is applied,
8
are the only parameters associated with load. The geometry
and characteristics of the structure can be defined by its
modulus of elasticity E, its shear modulus G, and the lengths
D, d, h, and a which are its outside diameter, wall thickness,
length, and the length of the strain gage mounted on it. The
selection of the significant parameters associated with the
soil is a more difficult problem. Two parameters which can be
chosen immediately are the soil grain size b and the depth of
soil Y over the cylinder. Other soil properties are dependent
upon whether the soil acts as an elastic, visco-elastic,
elasto-plastic or some other, type of material and must be
investigated further.
Little information is available on the soil properties
that affect load transmission and soil-structure interaction.
As reported by Murphy and Young (13), a relationship between
the soil characteristics of stress, strain and rate of change
of strain with time (strain rate) may be expressed as
c = f j_ ( €, € ) where o - , c, and c have the dimensions of FL
-1 none, and T respectively. Since these variables cannot be
combined into a dimensionless form, even when the above listed
soil characteristics are used, it is obvious that there are
some variables missing. Based on a knowledge of the usual
properties of most materials it may be assumed that these
missing properties (temporarily called j and k) have the form
of a "modulus of elasticity" and an "absolute viscosity"
having dimensions of FL and FL T respectively. All of these

9
i.terns may now be combined in a dimensionles» relationship
cr/j = f2 (e, kc/j). For a material which follows Hooka's
Law CT = Ec or o/E = e so that here j = E, k = 0, and
f2 = c. Materials having visco-elastic characteristics
follow the relationship o = Ee + nk or o/E = ç + /iê/E so
that now j = E, k = jj, and fg = f + /Ltf/E where /i is the
apparent viscosity. Finally, materials which exhibit ideal
elasto-plastic characteristics can be described by o/E = c
for € < cc and o/E = for e > ec where ec represents
the strain at the upper limit of the elastic range. Thus
j = E, k = 0 and fg = e for c < -€c and f^ = cc for c > ec.
Since the k term applies only to a dynamic situation, its
use will be delayed until that portion of the analysis is
discussed. It should be noted that because the above analysis
applies to both normal and shear stress, two new variables,
j and j1, should appear in our complete list of variables.
These variables will now be denoted as E£ and G . The
validity of the preceding analysis and the proposed soil
properties produced by using it can be determined only from
basic investigations of the soil characteristics and from
model studies using the analysis. It must be stressed that
the properties listed as being pertinent may be accepted,
modified or neglected as test results dictate.
It should also be reiterated that the listed properties
for the soil are of a general form and that they can represent
not only a modulus of elasticity but rather any soil property

10
having the same basic dimensivna. As a ma I lex ox" fact, a
number of other soil properties such as shear strength and
angle of friction could be listed but their inclusion would
require no additional design conditions if they were dimen
sionless or had the same basic dimensions as the listed soil
properties as long as the same material is used for prototype
and model. It has been assumed that the live load is large
compared with the dead load due to the weight of the soil
and therefore gravitational effects are neglected.
A listing of the pertinent variables is shown in Table 1.
Table 1. A listing of pertinent variables for static loads
No. Symbol Dimensions Variable
1 e None Strain
2D L Cylinder outside diameter
3d L Cylinder wall thickness
4 h L Cylinder length
5 Y L Depth of burial, measured from surface of soil to top of cylinder
6 a L Gage length of strain gage
7b L Grain size (average diameter of soil particles)
8s L Soil bin inside diameter _ n
9 p FL Pressure on the surface of soil
- 2 10 E FL Modulus of elasticity of cylinder
material
_ g 11 G FL Shear modulus of cylinder material

11
Table 1. (Continued)
No. Symbol Dimensions Variable
12 Eg FL Soil property related to normal stress
- 2 13 Gg FL Soil property related to
shearing stress'
The Buckingham Pi theorem, as described by Murphy (12),
states that the number of dimensionless and independent
quantities called Pi terms required to express a relationship
among the variables in any phenomenon is equal to the number
of quantities involved, minus the number of dimensions in
which those quantities may be measured. Therefore, 13 - 2 = 11
Pi terms will be required for this portion of the testing and
analysis. A possible set of Pi terms which meets the fore
going requirements is r c, = d/D, ir = h/D, = Y/D,
= a/D, n6 = b/D, = s/D, tiq = p/E, rr = G/E,
*10 = Es/E' ffn = VG-
Then tt^ = F^ ( flV,, Wg, "y» » "g» ""lO' ^11^
€ = (d/D, h/D, Y/D, a/D, b/D, s /D, p/E, G/E, E^/E, G^/G).
As one method of evaluating this relationship, testing
should proceed in such a manner that only one Pi term is
varied at a time and the effect of this variation on the de
pendent variable determined. In turn, other Pi terms are
varied and their effect on evaluated. If there is a
sufficiently small number of terms it is frequently possible

12
to determine a general analytical relationship between the
various Pi terms. However, when a large number of Pi terms
occur, as do here, it is quite difficult to determine such
a relationship.
Since the functional equation shown above is completely
general, it may be written as (7^, ^3 . . . itj_) for
the prototype and 7r l m = Fj_ ( ir2 m , 7r3 m . . . ir l l m) for the
model. As shown by Murphy (12), a prediction equation will be
developed if the first equation is divided by the second so
that
ÏÏ1 = F1 (*2. *3 . . . *11) nlm (ïï2m> ff3m • • • ^llm)
If F j ( 1 2 » ïï3 • • • "l l equal to F ( 2m ' 3m • • •
the prediction equation is obtained. The require
ment that the two functional relationships be equal results
in a set of design and operating conditions such that
770 = 7r0, Tu = tt„ . . . 77, . = 77. . which must be satisfied 2m z' 3m 3 11m 11
if true modeling is to occur. The previously developed
equations thus result in the following geometrical design
conditions :
1- dm/Dm = d/D 2. hm/Dm = h/D 3. Ym/Dm = Y/D
' am// m = a// • km/Dm = • sm/ m = s/D
These six conditions indicate that geometric similarity
is required between the model and prototype in all signifi
cant respects. The soil grain size was not scaled at all
times and thus design condition five was not satisfied.

13
Determination of the effect of this distortion was part of
the experimental program. Since the soil bin diameter and
thus the area over which the pressure was applied remained
constant rather than being scaled as is required by design
condition six, this condition was also distorted.
The remaining design conditions are 7. pm/Em = p/E
8- VEm = =/E 9- Esrr/Em = Es/E 10. Gsm/Gm = Gs/G.
Ordinarily these conditions are quite restrictive, but if
the same cylinder and soil materials are used for both model
and prototype, all conditions are satisfied if p = pm. It is
of note that during the static pressure testing phase, design
condition seven will be satisfied if the same cylinder ma
terial is used for both model and prototype. However, the
loading design condition does create certain requirements which
cannot be met during the dynamic testing phase of this ex
perimental work as is discussed later.
If the same soil material is not used for both model and
prototype, then more information about the assumed properties
of the soil must be obtained so that the properties can be
measured and used in the Pi terms.
If all the requirements of the foregoing design condi
tions are met, the strain experienced by the model should be
the same as that experienced by the prototype, em = e. How
ever, if one of the design conditions is violated (number 5,
for example), a distortion factor a must be introduced so
that bm/Dm = ab/D, which will in turn require that a

14
prediction factor ôj_, be used so thai t = oj_€m.
During the second phase of the testing a shock wave was
used to apply a dynamic load to the soil bin surface. Since
the previously described soil property k is dependent upon
rate of change of strain with time (strain rate) it will now
be included in the list of variables and will be designated
as and to represent the soil property related to
normal and shearing stress respectively. The variable time
t must now be added as well as the density of both the cyl
inder and the soil (p^ and p^) to include inertial effects.
The previously listed pressure p is now a function of time.
The pertinent variables for dynamic testing (in addition
to those presented in Table 1) are listed in Table 2.
Table 2. Additional variables pertinent to dynamic loading
No. Symbol Dimensions Variable
14 t T Time
15 Pi FT2L"4 Density of the cylinder
16 P2 ft2l~4 Density of the soil
17 -2
FTL Soil property related to normal stress
18 Ms FTL"2 Soil property related to shearing stress
It is now necessary to have 18 - 3 = 15 Pi terms. The
additional Pi terms selected are ir^ = P^/Pg, 3 = Mn/Ms»
ff14 - /Mn ' 15 = '
15
Now it = F (ir2, ir^ . , . ir^)
€ = Fg (d/D, h/D, Y/D, a/D, b/D, s/D, p/E, G/E, E^/E, Gg/G,
P /Pg, Pn/ s' PgD /pt2:
The first ten design conditions are listed before.
In addition, there are now 11. = P /Pg
•*-2 " nrr/ sm - Mn/Ms • Pgm m /' nm m = Pg /Vnt
• Pgm^m /Pm"^m = /pt •
Design condition 11 requires that the density of the P
model cylinder (Pj_m) be equal to ^ P2m' Since all of the
cylinders used in this experiment are made of aluminum, the
density is constant, p, - p, . Therefore the density of the ' InV
model soil must be the same as the prototype soil, that is,
the same soil must be used for both model and prototype.
If this is done, then design condition 12 is also satisfied.
However, if the same soil is used throughout, design condition
13 requires that Dm2/tm = D2/t or t/t = D2/Dm2 = n2
in which D/D^ represents the length scale n. Then design
condition 14 requires that = D2/pt2 or
t/tm = D/D = n since design condition 7 requires
p = pm if E = Em. Here is a contradiction which must
be eliminated, for the time scale cannot be equal to both
n and n2 unless the length scale n = 1, a case which de
feats the purpose of model study.
There are two alternatives, other than going to a dif
ferent combination of materials, from which to select a
solution to the above problem. A distorted Pi term may be

16
used and a prediction factor determined or one of the soil
properties may be disregarded. The report by Murphy, Young
and Martin (14) indicates that the variables related to
strain rate effects may be neglected for non-cohesive
materials, such as the dry sand used in the present experi
mental program. Reports by Selig and Vey (18) and by Whitman
and Healy (23) confirm that this is true for dry sands.
Therefore the soil properties ^ and ^ and design condi
tions 12 and 13 were eliminated from further consideration.
It should be noted that while this procedure is valid here,
it probably would not be true for a highly cohesive soil.
For cohesive soils it will probably be necessary to resort
to a distorted Pi term and a prediction factor, or to a
different combination of materials.
A problem remains since design condition 14 requires
that t/t = n. While this is a reasonable design condition
for most test arrangements, it becomes impossible to fulfill
when applied to a shock tube which has a constant rise time.
Prior use of the shock tube as the source of impact pressure
upon the soil surface has shown that the rise, hold, and
decay times (as defined in the next section) must be identical
for model and prototype to produce identical pressures, as
required by design condition seven, with E = E . Therefore
design condition 14 is distorted and a distortion factor must
2 2 2 2 be applied such that p D /p t = v p.D /pt . Then a
2m m rm m 2 r
prediction factor 6^ can also be used so that c =

17
B. Design oi the Tests
The purpose of most model studies is to predict the
effect of various prototype phenomena by scaling measurements
from a model. In many studies of this type, the actual proto
type is not available as a check on the predictions derived
for it from the model. In this case, tests can be conducted
on a number of models of various scaled sizes in which one
of the models is considered as the prototype. If measurements
of the other models can then be used to predict the effects on
the designated model, the design can be used with an addition
al degree of confidence when applied to the actual prototype.
For the present experimental work, small cylinders were
selected as the test structures since they were readily avail
able and easily workable to obtain the required geometric
similarity. Dry Ottawa sand was selected as the soil because
of its properties, availability, and ease of handling.
Since one of the major purposes of this work was to
determine the validity of the model design and to investigate
the effect of varying the design parameters, the tests were
so arranged that only one variable or design condition was
varied at a time while the remaining ones were held constant.
In this way the effect of grain size, depth of burial and
pressure on the strain experienced by the test cylinders
could be determined.
Certain special problems are encountered in using test
equipment of small size as was done in the present study.
18
Ordinarily a soil bin can be constructed of such a size that
its diameter is much greater than the largest dimension of
the model to be tested. However, the 3^" inside diameter of
the available shock tube not only limits the length of the
test cylinders but also can cause certain sidewall effects
which are not usually significant.
The use of a small soil bin and shock tube provides
several advantages which serve to offset the problems
mentioned above. Among these are the small cost of con
structing and operating the shock tube, the low cost of
making test structures, the ease of positioning structures
in the soil bin, the small amount of time required to prepare
the test structure and soil bin for testing, the small
amount of soil required in the bin, and the ease of control
ling the design conditions. Since there are several
apparent advantages in using a small model system, it is of
importance to determine what limitations on size do exist.

19
IV. DESCRIPTION OF TEST EQUIPMENT
The major item of test equipment used in the tests
described herein is a shock tube with an inside diameter of
3'4". A photograph and a schematic of the shock tube as
assembled for the dynamic phase of the testing are shown in
Figures 1 and 2 respectively. From top to bottom, the tube
consists of a 30" long compression chamber, a 7/8" thick
diaphragm holder, a 60" long expansion chamber, a l!$" thick
sidewall fixture for the pressure transducer, and a 24"
long soil bin. This provides a pressure chamber with an
effective length of 30 7/16" and an expansion chamber with
an effective length of 61 15/16". While designed to with
stand internal pressures of 500 psig, the maximum pressure
actually used in the compression chamber was 85 psig since
that is the available pressure in the air supply. To obtain
the shock, a diaphragm consisting of several layers of
cellulose'acetate was placed in its holder, as can be noted
in Figure 3, and punctured with a pointed plunger, which
caused the acetate to completely shatter and allow the shock
front to move down the expansion chamber and impinge upon the
soil bin. Other materials such as Mylar were tested for use
as a diaphragm material but the acetate provided a shock wave
with the highest maximum pressure and the shortest rise time.
Prior to breaking the diaphragm, the air pressure in the
expansion chamber was atmospheric (14.5 psia).
The pressure-time curve described by the wave generated

Fig. 1. Test equipment for dynamic testing

itaSi:

22
-»)3 Vk-AIR ll.D. I INLET^
-d4=ra
PLUNGER
30
" •
8
60
:
f6
24
1
1
PRESSURE CHAMBER
DIAPHRAGM HOLDER
VIBRATION PICKUP
TRIGGER SIGNAL
EXPANSION CHAMBER
SIGNAL AMPLIFIER •
i PRESSURE TRANSDUCER FIXTURE
PRESSURE SIGNAL
SOIL BIN
RM-45A OSCILLOSCOPE
TRIGGER SIGNAL
MODEL 502
OSCILLOSCOPE
STRAIN SIGNAL
ELLIS BRIDGE
NOT TO SCALE
FIG. 2. SCHEMATIC OF TEST EQUIPMENT.

Fig. 3. Diaphragm material and fixture

24

25
in a shock tube when it strikes a surface is one characterized
by a very rapid rise in pressure from atmospheric to a steady
"hold" pressure level followed by a smaller rise to the peak
pressure and a subsequent exponential decay to the original
pressure. The times associated with each of these phases
are rise time, the time for the pressure to rise to its
approximately steady level; hold -time, the time that the
pressure stays at the steady and peak pressure; and decay
time, the time for the pressure to decay to the atmospheric
level. It is stated by Ricklefs (16) and confirmed by the
experiments described herein that the rise time of the
pressure pulse is less than two microseconds. The hold time
for the shock tube is about four milliseconds followed by a
decay time of about 10 2/3 milliseconds. When the compres
sion chamber was filled to a pressure of 85 psi, an average
hold pressure of 61 psi and an average peak pressure of 72.5
psi were obtained.
As can be seen in Figure 4, the same shock tube was used
for the static loading phase of the tests except that no
diaphragm was used, the diaphragm holder and pressure trans
ducer fixture were removed, and the pressure was increased
at a slow rate. In both phases of the testing, the- soil bin
was covered with a thin sheet of rubber and a sheet of 1 mil
Mylar to prevent air from leaking into the bin.
The shock tube is equipped with a lever device so that
the pressure chamber may be raised and the diaphragm holder
Fig. 4. Test equipment for static testing

27

28
easily removed for replacement of the diaphragm materia 1 =
A lever device was also used to operate the plunger to break
the diaphragm. A small dolly was built to allow the soil
bin to be rolled out from under the shock tube, thus allow
ing the cylinder to be repositioned and the sand reworked
easily. See Figure 5.
Measurements of the strain experienced on the surface
of an embedded cylinder were obtained by placing these
instrumented cylinders at various depths in the soil bin
and allowing the load caused by either the static or
dynamic air pressure to strain the cylinders and cause a
signal to be transmitted from the strain gages mounted
thereon. Two sizes of cylinders were used; one with a
nominal outside diameter of 1", an inside diameter of 7/8"
and a length of 2", the other with a nominal O.D. of ,
an I.D. of 7/16", and a length of 1". The actual dimensions
of the test cylinders and their related dimensionless ratios
are listed in Table 3 in which D, d, and h represents the
test cylinder outside diameter, wall thickness and length
respectively, while s is the diameter of the soil bin.
Table 3. Test cylinder data
~ I.D. O.D. Length d h js Cyl. No. in. in. in. D D D
1 0.4326 0.5003 1.002 0.0677 2.003 6.496 2 0.4340 0.5012 1.004 0.0670 2.003 6.484

Fig. 5. Soil bin

30

31
Table 3, (Continued
Cyl. No. I.D. O.D. Length d h s
Cyl. No. in. in. in. D D D
3 0.4346 0.5010 1.002 0 .0663 2.000 6 .487 5 0.8684 1.0012 2.004 0 .0663 2.002 3 .246 6 0.8688 1.0010 2.003 0 .0660 2.001 3 .247 8 0.8676 1.0011 2.004 0 .0667 2.002 3 .246 9 0.8672 1.0013 2.004 0 .0670 2.001 3 .246
The cylinders were constructed by swaging existing
6061-T6 aluminum tubing stock to the correct inside diameter
and then machining the exterior to the correct outside
diameter. Foil strain gages were mounted on each cylinder
in the positions shown in Figure 6.
diamete] cylinder
1" diameter cylinder
Fig. 6. Location of strain gages

32
A type C12-121A Budd Metal film gage with a gage length of
1/8" was used on the V2" diameter cylinders, and a type
C12-141 Budd Metalfilm gage with a gage length of V was
used on the 1" diameter cylinders. Both types are temper
ature compensated for use on aluminum. The metalfilm gages
were selected for use because of their relative insensitivity
to transverse strains. An attempt was made to also install
gages on the interior of the diameter cylinders but none
were mounted successfully. A photograph of the cylinders
with gages mounted and lead wires attached is shown in
Figure 7.
The signal from the strain gages was measured in either
of two ways. For static testing, wires from the gages were
connected directly to a Balwin-Lima-Hamilton type N strain
indicator or to an Ellis model B-l bridge and then to a
Tektronix model 502 oscilloscope. The Ellis bridge and the
model 502 oscilloscope were also used during dynamic testing.
One other method attempted was the use of a Tektronix model
555 oscilloscope utilizing a type Q plug-in unit to transform
and amplify the gage signal. However, the somewhat limited
frequency response of the Q unit as compared to the Ellis
bridge and the 502 oscilloscope led to the eventual use of
the latter combination exclusively. A Tektronix type C-12
Polaroid oscilloscope camera was used on the 502 oscilloscope
to record the strain-time trace.
Measurements of static pressure were made with a Bourdon

Fig. 7. Instrumented test cylinders

34

35
test gauge manufactured by the American Steam Gauge and Valve
Company. This gauge was calibrated with a dead weight tester
prior to use and found to be accurate within less than
±0.5 psi.
Measurements of dynamic pressure were obtained by mount
ing an Endevco model 2501-500 dynamic pressure pickup in the
sidewall of a special fixture placed between the soil bin and
the expansion chamber. In this manner values of pressure at
a point 0.75" above the soil bin surface were obtained. The
signal from the pickup was transmitted through a D.C. powered
cathode follower to a Tektronix type RM-45A oscilloscope. A
permanent record of the pressure-time trace was obtained by
using a Beattie-Coleman oscillotron Mark II Polaroid camera
mounted directly on the RM-45A oscilloscope. During one phase
of the testing, two pressure pickups and cathode followers
were used simultaneously to provide a comparison between indi
cated sidewall pressure and indicated pressure at various
depths in the soil. To do this, one pickup was mounted in
its usual sidewall fixture while the other was mounted in a
flat brass plate and positioned at various depths in the soil
bin. The two fixtures are shown in Figures 8 and 9. The
pulses from these two pickups were placed on the same oscil
loscope and the traces appear on the same photograph.
The difficult problem of triggering the oscilloscopes
at the proper time was solved by mounting a Brush DP-1
vibration pickup on the shock tube just below the top of the

4
Fig. 8. Pressure transducer sidewall fixture

37

Fig. 9. Pressure transducer soil bin fixture

39

40
expansion chamber. When the shock wave passed by the Brush
pickup, a signal (of size based on the pickup sensitivity of
0.46 RMS volts to 0.001" of motion) was transmitted to the
external trigger jack of the RM-45A oscilloscope. To obtain
a clear trace of the strain or pressure pulse it is desirable
to have only one sweep of the trace across the screen. This
is a simple matter when using the RM-45A scope for it has a
single sweep position switch. However, the 502 oscilloscope
used does not have this capability and the 502 was therefore
triggered and limited to a single sweep by using the Gate A
output of the RM-45A. Since there is an internal delay of
less than V2 microsecond within the RM-45A, the two scopes
can be said to have been triggered simultaneously.

41
V. TEST PROCEDURE
Two general types of testing were accomplished during
the experimentation described herein. The first of these
was the application of a static load to the surface of a
soil bin to determine the amount that cylinders of two sizes
would be strained. The second, which had the same purpose as
the first, utilized a dynamic load. The shock tube described
previously was used for both phases of the testing program
although the static loading on the 1" diameter cylinder was
also checked by using a Tinius-Olsen testing machine.
Both phases of the testing required a careful preparation
of the sand and placement of the test cylinders at the proper
depth in the soil bin. The weight of the empty soil bin was
first determined and later compared to the weight of the full
soil bin so that the average density of the sand could be
computed. The "raining" technique of filling the bin with
sand was used wherein sand is placed in a container about
2/5 feet above the soil bin and allowed to flow out a tube
through a wire screen into the soil bin. This technique has
been used by several investigators and relatively high and
consistent densities are obtainable in this manner. Measure
ments of density obtained by other methods, including the hand
tamping of 1" layers, confirmed that the raining technique
gave the highest specific weight of 111.2 ±0.9 pounds per
cubic foot.
The type of sand used was dry 20-30 Ottawa sand of ASTM

42
Designation C-190 although sand sieved out from ASTM
Designation C-109 Graded Ottawa sand was used for the in
vestigation of the effect of grain size.
In preparing for tests, the soil bin was filled with
sand each time to such a level that it was necessary to
gently force the cylinder into the sand approximately a
half-diameter. When procedures for preparing test samples
were being developed, it was found that care must be taken
to position the cylinders in a similar manner each time.
Selig (17) states that a difference of at least 15% in
strain measurements could be detected depending on whether
or not the cylinder was pushed part way into the sand or
laid on the surface and covered with sand. Prior to placing
the cylinders, their ends were covered with a flexible
membrane to keep the sand out. The lead wires from the
strain gages on the cylinders were then led out through
small openings in the side of the soil bin. The distance
from the soil bin surface to the top of the instrumented
cylinders was selected as the standard depth of burial, a
distance measured before and after each test until it be
came obvious that the cylinders did not move any measurable
distance during the tests. The bin was then rained full to
the top and covered with a very thin sheet of rubber and a
1 mil thick piece of Mylar. The rubber and Mylar precluded
air entering the soil bin from the shock tube ; the Mylar
insured an easy connection of the bin to the tube; the

43
rubber helped alleviate the problems caused by static
electricity (sand grains sticking to Mylar, for instance).
To insure maximum compaction and uniform testing conditions,
the air pressure applied to the soil bin was cycled from zero
psig to its maximum value three times prior to the taking of
any data. A very slight lowering of the soil surface on the
order of 0.03 to 0.05 inches caused by the elimination of
voids in the sand could be detected after initial cycling.
To reduce the amount of work required, the soil bin was not
completely emptied after each test, but rather sand was re
moved to a depth of at least two test cylinder diameters
below the desired new depth of burial and then rained back
in as previously described.
The actual static testing was conducted by raising the
air pressure applied to the soil surface from 0 to 85 psig
in increments of 10, 15, or 30 psi depending on the type of
test. Similar increments were used when the air pressure was
being reduced except that 5 psi intervals were sometimes used
at the lower pressure levels because of the very rapid change
of strain in that region. Strain readings were obtained di
rectly from the BLH strain indicator except when check runs
were made using the Ellis bridge and the 502 oscilloscope.
When the Tinius-Olsen testing machine was used as a
check on the static loading obtained in the shock tube,
forces were applied to the soil bin surface in increments
such that they raised the pressure on the soil surface in

44
steps corresponding to the 15 psi units used with the shock
tube. Strain measurements were read on the BLH strain
indicator. The results from tests using the Tinius-Olsen
duplicated those from the shock tube and are thus not shown
in the results section.
The dynamic test procedures were somewhat more complex
since photographs of the strain-time curve were needed.
After all equipment had stabilized (usually requiring a time
interval of at least 30 minutes) and all connections made,
the camera settings were made and the cut film inserted. The
combined Ellis bridge and 502 oscilloscope complex was bal
anced and calibrated to a standard value (usually 50 /is/cm)
and checked prior to each shot. The oscilloscopes were
checked for trigger level setting and the trigger itself was
made to operate before the oscilloscopes were placed on
single sweep. After cycling the pressures to insure com
paction, the diaphragm was inserted in the shock tube and
the pressure chamber filled to the desired level. The
cameras were then set on time exposure, the diaphragm was
punctured and the camera shutters closed. The Polaroid
pictures were removed, treated and later scaled to obtain
the necessary information.

45
VI. EXPERIMENTAL RESULTS
A. Surface Pressure-Strain Envelopes
For the static loading tests, all parameters were held
constant except the static pressure applied to the surface of
the soil bin. The effect on the amount of strain, as noted by
the strain.gages mounted on the cylinders, was recorded as a
function of both increasing and decreasing pressure. The data
obtained from a gage mounted on the top exterior surface of
the 1" diameter cylinder appear in Figures 10 and 11 while
the data from a gage in the same position on the V2n diameter
cylinder are shown in Figures 14 and 15. Note that the units
(pie) shown for strain represent microinches per inch, some
times called microstrains. Each point plotted on the figures
represents an average value of strain, obtained from several
tests at each depth of burial, as a function of surface pres
sure. Thus it is possible to obtain the strain on either
cylinder at any surface pressure and any depth within the
limits of the investigation. It is easier to compare the
relative size of the envelope within the pressure-strain
curve when the above data are normalized so that the peak
strain is the same for all depths. The normalized data are
presented in Figures 12, 13 and 16. The large increase in
envelope size with depth is quite apparent when these latter
figures are compared, but it should be noted that the actual
area within the curve does not change at the same rate as is

46
DEPTH OF
BURIAL UJ40
200 300 STRAIN (/i€)
FIG. 10. LOADING CURVES FOR I "
400
CYLINDER.
DEPTH
BURIAL
uj 40
<t 20h
FIG. II
100 200 300 STRAIN ( f i t )
LOADING CURVES FOR l"
400
CYLINDER

47
80
«A a
60 w CE 3 CO en w 40 (C ÛL
UJ
< 20 u_ ÛC z> en
I" CYLINDER
DEPTH OF
BURIAL
X o-;
20 PERCENT
_L _L 40 60
OF MAXIMUM 80 100
STRAIN (%)
FIG. 12. NORMALIZED LOADING CURVES.
CYLINDER
DEPTH
OF BURIAL
0 5 6
FIG.
20 40 60 80 100 PERCENT OF MAXIMUM STRAIN (%)
13. NORMALIZED LOADING CURVES.

48
DEPTH
OF BURIAL
\ ui 40
100 400
FIG. 14.
200 300 S T R A I N ( f i t )
LOADING CURVE FOR 1/2" CYLINDER.
DEPTH
OF
BURIAL
100 300
FIG. 15
200 STR A I N ( f i t )
LOADING CURVES FOR
400
1/2" CYLINDER.

49
CYLINDER
y 60
DEPTH OF
BURIAL
0 20 40 60 80 100 PERCENT OF MAXIMUM STRAIN (%)
FIG. 16. NORMALIZED LOADING CURVES.
CO Ul X
2 6
^CYLINDER
X, AREAS OBTAINED FROM NORMALIZED CURVES.
1/2 CYLINDER
_L 3
DEPTH 4
( i n ) 6
FIG. 17. AREA OF PRESSURE -STRAIN ENVELOPES

50
shown in the normalized curves. Planimeter measurements of
the actual enclosed area were made and the results plotted
on Figures 18 and 19. A plot of the information obtained
from the normalized curves in the same manner is shown in
Figure 17. It can be seen from Figures 17 and 19 that for
the same depth of burial the larger cylinder has an envelope
area which is always larger than that for the small cylinder.
Since these surface pres sure-cylinder strain curves
have the same general form as stress-strain curves for con
fined sand, as noted by Hanley (5), it is possible to use
these curves as an approximation of the amount of energy loss
which occurs during a loading-unloading cycle. This requires
the assumption that the pressure at any depth in the sand
is a function of the surface pressure and that the strain
detected in the test cylinder is a function of the strain in
the sand around it. The results of tests by Hendron (6) who
conducted load-strain tests on a confined sand and by
Hanley (5) who used soil pressure gages to determine the
pressure at various depths and strain gages mounted on a
vertical structure to determine strain at these depths in a
confined sand indicate that sand exhibits an energy loss
during each cycle but has no residual strain or permanent
displacement. This energy loss is attributed to the re
versal of shearing forces between the loading and unloading
phases of the cycle such that higher strains are obtained
at any load during the unloading phase. If the preceding

51
CO LU X o z
CYLINDER UJ cc < 3 o CO
1/2" CYLINDER < £ <
6 2 3 4 5 0 Y/D
FIG. 18. AREA OF PRESSURE - STRAIN ENVELOPES.
CO UJ X o z CYLINDER
UJ ac « 3 O CO
/2" CYLINDER
UJ cc <
0 6 2 3 4 5 DEPTH Y (in)
FIG. 19. AREA OF PRESSURE-STRAIN ENVELOPES.

52
relationship between pressures and strains is assumed to be
valid, Figure 17 indicates that the energy loss is a direct
function of depth for equal strains at each depth. However,
Figures 18 and 19 show that since strain does decrease with
depth, the energy loss will reach a peak and gradually de
crease with depth.
B. Cycling Tests
Two series of cycling tests were conducted to investi
gate the repeatability of the surface pressure-strain results
as determined on a cylinder buried at some depth. The results
of the first series, in which the surface pressure was in
creased to various intermediate values and then reduced to
zero, are shown in Figure 20. These tests show that the
relationship between increasing pressure and strain was
repeatable no matter to what level the pressure was raised
and that the strain returned to zero each time the pressure
was reduced to zero. The tests also indicate that the
maximum consolidation had been achieved prior to testing and
that the amount of voids in the sand was not being reduced by
the applied pressure. During the second series of tests, the
surface pressure was raised to a maximum value and then cycled
between this maximum value and various intermediate points
on the decreasing pressure curve, and finally reduced to zero.
Results of these tests, shown in Figure 21, indicate that
the unloading curve was approximately repeatable and that

53
80
o.
60
S 40
I" CYLINDER
2"DEPTH
< 20 -
100 STRAIN ( f i t )
FIG. 20. CYCLING TEST SERIES NO. I.
80
Q. 60
40-
20
200 STR A I N ( f i t )
300 100 400
FIG. 21. CYCLING TEST SERIES NO. 2.

54
the same peak strain is attained each time the pressure is
cycled irrespective of the initial value of the surface
pressure.
C. Grain Size Tests
As mentioned in the dimensional analysis section,
complete geometric similarity between the model-prototype
systems must be maintained if true modeling is to occur.
Therefore, all pertinent dimensions must be scaled. A series
of static tests was conducted to see if this fact must be
extended to include the grain size of the sand in which the
cylinders are buried as is indicated by design condition
five. As can be seen in Figure 22, the results of tests
conducted with the cylinder embedded in 20-30 sand and
in a sand with an average diameter just half that of the
20-30 sand were so similar that the variation between the
two curves (averaging 3.7%) is less than the accuracy of
the data itself which had an average deviation of 4.1%.
Also to be noted is the fact that slightly greater com
paction (113.0 as compared to 112.2 pounds per cubic foot)
was obtained using the finer-grained sand which might account
for some difference in the strain readings. The choice of a
grain size one half that of the 20-30 sand was made because
the length scale (ratio of characteristic cylinder lengths)
is one half and thus the scaled grain size to be used with
the smaller cylinder according to dimensional analysis.

400r
300
w
<200
100
SURFACE PRESSURE
= 85 psi
SURFACE PRESSURE
= 70 psi
LEGEND
o 35-48 SAND (SP. WT. » 113.0 pcf)
• 20-30 SAND (SP. WT. = 112.2 pcf)
o1 U1
1/2" DIAMETER CYLINDER
± 0
FIG. 22. EFFECT OF GRAIN Y/D
SIZE ON STRAIN

56
Sand with an average diameter just half that of the 20-30
Ottawa sand (average diameter of 0.028") was obtained by
sieving Type C-109 graded Ottawa sand to obtain a sand which
passes a Tyler 35 sieve but is retained on a Tyler 48 sieve
which provides sand with an average diameter of 0.014".
It is apparent that even though the resulting strains
were consistently greater in the finer-grained sand, the
difference is such that the design condition requiring
scaling of the sand grain size may be neglected with no
deleterious effect on the results. It is of interest to
note that the data plotted in Figure 22 are obtained from
pressure-strain curves at selected pressures, namely 70 psi
and the maximum pressure of 85 psi. A summary of the data
obtained from the test cylinder in the fine grained sand is
presented in Tables 4 and 5. The figures listed in the "Ave."
column are the average of all tests run at the various depths
of burial.
Table 4. Static pressure tests in fine grained,sand at 70 psi
C y l No. Depth Depth Diam. Strain Ave. Diff. Diff. Y Diam. D € A C-A 100 € - A in. Y/D in. • % A
2 0 0 % 228 238 -10 4.2 0 0 248 238 10 4.2
]/A % 306 287 19 6 . 6 % % 275 287 -12 4.2 Va >2 281 287 - 6 2.1 % y
1 293 311 -18 5 . 8 % y 1 322 311 11 3.5
2 % 1 % 319 311 8 2 . 6

Table 4. (Continued)
57
Cyl. No Depth Depth Diam. Y Diam. 0
Y/D in. in.
Strain €
Ave, A
Diff, € - A
Diff. 100 IcjrA % A
1 2 % 303 311 - 8 2 . 6 1 2 319 311 8 2 . 6
3 317 317 0 0 v/2 3 317 317 0 0 2 4 295 292 3 1.0 2 4 290 292 - 2 0.7 2% 5 227 269 -42 15.6 2% 5 288 269 19 7.1 2% 5 258 269 -11 4.1 % 5 303 269 34 1 2 . 6 3 6 243 239 4 1.7 3 6 % 235 239 - 4 1.7
Table 5. Static pressure tests in fine grained sand at 85 psi
Cyl. No. Depth Depth Diam. Strain Ave. Diff. Diff. Y Diam. 0 e A €-A 100|e-A in. Y/D in. #*< N f*€ % | A I
0 0 % % >4 % % >2
ll 2 2
1 3 3
0 % 271 284 -13 4.6 0 296 284 12 4.2
% 363 340 23 6 . 8 % 325 340 -15 4.4 </2 332 340 - 8 2 . 4 1 350 376 -26 6 . 9 1 390 376 14 3.7
1 387 376 11 2 . 9 2 360 366 - 6 1.6 2 372 366 6 1.6 3 370 370 0 0
3 371 370 1 0 . 3 4 346 343 3 0 . 9 4 340 343 - 3 0.9 5 267 316 -49 15.2 5 338 316 22 7.0 5 305 316 -11 3.5 5 356 316 40 12.7 6 285 282 3 1.1 6 % 278 282 - 4 1.4

58
D. Comparison of Top and Bottom Gages
A comparison was made of the results obtained from
strain gages mounted on the top and bottom exterior of
test cylinders subjected to static loads. As noted from
Figures 23 and 24, the data obtained from the two strain
gages provide curves that are similar in shape except for
certain areas of interest. At a Y/D of zero (the crown of
the cylinder is at the surface of the soil bin) the strain
recorded by the top gage was significantly less than that
from the lower gage. The strain detected by the top gage
on cylinders of both diameters remained less than that de
tected on the bottom until a certain depth was attained
where the top strain became and remained larger than the
bottom strain. The reasons for this behavior are discussed
later.
E. Flexural and Hoop Strain
The two major types of strain which the test cylinders
undergo are hoop and flexural. The hoop strain is caused
during movement of the hollow cylinder cross-section center-
line uniformly toward or away from the center (a uniform
strain of the middle surface) while flexural strain is
associated with the cylinder bending and occurs when the
cylinder becomes oval shaped.

59
400
2 300 TOP GAGE
BOTTOM GAGE g 200
I" CYLINDER
85 psi SURFACE PRESSURE 100
0 2 3 5 6 4 Y/ D
FIG. 23. COMPARISON OF TOP AND BOTTOM STRAIN GAGES.
400
TOP GAGE
% 300
BOTTOM GAGE
200
1/2" CYLINDER
85 psi SURFACE PRESSURE 100
Y/ D FIG. 24. COMPARISON OF TOP AND BOTTOM
STRAIN GAGES.

60
A A
B B
Compressed Horizontal Position
Normal Compressed Vertical Position
Fig. 25. Cylinder deformation under load
As noted in Figure 25, when placed in the vertical
position, gages C and D, which are mounted on the interior
of the cylinder, experience tension from bending stress and
compression from hoop stress. However, when the cylinder is
rotated 90° so that the gages are in the horizontal position,
the gages then experience compression from both hoop and
bending stress. With these facts, it is possible to obtain
data such that the amount of each type of strain can be com
puted for any depth. This analysis is valid only if the
strains detected by C and D are equal to each other in each
position. Since this is not true in all cases, this analysis
provides only an approximation of actual results. In
Figure 26 is shown a comparison of all the strains measured
on a 1" cylinder at the 2" burial depth.
It might be noted that gages A and B, mounted externally
on the cylinders, will, when placed in the vertical position,
experience compression both from hoop and bending stress, and
tension from bending stress and compression from hoop stress

GAGE 7 8 1 2
G A G E L O C A T I O N S
400 300 200 100 COMPRESSIVE STRAIN (/*«)
FIG. 26. STRAIN AT VARIOUS LOCATIONS ON
O'
I" CYLINDER
2" DEPTH
ÏOÔ 200 300 4ÔC TENSILE STRAIN ( fit)
CYLINDER.

62
when in the horizontal position. This information was used
as a check on the foregoing calculations. It is also possible
to compute bending and hoop strains by using any two opposed
gages such as A and C or B and D. However, to eliminate
variations caused by any one gage or one position on the
cylinder, an average of all gages was used. This provides
a good approximation to the actual values.
A sample calculation follows to illustrate the method
of computing the two types of strain. When mounted in the
vertical position at a burial depth of 2" the strain in gage
C was 331 /Lie while the strain in gage D was 258 /iC. The
average of these two is 294 /xe = m. When mounted in the
horizontal position at the same burial depth the figures were
405 and 390 for an average of 398 gc = n. If the flexural
strain is represented by f and the hoop strain by d, then
f - d = m and f + d = n. Therefore 2f = m + n or
f = m/2 + n/2 = 398/2 + 294/2 = 346 jjc and 2d = n - m or
d = n/2 - m/2 = 398/2 - 294/2 = 52 /ie. These values are then
averaged with those obtained by using the strain recorded by
gages mounted on the exterior of the cylinder. As shown in
Figures 27 and 28, the d + f ratio should probably be
considered as a function of the load only since it increases
with load and does not change significantly as the depth of
burial changes.
An example of the relationship between hoop and flexural
stress as a function of load is shown in Figure 29 which shows

63
I 20
SURFACE 40
PRESSURE
l 60
( pti) 80
FIG. 27. VARIATION OF d+ b (100) WITH PRESSURE.
I I I I "0 I 2 3 4
DEPTH Y (in)
FIG. 28. VARIATION OF (100) WITH DEPTH.

80 HOOP STRAIN
60
en
40 BENDING STRAIN
f CYLINDER
2" DEPTH 3 20
100 200 STRAIN (/*«)
300 400
FIG. 29. COMPARISON OF BENDING AND DILATIONAL STRAIN.

65
that the bending strains are considerably higher than hoop
strains. This is true at all loads. As noted in Figures 27
and 28 hoop strain constitutes less than 10% of the total
strain for the pressures and depths investigated.
F. Modeling
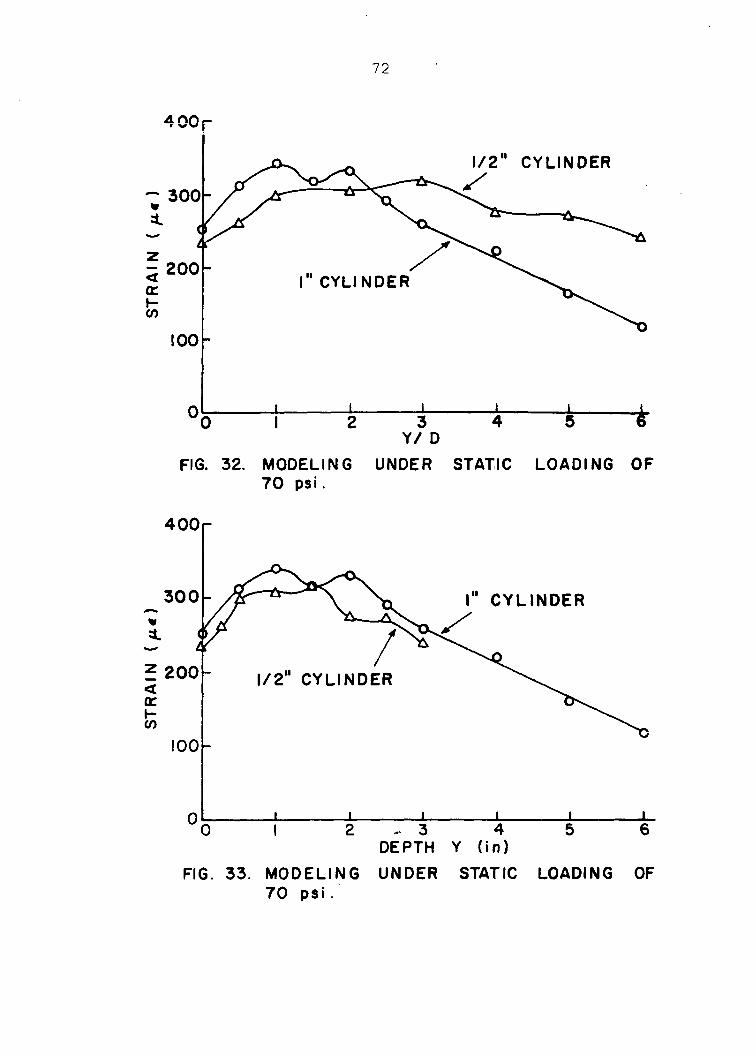
To fulfill one of the objectives of this investigation,
data were taken from the load-strain curves of the i£M diameter
cylinder at 70 and 85 psi and used to predict the effects of
the static loads on the prototype structure, which is the 1"
diameter cylinder in this case. These data are tabulated in
Tables 6, 7, 8 and 9 from which it can be noted that with few
exceptions, the strain on the 1" diameter cylinder is more
reproducible for any certain surface pressure than is the
strain detected on the diameter cylinder. The average
percent deviation for each of Tables 6, 7, 8 and 9 is
4.3, 4.7, 7.8 and 7.9 respectively. The average strain which
occurred at these loads at the various depths is plotted in
Figures 30, 31, 32 and 33. Note that strain is plotted as a
function of Y/D in Figures 30 and 32 but as a function of
depth Y in Figures 31 and 33. Figures 34, 35, 36 and 37
present the same information on logarithmic graph paper. Dis
cussion and interpretation of these results appear in
Section VII.

66
Table 6. Static prc::u. :c t e : to XM 20- V O O i l J CU U = 1
Cyl. No. Depth Depth Diam. Strain Ave. Dif=. Diff Y Diam. D c A c - A 100 in. Y/D in. Ht M* %
5 0 1 251 249 2 0.8 5 235 - _ 4 5.6 6 267 18 7.2 8 241 - 3 3 . 2 8 251 2 0 . 8 8 0 0 251 249 2 0 . 8 8 % % 321 310 11 3 . 5 8 302 - 8 2 . 6 8 311 1 0.3 8 4 % 306 310 - 4 1.3 :> 1 348 337 i X 3.3 b 8
320. 333
-17 - 4
5 . 0 1.2
8 361 24 7.1 3 353 16 4 . 8 8 332 - 0 1. 5 8 340 3 0.9 8 330 - 7 2. i 8 1 315 337 -22 6.5 8- 313 316 - 3 1 . 0 8 322 6 1.9 8 315 - i 0.3 6 1V2 >2 313 316 - 3 1 . 0 5 2 2 300 330 -30 9.1 6 360 30 9.1 6 354 24 7.3
8 336 6 1.8 8 320 -10 3.0
3 339 9 2.7
8 2 2 300 330 -30 9.1 8 2% 2% 289 289 0 0
6 3 3 269 255 14 5.5
8 253 - 2 0 . 8 8 246 - 9 3.5
8 234 -21 8 . 2 8 275 20 7.8
6 3 3 251 255 - 4 1 . 6 8 z 236 221 15 6 . 8 8 237 16 7.2
8 202 -19 8 . 6 8 4 4 209 221 -12 5.4
6 5 5 164 159 5 3.1
8 5 5 1 192 159 33 2 0 . 8
ç-A A

67
1 able 6. (Continued )
Cyl. No. Depth Y in.
Depth Diam.
Y/D
Diam. 0 in.
Strain €
Ave. A
Diff. € - A
Dirf, 100 %
e-A A
8 5 5 1 142 159 - 1 7 10.7 8 5 5 1 148 159 -11 6.9 8 5 5 1 149 159 -10 6.3 8 6 6 1 116 116 0 0
Table 7. Static pressure test in 20-30 sand at 85 psi
Cyl. No. Depth Depth Diam. Strain Ave. Diff. Diff. Y Diam. D .€ . A «-A 100 in. Y/D in. /Je fif %
€-A
5 5 6 8 8 8 '
8 8 8 8 8 8 8 5 5 8 8 8 8 8 8 8 8 8 8 8 8 8
0
0
%
!/2
1 1%
1%
0
%
4 1
Ï6
1%
304 284 312 284 297 298 283 373 358 366 361 337 357 403 376 337 416 410 390 390 380 366 365 355 370 362 377 404
295
295 359
359 388
388 372
372
9 •11 17 •11 2 3
•12 14
• 1 7 2
-22 - 2
15 •12
• 1 28 22
2 2
• 8
-22 -23 -17 - 2
- 1 0 5 32
3.1 3.7 5.8 3.7 0.7 1.0 4.0 3.9 0.3 2 . 0 0 .6 D . 1 0.6 3 . 9 3.1 0.3 7.2 5.7 0.5 0.5 2 . 1 5 7 5^9 4.6 0.5 2.7 1.3 8. ô

L.
6 5 6 8 8 8 8 8 8 8 8 8 6 8 8 8 8 8 8 8 '
8 8 8 8 6 8 8 8 8 8 8
68
(Continued)
Depth Depth Diam. Strain Ave. Diff. Diff Y Diam. D € A e-A 100 in. Y/D in. /ie /ue ^ie %
e-A A
V/2 2
\V2 2
2
1 3
5 6 6
2
1 3
3 4
5
0 6 6
362 372 -10 2 . 7 351 374 -23 6 . 2 410 36 9 . 6 405 31 8 . 3 387 13 3.5 358 -16 4.3 389 15 4.0 358 -16 4.3 364 -10 2.7 342 374 -32 8 . 6 330 345 -15 4 . 3 360- 345 15 4.3 304 298 6 2 . 0 290 - 8 2 . 7 280 -18 6.0 270 -28 9.4 317 19 6.4 310 12 4.0 320 22 7.4 291 298 - 7 2.3 270 253 17 6.7 272 19 7.5 230 -23 9.1 240 253 -13 5.1 188 183 5 2.7 226 43 2 3 . 5 162 -21 11.5 170 -13 7.1 168 183 -15 8 . 2 132 134 • - 2 1.5 136 134 2 1.5

69
Table 8= Static pressure teste in 20-30 Sana dl 70 psi
Cyl. No. Depth Depth Diam. Strain Ave. Diff. Diff., Y Diam. 0 < A c-A -100 IzA in. Y/D in. /je /jç /je % ' A
1 0 0 % 218 232 -14 6.0 1 183 -49 21.1 2 245 13 5 . 6 2 250 18 7 . 8 2 269 37 1 6 . 0 2 0 0 227 232 - 5 2 . 2 2 % 250 260 -10 3 . 8 2 285 25 9 . 6 2 242 -18 6 . 9 2 X/A 263 260 3 1.2 1 % % 313 296 17 5 . 8 2 279 -17 5.8 2 311 15 5.1 2 315 19 6.4 2 y2 y 262 296 -34 11.5 1 i 2 333 303 30 9 . 9 1 309 6 2 . 0 1 330 27 8 . 9 2 259 -44 1 4 . 5 2. 292 -11 3.6 2 263 -40 1 3 . 2 2 305 2 0.7 2 i 2 333 303 30 9 . 9 1 l'A 3 358 3. .6 42 1 3 . 3 1 340 24 1 7 . 6 1 315 - 1 0 . 3 1 333 17 5.4 2 264 -52 1 6 . 5 2 236 -80 2 5 . 3 2 VA 3 365 316 . 49 15.5 2 2 4 268 273 - 5 1.8 2 2 4 278 273 5 1.8 2 2% 5 251 269 -18 6.7 2 2% 5 276 269 7 2 . 6 2 2% 5 280 269 11 4.1 2 3 6 249 237 14 5.1 2 3 6 % 225 237 -14 5.1

70 a
Table 9. 3La Liu pxebbure tests in 2Ù-3U sand at 8b psi
Cyl. No. Depth Depth Diam. Strain Ave. Diff. Diff, Y Diam. D c A e-A 100 in. Y/D in. /lic % A
1 0 0 4 263 270 - 7 2 . 6 1 223 -47 17.4 2 290 20 7.4 2 296 26 9 . 6 2 313 43 1 5 . 9 2 268 - 2 0.7 2 249 -21 7.8 2 / ) 0 257 270 -13 4 . 8 2 •4 299 326 -27 8 . 3 2 332 6 1.8 2 289 -37 11.3 2 312 -14 4.3 2 370 44 1 3 . 5 2 315 -11 3.4 2 2 365 326 39 1 2 . 0 1 4 1 368 367 1 0 . 3 2 329 -38 10.4 2 368 1 0 . 3 2 370 3 0 . 8 2- 311 -56 15.3 2 417 50 1 3 . 6 2 350 -17 4.6 2 352 -15 4.1 2 411 44 1 2 . 0 2 4 1 392 367 25 6 . 8 1 l 2 386 371 15 4.0 1 367 - 4 1.1 1 382 11 3 . 0 2 303 -68 1 8 . 3 2 337 . -34 9 . 2 2 308 - 6 3 17.0 2 353 -18 4 . 8 2 390 19 5.1 2 392 21 5.7 2 430 59 1 5 . 9 2 1 2 433 371 61 1 6 . 4 1 V/2 419 358 61 17.0 1 398 40 11.2 1 367 9 2.5 1 387 29 8.1 2 305 -53 1 4 . 8 2 14 2 4 271 358 -87 2 4 . 3

70 b
Table 9. (Continued)
Cyl. No, Depth Depth Diam. Y Diam. 0
Y/D in. in.
Strain e n*
Ave, A
Diff. e-A
D i f f . 100 e-A
A
2 1% 3 % 421 358 63 1 7 . 6 2 351 - 7 2 . 0 2 335 -23 6 . 4 2 iy2 3 330 358 -28 7 . 8 2 4 309 317 - 8 2 . 5 2 320 3 1.0 2 340 23 7 . 3 2 307 -10 3.1 2 2 i 309 317 - 8 2.5 2 2% 5 287 307 -20 6 . 5 2 2% 5 319 307 12 3 . 9 2 2% 5 315 307 8 2 . 6 2 2 6 286 272 14 5.1 2 3 6 % 258 272 -14 5.1

71
zinnt-
•/o" CYLINDER
z
2 200 h (/)
CYLINDER
100
Y/D
FIG. 30. MODELING UNDER STATIC LOADING OF 85 psi
400
300,
l/2" CYLINDER
- 200 I" CYLINDER
00
DEPTH Y (in)
FIG. 31. MODELING UNDER STATIC LOADING OF 85 psi
72
1/2" CYLINDER
300
- 200 CYLINDER
100
Y/ D
FIG. 32. MODELING UNDER STATIC LOADING OF 70 psi.
400
300 CYLINDER
z 200 1/2" CYLINDER
100
DEPTH Y (in)
FIG. 33. MODELING UNDER STATIC LOADING OF 70 psi .

73
500 -
4 00-
1.300-
z
2 200-H CO
100 0.25 0.5 I 2 34567
Y / D
FIG. 34. MODELING UNDER STATIC LOADING OF 85 psi.
500
400
1/2" CYLINDER/*
oc 200
I" CYLINDER
001— 0.25 0.5 2 3 4 5 6 7
DEPTH Y (in)
1/2" CYLINDER
I" CYLINDER
FIG. 35. MODELING UNDER STATIC LOADING 85 psi.

500
400
* 300
V CYLINDER < 200
I" CYLINDER
J I 100 0.25 0.5 I 2 3 4 5 6 7
Y / D
FIG. 36. MODELING UNDER STATIC LOADING OF 70 psi
500
400
300
l/2" CYLINDER
t 200 CYLINDER
0.5 4 5 6 7 2 3 DEPTH Y( in)
FIG. 37. MODELING UNDER STATIC LOADING OF 70 psi

75
G» Pressure Variation.
Prior to the first series of tests using dynamic load
ing to produce strains on instrumented cylinders, an investi
gation of the velocity of shock wave propagation in air and
sand and of the changes in shape or the shock wave as it
travelled through sand was made. This study was accomplished
by comparing the results obtained from a transducer mounted
in a sidewall fixture with those from a transducer mounted in
a special brass adapter which was placed at various depths
in the soil bin sand. Photographs of the traces obtained from
the two transducers are shown in Figure 38, one at a sweep
rate of 1 ms/cm and the other at 0.5 ms/cm. The pressure
trace which starts in the lower left hand corner of the
pictures is the one described by the pressure detected at the
sidewall fixture and is quite reproducible each time. When
the pressure chamber is filled to 85 psi, the pressure de
tected at the sidewall fixture is consistently between 71.5
and 74.0 psi with an average of about 72.5 psi, a figure
which checks with data plotted by Ricklefs (16), the designer
of the shock tube being used in these tests. According to a
theoretical analysis presented by Ricklefs (16), the pressure
on the sidewall is equal to that on the soil bin surface. The
trace originating in the upper left hand corner of the pictures
is that formed by the pressure detected at a point 6" beneath
the soil surface.

Fig. 38. Sidewall and soil bin pressure traces
Horizontal scale :
1 major division = 1 millisecond
Vertical scale :
1 major division = 12.5 psi for signal originating in upper left
1 major division = 17.7 psi for signal originating in lower left
Horizontal scale :
1 major division = % millisecond
Vertical scale :
1 major division = 25.0 psi ior signal originating in upper left
1 major division = 17.7 psi for signal originating in lower left

78
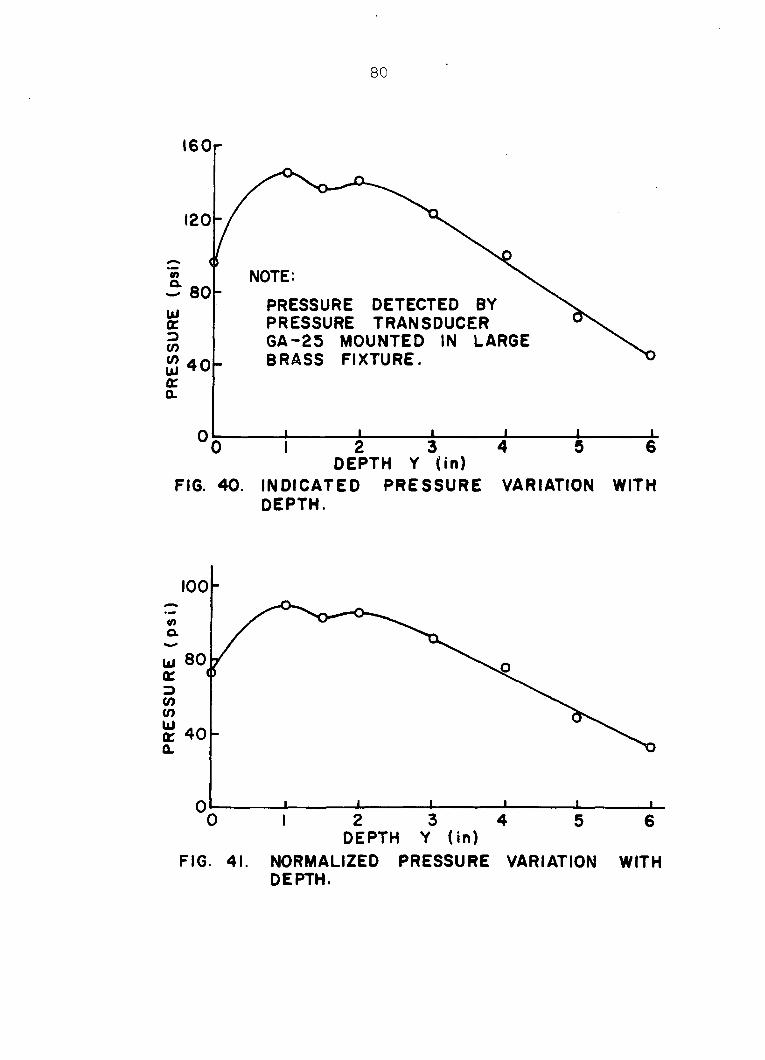
Reproductions of the traces of the pressure detected
at several depths of burial are shown in Figure 39 in which
the initial point of pressure rise has been shifted so that
the curves can be compared more easily. The maximum pressure
determined from the pictures is plotted as a function of
depth in Figure 40. The values of pressure detected by the
buried transducer are most likely not the true values of
pressure at the various depths because the brass fixture in
which it is mounted does not provide a fixed support for it.
When these values are normalized so that the pressure de
tected at the surface is the same as that detected in the
sidewali fixture, values are obtained which can be assumed
to be more nearly correct. These adjusted values are shown
in Figure 41. However, the importance of this information
is to provide an insight into the variation of pressure with
depth rather than to determine true values. It should also
be realized that the pressures detected in this test are
probably not the same as those experienced by test cylinders
because arching and sidewali effects will be different in
each case.
As can be noted in Figure 38, there is a detectable
time lag between the initiation of the two pressure pulses
which can be used to determine the velocity with which the
shock wave travels through the sand. First, however, the
velocity of shock wave travel in the air must be computed
so that this correction can be applied to these computations.

79
95,8 Dsi
44.6 psi
DEPTH OF BURIAL
139.2 psi
2"
NOTE;
TRACES HAVE BEEN SHIFTED
SO THAT ALL INITIATE AT THE SAME TIME FOR EASIER COMPARISON.
VERTICAL SCALE
I = 100 psi
121.4 psi
99.4 psi
62.3 psi
44.1 psi
1 1 i l 0 2 4 6 8
TIME (ms)
FIG. 39. DEPTH-TIME - INDICATED PRESSURE RELATIONSHIP.
80
I60r
NOTE:
PRESSURE DETECTED BY PRESSURE TRANSDUCER GA-25 MOUNTED IN LARGE BRASS FIXTURE.
_L _L _L I 2 3
DEPTH Y (in) FIG. 40. INDICATED PRESSURE
DEPTH. VARIATION WITH
100
E 40
DEPTH Y (in) FIG. 41. NORMALIZED PRESSURE VARIATION WITH
DEPTH.

81
This may be calculated by measuring the time interval between
the passage of the initial shock wave and that of the re
flected wave past the sidewali transducer. This information
was obtained from the photographs of the curves with a travel
ing microscope ; calculations then showed that the average
shock wave velocity in air to be 1081 ft/sec. This value com
pares favorably with the 1108 ft/sec listed by Ricklefs (16).
By the same procedure, the time of shock wave arrival
at the various depths was determined and plotted in Figure 42
as a function of depth. The slope of this curve is then the
velocity of shock wave travel in sand of this type ; a value
determined to be 971 ft/sec.
It is of interest to note in Figure 39 that the rise
time is of such short duration, <2 ps according to Ricklefs (16),
that no variation with depth can be detected and that the hold
time of the shock wave remains approximately constant over the
range of depths investigated.
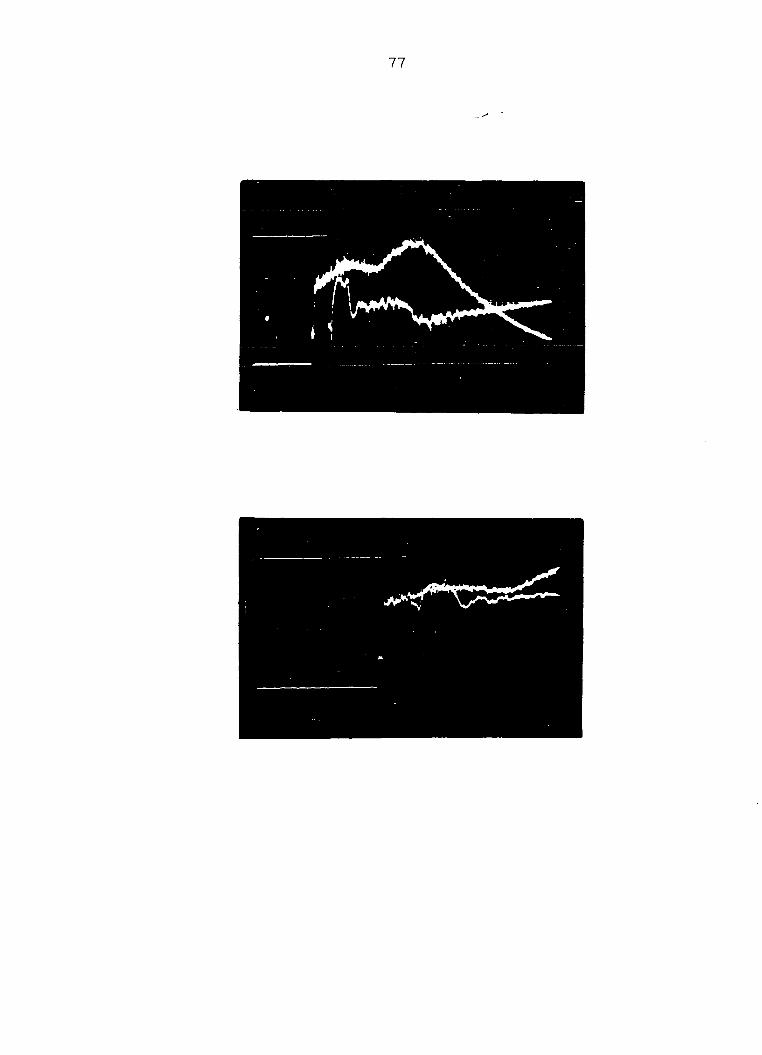
H. Dynamic Loading Tests
The data from the dynamic loading tests were obtained by
applying a shock wave to the surface of a soil bin in which
instrumented cylinders were buried at various depths. An
example of the strain-time trace obtained from the strain
gage mounted on a V2n diameter cylinder at a burial depth of
1^" when subjected to a shock surface pressure of 72.5 psi is
shown in the lower part of Figure 43. In the same figure is
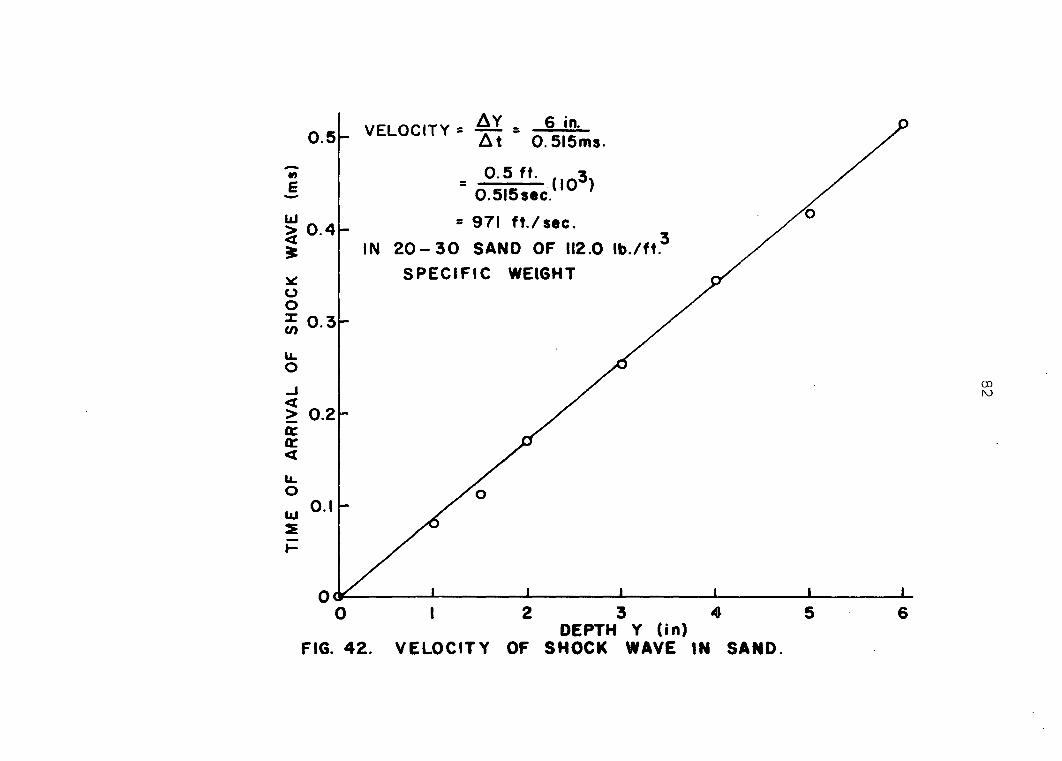
0.5- VELOCITY = Ay At
6 in. 0.515ms.
M
e
> 0.4 &
u o £ 0 3
0.5 ft. (I03)
0.515sec.
= 971 ft./sec.
IN 20-30 SAND OF 112.0 Ib./ft.
SPECIFIC WEIGHT
00 ro
FIG. 42.
12 3 4 DEPTH Y (in)
VELOCITY OF SHOCK WAVE IN SAND

Fig. 43. Example of pressure and strain traces
Horizontal scale :
1 major division = 2 milliseconds
Vertical scale :
1 major division = 17.7 psi
Horizontal scale :
1 major division = 2 milliseconds
Vertical scale :
1 major division = 60 microstrains

84

85
shown the curve of the pressure detected at the sidewali
fixture which has the same time base (2 ms/cm) and thus
occurs simultaneously with the strain curve. Some of the
rapid fluctuations of the strain trace in Figure 43 may be
due to the "ringing" of the test cylinder immediately after
being struck by the shock wave. The theoretical natural
frequency of vibration of the two test cylinders in air was
computed by the use of Timoshenko's (22) equation
f i ' à \ j f  3 l 2 i V J ? 2 ' 2
where i = 2 is the fundamental mode for flexural vibration,
E is the modulus of elasticity, g is the acceleration of
gravity, y is the specific weight of aluminum, I is the
moment of inertia of a cross section with respect to a
principal axis at right angles to the plane of the ring, A
is the cross-sectional area of the ring and r is the outside
radius. The calculated values of the natural period for the
1" and V2U diameter cylinders are 150 fis and 75 respective
ly. The initial vibration of the recorded trace corresponds
roughly to these periods so that part of the "hash" can be
attributed to this source. Since the natural period of
the pressure transducer is 22 fis, it is a probable source of
some of the oscillations to be seen on the pressure trace.
Reproductions of the strain traces detected at all
depths of burial for both the and 1" diameter cylinders

86
are shown in Figures 44 and 45. Again the initial strain
rise point has been adjusted so that the curves can be com
pared easily. It can be noticed here that the shape of the
strain curves is quite similar to that of the pressure curves
at the various depths. Also to be noted is the fact that the
peak strains all occur at the same time after the strain
starts to increase. An example of the strain-time curves for
cylinders of different size at the same depth of burial is
shown in Figure 46, while a similar comparison is shown in
Figure 47 for the two cylinders at the same Y/D. The peak
dynamic strain from each one of the traces is plotted as a
function of Y/D in Figure 48 and as a function of depth Y in
Figure 49. It should be noted that results of tests conducted
by Murphy, Young and Martin (14) in a 2' diameter shock tube
on geometrically similar cylinders of 1, 2 and 4 inch diameters
are of the same range of magnitudes as those plotted on
Figure 49. Figures 50 and 51 present the same information on
logarithmic graph paper. These peak strains and their related
errors are tabulated in Table 10. The average deviations of
the listed strains obtained during the dynamic loading tests
are 6.1% and 7.6% for the 1" and !>$" diameter cylinders respec
tively. Thus, strains detected on the larger cylinder are
slightly more reproducible than those detected on the smaller
cylinder; a result which is the same for both static and
dynamic loadings. A comparison between the strains exper
ienced by the cylinders under dynamic and static loadings is

37
2 4 2 LJtp i M
V—BURIAL
INITIAL POINTS OF STRAIN-TIME TRACES FROM DYNAMIC LOADING HAVE BEEN SHIFTED SO THAT ALL OCCUR AT THE SAME TIME FOR EASIER COMPARISON.
380
VERTICAL SCALE
I cm » 100fi.« 306
250
194
60
0 4 TIME (ms)
FIG.44. STRAIN ON l" DIAMETER CYLINDER

88
C.OI
BURIAL
NOTE :
INITIAL POINTS OF STRAIN TIME TRACES FROM DYNAMIC LOADING HAVE BEEN SHIFTED SO THAT ALL OCCUR AT THE SAME TIME FOR EASIER COMPARISON.
VERTICAL SCALE I cm = 100fit
2 1/2"
4 8 12 16 TIME (ms)
45. STRAIN ON 1/2" DIAMETER CYLINDER,

4001-
/ 2 " CYL INDER
300
BOTH CYLINDERS AT l " D E P T H O F B U R I A L .
3 200
CYLINDER
100
2 6 8 0 4 10 12 14 TIME (ms)
FIG. 46. COMPARISON OF DYNAMIC LOADING STRAIN-TIME CURVES.

400
1/2" CYLINDER AT l" DEPTH 300
Z* 200
CYLINDER AT 2" DEPTH cn
100 Y/D » 2
TIME (ms)
FIG. 47. COMPARISON OF DYNAMIC LOADING STRAIN-TIME CURVES.

91
400
1/2" CYLINDER
300
S 200
CYLINDER
100
Y/D FIG. 48. PEAK DYNAMIC STRAINS.
400
300 f CYLINDER
5 200- l/2" CYLINDER
100
DEPTH Y (In)
FIG. 49. PEAK DYNAMIC STRAINS.

92
500
_ 400 «
- 300
< û; h- 200 CO
100 0.25
r CYLINDER
_L 0.5 I
1/2" CYLINDER
_L
Y / D
FIG. 50. PEAK DYNAMIC STRAINS.
J I L 5 6 7
500
400
5.300
z < tr h co
200
100 0.25
FIG. 51.
1/2" CYLINDER
0.5 I
lM CYLINDER
_L 2
DEPTH Y (in)
PEAK DYNAMIC STRAINS
J L 4 5 6 7

93
!C LOADING OF S5 psi PRESSURE CHAMBER, 72.5 AT SOIL BIN SURFACE
300
STATIC LOADING < 200
100 l" CYLINDER
Y/ D FIG. 52. COMPARISON OF STATIC AND DYNAMIC
STRAINS.
400|- DYNAMIC LOADING OF 85 psi IN PRESSURE CHAMBER, 72.8 pti AT SOIL BIN
^XSURFACE. w 300
STATIC LOADING OF 70 pti
1 /2 " CYL INDER 100
Y/D
FIG. 53. COMPARISON OF STATIC AND DYNAMIC STRAINS.

94
presented in Figures 52 and 53. Discussion and interpretation
of these results appear in Section VII.
As can be noted from the pressure or strain traces,
a second pulse of slightly reduced magnitude occurs as the
first pulse is decaying out. When the oscilloscope sweep
rate is slowed down, even more of these repeated pulses can
be detected. The repeated pulse is caused when the original
shock wave is reflected off the soil bin surface back to the
upper end of the shock tube where it is again reflected and
returned to impinge once again on the soil bin surface. As
a check on the calculation of shock wave velocity in air, a
number of traces of this type at varying sweep rates were
measured with the traveling microscope. The average value
of velocity resulting from this data was 1074 ft/sec which
agrees very closely with the previously determined value
for shock wave travel in air.
Table 10. Data from dynamic tests
Cyl. No. Depth Depth Diam. Strain Ave. Diff. Diff. Y Diam. 0 e A c-A 100 le -A in. Y/D in. /ic \i€ fie % | Â~
8 8 8 8 8 8 8 8 6 8
0
% 1 1 1 V/2 l'/2
if
0 y
242 242 0 0 416 416 0 0 333 380 -47 12.4 355 380 -25 6.7 453 380 73 1 9 . 2 340 314 26 8.3 272 314 -42 1 3 . 4 323 314 9 2 . 9 299 314 -15 4 . 8 355 314 41 13.0

L.
8 8 8 8 8 8 8 8 8 8 8 8 2 2 2 2 2 2 2 2 2 2 2 2 2 2 2 2 2 2 2 2 2 2 2 2
95
Depth Depth Diam. Y Diam. D in. Y/D in.
Strain Ave. Diff, e A c-A /iC /K
Diff. 100 %
e-A A I
2 2 i 325 306 19 6 . 2 2 2 287 306 -19 6 . 2 2 2 306 306 0 0 3 3 271 250 21 8.4 3 3 253 250 3 1.2 3 3 243 250 - 7 2.8 3 3 234 250 -16 6 . 4 4 4 206 216 -10 4 . 6 4 4 225 216 9 4 . 2 5 5 194 194 0 0 6 6 172 160 12 7.5 6 6 149 160 -11 6 . 9 0 0 y 218 237 -19 8.0 0 0 237 237 . 0 0 0 0 255 237 18 7.6 % 1 422 414 8 1.9 y2 1 407 414 - 7 1 . 7 y2 1 413 414 - 1 0.2 i 2 385 385 0 0 i 2 381 385 - 4 1 . 0 i 2 388 385 3 0 . 8 v/2 3 379 360 19 5.3 ly 3 353 360 - 7 1.9 l^ 3 347 360 -13 3 . 6 2 4 267 290 -23 7.9 2 4 346 290 56 19.3 2 4 291 290 1 0.3 2 4 256 290 -34 11.7 2)6 5 228 252 -24 9 . 5 2)6 5 274 252 22 8 . 7 2% 5 211 252 -41 1 6 . 3 2)6 5 294 252 42 16.7 3 6 255 233 22 9 . 4 3 6 164 233 -69 2 9 . 6 3 6 224 233 - 9 3 . 9 3 6 277 233 44 1 8 . 9 3 6 y 247 233 14 6 . 0

96
. VII . EVALUATION AND ANALYSIS
A. Model Theory
One o f the pr inc ipal object ives of the present invest i
gat ion was to exper imenta l ly eva luate the model des ign . I f
true model ing occurs , i t i s poss ib le to use the resul t s of
t es t s on a model to predic t the e f fec t of s imi lar tes t s on a
prototype . Thus , cons ider ing the V 2n diameter cy l inder as the
model and the 1" d iameter cy l inder as the prototype , the amount
o f s tra in exper ienced by the cy l inders under s ta t ic and dy
namic loading has been determined by tes t s and p lot ted on
Figures 30 through 37 and 48 through 51 as a check on the
va l id i ty of the model des ign deve loped here in . An exami
nat ion of the data presented in these f igures reveals that
d i s tort ion i s present s ince the resul t s of t es t s on the smal l
cy l inder do not accurate ly predic t the behavior o f the larger
cy l inder when p lot ted against depth d iv ided by d iameter (Y/D)
as required by the model des ign . This fact indicates that not
a l l pert inent var iables were cons idered or that a t l eas t one
known des ign condi t ion was d i s torted . S ince i t i s known
that the des ign condi t ions re lated to gra in s ize and so i l b in
d iameter could not be met , they wi l l be inves t igated as the
source o f error . As ment ioned in the d imens ional analys i s
sec t ion , a d i s tort ion factor must be introduced when a des ign
condi t ion i s v io lated and a predic t ion factor appl ied to the
predic t ion equat ion . However , to show th i s d i s torted prototype-

97
mod e1 re lat ionship; e i ther exper imenta l data or a knowledge
o f the funct ional re lat ionship between the s tra in and the Pi
terms must be used .
In an a t tempt to determine the cause of the d i s tort ion ,
an examinat ion wi l l be made o f the espec ia l ly s igni f icant
aspects o f the resul t s obta ined from the tes t s which are :
(1 ) much bet ter corre lat ion i s obta ined between model and
prototype when the s tra ins are p lot ted versus depth Y
rather than versus the d imens ionless parameter Y/D which
i s the depth of bur ia l d iv ided by the tes t cy l inder d iameter ,
(2 ) s tra in in i t ia l ly increases wi th depth of bur ia l , then
l eve l s o f f and beg ins an exponent ia l decrease as depth con
t inues to increase , and (3 ) a second smal l r i se in s tra in
occurs short ly a f ter the exponent ia l decay has s tarted . The
analys i s wi l l be based on a s ta t ic loading of the tes t
cy l inders .
B. So i l Bin Regions
In an endeavor to expla in the foregoing phenomena, i t i s
postu lated that wi th in the so i l b in three general reg ions
ex i s t : (1 ) an upper reg ion , near the surface , in which the
vert ica l s tress i s uni formly d i s tr ibuted over the cross
sect ion , (2 ) an intermediate or trans i t ion reg ion in which the
vert ica l s tress becomes non-uni form because of the inf luence
exerted by the so i l b in s idewal l , and (3 ) a lower reg ion in
which the vert ica l s tress again approaches a uni form

98
dis tr ibut ion but o f somewhat l e ss magni tude than in the
upper reg ion .
C. Vert ica l Stress Variat ion
1 . Stress transfer
o C d Y r
V
1 ) 1 I _ L dY
f M f t (a Y + ^dY) A
When the forces due to s ta t ic loads act ing on an incre
menta l layer of sand in the upper reg ion are summed the resul t
i s do
°YA " ( °Y + w d Y ) A - TCdY = 0
2 where A = nr , r i s the radius of the e lement and the weight
o f the sand i s neglected . Thus
-da , Y dY
fY dY
dY ( TIT ) = r (2 irr ) dY
2 r
Before the preceding equat ion can be integrated , the
shear ing s tress var iat ion must be spec i f ied . The assumpt ion
that the hor izonta l s tress i s a funct ion of the vert ica l

99
s tress , cr^ = KCy as used by Terzaghi i ,21 j and o thers , wi l l
be appl ied to th i s deve lopment . I f K i s assumed to be con
s tant and cohes ion i s neg lected , the shear ing s tress i s
r = cr K tan <p where <p i s the angle of in ternal fr ic t ion
of the sand. Thus
^Y_ . 2r _ 2 K t dY = T~ = r c t
Y K tan <p
d t Y 2 + —o K tan ip = 0 d Y r Y
And, i f the surface pressure i s q ,
°Y = - —j K ( tan <p) Y
(Eq. 1 )
An assumpt ion used in th i s deve lopment i s that the normal
force i s of such magni tude that the maximum shear ing s tress
i s deve loped.
I t should be noted that as the s ize of the e lement in
creases in d iameter , 2r becomes equal to s , the d iameter of the
so i l b in , and the preceding equat ion must be modi f ied s ince the
coef f ic ient of f r ic t ion between sand and meta l d i f fers from
the tan prev ious ly used . This modi f icat ion i s d iscussed in
the next sec t ion .
As a f i r s t approximat ion , the rat io K = c^/Oy c a n be
assumed to be constant . Tests (5 ) have shown that under s ta t ic
loading the va lue of K var ies from about 0 .40 at a depth of 4"
to about 0 .25 a t a depth of 16" in dry sand. These va lues

100
compare wi th the 0 .34 obta ined by Hsndron (ô ) and the range
of from 0 .25 to 0 .42 obta ined by Terzaghi (as quoted by
Hendron) for dry sands . No depth was spec i f ied for the la t ter
two va lues . I f a l inear re lat ionship i s assumed, the equat ion
descr ib ing the var iat ion of K wi th depth i s K = 0 .45 - 0 .0125 Y.
For the range of depths used here ( from zero to 6") a va lue for
K o f 0 .4 may be used wi th a resul t ing error of l e ss than 13%.
However , i f the more accurate K i s des ired , then the prev ious
deve lopment o f an equat ion represent ing s tress transfer should
be modi f ied so that
- ( tan <p) (0 .45Y - 0 .0062Y 2 ) o = q e
Y ( E q . 2 )
However , for the purposes o f th i s s tudy K i s assumed to be
constant and equal to 0 .4 .
2 . S idewal l f r ic t ion
As ment ioned prev ious ly , the coef f ic ient of f r ic t ion
a long the s idewal l i s d i t ferent from that which occurs in
the sand i t se l f and must be taken into cons iderat ion . From
sources such as Luscher and Hoeg (8 ) and Marino (9 ) , a va lue
of ip equal to 38° i s obta ined for 20-30 Ottawa sand wi th a
spec i f ic weight o f approximate ly 111 to 112 pounds per cubic
foot. This gives a coefficient of internal friction (tan <p)
equal to 0 .78 . S imple t es t s to determine the coef f ic ient of
f r ic t ion between sand and the so i l b in wal l indicate that a
va lue for f o f approximate ly 0 .5 ± 0 .1 appl ies a long the

101
s idewal l . S ince the shear ing s tress i s d irect ly proport ional
to the coef f ic ient of f r ic t ion , the sand thus has an ab i l i ty
to transmit shear ing s tresses wi th in i t se l f which i s greater
than the abi l i ty to transmit them to the so i l b in wal l .
Therefore , there must be some l ine of demarcat ion where the
e f fec t of reduced shear carry ing abi l i ty i s noted . This
surface of demarcat ion (when cons idered in three d imens ions)
i s cons idered to touch the s idewal l a t the top of the so i l
b in and move toward the center as depth increases . S ince
l i t t l e analyt ica l informat ion i s avai lable on th i s subject ,
the geometry of th i s surface i s not def ined here . The e f fec t
of s idewal l f r ic t ion wi l l be approximated by assuming that
the prev ious ly deve loped s tress funct ion - — K ( tan </>)Y a y = qe 5
wil l be changed to -4 Oy = qe 5
(Eq. 3 )
a t some po int in the trans i t ion reg ion of the so i -T b in . Thus
the s idewal l f r ic t ion can cause a change in the rate a t which
the vert ica l s tress i s changing wi th depth . Exper imenta l
resu l t s from s tat ic and dynamic t es t s p lot ted on Figures 31
and 49 indicate that th i s change poss ib ly occurs between
depths of 1^" to 2" for the 1" d iameter cy l inder and between
2" and 2/^" for the /£" d iameter cy l inder . I t should be noted
that the tes t cy l inder d iameter apparent ly determines the
depth a t which the rate of vert ica l s tress at tenuat ion changes
but has no e f fec t on the amount o f change .

102
3 . Arching
The equat ions deve loped in the preceding sect ions to
es t imate the change in vert ica l s tress were independent o f
whether or not a t es t s tructure was bur ied in the so i l b in .
However , the mechanism of arching , which i s def ined by
Terzaghi (21) as the transfer of pressure from a y ie ld ing
mass o f so i l onto an adjo in ing s tructure which deforms l ess
than the so i l , depends on there be ing a d i scont inui ty in the
so i l , such as a t es t s tructure , which i s of d i f ferent s t i f f
ness than the surrounding so i l . Thus , th i s phenomenon i s
actual ly caused by the tes t s tructure i t se l f . For ins tance ,
i f the tes t s tructure were to deform under load a t the same
rate as the sand there would be no arching . However , i f the
s tructure i s s t i f fer than the sand i t wi l l deform less than
the sand and an increased amount o f load wi l l be sh i f ted
from the sand to the s tructure unt i l i t s deformat ion ap
proaches that of the sand. A sketch depic t ing th i s phenomenon
i s shown in Figure 54 . In the free body d iagram shown in
Figure 54 , i t i s assumed that the amount o f sand a f fected by
arching i s l imited to a co lumn d irect ly above the cy l inder .
Terzaghi (21) a l so uses th i s assumpt ion concerning the sur
faces of s l id ing even though the actual surfaces are probably
bes t represented by the l ines ae and bf .
The free body d iagram shown in Figure 54 i s used as an
a id in the deve lopment o f an equat ion which wi l l descr ibe
the s tra in exper ienced by a t es t s tructure in a smal l so i l b in .

103
1 . 1 . 1 . 1 , 1
SOIL BIN SIDEWALL
(oh>ovA
Î 1 Î Î Î ay h D
A = AREA
q. = SURFACE PRESSURE
h = CYLINDER LENGTH
0 = CYLINDER DIAMETER s = SOIL BIN DIAMETER Y = DEPTH
FIG. 54. F R E E B O D Y D I A G R A M O F S O I L E L E M E N T .

104
An assumpt ion used to deve lop th i s re lat ionship i s that the
shear ing s tress i s d irect ly proport ional to the hor izonta l
s tress which i s of suf f ic ient magni tude that the maximum
shear i s deve loped at a l l depths of concern . The expres
s ion for the shear ing s tress i s wri t ten as
T = ^ ( ° h ) « (Eq. 4 ,
This assumpt ion i s based on the fact that a f r ic t ional force
i s a funct ion of the normal force and the coef f ic ient of
f r ic t ion . A second assumpt ion i s that the hor izonta l s tress
i s a funct ion of the vert ica l s tress (as descr ibed prev ious ly)
and that a re lat ionship s imi lar to equat ion 1 can be used to
descr ibe the var iat ion of vert ica l s tress wi th depth . This
assumpt ion indicates that
( O a u = kO (<0; h y av - ^2 v Y'av
I Y '2
-, s 1 av = ko q e
- : Y = k 2 qe
(Eq. 5 )
For s impl ic i ty i t has been assumed that the appropriate va lue
for Y g v i s proport ional to Y and that the constant of propor
t ional i ty can be absorbed in the coef f ic ient B. In equat ion 5
kg and B are constants , s represents the so i l b in d iameter ,
q i s the surface pressure , and the subscr ipt av denotes a
va lue averaged over the sect ion . I t wi l l be further assumed
that the s tra in in the cy l inder i s proport ional to the s tress

105
in the so i l immediate ly above the cy l inder so that
' " ( E q . 6 )
A s imi lar assumpt ion was made by Hendron (6 ) and Hanley (5 ) .
Summation o f the forces on the free body d iagram of Figure 54
g ives
ZTfy = 0 = qhD - OyhD + rY (2h + 2D)
Oy = q + 2rY hD
= < * + 2 k l ( o h ' a v Y f h + D )
= q + 2k^k q (h + D)
hD
hD
Ye
= q [ l + k 4 Y ( i + 1 ) e
•B ?
• B ï
€ = k
= q C 1 + k 4 ÏÏ ( 1 + 8
)*Y = kgq [ l + % (1 + g ) e
-B X H D s
- b 5 7
(Eq. 7 )
To locate the po int a t which the s tra in equat ion has a maximum
or minimum point , the der ivat ive of equat ion 7 i s se t equal to
zero . Thus
•B X D
5Y = 0 = k3^k4 ( 1 + H> D ( e C 5 - | Ye D s) 3 M 4
(Eq. 8)

106
From Figure 31 , i t can be determined that the exper i
menta l ly measured s tra in peaks a t a depth of approximate ly
1" . Thus
from Figure 30 that the average s tra in on the cy l inders under
a s ta t ic surface load of 85 ps i i s 282 /*€ a t a Y/D of zero
and 378 gc a t a Y/D of one . I t should be noted that i t i s
poss ib le to use these va lues because the s tra ins recorded on
the tes t cy l inders are approximate ly equal to each other a t
these va lues of Y/D. Use o f the f i rs t va lue l i s ted above
indicates that kg = 3 .32 so the s tra in equat ion can be wri t ten
S ince D/h equals i-5 t or a l l tes t cy l inders , the equat ion becomes
I t should be noted that k^ i s poss ib ly a funct ion of the Pi
term D/s which provides the fo l lowing va lues where the 1"
d iameter cy l inder i s cons idered as the prototype and the
d iameter cy l inder as the model .
B = s /Y = 3 .25/1 = 3 .25
The two constants k^ and k^ can be eva luated by not ing
as
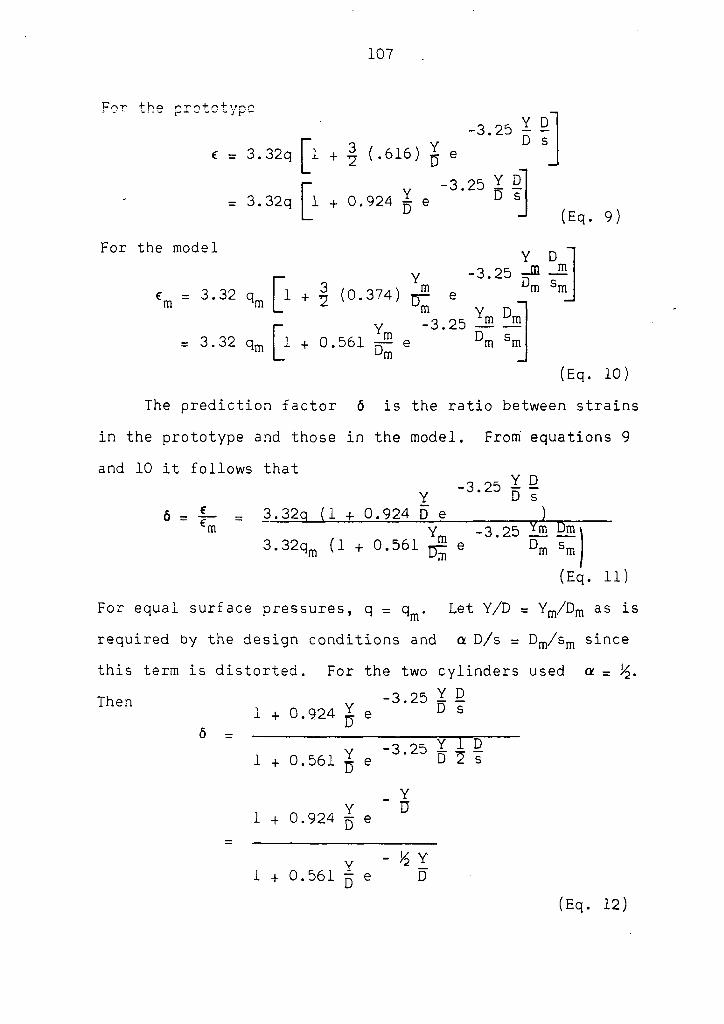
107
For the prototype
e = 3 .32q £1 + ! (.616)
0
Y •3 .25 X D
D s
Y -3 .25 Y ° = 3 .32q I 1 + 0 .924 1 e u 5
(Eq. 9)
For the model Y D
y -3 .25 ^ m
%= 3 ' 3 2 %, I 1 + 2 (0-374) ^ e
V -3 .25 Em b
t
^m s m
= 3 .32 q m 1 + 0 .561 D m s m
(Eq. 10)
The predic t ion factor 6 i s the rat io between s tra ins
in the prototype and those in the model . From equat ions 9
and 10 i t fo l lows that
Y -3 .25 X D
D s 6 = | - = 3 .32q (1 + 0 .924 D e
•m 3 .32q m (1 + 0 .561
y I -3 .25 IE Dm m 6 D m s m
(Eq. 11)
For equal surface pressures , q = q^. Let Y/D = Y m /D m as i s
required by the des ign condi t ions and a D/s = D m / s m s ince
th i s term i s d is torted . For the two cy l inders used a = !<$.
Then
6 =
v -3 '25 Y D 1 + 0 .924 Y e D 5
1 + 0 .561 % e "3-^5 % ^ g
1 + 0 .924 X e
Y D
1 + 0 .561 ^ e - % Y
D
(Eq. 12)
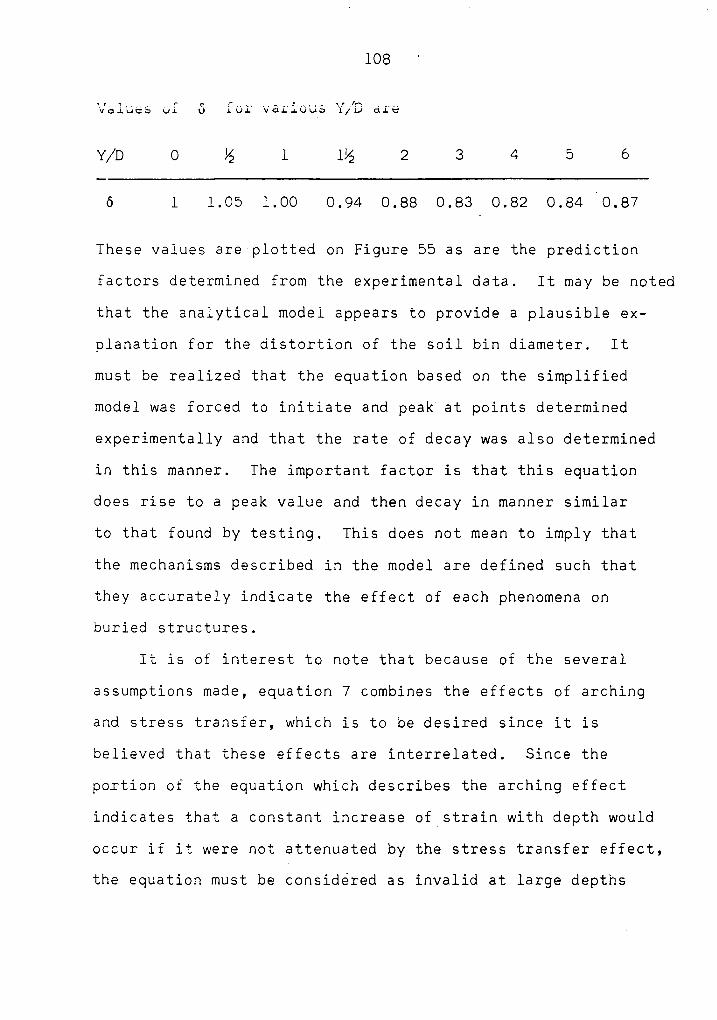
108
x .r. i .. r ç r .. ... * i i\.r /ps , voiuca u i u i vx v ai xu ua i / iv axe
Y/D 0 y 1 1% 2 3 4 5 6
ô 1 1 .05 1 .00 0 .94 0 .88 0 .83 0 .82 0 .84 0 .87
These va lues are p lot ted on Figure 55 as are the predic t ion
factors determined from the exper imenta l data . I t may be noted
that the analyt ica l model appears to provide a p laus ib le ex
planat ion for the d i s tort ion of the so i l b in d iameter . I t
must be rea l ized that the equat ion based on the s impl i f ied
model was forced to in i t ia te and peak a t po ints determined
exper imenta l ly and that the rate of decay was a l so determined
in th i s manner . The important factor i s that th i s equat ion
does r i se to a peak va lue and then decay in manner s imi lar
to that found by tes t ing . This does not mean to imply that
the mechanisms descr ibed in the model are def ined such that
they accurate ly indicate the e f fec t of each phenomena on
bur ied s tructures .
I t i s of in teres t to note that because of the severa l
assumpt ions made , equat ion 7 combines the e f fec ts of arching
and s tress transfer , which i s to be des ired s ince i t i s
be l ieved that these e f fec ts are interre lated . S ince the
port ion of the equat ion which descr ibes the arching e f fec t
indicates that a constant increase of s tra in wi th depth would
occur i f i t were not a t tenuated by the s tress transfer e f fec t ,
the equat ion must be cons idered as inval id a t large depths

1.20
0.80
S
0.40
-6-
• STATIC
• DYNAMIC LOADING
_L 0 12 3
Y / D
FIG. 55. COMPARISON OF PREDICTION
t \
L 4
FACTORS.

110
unless the e f fec ts are combined. The correct ion to the
equat ion for s idewal l f r ic t ion must s t i l l be added a t the
correct depth by changing the coef f ic ient of- f r ic t ion . Also
to be noted in th i s equat ion i s the fact that the e f fec t of
d i s tort ing var ious factors such as the surface pressure q or
the P i terms Y/D, D/h , or D/s can be es t imated in a manner
s imi lar to the foregoing in which a d i s tort ion factor was
computed to indicate the e f fec t of d i s tort ing the Pi term D/s .
In Figure 56 i s shown a comparison of the exper imenta l ly
determined s tra ins wi th those predic ted by the equat ion for
each s ized cy l inder which were deve loped on the bas i s o f the
analyt ica l model . I t can be noted that the shape of the curves
i s s imi lar but that the magni tudes o f the predic ted s tra ins
are too h igh a t the greater depths . Equat ions 9 and 10
correct ly predic t that the s tra ins in the two cy l inders wi l l
be equal on the surface and that for equal va lue of Y/D
the s tra in in the smal ler cy l inder wi l l be greater than that
in the larger cy l inder a f ter the peak s tra in i s at ta ined .
They a l so predic t that the curves wi l l cross a t a Y/D of
about one which i s conf irmed by exper imenta l resu l t s . Again
i t should be s ta ted that the s imple mechanisms descr ibed in
th i s analyt ica l model serve only to approximate the actual
phenomena and because o f the many s implfy ing assumpt ions
made cannot be expected to descr ibe i t accurate ly .
Tie constants which were determined for the s tra in
equat ions provide addi t ional informat ion . For ins tance , the

400
w 4.
200
< cc #— CO
% f v \
EXPERIMENTAL 1/2" CYLINDER
FIG. 56. PREDICTED AND
EQUATION 10 FOR 1/2" CYLINDER
V
T y
EXPERIMENTAL f CYLINDER
EQUATION 9 FOR I" CYLINDER
1 1 l L 3 4 5 6
Y / D
ACTUAL STRAIN.

112
equat ions indicates that k-> the constant which re lates the
cy l inder s tra in to the vert ica l s tress in the so i l , i s inde
pendent of D/s . However , k , which i s re lated to the sand's
angle of internal fr ic t ion and to the rat io of hor izonta l to
vert ica l s tress , appears to be dependent on the P i term D/s .
S ince the va lue of k , as determined from exper imenta l data
i s approximate ly twice as large for the 1" d iameter cy l inder
as for the V 2n diameter cy l inder , i t appears that k^ may be
d irect ly proport ional to D/s .
D. Resul t s Der ived from the Analyt ica l Model
The use o f a s imple analyt ica l model resu l t s in s tra in
and predic t ion equat ions which adequate ly descr ibe the mech
anisms re lated to the behavior of a t es t s tructure embedded
in a smal l so i l b in . The equat ions a l so indicate the re lat ion
ship between s tra in and var ious d imens ionless parameters in
such a way that the e f fec t of d i s tort ing these terms can be
es t imated . Resul t s from exper imenta l t es t s conf irm the
general trends predic ted by these equat ions . The equat ions
based on the analyt ica l model predic t that s tra ins on model
and prototype tes t cy l inders would be ident ica l a t a l l
depths of bur ia l i f there were no d i s tort ion of the D/s P i
term, indicat ing that true model ing would occur . However ,
the d i s tort ion of D/s causes the resul t s to corre late
bet ter when p lot ted as a funct ion of Y rather than Y/D.
This can be demonstrated from equat ions 9 and 10 i f the

113
s tra ins are wri t ten in terms of Y. The fact that the s tra ins
detected in the tes t cy l inders are a lmost ident ica l for zero
depth of bur ia l indicates that the cy l inders react s imi lar ly
when subjected to the same load and that model ing occurs a t
that depth but becomes d i s torted as depth of bur ia l in the
sand increases . The resul t s obta ined from the analyt ica l
model s trongly support the conc lus ion that the pr imary cause
of the d i f ferences in s tra in between model and prototype i s
the d i s tort ion of the des ign condi t ion re lated to the geometry
o f the so i l b in .
Only the s ta t ic loading case has been cons idered in the
deve lopment o f the analyt ica l model . Due to the numerous
s implfy ing assumpt ions made in the s ta t ic loading analys i s i t
i s be l ieved that the addi t ional re f inement o f cons ider ing
dynamic e f fec ts i s not warranted . However , i t i s of in teres t
to note in Figure 55 that the resul t s obta ined in the dynamic
t es t s are in reasonable agreement wi th the predic t ion equat ion
g iven by equat ion 12 .
A comparison of the dynamic and s ta t ic s tra ins a t equal
depths indicates that they vary from an essent ia l ly one to one
rat io a t the surface (which again indicates that the cy l inders
respond s imi lar ly to equal pressures) to rat ios between 0 .8
and 1 .4 dependent on depth . Al though no def in i te re lat ion was
determined, the fact that the s tra ins are s imi lar for the two
types of load appl icat ion indicates that th i s may be a worth
whi le f i e ld for more inves t igat ion . The fact that l i t t l e
114
ev idence of arching e f fec t has been detected in shock tubes
which have a neg l ig ib le hold t ime or drop weight fac i l i t i es
which a l so create that type of load , indicates that arching
may be t ime dependent , for arching certa in ly can be detected
when s ta t ic loads or shock loads of long hold t imes are
appl ied to a so i l conta in ing a t es t s tructure .

L io
VIII . SUMMARY AND CnNCM.'SKNS
The resul t s of the invest igat ion can ce summarized in
two groups ; those re lated to the general behavior or the tes t
cy l inders and those re lated to the s imi l i tude requirements .
A. Test Cyl inder Behavior
Comparison 01 data irorr , s tra in gages mounted a t var ious
locat ions on tes t cy l inders when subjected to a s ta t ic surface
pressure indicates that the to ta l s tra in exper ienced oy a t es t
cy l inder wi l l cons i s t o f about 90% Lending and IC/o hoop s tra in .
There i s no apparent var iat ion in these percentages wi th depth .
When resul t s from gages mounted on the top and bot tom of the
cy l inders were compared i t was observed that the top of the
cy l inder exper iences l ess s tra in than the bot tom when the
cy l inder i s at zero depth of bur ia l . This remains true for
shal low depths but as depth increases the top s tra in oecomes
and remains larger than that measured on the bot tom. The
reason proposed for th i s phenomenon i s that , whi le arching
i s not detectable on the surface o : the so i l o i .n , i t increases
rapid ly wi th depth unt i l a near ly constant va lue i s a t ta ined .
S ince i t then has about an equal e f fec t on both gages , the
e f tec t o i decreas ing s tra in wi th depth caused by s tress
transfer oecomes predominant and the top gage exper iences
the greater s tra in .
By re lat ing the s ta t ic surface pressure and the s tra in
on a t es t cy l inder to the pressure a t some depth in the sand

116
and to the s tra in in the sand respect ive ly , i t was determined
that the energy loss in the sand due to the reversa l of shear
ing forces dur ing a complete loading-unloading cyc le i s a
l inear funct ion ot depth for equal s tra ins a t each depth . For
a constant surface load and the consequent var iat ion of s tress
wi th depth , the energy loss wi l l reach a peak and gradual ly
decrease wi th increas ing depth .
F igures 39 , 44 and 45 show that the s tra in traces caused
by the dynamic loading of t es t cy l inders are s imi lar to the
pressure traces a t the same depths in the so i l b in . This
indicates that the re lat ionship between s tress in the so i l
and s tra in in the tes t cy l inder i s essent ia l ly constant under
these condi t ions . The var iat ion of the pressure traces con
f irms the observat ions of Se l ig and Vey (18) in that the peak
va lue decreases as the wave propagates through the sand.
F igures 52 and 53 show that the load-s tra in curves
obta ined from s tat ic and dynamic loading of t es t cy l inders
are s imi lar in shape and magni tude except a t shal low depths
o f bur ia l where they vary as much as 40% in magni tude . Under
both s ta t ic and dynamic loading , the s tra in exper ienced by a
t es t cy l inder in a smal l so i l b in in i t ia l ly increases wi th
depth of bur ia l , reaches a peak and then begins an exponent ia l
decrease as depth cont inues to increase . A second smal l
increase in s tra in occurs dur ing the decay per iod which i s
be l ieved to be caused by s idewal l f r ic t ion . Further s tudy i s
required to obta in more accurate equat ions descr ib ing the

117
mechanisms o f s tress transfer , arching and s idewal l f r ic t ion .
B. S imi l i tude Requirements
The model des ign deve loped by d imens ional analys i s was
used to eva luate the ut i l i zat ion of a smal l shock tube as a
t es t ing device . The pert inent var iables were se lec ted and
used to form Pi terms and des ign condi t ions upon which the
tes t s were based . Des ign condi t ions re lated to the so i l
gra in s ize , so i l b in d iameter and t ime could not be met
and were thus d i s torted .
Comparison o f resul t s from tes t s in which the gra in s ize
was sca led wi th those in which i t was not indicates that
there wi l l be an error of l e ss than 4% in the s tra in readings
i f the so i l gra in s ize -cy l inder d iameter rat io (b /D) remains
l e ss than 0 .056 . According to the data shown in Figure 22
the s tra in decreases as . b /D increases .
Model ing o f s tra ins from both s tat ic and dynamic loading
occurs a t the surface of the so i l b in but i s d is torted at
greater depths of bur ia l . This d i s tort ion causes the s tra ins
on model and prototype to compare more favorably when p lot ted
as a funct ion of depth rather than as a funct ion of the Pi
term Y/D, as required by the d imens ional analys i s . To deter
mine the cause o f th i s d i s tort ion a s imple analyt ica l model
was proposed which apparent ly expla ins th i s act ion . The
s tra in equat ion and the semi-empir ica l predic t ion equat ion
118
deve loped from th i s model indicates that the d i s tort ion of
the P i term conta in ing the so i l b in d iameter causes the
corre lat ion of s tra ins to be bet ter when p lot ted as a
funct ion o f depth rather than of Y/D. No percept ib le
resul t s were noted from the d i s tort ion of P i term 14 ,
2 2 2 2 D m /p t m = 0 /pt which tends to conf irm the assumpt ion
that the propert ies of dry sand are independent of s tra in rate .

119
IX. REFERENCES CITED
1 . Aggarwal , H. R . , So ldate , A. M. and Hook, J . F . A theoret ica l analys i s o f s tress wave interact ion in a model so i l . AFSWC-TDR-63-43 . Kirt land Air Force Base , New Mexico . Technica l Library , Air Force Spec ia l Weapons Center . 1963 .
2 . Baron, M. L . and Ble ich , H. H. Further s tudies of the response of a cy l indr ica l she l l to a transverse shock wave . Washington, 0 . C. Off ice of Naval Research . 1953 .
3 . , and Weidl inger , P . Theoret ica l s tudies of ground shock phenomena. Bedford, Massachuset t s . The MITRE Corporat ion . 1960 .
4 . Ble ich , H. H. Dynamic in teract ion between s tructures and f lu ids . In Goodier , J . N. and Hoff , N. J . , eds . Structura l mechanics . Proceedings of the f i rs t sympos ium on naval s tructural mechanics , Stanford Univers i ty , pp . 263-284 . New York, N. Y. Pergamon Press . 1960 .
5 . Hanley , J . T . Interact ion between a sand and cy l indr ica l she l l s under s ta t ic and dynamic loading . Unpubl i shed Ph.D. thes i s . Urbana, I l l ino is . Library , Univers i ty of I l l ino is . 1963 .
6 . Hendron, A. J . , Jr . The behavior of sand in one-dimens ional compress ion . RTD-TDR-63-3089 . Kirt land Air Force Base , New Mexico . Technica l Library , Air Force Spec ia l Weapons Center . 1963 .
7 . Huang, T . , Iyengar , S . and Jennings , R. L . S tudies o f the response of arches and domes under dynamic loads . AFSWC-TR-61-90 . Kirt land Air Force Base , New Mexico . Technica l Library , Air Force Spec ia l Weapons Center . 1961 .
8 . Luscher , R. and Hoeg , K. The interact ion between a s tructural tube and the surrounding so i l . RTD-TDR-63-3109 . Kirt land Air Force Base , New Mexico . Technica l Library , Air Force Spec ia l Weapons Center . 1964 .
9 . Marino , R. L . , Jr . A s tudy of s ta t ic and dynamic res i s t ance and behavior o f s tructural e lements . RTD-TDR-63-3060 . Kirt land Air Force Base , New Mexico . Technica l Library , Air Force Spec ia l Weapons Center . 1963 .
120
10 . Mason, H. G, , Cr iner . 0 . H, . Waissar , R, and Wal lace , N. R. A s tudy of the dynamic so i l - s tructure interact ion character i s t ics of rea l so i l media . RTD-TDR-63-3075 . Kirt land Air Force Base , New Mexico . Technica l Library , Air Force Spec ia l Weapons Center . 1963 .
11 . Mindl in , R. D. and Ble ich , H. H. Response o f an e las t ic cy l indr ica l she l l to a transverse , s tep shock wave . American Soc ie ty of Mechanica l Engineers Journal o f Appl ied Mechanics 75: 189-195 . 1953 .
12 . Murphy, Glenn. S imi l i tude in engineer ing . New York, N.Y. Roland Press Co. 1950 .
13 . and Young, D. F . A s tudy of the use of models to s imulate dynamical ly loaded underground s tructures . SWC-TDR-62-2 . Kirt land Air Force Base , New Mexico . Technica l Library , Air Force Spec ia l Weapons Center . 1962 .
14 . , and Mart in , C. W. Use o f models to predic t the dynamic response of dynamical ly loaded underground s tructures . RTD-TDR-63-3064 . Kirt land Air Force Base , New Mexico . Technica l Library , Air Force Spec ia l Weapons Center . 1963 .
15 . Newmark, N. M. and Hai t iwanger , J . D. Pr inc ip les and pract ices for des ign of hardened s tructures . AFSWC-TDR-62-138 . Kirt land Air Force Base , New Mexico . Technica l Library , Air Force Spec ia l Weapons Center . 1962 .
16 . Rickle fs , M. J . Impact character i s t ics of an expanding gas in a cy l indr ica l tube . Unpubl i shed M_.S . thes i s . Ames , Iowa, Library , Iowa State Univers i ty of Sc ience and Technology . 1963 .
17 . Se l ig , E. T . and Rus in , R. Gage p lacement s tudy . RTD-TDR-63-3024 . Kirt land Air Force Base , New Mexico . Techn ica l Library , Air Force Spec ia l Weapons Center . 1963 .
18 . and Vey , E . Behavior o f shock waves in sand. Proceedings o f the Second As ian Regional Conference on So i l Mechanics and Foundat ion Engineer ing , Tokyo, Japan, 1 : 82-87 . 1963 .
19 . So ldate , A. M. and Hook, J . F . A theoret ica l s tudy of s tructure-medium interact ion . AFSWC-TN-61-6 . Kirt land Air Force Base , New Mexico . Technica l Library , Air Force Spec ia l Weapons Center . 1960 .
121
20 . and • A theoret ica l s tudy of s tructure-meBium interact ion . AFSWC-TDR-62-30 . Kirt land Air Force Base , New Mexico . Technica l Library , Air Force Spec ia l Wea^-oTTs Center . 1962 .
21 . Te^zaghi , K. Theoret ica l so i l mechanics . New York, N. Y. John Wiley and Sons , Inc . 1943 .
22 . Timoshenko, S . Vibrat ion problems in engineer ing . 3rd ed . Pr inceton , New Jersey . D. Van Nostrand Co. , Inc . 1955 .
23 . Whitman, R. V. and Healy , K. A. Shear s trength of sand during rapid loadings . Proceedings o f the American Soc ie ty of Civ i l Engineers , Journal o f So i l Mechanics Div i s ion 88: 99 . 1962 .
24 . Yoshihara , T . , Robinson, . A. R. and Merr i t t , J . L. Interact ion of p lane e las t ic waves wi th an e las t ic cy l indr ica l she l l . Urbana, I l l ino is . Univers i ty of I l l ino is c iv i l engineer ing s tudies , s tructural research ser ies no . 261 . 1963 .
122
X. ACKNOWLEDGEMENTS
The author takes th i s opportuni ty to express h i s
s incere apprec iat ion to Dr . Donald F . Young for h i s guidance
and encouragement dur ing th i s invest igat ion .
I wish to thank the personnel o f the Air Force Weapons
Laboratory , Kirt land Air Force Base , New Mexico , for the
loan of equipment wi thout which the co l lec t ion of data
would have been much more compl icated and t ime consuming.
I wish a l so to thank my wi fe , Ruth , and son , Douglas ,
for the ir he lp and encouragement dur ing the course of th i s
invest igat ion .