Respiratory Mechanics in Mechanically Ventilated Patients...Respiratory mechanics refers to the...
22
Respiratory Mechanics in Mechanically Ventilated Patients Dean R Hess PhD RRT FAARC Introduction Pressure Airway Pressure Equation of Motion Alveolar Pressure Plateau Pressure Auto-PEEP Mean Airway Pressure Esophageal Pressure Transpulmonary Pressure Intra-Abdominal Pressure Transdiaphragmatic Pressure Asynchrony Stress Index Flow and Volume Time Constant Inspiratory Flow Expiratory Flow Tidal Volume End-Expiratory Lung Volume Derived Measurements Respiratory System Compliance Chest-Wall Compliance Lung Compliance Airway Resistance Work of Breathing Pressure-Volume Curves Flow-Volume Loops Tension-Time Index and Pressure-Time Product Esophageal Pressure for PEEP Titration Stress and Strain Spontaneous Breathing and Pressure-Targeted Ventilation Pleural Pressure and Hemodynamics During Mechanical Ventilation Respiratory mechanics refers to the expression of lung function through measures of pressure and flow. From these measurements, a variety of derived indices can be determined, such as volume, compliance, resistance, and work of breathing. Plateau pressure is a measure of end-inspiratory distending pressure. It has become increasingly appreciated that end-inspiratory transpulmonary pressure (stress) might be a better indicator of the potential for lung injury than plateau pressure alone. This has resulted in a resurgence of interest in the use of esophageal manometry in mechan- ically ventilated patients. End-expiratory transpulmonary pressure might also be useful to guide the RESPIRATORY CARE • NOVEMBER 2014 VOL 59 NO 11 1773
Transcript of Respiratory Mechanics in Mechanically Ventilated Patients...Respiratory mechanics refers to the...
Respiratory Mechanics in Mechanically Ventilated Patients
Dean R Hess PhD RRT FAARC
IntroductionPressure
Airway PressureEquation of MotionAlveolar PressurePlateau PressureAuto-PEEPMean Airway PressureEsophageal PressureTranspulmonary PressureIntra-Abdominal PressureTransdiaphragmatic PressureAsynchronyStress Index
Flow and VolumeTime ConstantInspiratory FlowExpiratory FlowTidal VolumeEnd-Expiratory Lung Volume
Derived MeasurementsRespiratory System ComplianceChest-Wall ComplianceLung ComplianceAirway ResistanceWork of Breathing
Pressure-Volume CurvesFlow-Volume LoopsTension-Time Index and Pressure-Time ProductEsophageal Pressure for PEEP TitrationStress and StrainSpontaneous Breathing and Pressure-Targeted VentilationPleural Pressure and Hemodynamics During Mechanical Ventilation
Respiratory mechanics refers to the expression of lung function through measures of pressure andflow. From these measurements, a variety of derived indices can be determined, such as volume,compliance, resistance, and work of breathing. Plateau pressure is a measure of end-inspiratorydistending pressure. It has become increasingly appreciated that end-inspiratory transpulmonarypressure (stress) might be a better indicator of the potential for lung injury than plateau pressurealone. This has resulted in a resurgence of interest in the use of esophageal manometry in mechan-ically ventilated patients. End-expiratory transpulmonary pressure might also be useful to guide the
RESPIRATORY CARE • NOVEMBER 2014 VOL 59 NO 11 1773
setting of PEEP to counterbalance the collapsing effects of the chest wall. The shape of the pressure-time curve might also be useful to guide the setting of PEEP (stress index). This has focused interestin the roles of stress and strain to assess the potential for lung injury during mechanical ventilation.This paper covers both basic and advanced respiratory mechanics during mechanical ventilation.Key words: auto-PEEP; chest wall; compliance; esophageal pressure; mechanical ventilation; plateaupressure; resistance; respiratory mechanics; work of breathing. [Respir Care 2014;59(11):1773–1794.© 2014 Daedalus Enterprises]
Introduction
Respiratory mechanics refers to the expression of lungfunction through measures of pressure and flow.1,2 Fromthese measurements, a variety of derived indices can bedetermined, such as volume, compliance, resistance, andwork of breathing (WOB). Waveforms are derived whenone of the parameters of respiratory mechanics is plottedas a function of time or as a function of one of the otherparameters. This produces scalar tracings of pressure-time, flow-time, and volume-time graphics, as well asflow-volume and pressure-volume (P-V) loops. All current-generation positive-pressure ventilators provide some mon-itoring of pulmonary mechanics and graphics in real timeat the bedside. When interpreting these measurements, it isimportant to remember that bedside monitoring of me-chanics and graphics during positive-pressure ventilationportrays the lungs as a single compartment and assumes alinear response over the range of tidal volume (VT). Al-though this is a physiologic oversimplification, the infor-mation nonetheless is useful to evaluate lung function,assess response to therapy, and optimize mechanical ven-tilator support. An evaluation of respiratory mechanicsallows the best available evidence to be individualized tothe patient. By necessity, any discussion of respiratorymechanics involves mathematics. Fortunately, much of themathematics is basic algebra, and for the most part, I willstick to that in this paper.
Pressure
Airway Pressure
Airway pressure is measured universally during me-chanical ventilation. Pressure is measured ideally at theproximal airway, but most ventilators do not because prox-imal airway pressure monitoring exposes the sensor tosecretions and carries other technical issues.3 Alternatively,the ventilator can measure pressure proximal to the expi-ratory valve during the inspiratory phase to approximateinspiratory proximal airway pressure, and it can measurepressure distal to the inspiratory valve during the expira-tory phase to approximate expiratory proximal airway pres-sure. Because flow in the expiratory limb is zero duringthe inspiratory phase and flow in the inspiratory limb iszero during the expiratory phase, pressures measured inthis manner should approximate proximal airway pressure.
Airway pressure is typically displayed on the ventilatorscreen as a function of time. The shape of the airwaypressure waveform is determined by flow and VT from theventilator, lung mechanics, and any active breathing ef-forts of the patient.
Equation of Motion
Airway pressure is predicted mathematically by the equa-tion of motion:
Pvent � Pmus � VT/CRS � Raw � VI
� PEEP � PEEPi � inertance (1)
where Pvent is the proximal airway pressure applied by theventilator, Pmus is the pressure generated by the patient’sinspiratory muscles, VT is tidal volume, CRS is respiratorysystem compliance, Raw is airway resistance, VI is inspira-tory flow, PEEP is the PEEP set on the ventilator, andPEEPi is intrinsic PEEP (auto-PEEP). The inertance vari-able, representing the effect of inertia, is assumed to below and thus disregarded.
Raw and CRS can be obtained by fitting the equation ofmotion to P, V, and V with a multiple linear regressionanalysis, called linear least-squares fitting.4 This approach
Dr Hess is affiliated with Respiratory Care Services, Massachusetts Gen-eral Hospital, and Harvard Medical School, Boston, Massachusetts.
Dr Hess discloses relationships with Philips Respironics, Pari, Covidien,Maquet, Merck, Bayer, McGraw-Hill, Jones and Bartlett, and UpToDate.
Dr Hess presented a version of this paper at the 29th New Horizons inRespiratory Care Symposium: Back to the Basics: Respiratory Physiol-ogy in Critically Ill Patients at the 59th AARC Congress, held Novem-ber 16–19, 2013, in Anaheim, California.
Correspondence: Dean R Hess PhD RRT FAARC, Respiratory CareServices, Ellison 401, Massachusetts General Hospital, 55 Fruit Street,Boston, MA 02114. E-mail: [email protected].
DOI: 10.4187/respcare.03410
RESPIRATORY MECHANICS DURING MECHANICAL VENTILATION
1774 RESPIRATORY CARE • NOVEMBER 2014 VOL 59 NO 11
is incorporated into the software of some ventilators, al-lowing display of Raw, CRS, and auto-PEEP without theneed for inspiratory and expiratory pause maneuvers. P, V,and V are digitized at 100 Hz, allowing Raw and CRS becalculated from 100 or more equations per breath. Thismethod can be applied during the whole breathing cycle oronly in the inspiratory or expiratory phase, although re-stricting the analysis to the inspiratory phase may be moreappropriate in patients with COPD who have flow limita-tion. The least-squares fitting method assumes that Pmus iszero and is thus less valid if the patient is actively breath-ing. An important methodological issue is that the least-squares fitting approach uses a single linear model thatdoes not take into account changes of Raw and CRS withlung volume, and it also neglects flow turbulence andinertial forces.
Alveolar Pressure
During volume control ventilation, alveolar pressure(Palv) at any time during inspiration is determined by thevolume delivered and CRS: Palv � V/CRS � PEEP. Forpressure control ventilation, Palv at any time after the ini-tiation of inspiration is: Palv � �P � (1 � e�t/�) � PEEP,where �P is the pressure applied to the airway abovePEEP, e is the base of the natural logarithm, t is the elapsedtime after initiation of the inspiratory phase, and � is thetime constant.
Plateau Pressure
Due to Raw, proximal airway pressure will always begreater than Palv during inspiration if flow is present. Palv
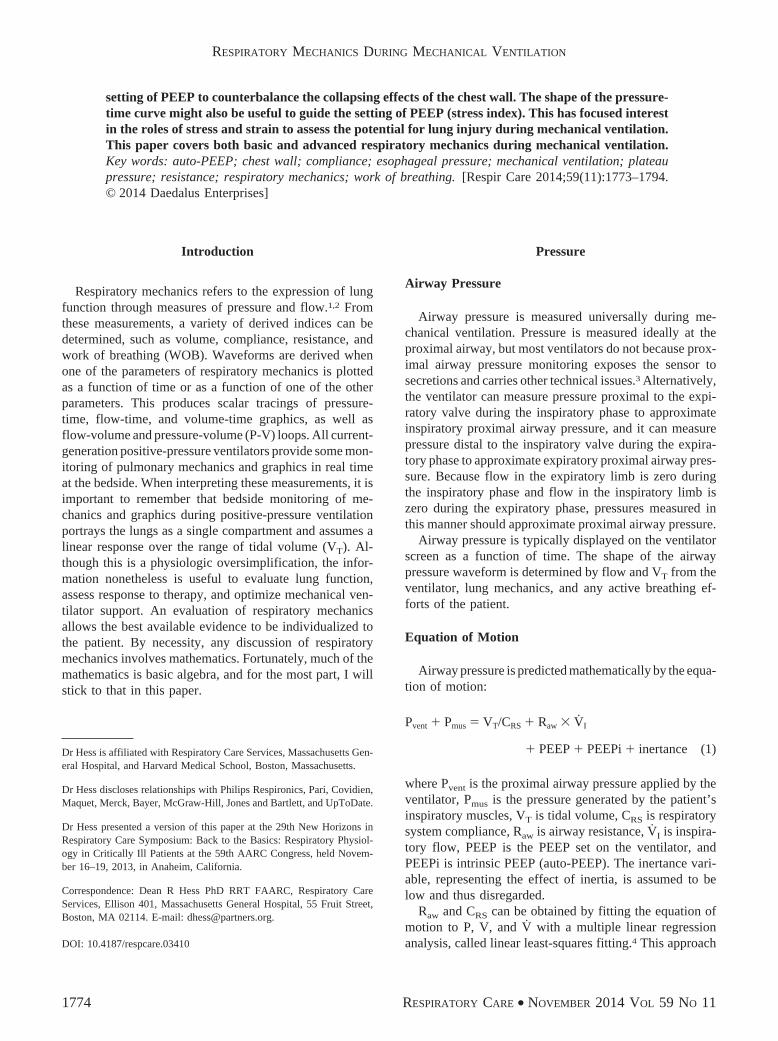
is estimated with an end-inspiratory hold maneuver. Pla-teau pressure (Pplat) is measured during mechanical ven-tilation by applying an end-inspiratory breath-hold for0.5–2 s, during which pressure equilibrates throughout thesystem, so the pressure measured at the proximal airwayapproximates the Palv (Fig. 1).
With rapid airway occlusion at the end of inspiration,flow drops to zero, and the proximal airway pressure im-mediately decreases to a lower level (the pressure at zeroflow [Pz]). Raw and end-inspiratory flow determine thedifference between peak inspiratory pressure (PIP) and Pz.During airway occlusion, pressure further declines to reacha plateau (Pplat). The difference between Pz and Pplat isdetermined by time constant heterogeneity within the lungs(ie, pendelluft) and the viscoelastic behavior of the stressrelaxation of the pulmonary tissues. Measurement of Pplat
is valid only during passive inflation of the lungs, but notduring active breathing. During pressure control ventila-tion, the flow might decrease to zero at the end of theinspiratory phase; if this occurs, PIP and Pplat are equal.
Pplat is determined by VT and CRS during full ventila-tory support: Pplat � VT/CRS. A high Pplat indicates risk ofalveolar over-distention. Pplat should ideally be kept at� 30 cm H2O,5 with some evidence suggesting that Pplat
should be targeted to � 25 cm H2O in patients withARDS.6,7 This assumes that chest-wall compliance (CCW)is normal. A high Pplat may be safe (and necessary) if CCW
is decreased.A method has been described that uses the expiratory
time constant (�E) to provide real-time determinations ofPplat without the need for an end-inspiratory pause maneu-ver.8 Using this approach, �E is estimated from the slope ofthe passive expiratory flow curve between 0.1 and 0.5 s.Pplat is then calculated as:
Pplat ��VT � PIP � �VT � PEEP
VT � ��E � VI(2)
This approach has the advantage of being able to be usedin spontaneous breathing modes such as pressure support,but has the disadvantage of requiring a computerized al-gorithm to make the necessary calculations.
Auto-PEEP
Incomplete emptying of the lungs occurs if the ex-piratory phase is terminated prematurely. The pressure
Fig. 1. Airway pressure and flow waveforms during constantflow volume control ventilation, illustrating the effect of an end-inspiratory breath-hold. With a period of no flow, the pressureequilibrates to the plateau pressure (Pplat). Pplat represents thepeak alveolar pressure. The difference between Pz and Pplat is dueto time constant inhomogeneity within the lungs. The differencebetween the peak inspiratory pressure (PIP) and Pplat is deter-mined by resistance and flow. The difference between Pplat andPEEP is determined by tidal volume and respiratory system com-pliance. Pz � pressure at zero flow.
RESPIRATORY MECHANICS DURING MECHANICAL VENTILATION
RESPIRATORY CARE • NOVEMBER 2014 VOL 59 NO 11 1775
produced by this trapped gas is called auto-PEEP, in-trinsic PEEP, or occult PEEP. Auto-PEEP increases end-expiratory lung volume and thus causes dynamic hyper-inflation.9,10
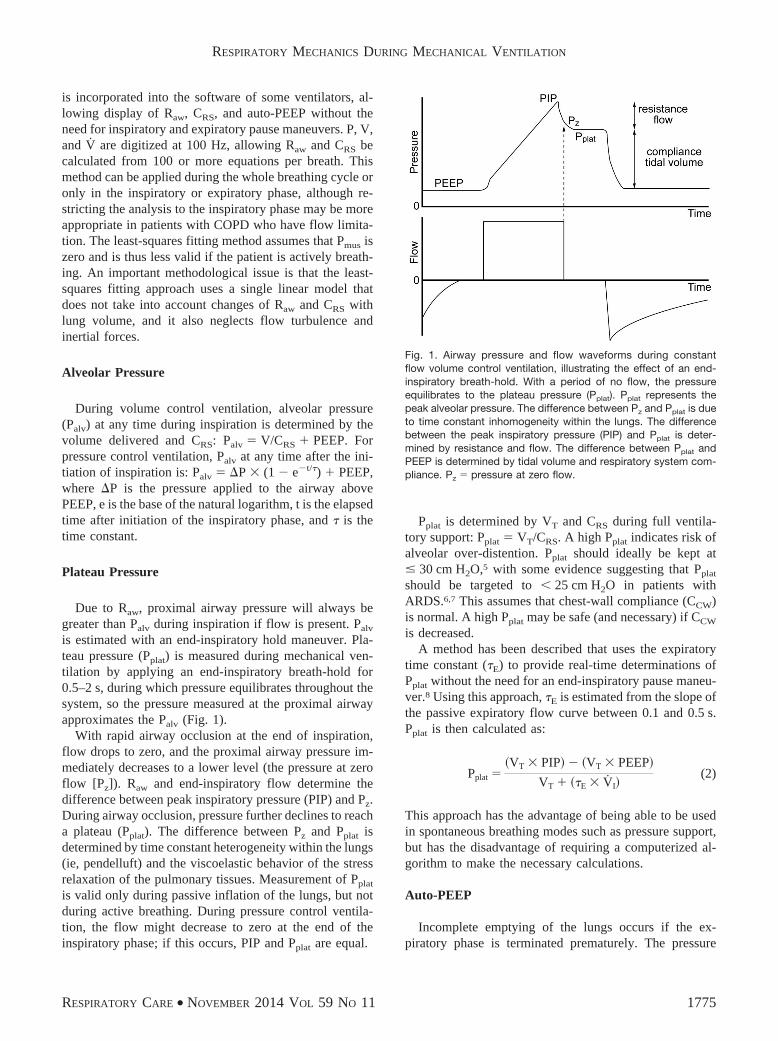
Auto-PEEP is measured by applying an end-expiratorypause for 0.5–2 s (Fig. 2). The pressure measured at theend of this maneuver in excess of the PEEP set on theventilator is defined as auto-PEEP. For a valid measure-ment, the patient must be relaxed and breathing in syn-chrony with the ventilator, as active breathing invalidatesthe measurement. The end-expiratory pause method canunderestimate auto-PEEP when some airways close duringexhalation, as may occur during ventilation of the lungs ofpatients with severe asthma (Fig. 3). In spontaneouslybreathing patients, measurement of esophageal pressure(Pes) can be used to determine auto-PEEP (Fig. 4).
Auto-PEEP is a function of ventilator settings (VT andexpiratory time [TE]) and lung function (Raw and lungcompliance [CL]): auto-PEEP � VT/(CRS � (eKx � TE � 1),where Kx is the inverse of the �E (1/�). Note that auto-PEEP is increased with increased resistance and compli-ance, increased breathing frequency or increased inspira-tory time (TI; both decrease TE), and increased VT.Clinically, auto-PEEP can be decreased by decreasingminute ventilation (rate or VT), increasing TE (decreasingrate or TI), or decreasing Raw (eg, bronchodilatoradministration).
Mean Airway Pressure
Mean airway pressure (P� aw) is determined by PIP, thefraction of time devoted to the inspiratory phase (TI/Ttot,where Ttot is total respiratory cycle time), and PEEP. Forconstant flow-volume ventilation, in which the airway pres-sure waveform is triangular, P� aw can be calculated as:P� aw � 0.5 � (PIP � PEEP) � (TI/Ttot) � PEEP. Duringpressure ventilation, in which the airway pressure wave-form is rectangular, P� aw can be estimated as: P� aw � (PIP� PEEP) � (TI/Ttot) � PEEP. The mean Palv may bedifferent than P� aw if the inspiratory airway resistance (RI)and expiratory airway resistance (RE) are different, whichis often the case in lung disease: mean Palv � P� aw �(VE/60) � (RE � RI), where VE is expiratory flow.
Esophageal Pressure
Pleural pressure (Ppl) cannot be easily measured directly.The traditional approach to assess Ppl is the use of anesophageal balloon,11-18 which consists of a thin catheterwith multiple small holes in the distal 5–7 cm of its length.A 10-cm-long balloon is placed over the distal end of thecatheter to prevent the holes in the catheter from beingoccluded by esophageal tissue and secretions, and the bal-loon is inflated with a small amount of air (0.5 mL). Theproximal end of the catheter is attached to a pressuretransducer.
The catheter is inserted orally or nasally to 35–40 cmfrom the airway opening. Correct positioning of the esoph-ageal balloon is necessary to ensure accurate Pes measure-ments. After the balloon is inflated and the pressure ismeasured, the Pes waveform should be compared to theairway pressure waveform. If they appear similar in pres-sure and shape, the catheter is likely in the trachea andshould be removed. If the catheter is in the esophagus,cardiac oscillations should be visible on the Pes wave-form, indicating that the balloon is positioned in the lowerthird of the esophagus directly behind the heart (Fig. 5).
Fig. 2. Applying an end-expiratory breath-hold allows measure-ment of end-expiratory alveolar pressure. The difference betweenPEEP set and the pressure measured during this maneuver is theamount of auto-PEEP. PIP � peak inspiratory pressure.
Fig. 3. As illustrated here, the measured auto-PEEP can be con-siderably less than the auto-PEEP in some lung regions if airwayscollapse during exhalation.
RESPIRATORY MECHANICS DURING MECHANICAL VENTILATION
1776 RESPIRATORY CARE • NOVEMBER 2014 VOL 59 NO 11
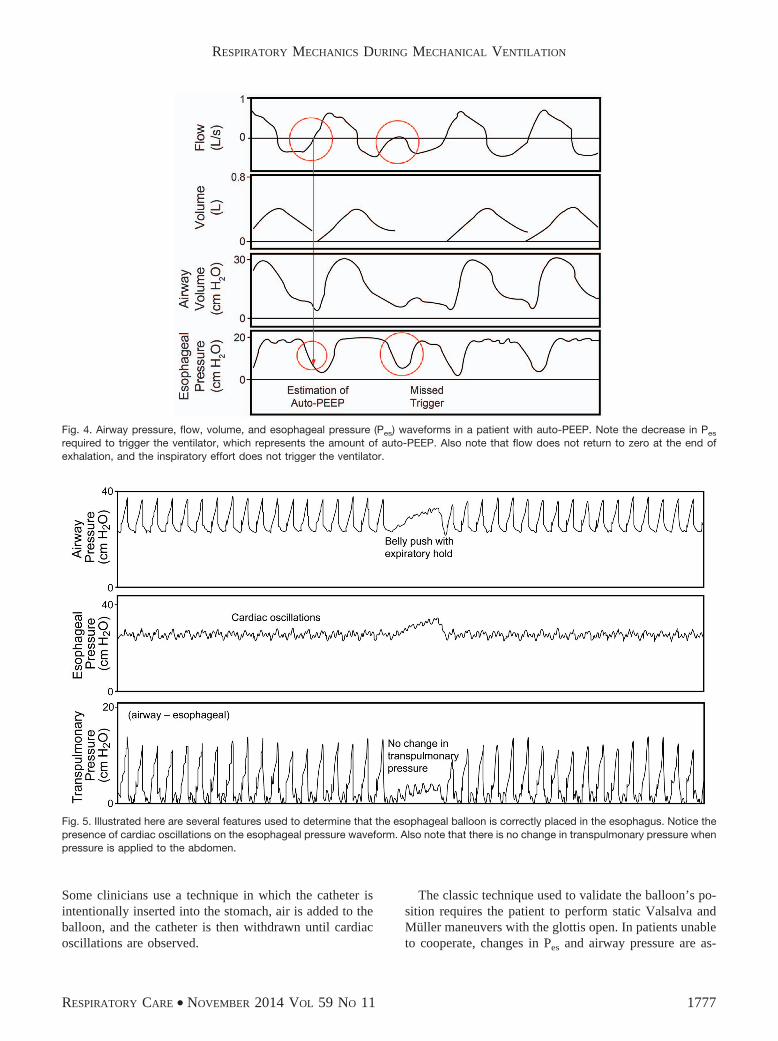
Some clinicians use a technique in which the catheter isintentionally inserted into the stomach, air is added to theballoon, and the catheter is then withdrawn until cardiacoscillations are observed.
The classic technique used to validate the balloon’s po-sition requires the patient to perform static Valsalva andMuller maneuvers with the glottis open. In patients unableto cooperate, changes in Pes and airway pressure are as-
Fig. 4. Airway pressure, flow, volume, and esophageal pressure (Pes) waveforms in a patient with auto-PEEP. Note the decrease in Pes
required to trigger the ventilator, which represents the amount of auto-PEEP. Also note that flow does not return to zero at the end ofexhalation, and the inspiratory effort does not trigger the ventilator.
Fig. 5. Illustrated here are several features used to determine that the esophageal balloon is correctly placed in the esophagus. Notice thepresence of cardiac oscillations on the esophageal pressure waveform. Also note that there is no change in transpulmonary pressure whenpressure is applied to the abdomen.
RESPIRATORY MECHANICS DURING MECHANICAL VENTILATION
RESPIRATORY CARE • NOVEMBER 2014 VOL 59 NO 11 1777
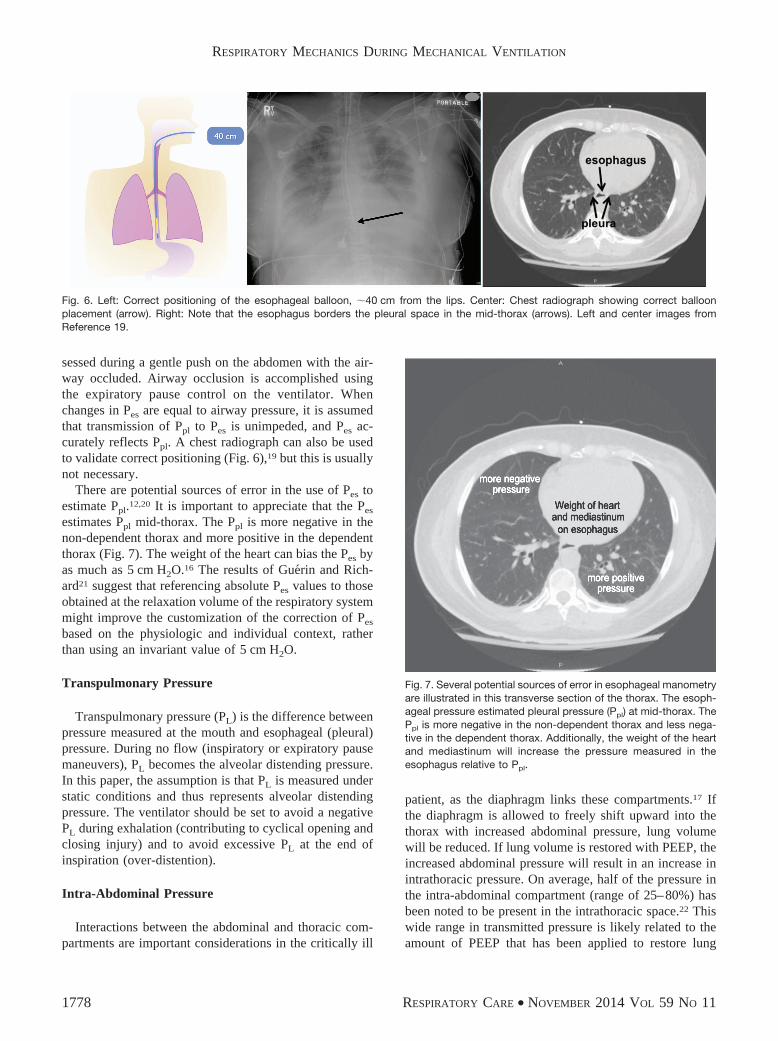
sessed during a gentle push on the abdomen with the air-way occluded. Airway occlusion is accomplished usingthe expiratory pause control on the ventilator. Whenchanges in Pes are equal to airway pressure, it is assumedthat transmission of Ppl to Pes is unimpeded, and Pes ac-curately reflects Ppl. A chest radiograph can also be usedto validate correct positioning (Fig. 6),19 but this is usuallynot necessary.
There are potential sources of error in the use of Pes toestimate Ppl.12,20 It is important to appreciate that the Pes
estimates Ppl mid-thorax. The Ppl is more negative in thenon-dependent thorax and more positive in the dependentthorax (Fig. 7). The weight of the heart can bias the Pes byas much as 5 cm H2O.16 The results of Guerin and Rich-ard21 suggest that referencing absolute Pes values to thoseobtained at the relaxation volume of the respiratory systemmight improve the customization of the correction of Pes
based on the physiologic and individual context, ratherthan using an invariant value of 5 cm H2O.
Transpulmonary Pressure
Transpulmonary pressure (PL) is the difference betweenpressure measured at the mouth and esophageal (pleural)pressure. During no flow (inspiratory or expiratory pausemaneuvers), PL becomes the alveolar distending pressure.In this paper, the assumption is that PL is measured understatic conditions and thus represents alveolar distendingpressure. The ventilator should be set to avoid a negativePL during exhalation (contributing to cyclical opening andclosing injury) and to avoid excessive PL at the end ofinspiration (over-distention).
Intra-Abdominal Pressure
Interactions between the abdominal and thoracic com-partments are important considerations in the critically ill
patient, as the diaphragm links these compartments.17 Ifthe diaphragm is allowed to freely shift upward into thethorax with increased abdominal pressure, lung volumewill be reduced. If lung volume is restored with PEEP, theincreased abdominal pressure will result in an increase inintrathoracic pressure. On average, half of the pressure inthe intra-abdominal compartment (range of 25–80%) hasbeen noted to be present in the intrathoracic space.22 Thiswide range in transmitted pressure is likely related to theamount of PEEP that has been applied to restore lung
Fig. 7. Several potential sources of error in esophageal manometryare illustrated in this transverse section of the thorax. The esoph-ageal pressure estimated pleural pressure (Ppl) at mid-thorax. ThePpl is more negative in the non-dependent thorax and less nega-tive in the dependent thorax. Additionally, the weight of the heartand mediastinum will increase the pressure measured in theesophagus relative to Ppl.
Fig. 6. Left: Correct positioning of the esophageal balloon, 40 cm from the lips. Center: Chest radiograph showing correct balloonplacement (arrow). Right: Note that the esophagus borders the pleural space in the mid-thorax (arrows). Left and center images fromReference 19.
RESPIRATORY MECHANICS DURING MECHANICAL VENTILATION
1778 RESPIRATORY CARE • NOVEMBER 2014 VOL 59 NO 11

volume. Sindi et al23 evaluated the correlation betweenesophageal and abdominal pressures in mechanically ven-tilated subjects undergoing laparoscopic surgery. In thosesubjects without respiratory disease, there was a signifi-cant but limited relationship between esophageal and ab-dominal pressures. They concluded that intra-abdominalpressure cannot predict Pes, but can provide complemen-tary information useful in setting mechanical ventilation.
Intra-abdominal pressure is the steady-state pressurein the abdominal cavity.22 Normal intra-abdominal pressureis 5 mm Hg; it increases during inhalation with diaphrag-matic contraction. Direct measurement of intraperitonealpressure is the accepted standard for determination ofintra-abdominal pressure. This is not practical, however;so the bladder method is thus most commonly used forintermittent intra-abdominal pressure measurement.24 Thebladder is a passive structure, transmitting intra-abdominalpressure after infusion of saline volumes of 50–100 mL.Intra-abdominal pressure should be measured at the end ofexhalation in the supine position, ensuring that abdominalmuscle contractions are absent and that the transducer iszeroed at the mid-axillary line.
In mechanically ventilated patients, an increase in intra-abdominal pressure results in decreased CRS with flatten-ing and a rightward shift of the P-V curve of the respira-tory system.22 These changes are due to decreased CCW,whereas CL remains unchanged. A strong positive corre-lation between intra-abdominal pressure and the lower in-flection point of the P-V curve of the respiratory systemhas also been reported in conditions with increased intra-abdominal pressure, suggesting that intra-abdominal pres-sure might be correlated with the best PEEP in ventilatedpatients with ARDS and intra-abdominal hypertension.22
In deeply sedated patients with ARDS, the diaphragm be-haves as a passive structure, and thus moves upward inthe rib cage, transmits increased intra-abdominal pressure
to the lower lobes of the lung, and causes compressionatelectasis. Surgical abdominal decompression recruitslung volume and increases in PaO2
/FIO2.25 Upright posi-
tioning increases intra-abdominal pressure and decreasesCRS, suggesting that this position might result in a deteri-oration of respiratory function in patients with intra-abdominal hypertension.26
Transdiaphragmatic Pressure
Normally during spontaneous inspiration, Ppl decreasesand intra-abdominal pressure increases. Transdiaphrag-matic pressure (Pdi) represents the pressure across the di-aphragm, the difference between abdominal pressure (Pab)and Ppl: Pdi � Pab � Ppl. Abdominal pressure is measuredfrom a catheter in the stomach (gastric pressure), and Ppl ismeasured as Pes. Sharshar et al27 reported that Pdi-drivenservo ventilation was well synchronized to the subjects’effort, delivering a pressure proportional to Pdi and reduc-ing respiratory effort at normocapnia and hypercapnia. Al-though this approach has physiologic intrigue, it might notbe practical for routine clinical use.
Abdominal paradox is a clinical sign of diaphragm pa-ralysis. In this circumstance, both esophageal and gastricpressures have a negative deflection during inspiration,suggestive of diaphragmatic paralysis (Fig. 8).28
Asynchrony
Patient-ventilator asynchrony results in an airway pres-sure waveform that varies from breath to breath, particu-larly during volume control ventilation (Fig. 9).29 A spe-cial form of patient-ventilator asynchrony can occur duringpressure support ventilation, in which the patient activelyexhales to terminate the inspiratory phase. This is seen as
Fig. 8. Esophageal and gastric pressures. Positive flow represents inhalation, and negative flow represents exhalation. Both esophageal andgastric pressures decrease during inhalation, consistent with diaphragmatic paralysis. From Reference 28, with permission.
RESPIRATORY MECHANICS DURING MECHANICAL VENTILATION
RESPIRATORY CARE • NOVEMBER 2014 VOL 59 NO 11 1779
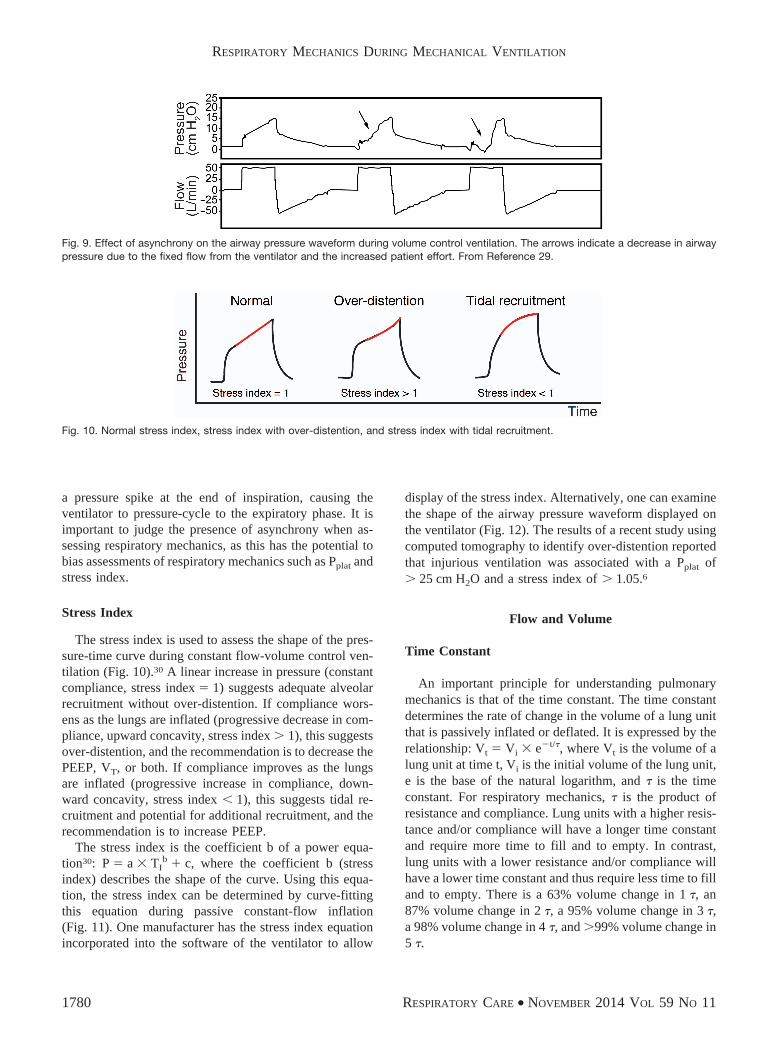
a pressure spike at the end of inspiration, causing theventilator to pressure-cycle to the expiratory phase. It isimportant to judge the presence of asynchrony when as-sessing respiratory mechanics, as this has the potential tobias assessments of respiratory mechanics such as Pplat andstress index.
Stress Index
The stress index is used to assess the shape of the pres-sure-time curve during constant flow-volume control ven-tilation (Fig. 10).30 A linear increase in pressure (constantcompliance, stress index � 1) suggests adequate alveolarrecruitment without over-distention. If compliance wors-ens as the lungs are inflated (progressive decrease in com-pliance, upward concavity, stress index � 1), this suggestsover-distention, and the recommendation is to decrease thePEEP, VT, or both. If compliance improves as the lungsare inflated (progressive increase in compliance, down-ward concavity, stress index � 1), this suggests tidal re-cruitment and potential for additional recruitment, and therecommendation is to increase PEEP.
The stress index is the coefficient b of a power equa-tion30: P � a � TI
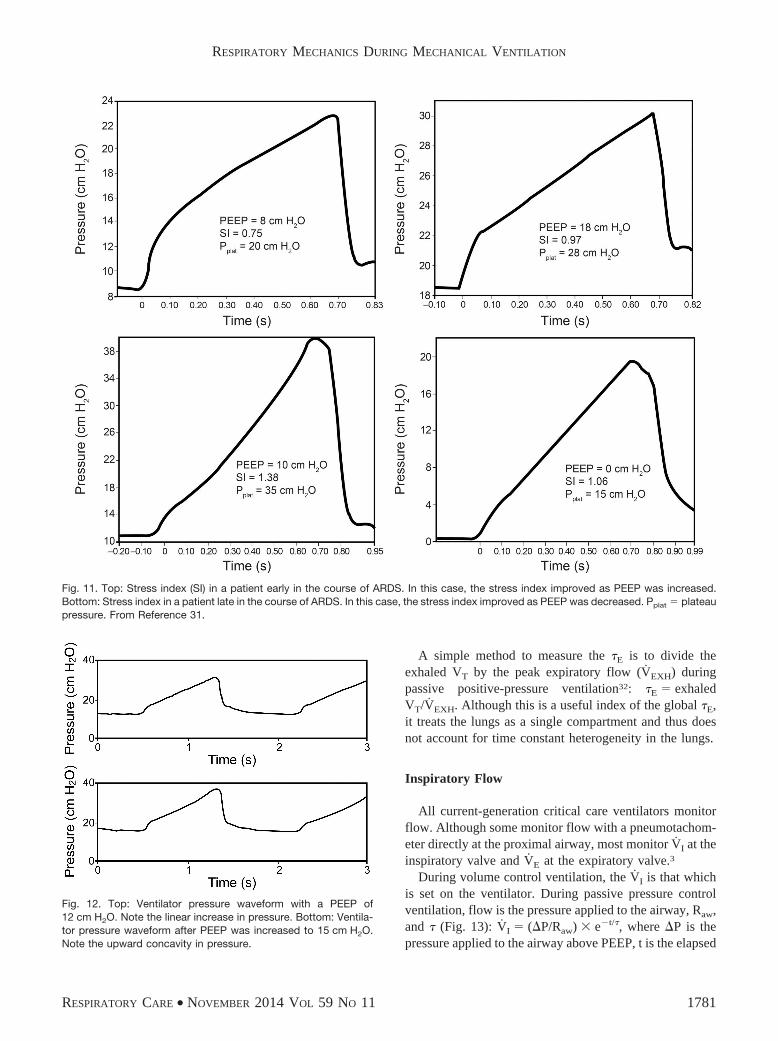
b � c, where the coefficient b (stressindex) describes the shape of the curve. Using this equa-tion, the stress index can be determined by curve-fittingthis equation during passive constant-flow inflation(Fig. 11). One manufacturer has the stress index equationincorporated into the software of the ventilator to allow
display of the stress index. Alternatively, one can examinethe shape of the airway pressure waveform displayed onthe ventilator (Fig. 12). The results of a recent study usingcomputed tomography to identify over-distention reportedthat injurious ventilation was associated with a Pplat of� 25 cm H2O and a stress index of � 1.05.6
Flow and Volume
Time Constant
An important principle for understanding pulmonarymechanics is that of the time constant. The time constantdetermines the rate of change in the volume of a lung unitthat is passively inflated or deflated. It is expressed by therelationship: Vt � Vi � e�t/�, where Vt is the volume of alung unit at time t, Vi is the initial volume of the lung unit,e is the base of the natural logarithm, and � is the timeconstant. For respiratory mechanics, � is the product ofresistance and compliance. Lung units with a higher resis-tance and/or compliance will have a longer time constantand require more time to fill and to empty. In contrast,lung units with a lower resistance and/or compliance willhave a lower time constant and thus require less time to filland to empty. There is a 63% volume change in 1 �, an87% volume change in 2 �, a 95% volume change in 3 �,a 98% volume change in 4 �, and �99% volume change in5 �.
Fig. 9. Effect of asynchrony on the airway pressure waveform during volume control ventilation. The arrows indicate a decrease in airwaypressure due to the fixed flow from the ventilator and the increased patient effort. From Reference 29.
Fig. 10. Normal stress index, stress index with over-distention, and stress index with tidal recruitment.
RESPIRATORY MECHANICS DURING MECHANICAL VENTILATION
1780 RESPIRATORY CARE • NOVEMBER 2014 VOL 59 NO 11
A simple method to measure the �E is to divide theexhaled VT by the peak expiratory flow (VEXH) duringpassive positive-pressure ventilation32: �E � exhaledVT/VEXH. Although this is a useful index of the global �E,it treats the lungs as a single compartment and thus doesnot account for time constant heterogeneity in the lungs.
Inspiratory Flow
All current-generation critical care ventilators monitorflow. Although some monitor flow with a pneumotachom-eter directly at the proximal airway, most monitor VI at theinspiratory valve and VE at the expiratory valve.3
During volume control ventilation, the VI is that whichis set on the ventilator. During passive pressure controlventilation, flow is the pressure applied to the airway, Raw,and � (Fig. 13): VI � (�P/Raw) � e�t/�, where �P is thepressure applied to the airway above PEEP, t is the elapsed
Fig. 11. Top: Stress index (SI) in a patient early in the course of ARDS. In this case, the stress index improved as PEEP was increased.Bottom: Stress index in a patient late in the course of ARDS. In this case, the stress index improved as PEEP was decreased. Pplat � plateaupressure. From Reference 31.
Fig. 12. Top: Ventilator pressure waveform with a PEEP of12 cm H2O. Note the linear increase in pressure. Bottom: Ventila-tor pressure waveform after PEEP was increased to 15 cm H2O.Note the upward concavity in pressure.
RESPIRATORY MECHANICS DURING MECHANICAL VENTILATION
RESPIRATORY CARE • NOVEMBER 2014 VOL 59 NO 11 1781
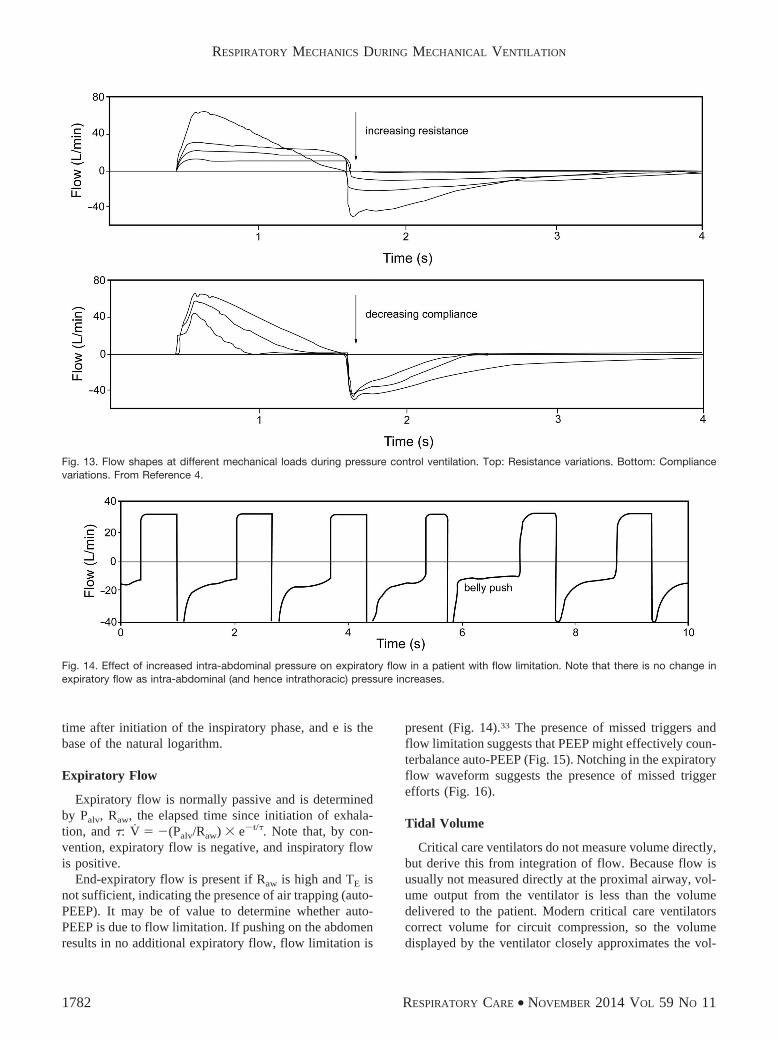
time after initiation of the inspiratory phase, and e is thebase of the natural logarithm.
Expiratory Flow
Expiratory flow is normally passive and is determinedby Palv, Raw, the elapsed time since initiation of exhala-tion, and �: V � �(Palv/Raw) � e�t/�. Note that, by con-vention, expiratory flow is negative, and inspiratory flowis positive.
End-expiratory flow is present if Raw is high and TE isnot sufficient, indicating the presence of air trapping (auto-PEEP). It may be of value to determine whether auto-PEEP is due to flow limitation. If pushing on the abdomenresults in no additional expiratory flow, flow limitation is
present (Fig. 14).33 The presence of missed triggers andflow limitation suggests that PEEP might effectively coun-terbalance auto-PEEP (Fig. 15). Notching in the expiratoryflow waveform suggests the presence of missed triggerefforts (Fig. 16).
Tidal Volume
Critical care ventilators do not measure volume directly,but derive this from integration of flow. Because flow isusually not measured directly at the proximal airway, vol-ume output from the ventilator is less than the volumedelivered to the patient. Modern critical care ventilatorscorrect volume for circuit compression, so the volumedisplayed by the ventilator closely approximates the vol-
Fig. 13. Flow shapes at different mechanical loads during pressure control ventilation. Top: Resistance variations. Bottom: Compliancevariations. From Reference 4.
Fig. 14. Effect of increased intra-abdominal pressure on expiratory flow in a patient with flow limitation. Note that there is no change inexpiratory flow as intra-abdominal (and hence intrathoracic) pressure increases.
RESPIRATORY MECHANICS DURING MECHANICAL VENTILATION
1782 RESPIRATORY CARE • NOVEMBER 2014 VOL 59 NO 11

ume delivered to the patient. The volume waveform maybe useful to detect the presence of a leak (eg, bronchopleuralfistula, leak around the cuff, leak around the mask), whichresults in a difference between the inspiratory and expiratoryVT. Bolzan et al34 reported a method for managing endotra-cheal tube cuff inflation using volume-time graphics.
End-Expiratory Lung Volume
Calculation of end-expiratory lung volume is based ona step change in FIO2
and the assumption that N2 is the bal-ance gas.35,36 Baseline determination is made of end-tidalN2 (FETN2
). It is assumed that oxygen consumption and
carbon dioxide production remain constant throughout themeasurement. A step change in FIO2
then occurs, and theend-expiratory lung volume is calculated as: �VN2
/�FETN2,
where �FETN2is the change following the step change in
FIO2. The breath-to-breath changes are calculated over 20
breaths. The end-expiratory lung volume measurement iscommercially available on the Engstrom Carestation (FRCINview, GE Healthcare, Madison, Wisconsin). For thisapplication, nitrogen concentration in inhaled and exhaledgas is not directly measured, but estimated from the end-tidal concentrations of oxygen and carbon dioxide.
The use of end-expiratory lung volume during PEEPtitration would seem attractive. However, a PEEP-inducedincrease in end-expiratory lung volume might be the resultof recruitment, or it might be the result of over-distentionof already open alveoli. Thus, end-expiratory lung volumeby itself might not be useful to assess PEEP response.
Derived Measurements
Respiratory System Compliance
CRS is calculated as the VT divided by the pressurerequired: CRS � �V/�P � VT/(Pplat � PEEP), where �Vis volume change. Acceptable CRS is 50–100 mL/cm H2Oin mechanically ventilated patients. It is determined by thecompliance of the lungs and chest wall.
Fig. 15. Effect of PEEP, auto-PEEP, and trigger effort in the settingof flow limitation.
Fig. 16. Flow (top) and airway pressure and esophageal pressure (bottom) in a patient with severe COPD. The arrows represent missedtriggers.
RESPIRATORY MECHANICS DURING MECHANICAL VENTILATION
RESPIRATORY CARE • NOVEMBER 2014 VOL 59 NO 11 1783

CRS has been used to determine the optimal level ofPEEP in patients with ARDS; the highest level of CRS
corresponds to best PEEP. In 1975, Suter et al37 re-ported that the PEEP that resulted in the maximumoxygen delivery and the lowest dead-space fraction alsoresulted in the greatest CRS. The optimal PEEP rangedfrom 0 to 15 cm H2O. Mixed venous PO2
increased be-tween 0 PEEP and the PEEP that resulted in maximumoxygen delivery, but then decreased at higher PEEP. Theauthors concluded that CRS could be used to determine theoptimal PEEP.
The optimal PEEP is that which results in the lowestdriving pressure (Pplat � PEEP) if VT is kept constant.Mercat et al38 used an approach in which PEEP was setas high as possible without increasing Pplat above 28–30 cm H2O. Using this approach, higher PEEP is likelyset to best compliance because compliance increaseswith alveolar recruitment. With over-distention, compli-ance decreases, and Pplat is more likely to be � 30 cm H2O.This approach for setting PEEP did not significantly re-duce mortality, but it did improve lung function and re-duced the duration of mechanical ventilation and organfailure.
Pintado et al39 recently reported a randomized controlledstudy to evaluate the effect of setting an individualizedPEEP at the highest CRS. Subjects in the CRS-guided grouphad a nonsignificant improvement in 28-d mortality(21% vs 39%, P � .12), perhaps because the study wasunderpowered. Multiple-organ dysfunction-free days(median of 6 vs 20.5 d, P � .02), respiratory failure-freedays (median of 7.5 vs 14.5 d, P � .03), and hemody-namic failure-free days (median of 16 vs 22 d, P � .04) at28 d were significantly lower in subjects with a CRS-guidedsetting of PEEP.
Chest-Wall Compliance
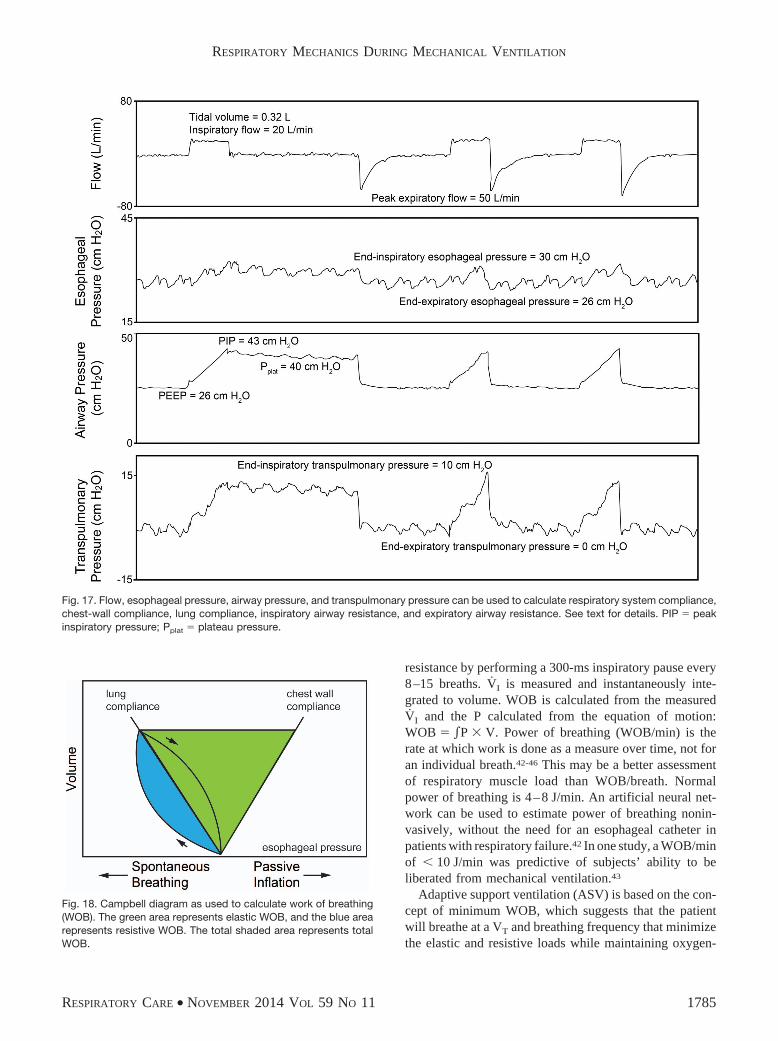
To calculate CCW, changes in Pes (Ppl) are used duringpassive inflation17: CCW � �V/�P � VT/�Pes. The patientdata in Figure 17 can be used to calculate CCW: CCW �320 mL/4 cm H2O � 80 mL/cm H2O. Normal CCW is200 mL/cm H2O and is decreased due to morbid obesity,abdominal compartment syndrome, chest-wall edema,chest-wall burns, and thoracic deformities (eg, kyphosco-liosis). CCW is also decreased with an increase in muscletone (eg, a patient who is asynchronous with the ventila-tor). CCW is increased with flail chest and paralysis.
Lung Compliance
To calculate CL, the change in PL when the lungs areinflated is used: CL � �V/�P � VT/�PL. Normal CL is200 mL/cm H2O. CL is decreased with ARDS, cardiogenicpulmonary edema, pneumothorax, consolidation, atelecta-
sis, pulmonary fibrosis, pneumonectomy, bronchial intu-bation, and over-distention. CL is increased with emphy-sema.
The patient data in Figure 17 can be used to illustratethese calculations:
CRS � 320 mL/�40 cm H2O � 26 cm H2O
� 23 mL/cm H2O (3)
CCW � 320 mL/4 cm H2O � 80 mL/cm H2O (4)
CL � 320 mL/10 cm H2O � 32 mL/cm H2O (5)
These calculations can be crosschecked in the followingmanner: 1/CRS � 1/CCW � 1/CL and 1/23 � 1/80 � 1/32.In this example, CL and CCW are both decreased, but CL isthe most compromised.
Airway Resistance
During volume control ventilation, RI can be estimatedfrom the PIP, Pplat, and end-inspiratory flow: RI � (PIP �Pplat)/VI. RE can be estimated from the VEXH and the dif-ference between Pplat and PEEP40: RE � (Pplat � PEEP)/VEXH. Common causes of increased Raw are bronchos-pasm, secretions, and a small inner diameter endotrachealtube. For intubated and mechanically ventilated patients,RI should be � 10 cm H2O/L/s. RE is typically greaterthan RI.
The patient data in Figure 17 can be used to illustratethese calculations:
RI � �43 cm H2O � 40 cm H2O/0.33 L/s
� 9 cm H2O/L/s (6)
RE � �40 cm H2O � 26 cm H2O/0.83 L/s
� 17 cm H2O/L/s (7)
Work of Breathing
The Campbell diagram (Fig. 18) includes the effects ofCCW, CL, and Raw on WOB.41 Note that WOB is increasedwith decreased CCW, decreased CL, or increased Raw. WOBrequires an esophageal balloon to properly quantify, andfor that reason, it is not frequently measured. It is not clearthat measuring WOB improves patient outcome. NormalWOB is 0.3–0.7 J/L.
The algorithm for proportional assist ventilation of thePuritan-Bennett 840 ventilator estimates compliance and
RESPIRATORY MECHANICS DURING MECHANICAL VENTILATION
1784 RESPIRATORY CARE • NOVEMBER 2014 VOL 59 NO 11
resistance by performing a 300-ms inspiratory pause every8–15 breaths. VI is measured and instantaneously inte-grated to volume. WOB is calculated from the measuredVI and the P calculated from the equation of motion:WOB � P � V. Power of breathing (WOB/min) is therate at which work is done as a measure over time, not foran individual breath.42-46 This may be a better assessmentof respiratory muscle load than WOB/breath. Normalpower of breathing is 4–8 J/min. An artificial neural net-work can be used to estimate power of breathing nonin-vasively, without the need for an esophageal catheter inpatients with respiratory failure.42 In one study, a WOB/minof � 10 J/min was predictive of subjects’ ability to beliberated from mechanical ventilation.43
Adaptive support ventilation (ASV) is based on the con-cept of minimum WOB, which suggests that the patientwill breathe at a VT and breathing frequency that minimizethe elastic and resistive loads while maintaining oxygen-
Fig. 17. Flow, esophageal pressure, airway pressure, and transpulmonary pressure can be used to calculate respiratory system compliance,chest-wall compliance, lung compliance, inspiratory airway resistance, and expiratory airway resistance. See text for details. PIP � peakinspiratory pressure; Pplat � plateau pressure.
Fig. 18. Campbell diagram as used to calculate work of breathing(WOB). The green area represents elastic WOB, and the blue arearepresents resistive WOB. The total shaded area represents totalWOB.
RESPIRATORY MECHANICS DURING MECHANICAL VENTILATION
RESPIRATORY CARE • NOVEMBER 2014 VOL 59 NO 11 1785
ation and acid/base balance.35,47 This uses the approachdescribed by Otis to determine the breathing frequencyassociated with the lowest WOB. Of note, Otis based hisdata on the patient, whereas adaptive support ventilation isbased on the ventilator. The target breathing frequency isdetermined by respiratory mechanics and alveolar venti-lation.
With ASV, the ventilator attempts to deliver 100mL/min/kg of minute ventilation, adjustable from 25% to350%, which allows the clinician to provide full support orencourage spontaneous breathing. VT is determined bydividing the target VE by the target rate. Note that a higherbreathing frequency (and lower VT) will be targeted forlow compliance (low �), whereas a lower breathing fre-quency (and higher VT) will be targeted for a high resis-tance (high �). This is observed clinically, where patientswith pulmonary fibrosis breath rapidly and shallowly. Forpatients with COPD with a high �, the WOB is less witha lower breathing frequency. For ASV, the ventilator alsoadjusts the inspiratory-expiratory ratio and TI of the man-datory breaths by calculation of the �E, as described above,to maintain sufficient TE (3 � �). During spontaneousbreathing, ASV controls only the pressure of pressure sup-port breaths.
Pressure-Volume Curves
P-V curves are displayed with volume as a functionof pressure.36,48 The slope of the P-V curve is CRS. Themost common methods used to measure pressure-volumecurves are the use of a super syringe, inflation with aconstant slow flow (� 10 L/min), and Pplat at various in-flation volumes. Correct interpretation of the P-V curveduring non-constant-flow ventilation (eg, pressure con-trol ventilation) and with higher VI is problematic. Severalcurrent-generation ventilators are able to measure P-Vcurves using a slow inflation technique at several levelsof PEEP to assess alveolar recruitment and inflectionpoints to determine the appropriate level of PEEP.
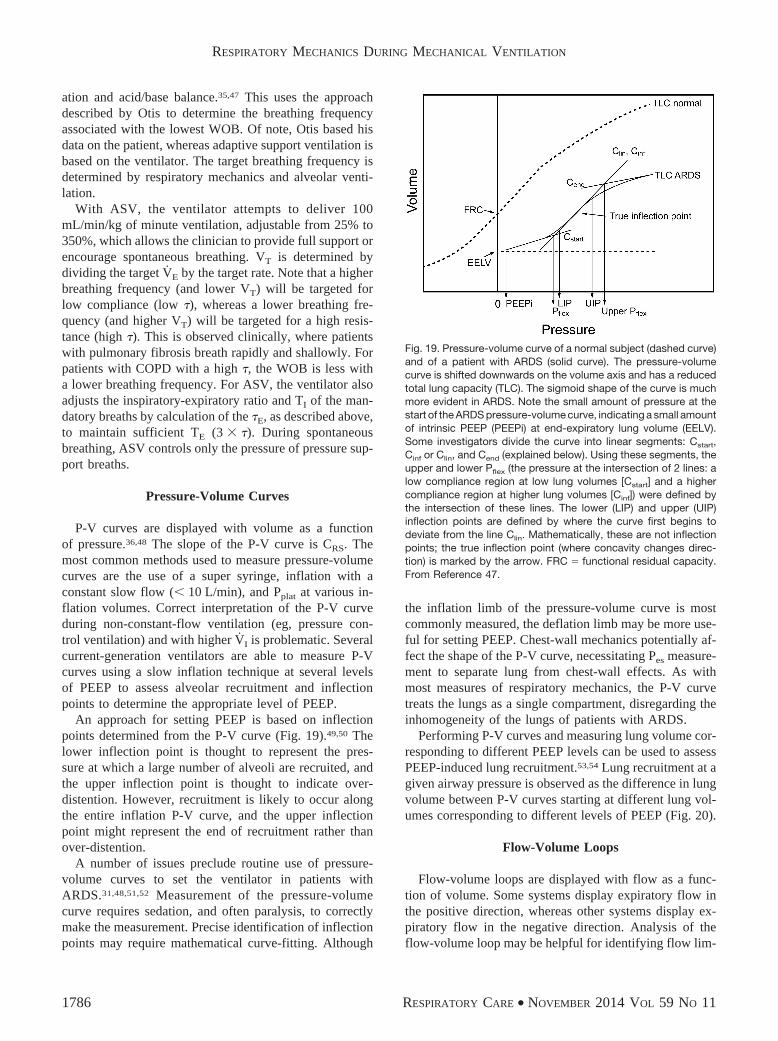
An approach for setting PEEP is based on inflectionpoints determined from the P-V curve (Fig. 19).49,50 Thelower inflection point is thought to represent the pres-sure at which a large number of alveoli are recruited, andthe upper inflection point is thought to indicate over-distention. However, recruitment is likely to occur alongthe entire inflation P-V curve, and the upper inflectionpoint might represent the end of recruitment rather thanover-distention.
A number of issues preclude routine use of pressure-volume curves to set the ventilator in patients withARDS.31,48,51,52 Measurement of the pressure-volumecurve requires sedation, and often paralysis, to correctlymake the measurement. Precise identification of inflectionpoints may require mathematical curve-fitting. Although
the inflation limb of the pressure-volume curve is mostcommonly measured, the deflation limb may be more use-ful for setting PEEP. Chest-wall mechanics potentially af-fect the shape of the P-V curve, necessitating Pes measure-ment to separate lung from chest-wall effects. As withmost measures of respiratory mechanics, the P-V curvetreats the lungs as a single compartment, disregarding theinhomogeneity of the lungs of patients with ARDS.
Performing P-V curves and measuring lung volume cor-responding to different PEEP levels can be used to assessPEEP-induced lung recruitment.53,54 Lung recruitment at agiven airway pressure is observed as the difference in lungvolume between P-V curves starting at different lung vol-umes corresponding to different levels of PEEP (Fig. 20).
Flow-Volume Loops
Flow-volume loops are displayed with flow as a func-tion of volume. Some systems display expiratory flow inthe positive direction, whereas other systems display ex-piratory flow in the negative direction. Analysis of theflow-volume loop may be helpful for identifying flow lim-
Fig. 19. Pressure-volume curve of a normal subject (dashed curve)and of a patient with ARDS (solid curve). The pressure-volumecurve is shifted downwards on the volume axis and has a reducedtotal lung capacity (TLC). The sigmoid shape of the curve is muchmore evident in ARDS. Note the small amount of pressure at thestart of the ARDS pressure-volume curve, indicating a small amountof intrinsic PEEP (PEEPi) at end-expiratory lung volume (EELV).Some investigators divide the curve into linear segments: Cstart,Cinf or Clin, and Cend (explained below). Using these segments, theupper and lower Pflex (the pressure at the intersection of 2 lines: alow compliance region at low lung volumes [Cstart] and a highercompliance region at higher lung volumes [Cinf]) were defined bythe intersection of these lines. The lower (LIP) and upper (UIP)inflection points are defined by where the curve first begins todeviate from the line Clin. Mathematically, these are not inflectionpoints; the true inflection point (where concavity changes direc-tion) is marked by the arrow. FRC � functional residual capacity.From Reference 47.
RESPIRATORY MECHANICS DURING MECHANICAL VENTILATION
1786 RESPIRATORY CARE • NOVEMBER 2014 VOL 59 NO 11

itation during expiration, the presence of secretions in theairway (Fig. 21), and bronchodilator response (Fig. 22).55
The flow-volume curve can provide an indication of ex-cessive secretions more reliably than clinical examination,with the presence of excessive secretions in the airwaysproducing a sawtooth pattern on both the inspiratory andexpiratory flow-volume curves.56
Tension-Time Index and Pressure-Time Product
The tension-time index (TTI) has been used to predictdiaphragmatic fatigue. It is calculated as: TTI � (Pdi/Pdimax
)� (TI/Ttot), where Pdimax
is Pdi with maximum inhalation.57
Pdi/Pdimaxis the contractile force of the diaphragm, and
TI/Ttot is the contraction duration (duty cycle).A tension-time index of � 0.15 predicts respiratory
muscle fatigue. Measurement of the Pdi requires esopha-geal and gastric pressure measurements, which are sel-dom performed in mechanically ventilated patients. Asimpler form of the tension-time index is the pressure-timeindex (PTI),58 which can be determined more readily withequipment available in the ICU. It is calculated as: PTI �(Pbreath/PImax) � (TI/Ttot), where Pbreath is the pressure re-quired to generate a spontaneous breath, and PImax is themaximum pressure that can be generated against an oc-cluded airway. The Pbreath can be determined with esoph-ageal balloon measurements during a short trial of spon-taneous breathing.
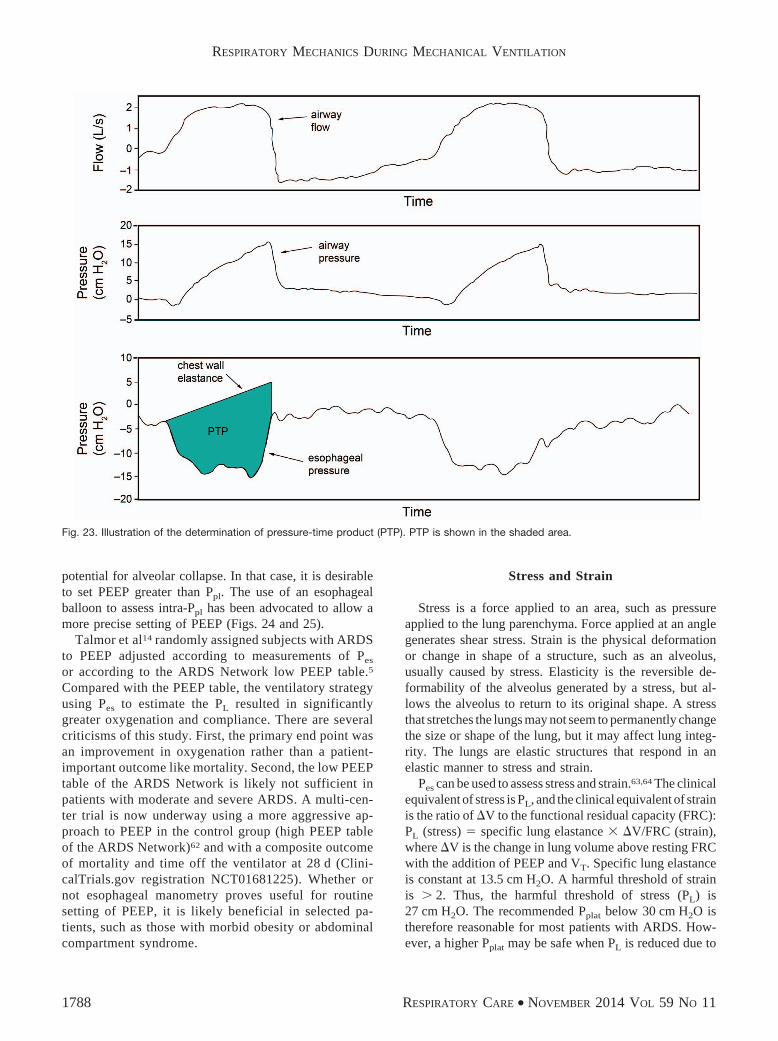
The pressure-time product (PTP) was developed to ac-count for energy expenditures during the dynamic andisometric phases of respiration.59 WOB does not accountfor the isometric phase of respiration because there is novolume change. For example, energy is expended to over-come the threshold load of auto-PEEP, but technically thisis not work because there is no volume moved into thelungs. Thus, different patients might have the same WOB,but the respiratory efficiency (WOB/oxygen consumptionof respiratory muscles) could be quite different. The PTPis measured as the time integral of the difference between
the Pes tracing and the recoil pressure of the chest wall(Fig. 23). The traditional measurement of PTP may fail toaccount for the energy needed for active expiration, whichhas led to the determination of upper bound PTP andlower bound PTP to enable calculations of PTP throughoutthe respiratory cycle so that total energy expenditure canbe approximated.60
Esophageal Pressure for PEEP Titration
Particularly in patients with extrapulmonary ARDS,61
the CCW may be reduced. This can result in an increasein Ppl, and if Ppl is high relative to Palv, there may be
Fig. 20. Pressure-volume (P-V) curve technique to determine re-cruited lung volume with 2 levels of PEEP.
Fig. 21. Sawtooth pattern on flow-volume curve representing se-cretions in the airway.
Fig. 22. Flow-volume curve illustrating response to broncho-dilation in a patient with obstructive lung disease.
RESPIRATORY MECHANICS DURING MECHANICAL VENTILATION
RESPIRATORY CARE • NOVEMBER 2014 VOL 59 NO 11 1787
potential for alveolar collapse. In that case, it is desirableto set PEEP greater than Ppl. The use of an esophagealballoon to assess intra-Ppl has been advocated to allow amore precise setting of PEEP (Figs. 24 and 25).
Talmor et al14 randomly assigned subjects with ARDSto PEEP adjusted according to measurements of Pes
or according to the ARDS Network low PEEP table.5
Compared with the PEEP table, the ventilatory strategyusing Pes to estimate the PL resulted in significantlygreater oxygenation and compliance. There are severalcriticisms of this study. First, the primary end point wasan improvement in oxygenation rather than a patient-important outcome like mortality. Second, the low PEEPtable of the ARDS Network is likely not sufficient inpatients with moderate and severe ARDS. A multi-cen-ter trial is now underway using a more aggressive ap-proach to PEEP in the control group (high PEEP tableof the ARDS Network)62 and with a composite outcomeof mortality and time off the ventilator at 28 d (Clini-calTrials.gov registration NCT01681225). Whether ornot esophageal manometry proves useful for routinesetting of PEEP, it is likely beneficial in selected pa-tients, such as those with morbid obesity or abdominalcompartment syndrome.
Stress and Strain
Stress is a force applied to an area, such as pressureapplied to the lung parenchyma. Force applied at an anglegenerates shear stress. Strain is the physical deformationor change in shape of a structure, such as an alveolus,usually caused by stress. Elasticity is the reversible de-formability of the alveolus generated by a stress, but al-lows the alveolus to return to its original shape. A stressthat stretches the lungs may not seem to permanently changethe size or shape of the lung, but it may affect lung integ-rity. The lungs are elastic structures that respond in anelastic manner to stress and strain.
Pes can be used to assess stress and strain.63,64 The clinicalequivalent of stress is PL, and the clinical equivalent of strainis the ratio of �V to the functional residual capacity (FRC):PL (stress) � specific lung elastance � �V/FRC (strain),where �V is the change in lung volume above resting FRCwith the addition of PEEP and VT. Specific lung elastanceis constant at 13.5 cm H2O. A harmful threshold of strainis � 2. Thus, the harmful threshold of stress (PL) is27 cm H2O. The recommended Pplat below 30 cm H2O istherefore reasonable for most patients with ARDS. How-ever, a higher Pplat may be safe when PL is reduced due to
Fig. 23. Illustration of the determination of pressure-time product (PTP). PTP is shown in the shaded area.
RESPIRATORY MECHANICS DURING MECHANICAL VENTILATION
1788 RESPIRATORY CARE • NOVEMBER 2014 VOL 59 NO 11

Fig. 24. Esophageal pressure, airway pressure, and transpulmonary pressure (PL) with PEEP set at 18 cm H2O. A: During expiratory pause.B: During inspiratory pause. C: As shown in the cartoon, there is a net collapsing pressure on the lungs, heart, and central circulation atthe end of exhalation. At the mid-thoracic level (position of the esophageal balloon), the end-inspiratory PL is slightly positive. Pplat � plateaupressure; PIP � peak inspiratory pressure; Ppl � pleural pressure; BP � blood pressure.
RESPIRATORY MECHANICS DURING MECHANICAL VENTILATION
RESPIRATORY CARE • NOVEMBER 2014 VOL 59 NO 11 1789

Fig. 25. Esophageal pressure, airway pressure, and transpulmonary pressure (PL) with PEEP set at 26 cm H2O (same patient as Fig. 24).A: During expiratory pause. B: During inspiratory pause. C: as shown in the cartoon, the PEEP counterbalancs the Pes (pleural pressure [Ppl]).Note that the same pressure is exerted on the heart and central circulation at the end of exhalation. At the mid-thoracic level (position ofthe esophageal balloon), the end-inspiratory PL is 10 cm H2O, which is likely safe, despite a plateau pressure (Pplat) of 40 cm H2O. Note thatblood pressure (BP) is not affected because there is no increase in Ppl with the addition of PEEP. PIP � peak inspiratory pressure;Ppl � pleural pressure; BP � blood pressure.
RESPIRATORY MECHANICS DURING MECHANICAL VENTILATION
1790 RESPIRATORY CARE • NOVEMBER 2014 VOL 59 NO 11

an increase in Ppl. This makes a case for measurement ofPes in a patient with a stiff chest wall.
It is also possible to measure strain and then calculatestress if the end-expiratory lung volume is measured asFRC. However, strain is the lung volume above restingFRC without PEEP. Thus, end-expiratory lung volume ismeasured without PEEP to determine strain, which mightnot be safe, particularly in patients with severe ARDS.
Thisconcept is illustrated inFigure25.WhenthePEEPissetat 26 cm H2O, the end-inspiratory PL (stress) is 10 cm H2O,and strain is 0.74. In this case, stress at 10 cm H2O and strainat 0.74 are both safe, despite a Pplat of 40 cm H2O.
Stress will be concentrated in the setting of inhomoge-neity within the lungs where regions of collapse borderregions of ventilation. This is called a stress raiser64 andwas first described many years ago by Mead et al.65 Theyconsidered 2 adjacent lung regions fully expanded at a PL
of 30 cm H2O. If one of the 2 regions loses elasticity (ie,consolidation or collapse), the applied force concentratesin the other, thereby increasing its strain and stress. Meadet al65 calculated that, if the volume ratio of the 2 regionsgoes from 10/10 (both regions distended) to 10/1 (oneregion distended and the other collapsed/consolidated), thestress of the open regions increases from 30 to 130 cm H2O.The mathematical basis of this computation relies on thefact that the stress is a force/area ratio. A volume ratio of10/1 should be transformed into a ratio of areas. As areais volume to a power of 0.66, a volume ratio of 10/1 isequal to an area ratio of (10/1)0.66, which is 4.57. There-fore, the initial force applied to the 2 lung regions shouldbe multiplied almost 5-fold, thus increasing the stress ofthe open unit to 30 � 4.57 cm H2O � 137 cm H2O. Thebasic concept is that in an inhomogeneous lung, which isusually the case in mechanically ventilated patients, thepresence of these areas of stress raisers might create dan-gerous regional PL despite an acceptable Pplat and PL. Thiseffect can be minimized clinically by using the lowest Pplat
possible for an individual patient.
Spontaneous Breathing and Pressure-TargetedVentilation
Many years ago, Dreyfuss and Saumon66 conductedsome interesting studies related to ventilator-induced lunginjury. They subjected rats to low or high VT ventilation,using identical airway pressure (45 cm H2O) in both groups.Low VT with high airway pressure was produced by thora-coabdominal strapping during positive airway pressure ven-tilation. The rats subjected to high VT and high airway pres-sure ventilation quickly developed ventilator-induced lunginjury. However, the animals that underwent thoracoabdomi-nal strapping and were ventilated with high airway pressurebut a normal VT did not develop ventilator-induced lunginjury. The lungs of the animals with decreased CCW were
presumably subjected to less stress. Another group of ratsreceived negative-pressure ventilation with high VT, and theseanimals developed ventilator-induced lung injury.
More recently, Yoshida et al67 evaluated spontaneousbreathing and muscle paralysis in 2 different severities ofexperimental lung injury. They found that in rabbits withmild lung injury, spontaneous breathing was beneficial tolung recruitment. However, in animals with severe lung in-jury, spontaneous breathing worsened lung injury, suggestingthat muscle paralysis might be more protective for injuredlungs by preventing injuriously high PL. In another experi-mental study, Yoshida et al68 found that spontaneous breath-ing caused pendelluft during early inflation, which was as-sociatedwithmorenegative localPpl independent lungregionsversus non-dependent regions. This occurred despite limita-tion of VT to � 6 mL/kg. Comparable inflation of dependentlung during paralysis required almost 3-fold greater drivingpressure (and VT) versus spontaneous breathing. These datasuggest that spontaneous breathing might be harmful in thesetting of moderate-to-severe lung injury. Indeed, several casereports have described barotrauma in spontaneously breath-
Fig. 26. Cartoon illustrating how a strong inspiratory effort canresult in a high transpulmonary pressure (PL). Paw � airway pres-sure; PS � pressure support; PR � pressure drop due to airwayresistance; Palv � alveolar pressure; Patm � atmospheric pressure;Ppl � pleural pressure.
RESPIRATORY MECHANICS DURING MECHANICAL VENTILATION
RESPIRATORY CARE • NOVEMBER 2014 VOL 59 NO 11 1791

ing patients receiving pressure support ventilation or airwaypressure release ventilation.69,70
The potential benefits of pressure-targeted modes are bet-ter enhanced patient-ventilator interaction, the possibility ofless sedation, improved ability to participate in care such asmobilization and ambulation, and better ventilation of dorsallung units with subsequently improved alveolar recruitmentand arterial oxygenation. However, these possible benefitsmust be weighed against the potential for alveolar over-dis-tention with spontaneous breathing efforts. Imagine a patientwho is being ventilated with a pressure-targeted mode suchas pressure control, pressure support, or airway pressure re-lease ventilation. The ventilator will provide flow to maintainconstant airway pressure, and the spontaneous breathing ef-forts of the patient will lower the Ppl, thus increasing PL. Asillustrated in Figures 26 and 27, a potentially injurious PL canoccur using an airway pressure that might otherwise be con-sidered safe.
Respiratory variation in central venous pressure, whichis commonly available in mechanically ventilated patients,can provide information about Ppl changes during the re-spiratory cycle. Large negative-pressure swings in centralvenous pressure during spontaneous breathing suggest ahigh PL. Perhaps most important, and easiest to monitorat the bedside, is the VT that results from the patient’sinspiratory effort. If the VT is not excessive, in most cases,the PL will be acceptable. However, due to the inhomo-geneity of the disease process, a high PL might result inregional over-distention despite an acceptable VT. Regard-less of the ventilator mode, in critically ill patients, the VT
target should be 6 mL/kg of ideal body weight.
Pleural Pressure and Hemodynamics DuringMechanical Ventilation
A common clinical question relates to the effect ofpositive-pressure ventilation on Ppl. Ppl is independent of
Fig. 27. Airway pressure, esophageal pressure, and transpulmonary pressure (PL) for a patient on pressure support ventilation (PSV). Notethe high PL due to the patient’s strong inspiratory effort.
RESPIRATORY MECHANICS DURING MECHANICAL VENTILATION
1792 RESPIRATORY CARE • NOVEMBER 2014 VOL 59 NO 11
CL17: Ppl � lung volume/CCW. Thus, it is not correct to
refer to the amount of pressure transmitted to the pleuralspace because Ppl is determined by lung volume (VT
and PEEP) and CCW. Ppl as a fraction of Palv is deter-mined by the relationship: �Ppl/�Palv � CL/(CL � CCW),or �Ppl/�Palv � CRS/CCW. Under normal conditions,where CL and CCW are equal, �Ppl will be half of �Palv.When CCW is reduced relative to CL, �Ppl will be a greaterfraction of �Palv. On the other hand, when CL is reducedrelative to CCW, �Ppl will be a lower fraction of �Palv.
Ppl affects hemodynamics due to its effect on the heart andcentral circulation. When Ppl is increased due to a decreasedCCW, use of PEEP that counterbalances the collapsing effectof the chest wall should not compromise hemodynamics untilthe PEEP exceeds the Ppl due to chest-wall effects. Sargeet al71 reported that in subjects with ARDS, individualizingPEEP to optimize PL using esophageal manometry does notcompromise hemodynamic function.
Summary
A variety of respiratory mechanics can be assessed inmechanically ventilated patients. This can be useful as aprobe of the underlying pathophysiology. Assessment ofrespiratory mechanics can also be used to set the ventilatorto minimize lung injury.
REFERENCES
1. Hess DR, Medoff BD, Fessler MB. Pulmonary mechanics and graph-ics during positive pressure ventilation. Int Anesthesiol Clin 1999;37(3):15-34.
2. Lucangelo U, Bernabe F, Blanch L. Lung mechanics at the bedside:make it simple. Curr Opin Crit Care 2007;13(1):64-72.
3. Sanborn WG. Monitoring respiratory mechanics during mechanicalventilation: where do the signals come from? Respir Care 2005;50(1):28-52; discussion 52-54.
4. Lucangelo U, Bernabe F, Blanch L. Respiratory mechanics derivedfrom signals in the ventilator circuit. Respir Care 2005;50(1):55-65;discussion 65-57.
5. Ventilation with lower tidal volumes as compared with traditionaltidal volumes for acute lung injury and the acute respiratory distresssyndrome. The Acute Respiratory Distress Syndrome Network.N Engl J Med 2000;342(18):1301-1308.
6. Terragni PP, Filippini C, Slutsky AS, Birocco A, Tenaglia T, GrassoS, et al. Accuracy of plateau pressure and stress index to identifyinjurious ventilation in patients with acute respiratory distress syn-drome. Anesthesiology 2013;119(4):880-889.
7. Terragni PP, Rosboch G, Tealdi A, Corno E, Menaldo E, Davini O,et al. Tidal hyperinflation during low tidal volume ventilation inacute respiratory distress syndrome. Am J Respir Crit Care Med2007;175(2):160-166.
8. Al-Rawas N, Banner MJ, Euliano NR, Tams CG, Brown J, MartinAD, Gabrielli A. Expiratory time constant for determinations ofplateau pressure, respiratory system compliance, and total resistance.Crit Care 2013;17(1):R23.
9. Marini JJ. Dynamic hyperinflation and auto-positive end-expiratorypressure: lessons learned over 30 years. Am J Respir Crit Care Med2011;184(7):756-762.
10. Blanch L, Bernabe F, Lucangelo U. Measurement of air trapping,intrinsic positive end-expiratory pressure, and dynamic hyperinfla-
tion in mechanically ventilated patients. Respir Care 2005;50(1):110-123; discussion 123-124.
11. Benditt JO. Esophageal and gastric pressure measurements. RespirCare 2005;50(1):68-75; discussion 75-77.
12. Talmor DS, Fessler HE. Are esophageal pressure measurements im-portant in clinical decision-making in mechanically ventilated pa-tients? Respir Care 2010;55(2):162-172; discussion 172-174.
13. Talmor D, Sarge T, O’Donnell CR, Ritz R, Malhotra A, Lisbon A,Loring SH. Esophageal and transpulmonary pressures in acute re-spiratory failure. Crit Care Med 2006;34(5):1389-1394.
14. Talmor D, Sarge T, Malhotra A, O’Donnell CR, Ritz R, Lisbon A,et al. Mechanical ventilation guided by esophageal pressure in acutelung injury. N Engl J Med 2008;359(20):2095-2104.
15. Sarge T, Talmor D. Targeting transpulmonary pressure to prevent ven-tilator induced lung injury. Minerva Anestesiol 2009;75(5):293-299.
16. Loring SH, O’Donnell CR, Behazin N, Malhotra A, Sarge T, Ritz R,et al. Esophageal pressures in acute lung injury: do they representartifact or useful information about transpulmonary pressure, chestwall mechanics, and lung stress? J Appl Physiol 2010;108(3):515-522.
17. Hess DR, Bigatello LM. The chest wall in acute lung injury/acute re-spiratory distress syndrome. Curr Opin Crit Care 2008;14(1):94-102.
18. Akoumianaki E, Maggiore SM, Valenza F, Bellani G, Jubran A,Loring SH, et al. The application of esophageal pressure measure-ment in patients with respiratory failure. Am J Respir Crit Care Med2014;189(5):520-531.
19. Piraino T, Cook DJ. Optimal PEEP guided by esophageal balloonmanometry. Respir Care 2011;56(4):510-513.
20. Hager DN, Brower RG. Customizing lung-protective mechanicalventilation strategies. Crit Care Med 2006;34(5):1554-1555.
21. Guerin C, Richard JC. Comparison of 2 correction methods for ab-solute values of esophageal pressure in subjects with acute hypox-emic respiratory failure, mechanically ventilated in the ICU. RespirCare 2012;57(12):2045-2051.
22. Malbrain ML, Deeren D, De Potter TJ. Intra-abdominal hypertensionin the critically ill: it is time to pay attention. Curr Opin Crit Care2005;11(2):156-171.
23. Sindi A, Piraino T, Alhazzani W, Tunks M, Faden M, Ma J, et al.The correlation between esophageal and abdominal pressures inmechanically ventilated patients undergoing laparoscopic surgery.Respir Care 2014;59(4):491-496.
24. Malbrain ML. Different techniques to measure intra-abdominal pres-sure (IAP): time for a critical re-appraisal. Intensive Care Med 2004;30(3):357-371.
25. Ranieri VM, Brienza N, Santostasi S, Puntillo F, Mascia L, Vitale N,et al. Impairment of lung and chest wall mechanics in patients withacute respiratory distress syndrome: role of abdominal distension.Am J Respir Crit Care Med 1997;156(4 Pt 1):1082-1091.
26. Cheatham ML, De Waele JJ, De Laet I, De Keulenaer B, Widder S,Kirkpatrick AW, et al. The impact of body position on intra-abdominal pressure measurement: A multicenter analysis. Crit CareMed 2009;37(7):2187-2190.
27. Sharshar T, Desmarais G, Louis B, Macadou G, Porcher R, Harf A, etal. Transdiaphragmatic pressure control of airway pressure support inhealthy subjects. Am J Respir Crit Care Med 2003;168(7):760-769.
28. Lecamwasam HS, Hess D, Brown R, Kwolek CJ, Bigatello LM. Dia-phragmatic paralysis after endovascular stent grafting of a thoraco-abdominal aortic aneurysm. Anesthesiology 2005;102(3):690-692.
29. Nilsestuen JO, Hargett KD. Using ventilator graphics to identifypatient-ventilator asynchrony. Respir Care 2005;50(2):202-234; dis-cussion 232-234.
30. Grasso S, Stripoli T, De Michele M, Bruno F, Moschetta M, AngelelliG, et al. ARDSnet ventilatory protocol and alveolar hyperinflation:role of positive end-expiratory pressure. Am J Respir Crit Care Med2007;176(8):761-767.
RESPIRATORY MECHANICS DURING MECHANICAL VENTILATION
RESPIRATORY CARE • NOVEMBER 2014 VOL 59 NO 11 1793
31. Hess DR. Approaches to conventional mechanical ventilation of thepatient with acute respiratory distress syndrome. Respir Care 2011;56(10):1555-1572.
32. Brunner JX, Laubscher TP, Banner MJ, Iotti G, Braschi A. Simplemethod to measure total expiratory time constant based on the passiveexpiratory flow-volume curve. Crit Care Med 1995;23(6):1117-1122.
33. Ninane V, Leduc D, Kafi SA, Nasser M, Houa M, Sergysels R. Detec-tion of expiratory flow limitation by manual compression of the abdom-inal wall. Am J Respir Crit Care Med 2001;163(6):1326-1330.
34. BolzanDW,GomesWJ,FaresinSM,deCamargoCarvalhoAC,DePaolaAA, Guizilini S. Volume-time curve: an alternative for endotrachealtube cuff management. Respir Care 2012;57(12):2039-2044.
35. Branson RD, Johannigman JA. Innovations in mechanical ventila-tion. Respir Care 2009;54(7):933-947.
36. Owens RL, Stigler WS, Hess DR. Do newer monitors of exhaledgases, mechanics, and esophageal pressure add value? Clin ChestMed 2008;29(2):297-312, vi-vii.
37. Suter PM, Fairley B, Isenberg MD. Optimum end-expiratory airwaypressure in patients with acute pulmonary failure. N Engl J Med1975;292(6):284-289.
38. Mercat A, Richard JC, Vielle B, Jaber S, Osman D, Diehl JL, et al.Positive end-expiratory pressure setting in adults with acute lunginjury and acute respiratory distress syndrome: a randomized con-trolled trial. JAMA 2008;299(6):646-655.
39. Pintado MC, de Pablo R, Trascasa M, Milicua JM, Rogero S, DaguerreM, et al. Individualized PEEP setting in subjects with ARDS: a ran-domized controlled pilot study. Respir Care 2013;58(9):1416-1423.
40. Hess D, Tabor T. Comparison of six methods to calculate airwayresistance during mechanical ventilation in adults. J Clin Monit 1993;9(4):275-282.
41. Banner MJ, Jaeger MJ, Kirby RR. Components of the work of breath-ing and implications for monitoring ventilator-dependent patients.Crit Care Med 1994;22(3):515-523.
42. Banner MJ, Euliano NR, Brennan V, Peters C, Layon AJ, GabrielliA. Power of breathing determined noninvasively with use of anartificial neural network in patients with respiratory failure. Crit CareMed 2006;34(4):1052-1059.
43. Banner MJ, Euliano NR, Martin AD, Al-Rawas N, Layon AJ,Gabrielli A. Noninvasive work of breathing improves prediction ofpost-extubation outcome. Intensive Care Med 2012;38(2):248-255.
44. Bonett S, Banner MJ, Euliano NR, Peters CW, Layon AJ, GabrielliA. Pressure support ventilation advisory system provides valid recom-mendations for setting ventilator. Respir Care 2011;56(3):271-277.
45. Idris AH, Convertino VA, Ratliff DA, Doerr DF, Lurie KG, GabrielliA, Banner MJ. Imposed power of breathing associated with use of animpedance threshold device. Respir Care 2007;52(2):177-183.
46. Ozcan MS, Bonett SW, Martin AD, Gabrielli A, Layon AJ, Banner MJ.Abnormally increased power of breathing as a complication of closedendotracheal suction catheter systems. Respir Care 2006;51(4):423-425.
47. Branson RD. Modes to facilitate ventilator weaning. Respir Care2012;57(10):1635-1648.
48. Harris RS. Pressure-volume curves of the respiratory system. RespirCare 2005;50(1):78-98; discussion 98-99.
49. Villar J, Kacmarek RM, Perez-Mendez L, Aguirre-Jaime A. A highpositive end-expiratory pressure, low tidal volume ventilatory strategyimproves outcome in persistent acute respiratory distress syndrome: arandomized, controlled trial. Crit Care Med 2006;34(5):1311-1318.
50. Amato MB, Barbas CS, Medeiros DM, Magaldi RB, Schettino GP,Lorenzi-Filho G, et al. Effect of a protective-ventilation strategy onmortality in the acute respiratory distress syndrome. N Engl J Med1998;338(6):347-354.
51. Owens RL, Hess DR, Malhotra A, Venegas JG, Harris RS. Effect ofthe chest wall on pressure-volume curve analysis of acute respiratorydistress syndrome lungs. Crit Care Med 2008;36(11):2980-2985.
52. Harris RS, Hess DR, Venegas JG. An objective analysis of thepressure-volume curve in the acute respiratory distress syndrome.Am J Respir Crit Care Med 2000;161(2 Pt 1):432-439.
53. Blanch L, Lopez-Aguilar J, Villagra A. Bedside evaluation ofpressure-volume curves in patients with acute respiratory distresssyndrome. Curr Opin Crit Care 2007;13(3):332-337.
54. Albaiceta GM, Blanch L, Lucangelo U. Static pressure-volumecurves of the respiratory system: were they just a passing fad? CurrOpin Crit Care 2008;14(1):80-86.
55. Dhand R. Ventilator graphics and respiratory mechanics in the pa-tient with obstructive lung disease. Respir Care 2005;50(2):246-261;discussion 259-261.
56. Jubran A, Tobin MJ. Use of flow-volume curves in detecting secre-tions in ventilator-dependent patients. Am J Respir Crit Care Med1994;150(3):766-769.
57. Stoller JK. Physiologic rationale for resting the ventilatory muscles.Respir Care 1991;36(4):290-296.
58. Jabour ER, Rabil DM, Truwit JD, Rochester DF. Evaluation of a newweaning index based on ventilatory endurance and the efficiency of gasexchange. Am Rev Respir Dis 1991;144(3 Pt 1):531-537.
59. Grinnan DC, Truwit JD. Clinical review: respiratory mechanics inspontaneous and assisted ventilation. Crit Care 2005;9(5):472-484.
60. Jubran A, Van de Graaff WB, Tobin MJ. Variability of patient-ventilator interaction with pressure support ventilation in patientswith chronic obstructive pulmonary disease. Am J Respir Crit CareMed 1995;152(1):129-136.
61. Gattinoni L, Pelosi P, Suter PM, Pedoto A, Vercesi P, Lissoni A.Acute respiratory distress syndrome caused by pulmonary and ex-trapulmonary disease. Different syndromes? Am J Respir Crit CareMed 1998;158(1):3-11.
62. Brower RG, Lanken PN, MacIntyre N, Matthay MA, Morris A,Ancukiewicz M, et al. Higher versus lower positive end-expiratorypressures in patients with the acute respiratory distress syndrome.N Engl J Med 2004;351(4):327-336.
63. Chiumello D, Carlesso E, Cadringher P, Caironi P, Valenza F, PolliF, et al. Lung stress and strain during mechanical ventilation foracute respiratory distress syndrome. Am J Respir Crit Care Med2008;178(4):346-355.
64. Gattinoni L, Carlesso E, Caironi P. Stress and strain within the lung.Curr Opin Crit Care 2012;18(1):42-47.
65. Mead J, Takishima T, Leith D. Stress distribution in lungs: a modelof pulmonary elasticity. J Appl Physiol 1970;28(5):596-608.
66. Dreyfuss D, Saumon G. Ventilator-induced lung injury: lessons fromexperimental studies. Am J Respir Crit Care Med 1998;157(1):294-323.
67. Yoshida T, Uchiyama A, Matsuura N, Mashimo T, Fujino Y. Thecomparison of spontaneous breathing and muscle paralysis in two dif-ferent severities of experimental lung injury. Crit Care Med 2013;41(2):536-545.
68. Yoshida T, Torsani V, Gomes S, De Santis RR, Beraldo MA, Costa EL,et al. Spontaneous effort causes occult pendelluft during mechanicalventilation. Am J Respir Crit Care Med 2013;188(12):1420-1427.
69. Leray V, Bourdin G, Flandreau G, Bayle F, Wallet F, Richard JC,Guerin C. A case of pneumomediastinum in a patient with acuterespiratory distress syndrome on pressure support ventilation. RespirCare 2010;55(6):770-773.
70. Sasidhar M, Chatburn RL. Tidal volume variability during airwaypressure release ventilation: case summary and theoretical analysis.Respir Care 2012;57(8):1325-1333.
71. Sarge T, Loring SH, Yitsak-Sade M, Malhotra A, Novack V, TalmorD. Raising positive end-expiratory pressures in ARDS to achieve apositive transpulmonary pressure does not cause hemodynamic com-promise. Intensive Care Med 2014;40(1):126-128.
RESPIRATORY MECHANICS DURING MECHANICAL VENTILATION
1794 RESPIRATORY CARE • NOVEMBER 2014 VOL 59 NO 11