ResourceThe Bull & Bear's URANIUM SILVER … aggregate from Lens A, and quarry towards Lens B...
22
GOLD SILVER URANIUM PLATINUM PALLADIUM OIL & GAS BASE METALS May/June 2015 Investor Investor Bull & Bear's The Resource Resource INSIDE... El Nino Has Set In, Crops Most at Risk Asia braces for crop damage as an El Nino has formed. Most at risk: Wheat, Rice, Soybeans, Palm Oil and Corn. El Nino will deliver drought-busting rains to Texas and California. ...Page 3 Natixis Metals Review Natixis Commodity Research analysts give their outlook and price forecasts for Base Metals, Gold, Silver, and PGMs for 2015 and 2016. …Page 6 Cameco: Better Times Ahead While results fell short of the “Streets” expectations for Cameco. Looking ahead, Vivian Lewis expects this pro- ducer of 16% of the uranium used worldwide to become a boom rather than a bomb stock this year. …Page 12 Profiled Companies: Atna Resources Ltd. Fairmont Resources Torex Gold Resources Puma Exploration Investment Newsletter Digest Advice from the world’s top- performing resource sector investment experts. Top Stock Picks of the Month. Buy/Sell advice on Energy Stocks, Ag Sector, Gold & Silver Stocks, Precious Metals Trends and Trading Strategies. ...Page 10 By George Putnam, III The Turnaround Letter We were at best early – and perhaps wrong – when we high- lighted the mining sector two years ago. The good news is that we recommended sticking to the large, well-capitalized companies in the sector. As a result, while the stocks we highlighted then have not performed well in the interim, they have not been crushed like many of the more leveraged names in the sector, some of which are down 80% or more. What we did not anticipate two years ago was the rapid decline in Chinese demand for coal and other commodities and metals. This pushed the prices for many commodities down sharply, and the profits and stock prices of the commodity producers followed. We do not claim to have any expertise in forecasting Chinese demand. What we are seeing, however, are the beginnings of supply reduction in a number of metals. Mines and smelters are being closed to reduce the higher cost production. And there are rumblings of possible mergers among some of the players that could lead to further cutbacks. If commodity supplies are brought back into line with the reduced demand, prices will stabilize and the stocks will begin to move up. Should Chinese demand pick up again, the supply cutbacks could cause commodity prices – and the related stocks – to rebound very sharply. Because our crystal ball on all of this is still pretty hazy, we are once again suggesting that you focus on the larger players with the stronger balance sheets. Many of the smaller, more leveraged miners and metals producers may not Continued on page 20 Mining Stocks: Beginning to Dig Out? BHP Billiton Record Production Volumes for Fiscal Year ’14
Transcript of ResourceThe Bull & Bear's URANIUM SILVER … aggregate from Lens A, and quarry towards Lens B...

GOLD
SILVER
URANIUM
PLATINUM
PALLADIUM
OIL & GAS
BASE METALSMay/June 2015
InvestorInvestorBull & Bear'sTheResourceResource
INSIDE...El Nino Has Set In,Crops Most at RiskAsia braces for crop damage as an El Nino has formed. Most at risk: Wheat, Rice, Soybeans, Palm Oil and Corn. El Nino will deliver drought-busting rains to Texas and California.
...Page 3
Natixis Metals ReviewNatixis Commodity Research analysts give their outlook and price forecasts for Base Metals, Gold, Silver, and PGMs for 2015 and 2016.
…Page 6
Cameco: Better Times AheadWhile results fell short of the “Streets” expectations for Cameco. Looking ahead, Vivian Lewis expects this pro-ducer of 16% of the uranium used worldwide to become a boom rather than a bomb stock this year.
…Page 12
Profiled Companies:Atna Resources Ltd.Fairmont ResourcesTorex Gold ResourcesPuma Exploration
Investment Newsletter DigestAdvice from the world’s top-per forming resource sector investment experts. Top Stock Picks of the Month. Buy/Sell advice on Energy Stocks, Ag Sector, Gold & Silver Stocks, Precious Metals Trends and Trading Strategies.
...Page 10
By George Putnam, IIIThe Turnaround Letter
We were at best early – and perhaps wrong – when we high-lighted the mining sector two years ago. The good news is that we recommended sticking to the large, well-capitalized companies in the sector. As a result, while the stocks we highlighted then have not performed well in the interim, they have not been crushed like many of the more leveraged names in the sector, some of which are down 80% or more.
What we did not anticipate two years ago was the rapid decline in Chinese demand for coal and other commodities and metals. This pushed the prices for many commodities down sharply, and the profits and stock prices of the commodity producers followed.
We do not claim to have any expertise in forecasting Chinese
demand. What we are seeing, however, are the beginnings of supply reduction in a number of metals. Mines and smelters are being closed to reduce the higher cost production. And there are rumblings of possible mergers among some of the players that could lead to further cutbacks. If commodity supplies are brought back into line with the reduced demand, prices will stabilize and the stocks will begin to move up. Should Chinese demand pick up again, the supply cutbacks could cause commodity prices – and the related stocks – to rebound very sharply.
Because our crystal ball on all of this is still pretty hazy, we are once again suggesting that you focus on the larger players with the stronger balance sheets. Many of the smaller, more leveraged miners and metals producers may not
Continued on page 20
Mining Stocks:Beginning to Dig Out?
BHP Billiton Record Production Volumes for Fiscal Year ’14

ch_canvest2015_bull_bear_ad_7.25x9.8_print_otl.indd 1 15-03-30 10:49 AM

3
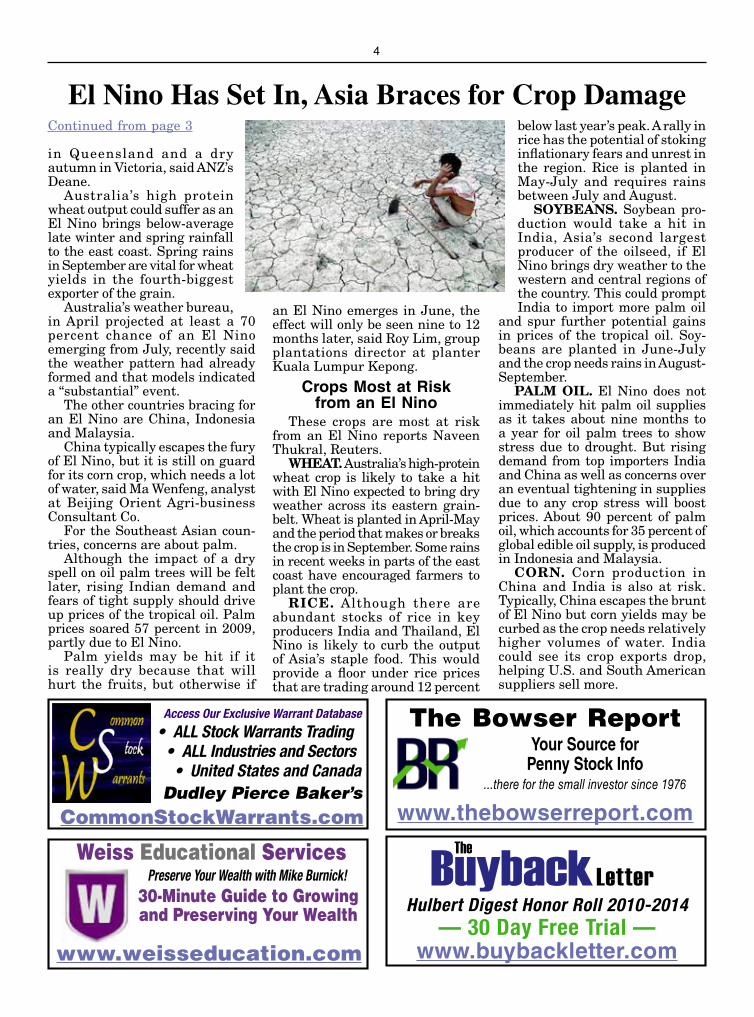
Prayers for rains in Asia, however, may not be answered as weather forecasts show an intensifying El Nino has set in.
In 2009, the El Nino brought the worst drought in four decades to India. It razed wheat fields in Australia and ravaged croplands across Asia, driving food prices to multi-year highs. A closely watched forecast by Japan has confirmed its return this year.
A strong El Nino will roil econo-mies that are heavily dependent on agriculture, particularly India which is already reeling from bad weather. It would also unhinge supply chains of commodities such as rice, corn and palm oil. In fact, the heat is already up in some places in the Asia Pacific.
“We’ve already been hit by a three-month dry spell. We could not plant anything since January. All of us here in Taculen are praying for more rains,” said Benny Ramos, a rice farmer in North Cotabato in southern Philippines.
The El Nino, or a warming of sea-surface temperatures in the Pacific, can lead to scorching weather across Asia and east Africa but heavy rains and floods in South America.
This year, the El Nino arrived in spring and is likely to continue into autumn, said the Japan Meteorological Agency, which was the first bureau to project the emergence of an El Nino in 2015.
Forecasts in May tend to be more accurate as weather models become more dependable here onwards, said Paul Deane, senior agricultural economist at ANZ Bank, Melbourne.
“Now we are getting to a point that you start having more confidence in those models,” he said.
Grain prices have, however, not yet factored in the threat to supplies from an El Nino, largely because similar calls for bad weather in 2014 did not come to pass. In fact, good crops replenished stocks last year.
In the absence of a weather premium, prices of grains such as wheat and rice remain near multi-month lows. Wheat futures, down a fifth so far this year, are near five-year lows, while Asia rice is at its weakest since June.
The last El Nino led to tens of billions of dollars in economic damages in the Asia Pacific. This year, a strong El Nino could take an even bigger toll in certain countries, analysts said.
For India, it would be a double whammy.
India: Among the Worst Hit
Dozens of farmers have already committed suicide in India after damage from unseasonal rains this year. Now if the summer rains are below normal, rural discontent will deepen.
The monsoons are vital for India as half its croplands lack irrigation while the farm sector accounts for 14 percent of its economy. India’s weather bureau has forecast weaker rainfall this year, citing a 70 percent El Nino probability.
“Crops like soybean and cotton are under El Nino watch for being
sown mainly in rainfed conditions,” said K.K. Singh, the head of agri-cultural meteorology division of the Indian weather office. “El Nino looms large over soybean areas of the central parts and cotton belts of the western and the northern regions.”
Fewer domestic soybeans, which are crushed to produce soyoil, will prompt the world’s No.1 edible oil importer to buy more palm oil from top producers Indonesia and Malaysia.
India’s rice crop would also be hit.
While the Number 2 rice ex-porter could use its record-high stocks to meet a local shortfall, it would leave less available for sales at a time when demand could rise from countries like the Philippines.
More than half of the provinces in the Philippines, one of the world’s top rice importers, are already suffering from dryness which has curbed its rice output.
Australia: Early Signs of El NinoEarly signs of El Nino also
emerged on Australia’s east coast, with a poor end to the wet season
Continued on page 4
El Nino Has Set In, Asia Braces for Crop Damage
4
Continued from page 3
in Queensland and a dry autumn in Victoria, said ANZ’s Deane.
Australia’s high protein wheat output could suffer as an El Nino brings below-average late winter and spring rainfall to the east coast. Spring rains in September are vital for wheat yields in the fourth-biggest exporter of the grain.
Australia’s weather bureau, in April projected at least a 70 percent chance of an El Nino emerging from July, recently said the weather pattern had already formed and that models indicated a “substantial” event.
The other countries bracing for an El Nino are China, Indonesia and Malaysia.
China typically escapes the fury of El Nino, but it is still on guard for its corn crop, which needs a lot of water, said Ma Wenfeng, analyst at Beijing Orient Agri-business Consultant Co.
For the Southeast Asian coun-tries, concerns are about palm.
Although the impact of a dry spell on oil palm trees will be felt later, rising Indian demand and fears of tight supply should drive up prices of the tropical oil. Palm prices soared 57 percent in 2009, partly due to El Nino.
Palm yields may be hit if it is really dry because that will hurt the fruits, but otherwise if
an El Nino emerges in June, the effect will only be seen nine to 12 months later, said Roy Lim, group plantations director at planter Kuala Lumpur Kepong.
Crops Most at Risk from an El Nino
These crops are most at risk from an El Nino reports Naveen Thukral, Reuters.
WHEAT. Australia’s high-protein wheat crop is likely to take a hit with El Nino expected to bring dry weather across its eastern grain-belt. Wheat is planted in April-May and the period that makes or breaks the crop is in September. Some rains in recent weeks in parts of the east coast have encouraged farmers to plant the crop.
RICE. Although there are abundant stocks of rice in key producers India and Thailand, El Nino is likely to curb the output of Asia’s staple food. This would provide a floor under rice prices that are trading around 12 percent
El Nino Has Set In, Asia Braces for Crop Damagebelow last year’s peak. A rally in rice has the potential of stoking inflationary fears and unrest in the region. Rice is planted in May-July and requires rains between July and August.
SOYBEANS. Soybean pro-duction would take a hit in India, Asia’s second largest producer of the oilseed, if El Nino brings dry weather to the western and central regions of the country. This could prompt India to import more palm oil
and spur further potential gains in prices of the tropical oil. Soy-beans are planted in June-July and the crop needs rains in August-September.
PALM OIL. El Nino does not immediately hit palm oil supplies as it takes about nine months to a year for oil palm trees to show stress due to drought. But rising demand from top importers India and China as well as concerns over an eventual tightening in supplies due to any crop stress will boost prices. About 90 percent of palm oil, which accounts for 35 percent of global edible oil supply, is produced in Indonesia and Malaysia.
CORN. Corn production in China and India is also at risk. Typically, China escapes the brunt of El Nino but corn yields may be curbed as the crop needs relatively higher volumes of water. India could see its crop exports drop, helping U.S. and South American suppliers sell more.
Preserve Your Wealth with Mike Burnick!
www.weisseducation.com
Weiss Educational Services
30-Minute Guide to Growing and Preserving Your Wealth
Access Our Exclusive Warrant Database
• ALL Stock Warrants Trading • ALL Industries and Sectors • United States and Canada Dudley Pierce Baker’s
CommonStockWarrants.com
The Bowser ReportYour Source for
Penny Stock Info...there for the small investor since 1976
www.thebowserreport.com
www.buybackletter.com
Hulbert Digest Honor Roll 2010-2014 — 30 Day Free Trial —
The
Buyback Letter
FAIRMONT RESOURCES, LTD.
TSX.V: FMR Contact:
Michael Dehn, President, CEO
600 Orwell St. Unit 14 Mississauga, ON,Canada L5A 3R9
Phone: (647) 477-2382 [email protected]
www.fairmontresources.ca
Fairmont Resources (TSX.V: FMR) is about to enter production for cement and aggregate compa-nies that seek a clean high density aggregate that can be shipped through the Great Lakes or the Atlantic Ocean.
Fairmont recently received a Certificate of Authorization, allowing 300,000 tonnes annual titano-mag-netite aggregate production from the Buttercup property. Fairmont’s goal is to be active on the ground at But-tercup by late spring 2015, putting put one project into production per year, and permitting a high purity silica project in 2015.
The current plan is to produce titano-magnetite aggregate from Lens A, and quarry towards Lens B thereafter. Fairmont Resources is also accepting property sub-missions for industrial minerals deposits in Canada that have a resource and are close to infra-structure. The titano-magnetite aggregate from the Buttercup property can be used as loose bal-last for offshore ballasting of rigs
and caissons, scour protection for underwater structures or pipelines, and as ground stabilization. High density concrete weighs up to 1.7 times that of regular concrete for the same volume. Adding titano-magnetite aggregate to make high density concrete is beneficial in underwater concrete for tunneling and pipelines; for shoreline protec-tion in breakwaters and modular precast jetties; as counterweights for bridges, locks sluices, elevators and excavators; as negative buoy-ancy pipeline coatings; and in high density concrete for medical and nuclear radiation shielding.
Fairmont’s Quebec properties cover numerous occurrences of high-grade titaniferous magnetite with vanadium, a glistening black mineral. Where these occurrences have been tested they have display exceptional uniformity with respect to grade. These occurrences are of considerable interest due to their proximity to tide water, with the Grand Anse Sea Terminal at the Port of Saguenay located within 100km of all
of Fairmont’s properties, which include the Lac Elan Property, the Hearth Project and the recently optioned Lac Bouchette Quartz Property.
The deep water port at the Grand Anse Sea Terminal is open year round, and an ideal location to ship aggregates from the Buttercup Project.
Fairmont Resources Fully Permitted to Produce Dense Aggregate Lump Titano-Magnetite in Quebec
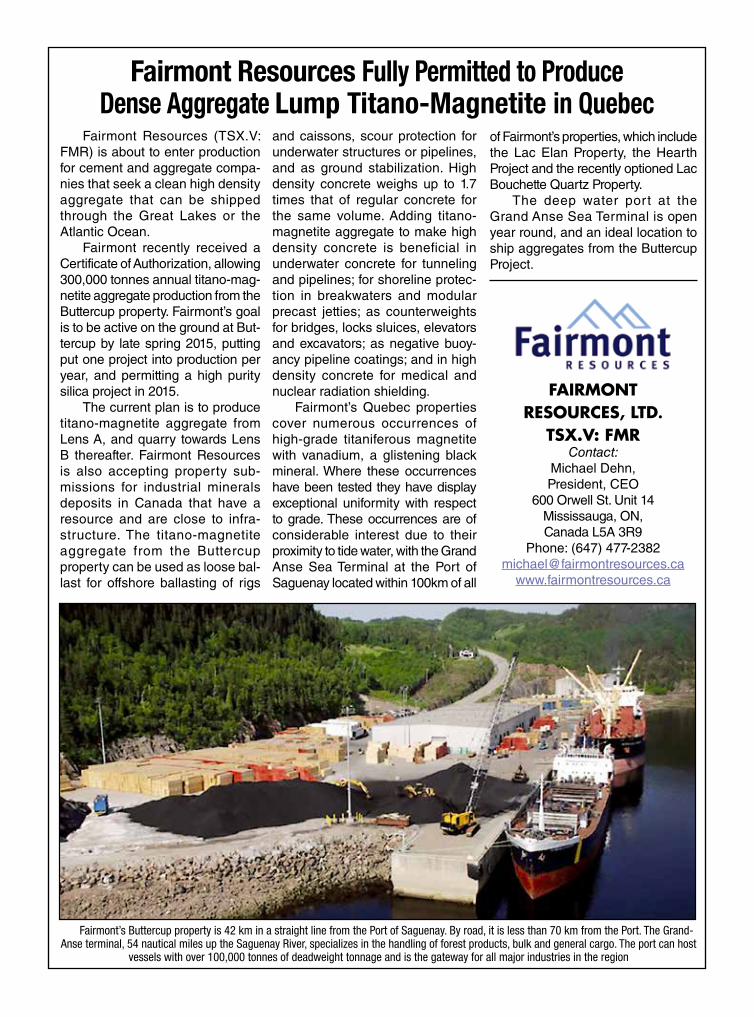
Fairmont’s Buttercup property is 42 km in a straight line from the Port of Saguenay. By road, it is less than 70 km from the Port. The Grand-Anse terminal, 54 nautical miles up the Saguenay River, specializes in the handling of forest products, bulk and general cargo. The port can host
vessels with over 100,000 tonnes of deadweight tonnage and is the gateway for all major industries in the region

6
Special Report: Price forecasts and outlook for Base Metals, Gold, Silver and PGMs for 2015 and 2016 by Nic Brown and Bernard Dahdah, analysts with French-based Natixis Commodity Research.
In recent years, the global economy has been underpinned by both central bank and in many cases government support for economic activity, propping up what would otherwise have been anaemic rates of growth. Over the period 2015-16, this situation is expected to change perceptibly. In the US, the Fed is expected to begin normalising monetary conditions as the US labour market finally approaches full employment once again. In Europe, years of under-performance are finally expected to be replaced by stronger economic growth, not least thanks to the ECB’s implementation of quantitative easing. Whether Japan can rediscover growth through Abenomics remains to be seen.
Across the developing world, economic performance is expected to diverge markedly. In China, although the rate of growth is expected to slow only marginally, this will coincide with a huge change in the underlying structure of the economy, from unsustainable investment-led growth to a more sustainable model based around consumption, innovation and the influence of the price mechanism. In India, years of sub-par growth are expected to give way to stronger economic activity, supported by pro-growth policies of the new Modi government. In Brazil and Russia, economic conditions are expected to remain extremely challenging, suggesting a potential economic contraction in 2015.
The pursuit of quantitative easing by the ECB and BoJ, at a time when the US Fed is expected to begin raising interest rates, is leading to a sharp realignment of currencies, with the dollar strengthening to its highest level in over a decade.
Another key development for
Natixis Metals Review
Setting Out on a Path Back to Normalitymetal markets is the recent fall in oil prices, boosting economic activity in oil consuming countries at the expense of deteriorating fiscal balances among oil producing countries. Against this backdrop, we expect world growth to improve marginally over the coming two years.
In the base metal markets, our assessment of market balance has been complicated significantly by the major structural change now occurring in China. For some metals, curtailment of excess capacity has scope to result in significant changes in either supply of or demand for base metals. In similar fashion, forecasting the potential strength of Chinese exports of metal and metal products is fraught with uncertainty.
Precious metal markets are expected to remain fixated upon the decisions facing the US Fed this year. When to begin normalising rates, and what effect will this have upon the rapidly strengthening dollar?
For both base and precious metals, the effects of the lengthy investment cycle will be of crucial significance. Current low prices may be deterring investment, but it can take 4-6 years before the full effects of changing investment decisions are felt in terms of mine output.
Aluminium. After experiencing a roller-coaster ride in 2014, sig-nificant swings in LME aluminium prices are expected to continue in 2015-16 as strengthening medium-term fundamentals risk being undermined by negative factors in the short term. While the global aluminium market is expected to experience deficits over the coming years, it will still take some con-siderable time before aluminium inventories are brought down to more “normal” levels.
One factor that may put pres-sure on aluminium prices in the near term is the potential for alu-minium premiums to extend their recent decline. This fall in premi-
ums is damaging the economics of financing trades, with the result that more metal is becoming avail-able within the market.
While the eventual trajectory for aluminium prices is expected to be upwards, there remain sig-nificant risks that could lead to bouts of recurrent weakness in the immediate future. For 2015, we forecast an average aluminium price of $1,840/tonne, to be fol-lowed by $2,000/tonne in 2016.
Copper. We have been bearish on the outlook for copper prices since 2013, arguing that a move from deficit to surplus would be accompanied by a fall in copper prices and a shift in the shape of the forward price curve from backwardation to contango.
Alongside a progressive decline in copper prices, growth in mine output is slowing perceptibly. This is contributing to a decline in TC/RCs, which is expected to slow the growth in output of refined copper in 2015-16.
With the sharp drop in copper prices in January this year, we believe that a multi-year adjust-ment in the copper price is now largely complete. Yes, there is scope for spot prices to suffer a little more in the near term if the forward curve were to complete its transition from backwardation to contango, but the shift from 2014-15 surplus to 2017-18 deficit should gradually provide increas-ing support for copper prices over the coming years.
In our central scenario, we expect copper prices to average $6,150/tonne in 2015, rising to an average of $6,800/tonne in 2016.
Alternative ScenariosThere are a number of risks
to our central scenario, which could result in prices diverging significantly from their expected trajectory.
In our higher case scenario, mined output could slow more markedly than we expect. This
Continued on next page
7
Continued from previous page
would be expected to depress TC/RCs, leading to lower utilisation rates at smelters/refiners and therefore a slowdown in output of refined copper. Similarly, if the US dollar has peaked, a gradual decline in the strength of the dollar would be supportive of higher copper prices. Under this scenario, copper prices could increase to an average of $6,500/tonne in 2015, to be followed by $7,500/tonne in 2016, with the copper curve remaining in backwardation.
In our lower case scenario, the US dollar may extend its recent upward trajectory, further undermining commodity prices. China’s rapidly expanding smelting and refinery capacity could run at higher utilisation rates than we expect, increasing output of refined copper faster than we anticipate. Temporary increases in copper prices could result in strong supply responses from global mining companies, leading to repeated capitulations in copper prices. Chinese demand for copper could slow more abruptly than we anticipate, in response to the changing underlying structure of China’s “new normal” economy. Any one of these potential outcomes could result in copper prices stagnating at or around current levels, while a combination of two or more negative factors could push copper prices lower. Our lower case scenario therefore envisages average copper prices of $5,500/tonne in 2015, followed by $5,300/
tonne in 2016.
Lead. The global lead market has been subject to immense up-heaval over recent years, with huge structural changes taking place in the lead industry in both the US and China, the two largest mar-kets for lead. This has resulted in a high degree of uncertainty relating to the fundamentals underpinning lead supply and demand.
In our central scenario, Chinese demand for lead is expected to change from yoy declines over the past two years to very slow growth in 2015-16. Depending on the pace at which e-bike demand for lead diminishes, this could prove to be an overly optimistic assessment. New environmental regulations are expected to dampen Chinese mined output of lead, but at the same time are likely to encourage lead recycling. Again, both of these assumptions are open to some degree of doubt.
Our forecast for a lead surplus of 90,000 tonnes in 2015 suggests that lead prices are unlikely to perform well this year. However, with prices recently hitting five-year lows below $1,700/tonne, depressed by the recent strength of the dollar, scope for further significant price falls appears limited. We would therefore envisage lead prices remaining muted, trading in a range between $1,700/tonne and $1,900/tonne. In our central forecast, we would suggest an average price of $1,800/tonne in 2015, to be followed by $1,850/
tonne in 2016.
Nickel. The global nickel market has been subject to significant upheaval in recent years, causing a high degree of price volatility. Between 2009 and 2013, Chinese stainless steel producers expanded production rapidly, supported by imports of Indonesian nickel ore. After Indonesia introduced a ban on exports of unprocessed raw material, this dependence was forced to shift from Indonesia to the Philippines.
Has Chinese output of stainless steel grown too rapidly? The current shift from an unsustainable investment-driven growth model to a more sustainable model based upon consumption, innovation and the price mechanism is already leading to substantial change in China’s steel industry. Whether this proves to be equally negative for the country’s stainless steel industry remains to be seen, but the drop in Chinese apparent demand in 2014 is certainly a worrying development.
Close study of the supply side of the nickel market gives us a relatively clear picture of likely developments in 2015-16, but the potential strength of demand for nickel is much harder to gauge, resulting in a significant degree of uncertainty in our forecasts for market balances and nickel prices in the years ahead. Our central scenario envisages nickel prices averaging somewhere around $14,500/tonne in 2015. For 2016, prices are expected to improve
Continued on page 8
American Gold Exchange, Inc.
Your Reliable Hard Asset Advisor Gold, Platinum, Silver, Rare Coins
www.amergold.com
n U.S. Gold Miner/Producer
n Two Operating Mines
n Diverse Portfolio of Development-Ready Gold Properties
www.Atna.comR E S O U R C E S L T D .
ArgonAut gold
2 Operating Mines • 3 Advanced Exploration Projects
www.argonautgold.com
Creating Value Beyond Gold
The Morgan ReportMoney, Metals & Mining
Silver Analysis & Research

8
Continued from page 7
only modestly, rising perhaps to an average of $15,300/tonne.
Zinc. The zinc market is moving inexorably from surplus to deficit. This prompted a sharp rise in prices during 2014H2, which encouraged a supply response in the form of higher Chinese output. Since then, zinc prices have softened, slipping back to $2,000/tonne in March.
From 2015H2, we expect the next bout of scarcity, brought about by the closure of both the Century mine in Australia and Lisheen in Ireland, to result in a renewed upward trend in zinc prices. If Chinese producers are not able to respond so easily with higher output this time around, the rise in zinc prices might be more sustainable during 2015H2 and 2016. Our central forecast for zinc anticipates an average price of $2,225/tonne in 2015, rising to $2,520/tonne in 2016.
Gold. In the period between 2003 and 2012 gold miners invested heavily in mine expansion and ramping up production. Following the 2013 collapse in the price of gold, producers instead turned to cutting Capex. As a result of these previous investments, gold mined output has continued to rise, and in 2014 mined output rose by 2.25% yoy to 2,875 tonnes. New mines take around 5 years to come on-stream, as such the sharp drop in investments will most likely only show up in 2017-8.
In the meantime, higher output and lower investment demand is expected to weigh on gold prices. Our view is that a rise in US interest rates may
push gold prices to lower levels as the opportunity cost of holding the metal rises and the need for a safe haven dissipates.
For 2015 we forecast that gold prices will average $1,150/oz, followed by $1,055/oz in 2016.
Alternative ScenariosThe potential downside for gold prices could stem
from a rapid improvement in the economic situation in Europe. Under such a situation we might see the ECB terminating QE sooner than expected. On a global scale, once more countries start to contemplate interest rate hikes, so gold prices could suffer significantly.
Larger than expected hedging by gold producers could potentially depress gold prices. Around two decades ago substantial volumes of hedging contributed to ever lower gold prices.
A potential repetition of the 2013 outflows from physically backed ETPs is unlikely. Nevertheless, there still remains 1,640 tonnes of gold in these funds which is equivalent to almost 50% of last year’s mined supply.
In our worst case scenario, we could see gold prices averaging $1,050/oz in 2015 (which could take fourth-quarter prices to as low as $950/oz), followed by an average of $825/ oz in 2016, close to the average cash costs of production.
Looking at our high case scenario, in a situation where economic challenges in Europe continue to mount and Greece exits in a disorderly way, we could potentially see gold prices rising sharply.
Geopolitical tensions could also drive up gold prices. Although the tensions between Russia and Ukraine have already been factored into gold prices, further expansion of Russian ambitions in Ukraine and other Baltic countries could also raise the price of gold.
Alongside low oil prices, there is scope for a number of countries to face risks of imminent default. This could raise perceptions of global risk, encouraging investment in gold as a safe-haven asset.
In our high case scenario we could see gold prices averaging $1,350/oz in 2015 and $1,600/oz in 2016.
Silver. We expect that the positive correlation between silver and gold prices will remain strong in 2015; so far this year it has been at around 0.87. Nevertheless, the beta between silver and gold prices appears to have fallen in recent years. In 2014, for every 1% daily movement in the price of gold, silver prices changed by only 1.26% compared with 1.65% in 2011. Since January 2014 the beta has been 1.27.
As with gold, we expect that the main pressure on silver prices will come from the stronger US dollar and higher US interest rates. Silver is especially sensitive to the US market where the metal has a wider popularity with retail investors than in other developed countries.
Investment demand for silver could suffer this year as investors seek higher yielding investments (hand in hand with higher interest rates). Investment demand as a share of total demand for silver reached
Continued on next page
FairmontResources.ca
Fully Permitted for Dense Aggregate
Production in Quebec
The easiest way to trade US and Canadian stocks online.
Division of Pennaluna & Co. member FINRA/SIPCwww.penntrade.com
9
Continued from previous page
as much as 25% in the past five years. Prior to the financial crisis this share was around 8% and we believe that markets are steadily heading back towards that pre-crisis figure.
Industrial demand is expected to grow this year as the global economy continues to expand and electronics become more popular and accessible in developing countries. That said, the price elasticity of industrial demand for silver is low and we do not believe it would be enough, in the short run, to compensate for a sharp drop in investment demand.
Based on our positive outlook on the US economy and additional downside risks linked to silver prices (potential outflows from investment demand and low cash cost of production), we forecast silver prices will average $15.5/oz in 2015 and $13.5/oz in 2016.
Alternative ScenariosDownside risks to silver prices appear more
prevalent and more likely than upside risks. Our biggest downside risk for silver is an outflow from silver held in physically-backed ETPs. The current amount held by physically-backed silver ETPs is equivalent to 71% of 2014’s mined output. Should the 2013 gold ETP scenario happen in silver, the effect could possibly be more devastating as the volume of silver held by ETPs relative to annual supply/demand is considerably higher than was the case with gold.
Another reason why the potential downside for silver is potentially more significant than gold is that current prices are well above the typical industry cash cost of production, whereas gold prices are closer to average costs of production. Given that silver is typically a by-product, there is also no clearly defined point at which a majority of producers would reduce or cease silver output in the face of declining prices. This means that falling silver prices will not necessarily act as a barrier to silver production. Moreover, mined supply of silver is expected to continue to grow. Though some mining companies are delaying investment decisions for new projects because of the drop in metal prices, this is not expected to affect silver output for at least four years.
Under this scenario we could see silver prices dropping to an average of $13/oz in 2015 and $10/oz in 2016.
In our upside scenario, a global economic slowdown could lead to higher silver prices if central banks’ focus shifted back towards monetary easing. Heightened political tensions either in the Middle East or Ukraine could also lead to higher silver prices. Under these scenarios we could see silver prices reach $20/oz in 2015 and $30/oz in 2016.
Platinum. As a result of last year’s strikes, it is estimated that mined supply of refined platinum dropped by 11% yoy in 2014 to 161 tonnes which in turn pushed down total supply by 8% yoy to 224 tonnes. Higher output from recycling has been offsetting efforts by miners to reduce platinum output. Scrap supply of platinum is expected to have risen by 13% yoy in 2014 to a record of 71 tonnes.
We expect demand for platinum will improve in 2015. New automobile sales in Europe are expected to grow and so is jewellery demand from China. This should be supportive for platinum prices which lately have been strongly positively correlated with gold. In our base case scenario we see platinum prices averaging $1,285/oz in 2015 and $1,500/oz in 2016.
Palladium. At the beginning of 2014, palladium prices rose strongly due to the unfolding of the Russia and Ukraine crisis. The market has therefore factored this into current price levels, and it would take a further escalation of the conflict in order to support palladium prices in 2015. Although automobile sales in the US, China and India are expected to grow this year, we are pessimistic on the outlook for Russia and Brazil, suggesting only modest global growth in demand for palladium.
In our base case scenario we see palladium prices averaging $775/oz in 2015 and $740/oz in 2016.
Alternative ScenariosIn our low case scenario for both metals, the
biggest risk for us stems from the amount of platinum and palladium held in physically backed ETPs. The amount held in platinum and palladium ETPs is equivalent to 83 and 90 tonnes respectively, ie 35% and 32% of total supply. Should this source of demand for the metal turn into a source of supply then we could potentially see a devastating effect on PGM prices. Back in 2013, outflows from physically-backed gold ETPs accentuated the drop in gold prices.
Another potential downside risk, particularly for platinum, is a deterioration of the economic situation in Europe. With Europe being a substantial source of demand for platinum, a renewed drop in automobile demand, especially for dieselpowered cars, could drive platinum prices lower.
As such, in our low case scenario we see the prices of platinum and palladium averaging $1,070/oz and $685/oz in 2015 and $1,000/oz and $550/oz in 2016 respectively. We do not see platinum prices averaging below $1,000/oz as this would be below the cash cost of production and would lead to mine shutdowns.
In our high case scenario, unusually strong demand for platinum and palladium in physically backed ETPs could drive the price of the two metals higher. A further escalation of the conflict between Russia and Ukraine could once again lift palladium prices. As for platinum, unforeseen strikes in South Africa could lift platinum prices as above ground stocks have dropped substantially since last year’s strikes. Platinum prices could further benefit from a stronger than expected improvement in European automobile demand for the metal and in Chinese and Japanese jewellery demand.
In our high case scenario we see the price of platinum and palladium averaging $1,440/oz and $850/oz in 2015 and $1,650/oz and $920/oz in 2016 respectively.
Editor’s Note: The Natixis Metals Review First Half 2015 is authored by Nic Brown, head of commodities research and Bernard Dahdah who is responsible for precious metals research at Natixis.
Natixis is the corporate, investment, insurance and financial services arm of Groupe BPCE, the second-largest banking group in France. www.natixis.com.
10
ResouRce stocks: Gold, silveR & oil & Gas shaRes
INVESTINGDAILY.coma free website maintained by KCI Publishing7600A Leesburg Pike, West Bldg., Ste. 300, Falls Church, VA 22043
Profits to burnThomas Scarlett: “Consol Energy Inc. (NYSE:
CNX) has been associated with coal mining for many years, which may not sound like the cutting edge of energy production in the 21st century. But the Pittsburgh-based company has been adapting by expanding its operations in natural gas and other sectors, and its shares are undervalued.
With more than 9,000 employees, Consol is the leading diversified energy producer in the Appalachian basin. Consol produces both natural gas and high-BTU coal. Together, natural gas and coal fuel two-thirds of the nation’s power.
The company has 12 bituminous coal mining complexes in four states and reports proven and probable coal reserves of 4.2 billion tons. The company’s premium Appalachian coal is sold worldwide to electricity generators and steelmakers.
In natural gas, Consol Energy has transformed itself from a pure-play coalbed methane producer to a full-fledged exploration and production company. The company is a leading producer in the Marcellus Shale and is transitioning its active exploration program into development mode in the Utica Shale. Consol Energy has proved natural gas reserves of 4.0 trillion cubic feet.
Domestic coal producers are facing stiff challenges. Consol is not abandoning that industry entirely, but it is concentrating more on producing coal for export. The company has longstanding relationships with customers in Europe, Brazil and the Pacific Rim, so it should be able to still derive some profits from its coal business.
The company has been selling its Consolidation Coal Company (CCC) subsidiary, which contains all five of its longwall coal mines in West Virginia, to Murray Energy Corporation (Murray) for $4.4 billion in value.
“While this transaction furthers Consol’s growth strategy,” commented the firm’s CEO, “the sale of these five mines – assets that have long contributed to America’s economic strength and our company’s legacy – was a very difficult decision for our team. The employees at these mines are among the safest and most productive miners anywhere in the world. In the end, we concluded that the time had come to sell these mature assets to ownership whose strategic direction is more aligned with those mines.”
He added: “We’re not leaving the mining business; we’re growing the energy business. It wasn’t easy for us to make the decision to shift our strategy away from those mines to a growth area.”
Operational safety is a core value, and Consol Energy boasts a record of almost two times better than the industry average for underground bituminous coal mines. Consol Energy has total revenues of $5.5 billion, good enough to make the Fortune 500.
The Gas Division showed noticeable expansion as
the average sales price was nearly unchanged, while unit costs were lower, mostly due to higher volumes. Overall natural gas production was up 17 percent, aided by the 72 percent growth in the Marcellus Shale component.
The Gas Division is on track to meet its production goals. For 2015 and 2016, the company has announced annual production guidance increases of between 25 and 30 percent.
Consol’s Gas Division continues to see the Marcellus Shale become a greater portion of the production mix. This is important for two main reasons: the first is the lower-cost nature of the Marcellus resulting from drilling efficiencies such as pad drilling, and the second is sales price uplift associated with a higher concentration of liquids. Consol is not only on track to meet its 2015 overall gas production guidance but is also on track to more than double its Marcellus Shale production in the following year.
In the Coal Division, margins decreased primarily as a result of lower sale prices per ton, reflecting a decrease in the global metallurgical and thermal coal markets. Partially offsetting lower sales prices was approximately a 10 percent improvement in costs per ton.
The company’s liquidity remains strong at $2.3 billion, while the company continues to invest in value creating projects. Capital investments in the first quarter of 2015 were $438 million, which is flat with the year-earlier quarter.
Cash flow from operations in the quarter was $196 million, as compared to $162 million in the year-earlier quarter.
Natural gas is competing with coal more than ever in American homes. The company’s top execs think coal will continue to provide 35 or 45 percent of electricity needs domestically for the next 20 to 30 years.
The stock can be quite volatile. But investors who are willing to accept some volatility in exchange for the prospect of strong long-term growth should consider Consol Energy. The stock is a buy up to 36.”
Editor’s Note: Tom Scarlett is an investment analyst at Personal Finance, 1 year, 24 issues, $99. Special Limited Time Offer: Here’s how you can receive a FREE one year subscription to the highly-regarded Personal Finance newsletter, details…
***************
THE COMPLETE INVESTORP.O. Box 248, Williamsport, PA 17703. Monthly, year, $199. www.completeinvestor.com.
Deere: It’s not just about foodStephen Leeb: “We’d bet that most people (especially
anyone who’s ever listened to country music), if asked to blurt out the first thing they associate with “John Deere,” would come up with “tractor.” And Growth Portfolio’s Deere & Company (DE) is indeed the leading global provider of heavy-duty equipment used in agriculture. But there’s more to Deere than food: the company has large and fast-growing operations in

11
ResouRce stocks: Gold, silveR & oil & Gas shaRes
a variety of vital infrastructure areas.Its stake in both agriculture and infrastructure
combine to make Deere one of the safest and surest long-term investments you can make. That’s true despite disappointing results in its agriculture segment in the last couple of years, which reflect temporary conditions that don’t alter the long-term picture. Current projections point to a world population of 9.5 billion by 2050. More than 6.5 billion will live in relatively affluent urban areas where residents typically demand more protein-intensive foods, which require more grain (as feed for animals). The call on Deere’s state-of-the-art agriculture equipment will be enormous and protracted.
During the past decade, demand for grain has continued to grow. Indeed demand for corn, arguably the most important food product, has grown each year for a generation. Exceptionally favorable weather conditions that held down grain prices explain the recent faltering in Deere’s revenues and earnings. But even if such weather conditions became the norm (which we don’t expect), rising demand for food would still almost certainly overwhelm supply in the years ahead.
Deere’s strong and rapidly growing presence in nonfood infrastructure includes its forestry and
construction businesses, which are focused dead center on vital worldwide infrastructure needs. Offerings include state-of-the-art excavators, wheel loaders, and software that lets loggers use Deere’s proprietary “foresight” technology to wirelessly connect to machines. The businesses have a growing presence not only in North America but also in Brazil and China. Over the past two years as agriculture-related operating profits declined by about 7 percent, operating profits for the other two divisions rose 20 percent and currently represent 30 percent of overall operating profits compared with 21 percent two years ago. In addition the company also has a rapidly growing financial services division that helps finance construction and agricultural projects.
Through the growing reach of its infrastructure operation, Deere is making inroads into a market measured in the hundreds of millions of billions if not trillions of dollars. No wonder that Warren Buffett has taken a large position in the company. We would use any pullbacks in Deere as an opportunity to add to positions.”
Editor’s Note: Stephen Leeb, Ph.D. is Founder and Research Chairman of the Leeb Group, the publisher of an extensive line of financial newsletters and e-letters reaching more than 200,000 subscribers. For more information visit www.completeinvestor.com.
Atna Resources Optimizes Gold Production, Lowers Pinson Costs Pinson Underground Mine Atna Resources restarted mining operations at its high grade Pinson under-ground gold mine in Nevada in June of 2014 and the mine is expected to reach its full production by the second half of 2015. Atna is expecting to produce 55,000 to 65,000 ounces of gold in 2015, with 30,000 to 35,000 ounces being contributed from Pinson and the remainder from its Briggs open pit mine in California. A new NI 43-101 Technical Report for the Pinson Underground proj-ect and the adjacent, unpermitted Mag open pit mine was completed in Sep-tember 2014. The report provided an updated resource estimate and mine plan for the underground operation and a positive prefeasibility study for the open
pit mine. Total Measured and Indicated Resources at Pinson underground total 347,000 ounces at a grade of 0.43 ounces per ton. The new underground resource estimate was completed using tighter constraints than previous models creating a higher degree of confidence in the estimate to allow the property to withstand downside gold price pressure. The initial restart and test mining period from June through December 2014, focused on a number of improvements including; lower cost mining method, improved operating and processing contracts and stronger mine management; these positive changes all contributed to the successful restart. Ore sale agreements for both oxide and refractory sulfide ores with Newmont have proven to be very beneficial to the Pinson operation. Gold ore recover-ies have averaged 94.5% at Newmont’s Twin Creeks autoclave facility. This is a significant improvement over the 86% recovery rate experi-enced in a 2013 when Pinson sulfide ores were processed in a roasting facility. The close proximity of Newmont’s facility has also reduced ore transportation costs. Long- hole stoping is the primary mining method at Pinson and so far is providing better and lower cost results than the previous underhand cut and fill mining method. The new contract mining group is working under a productivity based contract versus the previous time and materials contract, increasing productivity and reducing costs.
ATNA RESOURCES LTD.TSX: ATN
US OTC QB: ATNAFContact: Valerie Kimball
Corporate Communications/ Corporate Secretary
Toll Free: (877) [email protected]
www.atna.comShares Outstanding:
208.4 million52-week High $0.2452-week Low $0.06

12
ResouRce stocks: Gold, silveR & oil & Gas shaRes
P.O. Box 917179, Longwood, FL 32791
(407) 682-6496
Publisher: The Bull & Bear Financial Report Editor: David J. Robinson
1 year, 12 issues, $198
TheResourceInvestor.com
© Copyright 2015 The Resource Investor. Reproduction in whole or in part without written permission is strictly prohibited. The Resource Investor publishes investment news and comments of investment advisory newsletters whose thoughts are deemed of interest to subscribers. Neither the information, nor any opinion which may be expressed constitute a solicitation for the purchase or sale of any securities or investment referred herein.
TOP PROS’ TOP PICKSa column by the MoneyShow.com and edited by Steven Halpern, www.MoneyShow.com
Cameco: Better times ahead?Steven Halpern: “Hot off the presses from
Saskatchewan, our recommended uranium producer saw results fall short of Wall Street and Bay Street expectations; nevertheless, it is the forward looking stuff that makes this stock a favorite of mine, explains Vivian Lewis, editor of Global Investing, www.global-investing.com.
Cameco (CCJ) posted a net loss attributed to equity holders for the quarter of C$9 million (2 loony cents per share diluted) compared to net earnings of $131 million (33 cents/share) in Q1 2014.
This resulted from higher mark-to-market losses on forex derivatives. In addition, Cameco posted revenue of $556 million or US$447.7 million, also below forecasts by the brokerages.
The uranium market was flat from end-2014 with continued low contracting activity. But looking ahead, China has begun approving new reactor projects after a hiatus following the 2011 Fukushima disaster, and four reactors under construction bring the total to 26 operating reactors and 23 under construction.
On the supply side, production issues at several large uranium mines threaten to tighten supply in the coming year, although the market impact has been slight.
Japan is unsure about reactor restarts in 2015, with both negative and positive developments in the courts like the recent injunction preventing the restart of Kansai Electric’s two Takahama units.
This adds uncertainty about the Japanese government’s restart plans. Moreover five older
reactors will not apply to restart and will be permanently retired.
The frontrunners for restart continue to be the two Sendai reactors – poised to restart this summer – following final regulatory approvals and pre-operational safety checks.
Without an uptick in fuel demand, operating reactor fuel needs are well covered in 2015; as such, there was only modest movement in the uranium spot price from late 2014. The spot price does show support just below $40 (US).
Canada’s Nuclear Cooperation Agreement with India – and Cameco’s subsequent supply agreement with India’s Department of Atomic Energy – present an opportunity in the world’s second fastest growing nuclear fuel market.
The sale, into a market previously closed to Cameco, provides 7.1 million pounds of uranium concentrate under a long-term contract through 2020. Of course, CCJ hopes will lead to a long and positive relationship with a new customer.
And I also expect the loony to regain more of its 2014 losses against the greenback, although I hope after its forex losses in Q1, CCJ under CEO Ted Gitzel will lighten up on its currency hedging.
Raymond James boosted Cameco to outperform from neutral. CCJ’s US$ target price was raised to $28 from $22. The vexed Cigar Lake mine was said to have “turned the corner,” and as result, the share can be “re-rated” for “a potential upswing.”
Looking ahead, I expect that this producer of 16% of the uranium used worldwide will become a boom rather than a bomb stock this year.”
Editor’s Note: Vivian Lewis is editor and founder of Global-Investing.com, 1 year, $495; 3 months, $149, the daily blog newsletter for Americans and others seeking to internationalize their portfolios. She brings unique experience and competence to the business of picking foreign stocks.
Sign up to Global Investing on the Internet for a day, a quarter, or a year to test it out. Or sign up FREE for a daily blog with information on global markets, which is free but without Lewis’ stock picks at www.global-investing.com.
Be sure to attend this upcoming live conference: The MoneyShow San Francisco, July 18-18th at the San Francisco Marriott Marquis. For free registration go to MoneyShow.com.
***************
Conrad’s UTILITY INVESTORCapitalist Times, LLC 717 King St., Ste. 205 Alexandria, VA 22314. Monthly, Online, 1 year, $149.
NRG Energy: More growth than meets the eye
Roger Conrad: “NRG Energy (NYSE: NRG; $26.40) owns 51 gigawatts of unregulated generation capacity, more than any other US power company.
Unfortunately, the huge drop in natural-gas prices has pushed wholesale electricity prices to half last year’s levels – a major headwind for the company.
13
ResouRce stocks: Gold, silveR & oil & Gas shaRes
But NRG Energy still generates a solid cash flow in this challenging business environment. Although the cash flow generated by NRG Energy’s wholesale operations shrank 10.1 percent year over year, the company’s overall cash flow ticked up by 2.8 percent.
We also like the company’s move to market rooftop solar power to its existing customer base via a partnership with NRG Yield (NYSE: NYLD), a yieldco that the company created a few years ago to monetize its generation assets that operate under long-term contracts.
Since NRG Yield went public in July 2013, the stock has surged by more than 130 percent. Shares of NRG Energy, in contrast, have given up 8 percent of their value over this period.
But NRG Energy benefits immensely from NRG Yield’s success; the yieldco gives the parent a source of low-cost capital to fund its growth projects.
NRG Energy also captures $0.65 from every dollar that NRG Yield earns, a relationship that accounted for almost 15 percent of the parent’s overall cash flow in the first quarter.
NRG Energy and NRG Yield’s push into renewable
energy includes more than 2,200 operating leases and about 17 megawatts of generation capacity. Management estimates that about 13,000 tax equity-funded leases are in development – another 90 megawatts of capacity. Lease terms range from 17 to 20 years.
NRG Energy will receive cash flow from this venture via its ownership interest in NRG Yield. Meanwhile, the yieldco’s higher valuation will make it easier to finance the $100 million that the firm plans to invest in distributed solar power over the next 18 months.
Trading at 93 percent of book value, NRG Energy’s stock has a low bar of expectations. More important, the company continues to demonstrate its ability to weather challenging conditions in the market for wholesale electricity.
NRG Energy rates a buy up to $35 per share for patient investors looking for an underappreciated turnaround story.”
Editor’s Note: Roger Conrad has provided in-depth analysis of the utility sector to individual and institutional investors for more than 20 years. Conrad’s Utility Investor is your complete guide to building a lifelong income stream from stocks that provide essential services. www.ConradsUtilityInvestor.com.
Torex Gold Building First Gold Mine, Defining its Second Torex Gold Resources Inc. is building its first gold mine, defining its second one, and looking for more at its 100% Morelos Gold Property, located in southwest Mexico, in the heart of the prolific Guerrero Gold Belt. The first mine, El Limon Guajes, is expected to be commissioned in August of 2015 and once in full production, it will be amongst the largest and lowest cost gold mines in the world. Fully permitted and fully financed, this mine will produce in excess of 350,000 oz/year for ten years at a cash cost of $504/oz which makes it one of the richest and lowest cost gold mines in the world. All this is possible due to its high grade, at 2.79 g/t, its simplicity and the existing infrastructure in the area. Its second mine, Media Luna, located only 5 km away from El Limon
Guajes, was discovered in 2012. It has an inferred resource of 5.8 million ounces of gold equivalent, contained in only 30% of the magnetic anomalies targeted. Engineering is advancing at Media Luna with scoping work into a preliminary economic assessment expected to be completed by Q3/2015. Torex will be actively exploring for its third mine starting next month. With the help of a Ztem survey completed last year and geophysics, new targets have been developed to look for the roots of this structurally controlled system. Since its inception almost five years ago, the Torex seasoned management team, lead by Fred Stanford, has been consistently delivering on milestones and they expect to continue this trend as they enter the final stages of construction of their first mine, which continues on time and on budget. Torex is a growth-oriented, Canadian-based resource company engaged in the exploration and development of its 100% owned Morelos Gold Property, an area of 29,000 hectares in the highly prospective Guerrero Gold Belt located 180 kilometers southwest of Mexico City. Torex intends to identify a pipeline of future economic deposits within its property, which remains 75% unexplored. The Financial Times recently reported a consensus forecast of 12 polled investment analysts that Torex Gold will outperform the market. Nine analysts offered a 12-month median price target for Torex Gold of $2.20, with a low estimate of $1.60 and a high estimate of $3.00.
TOREX GOLD RESOURCES INC.
TSX: TXGContact: Gabriela Sanchez,
Vice President, Investor Relations
145 King St. West, Suite 1502 Toronto, ON M5H 1J8 Canada
Phone: (647) 260-1500 Fax: (416) 640-2011
14
ResouRce stocks: Gold, silveR & oil & Gas shaRes
LIBERTY’S OUTLOOKpublished by Liberty Coin Service400 Frandor Ave., Lansing, MI 48912. 1 year, 12 issues, $159www.libertycoinservice.com.
How much gold reserves does China have?
Patrick Heller: “In order to make a case that the Chinese yuan deserves to be a component of the IMF’s Special Drawing Rights, that government will have to report significantly higher gold reserves within the next few weeks compared to the 1,054 tons (33.9 million ounces) it reported in April 2009.
The Chinese have not updated that figure in the six years since. However, tremendous quantities have been imported, on top of the growing domestic mining output, far above what is being purchased privately.
Only some bureaucrats in the Chinese government and central bank know the current size of that nation’s gold reserves. Outside observers almost uniformly project that current reserves are many times what they were six years ago. The range of forecasts I have read range from about 5,000 tons (over 160 million ounces) to as much as 25,000 tons (more than 800 million ounces).
The US government is still claiming that it holds more than 8,133 tons (261 million ounces) of gold reserves. If China discloses higher gold reserves by the end of June within the range listed above, it would have either the world’s largest or second largest holding of gold reserves.
Perhaps of greatest importance: should China report gold reserves of at least 5,000 tons, that would be worth nearly $200 billion or more. Coupled with almost another $4 trillion in reserve currencies, that would dwarf the US government’s total reserves of about $420 billion. The Chinese government, just by revealing a large quantity of gold reserves, would strike an immediate blow against the strength and future of the US dollar. You will want to establish at least a conservative position in physical gold and silver before the Chinese update their gold reserves.
By the way, whatever figure the Chinese might report, it will almost certainly be for less than the actual reserves as of the reporting date.”
10Q DETECTIVE a financial blog at http://10qdetective.blogspot.com.
Looking for value? Start with truth-telling at EXCO Resources
David Phillips: “Wow! How refreshing to witness a senior executive immune to the “Bullsh-t Syndrome” (the commonplace corporate condition where imaginary events are presented as fact). C. John Wilder, who recently joined EXCO Resources’ (XCO: $2.05) Board of Directors as Executive Chairman, had this to say on the Q1 earnings’ call about challenges currently facing the natural gas producer amid low energy prices:
• “EXCO is highly levered. The company’s net debt to market cap of 72% and net debt to EBITDA 4.3x are simply not sustainable. We have annual cash interest fixed costs of $107 million. We must improve these metrics, and that will take both time and ruthless execution.
• EXCO has underutilized gathering and firm transportation commitments of approximately $90 million per year. Of this amount, approximately $40 million isn’t used at all. This is a critical problem, which will require commercial ingenuity to solve.
• EXCO’s net drilling inventory is inadequate. EXCO suffers from a lack of a high networking interest locations with a current average operating net working interest across the shale portfolio of 35%, we’re essentially a contract driller. We need to reposition the portfolio to average 60% to 75% net working interest. EXCO has a highly qualified operational team, and needs more economic interest in its project.
• EXCO’s drilling and completion costs are too high. EXCO has made progress reducing drilling and completion costs, but we still need to reduce cost by an additional 15% to 20%. This is our number one objective and we will require lean manufacturing practices across the portfolio.
• EXCO’s corporate G&A is simply too high for its drilling program. EXCO needs to book NPV from drilling of about 5X its corporate overhead. Today, NPV accretion is about equal to annual G&A. To fix this, we need to improve both sides of the equation, reducing G&A and increasing the amount of NPV generated by drilling.”
If Wilder can execute on survivability and value creation through operational efficiencies, EXCO could be well-positioned to capitalize on the current commodity cycle – and yield significant gains for risk-tolerant investors when forward gas & oil price decks move higher.”
Editor’s Note: David Phillips has more than 25 years’ experience on Wall Street. He sifts through SEC filings for his blog 10Q Detective, looking for financial statement soft spots, such as depreciation policies, warranty reserves and restructuring charges. His blogs can be read at http://10qdetective.blogspot.com.
• ALL Stock Warrants Trading
• ALL Industries and Sectors
• United States and Canada
Dudley Pierce Baker’sCommonStockWarrants.com
Access Our Exclusive Warrant Database
15
ResouRce stocks: Gold, silveR & oil & Gas shaRes
NATES NOTESP.O. Box 667, Healdsburg, CA 95448. Monthly, 1 year, $289. www.NotWallStreet.com.
Expects dramatic uptick in commodity prices, two ETFs to buy
Nate Pile: “While it is too early to call the downtrend a thing of the past, I do take some comfort in the fact that the shares of both PowerShares DB Agriculture (DBA) and PowerShares DB Commodities (DBC) seem to have found at least a bit of traction after stumbling so badly in the first quarter of 2015. I continue to believe that, at some point, we are going to see a dramatic uptick in commodity prices.
To be sure, there are a lot of variables at play, and it is way too early to close-up shop and declare the
case closed when it comes to all the money that has been printed by central banks around the world over the past several years. You may want to make sure you own at least a small position in both of these ETFs ahead of time, just to make it easier to pull the trigger when the time comes to start “averaging up.” With very little sense of urgency for the time being, DBC is a buy under $19. DBA remains a buy under $24.”
Editor’s Note: Nate’s Notes returns since 10/31/97 (as of 5/8/15) for the Aggressive Portfolio is +5,291%, Model Portfolio +1,620% vs Nadaq +214% and the DJIA return of +146% for the same period. Note that past performance is not necessarily indicative of future performance. Nate’s Notes has been ranked #1 by The Hulbert Financial Digest for 10-year performance (through April 2015).
Puma Resumes Drilling at Turgeon Copper-Zinc Project in New Brunswick Puma Exploration (TSX.V: PUM) has just started a 1,500 meters drill program at its 100% owned Turgeon Copper-Zinc VMS deposit in northern New Brunswick. The drill program is
designed to define the extents of the new high grade Zinc massive sulphide lens grading 10% Zn over 2.7 meters intersected during the last drilling operation and to validate the VMS model with the discovery of higher grade Copper Stockworks. The recent successful drill program included the discovery of high grade Zinc massive sulphide zone grading 5.66% Zn, 0.38% Cu and 2.3 g/t Ag over 6.8 metres starting downhole at 219.1 meters and includes 10.05% Zn and 0.23% Cu over 2.7 metres within a 292 metre intercept of an anomalous zinc mineralization halo that grades 0.32% Zn (Drill Hole FT14-05). All the 2014 holes intersected mineralized volcanics with intense hydrothermal alteration. In drillhole FT14-05 a 115 meter intersection of hydrothermally altered rock was intercepted between 188 and 303 meters, grading 0.53% Zn and 0.10% Cu, including 1.13% Zn and 0.10% Cu over 44.1 meters. Drillholes FT14-01, FT14-02 and FT14-03 each intercepted copper stockwork horizons 100 meters northeast of the new Dragon zone and 75 meters southwest of the Powerline and Zinc Zones. The mineralization presents itself in the form of chalcopyrite veinlets within chloritized basalt host rock. This type of mineralization is common to VMS deposits and may indicate a feeder zone that is spatially related with the deposition of massive sulphide horizons. “The main objec-tive of the current program is to discover additional higher grade Cu-Zn mineralization associated with the typical VMS geological model in the Dragon Zone area, in particular, Cpy Stockwork mineralization over significant thickness which could be related with the recently discovered massive sul-phide intercepts and proving-up the presence of entire new VMS system.’’ notes Marcel Robillard, President of Puma Exploration. The Turgeon project remains a priority based on recent exploration results and the outstanding regional location with an infrastructure framework which includes the deep water port and smelter of Belledune located 5km away. The property is accessible by road all year round and is intersected by the main powerline grid.
PUMA EXPLORATIONTSX.V: PUM
OTCBB: PUXPF
Contact: Marcel Robillard, President
212, Avenue de la Cathédrale Rimouski (Québec) Canada G5L 5J2
Phone: (418) 724-0901
Toll-free: (800) 321-8564
www.pumaexploration.com
16
ResouRce stocks: Gold, silveR & oil & Gas shaRes
THE MORGAN REPORT21307 Buckeye Lake Ln., Colbert, WA 99005. Basic Membership: 1 year, 12 issues, $129.99. Basic Plus: $269.99. Includes Market Timing Updates, Alerts. www.silver-investor.com.
Watch the Gold/Silver ratioDavid Morgan: “The gold/silver ratio is quite
high at about 74 to 1. Those inclined might consider swapping gold for silver any time the ratio is above 72. This “trade” takes patience but usually is worth the time involved. This can be done in the physical world taking coins and swapping with your dealer or it can be done with futures, options, or ETF’s. The ratio has been as low as 35 when silver peaked near 50 at the end of April 2011 and because we think the market is ready to turn probably by fall it is a trade/swap that demands some attention.”
Canadian Zinc: A Stealth Silver Play
Chris Marchese: “Canadian Zinc is arguably the next best way to play the zinc and silver stories, as it has one of the best undeveloped zinc-lead-silver mines existing today.
Canadian Zinc’s principal asset, Prairie Creek, is one of the highest-grade undeveloped zinc deposits in the world. This is in part because of the high-grade nature of not only zinc but of lead and silver also. Furthermore, the metallurgy is also good at 75% Zn, 88% Pb, and 92% Ag, per the 2012 preliminary feasibility study. This translates into a base scenario of average annual production of 76m lbs. zinc, 90m lbs. lead, and 2.2m oz. silver. There is also the potential of producing a third type of concentrate, along with zinc sulphide concentrate and lead sulphide and oxide concentrate.
There is material production upside, as zinc oxide isn’t considered saleable but the company will conduct various studies to see whether it can be recovered. There is also the potential for producing high-grade copper-silver concentrate. Lastly, there is the potential and a reasonable likelihood to expand mine and milling capacity in excess of current design capacity at 1,350 tpd (1,000 mill capacity) at some point in time. A dense media separation (“DMS” 85 tph capacity) will be installed into the crushing circuit. This will reject a projected average of 27% of the waste and allow for a maximum of 1,350 tpd through the DMS plant and after passing through will produce 1,000 tpd that will be processed the grinding/flotation circuit.
Prairie Creek is fully permitted. The last remaining hurdle being financing of roughly $90m-$120m excluding the likelihood of a streaming agreement with Sandstorm Gold and an off-take agreement, which should bring in something in the neighborhood of $70m to $100m. This is the same mine the Hunt Brothers tried to bring into production.”
Editor’s Note: We highly recommend The Silver Manifesto written by David Morgan and Chris Marchese which may be the most important “hard money” book to be published in quite some time.
Fortunes have been made by those who bought silver around the $5.00 level and paid attention to the call of the top at over $48.00 by David Morgan. Yet the big money lies ahead, according
to the authors, as perhaps as much as 90 percent of the move occurs within the last 10 percent of the time.
Past performance does not guarantee future results, yet in the last bull market, silver gained over 800 percent from January 1979 to January 1980, dwarfing the gains made from 1964 to 1979.
There are factors that produce im-mense profits and these occur rarely. Investors stand at a unique point in monetary history where the death of pa-per currencies on a global scale is taking place before their eyes. Because most are frozen into inside-the-box thinking, few investors will ride the next move as silver (and gold) skyrocket in the years ahead.
In fact the primary purpose of this book is to educate the reader as to why there is no way out of the financial morass by the political class or the financial elite. We have reached the point where the savvy few understand what is happening and take action, while the rest are left watching, thinking the precious metals bull market was long dead.
Silver as money throughout history and the U.S. being founded on a silver standard.
The authors explore when to expect the next bull market to begin and why
How the 2008 financial crisis has been “papered over” and what to watch
for going forward.Is it possible there won’t be enough silver available for
investment demand as industrial users scramble to hoard what they need to stay in business?
The real supply and demand looking at both industrial and monetary demand.
Money and Banking – what fractional reserve banking means to currency and bullion.
The best surest method to stay in the profit zone and not worry about the wild price swings.
How to pick a mining company – this information is priceless. Most who are taught this methodology have a degree in finance, but we break it down for the average investor.
The silver manipulation story – the facts, more facts, and the irrefutable facts.
The biggest concern of all investors: The Debt Bomb! We’ve never seen anything like the dire situation we now face, say the authors.
Readers can order a copy of The Silver Manifesto for $29.99 from Amazon.com. Orders from Canada, United Kingdom and Australia will be processed directly from The Morgan Report for $29.99 + $19.75 S&H (Canada) (+26.85 S&H Australia) at 480-325-0230 or www.thesilvermanifesto.com.

17
Key components of global silver demand rose in 2014, with global silver jewelry demand posting a new record last year and silverware offtake rising to its highest level since 2006. This was coupled with notable growth in key silver industrial end uses, including ethylene oxide, photovoltaics, and brazing and alloys, according to World Silver Survey 2015, released by the Silver Institute. Gains in supply from mine production and producer hedging were partially offset by a continued decline in scrap supply.
Silver Fabrication DemandTotal silver physical demand stood at 1.07 billion
ounces last year, the fourth highest level recorded since 1990, but a 4 percent decline from the 2013 total. A main factor in the decrease in physical demand was a fall in coin and bar demand from 2013, which had been a record year.
The largest component of physical silver demand, industrial applications, which accounted for 56 percent of total physical silver demand, was marginally lower by 0.5 percent. On a regional basis, a modest increase in industrial demand in developing countries, led by 4 percent growth in China and Taiwan, was offset by weaker demand in advanced countries in 2014. This marks the fifth consecutive year of Chinese industrial demand growth. Last year’s industrial demand total for Taiwan was 23 percent above their 2009 figure.
Silver demand for photovoltaic applications rose 7 percent in 2014 while silver demand for ethylene oxide (EO) grew 6 percent. On the latter, GFMS estimates that 128.6 million ounces (Moz) of silver resided in EO plants around the word at year-end, equivalent to 15 percent of last year’s total mine production. Additionally, brazing alloy and soldering demand increased by 3 Moz in 2014. Photography demand slid by 5 percent in 2014, experiencing its slowest pace of decline since 1999.
Globally, silver jewelry fabrication had a second consecutive year of growth, increasing 1.5 percent to achieve a new record.
This was a reflection of high levels of restocking and a strong performance from India, which surged 47 percent from 2013 levels. Gains were also noted in Europe, up 9.3 percent, and North America, up 2.2 percent. Total silverware fabrication rose 3 percent to levels not seen since 2006, primarily due to a 20 percent increase in demand from the Indian Subcontinent.
Silver Investment & PriceIn 2014, silver coin and bar purchases remained at
historically high levels, primarily due to growth in silver coin demand in several key markets. Growth was experienced in the United States, Canada, India and Spain. Silver coins and medals demand was 107.6 Moz last year.
Holdings by silver-backed exchange traded funds remained sturdy, growing by 1.4 Moz, to record their
Key Components of GlobalSilver Demand Rose in 2014
highest year-end level at 636 Moz. In contrast, gold ETF holdings ended 2014 at 53.1 Moz, 8.8 percent lower than their year-end 2013.
Identifiable investment demand, which includes physical bar investment, coins and medals and exchange traded funds (ETF) inventories, stood at 197.4 Moz last year. Demand for physical bullion bars reached 88.4 Moz. India experienced a 4 percent growth in silver bar demand last year, but that was countered by losses in the United States, China and Europe when compared to the prior year.
A combination of a slowdown in Chinese growth, a move away from commodities as an asset class, a stronger U.S. dollar, and a challenging year for most precious metals in general, led to a lower average annual silver price at $19.08 for 2014.
Silver SupplySilver mine production grew by 5.0 percent to
reach 877.5 Moz. This growth is attributable to stronger output from the primary silver and copper sectors, new projects that came online last year and significant production gains in Central and South America. Primary silver mine production grew 8 percent, and accounted for 31 percent of global silver mine supply. Mexico was the world’s leading silver producer, followed by Peru, China, Australia and Chile. Primary silver mine cash costs dropped 16 percent to US$7.74 an ounce, while the producer silver hedge book grew by 15.8 Moz in 2014.
Government sales of silver were essentially nonexistent last year. Scrap supply was down 13 percent at 168.8 Moz, the lowest volume level recorded since 1996 and the third consecutive year of decline. As a proportion of total silver supply, scrap remained just above 15 percent, down from 25 percent in 2011 and 2012.
Editor’s Note: Copies of World Silver Survey 2015 can be purchased for US$225 from the Silver Institute, www.silverinstitute.org.
SilverCrestMines Inc.
www.SilverCrestMines.com
Low Cost ProduCer targeting 4.0-4.4 MiLLion siLver equivaLent ounCes in 2015
Save in Silver & Gold Bullion
Quick Delivery or Insured Storage
Simple. Safe. Secure.www.silver123.net

18
ResouRce stocks: Gold, silveR & oil & Gas shaRes
KITCO NEWS provides up to the minute coverage on the precious metals sector at www.kitco.com.
First quarter gold demand shows important regional, sector strength
Neils Christensen: “The World Gold Council (WGC) continues to see some bright spots in the gold market, despite an overall decline in demand in the first three months of the year.
According to the latest WGC report, looking at first quarter gold trends, world gold demand fell 1% in the first quarter, compared to the first quarter of 2014. The report said that total demand at the start of the year fell to 1,079 tonnes, down from 1,089 tonnes recorded in the previous year.
Juan Carlos Artigas, director of investment research with the WGC, said in an interview with Kitco news that the small decline in gold demand demonstrates that the market is finding some stability, “a stark contract from a few years ago.”
He added that the headline decline is also misleading as it doesn’t recognize important regional and sector trends.
“This contrast between the global picture and the more granular demand data clearly demonstrates the multi-faceted nature of the gold market. The numerous and varying roles that gold plays means it responds to different cues in different ways,” the report said.
Looking at regional demand, India saw a
considerable shift in gold consumption as demand increased 15% compared to the first quarter of 2014. The increase in Indian demand came after the government removed import restrictions at the end of the year.
“I think the upward trend that has been re-established in India is reflective of the economic growth that economists are expecting,” said Artigas.
At the same time, in sector trends, investment demand saw an increase of 4% in the first quarter of 2015, compared to the same time period last year. According to the council’s research, global gold-backed exchange traded funds saw positive net inflows of 26 tonnes, the first positive quarter since the fourth quarter of 2012.
“Anecdotally, I can tell you that I have seen a shift in investor sentiment. People haven’t necessarily turned bullish again, but they are certainly not as bearish as they were,” he said.
While there was renewed interest in the yellow metal in India, another important region, China, saw a 7% decline. However, Artigas added that the decline should be taken into perspective as demand was strong in China at the start of 2014, is skewing the year-over-year comparison.
“If you look at the five-year trend, Chinese demand is still very positive,” he said.
Artigas added that gold investment in China has also had to complete with increased investment flows into a red-hot equity market.
Another bright spot for the gold market is the jewelry sector, especially in the U.S., which saw growth of around 4%. The WGC said that U.S. jewelry demand rose year-over-year for the third consecutive increase.
The report also noted that jewelry demand in the United Kingdom also saw a 4% increase in the first quarter. In India, jewelry demand increased 22% year-over-year in the first quarter.
Artigas added that the council expects to see stronger jewelry and technology demand moving forward as the U.S. economy and the global economy start to expand.
Even in an environment of improving economic health, he said that investment demand should also remain positive this year as investors look to balance the risks in their portfolio, eventually turning back to gold as an important diversification tool.
Finally, looking at official gold purchases, central banks remain net buyers of gold and this trend doesn’t look like it will change soon. The WGC said that net central bank purchases at the start of the year was 119.5 tonnes, “virtually unchanged compared to the same period in 2014.”
“There is still a need from emerging market central banks to diversify their reserves away from the U.S. dollar,” he said.”
Editor’s Note: Kitco.com is one of the world’s most popular precious metals website with its compelling combination of an online precious metals store, live spot prices, expert market commentaries, up-to-the-minute news and usable market information.
Building one of the world’s largest and lowest cost gold mines
www.torexgold.com
Micro/Small-Caps • Buy-Sell Technical • Fundamental Market Timing
www.konlin.com

19
ResouRce stocks: Gold, silveR & oil & Gas shaRes
GUIDING MAST INVESTMENTS10 Forest Ave., Saratoga Springs, NY 12866. Monthly, 1 year, $85. www.GuidingMastInvestments.com.
Oil signaling a consolidation phaseGeorge Fisher: “Oil has made a bit of a rebound,
and may be signaling a consolidation phase. Recent articles by investment-house Bernstein outline a belief that oil will rebound in the second half but will average less than $100 going out 5 years. RBC’s analyst is calling for average $54 oil in 2015, or about where it is currently trading, and $74 next year. If the worst price decline is behind us, the time for nibbling on energy stocks could be getting closer.
The first industry to look at is the capital expenditure sensitive construction segment. Firms like Chicago Bridge and Iron (CBI) and Fluor (FLR) have been beaten down more than their limited exposure to weak oil prices in their respective earnings power. These are solid companies valued at a discount to their growth potential. CBI is discounted by upwards of 20% and FLR by as much as 17%.
While it may take a bit longer for confidence to return to the energy patch, it eventually will and nibbling on top tier, well managed and better capitalized energy companies should prove to be rewarding over the medium term.”
***************
The Peter Dag PORTFOLIO STRATEGY & MAN-AGEMENT, 65 Lakefront Dr., Akron, OH 44319. 1 year, 24 issues, $389. www.peterdag.com.
Gold to trade in a broad rangeGeorge Dagnino: “Our indicators for the stock
market remain bearish. This is a good time to be cautious. Our long-term outlook (next 12 month) is cautiously bullish.
Our near-term technical indicators remain bearish.There is no doubt commodities are showing
signs of strength. They have been declining since 2011 and are finally acting as if they were trying to bottom. This is good news because if the current trend continues and the commodity index rises above the 200dma, the message is the economy is gaining momentum. In this case we should change our investment strategy and move more aggressively into commodity-sensitive stocks. But the trend is not pronounced enough to justify a change in strategy.
Gold has been trying to bottom since last November, thus ending the steady decline started in 2011. Gold is likely to trade in a broad range. The Dollar has been correcting following a superb rise.”
GoldStockNews.com
Top Gold Stock Picks, Live Charts, News, Area Plays
TheResourceInvestor.com
Precious Metals Trends, Gold,
Silver, Uranium, Oil & Gas
1,450-acre Land Development PotentialConvert Estate Home
to Resort/Retreat
9,000’ lake front – 28-room two-storey mansionPigeon Lake, ON, Canada
(two hours from Toronto)
www.sandypointestate.com
(416) 525-1558
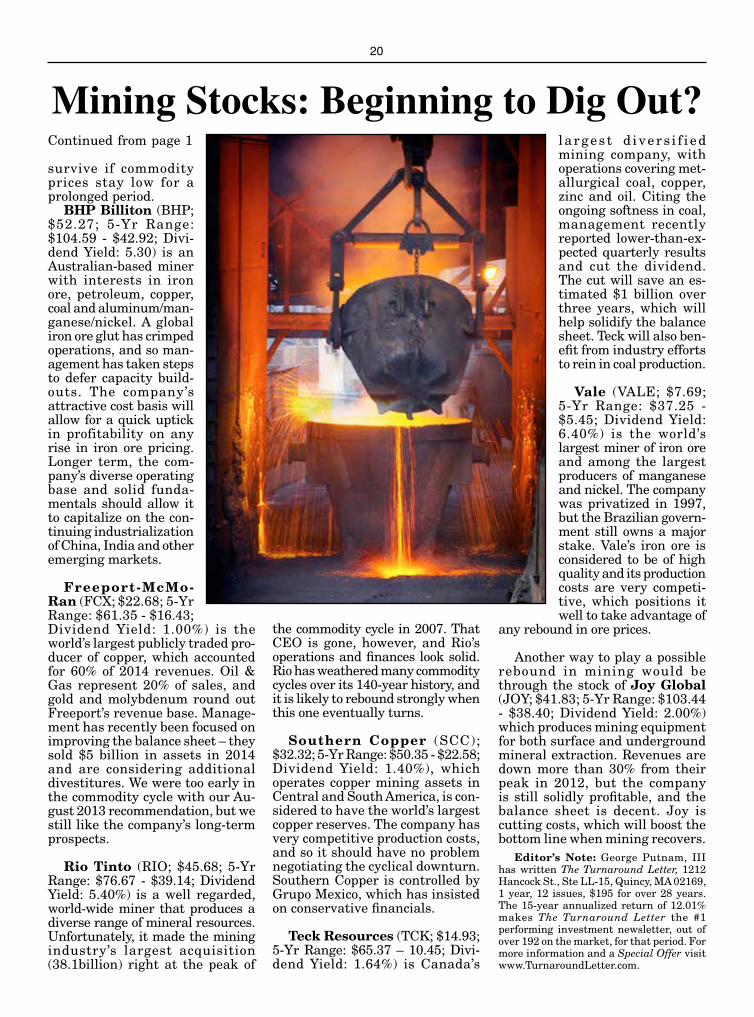
20
Mining Stocks: Beginning to Dig Out?Continued from page 1
survive if commodity prices stay low for a prolonged period.
BHP Billiton (BHP; $52.27; 5-Yr Range: $104.59 - $42.92; Divi-dend Yield: 5.30) is an Australian-based miner with interests in iron ore, petroleum, copper, coal and aluminum/man-ganese/nickel. A global iron ore glut has crimped operations, and so man-agement has taken steps to defer capacity build-outs. The company’s attractive cost basis will allow for a quick uptick in profitability on any rise in iron ore pricing. Longer term, the com-pany’s diverse operating base and solid funda-mentals should allow it to capitalize on the con-tinuing industrialization of China, India and other emerging markets.
Freeport-McMo-
Ran (FCX; $22.68; 5-Yr Range: $61.35 - $16.43; Dividend Yield: 1.00%) is the world’s largest publicly traded pro-ducer of copper, which accounted for 60% of 2014 revenues. Oil & Gas represent 20% of sales, and gold and molybdenum round out Freeport’s revenue base. Manage-ment has recently been focused on improving the balance sheet – they sold $5 billion in assets in 2014 and are considering additional divestitures. We were too early in the commodity cycle with our Au-gust 2013 recommendation, but we still like the company’s long-term prospects.
Rio Tinto (RIO; $45.68; 5-Yr Range: $76.67 - $39.14; Dividend Yield: 5.40%) is a well regarded, world-wide miner that produces a diverse range of mineral resources. Unfortunately, it made the mining industry’s largest acquisition (38.1billion) right at the peak of
the commodity cycle in 2007. That CEO is gone, however, and Rio’s operations and finances look solid. Rio has weathered many commodity cycles over its 140-year history, and it is likely to rebound strongly when this one eventually turns.
Southern Copper (SCC); $32.32; 5-Yr Range: $50.35 - $22.58; Dividend Yield: 1.40%), which operates copper mining assets in Central and South America, is con-sidered to have the world’s largest copper reserves. The company has very competitive production costs, and so it should have no problem negotiating the cyclical downturn. Southern Copper is controlled by Grupo Mexico, which has insisted on conservative financials.
Teck Resources (TCK; $14.93; 5-Yr Range: $65.37 – 10.45; Divi-dend Yield: 1.64%) is Canada’s
l a rges t d ivers i f i ed mining company, with operations covering met-allurgical coal, copper, zinc and oil. Citing the ongoing softness in coal, management recently reported lower-than-ex-pected quarterly results and cut the dividend. The cut will save an es-timated $1 billion over three years, which will help solidify the balance sheet. Teck will also ben-efit from industry efforts to rein in coal production.
Vale (VALE; $7.69; 5-Yr Range: $37.25 - $5.45; Dividend Yield: 6.40%) is the world’s largest miner of iron ore and among the largest producers of manganese and nickel. The company was privatized in 1997, but the Brazilian govern-ment still owns a major stake. Vale’s iron ore is considered to be of high quality and its production costs are very competi-tive, which positions it well to take advantage of
any rebound in ore prices.
Another way to play a possible rebound in mining would be through the stock of Joy Global (JOY; $41.83; 5-Yr Range: $103.44 - $38.40; Dividend Yield: 2.00%) which produces mining equipment for both surface and underground mineral extraction. Revenues are down more than 30% from their peak in 2012, but the company is still solidly profitable, and the balance sheet is decent. Joy is cutting costs, which will boost the bottom line when mining recovers.
Editor’s Note: George Putnam, III has written The Turnaround Letter, 1212 Hancock St., Ste LL-15, Quincy, MA 02169, 1 year, 12 issues, $195 for over 28 years. The 15-year annualized return of 12.01% makes The Turnaround Letter the #1 performing investment newsletter, out of over 192 on the market, for that period. For more information and a Special Offer visit www.TurnaroundLetter.com.

TO EXHIBIT: Call 800/822-1134
1 6 - 1 8J U L Y2 0 1 5SAN FRANCISCO
M A R R I O T T M A R Q U I S H O T E L
Attend and Take Home Over 100 Specific Stock and Income-Producing Recommendations Set to Outperform the Markets...
CASH
BONDS
INT’LLARGE CAP
MID CAP
SMALL CAP
Get 2 FREESPECIAL REPORTS
EASY TO REGISTER FREE AT www.SanFranciscoMoneyShow.com
or Call 800/970-4355 Today! Mention Priority Code 038962
Platinum Sponsor Silver Sponsor Event Sponsors Media Partner
Tim Plaehn
Mark Skousen
Jimmy Mengel
Jon Markman
Bryan Perry
Marilyn Cohen
Alex Koyfman
Nick Hodge
Chris Versace
Harry Domash
value$158

In Print And Online
In Print And Online
800-336-2855 • TheBullandBear.com
T h e B u l l & B e a r F i n a n c i a l r e p o r T
The Bull & Bear’s Investor Relations Programs…
Extend your shareholder base, build trading volume and increase awareness in the investment community.
The Bull & Bear Financial Report • P.O. Box 917179, Longwood, Florida 32791 • IR@TheB ullandBear.com


![scan0008 - [Mrs. Carlson's Third Grade]mrscarlsonsthirdgrade.weebly.com/uploads/1/6/8/1/... · When swimming, a polar bear's front legs do this. When swimming, a polar bear's back](https://static.fdocuments.in/doc/165x107/5f04dec97e708231d4101f61/scan0008-mrs-carlsons-third-gradem-when-swimming-a-polar-bears-front-legs.jpg)