Resources/EDWP_User_Fees.pdf - World Banksiteresources.worldbank.org/EDUCATION/Resources/... · 8...
133
Transcript of Resources/EDWP_User_Fees.pdf - World Banksiteresources.worldbank.org/EDUCATION/Resources/... · 8...

Implementation of Free Basic Education Policy
Raja Bentaouet Kattan

2
The Education Working Paper Series is produced by the Education Unit at the World Bank
(HDNED). It provides an avenue for World Bank staff to publish and disseminate preliminary
education findings to encourage discussion and exchange ideas within the World Bank and
among the broader development community. Papers in this series are not formal World Bank
publications. The findings, interpretations, and conclusions expressed in these papers are
entirely those of the authors and should not be attributed in any manner to the World Bank, its
affiliated organizations or to the members of its board of executive directors or the countries they
represent.
Copies of this publication may be obtained in hard copy through the Education Advisory
Service ([email protected]), and electronically through the World Bank Education
website (www.worldbank.org/education).
Copyright © The World Bank
December 2006
Washington, D.C. – U.S.A.

3
Contents Acknowledgements....................................................................................................................5 Executive Summary ..................................................................................................................6 Introduction.............................................................................................................................12 I. Barriers to Education .....................................................................................................14 II. Prevalence of User Fees: Results of 2005 Survey ..........................................................20 III. Providing Free Education: Eliminating User Fees........................................................28 IV. Lessons Learned: Achievements and Challenges ..........................................................34 V. Conclusion and Recommendations ................................................................................45 Bibliography ............................................................................................................................58 Annexes Annex 1: Country Profiles: Experiences with User Fee Policies ...............................................65
Cambodia..................................................................................................................65 Cameroon .................................................................................................................67 China ........................................................................................................................69 Kenya .......................................................................................................................71 Lesotho .....................................................................................................................74 Malawi......................................................................................................................76 Mozambique .............................................................................................................78 Tanzania ...................................................................................................................79 Timor-Leste ..............................................................................................................82 Uganda .....................................................................................................................83 Zambia......................................................................................................................86
Annex 2: Determinants of Enrollment ......................................................................................89 Annex 3: Summary Findings of the 2005 World Bank User Fee Survey...................................91 Annex 4: Survey Results -- Primary Level Matrix ..................................................................106 Annex 5: Survey Results -- Secondary Level Matrix ..............................................................110 Annex 6: Sample Survey Questionnaire .................................................................................115 Annex 7: Detailed Fee Amounts for Selected Countries .........................................................116 Annex 8: School Fees in South Africa: Creating Equity or Perpetuating Disparities?..............119 Annex 9: Offsetting Fees........................................................................................................121 Annex 10: The HIPC Debt Relief Initiative and Education Financing in Africa .......................126 Annex 11. Donor Positions on User Fees.................................................................................128 Annex 12: Analytical Framework for thinking about User Fees...............................................131

4
Tables Table 1: Results of 2005 World Bank User Fee Survey for Primary School................................7 Table 2: Results of World Bank User Fee Survey for Secondary Education................................8 Table 3: Increases in the Gross Enrollment Rate of Selected Countries After Fee Elimination....8 Table 4: Results of World Bank User Fee Survey for Primary School ......................................21 Table 5: Regional Comparisons of Fees at the Primary Level ...................................................23 Table 6: Results of World Bank User Fee Survey for Secondary Education..............................24 Table 7: Regional Comparisons of Fees at the Lower Secondary Level ....................................25 Table 8: Increases in the Gross Enrollment Rate of Selected Countries After Fee Elimination..29 Figures Figure 1: Household Expenditure on Public Schooling per Student (USD) as a percentage of
GNI per capita ..........................................................................................................17 Figure 2: School Fees as a Percentage of Final Household Consumption..................................18 Figure 3: Percentage of Countries with Primary School fees, 2001-2005 ..................................27 Figure 4: Evidence of Improved Equity in Uganda ...................................................................35 Figure 5: Lesotho Primary Enrollment 1998 to 2003 ................................................................46 Figure 6: Public Education Expenditure and School Completion ..............................................52 Boxes Box 1: Financing Education in the Democratic Republic of Congo...........................................16 Box 2: EDUCO-Impact of Parental Participation on Schooling ................................................32 Box 3: HIV/AIDS Orphans and Education ...............................................................................36 Box 4. Unofficial Fees and Decentralization in Ghana..............................................................41 Box 5: Household Financing in Vietnam. .................................................................................42 Box 6: The Mexican Experience with a Conditional Cash Transfer Program............................49 Box 7: The Education for All Fast Track Initiative ...................................................................53

5
Acknowledgements Data for this report is based on a World Bank survey of ninety-three countries that was
conducted between April and June of 2005.1 An initial draft of the paper was reviewed and
disseminated at several School Fee Abolition Initiative (SFAI) meetings, including the
Partnership Meeting in New York City (January 2006) and in Nairobi (April 2006). The purpose
of this Working Paper is to make the survey data and findings more widely available to
policymakers and development practitioners. This report also draws on other relevant data and
reports in order to present a more complete picture of current achievements and challenges in the
implementation of free basic education policies.
This work would not have been possible without the input of the World Bank education
task team leaders and sector managers, and the support of Eduardo Velez Bustillo (LCSHE),
Donald Bundy (HDNED), Robin Horn (HDNED), Ruth Kagia (Sector Director HDNED), Jamil
Salmi (HDNED), and Jean Louis Sarbib (HDNVP), who allocated staff time and resources to
make this study possible. This study has benefited from the contributions provided by Heather
Marie Layton, and Carrie Hubbard Willimann, whose relentless pursuit of country data provided
basic information for the study. This study has also benefited from comments and feedback from
a wide range of people. Key among them were World Bank staff Robert Prouty (HDNED), who
provided overall guidance, Xianon Cao (WBIHD), Michael Mills (AFTHD), Katie Nesmith
(EASHD), and Jee Peng Tan (AFTHD).
Also acknowledged here is the valuable contribution of external reviewers. Key among
them were Dina Craissati and Cream Wright (UNICEF); Sally Gear and Rose Kanwar (DFID);
and Tracy Burnette, Kristi Fair, and Patrick Collins (USAID). The work was supported by
World Bank colleagues in the Education Advisory Service (EAS), Veronica Grigera and Hana
Yoshimoto, Saida Mamedova (EDSTATS), and Long Quach (HDNED), who provided
invaluable help with desk-top editing.
1 Data was collected from World Bank task team leaders in 2005, and may not reflect the most recent changes in policy and practice at the country level.
6
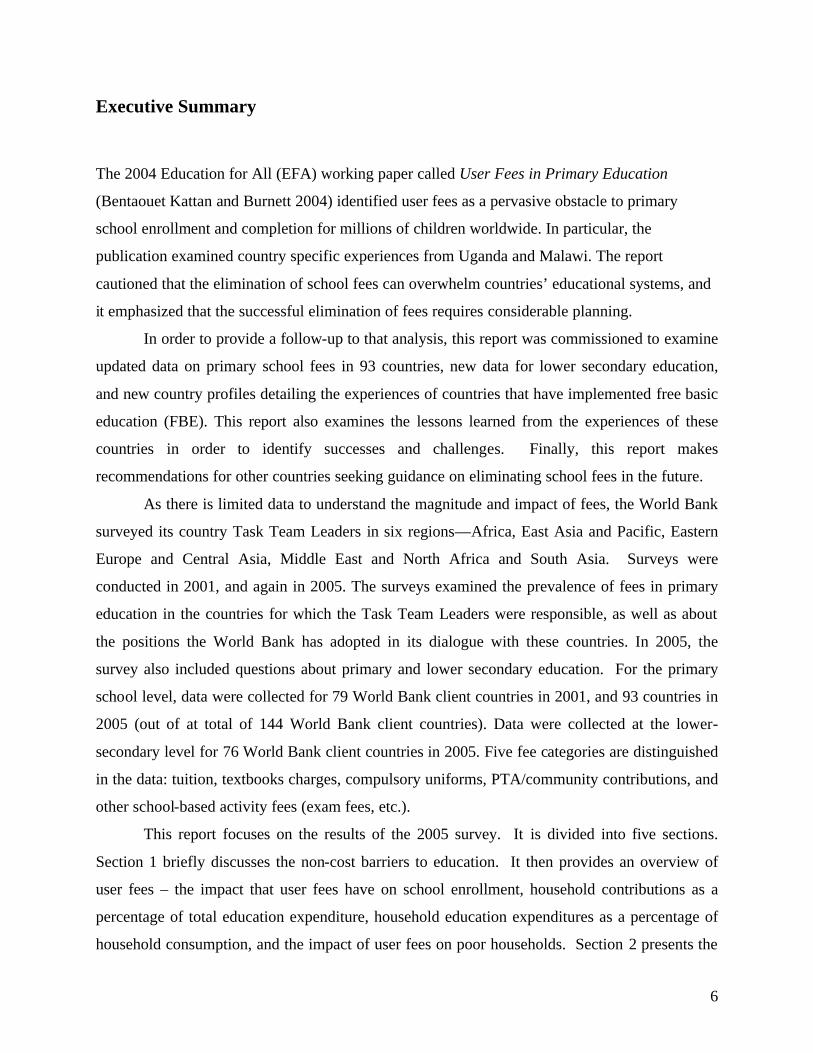
Executive Summary
The 2004 Education for All (EFA) working paper called User Fees in Primary Education
(Bentaouet Kattan and Burnett 2004) identified user fees as a pervasive obstacle to primary
school enrollment and completion for millions of children worldwide. In particular, the
publication examined country specific experiences from Uganda and Malawi. The report
cautioned that the elimination of school fees can overwhelm countries’ educational systems, and
it emphasized that the successful elimination of fees requires considerable planning.
In order to provide a follow-up to that analysis, this report was commissioned to examine
updated data on primary school fees in 93 countries, new data for lower secondary education,
and new country profiles detailing the experiences of countries that have implemented free basic
education (FBE). This report also examines the lessons learned from the experiences of these
countries in order to identify successes and challenges. Finally, this report makes
recommendations for other countries seeking guidance on eliminating school fees in the future.
As there is limited data to understand the magnitude and impact of fees, the World Bank
surveyed its country Task Team Leaders in six regions—Africa, East Asia and Pacific, Eastern
Europe and Central Asia, Middle East and North Africa and South Asia. Surveys were
conducted in 2001, and again in 2005. The surveys examined the prevalence of fees in primary
education in the countries for which the Task Team Leaders were responsible, as well as about
the positions the World Bank has adopted in its dialogue with these countries. In 2005, the
survey also included questions about primary and lower secondary education. For the primary
school level, data were collected for 79 World Bank client countries in 2001, and 93 countries in
2005 (out of at total of 144 World Bank client countries). Data were collected at the lower-
secondary level for 76 World Bank client countries in 2005. Five fee categories are distinguished
in the data: tuition, textbooks charges, compulsory uniforms, PTA/community contributions, and
other school-based activity fees (exam fees, etc.).
This report focuses on the results of the 2005 survey. It is divided into five sections.
Section 1 briefly discusses the non-cost barriers to education. It then provides an overview of
user fees – the impact that user fees have on school enrollment, household contributions as a
percentage of total education expenditure, household education expenditures as a percentage of
household consumption, and the impact of user fees on poor households. Section 2 presents the

7
results of the 2005 World Bank survey on user fees. Section 3 draws on the experiences of eight
African and three Asian nations that have eliminated user fees, in order to highlight the successes
and challenges of implementing such policies. Section 4 provides observations on the lessons
learned, and section 5 concludes the report and makes recommendations.
Select Findings from the 2005 World Bank Survey on User Fees
1. Primary education
Of the 93 countries surveyed, only 16 countries have no user fees. Countries with no fees are
Bangladesh, Cambodia, Cape Verde, Chile, Costa Rica, Guatemala, Iraq, Nepal, Peru, Senegal,
Sri Lanka, St. Kitts and Nevis, Tanzania, The Gambia, Tunisia, and Zambia. Tuition and
textbooks fees are collected in 24 countries, and 33 countries collect fees for mandatory uniforms
(see Table 1). PTA fees are the most commonly collected type of fee, followed by fees for other
school-based activities, uniforms, tuition, and textbooks.
Table 1: Results of 2005 World Bank User Fee Survey for Primary School
Type of Fee Countries
with fees Percentage of Countries in
Survey
Number of these countries that collect
fees unofficially Tuition fees 24 25 7 Textbook charges 24 25 2 Uniform fees 33 35 9 PTA/community contributions 65 69 28 Other school-based activities fees 34 36 15 Source: World Bank Survey 2005 2. Lower secondary education
Of the 76 countries surveyed, tuition fees are collected in 33 countries and textbook fees are
collected in 34 (see Table 2). As in the case of primary education, the two most common fees
collected are PTA/community contributions and other school-based activity fees. These fees are
collected informally. Ten countries have no fees, but do require a community/PTA contribution.
Those countries are Argentina, Azerbaijan, Iran, Jordan, Maldives, Namibia, Panama, Sierra
Leone, Timor-Leste, and Ukraine.

8
Table 2: Results of World Bank User Fee Survey for Secondary Education
Type of Fee Countries
with fees Percentage of
Countries in Survey Number of these
countries that collect fees unofficially
Tuition fees 33 44 2 Textbook charges 34 45 4 Uniform fees 31 41 7 PTA/community contributions 52 69 18
Other school-based activities fees 36 48 12
Source: World Bank Survey 2005 3. Countries that removed fees had substantial increases in enrollment rates (see Table 3).
Uganda increased its enrollment rates by 68 percent and Malawi by 49 percent. When certain
countries removed user fees there was a noticeable pattern of increased funding for education by
governments. For example, the governments of Malawi, Uganda, Cameroon, Zambia, Tanzania,
and Cambodia increased their share of spending on education after eliminating school fees.
Table 3: Increases in the Gross Enrollment Rate of Selected Countries After Fee Elimination Country Year Fees
Eliminated Gross Enrollment Rate Prior to Fee
Elimination
Gross Enrollment Rate After Fee
Elimination
Percent change in enrollment
Malawi 1994 89 (1993) 133 (1994) 49 Uganda 1997 76 (1996) 128 (1997) 68 Cameroon 1999/2000 90 (1999) 106 (2000) 17 Lesotho 2000 108 (1999) 122 (2000) 12 Tanzania 2001 63 (2000) 84 (2002) 33 Zambia 2002 78 (2001) 82 (2002) 5 Kenya 2003 86 (2002) 104 (2003) 21 Timor-Leste 2000 89 (2000) 110 (2001) 23 Cambodia 2001 111 (2000) 123 (2001) 10 Source: World Development Indicators 2004 Notes: Lesotho, Tanzania, and Cambodia implemented fee elimination policies using a phased-in approach, which may be reflected in their lower changes in enrollment rates compared to other countries. Due to data availability, this table presents only a partial list of the countries that have eliminated user fees.
9
4. Removal of user fees has improved equitable access to education-specifically the ability to
reach the poor, girls, orphans, and other disadvantaged groups. Enrollment rates grew quickly
among the poor in Cambodia, Uganda, Malawi, Zambia, and Timor-Leste and girls’ enrollment
rates grew more rapidly in Uganda, Kenya, and Timor-Leste.
Challenges in Eliminating User Fees
Eliminating user fees has resulted in many promising outcomes, but there have been a few
challenges as well. These include the following:
1. Issue of sustainability – How to maintain the gains in enrollment rates and the quality of
the education once there are increased numbers of new students and possible increases in
drop-out and repetition rates.
2. Disparities continue to exist with the gender gap, and there are increases in the equity
gap between urban and rural areas. For example, in Malawi urban students are 20 to 30
percentage points more likely to stay in school than their rural counterparts.
3. School and related fees continue to be collected informally.
4. Tradeoffs in expanding access and improving quality – For example, low-efficiency –
low quality education increases overall costs by increasing the number of years it takes to
complete school.
5. Teacher availability – Recruitment, training, and deployment are still major problems
faced by many countries.
Conclusions and Recommendations for Further Research
The study found that fee abolition alone cannot achieve universal basic education, and
educational reform, issues, and opportunities vary according to country specific circumstances.
Four concluding findings and seven recommendations for further research are listed below:

10
Findings:
1. A phased-in approach reduces the technical challenges of eliminating user fees, and can
reduce the likelihood of recidivism.
2. Other education related household expenses and indirect costs can be greater obstacles
than fees and must be addressed in any policy effort to increase access to education.
3. Targeted interventions are required to offset girls’ opportunity costs of schooling and
cultural norms regarding the education of girls, which often inhibit their enrollment rates.
4. Targeted efforts to ensure schooling for HIV/AIDS orphans and other vulnerable
children (OVC) should be part of any effort to improve access to schooling.
Recommendations for further research:
1. Significant fee obstacles at the lower-secondary level – Fees at the secondary level
tend to be significant and substantially higher than fees at the primary level. Further
research should be undertaken to understand better the prevalence and impact of fees at
this level.
2. Evidence of Decreased Parental Participation – The impact of fee elimination on
parental and community participation is not widely known. A more detailed
understanding of this important issue would be a useful addition to the debate on user
fees.
3. Overage Children – Governments continue to struggle with the issue of overage
children. While this has quality implications for schooling, it also points to the need for
special programs to incorporate these children into the education system and/or ensure
that they have alternative opportunities. An evaluation of these types of programs is
needed to assess their impact for possible scaling up.
4. Socio-political response to fee removal – It would be helpful to have a discussion about
what exactly is happening when governments announce the abolition of certain education
fees.
11
5. More analysis of mitigation strategies – The mitigation strategies mentioned in this
report have largely been successful. A discussion of those strategies that have failed
would also be useful. In addition, it would be useful to carry out cost-benefit analyses of
targeted vs. free education policies.
6. The impact of fees on learning – Examine this possible trade-off in specific country
circumstances.
7. Government effectiveness in delivering education services – Little is actually known
systematically about government effectiveness in delivering primary education; an
important area for future research will be the reliability of government provision of
education.
12
Introduction
At the 1990 Jomtien World Conference on Education for All (EFA), the development
community established the achievement of universal basic education as a top priority. This was
reconfirmed in 2000 at the World Education Forum in Dakar, Senegal, and at the United Nations
Millennium Summit, where 189 nations and the international development community promised
to guarantee universal basic education by 2015. In the ensuing years, only one strategy has
shown significant promise for leap-frogging nations from low enrollment status to high
enrollment status within the narrow time frame remaining until 2015. This strategy is the
abolition of school fees. It has been implemented with varying degrees of success by about 15
countries since 1994, including 13 since 2001.
Achieving the Millennium Development Goals (MDGs) of universal basic education
(UBE) requires that all children enter primary school, complete the cycle, and acquire a set of
basic skills. Although access rates have improved over the last decade, equitable access remains
a problem. Access differs significantly by family income, urban/rural location, and gender. One
key obstacle to achieving the MDG for education is the high cost of education to parents,
especially for the poorest households. User fees remain common in many countries whose
constitutions mandate free education. As countries seek ways to increase access to education,
elimination or reduction of fees is a natural policy to consider. There is continuing demand from
client countries for guidance on implementing free primary education.
In 2001, the World Bank conducted a survey to understand the extent that user fees are
collected for primary education. The results were reported in User Fees in Primary Education
(Bentaouet Kattan and Burnett 2004), which identified user fees as a pervasive obstacle to
primary school enrollment and completion for millions of children around the world. The User
Fees in Primary Education publication examined the experiences of Uganda and Malawi,
highlighted the surges in enrollment that accompanied fee removal, and recognized fee removal
as an important strategy towards achievement of the MDGs for education in many countries.
The report also cautioned that these surges at times threatened to overwhelm countries’
educational systems and emphasized that the successful elimination of fees requires considerable
planning.
13
Between 2001 and 2005 a number of countries have abolished fees, and now it has
become timely to update this analysis. This new report draws on the World Bank 2005 survey,
as well as other relevant data, to present a more comprehensive picture of school fees around the
world. This report includes: (i) updated data on primary school fees in ninety-four countries, (ii)
new data for lower secondary, and (iii) new country profiles detailing the experiences of
countries that have implemented free basic education (FBE) (see Annex 1). The report also
attempts to capture the lessons learned from the experiences of these countries in order to
identify successes and challenges and, ultimately, to provide recommendations for other
countries seeking guidance on eliminating school fees in the future.
This report is divided into five sections. Section 1 briefly discusses the non-cost barriers
to education. It then provides an overview of user fees – the impact that user fees have on school
enrollment, household contributions as a percentage of total education expenditure, household
education expenditures as a percentage of household consumption, and the impact of user fees on
poor households. Section 2 presents the results of the 2005 World Bank survey on user fees.
Section 3 draws on the experiences of eight African and three Asian nations that have eliminated
user fees, in order to highlight the successes and challenges of implementing such policies.
Section 4 provides observations on the lessons learned, and section 5 presents conclusions and
recommendations.
14
I. Barriers to Education
The poor are faced with a long list of obstacles to education. Among the major determinants of
enrollment identified in recent studies are household income, schooling costs, presence or
absence of schools, community involvement, transportation, education quality and relevance,
parental education, having a learning or physical disability, cultural values and norms, and the
opportunity costs of attending school (Boyle et. al. 2002; Deininger 2003; Deolalikar 1997;
Holmes 1999; Patrinos and Siddiqui 1995; UNICEF 2005a) (see Annex 2 for a more detailed
discussion of the determinants of enrollment). Other reasons that parents may not send their
children to school include information failures about the links between education and local job
opportunities, distance to schools, and distance to labor markets (Bentaouet Kattan and Burnett
2004; Hillman and Jenker 2002; Mukudi 2004). For girls, additional factors that contribute to
enrollment rates are the presence of female teachers, the availability of proper features such as
latrines, daycare facilities for younger siblings and water points, the flexibility of the school
calendar, and cultural norms and values regarding girls’ education (Deolalikar 1997; Holmes
1999; Mukudi 2004).
While it is difficult to disaggregate the relative impact of each factor on school
enrollment among the poor, there is a growing body of international evidence that the costs of
education represent a major obstacle to education in the developing world, especially for the
poor, girls, orphans, and other disadvantaged children. The cost of education can be divided into
two distinct groups: direct and indirect costs. User fees are direct costs levied by publicly
provided schools and paid by private households. General discussion of user fees is often
explicitly or implicitly about tuition fees. In practice, however, there are a large number of
different “fees” that private households sometimes have to pay for publicly provided basic
education. These include tuition fees, textbook fees and/or rental payments, compulsory
uniforms, Parent Teacher Association (PTA) dues, and various special fees, such as exam fees,
and community contributions to district education boards.2 Fees can be similar to prices in their
effects on individual behavior, and thus, affect enrollment through both a price and an income
effect. 2 This paper excludes fees that reflect student welfare, such as board and lodging charges at boarding schools, as well as charges for school meals.
15
User fees have a negative impact on school enrollment
A wide body of evidence shows that the costs of schooling inhibit school enrollment. Parents in
Indonesia, China, the Solomon Islands, and many African countries cite user fees as a major
obstacle to enrolling their children in school (Saroso 2005; Yardley 2005; Pacific News 2005).
In 2001, parents and teachers in Tanzania said that non-payment of fees was the principal reason
why children did not attend school (Oxfam 2001). Zambia’s Central Statistics Office estimated
that at least 45 percent of children who drop out of school did so because they could not pay
school fees (Tembo and Ndhlovu 2005).
However, there are few empirical studies of the ways in which user fees impact
enrollment. In Kenya, absenteeism and drop-out rates have been shown to rise and fall in line
with user fees (Mukudi 2004). User fees accounted for 31 percent of the time that children did
not attend school. Before user fees were eliminated, children who did not pay school fees were
often locked out of school or sent home. An econometric analysis of the impacts of Uganda’s
Universal Primary Education (UPE) policy showed that parental income became a less important
determinant of enrollment after school fees were eliminated (Deininger 2003). In 1992, the
proportion of children in Uganda who were not enrolled in school due to costs related to
schooling was estimated at 71 percent. After direct fees were eliminated this figure dropped to
37 percent.
The direct impact of fees on enrollment can be assessed by calculating the price elasticity
of demand for primary education. Estimates in the 1980s showed elasticities on average to be
less than 1 for education at all levels (Jimenez 1987). Additional studies examining household
schooling behaviors have found a negative price elasticity of demand for schooling in Peru, Mali,
Ghana, and India (Gertler and Glewwe 1989; Birdsall and Orivel 1996; Lavy 1996; Sipahimalani
1999). There is also evidence of varying price elasticies by income and gender. Gertler and
Glewwe (1989) found that the price elasticity of demand for the poorest quartile of the rural
population in Peru was two to three times larger than for the highest income quartile. The
expenditure elasticity of primary school enrollment in Kenya is three times greater for low-
income households (.18) than for high-income households (.06) (Deolalikar 1997). Price
elasticity has also been found to be higher for girls than for boys in several countries in Africa,
Asia, and Latin America (World Bank 2001a).
16
Household contributions often constitute a large percentage of total education expenditure.
Households in low-income countries are frequently called on to provide a significant share of
overall education expenditures. Prior to the elimination of school fees in Zambia, parents paid
50 to 75 percent of total primary education spending. User fees constituted more than half of
schools’ income in Uganda before the government eliminated school fees (Deininger 2003).
Households in the Congo serve as the main financing source for the education sector (see Box 1).
Box 1: Financing Education in the Democratic Republic of Congo
Households serve as the main financing source for the education sector in the Democratic Republic of Congo, contributing over 80 percent of total resources. Households pay a variety of charges: a portion of teachers’ salaries, and various school operating expenses, including expenditures on administration, inspection and examinations. The frais de motivation (a contribution to teachers’ salaries) and frais de fonctionnement (contributions to finance school non-personnel operating expenses) are the two most common school charges, the former accounting for as much as half of total teacher income. Based on 2004 data, the average annual per pupil household expenditure ranges from US$29 to US$37 at the primary level. This excludes additional expenditures on textbooks and materials, examination fees, and other miscellaneous charges. An amendment to the Constitution was adopted by the National Assembly declaring primary education be compulsory and free (Article 43). The elimination of fees was scheduled to begin in September 2005; however, the process was stalled due to implementation challenges, including teachers going on strike due to salary concerns. The government is currently developing a plan to project how much money is needed to cover the amount that households have been contributing to the education sector, and to estimate what amount can be financed with limited domestic resources. Specifically, the government is using the Medium Term Expenditure Framework (MTEF), a tool used to adapt Poverty Reduction Strategy Papers (PRSPs) into public expenditure programs within a feasible multi-year macroeconomic and fiscal framework, to identify funding gaps. Source: World Bank 2004a
17
A survey carried out in 2004 found that households in Cambodia finance 56 percent of
total spending on basic education, although this has fallen since 1997 when households paid for
76.9 percent (Bray and Bunly 2005). Despite the fact that the government abolished school fees
in the 1990s households in Malawi continue to bear a considerable share of both the recurrent
and capital costs of primary education. In Malawi, the average household expenditure for public
primary school was nearly 80 percent (World Bank 2004b).
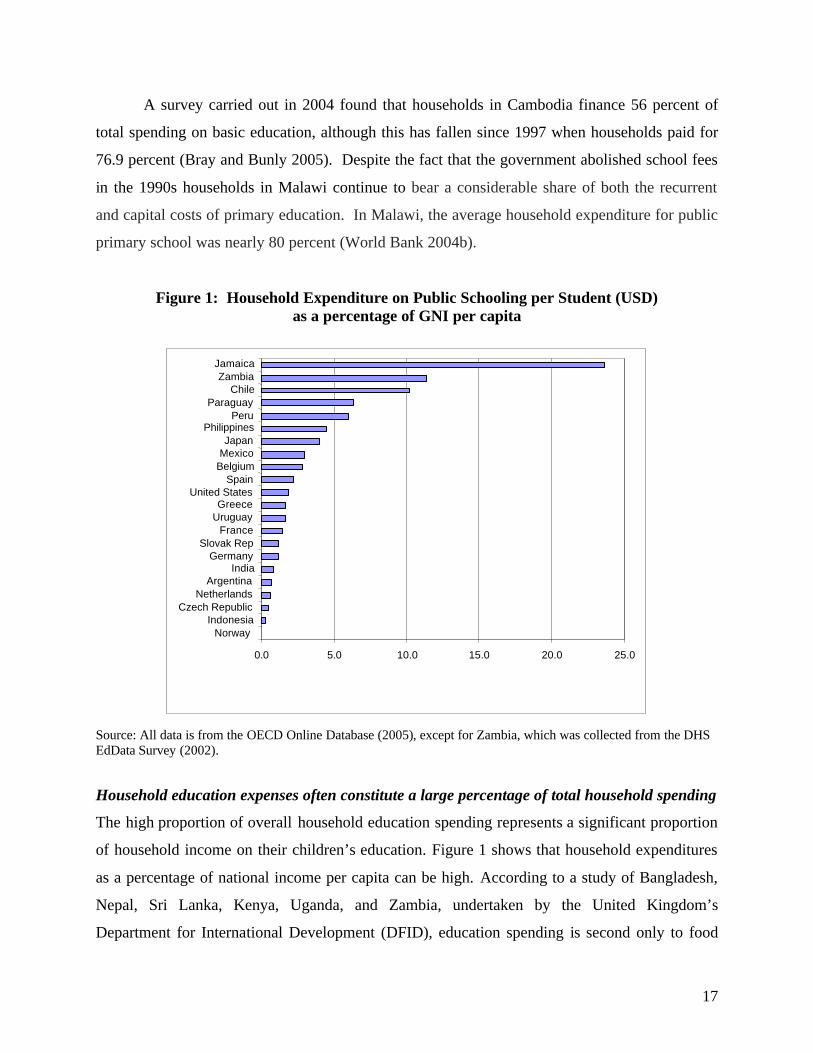
Figure 1: Household Expenditure on Public Schooling per Student (USD) as a percentage of GNI per capita
Source: All data is from the OECD Online Database (2005), except for Zambia, which was collected from the DHS EdData Survey (2002).
Household education expenses often constitute a large percentage of total household spending
The high proportion of overall household education spending represents a significant proportion
of household income on their children’s education. Figure 1 shows that household expenditures
as a percentage of national income per capita can be high. According to a study of Bangladesh,
Nepal, Sri Lanka, Kenya, Uganda, and Zambia, undertaken by the United Kingdom’s
Department for International Development (DFID), education spending is second only to food
0.0 5.0 10.0 15.0 20.0 25.0 Norway
Indonesia Czech Republic
Netherlands Argentina
India Germany
Slovak Rep France
Uruguay Greece
United States Spain
Belgium Mexico Japan
Philippines Peru
Paraguay Chile
Zambia Jamaica

18
0
5
10
15
20
25
Benin
Burkina Faso
Burundi
Cam
eroon
Chad (public schools)
DR
C
Lesotho
Mali
Mauritania
Mozam
bique
Nam
ibia
Rw
anda
Swaziland
China
Indonesia
Philippines
Vietnam
Bulgaria
Rom
ania
Russia
Serbia & M
ontenegro
Tajikistan
Ukraine
Argentina
Bolivia
Ecuador
El Salvador
Guyana
Honduras
Nicargua
Panama
Peru
Egypt
Yem
enexpenditures. Prior to elimination of fees in Uganda and Zambia, households spent 33 percent of
their discretionary expenditure on education (Boyle et. al. 2002). In Bangladesh and Nepal,
households pay 32 and 17 percent, respectively. Households in Cambodia spend 21 percent of
household spending on education (UNESCO 2004). In 1995, during the Indonesian
Administration in Timor-Leste, fees accounted for 13 percent of household spending on public
primary education per capita of the poorest quintile, with charges for PTA accounting for 9
percent, uniforms for 52 percent, textbooks for 16 percent, and other instructional materials for
10 percent of fees paid (World Bank 2002a). Monthly per capita spending in Timor-Leste at that
time was about US$0.82. Figure 2 shows the amount of school fees as a percentage of
household consumption for other countries where data is available.
Figure 2: School Fees as a Percentage of Final Household Consumption
Source: World Bank Survey 2005 and WDI 2000.
User fees represent regressive taxation on the poor
Poor families spend a larger proportion of household income on education than do non-poor
households. On average, the poorest 40 percent of the population in developing countries spends
10 percent of household income on costs for primary school (Oxfam 2001). In 2001, the poorest
20 percent of the population in Malawi paid more in absolute terms than the richer income
groups, with the exception of the wealthiest 20 percent (World Bank 2004b). Field studies
19
undertaken in 2001 in Tanzania, Ghana, and Zambia show that school fees as a percentage of
household income and/or expenditures and also as a percentage of total spending on primary
education was very high (Oxfam 2001).3 In Tanzania, families interviewed indicated that they
paid between US$8 and US$16 per year (the equivalent of one to two months’ agricultural
wages) to send one child to school. Poor families in Ghana can expect to pay one month’s
earnings to send one child to primary school. Parents stated that they often had to make choices
between buying medicines and buying food or sending their children to school. This problem is
not unique to Africa. In the Kyrgyz Republic, for instance, extremely poor households spend 17
percent of their household consumption on education, while non-poor households spend only 13
percent (World Bank 1999).
3 Since 2001, all three countries have eliminated school fees.
20
II. Prevalence of User Fees: Results of 2005 Survey
It has long been difficult to obtain a complete picture of fees in primary education, both in terms
of general prevalence, as well as magnitude and impact. User fees are only sporadically reported
in official school censuses or financial returns from education systems. Household surveys
rarely distinguish among levels of education, between types of expenditures (tuition, books,
uniforms, etc.), or between formal schooling and supplementary private tutoring. Official
statistics do not usually record the number of students receiving private tutoring or the costs of
this tutoring. Few countries compile data on the contribution of fees to the public sector, even
when the fees are commonplace. This is often because these fees have no official standing.
To make up for this lack of data, surveys of World Bank education task team leaders
were conducted in 2001 and again in 2005, enquiring about the prevalence of fees in primary
education in the countries for which they were responsible, as well as about the positions the
World Bank has adopted in its dialogue with these countries. The 2005 survey included
questions about lower secondary education, as well as primary education fees.4 For the primary
school level, data were collected for 79 World Bank client countries in 2001 and 93 countries in
2005 (out of a total of 144 World Bank client countries).5 In 2005, data were collected at the
lower secondary level for 76 World Bank client countries. The 2005 survey data refer to public
schools.6
As in the original 2001 World Bank user fees survey, five fee categories are distinguished
in the 2005 data: tuition, textbooks charges, compulsory uniforms, PTA/community
contributions, and other school-based activity fees (exam fees, etc.). Annex 3 summarizes the
overall results of the 2005 survey. Annexes 4 and 5 present the country-by-country results, and
Annex 6 is an example of the questionnaire sent to World Bank task team leaders.
4For the full 2001 survey, see Bentaouet Kattan and Burnett (2004). 5 The following World Bank regions achieved a 75 percent response rate or above: South Asia (100 percent), and Middle East and North Africa (76 percent). The following regions achieved at least a 50 percent response rate: Africa (72 percent) and Latin America Caribbean (61 percent). Europe and Central Asia achieved a 34 percent response rate. In all regions, the 2005 response rate was greater than the 2001 response rate. 6 Although the majority of students in Haiti attend private schools, the survey does include information for that country.

21
A. Fees at the Primary Level
Prevalence of Fees at the Primary Level
The 2005 survey results show that user fees are common at the primary level (see Table 4). Of
the 93 countries surveyed only 16 countries have no fees.7 Five countries have all five types of
fees: the Dominican Republic, Haiti, Honduras, Indonesia, and Vietnam.8 In 62 percent of the
countries surveyed (59 countries), national policy does not address the elimination of fees.
Table 4: Results of World Bank User Fee Survey for Primary School
Type of Fee Countries
with fees Percentage of
Countries in Survey Number of these countries that collect fees unofficially
Tuition fees 24 25 7 Textbook charges 24 25 2 Uniform fees 33 35 9 PTA/community contributions 65 69 28
Other school-based activity fees 34 36 15
Source: World Bank Survey 2005. A total of 93 countries were included in the survey.
Countries generally impose several types of fees. The amounts involved can be quite
significant. In some cases, the fees support core education services such as teachers’ salaries.
For example, until 2005 households in the Democratic Republic of Congo paid a variety of
charges including the frais de motivation (a contribution to teachers’ salaries), which accounted
for as much as half of teacher income (See box 1). Additionally, fees continue to be collected
unofficially (sometimes illegally) in over one-third of the countries in which there is an official
national policy calling for the elimination of fees.
The collection of PTA/community fees is particularly difficult to categorize. It has been
included for purposes of this report as a user fee, although in some cases it may reflect the
willingness of households to voluntarily pay for improved educational quality or as a way to
7 World Bank task team leaders reported that Bangladesh, Cambodia, Cape Verde, Chile, Costa Rica, Guatemala, Iraq, Nepal, Peru, Senegal, Sri Lanka, St. Kitts and Nevis, Tanzania, The Gambia, Tunisia, and Zambia have no fees. 8 The elimination of tuition charges in primary and lower secondary has been an explicit policy objective of the government of Vietnam; however, fees continued to be collected as of 2005.
22
remain involved in the school. PTA/community fees are widely imposed (in 65 of the 93
countries surveyed, or 69 percent), with failure to pay often leading to suspension or expulsion of
the student. These fees may also be increased when other fees, specifically tuition, textbook and
uniform fees, are eliminated. Furthermore, they are generally less well monitored and reported
than other fees, and are the type of fee most likely to persist, even where national policy calls for
the elimination of all fees. In 28 countries (43 percent) they are collected in spite of national
policy to the contrary. As indicated in Table 4, tuition and textbook fees are collected in 24
countries (25 percent). Thirty-three countries collect fees for mandatory uniforms. Other
school-based activity fees are collected in 34 countries.
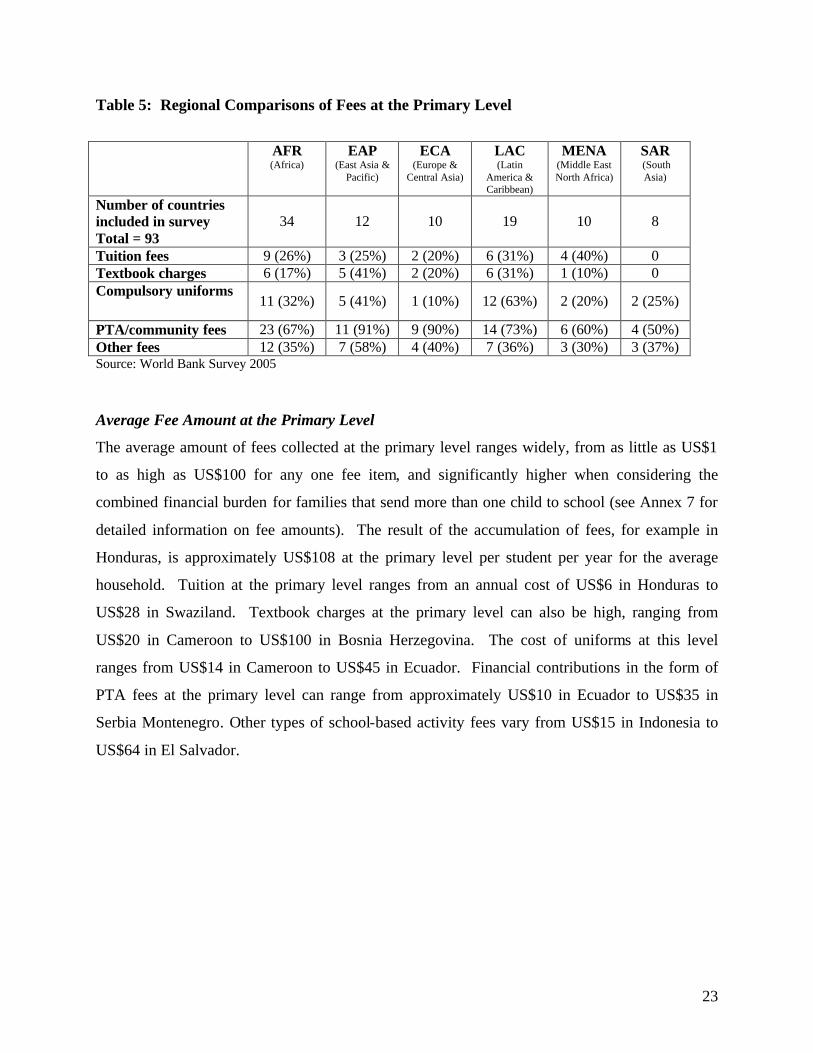
Regional Comparisons of Fees at the Primary Level
Table 5 presents information on primary school fees across regions. PTA fees are the most
commonly collected fee across all regions. In the Africa Region (AFR), PTA dues are the most
commonly collected type of fee, followed by school-based activity fees, uniforms, tuition, and
textbook fees. PTA dues in the East Asia and the Pacific Region (EAP) are the most commonly
collected type of fees, followed by school-based activity fees and tuition. Textbook charges and
compulsory uniforms are the least commonly collected fees in EAP. PTA dues are the most
commonly collected fee in Europe and Central Asia (ECA), followed by school-based activity
fees. The most commonly collected fees in Latin America and the Caribbean (LAC) are also
PTA dues. Countries in the Middle East North Africa Region (MENA) also commonly collect
PTA fees. Textbook and tuition fees were not reported in the South Asia Region (SAR). PTA
dues, followed by school-based activity fees and uniforms were also the most commonly
collected fees in this region. In addition, according to the survey results, fees are still collected
unofficially in 32 percent of the countries that responded in AFR, 58 percent in EAP, 30 percent
in ECA, 36 percent in LAC, and 30 percent in MENA. Survey respondents did not report any
unofficial collection of fees for SAR. See Annex 3 for more detailed survey results.
23
Table 5: Regional Comparisons of Fees at the Primary Level
AFR
(Africa) EAP
(East Asia & Pacific)
ECA (Europe &
Central Asia)
LAC (Latin
America & Caribbean)
MENA (Middle East North Africa)
SAR (South Asia)
Number of countries included in survey Total = 93
34 12 10 19 10 8
Tuition fees 9 (26%) 3 (25%) 2 (20%) 6 (31%) 4 (40%) 0 Textbook charges 6 (17%) 5 (41%) 2 (20%) 6 (31%) 1 (10%) 0 Compulsory uniforms
11 (32%) 5 (41%) 1 (10%) 12 (63%) 2 (20%) 2 (25%)
PTA/community fees 23 (67%) 11 (91%) 9 (90%) 14 (73%) 6 (60%) 4 (50%) Other fees 12 (35%) 7 (58%) 4 (40%) 7 (36%) 3 (30%) 3 (37%) Source: World Bank Survey 2005
Average Fee Amount at the Primary Level
The average amount of fees collected at the primary level ranges widely, from as little as US$1
to as high as US$100 for any one fee item, and significantly higher when considering the
combined financial burden for families that send more than one child to school (see Annex 7 for
detailed information on fee amounts). The result of the accumulation of fees, for example in
Honduras, is approximately US$108 at the primary level per student per year for the average
household. Tuition at the primary level ranges from an annual cost of US$6 in Honduras to
US$28 in Swaziland. Textbook charges at the primary level can also be high, ranging from
US$20 in Cameroon to US$100 in Bosnia Herzegovina. The cost of uniforms at this level
ranges from US$14 in Cameroon to US$45 in Ecuador. Financial contributions in the form of
PTA fees at the primary level can range from approximately US$10 in Ecuador to US$35 in
Serbia Montenegro. Other types of school-based activity fees vary from US$15 in Indonesia to
US$64 in El Salvador.
24
B. Fees at the Lower Secondary Level
Prevalence of Fees at the Lower Secondary Level
There are many issues linked to the transition from primary to lower secondary that are
increasingly relevant and urgent as more students complete primary education and many
countries move toward a definition of basic education that includes lower secondary education.
The issue of school fees is one of the issues impacting the transition to secondary school. Fees at
the lower secondary level tend to be significant, and substantially higher than fees at the primary
level. In general, there are more fees collected at the lower secondary level (in 94 percent of
surveyed countries) than at the primary level (81 percent of countries). In addition, fee levels are
generally significantly higher in lower secondary than at the primary level. For example, the
2001 average annual per pupil household expenditure in Malawi for a student in Standard 1 was
US$7.50, compared to US$35.40 in Standard 6 (World Bank 2004b).
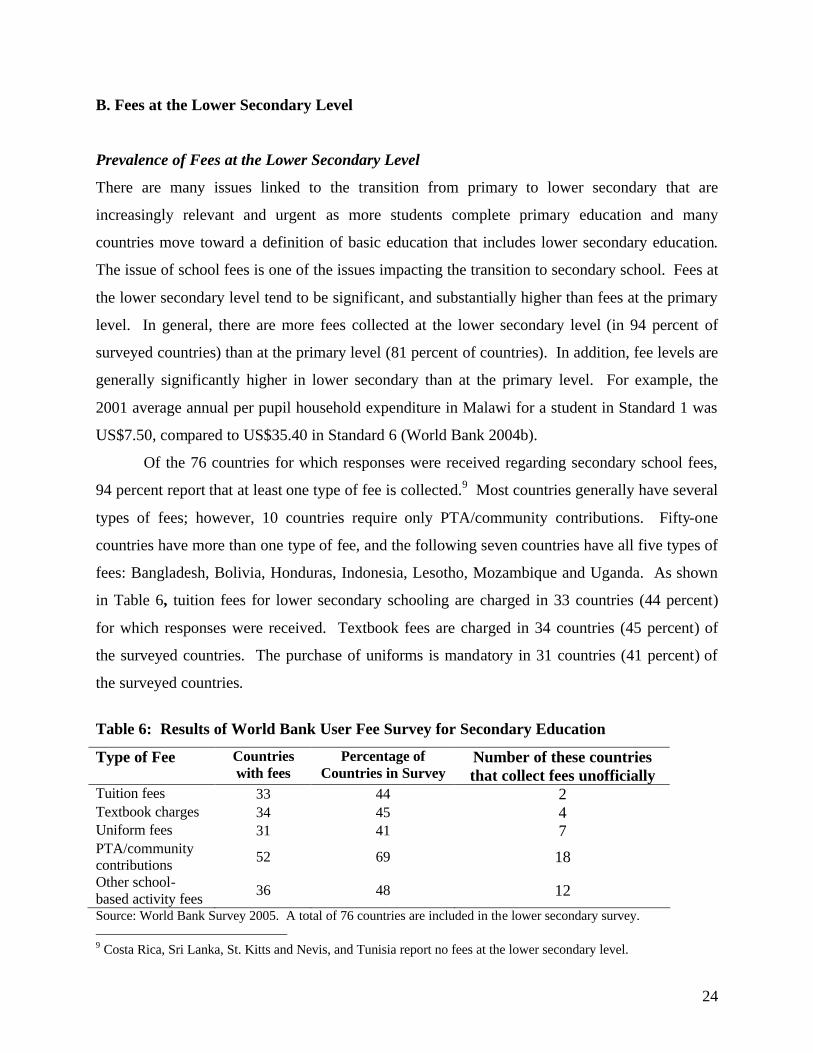
Of the 76 countries for which responses were received regarding secondary school fees,
94 percent report that at least one type of fee is collected.9 Most countries generally have several
types of fees; however, 10 countries require only PTA/community contributions. Fifty-one
countries have more than one type of fee, and the following seven countries have all five types of
fees: Bangladesh, Bolivia, Honduras, Indonesia, Lesotho, Mozambique and Uganda. As shown
in Table 6, tuition fees for lower secondary schooling are charged in 33 countries (44 percent)
for which responses were received. Textbook fees are charged in 34 countries (45 percent) of
the surveyed countries. The purchase of uniforms is mandatory in 31 countries (41 percent) of
the surveyed countries.
Table 6: Results of World Bank User Fee Survey for Secondary Education
Type of Fee Countries with fees
Percentage of Countries in Survey
Number of these countries that collect fees unofficially
Tuition fees 33 44 2 Textbook charges 34 45 4 Uniform fees 31 41 7 PTA/community contributions 52 69 18
Other school-based activity fees 36 48 12
Source: World Bank Survey 2005. A total of 76 countries are included in the lower secondary survey. 9 Costa Rica, Sri Lanka, St. Kitts and Nevis, and Tunisia report no fees at the lower secondary level.

25
As in the case of primary education, the two most common types of fees collected are
PTA/community contributions and other school-based activity fees. Furthermore, these two
types of fees are more likely to be collected unofficially than tuition, uniform, or textbook fees.
Of the 52 countries in which PTA/community contributions are collected, 18 of those do so
unofficially. Similarly, of the 36 countries in which other school-based activity fees are
collected, 12 do so unofficially.
Regional Comparisons of Fees at the Lower Secondary Level
While, overall, PTA/community contributions are the most commonly collected type of fee at the
lower secondary level, this is not true for all regions. Tuition fees are the most commonly
collected in AFR,10 while textbook charges are the most common in SAR.11 In EAP, however,
PTA dues are the most common type of fee, followed by school-based activity fees and textbook
charges. Uniforms and tuition are the two least commonly implemented fees in EAP. In ECA,
PTA dues are most common, followed by textbook charges, school-based activity fees, uniforms,
and tuition. Countries in LAC also collect PTA dues more often than other types of fees, with
textbook charges and uniforms following closely. Tuition is the least common type of fee in
LAC. PTA dues are the most common fee in MENA, followed in decreasing order by tuition
fees, uniforms, textbook charges and other school-based activity fees (see Table 7).
Table 7: Regional Comparisons of Fees at the Lower Secondary Level
AFR
(Africa)
EAP (East Asia &
Pacific)
ECA (Europe &
Central Asia)
LAC (Latin America & Caribbean)
MENA (Middle East North Africa)
SAR (South Asia)
Number of countries responded Total = 76
26 10 8 15 10 7
Tuition fees 18 (69%) 3 (30%) 1 (12%) 4 (26%) 4 (40%) 3 (42%) Textbook charges 10 (38%) 5 (50%) 5 (62%) 8 (53%) 1 (10%) 5 (71%) Compulsory uniforms
12 (46%) 3 (30%) 1 (12%) 8 (53%) 3 (30%) 4 (57%)
PTA/community fees 16 (61%) 9 (90%) 6 (75%) 11 (73%) 6 (60%) 4 (57%) Other school-based activity fees 15 (57%) 7 (70%) 2 (25%) 5 (33%) 1 (10%) 3 (42%)
Source: World Bank Survey 2005
10 Followed by PTA dues, school-based activity fees, uniforms, and textbook charges. 11 Followed by uniforms and PTA dues, then tuition and school-based activity fees.
26
C. Recent Trends
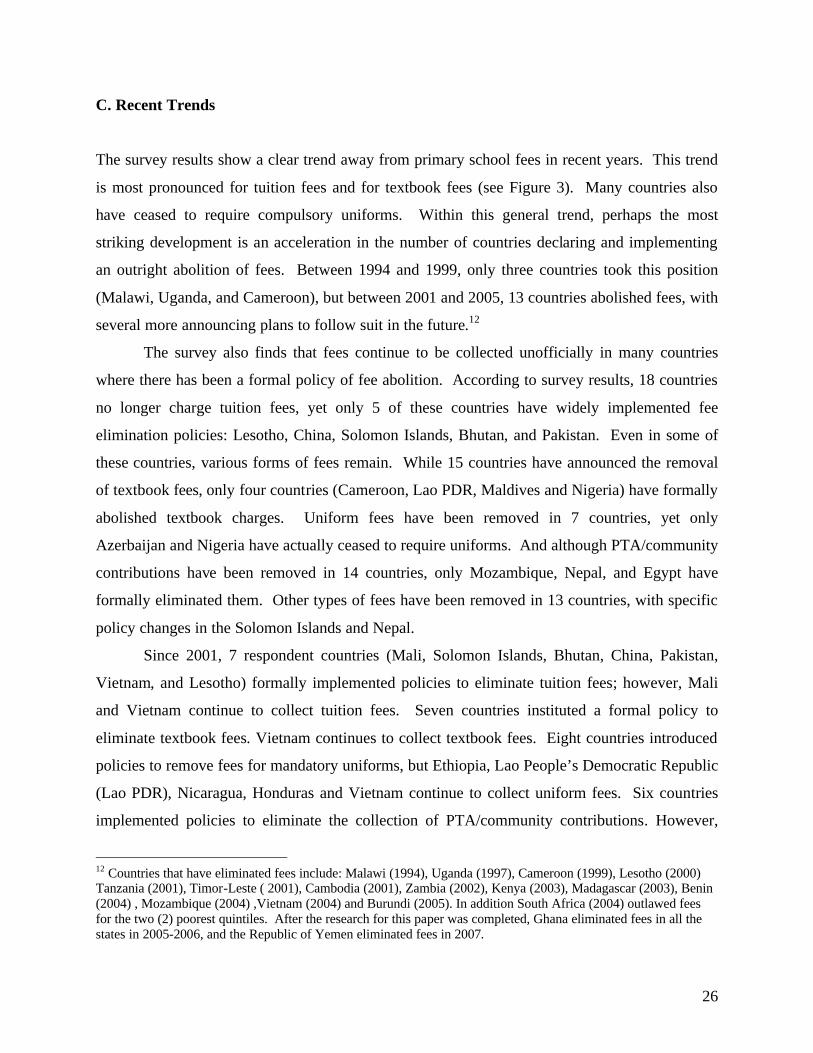
The survey results show a clear trend away from primary school fees in recent years. This trend
is most pronounced for tuition fees and for textbook fees (see Figure 3). Many countries also
have ceased to require compulsory uniforms. Within this general trend, perhaps the most
striking development is an acceleration in the number of countries declaring and implementing
an outright abolition of fees. Between 1994 and 1999, only three countries took this position
(Malawi, Uganda, and Cameroon), but between 2001 and 2005, 13 countries abolished fees, with
several more announcing plans to follow suit in the future.12
The survey also finds that fees continue to be collected unofficially in many countries
where there has been a formal policy of fee abolition. According to survey results, 18 countries
no longer charge tuition fees, yet only 5 of these countries have widely implemented fee
elimination policies: Lesotho, China, Solomon Islands, Bhutan, and Pakistan. Even in some of
these countries, various forms of fees remain. While 15 countries have announced the removal
of textbook fees, only four countries (Cameroon, Lao PDR, Maldives and Nigeria) have formally
abolished textbook charges. Uniform fees have been removed in 7 countries, yet only
Azerbaijan and Nigeria have actually ceased to require uniforms. And although PTA/community
contributions have been removed in 14 countries, only Mozambique, Nepal, and Egypt have
formally eliminated them. Other types of fees have been removed in 13 countries, with specific
policy changes in the Solomon Islands and Nepal.
Since 2001, 7 respondent countries (Mali, Solomon Islands, Bhutan, China, Pakistan,
Vietnam, and Lesotho) formally implemented policies to eliminate tuition fees; however, Mali
and Vietnam continue to collect tuition fees. Seven countries instituted a formal policy to
eliminate textbook fees. Vietnam continues to collect textbook fees. Eight countries introduced
policies to remove fees for mandatory uniforms, but Ethiopia, Lao People’s Democratic Republic
(Lao PDR), Nicaragua, Honduras and Vietnam continue to collect uniform fees. Six countries
implemented policies to eliminate the collection of PTA/community contributions. However,
12 Countries that have eliminated fees include: Malawi (1994), Uganda (1997), Cameroon (1999), Lesotho (2000) Tanzania (2001), Timor-Leste ( 2001), Cambodia (2001), Zambia (2002), Kenya (2003), Madagascar (2003), Benin (2004) , Mozambique (2004) ,Vietnam (2004) and Burundi (2005). In addition South Africa (2004) outlawed fees for the two (2) poorest quintiles. After the research for this paper was completed, Ghana eliminated fees in all the states in 2005-2006, and the Republic of Yemen eliminated fees in 2007.

27
Nigeria, and Lao PDR continue to collect PTA/community contributions. Four countries have
established policies to eliminate the collection of other school-based activity fees, but among
these countries such fees continue to be collected in Lao PDR, and Lesotho.
Figure 3: Percentage of Countries with Primary School fees, 2001-2005
36
69
35
25
25
43
71
49
47
38
0 10 20 30 40 50 60 70 80
Activity/other Fees
PTA/communitycontributions
Compulsory uniforms
Textbook charges
Tuition fees
2005 Primary School fees 2001 Primary School Fees
Source: World Bank Survey 2005. A total of 93 countries were included in the survey.
28
III. Providing Free Education: Eliminating User Fees
Most countries that have eliminated user fees focused on basic education because it is the most
accessible to the poor and has higher rates of return than secondary and university education
levels.13 Government spending on basic education is more likely to benefit the poor than
spending at other educational levels. This is because poor students are less likely to advance to
upper secondary and tertiary levels of schooling due to the opportunity costs of more schooling
(Psacharopoulos and Woodhall 1985).
Between 1960 and the early 1990s, a handful of developing countries with moderate or
declining growth raised human development levels, in part, by providing free education.
Barbados, Botswana, Costa Rica, the Republic of Korea, Malaysia, Mauritius, Sri Lanka, and
Zimbabwe were able to provide primary education without charging households for the cost of
tuition, and, with the exception of Zimbabwe, covered other types of costs such as infrastructure
and extracurricular activities (Mehrotra and Jolly 1997).
As noted above, a handful of African and South Asian countries have more recently
removed fees at the primary level with dramatic results. Enrollment rates surged (see Table 8)
and, not surprisingly, new enrollments were concentrated among the rural poor in most countries.
This suggests that the inability to pay for schooling is indeed a major obstacle to education for
the poor and other disadvantaged groups such as girls, orphans, and disabled children. In 2004,
South Africa outlawed fees for the two poorest quintiles (see Annex 8 for more detailed
information on the case of South Africa). Most countries that eliminated school fees experienced
a jump in gross primary enrollment, ranging from 5 percent in Zambia to 68 percent in Uganda.
In 1994, Malawi eliminated school fees. By the next year, gross primary enrollment increased
from 89 to 133 percent. In the case of Kenya, the elimination of fees resulted in 1.2 million
additional students entering the school system.
13 The social rate of return in developing countries for primary education is about 27 percent, while secondary education yields 16 percent (Psacharopoulos and Woodhall 1985).

29
Table 8: Increases in the Gross Enrollment Rate of Selected Countries After Fee Elimination
Country
Year
Eliminated Fees
Gross Enrollment
Rate Prior to Fee Elimination
Gross Enrollment
Rate After Fee Elimination
Percent change in enrollment
Malawi 1994 89 (1993) 133 (1994) 49 Uganda 1997 76 (1996) 128 (1997) 68 Cameroon 2000 90 (2000) 106 (2002) 17 Lesotho* 2000 108 (1999) 122 (2000) 12 Tanzania* 2001 63 (2000) 84 (2002) 33 Zambia 2002 78 (2001) 82 (2002) 5 Kenya 2003 86 (2002) 104 (2003) 21 Timor-Leste 2000 89(2000) 110 (2001) 23 Cambodia* 2001 111 (2000) 123 (2001) 10 Source: World Development Indicators 2004 Notes: *Lesotho, Tanzania, and Cambodia implemented fee elimination policies using a phased-in approach, which may be reflected in their lower changes in enrollment rates compared to other countries. Due availability of data, this table presents only a partial list of the countries that have eliminated user fees.
Notwithstanding such successful increases in enrollment through the elimination of user
fees, there are some arguments in favor of user fees. The arguments, advanced on the supply
side, are the following: (1) fees are necessary because of government fiscal inadequacy and
inequitable education spending; (2) fees are justified to offset government failure to provide
services; and (3) fees increase the involvement of paying parents in schools and in their
children’s education.
During the 1980s, proponents of fees in primary education focused on fiscal arguments.
The main argument states that a developing country’s government could not raise sufficient
fiscal resources to finance primary education (Birdsall’s work in Mali, 1986). Experience has
shown, however, that the fiscal argument has not held up in practice, and we reinforce this with
the work reported in this paper. According to proponents, user fees can also help correct
imbalances in access to education created by poorly targeted or inefficient public spending on
education (Hillman and Jenker 2002). However, public spending on education in many countries
favors secondary and tertiary schooling, largely benefiting the non-poor. Levels of public
expenditure on education in many developing countries are insufficient to create sustainable

30
quality education systems. Some countries are already spending at high levels and user fees have
been used to augment meager government resources.14
There is evidence that countries need not have strong economies to provide primary
education to all. Rather, they need a comprehensive plan and public commitment to funding.
Barbados, Costa Rica, Mauritius, and Zimbabwe all achieved high primary enrollment rates
during periods of interrupted economic growth or decline (Mehrotra and Jolly 1997). A study of
these four countries, in addition to Malaysia, Republic of Korea, and Sri Lanka, which all
achieved high primary enrollment rates early on in their economic growth, cites the combination
of policies and interventions that made it possible to achieve universal primary education:
1. The state took primary responsibility for education
2. High allocation of government budget to primary education
3. Adoption of cost-effectiveness measures
4. Use of automatic promotion and double-shifting to increase internal efficiency and cost-
saving
5. Elimination of direct tuition fees
6. Use of mother tongue for instruction
7. Implementation of school feeding programs
(Mehrotra and Jolly 1997)
Government failure is the second argument in favor of fees. Recent work on user fees for
public services argues that use depends on circumstances and that in general there should be no
blanket policy on user fees. The World Development Report 2004: Making Services Work for
Poor People (World Bank 2004e) provides an analytical framework for thinking about user fees
(see Annex 12). It indicates rather clearly that there is no case for primary school fees except
where government is unreliable. If government cannot provide sufficient resources to schools,
then the schools should raise the resources themselves through fees (World Bank 2004e).
14 For example, in 1994, South Africa was spending 22.5 percent of its national budget on education, or 7 percent of GNP, compared to the world average of 5.1 percent at the time. While national and provincial levels of spending grew by 14 percent between 1997 and 2001, slowed economic growth and inflation meant that spending actually declined in real terms. The South African government thus encouraged public schools to collect fees from parents in order to supplement government funds. However, it appears that the school fee policy did little to benefit historically disadvantaged schools (Fiske and Ladd 2003; Lemon 2004) (see Annex 8 for information on school fees in South Africa).
31
On the two extremes of government reliability, the case is easy. User fees can allow poor
families to send their children to schools that they might not have access to in areas or countries
where government supply of education is inadequate. For example, due to the severe shortage of
publicly funded schools in Haiti, 65 percent of children are enrolled in private schools (Hillman
and Jenker 2002). Where there is no actual government, as in Somalia, for instance, fees are
essential if there is to be any primary schooling. All education in such circumstances is
essentially private – privately financed and privately provided. On the other extreme, where
governments can effectively deliver educational services, the case for fees is not as strong.
It is where the government, though present, is not effective, that the fee dilemma arises.
Little is actually known systematically about government effectiveness in delivering primary
education. An important area for future research will be the reliability of government provision
of education. If fees finance quality, they would need to be replaced. But fees often “disappear”
through various leakages, and at best only partly finance quality inputs. Fees, especially for such
things as books, may well result in the provision of essential materials for learning, and hence
improve educational quality. In practice, the evidence is not strong and, as we have noted, there
is an urgent need for research into this question.
The third argument in favor of fees is that fees increase parental involvement or
ownership in the schools and in their children’s education. However, there is little evidence to
support this assertion and further research is warranted. Even if this argument is sound, its
effects can be achieved by giving parents vouchers that they can use to enroll their children, and
by involving parents in school governance, as has been the case with India’s District Primary
Education Programme and EDUCO in El Salvador (see Box 2).
User fees have been shown to improve quality and cost-effectiveness, generally due to
the fact that parents monitor their children’s education more closely when they have to pay out of
their own pockets (Hillman and Jenker 2002). A study of primary schools in the Philippines
found that schools that received most of their funding from local governments and PTAs were
more cost effective (Jimenez and Paqueo 1996). Primary schools in Uganda, financed largely by
parents and communities until the late 1990s, kept good and transparent records of enrollments
and financial flows, most likely due to accountability requirements imposed on them by PTAs

32
(Ablo and Reinikka 1998). Nicaragua’s Autonomous School Program provides further insight.15
However, if parental contributions are used for quality inputs, then the finding that parents in
poorer areas contributed less money to the schools raises serious equity issues. A closer look at
the cases mentioned above shows that it could be the greater parental participation and not the
fees themselves that led to greater accountability. If this is true, then it may be enough to create
incentives for community and parental participation through in-kind donations, such as time
spent on parent-teacher committees for curriculum development, or school infrastructure
projects.
Box 2: EDUCO-Impact of Parental Participation on Schooling
Accountability mechanisms that put people at the center of service provision can go a long way in making services work and improving outcomes by facilitating participation in service delivery. There are three key relationships in the service delivery chain that can be used to strengthen accountability: (i) between beneficiaries and providers; (ii) between beneficiaries and policymakers; and (iii) between policymakers and providers. There may be a need to look for strategies to strengthen the short route to accountability, the direct influence of beneficiaries on service providers. Increased parental participation is just one example of a mechanism that may increase the short route to accountability. For example, under El Salvador’s EDUCO program, school committees, comprised largely of parents, were responsible for spending government funds to hire, monitor, and dismiss teachers. In addition, the parents are also trained in school management, as well as how to help their children with school work. Seventy-five percent of new enrollments between 1992, just after the program was implemented, and 1995 were EDUCO students. In addition, despite rapid expansion of EDUCO schools, education quality was comparable to traditional schools. In fact, parental participation was considered the principal reason for EDUCO’s success. Controlling for other factors, each parental visit to a school was associated with a 3.8 percent increase in math scores and a 5.7 percent increase in language scores. Source: World Bank 2004e
15 Under this school-based management program in Nicaragua, the schools are governed by school-site councils that decide how 100 percent of school resources are allocated. The councils have a voting majority of parents, in addition to teachers and students. In addition to testing and textbook fees, parents are asked to “voluntarily” make monthly financial contributions, though it is not clear that payment is entirely voluntary. The textbook and testing fees constitute 49 to 58 percent of fees for primary school students. Thirty-one percent of schools in the system collect at least 5 percent, and up to 15 percent, of their income from school charges and commercial activities. These funds helped create performance incentives for teachers, who earn very little. In addition, the school-site councils have the power to hire and fire school principals, a privilege that few other school councils in Latin America enjoy (Gershberg and Meade 2005).
33
Despite arguments in favor of user fees, works such as the 2004 World Development
Report (World Bank 2004e) find little support for fees in primary education. Research has
demonstrated that various countries have successfully increased access to education by
eliminating these economic barriers. The efforts of several countries to abolish fees are
documented in detail in Annex 1. The section below seeks to highlight their achievements, the
challenges that remain, and the lessons learned from these countries’ implementation
experiences.

34
IV. Lessons Learned: Achievements and Challenges
Achievements:
Free primary education policies have been successful in getting children into school.
Countries that eliminate school fees commonly see substantial increases in primary school
enrollment. In Lesotho, there was a significant increase in enrollment in Standard 1, from 66,999
in 1998 to 120,000 in the first year of implementation of the Free Primary Education (FPE)
program. In Uganda, enrollment jumped 68 percent, from 3.1 million children in 1996 to 5.3
million children in 1997 (World Bank 2001b; Avenstrup et. al. 2004). The primary gross
enrollment rate in Cameroon increased from nearly 90 percent in 2000 to almost 106 percent in
2002. In addition, the number of non-repeating students in primary school increased by 59
percent in Cameroon in the first year following elimination of user fees. The gross enrollment
rate in Cambodia jumped by 10 percent from 2000 to 2001. Net primary enrollment in Tanzania
increased from 57 percent prior to the elimination of fees to 85 percent within one year after the
removal of fees (Global Campaign for Education 2005).
Removal of user fees has improved equitable access to education.
School fees act as a barrier to education for poor children, girls, orphans, rural residents, children
with disabilities, and other disadvantaged groups. Fees prevent poor children from accessing
learning opportunities. While in most cases total income from fees constitutes a small part of
total education resources, enrollment of children from poor households is very sensitive to even
small fees. The evidence from countries that have eliminated school fees shows that free
education policies have been successful in reaching poor and marginalized populations.
Enrollment rates grew quickest among the poor in Cambodia, Uganda, Malawi, Zambia
and Timor-Leste with the removal of fees. For example, enrollment rates in Uganda grew
quicker among the poor than the non-poor after the government abolished school fees, thus
narrowing the enrollment gap between the two groups from a 36 percentage point difference in
1992 to 11 percentage points in 1997 (Deininger 2003). New enrollments in Cambodia were
concentrated among the poorest 20 percent of the population.

35
Further, girls’ enrollment rates grew more rapidly than boys’ following fee abolition in
Uganda, Kenya, and Timor-Leste, thus narrowing the gender gap in those countries. In Uganda,
primary attendance among girls 6 to 12 years old grew from 59.7 percent in 1992 to 83.2 percent
in 1999 while primary attendance among boys grew from 64.3 to 84 percent (Deininger 2003).
A World Bank study (2002b) found similar results (see Figure 4). More than 50 percent of new
students in Kenya were girls. Girls represent 49 percent of students enrolled in the first grade in
Tanzania.
Figure 4: Evidence of Improved Equity in Uganda
Source: World Bank 2002b
Overage students made up a large proportion of new enrollments in Uganda, Kenya, and
Cambodia. Overage enrollment in Uganda was massive just after fees were abolished. And
though it is now much lower, it is still sizeable with a gross enrollment rate of about 125 percent
in 2004. About 11.5 percent of new enrollments in Kenya were older than the average age for
grade. In 2001, 76.2 percent of pupils entering grade 1 in the poorest quintiles were overage,
compared to 53.4 percent in the richest quintiles in Cambodia.16
Fee abolition also helped students who had dropped out to return to school. A significant
amount of new enrollees in Zambia were actually students who had previously left school due to
the inability to pay school fees, especially in rural areas (Mwansa et. al. 2004). One study in
Kenya found that 7.5 percent of new enrollees were children who had previously dropped out of
school (UNESCO 2005).
16 Overall, the incidence of overage students is extremely high in Cambodia. In 2001, the Cambodia Child Labour Survey found that 72.2 percent of first-time students in primary school were overage. Similarly, the average age for lower secondary students was 15.8 years.

36
Urban-rural disparities declined in Uganda and Timor-Leste as a result of fee removal.
Many countries, such as Swaziland, have removed fees for orphans and vulnerable children
(OVC). Enrollments of HIV/AIDS orphans and other vulnerable children also increased in
Kenya and Lesotho following the removal of fees (see Box 3 for more information on HIV/AIDS
orphans and education). In Kenya and Zambia, fee removal also improved access to schooling
for children with special needs because parents are often reluctant to spend scare resources to
send their special needs children to school.
Box 3: HIV/AIDS Orphans and Education
There are an estimated 12.3 million children in Sub-Saharan Africa who have lost one or both parents to HIV/AIDS. According to a 2004 joint UNAID, UNICEF, and USAID publication, in 11 of the 43 countries in the region at least 15 percent of children are orphans, and in 5 of those 11 countries HIV/AIDS is the cause of parental death more than 50 percent of the time. The report estimates that by 2010 more than 18 million children in the region will have lost one or both parents to the disease. These staggering statistics highlight the vulnerability of children who experience reduced parental care and protection, coupled with increased economic hardship as a result of HIV/AIDS (UNICEF 2004). Children often become the primary caregiver when a parent is infected with HIV and unable to work. Children are also frequently taken out of school, either to provide care for the sick parent or to work outside the home to earn extra income. School fees may become unaffordable when one or both parents are too sick to work. School fees may further prevent children orphaned or made vulnerable by HIV/AIDS — particularly double orphans or those living in single-parent households — from accessing education (UNICEF 2004). This has serious implications for at-risk populations, especially girls. This points to the value of targeted programs for HIV/AIDS orphans. General elimination of fees has been successful in getting orphans into school (for example in Kenya, Lesotho, and Tanzania), and several countries have also implemented targeted mechanisms for raising enrollment rates for orphans and vulnerable children. In cooperation with the African Development Bank, Uganda implemented the Education II project in 2001, one of the goals of which was to increase provision of education for AIDS orphans. Tanzania’s National Education Fund provides scholarships to AIDS orphans. Namibia, Rwanda, Swaziland, Zambia, and Zimbabwe also provide fee waivers or bursary schemes for orphans and vulnerable children (Tempest 2005). Burundi and the Democratic Republic of Congo have also proposed removing fees for the same population (Tempest 2005). Youth are also at risk for becoming HIV positive. However, studies have shown that education can help lower incidence of HIV/AIDS among young people. For example, young people who do not finish primary school exhibit infection rates that are at least double those for young people who have completed primary school. Children (particularly girls) who complete secondary schooling are even less likely to be infected. For instance, 15 to 18 year-old girls in Zimbabwe who have dropped out of school are five times more likely to become infected than those who are enrolled in school (UNAIDS 2005). It is, therefore, important that education systems adopt a two-fold strategy: a curriculum that promotes HIV prevention, and a system that focuses on helping all children, but particularly girls, to complete primary and secondary schooling. ..

37
These country examples indicate that improved equity is generally a clear benefit of
removing fees, particularly for the most vulnerable populations, including girls, OVC and
children with special needs. Increased equity for children from these populations is imperative
because they represent the hardest to reach populations, who, it can be argued, without focused
interventions, such as the removal of user fees, would not be able to attend school.
Increased government funding for education.
There is some evidence that governments that have eliminated user fees have attempted to fund
such policies through increased spending on education. In Malawi, education spending rose
from 13 percent of the total government budget in 1994/1995 (3.5 percent of GDP) to 20 percent
in 1997/1998 (4.7 percent of GDP). The share of recurrent resources going to primary education
rose from approximately 50 percent in 1993/1994 to around 60 percent in 1990/2000 (World
Bank 2002c). As gross enrollments doubled over the decade, per pupil spending on primary
education in real terms also increased. Specifically, real unit costs at the primary and secondary
level increased, implying large increases in real public education expenditures, and the increases
appeared to have been captured disproportionately by the poorer income groups in Malawi
(World Bank 2002c).
The elimination of fees for primary schooling in Uganda was also accompanied by
restructuring of education expenditures. Education expenditures grew from 16.4 percent of the
national, discretionary, recurrent budget in 1996 to about 30 percent in 2000 (Uganda Ministry of
Finance, Planning and Economic Development, n. d.). Spending on primary education increased
from less than 40 percent of the overall education budget throughout the early 1990s to about 70
percent in 1997/98 to present. Funds for construction and maintenance grew to six times their
previous levels (Deininger 2003).
Per student government expenditures on primary education in Cameroon rose by 114
percent, from CFAF 21,000 in 1995 to CFAF 45,000 in 2001.17 In Tanzania, 29,922 new
classrooms were built between 2002 and 2004, with the support of communities using
development grants. Total expenditures for education in Tanzania more than doubled between
1998 and 2002 (World Bank 2005a). Zambia’s government proposed to increase budgetary
contributions to the education sector to at least 20.5 percent in 2000; by 2005, public education
17 In 2001, the exchange rate of CFA francs to USD was .00137.
38
expenditures accounted for 24.1 percent of total government spending. Lastly, in Cambodia,
between 1996 and 2003, direct government spending on education rose from US$31 million to
US$75.8 million and represented 19.1 percent of the total government recurrent budget by 2004.
A large proportion of the increase was funneled to the non-wage recurrent sector. In particular,
the government used the largest proportion of non-wage funds to finance the Priority Action
Program (PAP), which was designed to raise enrollment among children in grades 1-9 by
reducing school costs for the poorest families (World Bank 2005g).
Challenges:
Sustainability.
The gains in enrollment observed after fee abolition will only be sustainable if there is careful
planning of appropriate accompanying measures. In Malawi, Kenya, and Cameroon, enrollment
rates fell off after the initial increase. This was, at least in part, a response to a perceived decline
in educational quality due to a combination of increased enrollments, inadequate funding, and
overall lack of preparation. The situation in Malawi was particularly acute.18 In 2000, the
average student to teacher ratio for Standard 1 was 100:1, with many classrooms surpassing this
ratio. High student to teacher ratios, insufficient numbers of classrooms, unqualified teachers,
lack of supplies and textbooks, a decline in teacher-student contact hours, and an influx of
overage students are but some of the many examples of signs of low school quality.
In addition, drop-out and repetition rates continue to be high in some countries, while
primary completion rates are often very low. In Malawi, as of 2000, the average primary
repetition rate was gauged to be between 16 and 28 percent. The average primary drop-out rate
was between 5 and 10 percent in the same year. The primary school completion rate improved
from 20-25 percent to 35-40 percent between 1992 and 2000, but Malawi is not currently on
track to attain universal primary education by 2015 (World Bank 2004b).
18 The increase in enrollments in Malawi resulted in the following figures: students: permanent classroom, 119:1; students:desk, 38:1; students:chair, 48:1; students:textbook, 24:1; and students:teacher, 62:1 (World Bank 2004b).
39
Some disparities still exist.
In spite of general improvements in equity following the abolition of fees, disparities persist. In
Zambia, a significant gender gap remains, especially in rural areas. And while the gender gap
appears to have closed with the removal of fees in many countries, especially with the targeting
of fee removal programs to girls, the equity gap between urban and rural areas has often not
closed and in some countries, has deepened. In Malawi, urban students are 20 to 30 percentage
points more likely to stay in school than their rural counterparts. There is generally a higher
degree of poverty in rural areas and teacher deployment to rural areas is not as strong as
deployment to urban areas (World Bank 2004b). In Cameroon, wide gender and socio-economic
disparities still exist. Completion rates for boys are 14 percentage points higher than those for
girls. There is a 25 percentage point gap in enrollment between the poorest 40 percent of the
population and the richest 60 percent. There is a 40 percentage point differential in enrollment
between urban and rural areas, and a 60 point differential between the northern provinces and the
rest of the country (World Bank 2005e). Furthermore, enrollment rates in Cambodia are still
lowest among the poor. In 2000, the primary enrollment rate for the children in the poorest
quintile was 55.4 percent, compared to 77.5 percent for the richest 20 percent. Similarly, the
poor had lower net enrollment for lower secondary school (5.6 percent, compared to 31 percent
for the richest quintile) (World Bank 2005g). This suggests that while important gains have been
made, there is still much to be done to achieve universal basic education.
Fees continue to be collected informally.
Despite official fee elimination in Malawi, households continue to bear a considerable share of
both the recurrent and capital costs of primary education. According to data collected by the
World Bank, 83 percent of parents of primary pupils in public schools in Malawi paid for one or
more types of school supply during the year 2001. In addition, the majority of families reported
paying for textbooks and uniforms, and approximately half reported contributing to the school
development fund, which finances infrastructure maintenance. The average household
expenditure for public primary school was almost as high (at 80 percent) as the per pupil public
expenditure (World Bank, 2004b).
Official government policy in Uganda states that parents are responsible for paying costs
for exercise books and pencils, meals, clothing, transportation, and assistance with school

40
construction (World Bank, 2001b). A study undertaken by the United Kingdom’s Department
for International Development (DFID) found that unofficial fees include end-of-year parties,
classroom construction, telecommunication infrastructure, and even teachers’ funerals (Boyle et.
al. 2002). The same study noted that 48 percent of parents cite inability to pay the expenses as
the reason that their children left primary school. Despite elimination of direct fees, many
households cannot pay for uniforms, notebooks, and pencils (International Monetary Fund,
2000a).
Parents in Tanzania still incur costs to send their children to school, though the costs have
decreased significantly since 2001. Average total costs to send one child to school in the
Kilimanjaro area ranges from 2,000 to 8,000 Tanzania shillings (between US$2 and US$10).19
Prior to elimination of fees, the cost range was from 7,600 to 10,600 shillings. While uniforms
are no longer compulsory, there is a stigma associated with sending a child to school without a
uniform. The cost of books still represents an obstacle to schooling. Indirect costs remain high.
It is estimated that, combining direct and indirect costs, to send one child to school for one year,
parents are paying about 13,000 Tanzanian shillings (UNESCO 2003/04). Due to limited funding
for the free primary education policy in Kenya, schools often continue to charge fees to cover
costs (Mukudi 2004). Unofficial fees are also charged at the local level in Ghana (see Box 4).
In Zambia, households bear significant expenses related to education, even after the
formal abolition of fees. Despite the Free Basic Education (FBE) mandate to eliminate
obligatory uniforms, 46 percent of urban and 14 percent of rural schools still require students to
wear uniforms, though this could be the result of ambiguity in FBE guidelines that allowed
schools to use uniforms as long as they did not make a profit from them. Fees collected by
government schools increased between 2002 and 2003 (Mwansa et. al. 2004). Some schools
have begun to charge PTA fees again due to inadequate government funding (Global Campaign
for Education 2004). The situation is similar in Lesotho where households continue to make
contributions in a number of areas including the purchase of uniforms and the payment of non-
teaching staff. In addition, since the government does not cover all school costs, schools
continue to need to find ways to raise funds (World Bank 2005).
19 In 2001, 0.00116 Tanzanian Shillings equaled US$1.
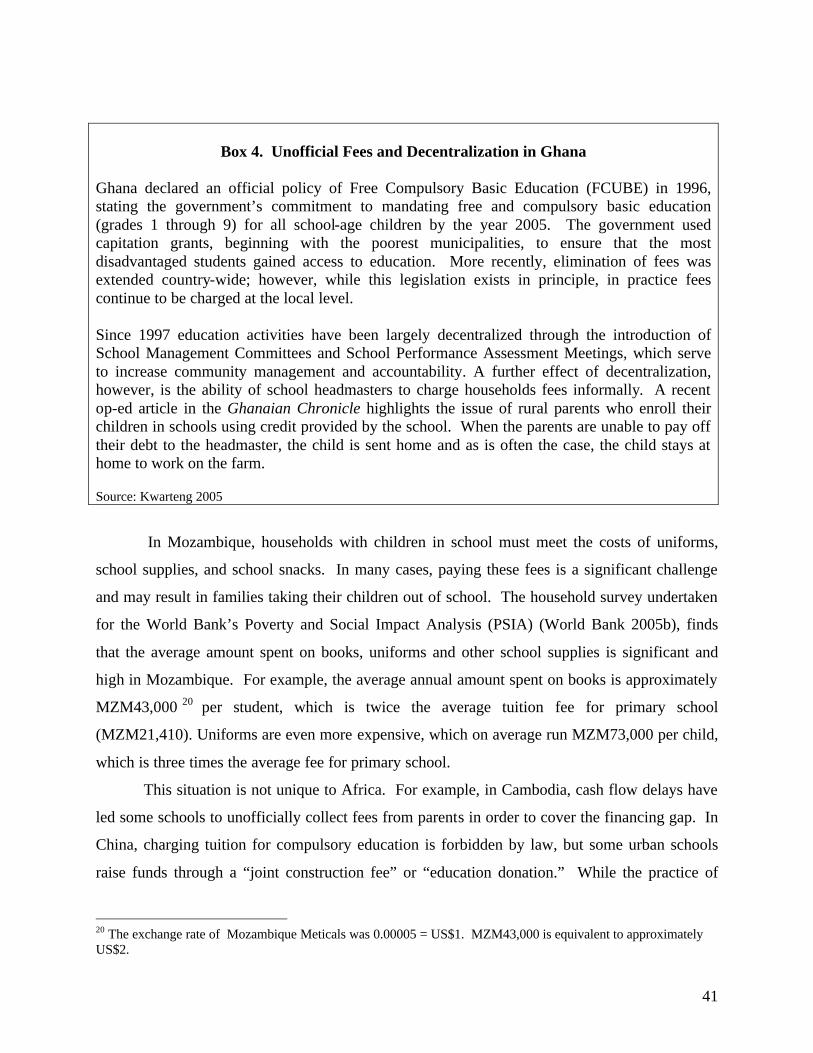
41
Box 4. Unofficial Fees and Decentralization in Ghana
Ghana declared an official policy of Free Compulsory Basic Education (FCUBE) in 1996, stating the government’s commitment to mandating free and compulsory basic education (grades 1 through 9) for all school-age children by the year 2005. The government used capitation grants, beginning with the poorest municipalities, to ensure that the most disadvantaged students gained access to education. More recently, elimination of fees was extended country-wide; however, while this legislation exists in principle, in practice fees continue to be charged at the local level. Since 1997 education activities have been largely decentralized through the introduction of School Management Committees and School Performance Assessment Meetings, which serve to increase community management and accountability. A further effect of decentralization, however, is the ability of school headmasters to charge households fees informally. A recent op-ed article in the Ghanaian Chronicle highlights the issue of rural parents who enroll their children in schools using credit provided by the school. When the parents are unable to pay off their debt to the headmaster, the child is sent home and as is often the case, the child stays at home to work on the farm. Source: Kwarteng 2005
In Mozambique, households with children in school must meet the costs of uniforms,
school supplies, and school snacks. In many cases, paying these fees is a significant challenge
and may result in families taking their children out of school. The household survey undertaken
for the World Bank’s Poverty and Social Impact Analysis (PSIA) (World Bank 2005b), finds
that the average amount spent on books, uniforms and other school supplies is significant and
high in Mozambique. For example, the average annual amount spent on books is approximately
MZM43,000 20 per student, which is twice the average tuition fee for primary school
(MZM21,410). Uniforms are even more expensive, which on average run MZM73,000 per child,
which is three times the average fee for primary school.
This situation is not unique to Africa. For example, in Cambodia, cash flow delays have
led some schools to unofficially collect fees from parents in order to cover the financing gap. In
China, charging tuition for compulsory education is forbidden by law, but some urban schools
raise funds through a “joint construction fee” or “education donation.” While the practice of
20 The exchange rate of Mozambique Meticals was 0.00005 = US$1. MZM43,000 is equivalent to approximately US$2.

42
charging fees is prohibited by the Chinese government, it is often tolerated or even encouraged
by local governments, which collect a certain percentage from schools as an additional source of
funding. Common fees include a twice yearly book fee of 80 yuan in urban areas and 65 yuan in
rural areas (between US$8 and US$10). In addition, key (or more elite public) schools often
charge a required “donation” to cover various expenses for unqualified students (World Bank
2005c). In Vietnam, poor parents still pay a substantial amount of household income on a
combination of fees – as much as US$8 per child per year (approximately US$0.66 per month)
(see Box 5).
Box 5: Household Financing in Vietnam. Despite legislation declaring tuition fees illegal in primary and lower secondary schools in Vietnam, financing of the education system continues to rely on families. The practice of raising fees for education, for instance through school construction fees, appears to be widespread and in some areas significant. Except for limited fee exemptions available for approximately 10 percent of parents, direct costs of education remain an obstacle to education for disadvantaged students. While exemptions are aimed at the bottom quintile, the magnitude of exemption is not as large as was expected or needed. Significant numbers of families in the bottom quintile continue to pay full charges. In many cases, the poorer provinces face heightened resource pressures and are more likely to be reluctant to remove potential revenue from fees. Source: World Bank 2005d
Expanding Access and Improving Quality: Possible Tradeoffs.
In many countries, insufficient public funding is linked to a deterioration in education quality.
Governments are expanding access to education without providing the necessary funds and
support for improving or maintaining quality. South Africa, for instance, has delayed
implementing free basic education (see Annex 8) because it does not believe it has adequate
funds to expand access and maintain the current quality of education. Even countries with
constitutional guarantees to free primary education, such as India, find it difficult to enforce
those guarantees because many schools that do not receive adequate funding compensate for the
shortfalls by charging tuition and textbook fees (UNESCO 2004). Many interviewees in
Mozambique suggest that fees are an essential source of funds for primary schools and that
without fees primary schools would be unable to function due to lack of sufficient government
budget (World Bank 2005b).
43
Low efficiency.
Low quality schooling increases overall costs by increasing the number of years it takes to
produce a graduate. For example, in Timor-Leste, despite the increases in enrollment, cohort
analysis points to low levels of internal efficiency. Most new enrollments were at the lower
primary level, regardless of the appropriate age-for-grade. In 2000/01, the number of children
enrolled in Grade 1 was more than double the estimated number of 6 year-olds in the country. A
2002 World Bank study found that given these levels of internal efficiency, “only 67 percent of
children would reach Grade 4, and 47 percent would eventually complete grade 6, while 53
percent would drop out” (World Bank 2002a, pg. 31). While the cost of sending a student to 6
years of primary school is about $300, the high repetition and drop-out rates cause costs to nearly
double (World Bank 2002a).
In Cameroon, while enrollment remains high and near universal, repetition rates are high
(25.8 percent in primary and 15.3 percent in lower secondary). In 2003, it was estimated that
almost 30 percent of education sector resources were wasted due to repetition. In Malawi,
approximately 40 percent of the students will have dropped out of school by the end of Standard
6 (World Bank 2004b). With the current level of repetition and drop out in Malawi’s education
system, the government would pay for as many as 20 years of schooling (instead of the normal
eight years) in order to get one child to graduate from primary school. Malawi’s index of
efficiency is 39.7 percent, indicating that “60.3 percent of the public resources are used either on
children who drop out before finishing primary or on repetition years (both of those who
eventually finish and those who do not and are also lost to the system)” (World Bank 2004b, pg.
56).
Availability of Teachers.
A comprehensive fee removal plan must address several critical teacher-related issues including,
but not limited to, recruitment, training, and deployment. While many countries have made the
adjustment to recruit teachers, they have not put adequate effort into training and effectively
deploying teachers. When free primary education was introduced in Malawi, a large number of
teachers were recruited to meet the increased demand from students. At that time, 18,000
untrained teachers were recruited and placed in the Malawi Integrated In-Service Teacher
Education Program (MIITEP). The recruitment of untrained teachers posed long-term
44
challenges to the quality of teaching and learning. The sustainability of teacher training should
also be considered. For example, in Malawi it is projected that the high volume of teacher
education programs will need to continue for at least another five to ten years in order to train the
unqualified teachers currently in the system and increase the teacher stock to meet primary
enrollments. In Zambia, the Ministry of Education has estimated that an additional 3,000 to
4,000 teachers per year will need to be hired to cover attrition (Global Campaign for Education
2004).
In addition to teacher training, a second critical aspect is the actual deployment of
teachers. This can be particularly challenging when considering the urban-rural divide. Many
rural schools are located in isolated settings. In Cameroon, the distribution of teachers lacks
clear guidelines: 45 percent of primary school teacher appointments are not related to the number
of students in those schools (World Bank 2005e). Data from Malawi indicates a significant
discrepancy in the number of teachers available to schools that enroll a similar number of pupils.
According to the data, there are between 5 and 40 teachers for every 1,000 pupils, depending on
the school. As mentioned above, the inconsistency and inefficiency in teacher deployment can
partly be explained by differences in allocations among the districts, especially between urban
and rural districts, and insufficient monitoring and management tools to ensure efficient,
sufficient, and fair deployment. The challenge is further heightened by significant differences in
pupil to qualified teacher ratios between urban and rural districts. In urban districts in Malawi,
the pupil to teacher ratio can range between 60 and 70, while in rural districts this average can be
twice as high. Malawi’s experience highlights the need for recruitment, training, and
deployment of teachers as an integral part of any plan to remove user fees (World Bank 2004b).
HIV/AIDS is a serious threat to education, especially in terms of teacher and
administrator attrition. Teacher absenteeism due to HIV/AIDS remains a significant obstacle to
education in many countries. For example, in Zambia, infection rates are 25 to 30 percent in
urban areas and 10 to 15 percent in rural areas. About 1,000 teachers die from AIDS every year
(AFD 1999; Global Campaign for Education 2004).

45
V. Conclusion and Recommendations
Based on the above, a number of observations about the abolition of user fees can be made. As
always for educational reform, issues and opportunities vary by country and must be tailored to
country-specific circumstances.
Where it is politically feasible, a phased-in approach reduces the technical challenge of
eliminating user fees, and can reduce the likelihood of recidivism.
Prior to eliminating fees, the government of Tanzania estimated that 3 million children aged 7 to
13 were not in school. Recognizing that eliminating school fees for all children at once could
overwhelm the resources of the education system, Tanzania developed the Primary Education
Development Plan (PEDP), a comprehensive strategy for enhancing service delivery in basic
education (Hillman and Jenker 2002). The PEDP outlined a phased in approach to reaching the
goal of Universal Primary Education (UPE) (Government of Tanzania 2001).
Due to the phased in approach in Tanzania, the education system was ready for the initial
increases in enrollment. Net primary enrollment increased from 57 percent prior to the
elimination of fees to 85 percent within one year (Global Campaign for Education 2005).
Although the student to teacher ratio increased from 45:1 before the PEDP in 2001 to current
59:1, it is still manageable. And, this ratio is likely to be reduced because the peak of the
enrollment has passed and more teachers are expected to graduate from teacher colleges. The
phased-in approach also protected quality. Over the period of the PEDP, the Primary School
Leaving Examination pass rate increased from 25 percent in 2002 to 48 percent in 2004. The
student to textbook ratio, improved from 8:1 before the launch of PEDP to 4:1 in 2004. The
percentage of Grade A teachers increased from 46 percent in 1999 to 58 percent in 2004,
indicating that while gains were made, quality teachers are still in demand as 42 percent of
primary teachers have minimal training.
Lesotho’s Free Primary Education (FPE) program began in January 2000 and is being
implemented in phases. Fees were eliminated for one additional level of school each year, such
that Standard 1 fees were eliminated in 2000, fees for Standard 2 in 2001, and so on until 2006,
when the whole primary cycle was expected to be covered. The phased-in approach has helped
the government to more effectively develop an implementation strategy. During implementation
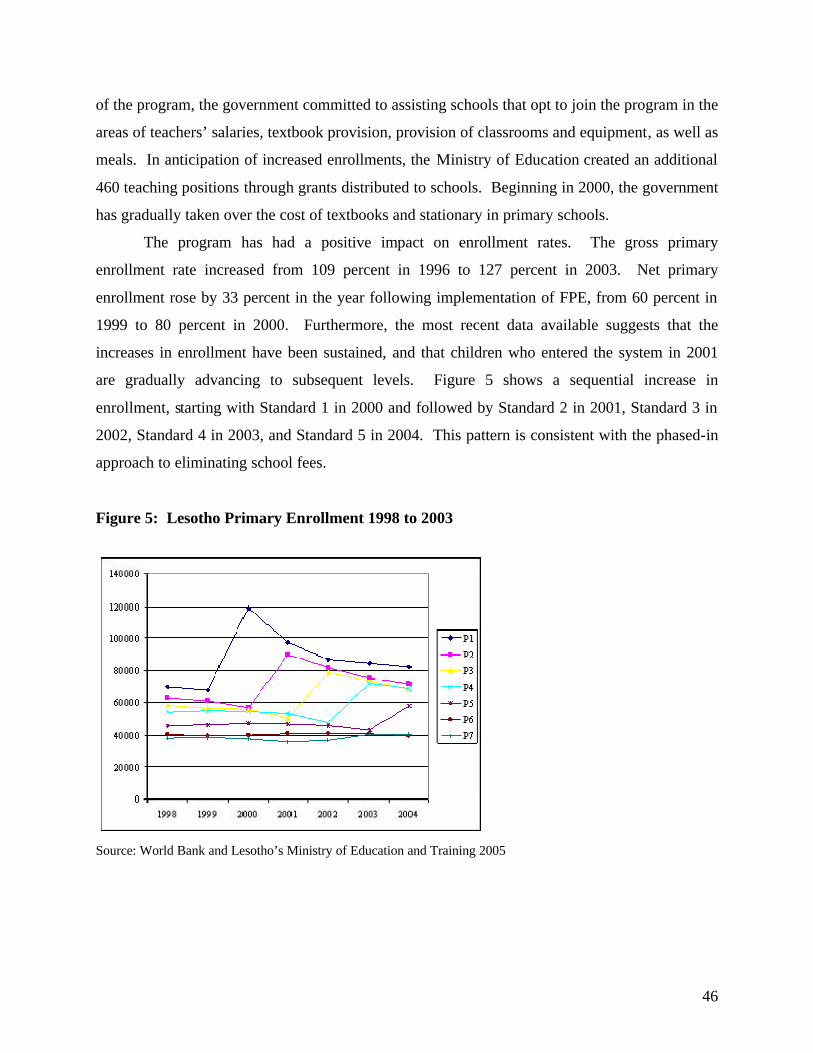
46
of the program, the government committed to assisting schools that opt to join the program in the
areas of teachers’ salaries, textbook provision, provision of classrooms and equipment, as well as
meals. In anticipation of increased enrollments, the Ministry of Education created an additional
460 teaching positions through grants distributed to schools. Beginning in 2000, the government
has gradually taken over the cost of textbooks and stationary in primary schools.
The program has had a positive impact on enrollment rates. The gross primary
enrollment rate increased from 109 percent in 1996 to 127 percent in 2003. Net primary
enrollment rose by 33 percent in the year following implementation of FPE, from 60 percent in
1999 to 80 percent in 2000. Furthermore, the most recent data available suggests that the
increases in enrollment have been sustained, and that children who entered the system in 2001
are gradually advancing to subsequent levels. Figure 5 shows a sequential increase in
enrollment, starting with Standard 1 in 2000 and followed by Standard 2 in 2001, Standard 3 in
2002, Standard 4 in 2003, and Standard 5 in 2004. This pattern is consistent with the phased-in
approach to eliminating school fees.
Figure 5: Lesotho Primary Enrollment 1998 to 2003
Source: World Bank and Lesotho’s Ministry of Education and Training 2005

47
Fee abolition alone will not achieve universal basic education.
The abolition of fees must be part of a broad government commitment to achieving universal
basic education, with many complementary measures and strong political leadership from the
highest levels. Low enrollment may also reflect a lack of supply (no schools in the area),
perceived low returns from schooling in the labor market, or other standard factors that limit
access, such as the distance to school and, for girls, the existence of female teachers and separate
toilets.
Other education-related household expenses and indirect costs can be greater obstacles than
fees, and must be addressed in any policy effort to increase access to education.
In addition to the direct costs levied by schools, households can often be faced with other
economic costs of basic education. In Cambodia, for instance, transportation costs account for 9
to 15 percent of household spending on education in urban areas and 9 to 21 percent in rural
areas (Bray and Bunly 2005). In many countries, especially, but not only, in Asia, it is
customary to send children to private tutors, often the very public school teachers in the schools
that they attend during the day, outside school hours (Bray 1996; Bray 1999; Bray 2001).
Though not strictly compulsory, such fees increase household costs of basic education, either
because parents feel that they must provide such tutoring to supplement formal schooling or
because there is an “element of blackmail involved because at least some teachers provide only
the bare minimum during school hours and reserve the real teaching for their private classes”
(Bray 1996, p. 17). This points to the need for public programs that provide incentives to poor
households so that their children can attend school. Some countries provide targeted subsidies to
help offset some of the non-fee costs of attending school, such as transport costs. For example,
Thailand and Ghana provide bicycles to poor students in rural areas (see Annex 9 for information
on strategies that countries have used to offset fees).
Poorer households often incur indirect economic costs by sending children to school who
would otherwise contribute to the household economy. Deolalikar (1997) found that the amount
of time spent collecting water, a proxy of opportunity costs, has a negative impact on primary
school enrollment in Kenya. Most children who work in developing countries are major
contributors to family income. For example, in Paraguay child labor constitutes 24 percent of
family income (Patrinos and Siddiqui 1995). Therefore, even in the absence of school fees, very

48
poor households may still be unlikely, or unable, to send their children to school (Hillman and
Jenker 2002). These indirect costs are often more critical than direct fees in keeping children out
of school, and must be addressed in any policy efforts to increase enrollments.
Experience from Latin America provides examples of successful targeted programs for
the poor. Brazil’s Bolsa Escola program and Mexico’s Oportunidades are conditional cash
transfer programs (CCTs) that have had a positive impact on enrollment rates and schooling
outcomes in addition to other indicators of well-being, such as health and child labor. CCTs, a
relatively new type of social program, provide cash grants to poor families conditional on certain
types of behaviors, such as sending children to school and attending regular preventative health
care visits. The principle objective of most CCTs is the long-term accumulation of human
capital, which is considered crucial to breaking the inter-generational transmission of poverty
(Rawlings 2004). CCTs have been widely implemented across Latin America21, where the
concept was originally developed, and a handful of other countries, 22 based mostly on the
success of Oportunidades (see Box 6).
Targeted interventions may be needed to offset girls’ opportunity costs of schooling and
cultural norms regarding the education of girls, which often inhibit enrollment rates.
Across the developing world, girls have significantly less education than boys, representing the
largest out-of-school population. In over half of developing countries, girls’ primary school
enrollment rates are at least 10 percentage points lower than those of boys. In Afghanistan,
females have 86 percent less schooling than men. Women in Bangladesh and Nigeria have
roughly 70 percent less schooling than men in those countries. Overall, the women of
developing countries have 45 percent less schooling than do men and are 30 percent less literate
than men (Todoro and Smith 2003). This gap in education inhibits women from taking
advantage of economic opportunities and contributing to the development process. In addition, it
hinders them from raising the living standards of their families (Deere and Leon 2003). Women
are among the most vulnerable groups in the developing world and their integration into society
and the economy in culturally and gender-specific ways is crucial to alleviating poverty.
21 Conditional cash transfer programs have been implemented in Colombia, Costa Rica, Honduras, Nicaragua, Bolivia, Ecuador, Chile, and Brazil. 22 Jamaica and Turkey are among a few non-Latin American countries that have implemented conditional cash transfer programs.

49
Box 6: The Mexican Experience with a Conditional Cash Transfer Program
Mexico’s Oportunidades program (formerly Progresa) was designed to promote investment in children’s human capital (future earnings) via increased schooling and improved health and nutrition status. Oportunidades provides cash transfers to poor rural families conditional on keeping children in school and providing them with basic preventive healthcare and nutrition. The benefit levels are intended to offset the opportunity costs of not sending children to school, and increase with grade level, recognizing that the opportunity cost of children’s time increases as they grow older. In 2004 the program reached 5 million families. Oportunidades has been very successful in targeting the poorest groups; program benefits are highly concentrated among the very poor. This program has been rigorously evaluated and the program has been shown to: (i) increase overall health, (ii) increase preventative health and nutrition monitoring visits, (iii) decrease the probability of stunting, (iv) increase school enrollment rates, (v) increase school continuation rates, (vi) slow the growth of poverty, (vii) decrease income inequality, (viii) decrease child labor rates, and (ix) increase consumption of more nutritious foods. It has a significant impact on education; primary school attendance increased by 2.2 percent – given a high enrollment rate of 92 percent – but secondary school attendance increased by 8.4 percent from a base of 65 percent. Based on this success, the program is about to be extended to urban areas. In addition, there is evidence that the program helped reduce the education gap between indigenous and non-indigenous children, as well as reducing the likelihood that an indigenous child would work. Sources: Bando et. al. 2005; Behrman and Hoddinott 2000; Gertler 2000; Hall et. al. 2002; Hoddinott et. al. 2000; Schultz 2000a; Schultz 2000b; SEDESOL 1999; Skoufias et. al. 2001.
Raising the human capital of women is a key element to breaking the inter-generational
transmission of poverty. International experience has shown that integrating gender themes into
development strategies and projects not only yields positive results, but is also one of the most
cost-effective interventions available to policy-makers. Reviews of development projects across
the globe “consistently show that expansion of basic education for girls earns among the highest
rates of return of any investment - much larger, for example, than most public infrastructure
projects” and is also a cost-effective way to improve overall health standards in communities
(Todoro and Smith 2003, p. 377).
While eliminating fees has been shown to promote girls’ school participation, many
countries use other targeted mechanisms to encourage families to send their daughters to school.
For example, Burkina Faso has proposed to remove fees for girls in the first and second grades.
50
Chad’s Education for All (EFA) strategy includes reduced fees for girls. Djibouti targets girls in
underprivileged areas. Ghana provides bicycles to girls (Tempest 2005). In Zambia, some
interventions have worked in tandem with the FBE policy to increase enrollments. The
Programme for the Advancement of Girls Education (PAGE) and a re-entry policy for pregnant
girls have improved access to education for girls, while the bursary schemes and the School
Health and Nutrition Programme have improved access for the poor. Due to the lower
enrollment rates of girls in secondary school in Mexico, Oportunidades grants received in those
years are higher for females than for males to offset the opportunity costs of sending them to
school, thus acting as an incentive to keep girls in school and close the gender gap in schooling.
Bangladesh’s Female Secondary School Assistance Program (FSSAP) has introduced mitigating
measures to offset school fees by providing monetary incentives for girls to reduce the direct
costs of schooling23 and to encourage participation, contingent on regular school attendance and
successful grade completion. One of the key objectives of The Gambia’s Third Education Sector
Program (TESP) is to increase the enrollment, retention and performance of girls attending
Grades 1 to 12. To help overcome barriers to girls’ education, such as poverty, the TESP
introduced a scholarship scheme for girls at the upper basic and secondary levels. Guatemala’s
Eduque a la Niña program represents another program that targets girls who are generally
underserved in the Guatemalan primary school system. A scholarship equivalent to US$4 a year
is given to each enrolled girl in a few poor villages to cover school-related costs (see Annex 9 for
more information on targeted schemes for girls).
Rigorous reviews of these programs demonstrate their success. Evaluations of Brazil’s
Bolsa Escola, which guarantees a minimum wage to every low-income family conditional on
keeping its children aged 7 to 14 years in school, indicate that the program has led to higher
enrollment rates, as well as reduction in both school drop-out and repetition rates. Evaluations of
Mexico’s Oportunidades program indicate that the program has significantly increased
enrollment rates, particularly for girls and for both boys and girls at the secondary level.
Evaluations of Guatemala’s Eduque a la Niña have found a positive impact on girls’
participation and performance. According to evaluations of Bangladesh’s FSSAP, the
23 Direct costs include tuition, examination costs, and an increasing proportion of school fees, textbooks, school supplies, uniforms, shoes , transport and kerosene (for lamps).

51
participating schools witnessed a sharp increase in female enrollment and there was a general
reduction in the drop-out rates of girls in participating schools.
Targeted efforts to ensure schooling for HIV/AIDS orphans and other vulnerable children
(OVC) should be part of any effort to improve access to schooling.
As noted above, there is a serious risk that HIV/AIDS orphans will not have access to schooling.
This points to the need for targeted programs for HIV/AIDS orphans. In addition to being at risk
of becoming an orphan, youth are at risk for becoming HIV positive. It is therefore important
that, in addition to reducing barriers to education for HIV/AIDS orphans, education systems
address HIV prevention.
Lost fee revenues must be offset.
A thoughtful plan to replace fee revenues is a necessary part of any fee abolition initiative.
Eliminating fees without commensurate government transfers to schools reduces the schools’
resource base (Oxfam 2001). Adequate timely financing will consider all costs so that schools
do not have to charge fees. In Kenya, the failure to provide such financing led to a standoff in
some rural communities, with schools demanding fees and parents refusing to pay them. Such
situations can be avoided by careful attention to financing and flow of funds issues from the
beginning (Boyle et. al. 2002).
There are four principal sources of such replacement revenues: shifting spending from
other sectors, shifting cost recovery to higher educational levels, improving efficiency of
education spending, and donor support. Countries may increase expenditure on education by
switching spending from other sectors or by increasing revenues. Shifting cost recovery to higher
educational levels would also increase financing for primary education. Government spending
on primary education is more likely to benefit the poor than at other educational levels because
poor students are less likely to advance to secondary and tertiary levels of education. For
example, as discussed above, in Indonesia in 1989, primary education subsidies for the poorest
20 percent of the population were almost twice as high as those for the richest 20 percent of the
population. In contrast, tertiary education subsidies for the poorest 10 percent of the population
were less than 1/18th of those for the richest 10 percent of population (van de Walle 1998).
Most countries have highly subsidized higher education systems, which only benefit the richer
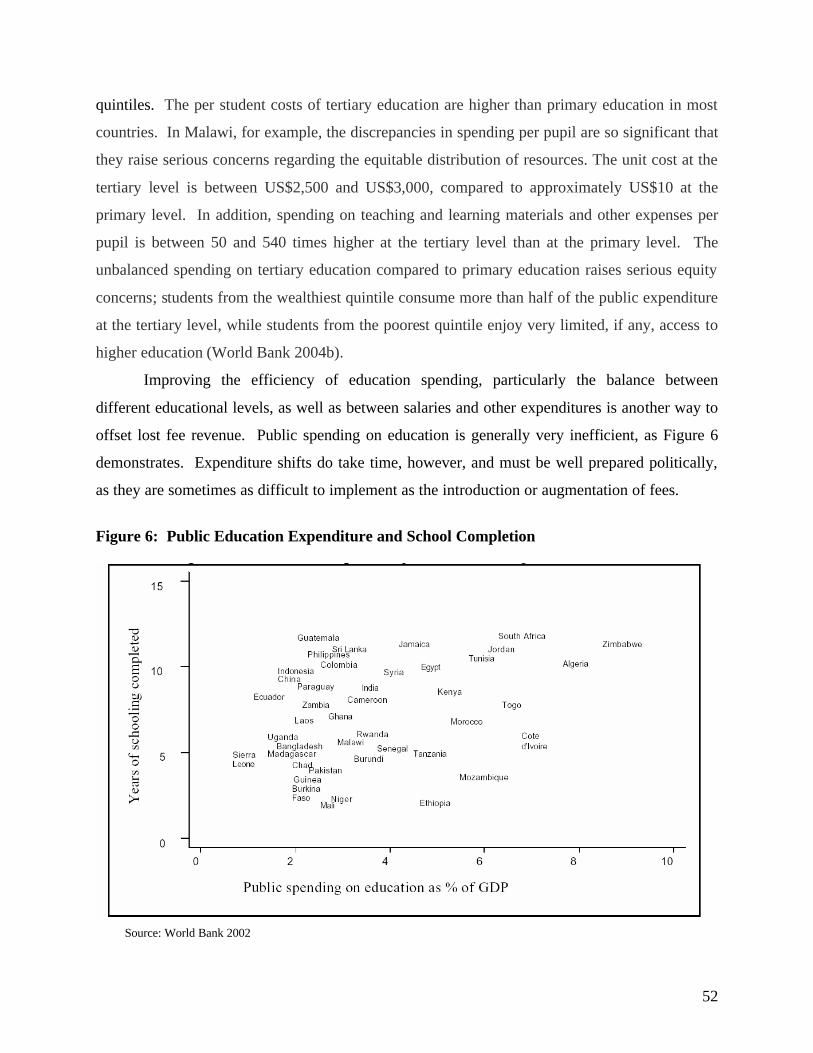
52
quintiles. The per student costs of tertiary education are higher than primary education in most
countries. In Malawi, for example, the discrepancies in spending per pupil are so significant that
they raise serious concerns regarding the equitable distribution of resources. The unit cost at the
tertiary level is between US$2,500 and US$3,000, compared to approximately US$10 at the
primary level. In addition, spending on teaching and learning materials and other expenses per
pupil is between 50 and 540 times higher at the tertiary level than at the primary level. The
unbalanced spending on tertiary education compared to primary education raises serious equity
concerns; students from the wealthiest quintile consume more than half of the public expenditure
at the tertiary level, while students from the poorest quintile enjoy very limited, if any, access to
higher education (World Bank 2004b).
Improving the efficiency of education spending, particularly the balance between
different educational levels, as well as between salaries and other expenditures is another way to
offset lost fee revenue. Public spending on education is generally very inefficient, as Figure 6
demonstrates. Expenditure shifts do take time, however, and must be well prepared politically,
as they are sometimes as difficult to implement as the introduction or augmentation of fees.
Figure 6: Public Education Expenditure and School Completion
Source: World Bank 2002

53
Donor support is critical. While additional domestic resources will be required for
sustainability in the long run, aid has a supporting role. Potential aid sources for achieving
universal primary education include Highly-Indebted Poor Countries (HIPC) debt relief funds
and other external support including bilateral, multilateral, and private foundation funding.
When the removal of user fees is explicitly stated in a country’s education plan, the Education
for All Fast Track Initiative (FTI) Catalytic Fund presents another potential source of support
(see Box 7). For example, the FTI Memorandum of Understanding for Uganda (World Bank
2002b) states that trigger points for the use of FTI funds will be used for quality enhancement in
addition to financial commitment of government and public expenditure management.
Box 7: The Education for All Fast Track Initiative
In 2002, the World Bank and thirty other regional, bilateral, and international development agencies created the Fast Track Initiative (FTI) to work towards ensuring that the Millennium Development Goal of universal primary education be met by 2015. Eligibility and compliance criteria are flexible: countries need only establish national education plans that prioritize universal primary education and have a poverty reduction strategy paper (PRSP) or equivalent document. In return, the FTI provides coordinated donor support in the forms of financial and technical assistance. Countries that do not have comprehensive education plans receive technical and capacity-building support through the FTI Education Program Development Fund to enable them to write their own education plans. An important component of the national education plans is an agreement and strategy for monitoring education outcomes and setting targets based on benchmarks that were developed through empirical analysis of successful Education for All (EFA) countries. It is expected that 40 countries will be receiving FTI support by the end of 2007 (World Bank 2004c; UNESCO 2004).
Using HIPC debt relief funds on a temporary basis may be one way to close the financing
gap in many heavily indebted countries over the next few years. In practice, because HIPC funds
are short-term funds, their use should be accompanied by measures to replace revenues on a
longer term basis. The HIPC Initiative, with its focus on improved budgetary management and
tracking of debt service relief has given International Development Association (IDA) borrowers
the ability to increase education expenditures and mobilize additional support, which can be
allocated to the education sector. A combination of HIPC funds and a start on improving
efficiency is the most likely route, and indeed has already been adopted through the Poverty

54
Reduction Strategy Paper (PRSP) process in several countries. Indeed, there is already some
evidence that the HIPC Initiative has played a pivotal role in the development and
implementation of education strategies, aimed at improving access to, and quality of, education
in many African countries (see Annex 10).
Careful advance planning of policy implementation is therefore essential, with estimation
of total costs and their calibration with macroeconomic prospects, government financing
capacity, and external assistance perspectives, to ensure sustainability. The overall impact to the
budget may be so large that free education may have to be phased in gradually, grade by grade.
Planning will have to address the medium-term and the long-term impact of free basic education,
taking into account the “knock on” effect of full participation in primary education (chiefly the
transition of future cohorts to lower secondary school where high fees will again restrict access
by the poor unless eliminated or mitigated).
A comprehensive fee abolition plan must address several critical teacher-related issues,
including, but not limited to, recruitment, training, and deployment, especially in rural areas.
While many countries have made the adjustment to recruit teachers, countries should also put
adequate efforts into training and effectively deploying teachers in an effective way. The
sustainability of teacher training should also be considered. In addition to teacher training, a
second critical aspect is the actual deployment of teachers with an eye for providing schools of
similar enrollments with comparable numbers of teachers.
In addition to fee elimination, other targeted programs or incentives must be put in place
to offset education-related fees, opportunity costs, and cultural norms regarding girls’ education.
Such incentives have great potential to improve educational opportunities for the disadvantaged
if complemented with strategies to address supply side constraints. Targeted efforts to ensure
schooling for HIV/AIDS orphans and other vulnerable children (OVC) should be part of any
effort to improve access to schooling.
Recommendations for Further Research
Significant fee obstacles at the lower-secondary level
As primary completion rates increase, transition to secondary and the cost of education at the
secondary level appears to be increasing in relevance. Fees at the secondary level tend to be
55
significant and substantially higher than fees at the primary level. In many countries, slow
growing and rural-based economies do not generate tax revenues to both achieve universal basic
education and provide publicly financed secondary education. Further research should be
undertaken to understand better the prevalence and impact of fees at this level.
Evidence of Decreased Parental Participation
The impact of fee elimination on parental and community participation is not well understood.
In some countries, such as Kenya, parental participation and transparency increased, while in
others, such as Zambia, communities stopped contributing to infrastructure improvements
because they interpreted the policy as meaning that the government would pay for all education
costs. In Malawi, teacher performance deteriorated as a result of reduced accountability
according to parents, who felt less compelled to monitor teachers, given the parents’ reduced
personal financial involvement (Hillman and Jekner 2002). A more detailed understanding of
this important issue would be a useful addition to the debate on user fees.
Overage Children
Governments continue to struggle with the issue of overage children. While this has quality
implications for schooling, it also points to the need for special programs to incorporate these
children into the education system and/or ensure that they have alternative opportunities. A
unique feature of the Tanzanian experience was expansion of non-formal education opportunities
for overage children who would be too old to benefit from the elimination of school fees due to
the phased-in approach. An evaluation of these types of programs is needed to assess their
impact for possible scaling up.
Sociopolitical response to fee removal
It would be helpful to have a discussion about what exactly is happening when governments
announce the abolition of certain fees. In general, there has been a massive public response even
though many fees remain. Is the government announcement a social signal to which parents
respond? Is the signal sometimes as important as the substance? Is the reason for recidivism
that parents come over time to realize the gap between the signal and the reality? Why do we see
56
the massive response in some countries and a collective shrugging of the shoulders in others?
What does all this mean for sustainability?
More analysis of mitigation strategies
The mitigation strategies mentioned in this report have largely been successful. A discussion of
those strategies that have failed would also be useful. What is the tipping point? Are they more
likely to fail in the absence of some strong communal ownership of the strategies, when left to
the initiative of the school personnel, or when parents have little voice in the life of the school?
What is the impact when fees are directly linked to a child's attendance, as opposed to when they
are of a more voluntary nature? Do we still believe there is a similar exclusion effect, even if it
is only due to social disapprobation, or self-censure?
In addition, it would be useful to carry out cost-benefit analyses of targeted versus free
education policies. A recent study in Kenya suggested that it would be cheaper to introduce
targeted mechanisms and reach the poorest of the poor than it would be to eliminate school fees
entirely (Vos et. al. 2004). However, well-targeted programs require good household-level data,
which may not be available in many low-income countries.
The impact of fees on learning
The connection between fees and learning is difficult to disentangle; it is both a demand and a
supply question. Here we consider the impact on demand. Demand for schooling tends to be
more sensitive to quality for poorer households and for girls (World Bank 2001a). Given certain
elasticity ranges, some argue that there is scope to increase fees without lowering enrollment if
the increased revenue was used to cross subsidize the poor (Birdsall 1987). Again, however,
such an argument fails to distinguish the different groups of actual and potential students,
especially by income group and by sex.
This presents a complex analytical dilemma. Does the evidence that demand for
education by the poor and by girls is relatively more sensitive to both price and quality mean that
there is a trade-off between price and quality? There is no clear empirical answer, but it is
important to note that the existence of fees does not, in and of itself, assure quality, though it
may sometimes contribute to it when the fees are used to provide books and other learning
materials. However, the presence of fees almost certainly deters enrollments by the poor and by
57
girls. As the world moves toward universal basic education, it is particularly important to
examine this possible trade-off in specific country circumstances.24
Government effectiveness in delivering education services
Little is actually known systematically about government effectiveness in delivering primary
education; an important area for future research will be the reliability of government provision of
education. If fees finance quality, they would need to be replaced. But fees often “disappear”
through various leakages and, at best, only partly finance quality inputs. Fees, especially for
such things as books, may well result in the provision of essential materials for learning and
hence improve educational quality. In practice, the evidence is not strong. One area where a
systematic review has been conducted is textbook charges – sales and rentals, which are
common. None of the textbook sales schemes in Africa supported by the World Bank seem to
have been successful in reaching the poor (Diop 2001). Even with price subsidies, for instance,
most rural primary students in Togo could not afford books, a full set of which represented more
than twice the average annual family spending on education. Fees for materials may, therefore,
improve learning among more affluent families, but they do not appear to help poor children.
24 An analytical study of what has happened in Malawi following the abolition of fees could be useful in this regard.
58
Bibliography
Ablo, Emmanuel, and Ritva Reinikka (1998). Do Budgets Really Matter? Evidence for Public Spending on Education and Health in Uganda.
African Development Fund (1999). Appraisal Report: Education Project III (Support to Basic Education) Republic of Zambia. African Development Bank. Abdijan, Cote d’Ivoire.
African Development Fund (2000). Appraisal Report: Support to the Education Strategic Investment Plan (Education II Project), Republic of Uganda. African Development Bank. Abdijan, Cote d’Ivoire.
African Development Fund (2002). Strategic Plan 2003-2007. African Development Bank. Abdijan, Cote d’Ivoire.
African Development Fund (2003). Education III Project- Strengthening and Expanding Access to Appropriate Secondary Education and Skills Acquisition Appraisal Report, Republic of Kenya. African Development Bank. Abdijan, Cote d’Ivoire.
Asian Development Bank (2003). Our Framework: Policies and Strategies, Education. ADB. Manila, Philippines.
Avenstrup, Roger, Xiaoyan Liang, and Soren Nelleman (2004). “Kenya, Lesotho, Malawi, and Uganda: Universal Primary Education and Poverty Reduction.” Reducing Poverty, Sustaining Growth- What Works, What Doesn’t, and Why: A Global Exchange for Scaling Up Success.” Presented at the Scaling Up Poverty Reduction: A Global Learning Process and Conference, Shanghai, May 25-27.
Bando, Rosangela, Luis F. Lopez-Calva, and Harry Anthony Patrinos (2005). “Child Labor, School Attendance, and Indigenous Households: Evidence from Mexico.” World Bank Policy Research Working Paper No. 3487. World Bank. Washington, DC.
Behrman, Jere R. and John Hoddinott (2000). An Evaluation of the Impact of Progresa on Pre-School Child Height. IFPRI. Washington, D.C.
Bentaouet Kattan, Raja and Nicholas Burnett (2004). User Fees in Primary Education. Education for All Working Paper. World Bank. Washington, DC.
Birdsall, Nancy and Francois Orivel (1996). “Demand for Primary Schooling in Rural Mali: Should User Fees be Increased?” Education Economics, 4(3).
Boyle, Siobhan, Andy Brock, John Mace and Mo Sibbons (2002). Reaching the Poor: the Costs of Sending Children to School. United Kingdom Department for International Development.
Bray, Mark (1996). Counting the Full Cost: Parental and Community Financing of Education in East Asia. World Bank. Washington, DC.
Bray, Mark (1999). The Shadow Education System: Private Tutoring and its Implications for Planners. UNESCO: IIEP.

59
Bray, Mark (2001). “Government and Household Financing of Education: Finding Appropriate Balances.” Presented at the International Conference of Economics of Education, Beijing University.
Bray, Mark and Seng Bunly (2005). Balancing the Books: Household Financing of Basic Education in Cambodia. Comparative Education Research Centre (University of Hong Kong) and the World Bank. Hong Kong and Washington, DC.
Bush, Tony and Jan Heystek (2003). “School Governance in the New South Africa.” Compare: A Journal of Comparative Education, 33(2): 127-138.
Deere, Carmen Diana and Magdalena Leon. 2003. “The Gender Asset Gap: Land in Latin America.” World Development 31(6): 925-47. Great Britain.
Deininger, Klaus (2003). “Does Cost of Schooling Affect Enrollment by the Poor? Universal Primary Education in Uganda.” Economics of Education Review 22, pp: 291-305.
UK Department for International Development (DFID) (1999). Learning Opportunities for All: A Policy Framework for Education. London, UK.
Deolalikar, Anil B (1997). The Determinants of Primary School Enrollment and Household Schooling Expenditures in Kenya: Do They Vary by Income? University of Washington, Seattle, WA.
Filmer, D. and L. Pritchett: ‘Household Wealth and Educational Attainment: Evidence from 35 Countries, Population and Development Review 25 (1), March 1998, pp.85-120.
Fiske, Edward B. and Helen F. Ladd (2003). Balancing Public and Private Resources for Basic Education: School Fees in Post-Apartheid South Africa. Terry Sanford Institute of Public Policy Working Paper SAN03-03. Duke University. Durham, North Carolina.
Gershberg, Alec Ian and Ben Meade (2005). “Parental Contributions, School-Level Finances and Decentralization: An Analysis of Nicaraguan Autonomous School Budgets.” Comparative Education 42 (3): 291-308.
Gertler, Paul (2000). Final Report: The Impact of Progresa on Health. IFPRI. Washington, D.C.
Gertler, Paul and Paul Glewwe (1990). “The Willingness to Pay for Education in Developing Countries.” Journal of Public Economics, 42: 251-275.
Gilmour, J. (2001). “Intention or Tension? Recent Education Reforms in South Africa” International Journal of Educational Development, 21: 5-19.
Global Campaign for Education (2004). Undervaluing Teachers: IMF Policies Squeeze Zambia’s Education System. Policy Briefing Paper.
Government of South Africa (1996). South African Schools Act, 1996. President’s Office No. 1867. November15 ( No. 84).
Government of South Africa (2004). National Norms and Standards for School Funding: Proposals for Amendments. Department of Education. Pretoria.
Government of Tanzania (2001). Education Sector Development Programme: Primary Education Development Plan (2002-2006).
60
Hinchcliffe, Keith (2004). Notes on the Impact of the HIPC Initiative on Public Expenditures in Education and Health in African Countries. Africa Region Human Development Working Paper. International Monetary Fund. Washington, DC.
Hillman, Arye L. and Eva Jenkner (2002). User Payments for Basic Education in Low-Income Countries. IMF Working Paper 02/182. International Monetary Fund, Washington, DC.
Hirschmann, David. 1998. “Civil Society in South Africa: Learning from Gender Themes.” World Development 26(2): 227-38. Great Britain.
Hoddinott, John, Emmanuel Skoufias, and Ryan Washburn (2000). The Impact of Progresa on Consumption: A Final Report. IFPRI. Washington, DC.
Holmes, Jessica (1999). Measuring the Determinants of School Completion in Pakistan: Analysis of Censoring and Selection Bias. Economic Growth Center Discussion Paper No. 794. Yale University. New Haven, CT.
Inter-American Development Bank (2000). Reforming Primary and Secondary Education in Latin America and the Caribbean: An IDB Strategy. IDB. Washington, DC.
International Monetary Fund (1998). Uganda: Initiative for Highly Indebted Poor Countries Completion Point Document. International Monetary Fund. Washington, DC.
International Monetary Fund (2000a). Decision Point Document under the Enhanced Heavily Indebted Poor Countries Initiative: Tanzania. International Monetary Fund. Washington, DC.
International Monetary Fund (2000b). Decision Point Document under the Enhanced Initiative for Highly Indebted Poor Countries, Cameroon. International Monetary Fund. Washington, DC.
International Monetary Fund (2000c). Decision Point Document under the Enhanced Heavily Indebted Poor Countries Initiative: Zambia. International Monetary Fund. Washington, DC.
International Monetary Fund (2000d). Uganda: Initiative for Highly Indebted Poor Countries Second Completion Point Document. International Monetary Fund. Washington, DC.
International Monetary Fund (2004). Zambia: Joint Staff Assessment of the Poverty Reduction Strategy Paper Progress Report. International Monetary Fund. Washington, DC.
Kabeer, Naila.2001. “Conflicts Over Credit: Re-evaluating the Empowerment Potential of Loans to Women in Rural Bangladesh.” World Development 29(1): 63-84. Great Britain.
Klein, Joe. 1995. “Mothers vs. Mullahs: A Program Favored by Hillary Clinton Meets Islamic Resistance.” Newsweek. April 17.
Kwarteng, K.A. (2005). “Enemies of Free Education!” Ghanaian Chronicle. August 19.
Lavy, Victor (1996). “School Supply Constraints and Children’s Educational Outcomes in Rural Ghana.” Journal of Development Economics, 51: 291-314.
Lemon, Anthony (2004). “Redressing School Inequalities in the Eastern Cape, South Africa.” Journal of Southern African Studies, 20(2): 269-290).
61
Lerotholi, Liteboho Maqalika (2001). Tuition Fees in Primary and Secondary Education in Lesotho: the Levels and Implication for Access, Equity, and Efficiency. Financial Management of Education Systems Series. UNESCO and International Institute for Educational Planning. Paris.
Jimenez, Emmanuel. (1987). Pricing Policies in the Social Sectors. World Bank. Washington, DC.
Jimenez and Paqueo (1996). “Do Local Contributions Affect the Efficiency of Public Primary Schools?” Economics of Education Review, Vol 15, No. 4, pp. 377-86.
Makongo, Japhet (2003). Implementation of the Primary Education Development Plan: Are We Achieving its Goals? HakiElimu Working Paper No. 2. Dar es Salaam, Tanzania.
Mehrotra, Santosh and Richard Jolly (1997). Development with a Human Face. Oxford University Press, United Kingdom.
Mwansa, Audrey C., Alex Kaba, Lucas Zulu, John Kalokoni, and Griffin Nyirongo (2004). Free Basic Education (Grades 1-7) Policy Implementation Assessment. Ministry of Education. Lusaka, Zambia.
Mukudi, Edith (2004). “The Effects of User-Fee Policy on Attendance Rates Among Kenyan Elementary School Children.” International Review of Education, 50 (5-6): 447-61.
Oxfam (2001). Education Charges: A Tax on Human Development. Oxfam Briefing Paper #3.
Pacific News (2005). 2005 Heralds Free Education for Solomon Islands Children. January 4th.
Parandekar, Suhas (n.d.). Willingness to Pay for School Quality: An Empirical Examination. Tulane University. New Orleans.
Patrinos, Harry and Faraaz Siddiqui (1995). “Child Labor: Issues, Causes, and Interventions.” Human Capital Development and Operations Policy Working Papers. The World Bank. Washington, DC.
Rawlings, Laura B. (2004). A New Approach to Social Assistance: Latin America’s Experience with Conditional Cash Transfer Programs. Social Protection Discussion Paper No. 0416. Washington, DC.
Saroso, Oyos (2005). “The Poor Still Waiting for Government Assistance.” The Jarkarta Post, March 23, 2005.
Schultz, Paul T. (2000a). Final Report: The Impact of Progresa on School Enrollments. IFPRI. Washington, D.C.
Schultz, Paul T. (2000b). Impact of Progresa on School Attendance Rates in the Sampled Population. IFPRI. Washington, D.C.
SEDESOL (Secretaria de Desarrollo Social) (1999). Mas Oportunidades para las Familias Pobres. Evaluación de Resultados del Programa de Educacion, Salud y Alimentación. Primeros Avances. México DF.
Sipahimalani, Vandana (1999). Education in the Rural Indian Household: The Impact of Household and School Characteristics on Gender Differences. Working Paper 68. National Council of Applied Economic Research, New Delhi.
62
Skoufias, Emanuel, Benjamin Davis, and Sergio de la Vega (2001). Targeting the Poor in Mexico: An Evaluation of the Selection of Households into Progresa. World Development. Vol. 29, No. 10, pp. 1769-1784. Great Britian.
Tembo, Benedict and Gershom Ndhlovy (2005). “Government Strives to Increase Access to Education.” News from Africa. Kenya.
Todoro, Michael and Stephen Smith. 2003. “Human Capital: Education and Health in Economic Development.” Economic Development. United Kingdom.
Uganda Bureau of Statistics (2002/03). Household Survey. UBOS. Entebbe, Uganda.
Uganda Bureau of Statistics (2004a). Uganda Education Statistics Abstract. UBOS. Entebbe, Uganda.
Uganda Bureau of Statistics (2004b). National Service Delivery Survey 2004. UBOS. Entebbe, Uganda.
Uganda Ministry of Education (n.d.). Education Management Information System. Kampala, Uganda.
Uganda Ministry of Finance, Planning, and Economic Development (n.d.). http://www.finance.go.ug/
UNAIDS (2005). Educate Girls. Fight Aids. The Global Coalition on Women and Aids. Washington, DC and Geneva, Switzerland.
UNICEF (1998). Addis Ababa Consensus on Principles of Cost Sharing in Education and Health. New York.
UNICEF (2004). Girls, HIV/AIDS and Education. UNICEF. New York.
UNICEF (2005a). Levels, Trends and Determinants of Primary School Participation and Gender Parity. UNICEF. New York.
UNICEF (2005b). The State of the World’s Children 2005: Childhood Under Threat. UNICEF. New York.
UNICEF(2005). Overcoming Financial Barriers to Children’s Participation in Education: Actions for Children Affected by AIDS in Sub-Saharan Africa. DRAFT.
UNESCO (2004). Education Today. No 10 (pp. 4-9).
UNESCO (2003/04). Global Monitoring Report 2003/04.
UNESCO (2005). Challenges of Implementing Free Primary Education in Kenya: Assessment Report. UNESCO. Nairobi, Kenya.
USAID (2005). Education Strategy: Improving Lives Through Learning. USAID. Washington, DC.
Update on the Krygyz Republic. (1999). Washington DC: The World Bank.
Van de Walle, Dominique (1998). “Targeting Revisited.” The World Bank Observer 13(2): 231-48. Washington, DC.
63
Vos, Rob, et. al. (2004). Achieving Universal Primary Education: Can Kenya Afford It? Department of Economics Working Paper Series #2004-47. University of Connecticut. Storrs, CT.
Watkins, Kevin (2001). The Oxfam Education Report. Oxfam Great Britain. UK.
World Bank (2001a). Engendering Development. World Bank, Washington, DC.
World Bank (2001b). Implementation Completion Report: Education Sector Adjustment Operation: Uganda. World Bank, Washington, DC.
World Bank (2002a). Education and Poverty in Timor-Leste. World Bank. Processed.
World Bank (2002b). Achieving Universal Primary Education in Uganda: The Big Bang Approach. Education Notes. World Bank. Washington, DC.
World Bank (2002c). The Changing Distribution of Public Education Expenditure in Malawi. Africa Region Working Paper Series, Number 29. World Bank, Washington, DC.
World Bank (2003a). Project Appraisal Document: Free Primary Education Support Project (Republic of Kenya). World Bank. Washington, DC.
World Bank (2003b). Mexico: Southern States Development Strategy. World Bank. Washington, DC.
World Bank (2004a). Democratic Republic of Congo Country Status Report on Education: Priorities and Options for Regenerating the Education Sector. World Bank. Washington, DC.
World Bank (2004b). Cost, Financing, and School Effectiveness of Education in Malawi: A Future of Limited Choices and Endless Opportunities. Africa Region Human Development Working Paper Series. World Bank. Washington, DC.
World Bank (2004c). Framework for Education for All-Fast Track Initiative: Accelerating Progress Towards Quality Universal Primary Education. World Bank, Washington DC.
World Bank (2004d). Project Performance Assessment Report: Primary Education and Teacher Project and Education Sector Adjustment Credit: Uganda. World Bank. Washington, DC.
World Bank (2004e). World Development Report: Making Services Work for the Poor. World Bank. Washington, DC.
World Bank (2005a). Implementation Completion Report: Primary Education Development Program (Tanzania). World Bank. Washington, DC.
World Bank (2005b). Mozambique Poverty and Social Impact Analysis: Primary School Enrollment and Retention- The Impact of School Fees. World Bank. Washington, DC.
World Bank (2005c). EFA and Beyond: Service Provision and Quality Assurance in China. Education Notes, July. World Bank. Washington, DC.
World Bank (2005d). Vietnam Managing Public Expenditure for Poverty Reduction and Growth: Public Expenditure Review and Integrated Fiduciary Assessment. World Bank. Washington, DC.

64
World Bank (2005e). Project Appraisal Document for An Education Development Capacity Building Project (Cameroon). World Bank. Washington, DC.
World Bank (2005f). Cambodia Basic Education for All Study. World Bank. Washington, DC.
World Bank (2005g). Project Appraisal Document: Education Sector Support Project, Kingdom of Cambodia. World Bank. Washington, DC.
World Bank (2005h). Project Appraisal Document on a Proposed IDA Credit to the Government of Kenya for an Education Sector Support Project. World Bank. Washington, DC.
World Bank and Lesotho’s Ministry of Education and Training (2005). Primary and Secondary Education in Lesotho: A World Bank Country Status Report for Education.
Yardley, Jim (2005). “China Plans to Cut School Fees for its Poorest Rural Students.” The New York Times. March 13, 2005.
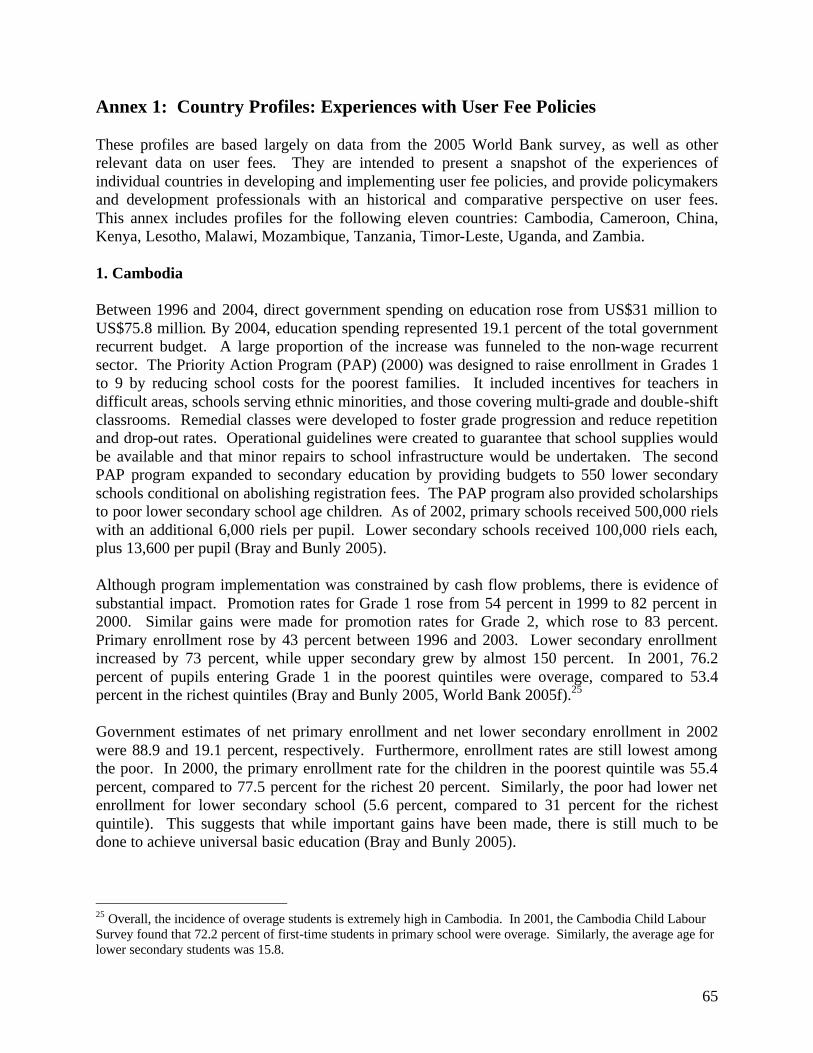
65
Annex 1: Country Profiles: Experiences with User Fee Policies These profiles are based largely on data from the 2005 World Bank survey, as well as other relevant data on user fees. They are intended to present a snapshot of the experiences of individual countries in developing and implementing user fee policies, and provide policymakers and development professionals with an historical and comparative perspective on user fees. This annex includes profiles for the following eleven countries: Cambodia, Cameroon, China, Kenya, Lesotho, Malawi, Mozambique, Tanzania, Timor-Leste, Uganda, and Zambia. 1. Cambodia
Between 1996 and 2004, direct government spending on education rose from US$31 million to US$75.8 million. By 2004, education spending represented 19.1 percent of the total government recurrent budget. A large proportion of the increase was funneled to the non-wage recurrent sector. The Priority Action Program (PAP) (2000) was designed to raise enrollment in Grades 1 to 9 by reducing school costs for the poorest families. It included incentives for teachers in difficult areas, schools serving ethnic minorities, and those covering multi-grade and double-shift classrooms. Remedial classes were developed to foster grade progression and reduce repetition and drop-out rates. Operational guidelines were created to guarantee that school supplies would be available and that minor repairs to school infrastructure would be undertaken. The second PAP program expanded to secondary education by providing budgets to 550 lower secondary schools conditional on abolishing registration fees. The PAP program also provided scholarships to poor lower secondary school age children. As of 2002, primary schools received 500,000 riels with an additional 6,000 riels per pupil. Lower secondary schools received 100,000 riels each, plus 13,600 per pupil (Bray and Bunly 2005). Although program implementation was constrained by cash flow problems, there is evidence of substantial impact. Promotion rates for Grade 1 rose from 54 percent in 1999 to 82 percent in 2000. Similar gains were made for promotion rates for Grade 2, which rose to 83 percent. Primary enrollment rose by 43 percent between 1996 and 2003. Lower secondary enrollment increased by 73 percent, while upper secondary grew by almost 150 percent. In 2001, 76.2 percent of pupils entering Grade 1 in the poorest quintiles were overage, compared to 53.4 percent in the richest quintiles (Bray and Bunly 2005, World Bank 2005f).25 Government estimates of net primary enrollment and net lower secondary enrollment in 2002 were 88.9 and 19.1 percent, respectively. Furthermore, enrollment rates are still lowest among the poor. In 2000, the primary enrollment rate for the children in the poorest quintile was 55.4 percent, compared to 77.5 percent for the richest 20 percent. Similarly, the poor had lower net enrollment for lower secondary school (5.6 percent, compared to 31 percent for the richest quintile). This suggests that while important gains have been made, there is still much to be done to achieve universal basic education (Bray and Bunly 2005).
25 Overall, the incidence of overage students is extremely high in Cambodia. In 2001, the Cambodia Child Labour Survey found that 72.2 percent of first-time students in primary school were overage. Similarly, the average age for lower secondary students was 15.8.

66
A recent study found that the household costs of education decreased between 1997 and 2004 due to the program (Bray and Bunly 2005).26 In the late 1990s, 59 percent of the total costs of primary education in Cambodia were covered by households and communities, with the government only providing 12.5 percent, and the remaining amount coming from other sources. In real terms, costs were 33.4 and 41.8 percent of 1997 levels for Grades 1 and 6, respectively. Household financing as a share of total primary education expenditures fell from an estimated 76.9 percent in 1997 to 55.6 percent in 2004 (Bray and Bunly 2005). Donor Response The World Bank’s Education Sector Support Project strives to improve equitable access to schooling, principally by reducing household costs of schooling and through developing school infrastructure, as well as improving education quality and efficiency. Project components include expanding educational facilities in poor and underserved areas, reducing access barriers for disadvantaged children, strengthening decentralized quality education service delivery, establishing a national assessment monitoring system, and giving assistance to the government’s Education Sector Support Program (ESSP). Sixty-seven (67) percent of the grant-loan combination (a US$8 million loan and a US$20 million grant) will be used to finance the access and quality components (World Bank 2005g).
26 The 2004 study followed up on Bray’s 1997 (Bray 1999) study of household costs, which had collected data from 77 primary schools. The 2004 study returned to those same schools and added 39 lower secondary schools.
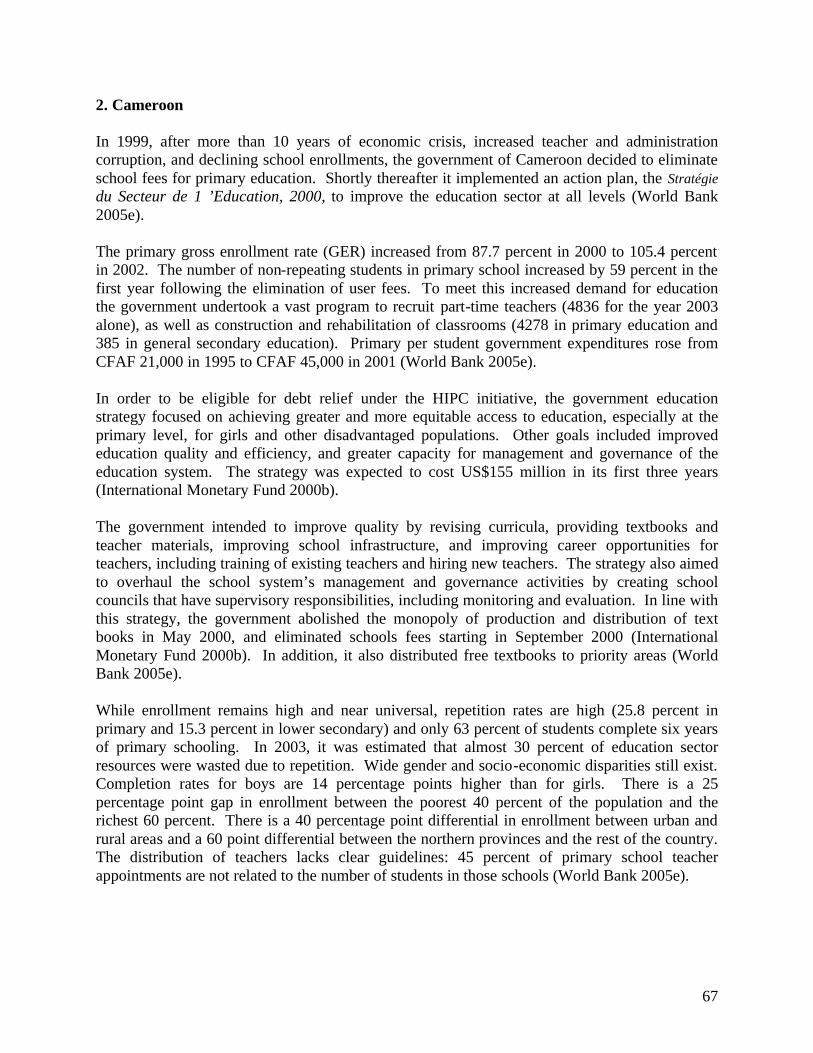
67
2. Cameroon In 1999, after more than 10 years of economic crisis, increased teacher and administration corruption, and declining school enrollments, the government of Cameroon decided to eliminate school fees for primary education. Shortly thereafter it implemented an action plan, the Stratégie du Secteur de 1 ’Education, 2000, to improve the education sector at all levels (World Bank 2005e). The primary gross enrollment rate (GER) increased from 87.7 percent in 2000 to 105.4 percent in 2002. The number of non-repeating students in primary school increased by 59 percent in the first year following the elimination of user fees. To meet this increased demand for education the government undertook a vast program to recruit part-time teachers (4836 for the year 2003 alone), as well as construction and rehabilitation of classrooms (4278 in primary education and 385 in general secondary education). Primary per student government expenditures rose from CFAF 21,000 in 1995 to CFAF 45,000 in 2001 (World Bank 2005e). In order to be eligible for debt relief under the HIPC initiative, the government education strategy focused on achieving greater and more equitable access to education, especially at the primary level, for girls and other disadvantaged populations. Other goals included improved education quality and efficiency, and greater capacity for management and governance of the education system. The strategy was expected to cost US$155 million in its first three years (International Monetary Fund 2000b). The government intended to improve quality by revising curricula, providing textbooks and teacher materials, improving school infrastructure, and improving career opportunities for teachers, including training of existing teachers and hiring new teachers. The strategy also aimed to overhaul the school system’s management and governance activities by creating school councils that have supervisory responsibilities, including monitoring and evaluation. In line with this strategy, the government abolished the monopoly of production and distribution of text books in May 2000, and eliminated schools fees starting in September 2000 (International Monetary Fund 2000b). In addition, it also distributed free textbooks to priority areas (World Bank 2005e). While enrollment remains high and near universal, repetition rates are high (25.8 percent in primary and 15.3 percent in lower secondary) and only 63 percent of students complete six years of primary schooling. In 2003, it was estimated that almost 30 percent of education sector resources were wasted due to repetition. Wide gender and socio-economic disparities still exist. Completion rates for boys are 14 percentage points higher than for girls. There is a 25 percentage point gap in enrollment between the poorest 40 percent of the population and the richest 60 percent. There is a 40 percentage point differential in enrollment between urban and rural areas and a 60 point differential between the northern provinces and the rest of the country. The distribution of teachers lacks clear guidelines: 45 percent of primary school teacher appointments are not related to the number of students in those schools (World Bank 2005e).
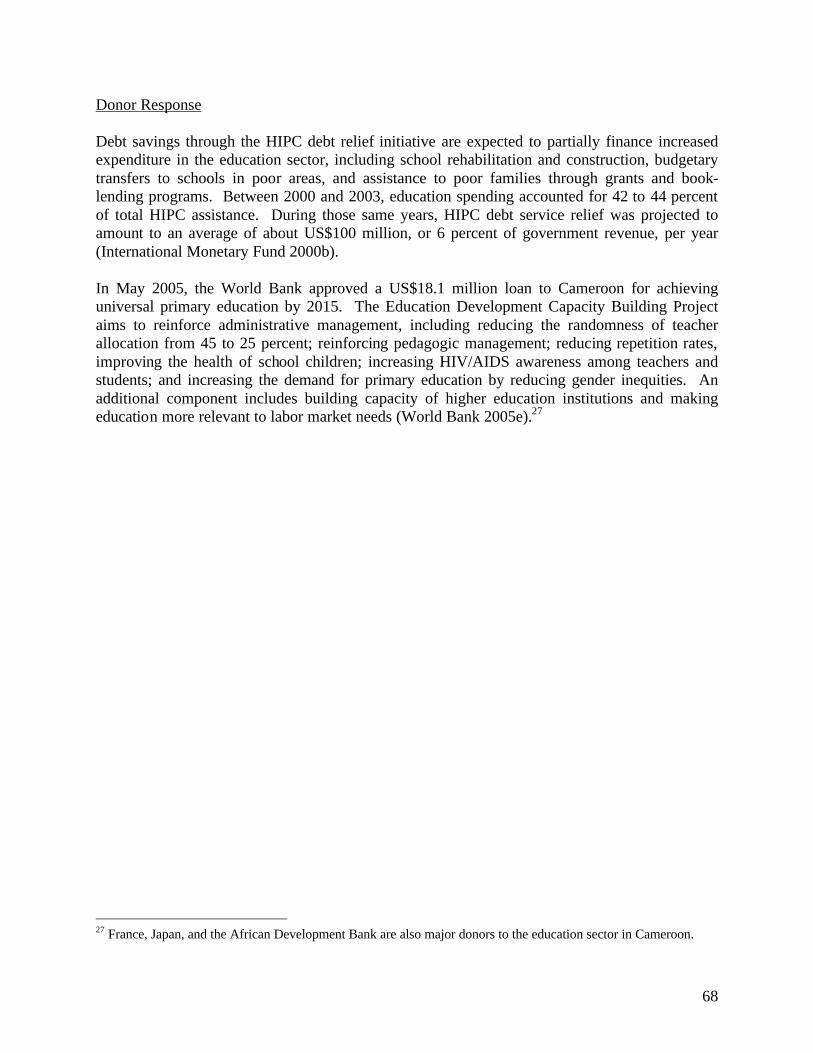
68
Donor Response Debt savings through the HIPC debt relief initiative are expected to partially finance increased expenditure in the education sector, including school rehabilitation and construction, budgetary transfers to schools in poor areas, and assistance to poor families through grants and book-lending programs. Between 2000 and 2003, education spending accounted for 42 to 44 percent of total HIPC assistance. During those same years, HIPC debt service relief was projected to amount to an average of about US$100 million, or 6 percent of government revenue, per year (International Monetary Fund 2000b). In May 2005, the World Bank approved a US$18.1 million loan to Cameroon for achieving universal primary education by 2015. The Education Development Capacity Building Project aims to reinforce administrative management, including reducing the randomness of teacher allocation from 45 to 25 percent; reinforcing pedagogic management; reducing repetition rates, improving the health of school children; increasing HIV/AIDS awareness among teachers and students; and increasing the demand for primary education by reducing gender inequities. An additional component includes building capacity of higher education institutions and making education more relevant to labor market needs (World Bank 2005e).27
27 France, Japan, and the African Development Bank are also major donors to the education sector in Cameroon.

69
3. China Despite notable achievements in China, specifically the central government’s declaration that the first nine years of compulsory education should be provided to all students, there is increasing debate regarding the equity and fairness of compulsory education. In urban areas, public schools are increasingly a focus of criticism because of their market orientation, since some public schools at compulsory level charge high fees and some teachers devote time on private tutoring for extra income. In rural areas, the concern is the lack of financial and human resources to support schools, since rural schools face severe shortage of teachers and increasing dropout rates (World Bank 2005c). The above issues are closely associated with the current funding system for basic education. All public schools are under-funded by the government. Some principals argue that 25 to 50 percent of the operational expense of school has to be raised at the school level. A critical part of the funds go to the payment for teachers’ salary and school construction. According to current government policy, a teacher’s salary consists of two parts: basic salary and bonus. The government only pays the basic salary, and the amount of bonus is dependent on the principals’ capacity to raise additional funds for teachers. The latter is a condition for maintaining good teachers. However, principals have no prior training or experience in fundraising. This situation is more common in urban areas, while in rural areas the main concern is whether teachers can receive basic salaries on time (World Bank 2005c). Charging tuition at the compulsory level is forbidden by law, but miscellaneous fees and textbook fee collection are allowed during this stage. However in some urban schools, extra fees are often collected in the form of a “joint construction fee” or “education donation and assistance” for some students. The donations range from 30,000 to 100,000 yuan28 for each student for the duration of middle school years. The practice of charging fees is prohibited by the national and local governments. The local governments often define the fee scale for miscellaneous fees and textbook fees, collecting a certain percentage from schools as an additional source of funding. The district or municipal governments draw 25 to 50 percent of the amount of money collected by schools, which is then used for the purpose of helping other schools to repair their school buildings and improve their facilities. The remaining may be spent at the principals’ discretion. Common fees include a two time per year book fee of 80 yuan in urban areas and 65 yuan in rural areas. In addition, more elite public schools often charge a required “donation” from non-qualified students to cover various expenses (World Bank 2005c). Public schools in rural areas have neither the resources nor the student populations required to generate the necessary funds. Under decentralized management, which places financial responsibilities at the county level, there is a huge disparity in the student expenditure between urban and rural areas, and between provinces. According to official statistics in 2001, per student expenditure in Guizhou, an economically disadvantaged province, ranges from 887 yuan for urban areas to 485 yuan in rural areas. In comparison, in Shanghai per student expenditure ranges from 5,886 yuan in urban areas to 3,605 yuan in rural areas (World Bank 2005c).
28 The exchange rate is approximately 8.27 Chinese yuan to US$1.

70
The national government has made an effort to compensate the loss of revenue in poor areas by directing funds to western poor provinces. According a speech given by the Minister of Education, “till 2002, the national government has paid 60 percent of the education finances in the western areas, including 78 percent of local teachers’ salaries. The fund of rural transferable payments reached 10 billion yuan per year.” No data are available to show if the funds have reached the designated recipients and are effectively used (World Bank 2005c). Since 2004, government support has been increased through many national and provincial programs. A “one-fee” policy, which combined all fees, has been conducted nationwide to lower the burden for poor families. However, school fees still account for up to a quarter or more of rural families’ annual income. And these school fees are leading to growing inequities between rural and urban residents because urban residents earn as much as three times the amount that farmers earn. In response to growing inequity, Prime Minister Wen Jiabao announced that fees will begin to be fully removed for 14 million students in the country’s poorest communities, and will continue to be removed until 2007, at which time all rural students will receive free primary education (Yardley 2005).

71
4. Kenya Throughout the 1990s, gross primary school enrollment declined from 105 percent in 1989 to 86 percent in 2002, due to a foundering economy and rising poverty rates. Immediately following the 2002 elections, the new Government announced its commitment to Free Primary Education (FPE) as its top priority, abolishing primary school fees in 2003. Free Primary Education (FPE) resulted in a major jump in enrollment for the first school term of 2003 (1.2 million new students) indicating that the previous costs were the biggest constraint on many children attending school. By 2003, gross primary enrollment was 104 percent. The net primary enrollment rate rose from 80 percent in 2003 to about 82 percent in 2005 (World Bank 2003a, World Bank 2005h). Most of the new enrollees were children who had never attended school or who had previously dropped out. And while the primary completion rate is still low at 57 percent, the drop-out rate has improved. Kenya is on track to meet the Universal Primary Education (UPE) MDG, but the country can only do so if its new policies continue to be implemented effectively and the government’s commitment is sustained. Many challenges remain and the gains under FPE could be lost without further investment, especially in the areas of education quality. Disparities still exist between boys and girls, with a net enrollment rate for girls of 81 percent. In addition, about 1 million school-age children, still do not have access to schooling. Most of these children live in urban slums, in the Arid and Semi-Arid Lands (ASAL) areas, and in other parts of the country where poverty is pervasive. The large influx of students has meant that schools with already meager resources are overflowing. In most cases, the school infrastructure is insufficient to meet increased demand for schooling, buildings are in disrepair and there are not enough classrooms and latrines. There is also evidence that the specific needs of girls and orphans are not being met. Improving the quality of education is also a major challenge. The results from the Southern and Eastern Africa Consortium for Monitoring of Educational Quality (SACMEQ) study show that while Kenya performs better than most other SACMEQ countries, performance varies within the country. For example, students in large urban areas have the highest scores, followed by students in small towns. Students in isolated, rural areas exhibit the lowest scores. Student to teacher ratios have risen, from an average of 31:1 to 40:1. And while this is not viewed as a major constraint, there is some evidence that class sizes are extremely large in some schools, indicating that the allocation of teachers can be improved.29 In general, the school system presents a problem of inefficient use of resources, where high costs do not yet translate into high quality. The Government is well aware of the education challenges and it has begun to take steps to improve the situation. Free Primary Education was accompanied by significant curriculum changes, including a reduction in the number of primary subjects taught. Furthermore, the number of primary subjects has already been reduced and further curriculum changes will be introduced in all of the primary school standards (1-8) over next four years. The Government has agreed to use multi-grade teachers in some schools. As part of a move towards increased decentralization, the selection of teachers for primary schools has been moved down to the district level, and to the school level for teachers in secondary schools. In addition, the Government has developed an education sector plan, spanning the period 2005-2010. The plan 29 The Government recently undertook a teacher “balancing” exercise (World Bank 2005h).

72
was developed in consultation with a wide range of stakeholders. Furthermore, extensive cost and budget analysis has been carried out for the Kenya Education Sector Support Project (KESSP) (World Bank 2005h). One of the most successful components of the FPE is a system of block grants given directly to schools. The grants are used to finance materials and textbooks, as well as for other spending such as minor maintenance and salaries for non-teaching staff. The funds are allocated to schools on a per student basis and are updated every term. School management committees and PTAs manage the funds and post the amount of funds received and expenditures for public viewing. The experience so far has been quite successful. There is a positive equity effect because expenditures of this type were formerly largely covered by households through the payment of school fees. The textbook to student ratio has improved to 3:1 for standards 1-4 and 2:1 for standards 5-8. In addition, this process of decentralization of funds and responsibilities has improved transparency and accountability (World Bank 2005h). The total allocation for such capitation grants amounted to KSh 9 billion in the 2003/04 budget, representing 12.5 percent of the recurrent education budget. The amount that needs to be spent on capitation grants in the long term is not entirely clear. Although there is a need for sustained, relatively high levels of spending in the medium-term to catch up with current deficits in textbooks and to accommodate the costs of shifting to a new curriculum, the Ministerial Public Expenditure Review (MPER) does not suggest that the current level of the capitation grant is inadequate, and the equilibrium level might be about KSh 6-7 billion per year. However, in the initial years, a large part of the capitation grants had been funded by the Department for International Development (DFID) and the World Bank. These capitation grants clearly need to be worked into regular recurrent budgets to ensure sustained funding predictability. There is also some concern regarding the need for monitoring and reporting on the use of these funds. Government spending on education represents about 7 percent of GDP and has ranged between 25 and 30 percent of total government spending over the last five years. The government budget for education includes funds earmarked for core poverty reduction activities, representing about 16 percent of the total education budget (US$170 million). Primary education spending accounts for 54 percent of the total education budget, of which 86 percent is used to pay teachers’ salaries. The enormous resources consumed by teachers’ salaries are a cause for concern as shrinking funds for non-salary expenditures will likely lead to further quality deterioration and, thus, an increase in the drop-out rate. The World Bank (2005h) suggests that “innovative policies and strategies are needed to reduce the unit costs, address the heavy cost burdens on households, and improve the internal efficiency of the schooling system by reducing repetition and drop-out rates, and by making better use of teachers.” In addition, due to higher primary school enrollment, the demand for secondary education is increasing. The secondary school system is marked by inefficient allocation of teachers, high per student costs, weak mathematics and science teaching, and inadequate preparation of students for labor market entry and further education. The government is currently developing a strategy for secondary education reform, which should be complete by 2007.
73
Donor Response Government and donor support for FPE reached more than US$130 million between 2003 and 2005 (African Development Fund 2003). The principal external partners for the FPE were the World Bank, DFID, the Canadian International Development Agency (CIDA), and the Swedish International Development Cooperation Agency (SIDA). The World Bank’s Free Primary Education Support Project, begun in 2003 and implemented over three years, seeks to support the government’s efforts to provide free primary education and attain the MDG of universal primary education by 2015. The project components include increased funding for instructional materials; capacity building efforts such as school-based teacher development and support; improving school accounting systems; development of an education management information system; financing education system design and program preparation; and monitoring and evaluation. Ninety-three (93) percent of the US$50 million grant will be spent on the instructional materials component (World Bank 2003a). The World Bank’s Education Sector Support Project (ESSP) provides support to the government to implement the Kenya Education Sector Support Project (KESSP), which aims to provide basic education to all children, as well as improve quality, by 2010. The program objectives are: (i) ensure equitable access to basic education, (ii) improve quality and learning outcomes, (iii) provide opportunities for education and training beyond the basic level, and (iv) strengthen the education sector management. The World Bank US$50 million loan will complement substantial government (US$ 6411.1 million) and other external agency spending (US$239.1 million) on the KESSP from 2005 to 2009 (World Bank 2005h). Other development agencies involved in related activities include DFID (textbook provision), OPEC (rehabilitation of school infrastructure and capacity building), the World Food Program (primary school feeding program in ASAL areas), and the Aga Khan Foundation (school-based teacher development and support at the primary level) (World Bank 2003a).
74
5. Lesotho Lesotho’s Free Primary Education (FPE) program began in January 2000. The program’s main goal is to provide the minimum and basic resources to enable children to enter and complete the primary education cycle. The program is being implemented in phases, beginning with Standard 1 in 2000, Standard 2 in 2001, and so on until 2006, when the whole primary cycle will be covered.30 In implementing the program, the government committed to assisting schools that opt to join the program with teachers’ salaries and provision of textbooks, classrooms and equipment, and meals. In anticipation of increased enrollments, the Ministry of Education created an additional 460 teaching positions, with grants distributed to schools. Beginning in 2000, the government has gradually taken over the cost of textbooks and stationary in primary schools, and has implemented a centralized procurement process. In addition, food services are provided by existing programs, such as the World Food Program, or through local catering contracts, paid directly by the ministry. School maintenance is also managed at the central level (World Bank and Lesotho’s Ministry of Education and Training 2005). The program seems to have had a positive impact on enrollment rates. The gross primary enrollment rate increased from 109 percent in 1996 to 127 percent in 2003. Net primary enrollment rose by 33 percent alone in the year following implementation of FPE, from 60 percent in 1999 to 80 percent in 2000. Furthermore, the most recent data available suggests that the increases in enrollment have been sustained and that children who entered the system in 2001 are gradually advancing to subsequent levels. Figure A1 shows a sequential increase in enrollment, starting with Standard 1 in 2000 and followed by Standard 2 in 2001, Standard 3 in 2002, Standard 4 in 2003, and Standard 5 in 2004. This pattern is consistent with the phased in approach to eliminating school fees. FPE has also been credited by head teachers with ensuring access to education for thousands of AIDS orphans. A policy of free and compulsory education also helps to entrench popular demand for schooling as a right, and puts positive pressure on both local and national governments to deliver (Lerotholi 2001). However, there is evidence that some households continue to bear certain education costs, including uniforms and non-teaching staff salaries. Also, since most transactions are handled by the central government and some schools’ financial needs exceed the government allocations, schools continue to struggle to raise funds (Lerotholi 2001). In addition, the school management component of FPE has met with little success. It has been plagued by budget constraints, the burden of vouchers, and individual schools' inability to account for funds received. Furthermore, the maintenance expenditure guidelines are not flexible enough to account for individual school needs.
30 Preparations for its implementation began soon after the program was announced. Government officials visited Malawi and Uganda to learn from their experiences in introducing similar programs, and based on those experiences, Lesotho’s government decided to phase in elimination of fees (World Bank 2005).
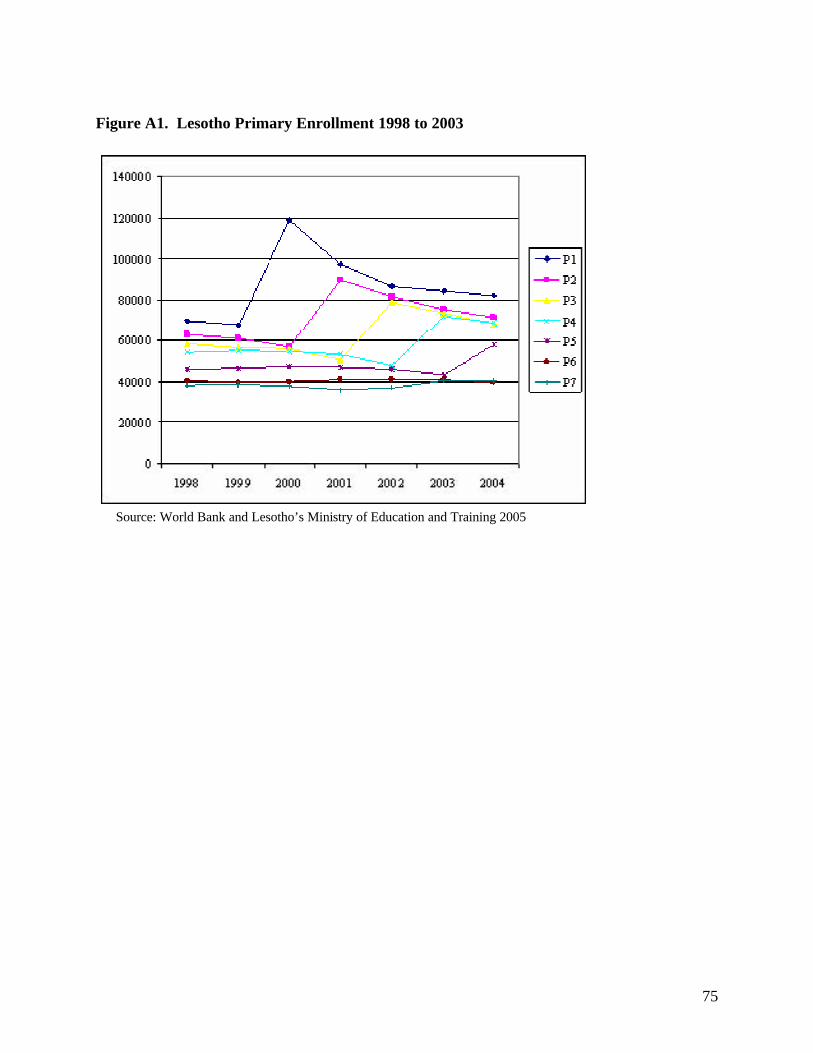
75
Figure A1. Lesotho Primary Enrollment 1998 to 2003
Source: World Bank and Lesotho’s Ministry of Education and Training 2005

76
6. Malawi In 1994, the newly elected government in Malawi took a step in improving access to schooling for the poor by eliminating primary school fees.31 Mandatory uniforms were also abolished, although parents were still expected to pay the costs of school supplies, as well as contribute labor and materials for school infrastructure improvements. The elimination of school fees led to a significant increase in primary school enrollment. The gross primary enrollment rate jumped by 49 percent, from 89 percent in 1993 to 133 percent in 1994 (WDI 2004). Education expenditures rose from 13 percent of total government spending (3.5 percent of GDP) in 1994/95 to 20 percent (4.7 percent of GDP) in 1997/98. The percentage of recurrent resources allocated to primary education increased from nearly 50 percent in 1993/94 to approximately 60 percent in 1999/2000 (World Bank 2002c). While enrollment rates increased dramatically overall, the poor appear to have benefited the most from fee elimination, and this has led to a narrowing of the gap in gross primary enrollment between the rich and the poor. Gross primary enrollment for the poorest 20 percent of the population rose by 101 percent between 1990 and 1997, from 58 to 117 percent. In comparison, gross primary school enrollment for the richest 20 percent only rose by 48 percent during the same years, from 81 to 120 percent (World Bank 2002c). Specifically, real unit costs at the primary and secondary level increased, implying large increases in real public education expenditure and the increases appeared to have been captured disproportionately by the poorer income groups in Malawi. While the gender gap has persisted, it has narrowed over time and across quintiles. For example, between 1990 and 1997, gross primary enrollment for girls in the poorest quintile rose by 113 percent (from 51 to 109 percent), while gross primary enrollment for boys in the same quintile rose by 92 percent (from 65 to 125 percent). Gross primary enrollment for girls and boys in the top quintile rose by 48 and 50 percent, respectively (World Bank 2002c). Despite gains in enrollment, many challenges remain and there is much evidence that quality of education has declined. The increase in enrollment was not accompanied by a commensurate rise in trained teachers or teaching and learning materials, and thus caused important quality indicators to reach unsustainable levels. The student to permanent classroom ratio was 119:1 while the student to desk ratio was 38:1 and the student to textbook ratio was 24:1. At the same time, the student to teacher ratio soared to 62:1 (World Bank 2004b; Kattan and Burnett 2004). By 1997 the government hired about 18,000 untrained primary school teachers, resulting in a student to unqualified teacher ratio of 120:1 (World Bank 2002c). According to parents, teacher performance deteriorated as a result of reduced parent accountability mechanisms. Parents felt less compelled to monitor teachers due to reduced personal financial involvement in the education system (Hillman and Jenkner 2002). As of 2000, the average primary repetition rate was between 15.5 and 28.4 percent, depending on the source used (Bentaouet Kattan and Burnett 2004; Hillman and Jenkner 2002; World Bank 2002c; World Bank 2004b). The average primary drop-out rate was between 4.8 and 10.4 in the same year. The primary school completion rate improved from 20 to 25 percent to 34 to 40 percent between 1992 and 2000, but without a sharp
31 Prior to 1994, school fees were partially eliminated, beginning with Standard 1 in 1991/92, moving to elimination of fees for Standards 1 to 3 by 1993/94. Also, fees were waived for non-repeating girls in Standards 2 through 8 in 1992/93 (World Bank 2002).
77
acceleration of this trend line, Malawi will not attain universal primary education by 2015 (World Bank 2004b). The high levels of repetition and drop-out are costly. According to a 2004 World Bank study, if these rates remain at the same level, the government will pay for up to 20 school years in order to send one child through 8 years of the primary school system. Malawi’s index of efficiency is 39.7 percent, indicating that “60.3 percent of the public resources are used either on children who drop out before finishing primary or on repetition years (both those who eventually finish and those who do not and are also lost to the system)” (World Bank 2004b, pg. 56). Despite official elimination of fees, households continue to pay a considerable share of the costs of education, and this could be one possible explanation for the primary drop-out rates. According to data collected by the World Bank, up to 83 percent of households that send their children to primary school paid for one or more school supplies in 2001. The majority of households reported paying for textbooks and uniforms, and about 50 percent contributed to school maintenance funds. These costs also rise as children progress to higher levels: expenses for Standard 3 are 50 percent higher than those for Standard 1, and by Standard 6 costs rise to 4.7 times more than Standard 1. On average, household expenditure for public primary schooling was 80 percent, almost on par with per pupil public expenditure. And, except for the richest 20 percent of the population, household expenditures for primary education are highly regressive. In 2001, the poorest 20 percent of the population paid US$9.60 per pupil, while the second, third, and fourth quintiles paid US$7.90, US$5.90, and US$9.30, respectively. The poorest quintile allocates about 5 to 6 percent of its income to education, whereas the same group in neighboring countries (such as Uganda, Zambia, and Kenya) pays about 2.5 to 3 percent. In addition, poor households also make in-kind contributions to schools. For example, 72 percent of rural households and 25 percent of urban households contributed labor to primary schools (World Bank 2004b). The government has begun to address the many challenges that it faces. For example, it has undertaken an evaluation of its training and hiring of untrained teachers and has also created a remuneration package and career development for primary school teachers (World Bank 2004b). However, there is still much that needs to be done to improve access to and the quality of education in Malawi. Informal fees and contributions should be discontinued, secondary school funding should be improved, better financing of teaching and learning materials are needed, parental and community participation in school management should be encouraged, curriculum should be strengthened, assessment exams should be restructured, and teacher training should be greatly improved (World Bank 2002c).
78
7. Mozambique In 2004, the government of Mozambique declared the elimination of primary school fees and levies, to begin in January 2005. Due to limited budget resources, households are still expected to bear the costs of school supplies, uniforms, and boarding costs, as well as textbooks in some grades. Households are also expected to contribute to the Social Action Fund (ASE), which was designed to provide school materials and clothing to disadvantaged students. In addition, households and communities are allowed to make voluntary cash or in-kind donations (World Bank 2005b). At this time it is not possible to measure the impacts of the fee policy. Thus, the discussion below will focus on the findings of a recent study on the impact of the costs of education on educational outcomes. Prior to fee abolition, a poverty and social impact analysis (PSIA) was carried out by the World Bank (2005b) in order to assess the impact of school fees and other education related expenses, as well as opportunity costs on important educational outcomes, such as primary school enrollment and student retention. The analysis revealed gaps in enrollment rates between poor and rich students. For example, for lower primary school (grades 1 through 5), the net enrollment rate was 59.4 percent for the poorest 20 percent of the population and 72.2 percent for the richest 20 percent of the population. Rural-urban gaps also exist; in urban areas, 75.5 percent of children ages 6-10 were attending school, while only 55.1 percent of children in the same group in rural areas were attending school. The study also found that girls were less likely to attend lower primary school (59.2 percent) than boys (63 percent). With the exception of urban areas in the Mozambique’s central region, the study did not find evidence of a statistically significant impact of fees on enrollment or drop-out rates. However, the authors note that this could be due to the fact that the monetary value of school fees is small (World Bank 2005b). The PSIA found that some schools turn away children who cannot pay school fees. In addition, many parents did not know about the ASE and most provincial and district officials reported that families that were unable to pay fees did not enroll their children in school. Furthermore, as noted above, even under the new policy, households are still expected to pay other various non-fee education expenses and these costs can present a significant barrier to education. On average, households spend twice the amount of the average school fee on textbooks, and more than three times the average school fee on uniforms. In addition, total household spending per child on schooling rises with each level of schooling; costs for lower secondary school are three times those of primary school (World Bank 2005b).
79
8. Tanzania The government of Tanzania eliminated school fees and other levies for primary education in July of 2001. Unlike other countries that eliminated user fees in Africa before and during the same period, Tanzania developed the Primary Education Development Plan (PEDP), a comprehensive strategy for enhancing service delivery in basic education (Hillman and Jenkner 2002). Prior to eliminating fees, the government estimated that 3 million children, aged 7 to 13, were not in school. Recognizing that eliminating school fees for all children at once would overwhelm the resources of the education system, the PEDP outlined a gradual approach for reaching its goal of universal primary education (Government of Tanzania 2001). The PEDP outlined three areas for reform: expansion of access to education, enhancement of education quality, and improvements to the management system. Activities for expanding access included recruiting and decentralizing the appointment of new teachers, giving incentives (such as teacher housing) to teachers deployed to rural areas, implementing double-shifts in 80 percent of schools, providing teachers who double-shift with extra pay, and meeting targets for new classroom construction. Quality improvement activities included ten days of in-service teacher training per teacher per year and establishment of school-based teacher resource centers. Procurement of textbook and learning materials was decentralized, with targets for student to book ratios improving from 3:1 in 2002 to 1:1 by 2006. In addition, a capitation grant of US$10 per student was implemented in 2002, US$4 of which would be sent to the school districts for textbook and learning materials procurement. The remaining money is sent to school committees, which decide how best to use the funds, including paying administrative costs and teacher development. The last component focuses on strengthening institutional and local capacity for education management, including governance, financial management, information systems, and system administration. A key feature of this component is strengthening participation and accountability at all levels (Government of Tanzania 2001). A strategy for including disadvantaged children was written into the PEDP. The government set up the National Education Fund, which provides scholarships to poor children and AIDS orphans. A unique feature of the Tanzanian experience was expansion of non-formal education opportunities for overage children, who would be too old to benefit from the elimination of school fees due to the phased-in approach (Government of Tanzania 2001). As a result of the phased-in approach, the education system was ready for the initial increases in enrollment. Net primary enrollment increased from 57 percent prior to the elimination of fees to 85 percent within one year (Global Campaign for Education 2005). Although the student to teacher ratio increased from 45:1 before the PEDP in 2001 to the current 59:1, it is still manageable. And, the ratio is likely to be reduced because the peak of the enrollment trend has passed and more teachers are expected to graduate from teacher colleges. The phased-in approach also protected quality. Over the period of the PEDP, the Primary School Leaving Examination pass rate increased from 25 percent in 2002 to 48 percent in 2004. The student to textbook ratio, improved from 8:1 before the launch of PEDP to 4:1 in 2004. The percentage of Grade A teachers increased from 46 percent in 1999 to 58 percent in 2004, indicating that while gains have been made, quality teachers are still in demand as 42 percent of primary teachers have

80
minimal training. Girls represent 49 percent of students enrolled in the first grade. Furthermore, 29,922 new classrooms were built between 2002 and 2004, with the support of communities using development grants (World Bank 2005a). Total expenditures in education more than doubled between 1998 and 2002. A recent report on the progress of the PEDP notes that although there have been many achievements, many challenges remain. There has been increased space for the participation of non-governmental organizations (NGOs), which play a role in disseminating information to communities. Another achievement has been the development of guidelines for improved democratic and transparent decision-making, as well as public access to financial information. However, there have also been delays in distributing guidelines regarding the use of funds, school committee reform and construction to many districts and schools. And, while the transfer of the capitation grant directly to schools has increased motivation and parental participation, it is felt that school committees have not been given the opportunity to outline their own school-level priorities due to the fact that the breakdown of the capitation grant was determined by the central government. There is also evidence that the full capitation grant is not reaching all of the schools and that the transfer schedules are erratic (Makongo 2003). While double-shifting has contributed to improved use of teachers, teachers’ effectiveness during afternoon sessions tends to diminish. Additionally, parents in urban areas are concerned with the safety of children who attend the afternoon sessions and do not return home until after dark. Also, due to the lack of meal programs, many children are unable to concentrate on their studies (World Bank 2005a). Furthermore, despite elimination of fees, some parents still incur costs to send their children to school, though the costs have decreased significantly since 2001. For example, average total costs to send one child to school in the Kilimanjaro area ranges from 2,000 to 8,000 Tanzania shillings (US$9 to US$12). Prior to elimination of fees, it cost 7,600 to 10,600 shillings (US$12 to US$15). Indirect costs still remain high. While uniforms are no longer compulsory, there is a stigma associated with sending a child to school without one. The cost of books still represents an obstacle to schooling. It is estimated that, combining direct and indirect costs, parents are paying about 13,000 Tanzanian shillings to send one child to school for one year (UNESCO 2003/04). Donor Response Prior to implementing the PEDP, the government estimated that there was a financing gap of US$129 million in 2001, though this would gradually decrease, eliminating the gap by 2012, dependent on a projected economic growth rate of 6 percent (Government of Tanzania 2001). Tanzania’s advances in implementing free primary education have played a key role in its activities under the HIPC debt relief initiative. As outlined above, the main goals of its Education Sector Development Program (ESDP) is to improve education quality and internal efficiency, increase access to primary education, especially for the poor and other disadvantaged groups, and to reduce the household costs of education. Under ESDP, Tanzania has increased expenditures on primary education, as well as eliminated user fees at the primary level. It also carried out a school-mapping exercise in over 50 percent of its school districts, which allowed education authorities to identify the main problems in delivering quality primary education. Due

81
to debt relief, the government was able to double per capita spending on education and eliminate school fees (International Monetary Fund 2000a, Global Campaign for Education 2005). In 2001, the World Bank approved a package supporting the implementation of the PEDP, including a loan of US$150 million and a grant provided by the Netherlands of US$50 million. The project closed in 2005 and while some of the challenges outlined above remain, overall the project was rated satisfactory, and sustainability is highly likely (World Bank 2005a).32
32 Canada dedicated US$10 million per year from 2002 - 2007 to pooled funding for the national education plan (Global Campaign for Education 2005).
82
9. Timor-Leste In 1999, a majority of the population in Timor-Leste voted for the restoration of independence from Indonesia. This would have an impact on many aspects of Timor-Leste’s political and social fabric, not least of which was the state of education in the region. Prior to 1999 and under Indonesian rule, Timor-Leste experienced primary education attainment levels well below the national average, 80 percent compared to nearly 100 percent for Indonesia as a whole. Additionally, it also exhibited larger enrollment gaps between the rich and the poor, urban and rural areas, and males and females. Under the Indonesian administration, school fees comprised 13 percent of household expenditure on public primary education per capita for the poorest 20 percent of the population, followed by 9 percent for PTA charges. Other types of fees were substantially more: 52 percent for uniforms, 16 percent for textbooks, and 10 percent for other instructional materials (World Bank 2002a). In 1999, the Timor-Leste Transitional Administration eliminated many education charges and fees. In addition, it also abolished mandatory uniforms. By 2001, primary school enrollment had grown by 9.5 percent, no small feat considering that the retreating pro-Indonesian militia destroyed 95 percent of the schools after the referendum, and 20 percent of primary school teachers returned to their homes in other regions of Indonesia. Donor financing of school infrastructure construction, teacher salaries, and textbook provision was primarily responsible for the reduction in school fees. By 2001, the poorest 20 percent of the population paid only 1.6 percent of household expenditures per capita on school fees, 0.6 percent on PTA charges, 0.4 percent for textbooks, and 3.1 percent for other instructional materials. Monthly per capita spending on education among the poorest quintile dropped from US$0.82 in 1995 to US$0.33 in 2001 (World Bank 2002a). The elimination of fees improved equitable access to education. Primary school enrollment gaps between the rich and the poor, girls and boys, and rural and urban areas have narrowed significantly. New enrollment was concentrated among children ages 5 to 15 (World Bank 2002a). Despite the increases in enrollment, cohort analysis points to low levels of internal efficiency. Most new enrollments were at the lower primary level, regardless of the appropriate age-for-grade. In 2000/01, the number of enrolled in Grade 1 was double the estimated number of six-year-olds in the country. Thus, there is a wide gap between gross and net enrollments: 102 and 73 percent, respectively. A 2002 World Bank study estimated that given these levels of internal efficiency, “only 67 percent of children would reach Grade 4, and 47 percent would eventually complete grade 6, while 53 percent would drop out” (World Bank 2002a, pg. 31). While the cost of sending a student to 6 years of primary school is about $300, the high repetition and drop-out rates cause costs to nearly double (World Bank 2002a).

83
10. Uganda On January 1, 1997 Uganda implemented the Universal Primary Education (UPE) policy, promising to eliminate user fees for primary education, including indirect fees through PTAs and uniforms, for as many as four children per household, two of whom should be girls. Until 1995, direct and indirect fees constituted more than 50 percent of school income. The elimination of fees was combined with a strong dissemination campaign of UPE and a highly decentralized mode of implementation. In addition, implementation included a public campaign aimed at keeping girls in school by focusing on girls’ education and the negative impact of early marriages. Enrollment jumped 68 percent, from 3.1 million in 1996 to 5.3 million in 1997 (World Bank 2001b; Avenstrup et. al. 2004). Smaller annual increases followed until, in 2004, total enrollment in government schools stabilized at about 6.7 million (Uganda Bureau of Statistics 2004a). Enrollment rates grew quicker among the poor than the non-poor after the introduction of UPE, thus narrowing the enrollment gap between the two groups. In 1992, there was a 36 percentage point difference between the poor and non-poor in terms of enrollment figures, but by 2004 the difference in enrollments was only 5 percentage points (Uganda Bureau of Statistics 2004b). Enrollment rates for girls also increased significantly. Primary attendance among girls 6 to 12 years old grew from 59.7 percent in 1992 to an estimated 83.2 and 91 percent in 1999 and 2004 respectively, while primary attendance among boys grew from 64.3 to an estimated 84 and 91 percent for the same years. Urban-rural disparities in access to primary education also declined. In addition, drop-outs due to cost-related issues decreased significantly. Overage enrollment was massive at the beginning of the UPE cycle. Now it is much lower but still sizeable, with a Gross Enrollment Rate (GER) of about 125 percent in 2004 (Uganda Ministry of Education n.d.). Furthermore, the percentage of children who dropped out of school due to cost decreased from an estimated 71 to 42 percent between 1992 and 2003, though urban-rural disparities remain, with 57 percent of households in urban areas citing cost as a reason for dropping out, compared to 36 percent in rural areas (Uganda Bureau of Statistics 2002/03). UPE was also accompanied by spending restructuring within the education sector. Education expenditures grew from 16.4 percent of the national, discretionary, recurrent budget in 1996 to about 30 percent in 2000 to 2005 (Uganda Ministry of Finance, Planning and Economic Development n.d.). Spending on primary education increased from less than 40 percent of the overall education budget throughout the early 1990s to about 70 percent in 1997-98 to present. Funds for construction and maintenance grew to six times their previous levels (Deininger 2003). Despite increases in education expenditures, the quality (measured by input per pupil) declined in government schools with the introduction of UPE. Though there has been considerable improvement in recent years, the ratios are not yet back to the pre-UPE levels. The pupil:teacher ratio increased from 38:1 in 1996 to 80:1 in 1997, and was down to 53:1 in 2004 (Uganda Ministry of Education n.d.). In rural areas the pupil to teacher ratio was 70:1 (Deininger 2003). The pupil:classroom ratio rose from 68:1 in 1996 to 105:1 in 1997, and was down to 84:1 in 2004 (Education Management Information System Reports).33 Exam scores point to possible 33 Deininger (2003) suggests that much of the improvement can be credited to in-kind community contributions, indicating that the policy created local incentives for community participation.

84
problems with school quality. Nearly 25 percent of students who took the final exams for primary school in 1999 did not pass. Furthermore, 27 percent of students in rural areas failed the exam, compared to only 17 percent in urban areas (Deininger 2003).34 Despite elimination of school fees, parents still pay both official and unofficial fees. Official government policy holds parents responsible for paying costs for exercise books, pencils, meals, clothing, transportation, and assistance with school construction (Uganda Bureau of Statistics 2002/03; Uganda Bureau of Statistics 2004b). A study undertaken by the United Kingdom’s Department for International Development (DIFD) found that unofficial fees include end-of-year parties, classroom construction, telecommunication infrastructure, and even teachers’ funerals (Boyle et. al. 2002). The figures on impact of cost on drop-out rates are already given above. Donor Response Tied to its bid for eligibility under the HIPC debt relief initiative, the Government of Uganda adopted a Poverty Eradication Action Plan (PEAP) in 1997, which placed a heavy emphasis on increasing expenditures in the social sectors, including increasing access to schooling, improved planning, funding, and monitoring of primary education. Government funding for the UPE policy increased by 37 percent in 1997/98 and HIPC assistance was earmarked for increased social spending. Education spending grew from 3 percent of GDP, or 17 percent of total public expenditures, in 1997 to 4 percent of GDP, or 20 percent of total public expenditures, in 2001 (International Monetary Fund 1998). In mid-1998, two World Bank projects supporting primary education were implemented. The Primary Education and Teacher Development Project (PETDP) focused on improving teaching and learning, providing textbooks and teachers’ guides to primary schools, and build capacity for strategic management, planning and policy analysis, and curriculum reform within the Ministry of Education. It was financed by an IDA credit of US$52.6 million as well as additional financing from the US Agency for International Development (USAID) (World Bank 2001b). The Education Sector Adjustment Credit (ESAC) was designed to assist the government with the challenges caused by increasing enrollments after it eliminated school fees. The goals of the project were to improve resource allocation and use in the education sector, to improve the quantity and quality of schooling inputs, and to strengthen sector management in order to keep pace with the growth of enrollment. ESAC was financed with a US$75 million HIPC grant and a US$80 million IDA loan (World Bank 2004d). In 2001, the government and the African Development Bank implemented the Education II Project.35 The goal of the project was to achieve equitable access to quality UPE by 2004. A second goal focused on improving access to secondary school for girls. It is also hoped that it will achieve development of institutional capacity for effective decentralization and provision of education for all, including AIDS orphans. Expected outputs include: 29,000 new schools in the 27 neediest districts, preparation of cost-effective, sustainable curriculum (including agricultural education and other productive skills), and instructional materials.36 Fifty-seven percent of the
34 Examination pass rates for 1992 were not reported. 35 Formally known as the Support to the Education Strategic Investment Plan. 36 Instructional materials include teachers’ guides and syllabi, teacher training, and curriculum specialist training.
85
US$26.75 million loan and US$3.18 million grant will be spent on a primary school infrastructure component, 14 percent on curriculum development, and 23 percent on achieving gender equity in secondary schools. The remaining funds will be used to coordinate and manage the project, scheduled to end in 2006 (African Development Fund 2000). Other development partners, such as DFID (UK), EC, CIDA (Canada), DANIDA (Denmark), DCI (Ireland), GTZ, Dutch, USAID, UNICEF, and WFP, intensified their support to the education program. What emerged was an education sector-wide approach (SWAP) in Uganda, in which the donors pooled their resources for education.
86
11. Zambia Free basic education (FBE) was announced and immediately introduced in Zambia in February of 2002. FBE was supported by Zambia’s 2002 Poverty Reduction Strategy Paper (PRSP), which outlined the elimination of user fees for basic education as a way to reduce poverty. The 2003-2007 Strategic Plan for education also called for the abolition of schools fees. Although FBE was a political decision made outside of the Ministry of Education, the Ministry was expected to implement the policy immediately, and therefore had little time to adequately plan for the transformation. Guidelines mandating the elimination of fees for grades 1 to 7 were prepared and circulated to schools. In addition, the government developed bursary schemes for clothing, instructional materials, and boarding costs for vulnerable groups (Mwansa et. al. 2004). Prior to FBE, the education system was characterized by low teacher motivation, inadequate training, shortage of textbooks and instructional materials, inadequate school infrastructure, and inequitable access to education, both between urban and rural areas and for girls. Zambia experienced declining enrollments, with the primary school gross enrollment decreasing from 95 percent in 1985 to 89 percent in 1996. Access to education was lowest for children in remote and rural areas. The primary school drop-out rate was about 31 percent. Parents paid a variety of fees including tuition, exam fees, Parent Teacher Association (PTA) dues, uniforms, and boarding fees. In 1993, government funds constituted 56 percent of education financing, while parents paid 44 percent. Public expenditure was 3 percent of GDP and 16.8 percent of the total recurrent budget. Most of the funds were used to pay salaries (African Development Fund 1999). The impact of FBE was somewhat limited, with enrollment only rising by 8.5 percent between 2002 and 2003. This suggests that factors other than costs still constituted a significant barrier to education. Drop-out rates declined slightly from 3.88 to 2.42 percent but largely persisted due to early marriages, pregnancy, the rising incidence of AIDS orphans, and lack of parental support. Teacher and student absenteeism due to HIV/AIDS remains a significant obstacle to education.37 About 1,000 teachers die from AIDS every year (Global Campaign for Education 2004). In addition, one study found that due to lack of specific guidelines on applications, one-third of applicants to government schools were turned away, possibly due to inadequate school infrastructure and the New Breakthrough to Literacy Policy (NBLP), which limits class size to 40 students FBE did seem to have an impact on enrollment of disadvantaged groups. Mwansa et. al. (2004) found that a significant number of new enrollments, especially in rural areas, were students who had previously left school due to the inability to pay school fees. Enrollment among orphans and children with special needs also rose. However, they also found evidence of a persistent gender gap, particularly in rural areas. While some interventions, such as the NBLP offset the impact of FBE, a few interventions worked to increase enrollments. The Programme for the Advancement of Girls Education 37 AIDS is a serious threat to education, especially in the form of teacher and administrator attrition. Infection rates are 25 to 30 percent in urban areas, and 10 to 15 percent in rural areas (AFD 1999).

87
(PAGE) and a re-entry policy for pregnant girls improved access to education for girls, while the bursary schemes and the School Health and Nutrition Programme improved access for the poor (Mwansa et. al. 2004). At the time that FBE was introduced there was a cost-sharing framework already in place under the Basic Education Sub-Sector Investment Program (BESSIP). Communities were required to support the construction and rehabilitation of schools. Under FBE communities stopped contributing to infrastructure improvements because they interpreted the policy as meaning that the government would pay for all education costs (Mwansa et. al. 2004). In order to replace the loss of school fees, the government increased the amount of grants paid to schools. However, due to rushed implementation of the policy, the government was not able to carry out a school census, or needs-assessments, and gave each school, big or large, urban or rural, the same amount of grant money. There is some evidence that the grants proved to be inadequate and that quality of education is suffering. Increased enrollments and teacher shortages have forced most schools to implement multiple shifts. While official data show that the student to classroom ratio improved slightly, one study of 352 basic schools38 found that 31.5 percent of schools conducted class under trees, 14.2 percent held multiple sessions, and some schools used tents (3.9 percent) (Mwansa et al. 2004). This suggests that official aggregate data obscures large inequities between schools and regions. The same study found that the student to teacher ratio increased from 46:1 to 52:1 between 2001 and 2003, partially due to a teacher strike, as well as hiring freezes that have left about 9,000 trained teachers out of work. In some rural areas, student teacher ratios are as much as 100:1 (Global Campaign for Education 2004). Teacher shortage has serious implications for the success of FBE. Some students receive only two hours of education a day, learning only a minimal amount of curriculum. And although mean scores have increased by 2 percentage points, almost two-thirds of 5th grade students do not achieve minimum competence levels in English and mathematics (International Monetary Fund 2004; Global Campaign for Education 2004). The government responded to the problem of inadequate learning materials by decentralizing the procurement process, which is expected to reduce the cost of transporting materials, as well as free up funds for more materials. One hundred and six (106) new primary schools were constructed in 2002 (International Monetary Fund 2004). The Ministry of Education has estimated that an additional 3,000 to 4,000 teachers a year will need to be hired to cover attrition, based on a 64:1 target for student to teacher ratio (Global Campaign for Education 2004). However, wage freezes in 2003 and 2004 meant that the real value of teacher salaries is declining. There is some evidence that households are still bearing a significant amount of education related expenses. Despite the mandate that school uniforms should not be required, 46 percent of urban and 14.4 percent of rural schools still required students to wear uniforms (although this could be the result of ambiguity in FBE guidelines that allowed schools to use uniforms as long as they did not make a profit from them). Also, fees collected by government schools actually increased
38 Basic schools in Zambia cover grades 1 through 7. Seventy three (73) percent of the surveyed schools were in rural areas, and while not perfectly representative, comes close to the official statistic of 84 percent of schools in Zambia being located in rural areas.
88
between 2002 and 2003 (Mwansa et. al. 2004). As well, some schools have begun to charge PTA fees again due to inadequate government funding (Global Campaign for Education 2004). Donor Response It is expected that 30 percent of the government’s education budget for 2003 to 2007 will be financed by external donors (Global Campaign for Education 2004). In order to be eligible for debt relief under the HIPC Initiative, the government of Zambia outlined education as a major area of reform (International Monetary Fund 2000c). Specifically, it proposed to increase budgetary contributions to the education sector to at least 20.5 percent, raise teacher salaries in rural areas to above the poverty line, and increase enrollment in rural areas. By 2005, public education expenditures accounted for 24.1 percent of total government spending, teacher salaries were increased so that they fell above the household poverty line, and user fees for grades 1 to 7 were eliminated. In addition, the government mandated that 100 percent of new teachers be posted to rural areas. However, one report holds the view that in order to meet the HIPC trigger points the Zambian government underestimates its spending needs (Global Campaign for Education 2004). For example, US$50 million is required to meet wage increases for current teachers and to hire new teachers. The EFA-FTI estimates that there is a financing gap of $US40 to 50 million a year in order to achieve universal primary education by 2015. Bilateral funding for education is more common in Zambia. For example, the Dutch government recently gave Zambia a grant of US$11.3 million to pay arrears owed to almost 8,000 retired and retrenched teachers, enabling the hiring of the same number of teachers (Global Campaign for Education 2004).
89
Annex 2: Determinants of Enrollment Among major determinants of enrollment identified in recent studies are household income, schooling costs, presence or absence of schools, community involvement, transportation, education quality, and relevance. For girls, additional factors that contribute to enrollment are the presence of female teachers; the availability of proper features such as latrines, daycare facilities for younger siblings, and water sources; and the flexibility of the school calendar. Not all studies use the same list of possible determinants and methodologies differ. While user fees impede access to education, they are not the only determinants of household demand for education. Households often reduce other household costs so that their children may go to school. For example, parents in Kenya stated that they would skip meals and parents in Sri Lanka noted that they defer or forgo seeking medical attention in order to pay school fees (Boyle et. al. 2002). In Uganda, the percentage of children not enrolled in school due to a “calamity in the family, pregnancy, or disabled” grew from 1.9 in 1992 to 16 percent in 1999, two years after user fees were eliminated (Deininger 2003, p. 297). The author surmises that this may be due to the rapid spread of HIV/AIDS. It may also be a result of the increased attention to improving school-level data following fee abolition. Quality of schooling can also be a determinant of enrollment. This highlights the importance of maintaining school quality at the same time as eliminating school fees. Deininger (2003) outlines the trade-offs between expanding access to education and improving quality: “Increasing access to schooling will favor the poor (who were previously excluded) while improvements in quality that are not accompanied by simultaneous improvements in access will work in favor of the rich (who are already enrolled)” (p. 293). A study of primary school enrollment in Kenya offers empirical evidence of this trade-off. Deolalikar (1997) found that the elasticity of primary school enrollment relative to school availability is .37 for low-income families and almost 0 for high-income families, while the elasticity relative to student to teacher ratios is -.53 for the poor and .13 for the wealthy. This means that building schools (quantity) is more pro-poor, while improving the student-teacher ratio largely benefits the rich, and has a negative impact on primary school enrollments for the poor.39 The true private costs of primary schooling also include the opportunity cost of children’s time, such as forgone income or the value of a child’s time spent on household duties. Deolalikar (1997) found that the amount of time spent collecting water, a proxy of opportunity costs, has a negative impact on primary school enrollment in Kenya. Most children who work in developing countries are major contributors to family income. For example, in Paraguay, child labor constitutes 24 percent of family income (Patrinos and Siddiqui 1995). Therefore, even in the absence of school fees, very poor households may still be unlikely, or unable, to send their children to school (Hillman and Jenker 2002). This points to the need for public programs that provide incentives or aid to poor households so that their children attend school. 39 The author notes that this is probably due to the fact that improvements in student to teacher ratios are often financed with user fees and/or from shifting of resources away from bursaries and scholarships to new teacher salaries.
90
Gender can often be a powerful determinant of enrollment. In Kenya, features such as the presence of female teachers, the availability of proper features such as latrines, daycare facilities for younger siblings and water sources, and the flexibility of the school calendar contribute to higher enrollments for girls, who often are responsible for a large percentage of household activities (Mukudi 2004). Culture often intersects with gender in its impact on enrollment. For example, women in Pakistan are often discouraged from joining the labor market and there are few job opportunities for them, thus reducing the private returns to female education. In addition, since women join their husbands’ households after marriage, parents may be more willing to invest resources in their sons’ educations because they are likely to get a better return on their investment in the form of support in their old age (Holmes 1999). The opportunity cost of sending girls to school is often greater since they are generally responsible for the bulk of household duties. Levels of parental education are often significantly related to demand for schooling. The head of household’s education has a strong impact on enrollment among high-income families, while the effect of the spouse’s level of education is more significant in low-income families (Deolalikar 1997). Globally, a mother’s education can make a big difference in whether or not a child attends primary school. Children of women who have no education are more than twice as likely to be out of school than children of women who have at least some education (UNICEF 2005). Parental education can also display a gender dimension. In Pakistan, mothers’ schooling has a larger impact on girls’ enrollment, while fathers’ schooling largely influences boys’ enrollment (Holmes 1999). Mothers’ schooling has a larger impact on girls from poor households than girls from more well-off households in Kenya (Deolalikar 1997). Other reasons that parents may not send their children to school include information failures about the links between education and local job opportunities; high incidence of nepotism and imperfect job markets; distances to schools; distances to closest labor market; and community involvement (Bentaouet Kattan and Burnett 2004; Hillman and Jenker 2002). For example, as unemployment grows in Kenya, it is unlikely that parents will send their children to school if they do not believe that there will be a significant return to their direct or indirect investment in education (Mukudi 2004). Low enrollment may also reflect a lack of supply (no schools in the area). There is a serious absence of current literature examining these different possible causes of low enrollment among the countries that have not achieved universal basic education. In part, this literature gap reflects the considerable progress made in increasing primary enrollments around the world, which makes it a less pressing global issue, even if it remains of high priority for Sub-Saharan Africa and South Asia. It also reflects the lack of usable data in many of the poorest countries that have low primary enrollment rates. On the other hand, the fact that a country has reached universal basic education, even though schools charge fees, does not mean that fees cease to be a cause of concern. In such cases fees may not be limiting access or attendance, but they may still be an equity concern.
91
Annex 3: Summary Findings of the 2005 World Bank User Fee Survey A survey in a matrix form was sent to all World Bank task team leaders of active basic and lower secondary education projects in April 2005.40 PRIMARY EDUCATION -- OVERALL SURVEY RESULTS: Data coverage: Data was obtained for 93 World Bank client countries with IBRD/IDA-supported basic education projects. • Out of the 93 countries, almost all (81%) – 77 countries – have some type of fee. Sixteen
(16) countries have no type of fees at all: Bangladesh, Cambodia, Cape Verde, Chile, Costa Rica, Guatemala, Iraq, Nepal, Peru, Senegal, Sri Lanka, St. Kitts and Nevis, Tanzania, The Gambia, Tunisia, and Zambia. In these countries education is completely provided by the government.
• Countries generally have several types of fees, with the exception of the following 19 countries: Brazil, Ghana, Namibia, Panama, Ukraine, Argentina, Azerbaijan, Chad, Cote d'Ivoire, India, Iran, Jordan, Malawi, Maldives, Philippines, Romania, Sierra Leone, Solomon Islands, and Timor-Leste, which have only PTA/community fees and no other types of fees.
• 5 countries have all 5 types of fees, including Dominican Republic, Haiti, Honduras, Indonesia, and Vietnam.
• 59 countries have some type of legal fees: Argentina, Azerbaijan, Benin, Bhutan, Bosnia-Herzegovina, Bulgaria, Burkina Faso, Burundi, Cameroon, Cape Verde, Chad, China, Costa Rica, Cote d'Ivoire, Democratic Republic of Congo, Djibouti, Dominican Republic, Ecuador, Egypt, El Salvador, Eritrea, Georgia, Guinea, Guinea Bissau, Guyana, Haiti, India, Indonesia, Iran, Jordan, Kenya, Kyrgyz Republic, Lebanon, Madagascar, Maldives, Mali, Mauritania, Mongolia, Morocco, Nicaragua, Niger, Paraguay, Peru, the Philippines, Romania, Russian Federation, Rwanda, Solomon Islands, South Africa, Swaziland, Tajikistan, Tanzania, Thailand, Timor-Leste, Uruguay, Vanuatu, Venezuela, West Bank and Gaza, and Republic of Yemen.
• Of these 59 countries, only Dominican Republic and Haiti have all five types of fees implemented legally.
• 33 countries have some type of fee implemented unofficially, including: Honduras, Vietnam, Liberia, Ethiopia, Lao PDR, Bolivia, Mexico, Tonga, Nigeria, Vanuatu, Indonesia, Brazil, Ghana, Lesotho, Mozambique, Namibia, Panama, Ukraine, Djibouti, Kenya, Nicaragua, Mali, Burkina Faso, China, Mongolia, Uganda, Venezuela, Georgia, West Bank and Gaza, Republic of Yemen Congo, Ecuador, and Kyrgyz Republic.
40 Data was collected informally from World Bank task team leaders and may not reflect the most recent changes in policy and practice at the country level.
92
• Honduras and Vietnam have all five fees implemented unofficially, and are the only 2 countries that have unofficial textbook fees.
• In the following 22 countries (of the 33 countries in which unofficial fees are collected) the fees are PTA/community contributions: Honduras, Vietnam, Liberia, Ethiopia, Lao PDR, Bolivia, Mexico, Tonga, Nigeria, Vanuatu, Indonesia, Brazil, Ghana, Namibia, Panama, Ukraine, Kenya, Mongolia, Venezuela, Georgia, West Bank and Gaza, and Ecuador.
Tuition Fees:
• Of the 93 countries surveyed, tuition fees are implemented in 24 countries (25%); of which 17 countries (18%) collect legal tuition fees. These 17 countries include: Burundi, Democratic Republic of Congo, Dominican Republic, Ecuador, Egypt, El Salvador, Eritrea, Georgia, Haiti, Indonesia, Kyrgyz Republic, Lebanon, South Africa, Swaziland, Vanuatu, West Bank and Gaza, and Republic of Yemen.
• In 7 countries, tuition fees are implemented unofficially: Mali, Nigeria, Republic of Congo,
Honduras, Liberia, Vietnam, and Bolivia. Textbook Fees:
• Textbook fees are implemented in 24 countries (25%): Bosnia-Herzegovina, Bulgaria,
China, Democratic Republic of Congo, Republic of Congo, Dominican Republic, El Salvador, Eritrea, Georgia, Guyana, Haiti, Honduras, Indonesia, Kyrgyz Republic, Mauritania, Mongolia, Russian Federation, Rwanda, Tajikistan, Uganda, Vanuatu, Venezuela, Vietnam, and West Bank and Gaza. Only in Honduras and Vietnam are these fees unofficial.
Uniform Fees:
• The purchase of mandatory uniforms is implemented in 33 (35%) of the countries surveyed: Bhutan, Bolivia, Burkina Faso, Burundi, Cameroon, China, Republic of Congo, Dominican Republic, Ecuador, El Salvador, Eritrea, Ethiopia, Guyana, Haiti, Honduras, Indonesia, Lao PDR, Liberia, Madagascar, Mexico, Mongolia, Morocco, Nicaragua, Pakistan, Paraguay, Rwanda, Swaziland, Tajikistan, Uganda, Uruguay, Venezuela, Vietnam, and Republic of Yemen. In only 9 countries are uniform fees unofficially implemented, including Bolivia, China, Ethiopia, Honduras, Lao PDR, Liberia, Mexico, Nicaragua, and Vietnam.
PTA/Community Contributions:
• PTA/ Community contributions are common in 65 (69%) of the countries surveyed. In 37(39%) of these countries, the collection of these fees are legally allowed and encouraged.
93
Other School-Based Activity Fees: • Other school-based activity fees are collected in 34 (36%) of the countries surveyed. In 15
(15%) of these countries, these fees are unofficial, including Burkina Faso, Djibouti, Ethiopia, Honduras, Indonesia, Kyrgyz Republic, Lao PDR, Lesotho, Liberia, Mozambique, Paraguay, Tonga, Uganda, Vanuatu, Vietnam, and Republic of Yemen.
AFRICA (AFR) – PRIMARY EDUCATION
Data Coverage: 34 World Bank client countries with IBRD/IDA-supported basic education projects Tuition Fees:
• For these 34 countries, tuition fees are implemented in 9 countries: Nigeria, Mali,
Democratic Republic of Congo, Swaziland, Republic of Congo, Eritrea, Liberia, Burundi, and South Africa. With the exception of Democratic Republic of Congo, Swaziland, Eritrea, Burundi, and South Africa all fees are collected unofficially.
Textbook Fees:
• Textbook fees are implemented in 6 countries, and in all countries these fees are legally
allowed: Mauritania, Democratic Republic of Congo, Eritrea, Rwanda, Republic of Congo, and Uganda.
Uniform Fees:
• Purchase of mandatory uniforms is implemented in 11 of these countries: Burkina Faso,
Burundi, Republic of Congo, Eritrea, Ethiopia, Liberia, Madagascar, Rwanda, Swaziland, Uganda, and Cameroon.
PTA/Community Contributions:
• PTA/Community contributions are common in 23 countries: Malawi, Nigeria, Mali,
Democratic Republic of Congo, Swaziland, Rwanda, Sierra Leone, Namibia, Ethiopia, Kenya, Liberia, Burkina Faso, Chad, Eritrea, Cameroon, Republic of Congo, Ghana, Uganda, Cote d'Ivoire, Benin, Guinea Bissau, Guinea, and Niger.
• In 6 of these countries fees are collected unofficially: Nigeria, Namibia, Ethiopia, Kenya,
Liberia, and Ghana.
94
Other School-Based Fees:
• Other school-based activity fees are collected in 12 countries: Ethiopia, Democratic Republic of Congo, Swaziland, Burkina Faso, Kenya, Liberia, Lesotho, Guinea, Uganda, Benin, Niger, and Mozambique.
• In 5 of these countries it is unofficial: Ethiopia, Burkina Faso, Liberia, Lesotho, and Mozambique.
EAST ASIA & PACIFIC (EAP) – PRIMARY EDUCATION
Data Coverage: 12 World Bank client countries with IBRD/IDA-supported basic education projects.
Tuition Fees:
• Of these 12 countries, tuition fees are implemented in 3 countries: Indonesia, Vanuatu, and Vietnam.
• Of these 3 countries, fees are collected unofficially in Vietnam.
Textbook Fees:
• Textbook fees are imposed in 5 countries: Vanuatu, China, Mongolia, Vietnam, and Indonesia.
• Of these 5 countries, fees are collected unofficially in Vietnam.
Uniform Fees:
• Purchase of mandatory uniforms is implemented in 5 of these cases: China, Indonesia, Lao PDR, Vietnam, and Mongolia.
• In 3 of these countries, fees for uniforms are unofficially collected: China, Lao PDR, and Vietnam.
PTA/Community Contributions:
• PTA/community contributions are common in 11 of the countries surveyed: Solomon Islands, Indonesia, China, Timor-Leste, Vanuatu, Tonga, the Philippines, Thailand, Lao PDR, Vietnam, and Mongolia. In 6 of these countries these fees are unofficially collected: Indonesia, Vanuatu, Tonga, Lao PDR, Vietnam, and Mongolia.
95
Other School-Based Activity Fees: • Other school-based activity fees are collected in 7 countries: China, Indonesia, Vanuatu,
Tonga, Lao PDR, Vietnam, and Thailand. It is legally allowed in only 2 countries, China and Thailand.
EASTERN EUROPE & CENTRAL ASIA (ECA) – PRIMARY EDUCATION
Data Coverage: 10 World Bank client countries with IBRD/IDA-supported basic education projects.
Tuition Fees:
• For these 10 countries, tuition fees are implemented in 2 countries, Kyrgyz Republic and Georgia. Tuition fees are legal in both countries.
Textbook Fees:
• Textbook fees are imposed in 2 countries: Serbia and Montenegro, and Bosnia Herzegovina. Textbook fees are legal in both countries.
Uniform Fees:
• Purchase of mandatory uniforms is implemented in only one country, Tajikistan.
PTA/Community Contributions:
• PTA/community contributions are common in 9 of the countries surveyed: Tajikistan, Kyrgyz Republic, Russian Federation, Georgia, Azerbaijan, Bulgaria, Serbia and Montenegro, Romania, and the Ukraine.
• These fees are collected unofficially in Georgia and the Ukraine.
Other School-Based Activity Fees: • Other school-based activity fees are collected in 4 countries: Tajikistan, Kyrgyz Republic,
Russian Federation, and Serbia and Montenegro. These fees are unofficial in the Kyrgyz Republic.
LATIN AMERICA & CARRIBEAN (LAC) – PRIMARY EDUCATION
Data Coverage: 19 World Bank client countries with IBRD/IDA-supported basic education projects.
96
Tuition Fees:
• Of these 19 countries, 6 countries have tuition fees. In 2 countries fees are collected unofficially: Honduras and Bolivia.
Textbook Fees:
• Textbook fees are implemented in 6 countries: Honduras, El Salvador, Haiti, Dominican
Republic, Guyana, and Venezuela. These fees are unofficial in Honduras. Uniform Fees:
• The purchase of mandatory uniforms is implemented in 12 countries: Bolivia, Dominican
Republic, Ecuador, El Salvador, Guyana, Haiti, Honduras, Mexico, Nicaragua, Paraguay, Uruguay, and Venezuela. In 4 cases these fees are unofficial: Bolivia, Honduras, Mexico, and Nicaragua.
PTA/Community Contributions:
• PTA/community contributions are common in 14 of the countries surveyed: Argentina,
Bolivia, Brazil, Dominican Republic, Ecuador, Guyana, Haiti, Honduras, Mexico, Nicaragua, Panama, Paraguay, Uruguay, and Venezuela. In 7 of these countries, these fees are unofficial: Bolivia, Brazil, Ecuador, Honduras, Mexico, Panama, and Venezuela.
Other School-Based Activity Fees: • Other school-based activity fees are collected in 7 countries: Honduras, Dominican
Republic, Haiti, Ecuador, Guyana, El Salvador and Paraguay. These fees are unofficial in Honduras.
MIDDLE EAST & NORTH AFRICA (MENA) – PRIMARY EDUCATION Data Coverage: 10 World Bank client countries with IBRD/IDA-supported basic education projects. All countries in MENA, with the exception of Tunisia and Lebanon, have constitutional and legal provisions for Education. Tuition Fees:
• For these 10 countries, tuition fees are implemented in 4 countries: Republic of Yemen,
West Bank and Gaza, Lebanon, and Egypt. Tuition fees are collected legally in all four countries.

97
Textbook Fees:
• Textbook fees are imposed in one country, West Bank and Gaza, and these fees are legally allowed.
Fees for Uniforms: • Mandatory purchase of uniforms is implemented in 2 countries: Republic of Yemen and
Morocco. In both of these countries, fees for uniforms are legal. PTA/ Community Contributions: • PTA/ community contributions are common in 6 of these countries: West Bank and Gaza,
Djibouti, Morocco, Lebanon, Iran, and Jordan. These fees are unofficial in four countries: Republic of Yemen, Egypt, Iraq, and West Bank and Gaza.
Other School-Based Activity Fees: • Other school-based activity fees are collected in 3 countries: Djibouti, Republic of Yemen,
and Egypt. In Egypt these fees are legally allowed.
SOUTH ASIA (SAR) – PRIMARY EDUCATION
Data Coverage: 8 (all) World Bank client countries with IBRD/IDA-supported basic education projects.
Tuition Fees:
• Tuition fees are not implemented in any of these 8 countries. World Bank projects have introduced mitigating measures (either generalized or targeted) in Pakistan.
Textbook Fees:
• Textbook fees are imposed in none of these countries, although textbook fees are legally allowed in Bhutan.
Fees for Uniforms:
• Mandatory purchase of uniforms is implemented in 2 countries: Pakistan and Bhutan. These fees are unofficial in both cases.
PTA/Community Contributions:
98
• PTA/community contributions are common in 4 countries: India, Maldives, Afghanistan, and Bhutan. These fees are legally allowed in all cases.
Other School-Based Activity Fees: • Other school-based activity fees are collected in 3 countries: Pakistan, Afghanistan, and
Bhutan. These fees are legally allowed in Bhutan.
99
LOWER SECONDARY EDUCATION -- OVERALL SURVEY RESULTS Data Coverage: 76 World Bank client countries with IBRD/IDA-supported basic education projects
• Out of the 76 countries, almost all (94%) – 71 countries – have some type of fee with the
exception of 4 countries: Costa Rica, Sri Lanka, St. Kitts and Nevis, and Tunisia. • Countries generally have several fees. Ten (10) out of the 76 (13%) require
PTA/community contributions, but no other fees: Argentina, Azerbaijan, Iran, Jordan, Maldives, Namibia, Panama, Sierra Leone, Timor-Leste, and Ukraine.
• 51 out of 76 have more than one fee. The following 7 countries have all five types of fees
(tuition, textbook, uniforms, financial contributions, and other school-based activity fees): Bangladesh, Bolivia, Honduras, Indonesia, Lesotho, Mozambique, and Uganda.
• The following 5 countries have all fees except tuition fees: Bhutan, China, Guyana,
Mongolia, and Tajikistan. • The remainder of the countries, 31 out of 76 (41%), have between two and three types of
fees. Tuition Fees:
• For these 76 countries, tuition fees are implemented in only 33 countries (44%), although
only 30 countries (40%) have legal tuition fees. In 2 countries fees are implemented unofficially: Bolivia and Honduras.
Textbook Fees:
• Textbook fees are implemented in 34 countries (45%), though these fees are legally allowed in only 28 countries (82%).
• Four countries have unofficial textbook fees: Guatemala, Honduras, Russian Federation, and Bolivia.
Uniform Fees:
• Purchase of mandatory uniforms is implemented in 31 (41%) of these cases. In 21 (28%) of these countries fees for uniforms are legally allowed. Seven countries have unofficial uniforms fees: Honduras, Mozambique, Iraq, Bolivia, Ethiopia, Mexico and Nicaragua.
PTA/Community Contributions:
• PTA/community contributions are common in 52 (69%) of the countries surveyed. In 31 (41%) of these countries, it is legally allowed.
100
• 18 countries have unofficial PTA fees: Bolivia, Brazil, Ethiopia, Georgia, Ghana, Honduras, Indonesia, Kenya, Lao PDR, Mexico, Mongolia, Mozambique, Namibia, Panama, Tonga, Ukraine, Vanuatu, West Bank and Gaza.
Other School-Based Activity Fees: • Other school-based activity fees are collected in 36 (48%) of the countries. In 22 (29%) of
these countries it is legally allowed. It is unofficial in 12 countries: Bolivia, Brazil, Burkina Faso, Cambodia, Djibouti, Ethiopia, Honduras, Indonesia, Mozambique, Tonga, Vanuatu, and Republic of Yemen.
AFRICA (AFR) - LOWER SECONDARY
Data Coverage: 26 World Bank client countries with IBRD/IDA-supported basic education projects. Tuition Fees: • For these 26 countries, tuition fees are implemented in 18 countries: Burundi, Cameroon,
Democratic Republic of Congo, Eritrea, Ghana, Lesotho, Liberia, Madagascar, Malawi, Mozambique, Nigeria, Rwanda, Senegal, South Africa, Swaziland, The Gambia, Uganda, and Zambia. Tuition fees are collected legally in all countries.
Textbook Fees:
• Textbook fees are implemented in 10 countries: Democratic Republic of Congo, Eritrea,
Lesotho, Malawi, Mauritania, Mozambique, Rwanda, The Gambia, Uganda, and Zambia. These fees are legally allowed in all of these countries.
Uniform Fees: • The purchase of mandatory uniforms is implemented in 12 countries: Burkina Faso,
Burundi, Cameroon, Chad, Eritrea, Ethiopia, Lesotho, Liberia, Madagascar, Mozambique, Senegal, and Uganda.
• In two of these countries fees for uniforms are unofficial: Ethiopia and Mozambique. PTA/Community Contributions: • PTA/community contributions are common in 16 of the countries: Burkina Faso,
Cameroon, Chad, Democratic Republic of Congo, Ethiopia, Ghana, Kenya, Lesotho, Liberia, Madagascar, Mozambique, Namibia, Nigeria, Rwanda, Sierra Leone, and Uganda.

101
• In three of these countries the collection of this type of fee is unofficial: Burkina Faso, Ethiopia and Mozambique.
Other School-Based Activity Fees: • Other school-based activity fees are collected in 15 countries: Burkina Faso, Cameroon,
Chad, Democratic Republic of Congo, Ethiopia, Kenya, Lesotho, Liberia, Madagascar, Malawi, Mali, Mozambique, Senegal, The Gambia, and Uganda. In 4 of these countries the collection of these fees is unofficial: Burkina Faso, Ethiopia, Ghana, and Mozambique.
EAST ASIA & PACIFIC (EAP) – LOWER SECONDARY
Data Coverage: 10 World Bank client countries with IBRD/IDA-supported basic education projects. Tuition Fees:
• For these 10 countries, tuition fees are implemented in 3 countries: Indonesia, Tonga, and
Vanuatu. Tuition fees are collected legally in all countries. Textbook Fees: • Textbook fees are implemented in 5 countries: China, Indonesia, Mongolia, Tonga, and
Vanuatu. These fees are legally allowed and in all countries. Uniform Fees: • Purchase of mandatory uniforms is implemented in 3 cases: China, Indonesia and
Mongolia. Uniform fees are legal in all cases. PTA/ Community Contributions:
• PTA/community contributions are common in 9 countries: China, Indonesia, Lao PDR,
Mongolia, the Philippines, Thailand, Timor-Leste, and Tonga. • In 5 of these countries the collection of this type of fee is unofficial: Indonesia, Lao PDR,
Mongolia, Tonga, and Vanuatu. Other School-Based Activity Fees: • Other school-based activity fees are collected in 7 countries: Cambodia, China, Indonesia,
Mongolia, Thailand, Tonga, and Vanuatu. In 5 of these countries the collection of these fees is unofficial: Indonesia, Lao PDR, Mongolia, Tonga, and Vanuatu.
102
EASTERN EUROPE & CENTRAL ASIA (ECA) – LOWER SECONDARY
Data Coverage: 8 World Bank client countries with IBRD/IDA-supported basic education projects. Tuition Fees: • For these 8 countries, tuition fees are implemented only in Georgia; tuition fees are legal in
Georgia. Textbook Fees: • Textbook fees are implemented in 5 countries: Bosnia and Herzegovina, Bulgaria, Georgia,
Russian Federation, and Tajikistan. Textbook fees are unofficial in the Russian Federation. Uniform Fees: • Purchase of mandatory uniforms is implemented in Tajikistan. Fees for uniforms are legal
in Tajikistan. PTA/Community Contributions: • PTA/community contributions are common in 6 countries: Azerbaijan, Bulgaria, Georgia,
Russian Federation, Tajikistan, and the Ukraine. PTA contributions are unofficial in Georgia and the Ukraine.
Other School-Based Activity Fees: • Other school-based activity fees are collected in 2 countries: Russian Federation and
Tajikistan. These fees are legal in both countries.
LATIN AMERICA & CARRIBEAN (LAC) - LOWER SECONDARY Data Coverage: 15 World Bank client countries with IBRD/IDA-supported basic education projects. Tuition Fees:
• For these 15 countries, tuition fees are implemented in 4 countries: Bolivia, El Salvador,
Honduras, and St. Vincent and Grenadines. Tuition fees are collected unofficially in Bolivia and Honduras.
103
Textbook Fees: • Textbook fees are implemented in 8 countries: Bolivia, El Salvador, Guatemala, Guyana,
Honduras, Nicaragua, St. Vincent and Grenadines, and Venezuela. In 3 of these countries textbooks are unofficial: Bolivia, Guatemala, and Honduras.
Uniform Fees: • Purchase of mandatory uniforms is implemented in 8 of these cases: Bolivia, El Salvador,
Guyana, Honduras, Mexico, Nicaragua, St. Vincent and Grenadines, and Venezuela. • In 4 of these countries fees for uniforms are unofficial: Bolivia, Honduras, Mexico and
Nicaragua. PTA/Community Contributions: • PTA/community contributions are common in 11 of the countries: Argentina, Bolivia,
Brazil, Chile, Guatemala, Guyana, Honduras, Mexico, Nicaragua, Panama, and St. Vincent and Grenadines.
• In 5 of these countries the collection of this type of fee is unofficial: Bolivia, Brazil,
Honduras, Mexico, and Panama. Other School-Based Activity Fees: • Other school-based activity fees are collected in 5 countries: Bolivia, Brazil, El Salvador,
Guyana and Honduras. These fees are unofficial in 3 countries: Bolivia, Brazil and Honduras.
MIDDLE EAST & NORTH AFRICA (MENA) - LOWER SECONDARY Data Coverage: 10 World Bank client countries with IBRD/IDA-supported basic education projects. Tuition Fees:
• For these 10 countries, tuition fees are implemented in 4 countries: Egypt, Lebanon, West
Bank and Gaza, and Republic of Yemen. Tuition fees are legal in all of these countries. Textbook Fees: • Textbook fees are implemented in the West Bank and Gaza and these fees are legal in the
West Bank and Gaza.
104
Uniform Fees: • Purchase of mandatory uniforms is implemented in 3 of these cases: Iraq, Morocco, and
Republic of Yemen. • Fees for uniforms are unofficial in Iraq. PTA/ Community Contributions: • PTA/community contributions are common in 6 of the countries: Djibouti, Iran, Jordan,
Lebanon, Morocco, and West Bank and Gaza. • Collection of these fees is unofficial in the West Bank and Gaza. Other School-Based Activity Fees: • Other school-based activity fees are collected in Lebanon, where they are legal.
SOUTH ASIA (SAR) - LOWER SECONDARY
Data Coverage: 7 World Bank client countries with IBRD/IDA-supported basic education projects. Tuition Fees:
• For these 7 countries, tuition fees are implemented in 3 countries: Bangladesh, India, and
Nepal. Tuition fees are legal in all of these countries. Textbook Fees: • Textbook fees are implemented in 5 countries: Bangladesh, Bhutan, India, Nepal, and
Pakistan. Textbook fees are legal in all countries. Uniform Fees: • Purchase of mandatory uniforms is implemented in 4 of these cases: Bangladesh, Bhutan,
Nepal, and Pakistan; they are legal in all four countries.

105
PTA/ Community Contributions: • PTA/community contributions are common in 4 of the countries: Bangladesh, Bhutan,
India, and the Maldives; they are legal in all four countries. Other School-Based Activity Fees: • Other school-based activity fees are collected in 3 countries: Bangladesh, Bhutan, and
Pakistan. These fees are legal in all countries.
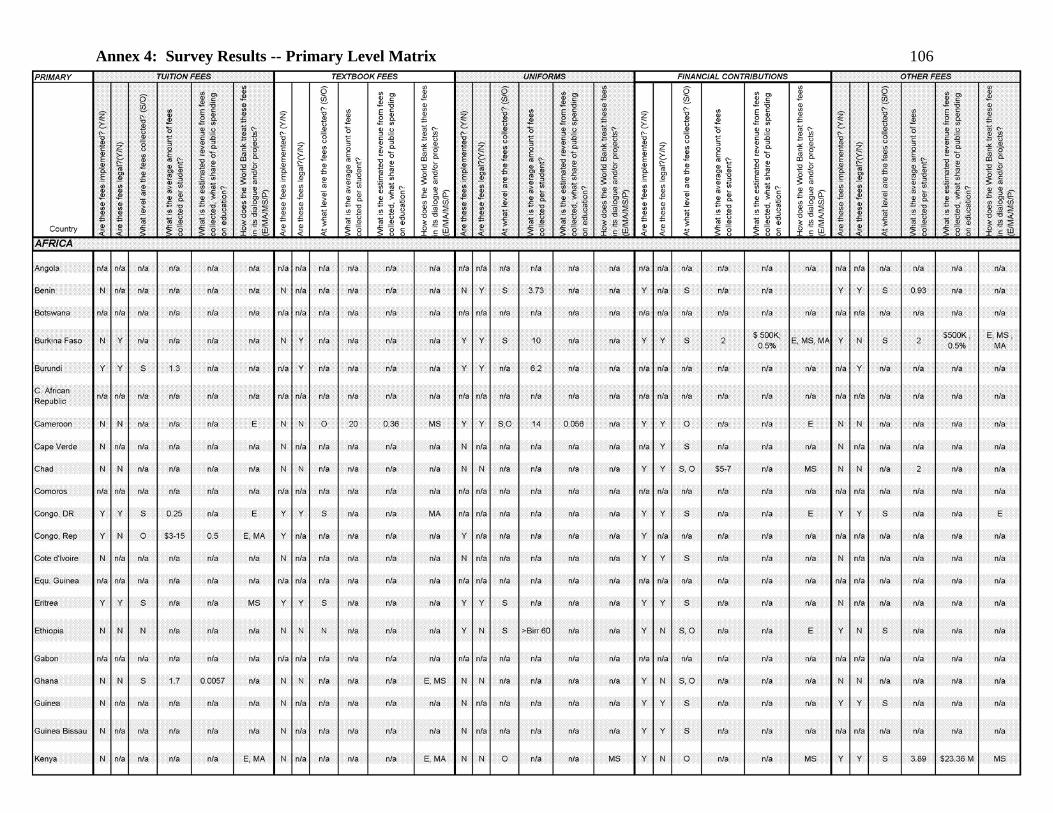
Annex 4: Survey Results -- Primary Level Matrix 106

107
Annex 4: Survey Results -- Primary Level Matrix 107
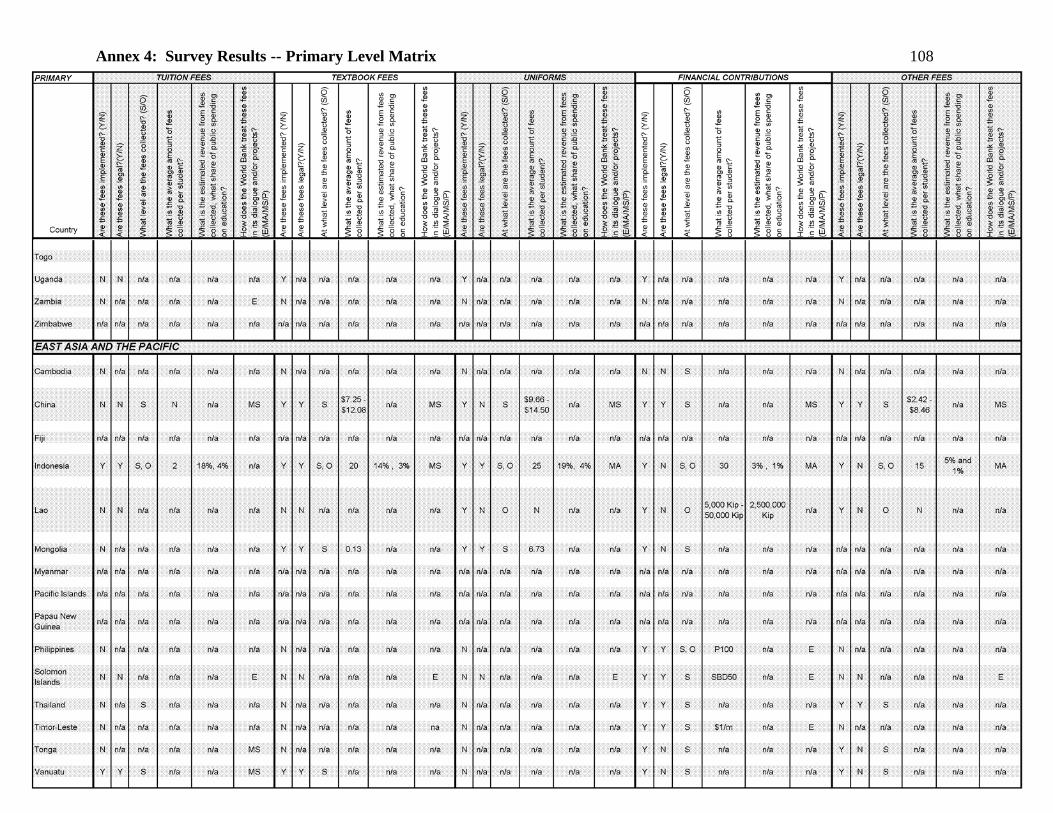
108
Annex 4: Survey Results -- Primary Level Matrix 108
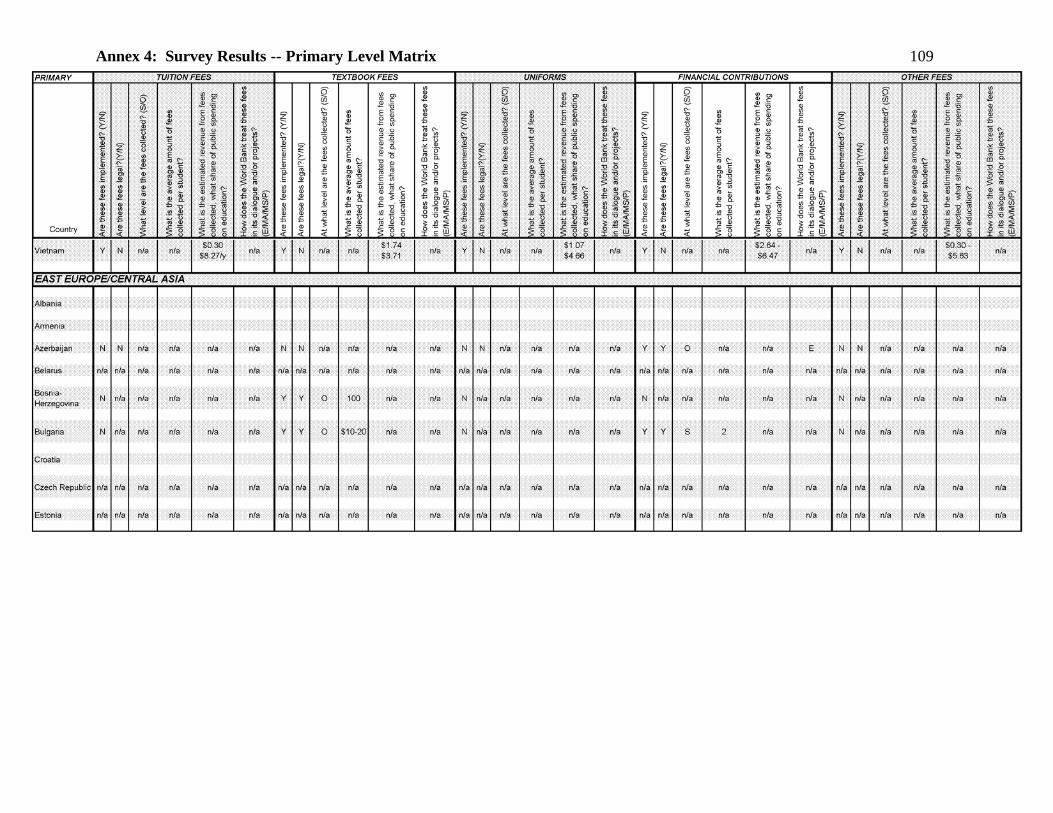
109
Annex 4: Survey Results -- Primary Level Matrix 109
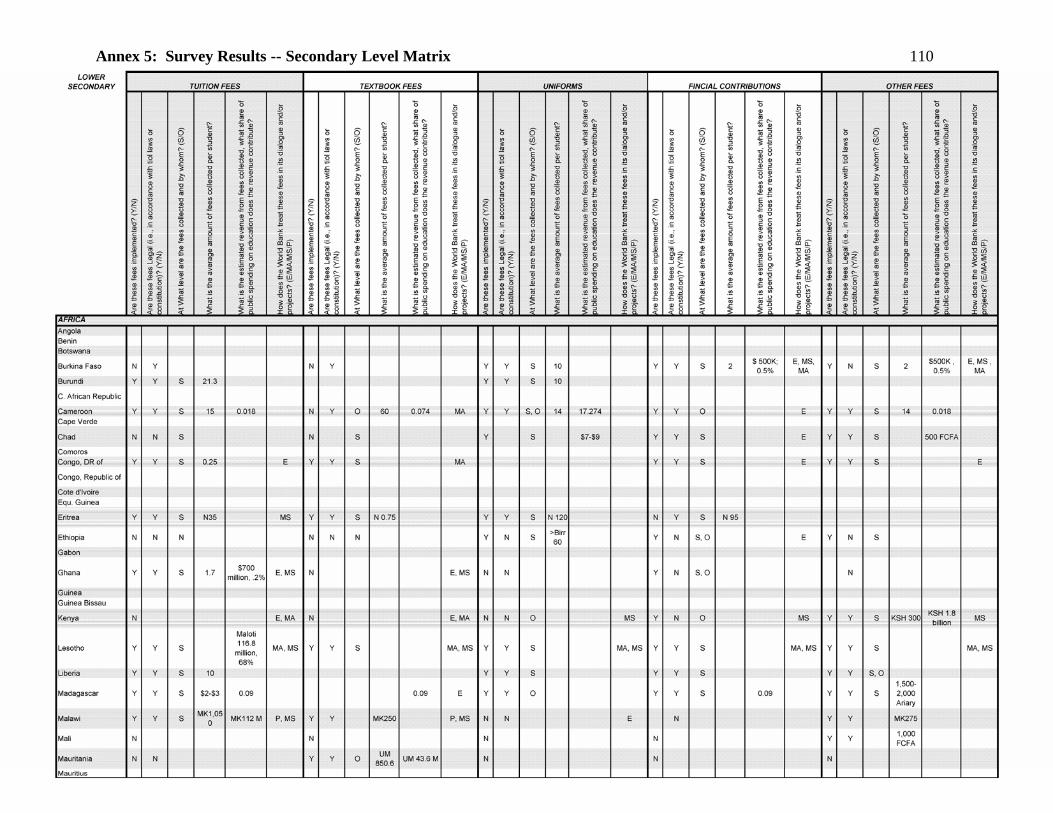
110
Annex 5: Survey Results -- Secondary Level Matrix 110

111
Annex 5: Survey Results -- Secondary Level Matrix 111

112
Annex 5: Survey Results -- Secondary Level Matrix 112
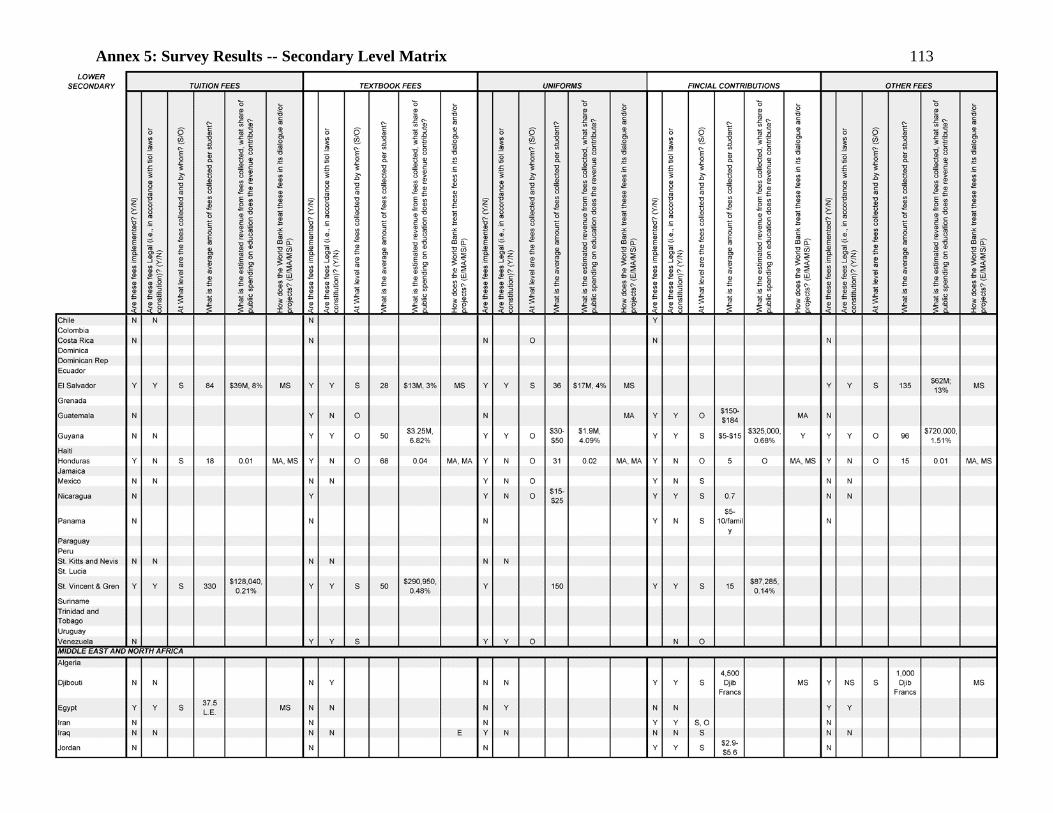
113
Annex 5: Survey Results -- Secondary Level Matrix 113
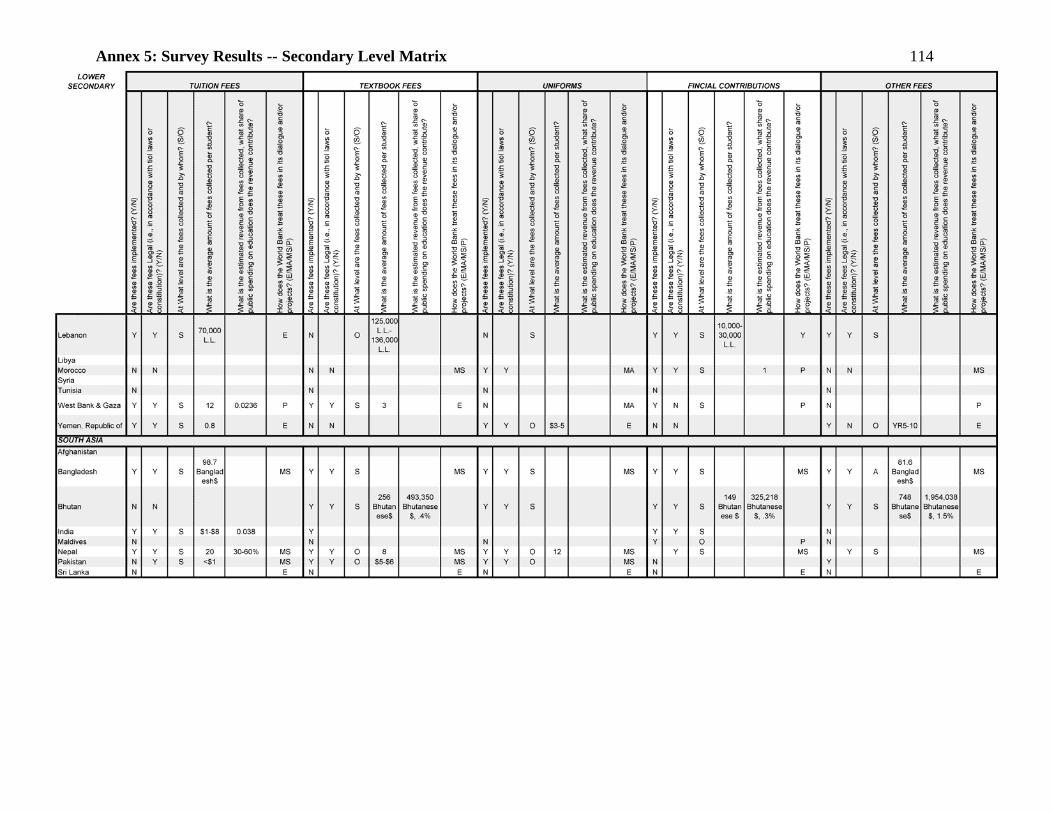
114
Annex 5: Survey Results -- Secondary Level Matrix 114
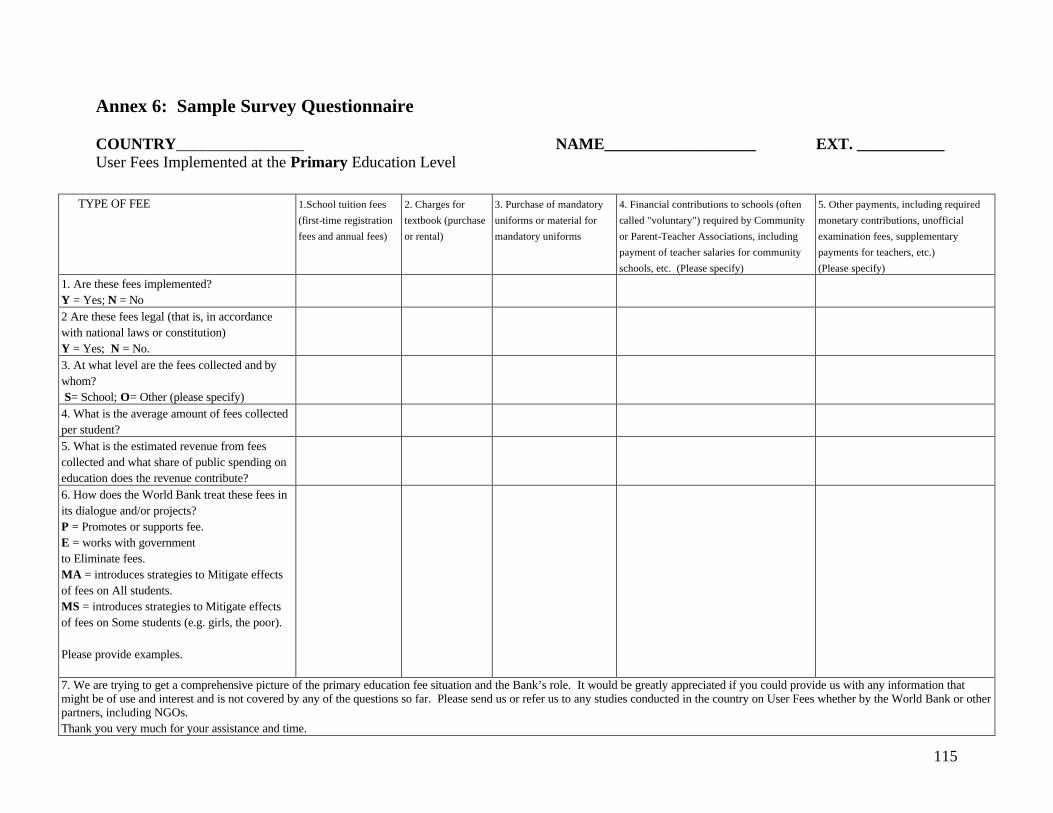
115
Annex 6: Sample Survey Questionnaire COUNTRY________________ NAME___________________ EXT. ___________ User Fees Implemented at the Primary Education Level
TYPE OF FEE 1.School tuition fees (first-time registration fees and annual fees)
2. Charges for textbook (purchase or rental)
3. Purchase of mandatory uniforms or material for mandatory uniforms
4. Financial contributions to schools (often called "voluntary") required by Community or Parent-Teacher Associations, including payment of teacher salaries for community schools, etc. (Please specify)
5. Other payments, including required monetary contributions, unofficial examination fees, supplementary payments for teachers, etc.) (Please specify)
1. Are these fees implemented? Y = Yes; N = No
2 Are these fees legal (that is, in accordance with national laws or constitution) Y = Yes; N = No.
3. At what level are the fees collected and by whom? S= School; O= Other (please specify)
4. What is the average amount of fees collected per student?
5. What is the estimated revenue from fees collected and what share of public spending on education does the revenue contribute?
6. How does the World Bank treat these fees in its dialogue and/or projects? P = Promotes or supports fee. E = works with government to Eliminate fees. MA = introduces strategies to Mitigate effects of fees on All students. MS = introduces strategies to Mitigate effects of fees on Some students (e.g. girls, the poor). Please provide examples.
7. We are trying to get a comprehensive picture of the primary education fee situation and the Bank’s role. It would be greatly appreciated if you could provide us with any information that might be of use and interest and is not covered by any of the questions so far. Please send us or refer us to any studies conducted in the country on User Fees whether by the World Bank or other partners, including NGOs. Thank you very much for your assistance and time.

116
Annex 7: Detailed Fee Amounts for Selected Countries
Country
School Tuition Fees
(USD) Textbook
Fees (USD)
Uniform fees
(USD) PTA dues
(USD) Other fees
(USD)
Type not specified (USD)
As % of public spending on education
Benin 3.67 0.91 Burkina Faso 10 2 2 1 Burundi 1.3 6.2 Cameroon 3.33 14 41.6
Chad (public schools)
5 to 7 in urban areas and 2 to 4 in rural areas 1 to 2
60 percent of teacher salaries at primary level and 30 to 40 percent of teacher salaries overall
Democratic Republic of Congo
see country status report
3 to 15 monthly
50 percent of school operating costs
Kenya 4 (exam fee)
Lesotho 22 to 70
14 percent of total public spending on primary school and 5 percent of total gov. recurrent expenditure on education
Liberia 5 10 5
Mali 9.2
20 percent of public spending on primary education
Mauritania 0.87
Mozambique
2 for school materials other than textbooks
10 although not mandatory 0.5 to 4
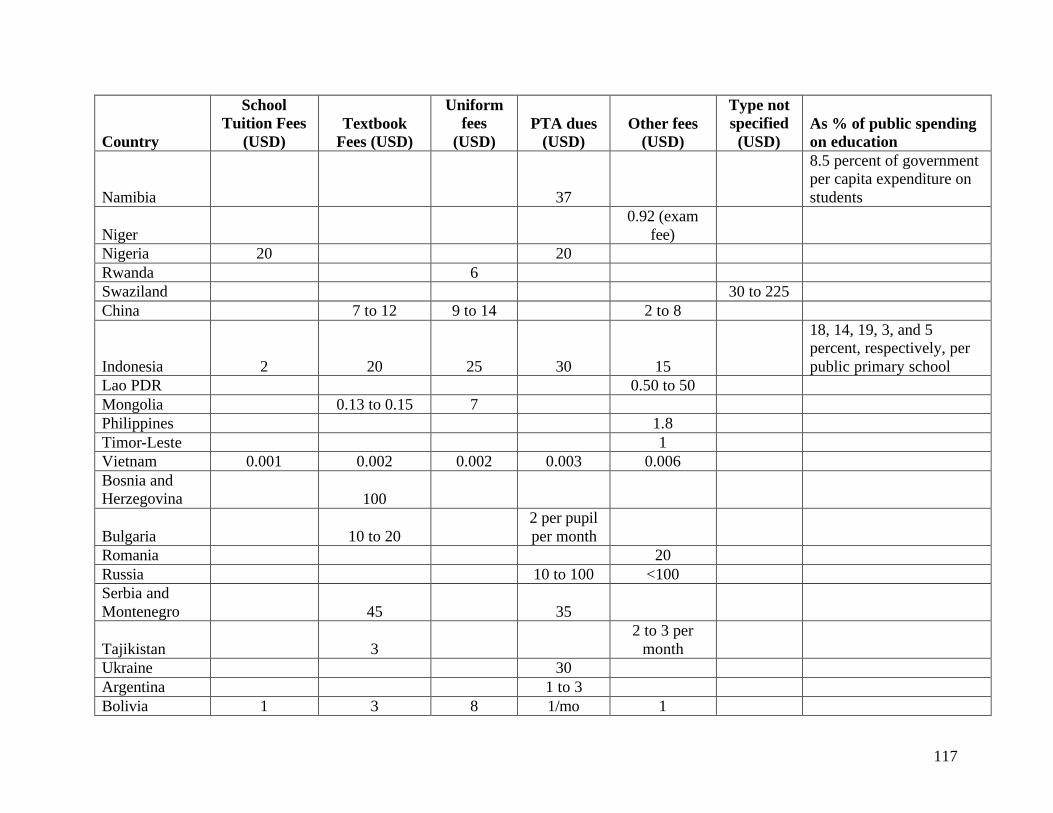
117
Country
School Tuition Fees
(USD) Textbook
Fees (USD)
Uniform fees
(USD) PTA dues
(USD) Other fees
(USD)
Type not specified (USD)
As % of public spending on education
Namibia 37
8.5 percent of government per capita expenditure on students
Niger 0.92 (exam
fee) Nigeria 20 20 Rwanda 6 Swaziland 30 to 225 China 7 to 12 9 to 14 2 to 8
Indonesia 2 20 25 30 15
18, 14, 19, 3, and 5 percent, respectively, per public primary school
Lao PDR 0.50 to 50 Mongolia 0.13 to 0.15 7 Philippines 1.8 Timor-Leste 1 Vietnam 0.001 0.002 0.002 0.003 0.006 Bosnia and Herzegovina 100
Bulgaria 10 to 20 2 per pupil per month
Romania 20 Russia 10 to 100 <100 Serbia and Montenegro 45 35
Tajikistan 3 2 to 3 per
month Ukraine 30 Argentina 1 to 3 Bolivia 1 3 8 1/mo 1

118
Country
School Tuition Fees
(USD) Textbook
Fees (USD)
Uniform fees
(USD) PTA dues
(USD) Other fees
(USD)
Type not specified (USD)
As % of public spending on education
Haiti 70 5 10
Ecuador 25 35 (for
materials) 45 1 to 10 25
El Salvador 26 16 25 64 5.3, 3, 5 and 13 percent, respectively
Guyana 25 to 30 27 to 45 5 to 15 10 5.25, 5.67, 1.05 and 8.40, respectively
Honduras 6 40 31 3 4 1, 10, 7, 3 and 4 percent, respectively
Nicaragua 15 to 25
0.60/mo in autonomous
schools Panama 5 to 10 Peru 2.2 0.28 2.94 0.73 4.89 Djibouti 5.84 1.62 Egypt 4.9 5.6 Palestine 12 3 2.36 percent Yemen 0.8 3 to 5
Bhutan 10 4.8 34.3 1.6, 1.6 and 11.3, respectively
119
Annex 8: School Fees in South Africa: Creating Equity or Perpetuating Disparities? In November of 1996, the post-apartheid South African government passed the South African Schools Act. The aim of the act was to create a new education system based on redressing injustices created during apartheid,41 improving equity, eliminating all forms of discrimination in education, and fostering participation and accountability at the local level. A key mandate of the act was the creation of governing bodies for public schools. Members of the governing bodies include parents, educators, non-educator staff, and students in the eighth grade or higher. Among other things, the governing body is responsible for administering the school funds, including public monies, school fees, and voluntary contributions. The act gives permission to the governing bodies to set and collect school fees, though the fees must be approved by a majority of parents. While parents are legally obligated to pay fees, any family unable to pay can seek exemption. In 1998, the act was amended to provide better guidelines on fee exemptions. The governing bodies were required to exempt families whose income was below certain thresholds, which are determined by the fee amount (Fiske and Ladd 2003). Families with household incomes falling below 30 times the set school fee are eligible for a partial exemption, while complete exemption is given to families whose household income falls below 10 times the designated fee (Lemon 2004). However, only 2.5 percent of students in the traditionally black schools and 4.1 percent in the former white schools in the Western Cape Province are exempt from paying fees. It is not clear, though, why there is such low incidence of fee exemptions. In 1995, primary school enrollment was near universal, between 95 and 99 percent according to varying estimates, and there is little to indicate that enrollment rates declined subsequent to the fee policy (Fiske and Ladd 2003). Fees may not impact enrollment because they are, in general, relatively low for the majority of the population but rise with income. Fiske and Ladd (2003) found that 63 percent of primary school students in the Eastern Cape, a very poor province, paid less than 25 rands per school year, while 5 percent paid fees of over 1000 rands. In contrast, in the more well-off Western Cape, 14 percent of students paid over 1000 rands to attend school. The school fee policy was also intended to create equal education opportunities, by releasing state funds for use by poor schools. And while the poorest 20 percent of schools receive 35 percent of government spending on education, compared to 5 percent for the richest 20 percent of schools, low school fees in poor schools do not compensate for the difference in fees received by rich schools. In fact, wide disparities exist between different types of schools (Bush and Heystek 2003; Fiske and Ladd 2003; Lemon 2004). Fiske and Ladd (2003) show that school fees, and thus funds for improving access to and quality of education, are lowest in traditionally black schools (45 rands) and highest in traditionally white schools in the Western Cape (2,077 rands). The black schools derive 1 percent of their income from fees, while former white schools collect enough fees to increase funding by 54 percent. In addition, public funds per student in the traditionally black schools are 3,002 rands, compared to 3,857 rands in the former white
41 Lemon (2003) notes that “The average white pupil, in 1994…benefited from educational expenditure that was nearly four times as great as that for the average African pupil” (p. 270).

120
schools. This funding gap manifests itself most in terms of quality indicators. Fees allow former white schools to hire four more teachers, in addition to those provided by public funding. In contrast, traditionally black schools can only hire an additional 1/5th of a teacher. Student to state-paid-teacher ratios are higher at black schools (38.4:1) than at white schools (35.9:1). Almost 7 percent of teachers at black schools are unqualified, compared to only 0.8 percent at white schools. These disparities are even greater at the secondary school level and translate to lower educational outcomes. For example, controlling for income and the level of fees, Fiske and Ladd (2003) found that higher qualified teachers and a larger proportion of teachers paid by school fees lead to higher pass rates on the national matriculation exams for students in the 12th grade. There are also disparities between provinces (Lemon 2004). In the Eastern Cape, where unemployment is higher than the national average, 26 percent of teachers were unqualified in 2002, compared to the national average of 22 percent. Additionally, the student:teacher ratios and matriculation exam pass rates were 35.7:1 and 46 percent, compared to the national averages of 32.7:1 and 62 percent, respectively (Gilmour 2001). School fees appear to perpetuate existing disparities between former white schools and historically black schools. This suggests that additional public funds should be provided for poor schools to compensate for the historical inequalities in resources between schools, as well as low levels of current funding to bring disadvantaged schools up to speed. The government has taken steps to address the situation. In 2004, proposed amendments to the Schools Act sought to improve the mechanisms for allocating resources to schools based on need, and to improve allocation of resources within schools (Government of South Africa 2004). The government has announced plans to turn schools serving the poorest communities into non-fee schools starting in 2006.

121
Annex 9: Offsetting Fees Many countries recognize that the cost of education fees can be a burden on the poor and may deter enrollments and learning. As a result there is a wide variety of measures in place around the world to mitigate the effects of fees. These can include reducing or eliminating tuition fees for the poor, offering scholarships to attend school, providing free textbooks and other learning materials, and providing free uniforms (Table A1). In addition, some countries provide targeted subsidies to help offset some of the other costs of attending school, such as transport costs and bursaries and stipends to enable poor families to overcome the indirect opportunity costs, in terms of lost contributions to the household economy, of attending school. Table A1. Offsetting Fees Types of Mitigating Measures
Country Examples:
Tuition-Related Interventions: Reduce or eliminate tuition fees for the poor, girls, and other disadvantaged groups.
Burkina Faso, China, Djibouti , Ethiopia, Jordan, Lesotho
Scholarships and Stipends. These are often accompanied by performance related measures such as “girls in deprived regions who excel in science and math,” or scholarships that are “contingent on regular school attendance and successful grade completion.”
Bangladesh, Brazil, Ethiopia, Ghana, The Gambia, Guatemala, India, Indonesia, Malawi, Mauritania, Morocco, Mozambique, Nepal, Nicaragua, Panama, Pakistan, Senegal, Mali, Zambia, Chad
Targeted bursaries
China, Colombia, India, Indonesia, México, Nicaragua Tanzania, Zambia
Textbook-Related Interventions:
Eliminate textbook rental fee and replace with a loan scheme.
The Gambia, Vietnam
Provide free textbooks to grades 1 to 7 Mali, Nigeria, Rwanda, Senegal, Provide free textbooks to targeted groups (poor, girls etc.)
Armenia, China, Chile, Ethiopia, Guinea, India, Malaysia, Morocco, Nepal, Tajikistan, Turkey
Learning Materials: Provide learning materials other than textbooks (stationary etc.)
Bangladesh, India, Mozambique
Provision of Free Uniforms
India
Transport-related interventions:
Provide bicycles for poor students to get to school in rural areas
Thailand, Ghana
Source: User Fee Surveys 2001 and 2005; World Bank Project Appraisal Documents

122
While not completely eliminating fees, some countries have taken steps to waive fees for the poorest households. China recently announced that it would fully remove fees for 14 million students in the country’s poorest rural communities, and will continue to remove fees until 2006, at which time all rural students will receive free primary education (Yardley 2005). Experience from Latin America also provides examples of successful targeted programs for the poor. Brazil’s Bolsa Escola program and Mexico’s Oportunidades are conditional cash transfer programs (CCTs) that have had a positive impact on enrollment rates and schooling outcomes in addition to other indicators of well-being, such as health and child labor. CCTs, a relatively new type of social program, provide cash grants to poor families conditional on certain types of behaviors, such as sending children to school and attending regular preventative health care visits. The principle objective of most CCTs is the long-term accumulation of human capital, which is considered crucial to breaking the inter-generational transmission of poverty (Rawlings 2004). CCTs have been widely implemented across Latin America42, where the concept was originally developed, and a handful of other countries, 43 based mostly on the success of Oportunidades (see Box A1). Girls While eliminating fees has been shown to promote girls’ school participation, many countries use other targeted mechanisms to encourage families to send their daughters to school. For example, Burkina Faso has proposed to remove fees for girls in the first and second grades. Chad’s EFA strategy includes reduced fees for girls. Djibouti targets girls in underprivileged areas. Ghana provides bicycles to girls. Mali and Zambia also target girls (Tempest 2005). Due to the lower enrollment rates of girls in secondary school in Mexico, Oportunidades grants received in those years are higher for females than for males to offset the opportunity costs of sending them to school, thus acting as an incentive to keep girls in school and close the gender gap in schooling. Bangladesh’s Female Secondary School Assistance Program (FSSAP) has introduced measures to offset school fees by providing monetary incentives for girls to reduce the direct costs of schooling44 and to encourage participation, contingent on regular school attendance and successful grade completion. Enrollment doubled in project areas between 1994 and 2001, from 462,000 to more than 1 million girls. Benefits from second phase of the project, FSSAP II, are expected to reach 1.45 million girls (Nuffic 2002).
42 Conditional cash transfer programs have been implemented in Colombia, Costa Rica, Honduras, Nicaragua, Bolivia, Ecuador, Chile, and Brazil. 43 Jamaica and Turkey are among a few non-Latin American countries that have implemented conditional cash transfer programs. 44 Direct costs include tuition, examination costs, and the increasing cost of school fees, textbooks, school supplies, uniforms, shoes, transport, and kerosene (for lamps).

123
Box A1. The Mexican Experience with a Conditional Cash Transfer Program
In 1997 the Mexican government single-handedly designed and, in 1998, successfully implemented the Education, Health, and Nutrition Program (Programa para Educacion, Salud, y Nutricion-Progresa), now called Oportunidades, a program that provides immediate financial transfers to the rural poor45 that at the same time promotes investment in children’s human capital (future earnings) via increased schooling and improved health and nutrition status. Oportunidades gives cash transfers (grants) to poor rural families conditional on keeping children in school and providing them with basic preventive healthcare and nutrition. The benefit levels are intended to offset the opportunity costs of not sending children to school and increase with grade level, recognizing that the opportunity cost of children’s time increases as they grow older. By the end of the experimental phase in 2000, almost 2.5 million families in over 2,000 municipalities were receiving Oportunidades benefits. In 2004 the program reached 5 million families in 2,429 municipalities. Since its implementation in 1996, Oportunidades has delivered over US$5 billion in cash grants to beneficiaries. In addition, beneficiaries of the program are highly concentrated in the poorest quintile of the population (World Bank 2003b), suggesting that Oportunidades has, overall, been highly successful in targeting the poorest groups. Interviews with beneficiaries and program administrators substantiate this finding -- the program was consistently commended as the first to successfully send resources directly to households in remote rural communities. In fact, Oportunidades is the first program in Mexican history to explicitly target the rural poor. Preliminary analysis of the experimental phase showed that Oportunidades yielded impressive results nationwide in the first couple of years following implementation. Primary school enrollment rates increased by about 1 percent, and secondary school enrollment rates increased by 8 percent for girls and 5 percent for boys. Furthermore, it was estimated that children’s educational achievement increased by about 10 percent, which would represent an increase in their future earnings of more than 8 percent. Prenatal care in the first trimester of pregnancy increased by 8 percent. Finally, incidence of disease among children under age 5 decreased by 12 percent among program participants, as had the probability of malnutrition among children between 12 and 36 months. More recent results have shown that Oportunidades is significantly associated with
• Increased overall health • Increased preventative health and nutrition monitoring visits • Decreased probability of stunting • Increased school enrollment rates • Increased school continuation rates • Evidence of slowed growth of poverty rates • Decreased income inequality • Decreased child labor rates • Increased consumption of more nutritious foods
Sources: Bando et. al. 2005; Behrman and Hoddinott 2000; Gertler 2000; Hall et. al. 2002; Hoddinott et. al. 2000; Schultz 2000a; Schultz 2000b; SEDESOL 1999; Skoufias et. al. 2001.
45 In subsequent stages, Oportunidades was expanded to urban areas.

124
One of the key objectives of The Gambia’s Third Education Sector Program (TESP) is to increase the enrollment, retention and performance of girls attending Grades 1 to 12. To help overcome barriers to girls’ education, such as poverty, the TESP introduced a scholarship scheme for girls at the upper basic and secondary levels. There are two key elements of the scheme. First, full scholarships for tuition, books and examination fees are awarded to one-third of girls in upper basic and secondary schools with low enrollment in the most deprived regions of The Gambia. Second, full scholarships for tuition and examination fees are awarded to ten percent of girls in upper basic and secondary schools in less deprived regions who are excelling in science, mathematics and technology. A trust fund to finance the scholarship scheme is administered by the Social Welfare Department. The scheme will be evaluated at various stages and could be extended to needy and meritorious students in less deprived regions. Guatemala’s Eduque a la Niña program represents another program that targets girls who are generally underserved in the Guatemalan primary school system. A scholarship equivalent to US$4 a year is given to each enrolled girl in a few poor villages to cover school-related costs.
Results of rigorous reviews of these programs have indicated that they have been reasonably successful. Evaluations of Brazil’s Bolsa Escola, which guarantees a minimum wage to every low-income family conditional on keeping its children aged 7 to 14 years in school, indicate that the program has led to higher enrollment rates and reductions in school drop-out and repetition rates. Evaluations of Mexico’s Oportunidades program indicate that the program has significantly increased enrollment, particularly girls’ enrollment at the secondary level. Evaluations of Guatemala’s Eduque a la Niña have found a positive impact on girls’ participation and performance. According to evaluations of Bangladesh’s FSSAP, the participating schools witnessed a sharp increase in female enrollment. There was a general reduction in drop-out rates among participating schools.
HIV/AIDS Orphans and Vulnerable Children There are an estimated 12.3 million children who have lost one or both parents to HIV/AIDS in Sub-Saharan Africa. According to a 2004 joint UNAIDS, UNICEF, and USAID publication, in 11 of the 43 countries in the region, at least 15 percent of children are orphans, and in 5 of those 11 countries, HIV/AIDS is the cause of parental death more than 50 percent of the time. The report estimates that by 2010, more than 18 million children in the region will have lost one or both parents to the disease. These staggering statistics highlight the vulnerability of children who experience reduced parental care and protection, coupled with increased economic hardship as a result of HIV/AIDS (UNICEF 2004). Children often become the primary caregiver when a parent is infected with HIV and is unable to work. Children are also frequently taken out of school, either to provide care for the sick parent or to work outside the home to earn extra income. School fees may become unaffordable when one or both parents are too sick to work. School fees may further prevent children orphaned or made vulnerable by HIV/AIDS — particularly double orphans or those living in single-parent households — from accessing education (UNICEF 2004). This has serious implications for at-risk populations, especially girls.

125
General elimination of fees has been successful in getting orphans into school (for example in Kenya, Lesotho, and Tanzania), and several countries have also implemented targeted mechanisms for raising enrollment rates for orphans and vulnerable children. In cooperation with the African Development Bank, Uganda implemented the Education II project in 2001. One of the goals of the project was to increase provision of education for AIDS orphans. Tanzania’s National Education Fund provides scholarships to AIDS orphans. Namibia, Rwanda, Swaziland, Zambia, and Zimbabwe also provide fee waivers or bursary schemes for orphans and vulnerable children (Tempest 2005). Burundi and the Democratic Republic of Congo have also proposed removing fees for the same population (Tempest 2005). In addition to being at risk of becoming an orphan, youth are at risk for becoming HIV positive. However, studies have shown that education can help lower HIV/AIDS infection rates among young people. For example, young people who do not complete primary school exhibit infection rates that are at least double those of young people who have completed primary school. In addition, 15 to 18 year old girls in Zimbabwe who have dropped out of school are five times more likely to become infected than those who are enrolled in school (UNAIDS 2005). That is why it is important that, in addition to reducing barriers to education for HIV/AIDs orphans, the education system incorporate HIV health education.
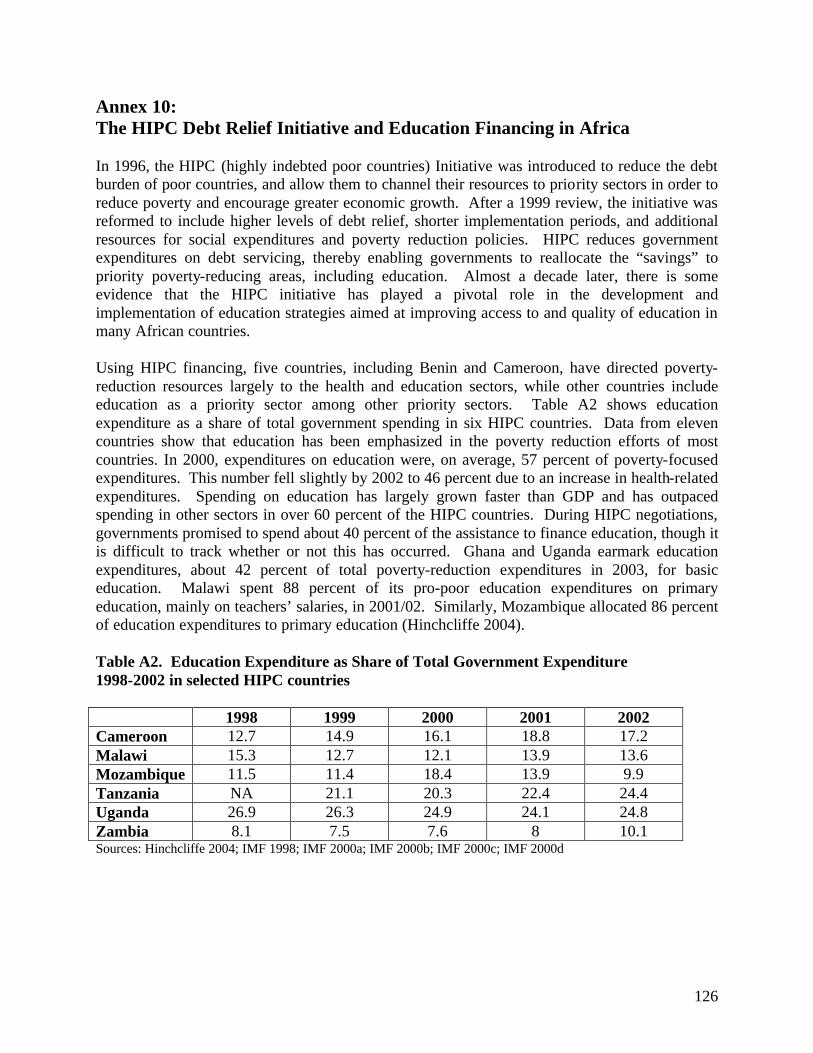
126
Annex 10: The HIPC Debt Relief Initiative and Education Financing in Africa In 1996, the HIPC (highly indebted poor countries) Initiative was introduced to reduce the debt burden of poor countries, and allow them to channel their resources to priority sectors in order to reduce poverty and encourage greater economic growth. After a 1999 review, the initiative was reformed to include higher levels of debt relief, shorter implementation periods, and additional resources for social expenditures and poverty reduction policies. HIPC reduces government expenditures on debt servicing, thereby enabling governments to reallocate the “savings” to priority poverty-reducing areas, including education. Almost a decade later, there is some evidence that the HIPC initiative has played a pivotal role in the development and implementation of education strategies aimed at improving access to and quality of education in many African countries. Using HIPC financing, five countries, including Benin and Cameroon, have directed poverty-reduction resources largely to the health and education sectors, while other countries include education as a priority sector among other priority sectors. Table A2 shows education expenditure as a share of total government spending in six HIPC countries. Data from eleven countries show that education has been emphasized in the poverty reduction efforts of most countries. In 2000, expenditures on education were, on average, 57 percent of poverty-focused expenditures. This number fell slightly by 2002 to 46 percent due to an increase in health-related expenditures. Spending on education has largely grown faster than GDP and has outpaced spending in other sectors in over 60 percent of the HIPC countries. During HIPC negotiations, governments promised to spend about 40 percent of the assistance to finance education, though it is difficult to track whether or not this has occurred. Ghana and Uganda earmark education expenditures, about 42 percent of total poverty-reduction expenditures in 2003, for basic education. Malawi spent 88 percent of its pro-poor education expenditures on primary education, mainly on teachers’ salaries, in 2001/02. Similarly, Mozambique allocated 86 percent of education expenditures to primary education (Hinchcliffe 2004). Table A2. Education Expenditure as Share of Total Government Expenditure 1998-2002 in selected HIPC countries 1998 1999 2000 2001 2002 Cameroon 12.7 14.9 16.1 18.8 17.2 Malawi 15.3 12.7 12.1 13.9 13.6 Mozambique 11.5 11.4 18.4 13.9 9.9 Tanzania NA 21.1 20.3 22.4 24.4 Uganda 26.9 26.3 24.9 24.1 24.8 Zambia 8.1 7.5 7.6 8 10.1 Sources: Hinchcliffe 2004; IMF 1998; IMF 2000a; IMF 2000b; IMF 2000c; IMF 2000d
127
It is not clear to what extent HIPC has funded greater education spending in general, and school fee elimination policies specifically, mainly due to the fact that budgetary procedures are complex and often not transparent. HIPC countries are not required to report disaggregated information on expenditures, though they must meet trigger points for debt relief measures to be implemented. These trigger points include eliminating fees for primary education (Benin and Guinea-Bissau), meeting targets for teacher intake and training (Malawi), undertaking a school mapping exercise (Tanzania), and raising teacher salaries in rural areas above the household poverty line (Zambia). Nevertheless, given that education is identified as a priority sector within the initiative framework for most countries, HIPC could be a powerful tool for improving access to, and quality of, education.

128
Annex 11. Donor Positions on User Fees Several multilateral and bilateral development aid organizations have adopted positions on user fees for education. UNICEF, UNESCO, and the Asian Development Bank all believe that countries should work towards eliminating school fees. The World Bank does not support user fees, but recognizes that in some cases local charges are inevitable. USAID and DFID appear to encourage countries to abolish school fees, though both recognize that resource constraints and inefficient resource use may constrain such efforts. The Inter-American Development Bank and the African Development Bank do not seem to have official positions on school fees. World Bank The World Bank does not support user fees for primary education. Where governments do levy user fees, the Bank helps governments to reduce the burden on poor people by recommending and providing finance for targeted subsidies. The World Bank has worked with governments to expand access to basic education, including the removal of financial and other barriers, especially for the poor. The World Bank is also working to document and help eliminate unauthorized or unofficial charges for basic education services. While the World Bank strongly believes that governments should not charge user fees for education, the Bank recognizes that local communities sometimes do levy such charges that are often paid in-kind through labor services. These additional charges can build community support for local schools and subsequently improve the quality of, and expand the access to, education. Given that such local charges can help sustain education services, the Bank believes they must be carefully designed to ensure that poor parents keep their children in school. United States Agency for International Development (USAID) USAID takes an expansive definition of basic education, including early childhood development, primary education, informal and formal secondary education, and teacher training at each level. In order to provide equitable access to quality education, especially for the poor and other disadvantaged populations, USAID “encourages host countries to replace school fees with adequate public funding for primary education wherever possible, so as to encourage poor families to keep their children in school” (USAID 2005, pp 7-8). USAID also works with host nations on issues of educational finance and resource scarcity in order to improve efficiency and reduce the use of school fees. USAID’s education strategy outlines two broad objectives: promoting equitable access to quality basic education, and investing in post-basic education to improve productivity-oriented knowledge and skills. United Nations Children’s Fund (UNICEF) UNICEF seeks to abolish school fees to encourage poor families to enroll their children in school and increase access to basic primary education. In pursuit of this objective, UNICEF and the World Bank launched the School Fee Abolition Initiative (SFAI) in 2005, which aims at making a breakthrough in access to basic education and significantly scaling up efforts to meet the MDGs and the Education for All targets in the next decade. SFAI aims “to organize and provide guidance to countries in planning and implementing a policy on school fee abolition, in securing

129
rapid intensified external assistance in the short and medium term, and in ensuring long term sustainability in terms of more equitable allocation and effective management of education and other resources” (UNICEF 2006). United Kingdom, Department for International Development (DFID) DFID has recently strengthened its position on the removal of fees and other compulsory charges for primary education and maintains that “Tuition fees and compulsory charges are a significant barrier to poor children’s access to primary schools [and that] removing these fees and charges will boost access” In addition, DFID states that “To be successful, and to protect standards, the abolition of fees must be part of a comprehensive, long-term plan for universal primary enrollment. This has to include complementary measures such as teacher recruitment and training, and the provision of teaching and learning materials." (DFID 2005). The abolition of school fees has also been forcefully advocated in recent months by the UK’s Chancellor of the Exchequer Gordon Brown, who stated,
“I want to particularly draw attention to the need for free primary education. It must be universal, but it must be free. I was in Kenya more than a year ago and I found that in the week that Kenya had made primary education free for its children, 1 million children who had not had schooling turned up to be registered for school, just one signal of the demand for education when it is available free of charge. And from Kenya, Tanzania, Uganda, Malawi, Zambia, we know that more than 1 million children in each of these countries were added to the education roles when education was made free. So part of our commitment to funding is to make it possible for primary education to be both universal and free. And I hope that we can move this forward quickly in the next few months.” (Gordon Brown, Singapore 2006)
United Nations Educational, Scientific and Cultural Organization (UNESCO) UNESCO made universal education a top priority as far back as 1946, when Education for All (EFA) was written into its constitution. The Convention against Discrimination in Education (UNESCO 1960) established an obligation to states parties to make primary education free and compulsory (Article 4) taking all domestic legislative and regulatory measures necessary to abrogate any texts that are contrary to the provisions contained in the Convention, and adopting those that will bring legislation and national policies in line with it. As stated in its Medium-Term Strategy (2002-2007), UNESCO promotes education as a fundamental right in accordance with the Universal Declaration of Human Rights. Free, compulsory, and universal primary education for all is considered as the most clearly defined of these rights, which governments have a duty and responsibility to make a reality. UNESCO assists countries in adapting legislation, policies and plans and provides capacity development in support of free, compulsory, and universal primary education – an essential building block for its work with other partners to fulfill the EFA and MDG agendas.

130
Asian Development Bank (ADB) The Asian Development Bank believes that basic education should be provided by the government for free (ADB 2003). It defines basic education as the first nine years of schooling, primary and lower secondary school. In addition to basic education, the sub-sector also focuses on non-formal education, early childhood development, and women and girls’ education. The ADB’s top priorities for basic education, as outlined in its education policy, are guaranteeing equitable access to education, equitable allocation of resources, improving quality, fostering community involvement, and enhancing local management. The ADB sees equitable access to basic education of paramount importance to achieving poverty reduction. Between 1991 and 2001, investment in basic education rose from 11 to 41 percent of its total education lending portfolio, which remained at 6 percent of overall lending during the same time period. As noted above, the ADB endorses free basic education but also works with governments to develop mechanisms to help poor households pay for other costs of schooling, such as uniforms, transportation, shoes, transportation, and opportunity costs. Mechanisms include targeted subsidies, scholarships, and special incentives. African Development Bank (AFDB) In its Strategic Plan 2003-2007, the AFDB indicated that it would significantly increase funds allocated to the basic education sector. Priorities will be expanding access to education and making education more affordable for households. Particular emphasis will be on girls’ enrollment and retention rates. The plan did not specify whether the AFDB has an official stance on user fees. Inter-American Development Bank (IDB) The IDB is currently working to improve quality and equity at the primary and secondary education levels (IDB 2000). In addition, it will also work towards increasing access to schooling where necessary, particularly at the secondary level. It does not appear to have a specific position on user fees.

131
Annex 12: Analytical Framework for thinking about User Fees
Source: World Bank 2004e
The findings, interpretations and conclusions expressed in this paper are entirely those of the authors and should not be attributed in any manner to the World Bank, its affiliated organizations or to the members of its board of executive directors or the countries they represent.
Copies of this publication may be obtained in hard copy through the Education Advisory Service ([email protected]) and electronically through the World Bank Education website (www.worldbank.org/education).
AchievingAchieving the Millenium Development Goal of universal basic education requires that all children enter primary school, complete the cycle, and acquire a set of basic skills. Although access rates have improved over the last decade, equitable access remains a problem. Access differs significantly by family income, urban/rural location and gender. One key obstacle to achieving the MDG for education is the high cost of education to parents, especially for the poorest households. User fees remain common in many countries whose constitutions mandate free education. As countries seek ways to increase access to education, elimination or reduction of feesfees is a natural policy to consider. There is continuing demand from client countries for guidance on implementing free primary education. In 2001, the World Bank conducted a survey to understand the extent that user fees are collected for primary education. The results were reported in User Fees in Primary Education, which identified user fees as a pervasive obstacle to primary school enrollment and completion for millions of children around the world. The User Fees in Primary Education publication examined the experiences of Uganda and Malawi, highlighted the surges in enrollment that accompanied fee removal, and recognized fee removal asas an important strategy towards achievement of the MDGs for education in many countries. It also cautioned that these surges at times threatened to overwhelm countries’ educational systems, and emphasized that the successful elimination of fees requires considerable planning.
Between 2001 and 2005 a number of countries abolished fees, and now it has become timely to update this analysis. This new study includes: (i) updated data on primary school fees in ninety-four countries, (ii) new data for lower secondary, and (iii) updated country profiles detailing the experiences of countries that have implemented free basic education (FBE). It attempts to capture the lessons learned from the experiences of these countries in order to identify the success and challenges and, ultimately, to provide recommendations for other countries seeking guidance on eliminating school fees in the future.
www.worldbank.org/education
THE WORLD BANK 1818 H Street, NW Washington, DC 20433