
Resources Inc. Coronado Global
35
Coronado Global Resources Inc. Financial Report for the six month period ending 30 June 2020
Transcript of Resources Inc. Coronado Global

Coronado Global Resources Inc.
Financial Reportfor the six month period ending30 June 2020

Coronado Global Resources Inc. 2
ContentsAppendix 4D 3
Directors’ Report 4
1. Operating and financial review 4
2. Review of Financial Performance 5
3. Summary of Financial Position 6
4. Production and Development 6
5. Segment Performance 7
6. Liquidity and Capital Management 8
7. Outlook 9
Interim Financial Statements 30 June 2020 11
Report of Independent Registered Public Accounting Firm 12
Condensed Consolidated Balance Sheet 13
Unaudited Condensed Consolidated Statements of Operations and
Comprehensive Income
14
Unaudited Condensed Consolidated Statements of Shareholders' Equity Capital 15
Unaudited Condensed Consolidated Statements of Cash Flows 16
Notes to Unaudited Condensed Consolidated Financial Statements 17
Appendix A – Cautionary Notice Regarding Forward-looking Statements 32
Appendix B – Reconciliation of Non-GAAP Financial Measures 33

Coronado Global Resources Inc. 3
Appendix 4DCoronado Global Resources Inc.
ARBN 628 199 468
This report comprises the half year end financial information given to the Australian Securities Exchange (ASX) under Listing Rule 4.2A. This includes the consolidated results of Coronado Global Resources Inc. (“Coronado” or the “Company”) for the half year ended 30 June 2020 (HY20).
All amounts in this Half Year Report are denominated in United States dollars (USD) unless otherwise indicated.
Results for announcement to the market
Reporting period: 30 June 2020
Previous corresponding period: 30 June 2019
30 June 2020 30 June 2019 VarianceRevenue from ordinary activities 713,666 1,234,335 (520,669)Net (loss) income from ordinary activities (123,196) 214,326 (337,522)Net (loss) income attributable to Coronado Global Resources Inc. (123,192) 214,330 (337,522)
A detailed discussion of the Company’s operating results for the half-year ended 30 June 2020 is included in the Directors’ Report set out on pages 4 to 9.
Net tangible asset backing30 June 2020 31 December
2019Net tangible asset backing per ordinary security (US$) 6.82 8.64Net tangible asset backing per CDI (US$) 0.68 0.86
Dividends and Return of Capital
Final and interim dividends per CDIPaid or Payable
onAmount per
CDI
Franked amount per
CDI
Conduit foreign income component
per CDI2019 Final dividend - paid 31 March 2020 $ 0.025 $ 0.025 NIL
No dividend has been declared or paid since the half-year ended 30 June 2020.
Details of associates and joint venture
Associate / joint venture 30 June 2020 31 December 2019Holdings % Profit
contributionHoldings % Profit
contributionJEP Mining LLC 50 Not material 50 Not material
The profit or loss contribution from the above joint venture or associate is not material to the Company’s net loss or income for the period.
Further information can be obtained from the attached interim financial statements, accompanying notes and Directors’ Report.

Coronado Global Resources Inc. 4
Directors’ ReportFor the half-year ended 30 June 2020
The following discussion and analysis of our financial condition and results of operations should be read in conjunction with our financial statements and the related notes to those statements included in the Company’s Annual Report on Form 10-K filed with the SEC and ASX on 24 February 2020.
The Directors of Coronado Global Resources Inc. present the operating and financial review of the consolidated entity for the half year ended 30 June 2020. The information in this review provides information to assist readers in assessing the operations, financial position and business strategies of Coronado.
The principal activity of Coronado during the period was the development and operation of premium quality metallurgical coal mines in Queensland, Australia (Curragh) and in Pennsylvania, Virginia and West Virginia in the United States of America (Buchanan, Logan and Greenbrier).
In the opinion of the Directors, there were no significant changes in the state of affairs of the Company that occurred during the financial period ended 30 June 2020 that have not been noted in this report.
1. Operational and Financial ReviewSafety
– On 12 January 2020, the operations at the Curragh mine were suspended when a contractor was fatally injured during a tyre change activity in the main workshop on site. Operations at Curragh resumed in a phased approach from 17 January 2020 with restrictions on tyre and wheel rim fitting activities. All workers participated in return to work safety sessions and comprehensive review of mine procedures, with particular attention to tyre handling, was performed. Resumption of full mining activities occurred from 14 February 2020 as permitted by the Queensland Mines Inspectorate.
– In Australia, the 12-month rolling average Total Recordable Injury Frequency Rate (TRIFR) was 7.81 and for the US the rolling 12-month average Total Reportable Incident Rate (TRIR) was 1.41. Reportable rates in both jurisdictions were below the relevant industry benchmarks1.
– The safety and wellbeing of our workforce remains our highest priority and we continue to proactively manage the potential threat of COVID-19 at our mines and offices. The Company formed a COVID-19 taskforce spanning its Australian and U.S. operations and enacted stringent preventative measures to ensure the safety and well-being of employees and contractors during the pandemic. These procedures include increased screenings of employees as they arrive at the workplace as well as strict adherence to hygiene and social distancing guidelines while at work.
Financial performance
– Reported Net income decreased by $337.5 million to a Net loss for HY20 of $123.2 million
– Adjusted EBITDA2 of $34.9 million, down 91.4% compared to HY19
– Group mining cost of $57.3 per tonne, $5.9 per tonne, or 11.5%, higher than HY19 driven by lower production. Lag effects from the January shutdown and the implementation of COVID-19 mine safety practices impacted production. Rescheduled drill and blast activity was affected by wet weather, causing delays to overburden removal and dragline operations. These issues were resolved in June.
– Revenue of $713.7 million, down $520.7 million, or 42.2%, compared to HY19 driven by lower sales volume and lower average realised met coal pricing due to softer market conditions and falling index pricing.
– At 30 June 2020, a non-cash impairment charge of $63.1 million was recorded in relation to the carrying value of the Greenbrier mining asset. The impairment was driven primarily by management’s review of market conditions, customer demand and current met coal pricing.
– Net debt of $404.9 million comprised of drawn debt of $441.0 million and cash and cash equivalents (excluding restricted cash) of $36.1 million.
– Total capital expenditure of $61.9 million for HY20.
1 TRIFR is the number of fatalities, lost time injuries and other injuries requiring medical treatment per million hours worked on a rolling 12-month basis. TRIR is the number of injuries that require medical treatment as defined by MSHA (Mine Safety and Health Administration) per 200,000 hours worked on a calendar 12-month basis.
2 All references to “EBITDA” in this Directors’ Report means EBITDA adjusted for non-recurring items

Coronado Global Resources Inc. 5
– The Company has implemented strategic initiatives to strengthen the balance sheet, including deferring Curragh Mine expansion plans, reducing operating costs and reducing FY20 capital expenditure by 40%.
Operational performance
– Coal production during HY20 was impacted by the temporary suspension of mining operations at Curragh due to the fatality in January 2020, the temporary idling of the U.S. Operations in April and May 2020 in response to the global impacts of COVID-19 on demand for metallurgical coal, and higher than expected wet weather events in Queensland that impacted mine sequencing and coal production at the Curragh mine.
– ROM production of 11.9Mt was down 28.7% compared to HY19
– Saleable production of 8.0Mt was down 23.1% compared to HY19
– Sales volume of 8.3Mt was down 20.2% compared to HY19 driven by the lower production profile.
– Group realised metallurgical coal pricing of $97.3 per tonne was down 29.2% compared to HY19 due to softer market conditions and failing index prices.
Corporate
– In May 2020, in response to the uncertainty caused by the global COVID-19 pandemic, and as a precautionary measure, the Company concluded an agreement with lenders of the Syndicated Facility Agreement (SFA) to waive the compliance with financial covenants until February 2021. Notwithstanding this agreement, the Company was in compliance with its covenant limits as at 30 June 2020.
– In response to the global impacts of COVID-19 on the demand for steel and the resulting impact on the price and demand for metallurgical coal, the Company has taken steps to safeguard its operations, strengthen its balance sheet and increase liquidity by reducing capital expenditures and managing operating costs in a disciplined manner.
2. Review Financial Performance$US HY20 HY19 Variance %Saleable production (Mt) 8.0 10.4 (23.1%)Sales volumes (Mt) 8.3 10.4 (20.2%)Revenue ($m) 713.7 1,234.3 (42.2%)Metallurgical coal sales % 79.0 79.5 (0.6%)Thermal coal sales % 21.0 20.5 2.4%Operating costs ($m) 665.1 811.2 (18.0%)Mining costs ($m) 472.4 533.7 (11.5%)Operating costs per tonne sold ($) 64.0 78.1 (18.1%)Mining costs per tonne sold ($) 57.3 51.4 11.5%Net (loss) Income ($m) (123.2) 214.3 (157.5%)Adjusted EBITDA ($m) 34.9 405.4 (91.4%)
Net income decreased by $337.5 million from $214.3 million in HY19, to a net loss of $123.2 million for HY20. This decrease reflected lower EBITDA and impairment charges of $63.1 million, partially offset by an income tax benefit of $20.4 million in HY20
Coronado’s HY20 EBITDA of $34.9 million, 91.4% lower than HY19. This decrease was driven by a reduction in coal sales revenues, partially compensated by lower operating costs.
Total Group Revenue for the six-month period was $713.7 million, $520.7 million, or 42.2% lower compared to HY19. This decrease was driven by lower coal sales volumes and a lower average realized Met coal price for the six months to June 30, 2020, compared to the same period in 2019.
Coal sales volumes were down 2.0 Mt, due to reduced production stemming from the temporary suspension of mining activities at the Curragh mine following the January safety incident and the temporary suspension of the U.S. operations in April and May in response to the COVID-19 pandemic. Furthermore, the Company was impacted by import restrictions into China, which resulted in the temporary suspension of sales from our U.S. Operations to China during the second quarter.
Average realized Met coal pricing of $97.3 per tonne sold was $40.2 per tonne sold lower compared to HY19. This was reflective of difficult market conditions affected by weak customer demand and restrictions caused by the global pandemic.
Group mining costs (FOR) were $61.3 million lower compared to HY19, however mining cost per tonne of $57.3 per tonne were 11.5% higher period on period. Higher costs per tonne were driven by the lower production levels.

Coronado Global Resources Inc. 6
Total operating costs (FOB) were $665.1 million, down 18.0% compared to HY19 due to lower royalties and Stanwell rebate (lower realised coal pricing), lower freight expenses (due to lower sales volume) and the benefit of a favourable exchange rate conversion of our A$ denominated Australian Operations.
Reconciliation of Adjusted EBITDA (Non-GAAP Financial Measure)
$US HY20 HY19Net (loss) Income ($m) (123.2) 214.3Add: Depreciation, depletion and amortisation ($m) 86.8 85.3Add: Net interest expense ($m) 24.3 17.3Add: Other FX (gain) losses ($m) 4.2 (0.6)Add: Income tax expense ($m) (20.3) 89.0Add: Impairment of assets 63.1 0.0Adjusted EBITDA ($m) 34.9 405.4
3. Summary of Financial PositionCash Flow ($ Million) HY20 HY19 VarNet cash from Operating Activities (7.6) 301.2 (308.8)Cash outflow for Investing Activities (61.9) (67.3) 5.4Financing Cash Flows 78.3 (312.1) 390.4Net change in cash and cash equivalents 8.8 (78.2) 87.0Effect of exchange rate changes 1.0 (0.4) 1.4Cash at beginning of period 26.6 124.9 (98.3)Closing Cash Balance 36.3 46.3 (10.0)
Net cash used in operating activities was $7.6 million for HY20, and cash provided by operating activities was $301.2 million for the six months ended HY19. The decrease in cash from operating activities was primarily due to the decline in revenues in the period partially offset by lower operating costs and capital expenditure.
Net cash used in investing activities was $61.9 million for HY20, compared to $67.4 million for HY19. Capital expenditure for HY20 was $61.9 million, of which $18.8 million related to the Australian Operations, $41.9 million related to the U.S. Operations and the remaining $1.2 million for corporate. Included in the capital expenditure for the U.S. Operations was an acquisition of new reserves of $6.0 million.
As a result of weak market conditions and the uncertainty surrounding the length and severity of the COVID-19 pandemic, the Company is focused on implementing additional strategic and financial initiatives to ensure there is sufficient available liquidity to meet our obligations. The business retains operating and cost flexibility, and such strategic initiatives may include further right-sizing of production at the US Operations for market conditions, deferring development capex, reducing stay-in-business capex and curtailing non-essential operating costs. In addition, the Company may pursue other initiatives to improve cash flow, such as the potential for non-core asset sales or other funding measures.
Net cash provided by financing activities was $78.3 million for HY20, compared to $312.1 million of net cash used in financing activities during HY19. Included in the net cash provided in financing activities for HY20, were proceeds from borrowings of $145.0 million, repayment of borrowings of $34.0 million, and $24.2 million for dividends paid to the shareholders of the Company.
Uses of cash from financing activities during HY19 included $299.7 million for distributions paid to the shareholders of the Company and payments of contingent royalty consideration under the Value Share Mechanism of $12.7 million.
4. Production and DevelopmentMeasures HY20 HY19 % Change ROM Production Mt 11.9 16.7 (28.7%)Australia Mt 6.7 8.9 (24.7%)United States Mt 5.2 7.8 (33.3%)
Saleable Production Mt 8.0 10.4 (23.1%)Australia Mt 5.4 6.3 (14.3%)United States Mt 2.6 4.1 (36.6%)% Metallurgical coal % 78.7 84.9 (7.3%)

Coronado Global Resources Inc. 7
ROM production for HY20 decreased by 28.7% to 11.9 Mt compared to HY19. The decrease was largely driven by the idling of the U.S. Operations for two months in response to COVID-19, lagging effects of the safety incident in January 2020 and other operational issues impacting productivity at Curragh Mine. Greenbrier mine remained idled as at 30 June 2020.
Consistent with ROM, Saleable production for HY20 of 8.0Mt was down 23.1% compared to HY19.
5. Segment PerformanceAustralia
$US HY20 HY19 Variance %Sales volumes (Mt) 5.6 6.4 (12.6%)Total revenues ($m) 473.6 794.2 (40.4%)Coal revenues ($m) 458.5 775.9 (40.9%)Average realised price per tonne sold ($) 82.1 121.5 (32.4%)Metallurgical sales volumes (Mt) 3.9 4.8 (18.6%)Metallurgical coal revenues ($m) 407.8 728.0 (44.0%)Average realised metallurgical price per tonne sold ($) 104.8 152.3 (31.2%)Mining costs ($m) 298.8 272.2 9.8%Mining costs per tonne sold ($) 53.9 42.6 26.5%Operating costs ($m) 466.6 522.2 (10.6%)Operating costs per tonne sold ($) 83.6 81.8 2.2%Segment Adjusted EBITDA ($m) 6.3 271.7 (97.7%)
Coal revenues decreased by $317.5 million (40.9%) to $458.5 million for the HY20 compared to $775.9 million for HY19. This was largely driven by a decrease in average realized met coal price by $47.5 per tonne sold and a decrease in sales volumes of 0.8Mt. The decrease in sales volumes is a result of reduced production stemming from the temporary suspension of operations at the Curragh Mine following January’s safety incident, adverse weather impacts, weaker rail performance, mine sequencing issues and the impact of COVID-19 pandemic affecting benchmark prices.
Operating costs decreased by $55.6 million (10.6%) to $466.6 million for HY20 compared to HY19 driven by lower royalties and Stanwell rebate (mainly due to lower realized coal pricing) lower freight expenses resulting from a decrease in sales volumes and the benefit of a favourable average foreign exchange rate. The effect of foreign exchange on translation of the A$ denominated Australian Operations for the six months ended June 30, 2020 was 0.66 (A$/US$) compared to 0.71 for the HY20. Mining costs of $53.9 per tonne sold was 26.5% higher compared to HY19, impacted by lower sales volumes due to lower production in the first quarter.
Adjusted EBITDA for the HY20 was $6.3 million, a decrease of $265.4 million (97.7%) compared to HY19. Lower coal revenues partly mitigated by lower operating costs contributed to the lower Adjusted EBITDA result.
United States
$US HY20 HY19 Variance %Sales volumes (Mt) 2.8 4.0 (31.0%)Total revenues ($m) 240.1 440.2 (45.4%)Coal revenues ($m) 236.3 436.5 (45.9%)Average realised price per tonne sold ($) 85.6 109.2 (21.6%)Metallurgical sales volumes (Mt) 2.7 3.5 (22.3%)Metallurgical coal revenues ($m) 234.2 407.5 (42.5%)Average realised metallurgical price per tonne sold ($) 86.6 117.0 (26.0%)Mining costs ($m) 173.5 261.5 (33.6%)Mining costs per tonne sold ($) 64.3 65.4 (1.7%)Operating costs ($m) 198.5 289.0 (31.3%)Operating costs per tonne sold ($) 71.9 72.3 (0.5%)Segment Adjusted EBITDA ($m) 41.7 151.6 (72.5%)
Coal revenues decreased by $200.2 million (45.9%) to $236.3 million for the HY20 compared to $436.5 million for HY19. This decrease was driven by lower average realized met coal pricing of $86.6 per tonne sold for HY20, compared to $117.0 per tonne sold for the same period in 2019, which was a result of softer market conditions, a decline in the benchmark coking coal market and lower sales volumes of 2.8 Mt as compared to 4.0 Mt for the HY19. Lower sales volumes were largely attributable to the temporary idling of U.S. mines in April and May in response to COVID-19, in addition to import restrictions into China which resulted in the lower export sales into China in the second quarter of 2020.

Coronado Global Resources Inc. 8
Operating costs decreased by $90.5 million (31.3%) for the HY20 compared to HY19. The decrease was due to lower mining costs of $173.5 million, a reduction of 33.6% compared to the same period in 2019, as the U.S. Operations were idled in April and May of 2020 in response to the COVID-19 pandemic. The lower operating costs are also a result of stringent cost control measures implemented in the first quarter of 2020 that resulted in slightly lower mining costs of $64.3 per tonne sold for the HY20, compared to $65.4 per tonne sold for the HY19, despite a decline in sales volumes of 1.2 Mt.
Adjusted EBITDA decreased by $109.9 million (72.5%) for the HY20 compared to HY19. This decrease was primarily driven by softer market conditions resulting in a lower average realized met coal price per tonne sold and lower sales volumes. This resulted in a decrease in coal revenues of $200.2 million which was partially offset by a decrease in operating costs of $90.5 million.
6. Liquidity and Capital ManagementOur objective in managing risks related to liquidity is to ensure that the Company has sufficient liquid assets and funding to satisfy any anticipated and unanticipated financial commitments when they are due.
Our principal sources of funds are cash flows from operations, cash and cash equivalents and the $550 million Syndicated Facility Agreement.
In response to the emerging risks associated with impacts of the COVID-19 pandemic on the demand and pricing for metallurgical coal, the Company concluded an agreement with its lenders under the SFA to waive compliance with certain financial covenants for the period from May 25, 2020 to February 28, 2021. This waiver was requested to enable the Company to adapt its operations to the impacts of the pandemic as well as to provide additional flexibility to work through this period of significant uncertainty, lower demand and pricing for metallurgical coal. This was a prudent measure undertaken by the Company and notwithstanding this agreement, the Company was in full compliance with its financial covenant limits as at 30 June 2020.
As part of the conditions of the waiver, the Company has agreed to certain obligations and restrictions during the period of the waiver. These include additional reporting undertakings and additional restrictions in relation to divestments and new indebtedness. We have also agreed to a liquidity buffer of $50 million and a new review event during the waiver period that arises if a utilization notice is provided which would cause the available balance under the Facility A and Facility C, in aggregate, to be less than US$50 million. If such a utilization notice is provided, the review event will commence and the Company will be required to negotiate with the Lenders on the terms on which they may consent to a drawdown of the $50 million liquidity buffer. If agreement cannot be reached on the terms under which the liquidity buffer may be drawn, the Lenders may cancel the whole or any part of the facilities and require repayment.
Based on our outlook for the next 12 months, which is subject to continued changing demand from our customers, volatility in coal prices and the uncertainty of impacts from the COVID-19 pandemic on the global economy, we believe expected cash generated from operations together with available borrowing facilities and other strategic and financial initiatives, will be sufficient to meet the needs of our existing operations and service our debt obligations. We are also continuing to actively engage with our lenders in relation to an extension of the waiver beyond February 2021. Whilst there can be no assurances that the waivers will be extended beyond February 2021, the Board and management are actively pursuing other financial levers, including the divestment of non-core assets, further cost reduction initiatives and other forms of financing to mitigate any potential risks associated with the waiver conditions.
Liquidity as of 30 June 2020 and 31 December 2019 was as follows:
($US million) 30 June 2020 31 December 2019 Variance %
Cash, excluding restricted cash 36.1 26.3 37.3%Availability under Revolving Syndicate Facility Agreement 109.0 220.0 (50.5%)Total 145.1 246.3 (41.1%)
As of 30 June 2020, available liquidity was $145.1 million comprising cash and cash equivalents (excluding restricted cash) of $36.1 million and $109.0 million of available funds from borrowing facilities under the SFA, $50 million of which is subject to a liquidity buffer agreed with the Lenders. This compares to available liquidity of $246.3 million at 31 December 2019, comprising cash and cash equivalents (excluding restricted cash) of $26.3 million and $220.0 million of available funds from borrowing facilities.
In light of the COVID-19 pandemic, the Company has taken several steps to further strengthen its financial position, and maintain financial flexibility, including, reviewing operating and corporate expenditure, reducing capital expenditure and ensuring there is sufficient available liquidity under the SFA. As stated above, we are actively pursuing a number of strategic initiatives to increase liquidity, including further covenant waivers, to manage operations through this period of uncertainty and volatility.

Coronado Global Resources Inc. 9
7. OutlookOperations
The COVID-19 pandemic has created significant uncertainty and volatility which has resulted in a significant slowing of major global economies. As governments implement response measures, a number of sectors, including steel and metallurgical coal, have been materially affected. As the global demand for steel reduced rapidly, so too did the demand for, and price, of metallurgical coal.
In response to the pandemic, the Company implemented a range of initiatives to protect our people and operations from the physical impacts of the pandemic. These included increasing sanitation and hygiene measures at all the mines and offices, and idling the US mines for a period of eight weeks. The Company also implemented a range of initiatives to preserve cash and improve liquidity given the uncertainty of the timing of a potential recovery and the uncertainty of the extent of the deterioration in metallurgical coal prices. Those initiatives included a 40% reduction in capital expenditure for FY20, deferral of the Curragh mine expansion plans and cost optimisation measures across all our operations. The Company also reached agreement with its Lenders to waive compliance with certain financial covenants under the SFA until 28 February 2021 to provide the Company flexibility to manage its financial position through this period of uncertainty.
The Company’s key focus for the balance of 2020 will be to continue to meet the demands of our customers as well as to maintain our focus on capital preservation. A number of key initiatives have been implemented to improve the overall liquidity of the Company which includes the sale of non-core assets and factoring of certain receivables. Further to this, the Company is performing a comprehensive review of the cost structure of each operation to ensure margins are protected in the current environment of depressed prices. Our overall objective is to position Coronado to weather the current market conditions while ensuring the business is positioned to take advantage of a recovery in the metallurgical coal market, as and when that recovery inevitably occurs.
Following a challenging first half of 2020, the Australian operations completed a comprehensive review of the mining schedule to position the Curragh operation to achieve targets. Further to this, a key focus will be on how to increase production to recover the lower production during the first half of 2020. Curragh sales have benefitted from being a strategic ‘base load’ producer of metallurgical coal in Asia Pacific.
During the second half of 2020, the US operations will produce saleable coal at a lower capacity to match market demand and reduce inventory levels. Scaling of production will see the US segment successfully fulfill its annually priced domestic contracts for the remainder of 2020 and 2021 at the current market prices. Accordingly, Buchanan will operate the longwall with fewer production shifts and less development units. However, production can be quickly increased to meet improvements in profitable market demand. The next longwall move is currently scheduled for late September or early October 2020 with no anticipated problems. Logan’s production schedule will continue to be scaled back to meet demand under our domestic contracts. Logan is also well positioned to quickly increase production to meet any improvements in profitable market demand. Greenbrier will likely remain idle in the second half 2020 depending on market conditions. Management will continue to control costs and closely monitor and implement opportunities to further reduce cost and capital expenditures.
Coal Market Outlook
During the June quarter the Platts PLV Coking Coal price retraced from $141.0 per tonne to circa $116.0 per tonne at the end of June. The index price has since fallen marginally lower in July as demand for metallurgical coal continues to be impacted by reduced steel production due to COVID-19.
Global steel producers have rationalized production due to a decline in steel demand from the construction and automotive sectors; a direct result of substantially lower consumer demand in a COVID-19 environment. We are seeing some early signs of improvement in these sectors in some major markets, but it is too early to determine whether this demand can be sustained.
Steel demand in China has been supported primarily by large infrastructure investment, with signs of improvement in discretionary steel demand (e.g. automotive) and property. Steel demand for the balance of 2020 is widely forecast to remain strong, underpinned by the investment in infrastructure.
Indian steel demand is improving, but from a very weak position, and GDP growth in 2020 is expected to be reduced. Steel demand for Indian mills is currently being supported by reversal of steel trade flow, becoming a net steel exporter to China. This has been an important factor in some of the early resumption of procurement activity for metallurgical coal. Any sudden change in this flow could have an impact on metallurgical coal demand in the short term.
Japanese and South Korean mills have been considering restocking activities during Q3 2020 in anticipation of improved demand from the automotive sector.

Coronado Global Resources Inc. 10
Given the overall importance of government backed economic stimulus post COVID-19, a rapid recovery in steel demand, and a return of production is anticipated, however the timing of the recovery remains uncertain.
Signed in accordance with a resolution of the Directors:
Bill Koeck
ChairmanDated at Brisbane this 10th day of August 2020

Coronado Global Resources Inc. 11
Interim Financial Statements30 June 2020

A member firm of Ernst & Young Global Limited
Ernst & Young111 Eagle StreetBrisbane QLD 4000 AustraliaGPO Box 7878 Brisbane QLD 4001
Tel: +61 7 3011 3333Fax: +61 7 3011 3100ey.com/au
To the Stockholders and Board of Directors of Coronado Global Resources Inc.
Results of Review of Interim Financial StatementsWe have reviewed the accompanying condensed consolidated balance sheet of Coronado GlobalResources Inc. (the Company) as of June 30, 2020, the related condensed consolidated statements ofoperation and comprehensive income, stockholders’ equity and cash flows for the three-month andsix-month periods ended June 30, 2020 and the related notes (collectively referred to as the“condensed consolidated interim financial statements”). Based on our review, we are not aware of anymaterial modifications that should be made to the condensed consolidated interim financialstatements for them to be in conformity with U.S. generally accepted accounting principles.
The condensed consolidated financial information of the Company for the three-month and six-monthperiods ended June 30, 2019, were reviewed by other auditors whose report dated August 5, 2019stated that based on their review they were not aware of any material modifications that should bemade to those statements for them to be in conformity with U.S. generally accepted accountingprinciples. The consolidated balance sheet of the Company as of December 31, 2019, the relatedconsolidated statements of operations and comprehensive income, stockholders' equity and cashflows for the year then ended, and the related notes (not presented herein) were audited by otherauditors whose report dated February 24, 2020 expressed an unqualified opinion on thosestatements.
Basis for Review ResultsThese financial statements are the responsibility of the Company's management. We are a publicaccounting firm registered with the PCAOB and are required to be independent with respect to theCompany in accordance with the U.S. federal securities laws and the applicable rules and regulationsof the SEC and the PCAOB. We conducted our review in accordance with the standards of the PCAOB.A review of interim financial statements consists principally of applying analytical procedures andmaking inquiries of persons responsible for financial and accounting matters. It is substantially less inscope than an audit conducted in accordance with the standards of the PCAOB, the objective of whichis the expression of an opinion regarding the financial statements taken as a whole. Accordingly, wedo not express such an opinion.
Ernst & YoungBrisbane, AustraliaAugust 10, 2020

Coronado Global Resources Inc. 13
(In US$ thousands, except the share data)
Assets Note
(Unaudited) June 30,
2020December 31,
2019Current assets:
Cash and restricted cash $ 36,324 $ 26,553Trade receivables 6 116,110 133,297Related party trade receivables 6 105,057 86,796Income tax receivable 15,431 897Inventories 7 138,624 162,170Other current assets 46,831 44,109
Total current assets 458,377 453,822Non-current assets:
Property, plant and equipment, net 8 1,532,736 1,632,788Right of use asset – operating leases, net 11 23,313 62,566Goodwill 9 28,008 28,008Intangible assets, net 9 4,318 5,079Deposits and reclamation bonds 12,152 12,227Deferred income tax assets 27,586 2,852Other non-current assets 14,819 17,512
Total assets $ 2,101,309 $ 2,214,854Liabilities and Stockholders’ EquityCurrent liabilities:
Accounts payable $ 36,652 $ 64,392Accrued expenses and other current liabilities 10 251,660 238,788Income tax payable 27,328 29,760Asset retirement obligations 9,955 10,064Contingent royalty consideration 17 — 688Contract obligations 14 35,225 36,935Lease liabilities 11 11,984 29,685Other current financial liabilities 13,268 5,894
Total current liabilities 386,072 416,206Non-current liabilities:
Asset retirement obligations 126,129 121,710Contract obligations 14 186,091 204,877Deferred consideration liability 15 181,400 174,605Interest bearing liabilities 13 441,000 330,000Other financial liabilities 457 1,546Lease liabilities 11 23,678 48,165Contingent royalty consideration 17 — 855Deferred income tax liabilities 59,552 47,973Other non-current liabilities 5,003 976
Total liabilities 1,409,382 1,346,913Common stock $0.01 par value; 1,000,000,000 shares authorized, 96,651,692 shares are issued and outstanding as of June 30, 2020 and December 31, 2019
967 967
Series A Preferred stock $0.01 par value; 100,000,000 shares authorized, 1 Share issued and outstanding as of June 30, 2020 and December 31, 2019
— —
Additional paid-in capital 820,643 820,247Accumulated other comprehensive loss 18 (74,258) (45,206)(Accumulated losses) retained earnings (55,642) 91,712Coronado Global Resources Inc. stockholders’ equity 691,710 867,720Noncontrolling interest 217 221Total stockholders’ equity 691,927 867,941
Total liabilities and stockholders’ equity $ 2,101,309 $ 2,214,854
See accompanying notes to unaudited condensed consolidated financial statements
Condensed Consolidated Balance Sheets

Coronado Global Resources Inc. 14
(in US$ thousands, except the share data)Three Months Ended
June 30,Six Months Ended
June 30,Note 2020 2019 2020 2019
Revenues:Coal revenues 3 $ 286,206 $ 495,385 $ 605,699 $ 919,329Coal revenues from related parties 3, 6 9,000 135,305 89,118 293,158Other revenues 3 9,142 11,767 18,849 21,848
Total revenues 304,348 642,457 713,666 1,234,335Costs and expenses:
Cost of coal revenues (exclusive of items shown separately below) 224,459 264,137 481,345 533,696Depreciation, depletion and amortization 41,547 45,508 86,849 85,279Freight expenses 40,504 52,035 82,886 89,362Stanwell rebate 24,787 45,847 57,415 94,674Other royalties 19,157 49,073 43,455 93,422Selling, general, and administrative expenses 7,158 9,242 13,353 18,311
Total costs and expenses 357,612 465,842 765,303 914,744Operating income (53,264) 176,615 (51,637) 319,591Other income (expenses):
Interest expense, net (12,064) (9,087) (24,318) (17,264)Impairment of assets 4 (63,111) — (63,111) —Other, net 5 (8,537) (2,989) (4,485) 1,042
Total other income (expense), net (83,712) (12,076) (91,914) (16,222)(Loss) income before tax (136,976) 164,539 (143,551) 303,369
Income tax benefit (expense) 12 22,646 (47,033) 20,355 (89,043)Net (loss) income (114,330) 117,506 (123,196) 214,326
Less: Net loss attributable to noncontrolling interest (2) (4) (4) (4)
Net (loss) income attributable to Coronado Global Resources Inc. $ (114,328) $ 117,510 $ (123,192) $ 214,330Other comprehensive income, net of income taxes:Foreign currency translation adjustment 18 39,161 (508) (14,406) (1,066)Net gain (loss) on cash flow hedges, net of tax 18 19,546 894 (14,646) 6,473Total other comprehensive income (loss) 58,707 386 (29,052) 5,407Total comprehensive (loss) income (55,623) 117,892 (152,248) 219,733
Less: Net loss attributable to noncontrolling interest (2) (4) (4) (4)
Total comprehensive (loss) income attributable to Coronado Global Resources Inc. $ (55,621) $ 117,896 $ (152,244) $ 219,737
(Loss) earnings per share of common stockBasic 16 (1.18) 1.22 (1.27) 2.22Diluted 16 (1.18) 1.22 (1.27) 2.22
See accompanying notes to unaudited condensed consolidated financial statements.
Unaudited Condensed Consolidated Statements of Operations and Comprehensive Income

Coronado Global Resources Inc. 15
(In US$ thousands, except the share data)
Common stock Preferred stock Additional Accumulated other (Accumulated Totalpaid in comprehensive losses) Retained Noncontrolling stockholders
Shares Amount Series A Amount capital loss earnings interest equityBalance December 31, 2019 $ 96,651,692 967 1 — 820,247 (45,206) 91,712 221 867,941Net loss — — — — — — (8,863) (2) (8,865)Other comprehensive loss (net of $13,781 tax) — — — — — (87,759) — — (87,759)Total comprehensive loss — — — — — (87,759) (8,863) (2) (96,624)Share-based compensation for equity classified awards — — — — 148 — — — 148Dividends paid — — — — — — (24,163) — (24,163)Balance March 31, 2020 $ 96,651,692 967 1 — 820,395 (132,965) 58,686 219 747,302Net loss — — — — — — (114,328) (2) (114,330)Other comprehensive income (net of $6,534 tax) — — — — — 58,707 — — 58,707Total comprehensive income (loss) — — — — — 58,707 (114,328) (2) (55,623)Share-based compensation for equity classified awards — — — — 248 — — — 248Balance June 30, 2020 $ 96,651,692 967 1 — 820,643 (74,258) (55,642) 217 691,927
Common stock Preferred stock Additional Accumulated other Totalpaid in comprehensive Retained Noncontrolling stockholders
Shares Amount Series A Amount capital loss earnings interest equityBalance December 31, 2018 $ 96,651,692 967 1 — 1,107,948 (49,609) 194,220 282 1,253,808Net income — — — — — — 96,820 — 96,820Other comprehensive income (net of $2,391 tax) — — — — — 5,021 — — 5,021Total comprehensive income — — — — — 5,021 96,820 — 101,841Dividends paid — — — — — — (299,682) — (299,682)Balance March 31, 2019 $ 96,651,692 967 1 — 1,107,948 (44,588) (8,642) 282 1,055,967Net income (loss) — — — — — — 117,510 (4) 117,506Other comprehensive income (net of $383 tax) — — — — — 386 — — 386Total comprehensive income (loss) — — — — — 386 117,510 (4) 117,892Share-based compensation for equity classified awards — — — — 93 — — — 93Balance June 30, 2019 $ 96,651,692 967 1 — 1,108,041 (44,202) 108,868 278 1,173,952
See accompanying notes to unaudited condensed consolidated financial statements.
Unaudited Condensed Consolidated Statements of Stockholders’ Equity

Coronado Global Resources Inc. 16
Unaudited Condensed Consolidated Statements of Cash Flows (In US$ thousands)
Six Months EndedJune 30,
2020 2019Cash flows from operating activities:Net (loss) income $ (123,196) $ 214,326Adjustments to reconcile net income to cash and restricted cash provided by operating activities:
Depreciation, depletion and amortization 86,849 85,404Impairment of assets 63,111 —Amortization of right of use asset - operating leases 9,387 10,394Amortization of deferred financing costs 2,751 2,060Non-cash interest expense 10,266 9,711Amortization of contract obligations (14,794) (17,550)Loss on disposal of property, plant and equipment 208 39Decrease in contingent royalty consideration (1,543) (7,143)Gain on operating lease derecognition (1,180) —Equity-based compensation expense 396 93Deferred income taxes (6,302) 17,026Reclamation of asset retirement obligations (1,574) (2,552)Change in estimate of asset retirement obligation — (125)
Changes in operating assets and liabilities:Accounts receivable - including related party receivables (6,223) (23,105)Inventories 21,133 (34,562)Other current assets 5,425 (2,287)Accounts payable (27,984) (1,832)Accrued expenses and other current liabilities 3,938 15,585Operating lease liabilities (10,374) (11,073)Change in other liabilities (17,930) 46,807
Net cash (used in) provided by operating activities (7,636) 301,216Cash flows from investing activities:Capital expenditures (61,927) (66,430)Purchase of deposits and reclamation bonds (51) (906)Redemption of deposits and reclamation bonds 125 —
Net cash used in investing activities (61,853) (67,336)Cash flows from financing activities:Proceeds from interest bearing liabilities and other financial liabilities, net of debt discount 145,000 109,008Debt issuance costs and other financing costs (2,423) —Principal payments on interest bearing liabilities and other financial liabilities (39,515) (108,073)Principal payments on finance and capital lease obligations (642) (686)Payment of contingent purchase consideration — (12,712)Dividends paid (24,162) (299,682)
Net cash provided by (used in) financing activities 78,258 (312,145)Net decrease in cash and restricted cash 8,769 (78,265)Effect of exchange rate changes on cash and restricted cash 1,002 (365)Cash and restricted cash at beginning of period 26,553 124,881Cash and restricted cash at end of period $ 36,324 $ 46,251Supplemental disclosure of cash flow information:
Cash payments for interest $ 10,981 $ 1,148Cash paid for taxes $ 2,029 $ 35,873
See accompanying notes to unaudited condensed consolidated financial statements.

Notes to Consolidated Financial Statements
Coronado Global Resources Inc. 17
1. Description of Business, Basis of Presentation
(a) Description of the Business
Coronado Global Resources Inc. (together with its subsidiaries, the “Company” or “Coronado”) is a global producer, marketer, and exporter of a full range of metallurgical coals, an essential element in the production of steel. The Company has a portfolio of operating mines and development projects in Queensland, Australia and in the states of Pennsylvania, Virginia and West Virginia in the USA.
(b) Basis of Presentation
The interim unaudited condensed consolidated financial statements have been prepared in accordance with the requirements of the U.S. Generally Accepted Accounting Principles, or U.S. GAAP, and with the instructions to Form 10-Q and Article 10 of Regulation S-X related to interim financial reporting issued by the Securities and Exchange Commission, or the SEC. Accordingly, they do not include all of the information and footnotes required by U.S. GAAP for complete financial statements and should be read in conjunction with the audited consolidated financial statements and notes thereto included in the Company’s Annual Report on Form 10-K filed with the SEC and the Australian Securities Exchange, or the ASX, on February 24, 2020.
The interim unaudited condensed consolidated financial statements are presented in U.S. dollars, unless otherwise stated. They include the accounts of Coronado Global Resources Inc. and its affiliates. References to “US$” or “USD” are references to U.S. dollars. References to “A$” or “AUD” are references to Australian dollars, the lawful currency of the Commonwealth of Australia. The Company, or Coronado, are used interchangeably to refer to Coronado Global Resources Inc. and its subsidiaries, or to Coronado Global Resources Inc., as appropriate to the context. Interests in subsidiaries controlled by the Company are consolidated with any outside stockholder interests reflected as noncontrolling interests. All intercompany balances and transactions have been eliminated in consolidation.
In the opinion of management, these interim financial statements reflect all normal, recurring adjustments necessary for the fair presentation of the Company’s financial position, results of operations, comprehensive income, cash flows and changes in equity for the periods presented. Balance sheet information presented herein as of December 31, 2019 has been derived from the Company’s audited consolidated balance sheet at that date. The Company’s results of operations for the three and six months ended June 30, 2020 are not necessarily indicative of the results that may be expected for future quarters or for the year ending December 31, 2020.
COVID-19
The COVID-19 global pandemic has continued to result in a challenging working environment which has significantly impacted the demand and price for metallurgical coal. Authorities in many countries around the world have implemented numerous and varying measures to reduce the spread and limit the impact of COVID-19, including travel bans and restrictions, quarantines, curfews, stay-at-home orders, business shutdowns and closures. Many countries have also commenced implementing multi-stage policies with the goal of re-opening markets and boosting economic activity. These measures have impacted and will continue to impact our mining operations, our customers, employees, suppliers and other third parties with whom we do business. The U.S. and Australia, where our mining operations are located, are in varying stages of restrictions and re-opening in response to COVID-19. There is considerable uncertainty regarding how current and future health and safety measures implemented in response to the pandemic will impact our business, including whether they will result in further changes in demand for metallurgical coal, increases in operating costs or impacts to our supply chain, and whether measures will result in port closures or border restrictions, each or all of which can impact our ability to produce and sell our coal.
The safety and wellbeing of our workforce remains our highest priority and we continue to manage the potential threat of COVID-19 at our mines and offices. The Company formed a COVID-19 taskforce spanning its Australian and U.S. operations and proactively enacted stringent preventative measures to ensure the safety and well-being of employees and contractors during the pandemic. These procedures include increased screenings of employees as they arrive at the workplace as well as strict adherence to hygiene and social distancing guidelines while at work.
Our U.S. Operations were idled in April and May 2020 due to the COVID-19 induced economic downturn and decline in demand from customers in Europe, Brazil and the U.S. While the mines were idled, the Company continued to make shipments to its customers from existing inventories which allowed the Company to meet all customer commitments. On June 1, 2020, the Company resumed operations at the Buchanan and Logan mines. Whilst production at these mines has been reduced in response to lower temporary demand, both mines are operationally well positioned to increase production quickly in the event demand increases rapidly. The Greenbrier mine remains idle and the Company will continue to monitor market developments to evaluate the duration for which the mine will remain idle. Subsequent to June 30, 2020 we have had a small number of our workforce at our U.S Operations who tested positive for the virus. We have taken all necessary steps to isolate the affected workers and protect the remaining workforce. To date these efforts have not adversely affected our production.
The global economic slowdown resulting from the effects of COVID-19 has sharply reduced the demand for steel in all markets except for China, where steel production remained elevated during the second quarter of 2020. In Australia, our sales profile has adjusted accordingly, with an increase in deliveries to the Chinese market in the quarter. Overall, the supply and demand constraints in respect of the global impacts of COVID-19 on our Australian Operations has been limited due to the unique position of the Curragh mine as a strategic supplier of ‘base load’ metallurgical coal for coke blends. While global demand remains uncertain, there are promising signs of recovery in Asia Pacific demand.
Notes to Unaudited Condensed Consolidated Financial Statements

Notes to Consolidated Financial Statements
Coronado Global Resources Inc. 18
In response to the global impacts of COVID-19 on the demand for steel and the resulting impact on the price and demand for metallurgical coal, the Company has taken steps to safeguard its operations, strengthen its balance sheet and increase liquidity by reducing capital expenditures and managing operating costs in a disciplined manner. As of June 30, 2020, the Company reduced its net debt by $31.8 million to $404.9 million since March 31, 2020, and had $109.0 million undrawn and available under the Syndicated Facility Agreement, or SFA, subject to a liquidity buffer of $50.0 million, and cash balances (excluding restricted cash) of $36.1 million. See Note 13 “Interest Bearing Liabilities”.
As the COVID-19 pandemic continues to evolve, the Company cannot currently predict the extent of this pandemic, which could have a material adverse impact to its business, results of operations, financial condition and ability to comply with financial covenants under the SFA.
2. Summary of Significant Accounting Policies
Please see Note 2 “Summary of Significant Accounting Policies” contained in the audited consolidated financial statements for the year ended December 31, 2019 included in Coronado Global Resources Inc.’s Annual Report on Form 10-K filed with the SEC and ASX on February 24, 2020.
(a) Newly Adopted Accounting Standards
Financial Instruments - Credit Losses. In June 2016, the FASB issued ASU 2016-13 related to the measurement of credit losses on financial instruments. The pronouncement replaces the incurred loss methodology to record credit losses with a methodology that reflects the expected credit losses for financial assets not accounted for at fair value with gains and losses recognized through net income.
On January 1, 2020, the Company adopted ASU 2016-13. The cumulative-effect adjustment upon adoption was not material to the Company’s results of operations and its cash flows. Changes to the Company’s accounting policies as a result of adoption are discussed below.
The Company assesses on a forward-looking basis the expected credit loss associated with its financial assets carried at amortized cost. The amount of expected credit losses is updated at each reporting date to reflect changes in credit risk since initial recognition of the respective financial instrument. The Company recognizes the lifetime expected credit losses for financial assets carried at amortized cost. The expected credit losses on these financial assets are estimated based on the Company’s historic credit loss experience, adjusted for factors that are specific to the financial asset, general economic conditions, financial asset type, term and an assessment of both the current as well as forecast conditions at the reporting date.
Fair Value Measurement. In August 2018, the FASB issued ASU 2018-13, which amended the fair value measurement guidance by removing and modifying certain disclosure requirements, while also adding new disclosure requirements.
On January 1, 2020, the Company adopted ASU 2018-13. The amendments on changes in unrealized gains and losses, the range and weighted average of significant unobservable inputs used to develop Level 3 fair value measurements and the narrative description of measurement uncertainty were applied prospectively for only the most recent interim period presented. All other amendments were applied retrospectively to all periods presented. The adoption of ASU 2018-13 did not have a material impact on the Company’s unaudited condensed consolidated financial statements.
Intangibles – Goodwill and Other: Simplifying the Test for Goodwill Impairment. In January 2018, the FASB issued ASU 2017-04, which eliminates step two from the goodwill impairment test. Under ASU 2017-04, an entity should recognize an impairment charge for the amount by which the carrying amount of a reporting unit exceeds its fair value up to the amount of goodwill allocated to that reporting unit.
On January 1, 2020, the Company adopted ASU 2017-04. Changes to the Company’s accounting policies as a result of adoption are discussed below.
Goodwill is an asset representing the future economic benefits arising from other assets acquired in a business combination that are not individually identified and separately recognized. Goodwill is not amortized but is reviewed for impairment annually or when circumstances or other events indicate that impairment may have occurred.
The Company makes a qualitative assessment of whether it is more likely than not that a reporting unit’s fair value is less than its carrying amount. Circumstances that are considered as part of the qualitative assessment and could trigger a quantitative impairment test include but are not limited to: a significant adverse change in the business climate; a significant adverse legal judgment; adverse cash flow trends; an adverse action or assessment by a government agency; unanticipated competition; and a significant restructuring charge within a reporting unit. If a quantitative assessment is determined to be necessary, the Company compares the fair value of a reporting unit with its carrying amount, including goodwill. If the carrying amount of a reporting unit exceeds its fair value, the Company recognizes an impairment charge for the amount by which the carrying amount exceeds its fair value to the extent of the amount of goodwill allocated to that reporting unit.
The Company defines reporting units at the business unit level. For purposes of testing goodwill for impairment, goodwill has been allocated to the reporting units to the extent it relates to each reporting unit.
(b) Accounting Standards Not Yet Implemented
“Income Taxes - Simplifying the Accounting for Income Taxes” - In December 2019, the FASB issued ASU 2019-12, which is intended to simplify various aspects related to accounting for income taxes. ASU 2019-12 removes certain exceptions to the general principles in Topic 740 and clarifies and amends existing guidance to improve consistent application. ASU 2019-12 will be effective for interim

Notes to Consolidated Financial Statements
Coronado Global Resources Inc. 19
and annual periods beginning after December 15, 2020. The Company is currently evaluating the impact the adoption of ASU 2019-12 will have on its consolidated financial statements.
(c) Reclassification
Certain amounts in the prior period Condensed Consolidated Balance Sheet have been reclassified to conform to the presentation of the current period financial statements. These related to the reclassification of four reportable segments into the current two reportable segments discussed in Note 3 “Segment information”. These reclassifications had no effect on the previously reported net income.
3. Segment Information
The Company has a portfolio of operating mines and development projects in Queensland, Australia and in the states of Pennsylvania, Virginia and West Virginia in the USA. The Company operates four coal mine complexes: Curragh, Buchanan, Logan and Greenbrier. Commencing on January 1, 2020, the Company updated its reportable segments to be the country in which they operate, that is Australia and the United States, in order to align with the manner in which its Chief Operating Decision Maker, or CODM, views the Company’s business for purposes of reviewing performance and allocating resources.
Factors affecting and differentiating the financial performance of each of these two reporting segments generally include coal quality, geology, and coal marketing opportunities, mining and transportation methods and regulatory issues. This is the basis on which internal financial and operational reports are currently prepared and provided to the CODM and reflects how the CODM manages performance and determines the allocation of resources within the Company. The Company believes this method of segment reporting reflects both the way its business segments are currently managed and the way the performance of each segment is evaluated. Comparative disclosures have been restated to a consistent basis.
The CODM uses Adjusted EBITDA as the primary metric to measure each segment’s operating performance. Adjusted EBITDA is not a measure of financial performance in accordance with U.S. GAAP. Investors should be aware that the Company’s presentation of Adjusted EBITDA may not be comparable to similarly titled financial measures used by other companies.
Adjusted EBITDA is defined as earnings before interest, tax, depreciation, depletion and amortization and other foreign exchange losses. Adjusted EBITDA is also adjusted for certain discrete items that management exclude in analyzing each of our segments’ operating performance. “Other and corporate” relates to additional financial information for the corporate function such as accounting, treasury, legal, human resources, compliance, and tax. As such, the corporate function is not determined to be a reportable segment but is discretely disclosed for purposes of reconciliation to the Company’s consolidated financials.
Reportable segment results as of and for the three and six months ended June 30, 2020 and 2019 are presented below:
Australia United States
Other and Corporate Total
($ thousands)Three months ended June 30, 2020
Total revenues 228,410 75,938 — 304,348Adjusted EBITDA (6,804) 3,490 (7,163) (10,477)Net loss (16,933) (74,006) (23,391) (114,330)Total assets 1,043,222 975,045 83,042 2,101,309Capital expenditures (1) 13,535 6,396 578 20,509
Three months ended June 30, 2019Total revenues 412,810 229,647 — 642,457Adjusted EBITDA 151,561 79,642 (8,912) 222,291Net income (loss) 91,024 40,609 (14,127) 117,506Total assets 1,182,652 972,193 63,638 2,218,483Capital expenditures (1) 9,341 27,426 — 36,767
Six Months Ended June 30, 2020Total revenues 473,555 240,111 — 713,666Adjusted EBITDA 6,260 41,740 (13,056) 34,944Net loss (22,900) (64,877) (35,419) (123,196)Total assets 1,043,222 975,045 83,042 2,101,309Capital expenditures (1) 18,804 41,917 1,206 61,927
Six Months Ended June 30, 2019Total revenues 794,182 440,153 — 1,234,335Adjusted EBITDA 271,709 151,611 (17,965) 405,355Net income (loss) 159,758 77,409 (22,841) 214,326Total assets 1,182,652 972,193 63,638 2,218,483Capital expenditures (1) 15,431 50,996 3 66,430

Notes to Consolidated Financial Statements
Coronado Global Resources Inc. 20
(1) Capital expenditures includes financing fees incurred through other financial liabilities for the purchase of certain equipment.
The reconciliation of Adjusted EBITDA to net income attributable to the Company for the three and six months ended June 30, 2020 and 2019 are as follows:
Three months ended Six Months EndedJune 30, June 30,
2020 2019 2020 2019(US$ thousands) (US$ thousands)
Net (loss) income $ (114,330) $ 117,506 $ (123,196) $ 214,326Depreciation, depletion and amortization 41,547 45,508 86,849 85,279Interest expense (net of income) 12,064 9,087 24,318 17,264Other foreign exchange losses (gains) 9,777 3,157 4,217 (557)Income tax (benefit) expense (22,646) 47,033 (20,355) 89,043Impairment of assets 63,111 — 63,111 —
Consolidated adjusted EBITDA $ (10,477) $ 222,291 $ 34,944 $ 405,355
Disaggregation of Revenue
The Company disaggregates the revenue from contracts with customers by major product group for each of the Company’s reportable segments, as the company believes it best depicts the nature, amount, timing and uncertainty of revenues and cash flows. All revenue is recognized at a point in time.
Three months ended June 30, 2020
Australia United States
Other and Corporate Total
($ thousands)Product Groups:Metallurgical coal 194,909 74,839 — 269,748Thermal coal 25,041 417 — 25,458Total coal revenue 219,950 75,256 — 295,206Other(1) 8,460 682 — 9,142Total 228,410 75,938 — 304,348
Three months ended June 30, 2019
Australia United States
Other and Corporate Total
($ thousands)Product Groups:Metallurgical coal 377,016 211,656 — 588,672Thermal coal 26,687 15,331 — 42,018Total coal revenue 403,703 226,987 — 630,690Other(1) 9,107 2,660 — 11,767Total 412,810 229,647 — 642,457
Six months ended June 30, 2020
Australia United States
Other and Corporate Total
($ thousands)Product GroupsMetallurgical coal 407,831 234,198 — 642,029Thermal coal 50,650 2,138 — 52,788Total coal revenue 458,481 236,336 — 694,817Other(1) 15,074 3,775 — 18,849Total 473,555 240,111 — 713,666

Notes to Consolidated Financial Statements
Coronado Global Resources Inc. 21
Six months ended June 30, 2019
Australia United States
Other and Corporate Total
($ thousands)Product GroupsMetallurgical coal 727,964 407,535 — 1,135,499Thermal coal 47,978 29,010 — 76,988Total coal revenue 775,942 436,545 — 1,212,487Other(1) 18,240 3,608 — 21,848Total 794,182 440,153 — 1,234,335
(1) Other revenue for Curragh includes the amortization of the Stanwell non-market coal supply contract obligation liability
4. Impairment of assets
Long-lived assets, such as property, plant, and equipment, and purchased intangible assets subject to amortization, are reviewed for impairment whenever events or changes in circumstances indicate that the carrying amount of an asset may not be recoverable. If circumstances require a long-lived asset or asset group be tested for possible impairment, the Company first compares undiscounted pre-tax cash flows expected to be generated by that asset or asset group to its carrying value. If the carrying value of the long-lived asset or asset group is not recoverable on an undiscounted pre-tax cash flow basis, an impairment is recognized to the extent that the carrying value exceeds its fair value. Fair value is determined through various valuation techniques including discounted cash flow models, quoted market values and third-party independent appraisals, as considered necessary. No impairment losses were recognized for property, plant and equipment or amortizing intangible assets for the years ended December 31, 2019 and 2018.
The following costs are reflected in “Impairment of Assets” in the unaudited Consolidated Statement of Operations and Other Comprehensive income for the three and six months ended June 30, 2020:
Reportable Segment (US$ thousands) United StatesProperty, plant and equipment, net $ 62,481Right of use asset – operating leases, net 10Intangible assets, net 620Total $ 63,111
The Company generally does not view short-term declines in metallurgical coal prices in the markets in which it sells its products as a singular indicator of impairment. However, due to the decline in metallurgical coal prices during the six months ended June 30, 2020, the resulting impact on business conditions from COVID-19 and the idling of the Greenbrier mine for an undetermined period, there were indications that the carrying value of the Greenbrier mining asset, in the U.S., exceeded its fair value. The Company performed an impairment assessment in accordance with the rules of ASC 360 – Property, Plant and Equipment, and determined an impairment charge of $63.1 million reducing the carrying value of Greenbrier’s long-lived assets to approximately $50.0 million as at June 30, 2020. The fair value of the Greenbrier mining asset was derived using Level 3 inputs and was primarily driven by estimates of future cash flows based on a combination of historical results adjusted to reflect the Company’s best estimate of future market and operating conditions, including its current life of mine plan, and reserve multiple valuation. The Company concluded that no indicators of impairment or requisite charges were required at any of the Company’s other mining assets as at June 30, 2020.
5. Expenses
Other, Net
Three months ended Six Months EndedJune 30, June 30,
2020 2019 2020 2019(US$ thousands) (US$ thousands)
Other foreign exchange (losses) gains (9,777) (3,157) (4,217) 557Other income (expenses) 1,240 168 (268) 485Total Other, net $ (8,537) $ (2,989) $ (4,485) $ 1,042

Notes to Consolidated Financial Statements
Coronado Global Resources Inc. 22
6. Trade and related party receivables
The Company extends trade credit to its customers in the ordinary course of business. Trade receivables and related party receivables are recorded initially at fair value and subsequently at amortized cost, less any Expected Credit Losses, or ECL. Trade receivables from provisionally priced sales are carried at fair value to profit or loss.
For trade and related party receivables carried at amortized cost, the Company determines ECL on a forward-looking basis. The amount or ECL is updated at each reporting date to reflect changes in credit risk since initial recognition of the respective financial instrument. The Company recognizes the lifetime ECL. The ECL is estimated based on the Company’s historic credit loss experience, adjusted for factors that are specific to the financial asset, general economic conditions, financial asset type, term and an assessment of both the current as well as forecast conditions at the reporting date, modified for credit enhancements such as letters of credit obtained. To measure ECL, trade and related party receivables have been grouped based on shared credit risk characteristics and the days past due.
The Company considers an event of default has occurred when a financial asset is significantly past due or other factors indicate that the debtor is unlikely to pay amounts owed to the Company. A financial asset is credit impaired when there is evidence that the counterparty is in significant financial difficulty or a breach of contract, such as default or past due event has occurred. The Company writes off a financial asset when there is information indicating there is no realistic prospect of recovery of the asset from the counterparty. The amount of the impairment loss is recognized in the consolidated statement of operations and other comprehensive income within “other, net”. Subsequent recoveries of amounts previously written off are credit against “other, net” in the consolidated statement of operations and other comprehensive income.
(US$ thousands)June 30,
2020
December 31,
2019
Trade receivables - at amortized cost $ 82,303 $ 118,572Trade receivables - at fair value 33,807 14,725
Total trade receivables 116,110 133,297Related party receivables - at amortized cost 105,057 86,796
Total trade and related party receivables $ 221,167 $ 220,093
No provision has been recognized on the ECL on trade and related party receivables as at June 30, 2020. The Company has not recognised any bad debt expense from trading counterparties in the three and six months ended June 30, 2020 and 2019.
Related party receivables - Xcoal
During the three and six months ended June 30, 2020, the Company sold coal to Xcoal Energy and Resources, or Xcoal, an entity associated with Non-Executive director, Mr. Ernie Thrasher. Revenues from Xcoal of $9.0 million and $135.3 million, respectively, are recorded as “Coal revenues from related parties” in the unaudited Condensed Consolidated Statement of Operations and Comprehensive Income for the three months ended June 30, 2020 and 2019. Revenues from Xcoal of $89.1 million and $293.2 million, respectively, are recorded as coal revenues in the unaudited Condensed Consolidated Statement of Operations and Comprehensive Income for the six months ended June 30, 2020 and 2019. During the three and six months ended June 30, 2020, the Company purchased coal from Xcoal totalling $7.9 million and the corresponding payable was offset against trade receivables from Xcoal. The cost of purchasing coal from Xcoal is recorded within “Cost of coal revenues” in the Unaudited Condensed Consolidated Statement of Operations and Comprehensive Income.
At June 30, 2020, amounts due from Xcoal in respect of coal sales were $105.1 million. At December 31, 2019, amounts due from Xcoal in respect of coal sales were $86.8 million.
7. Inventories
(US$ thousands)
June 30,
2020
December 31,
2019
Raw coal $ 25,765 $ 41,127Saleable coal 54,713 63,006
Total coal inventories 80,478 104,133Supplies inventory 58,146 58,037
Total inventories $ 138,624 $ 162,170

Notes to Consolidated Financial Statements
Coronado Global Resources Inc. 23
8. Property, Plant and Equipment
(US$ thousands)
June 30,
2020
December 31,
2019
Land $ 26,747 $ 27,037Buildings and improvements 80,867 80,658Plant, machinery, mining equipment and transportation vehicles 938,537 896,392Mineral rights and reserves 413,755 464,710Office and computer equipment 5,223 3,977Mine development 503,430 497,439Asset retirement obligation asset 76,737 81,520Construction in process 44,100 80,646
2,089,396 2,132,379Less accumulated depreciation, depletion and amortization 556,660 499,591Net property, plant and equipment $ 1,532,736 $ 1,632,788
9. Goodwill and Other Intangible Assets
(a) Acquired Intangible Assets
June 30, 2020
(US$ thousands)
Weighted average amortization
period (years)
Gross carrying amount
Accumulated amortization
Net carrying amount
Intangible assets:Amortizing intangible assets:
Mining permits - Logan 15 1,642 795 847Mining permits - Buchanan 28 4,000 529 3,471
Total intangible assets $ 5,642 $ 1,324 $ 4,318
December 31, 2019
(US$ thousands)
Weighted average amortization
period (years)
Gross carrying amount
Accumulated amortization
Net carrying amount
Intangible assets:Amortizing intangible assets:
Mining permits - Greenbrier 14 $ 1,500 $ 840 $ 660Mining permits - Logan 15 1,642 756 886Mining permits - Buchanan 28 4,000 467 3,533
Total intangible assets $ 7,142 $ 2,063 $ 5,079
Amortization expense is charged using the straight-line method over the useful lives of the respective intangible asset. The aggregate amount of amortization expense for amortizing intangible assets for the three months ended June 30, 2020 and 2019 was $0.1 million and $0.1 million, respectively. The aggregate amount of amortization expense for amortizing intangible assets for the six months ended June 30, 2020 and 2019 was $0.2 million and $0.2 million, respectively.
Mining permit intangible asset relating to Greenbrier with a carrying value of $0.6 million was fully impaired as at June 30, 2020. Refer to Note 4 “Impairment of assets” for further disclosure.
(b) Goodwill
In connection with the Buchanan acquisition on March 31, 2016, the Company recorded goodwill in the amount of $28.0 million. The balance of goodwill as at both June 30, 2020 and December 31, 2019 was $28.0 million.
Notes to Consolidated Financial Statements
Coronado Global Resources Inc. 24
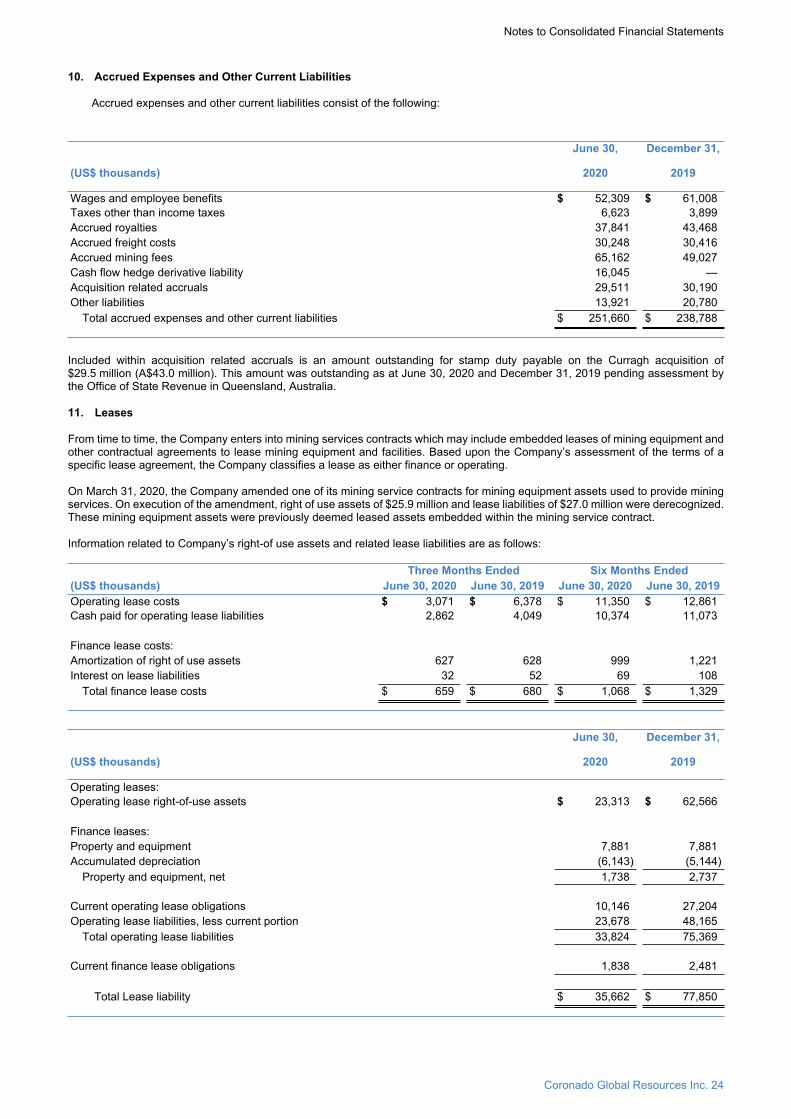
10. Accrued Expenses and Other Current Liabilities
Accrued expenses and other current liabilities consist of the following:
(US$ thousands)
June 30,
2020
December 31,
2019
Wages and employee benefits $ 52,309 $ 61,008Taxes other than income taxes 6,623 3,899Accrued royalties 37,841 43,468Accrued freight costs 30,248 30,416Accrued mining fees 65,162 49,027Cash flow hedge derivative liability 16,045 —Acquisition related accruals 29,511 30,190Other liabilities 13,921 20,780
Total accrued expenses and other current liabilities $ 251,660 $ 238,788
Included within acquisition related accruals is an amount outstanding for stamp duty payable on the Curragh acquisition of $29.5 million (A$43.0 million). This amount was outstanding as at June 30, 2020 and December 31, 2019 pending assessment by the Office of State Revenue in Queensland, Australia.
From time to time, the Company enters into mining services contracts which may include embedded leases of mining equipment and other contractual agreements to lease mining equipment and facilities. Based upon the Company’s assessment of the terms of a specific lease agreement, the Company classifies a lease as either finance or operating.
On March 31, 2020, the Company amended one of its mining service contracts for mining equipment assets used to provide mining services. On execution of the amendment, right of use assets of $25.9 million and lease liabilities of $27.0 million were derecognized. These mining equipment assets were previously deemed leased assets embedded within the mining service contract.
Information related to Company’s right-of use assets and related lease liabilities are as follows:
Three Months Ended Six Months Ended(US$ thousands) June 30, 2020 June 30, 2019 June 30, 2020 June 30, 2019Operating lease costs $ 3,071 $ 6,378 $ 11,350 $ 12,861Cash paid for operating lease liabilities 2,862 4,049 10,374 11,073
Finance lease costs:Amortization of right of use assets 627 628 999 1,221Interest on lease liabilities 32 52 69 108
Total finance lease costs $ 659 $ 680 $ 1,068 $ 1,329
(US$ thousands)
June 30,
2020
December 31,
2019
Operating leases:Operating lease right-of-use assets $ 23,313 $ 62,566
Finance leases:Property and equipment 7,881 7,881Accumulated depreciation (6,143) (5,144)
Property and equipment, net 1,738 2,737
Current operating lease obligations 10,146 27,204Operating lease liabilities, less current portion 23,678 48,165
Total operating lease liabilities 33,824 75,369
Current finance lease obligations 1,838 2,481
Total Lease liability $ 35,662 $ 77,850
11. Leases

Notes to Consolidated Financial Statements
Coronado Global Resources Inc. 25
June 30,
2020December 31, 2019
Weighted Average Remaining Lease Term (Years)
Weighted average remaining lease term – finance leases 0.18 0.67Weighted average remaining lease term – operating leases 3.62 2.89
Weighted Average Discount RateWeighted discount rate – finance lease 6.25% 6.25%Weighted discount rate – operating lease 7.94% 8.00%
The Company’s operating leases have remaining lease terms of 1 year to 6 years, some of which include options to extend the terms deemed reasonable to exercise. Maturities of lease liabilities as at June 30, 2020, are as follows:
(US$ thousands)
Operating
Lease
Finance
Lease
Year ending December 31,
2020 $ 7,532 $ 1,8572021 9,085 —2022 8,911 —2023 9,196 —2024 2,897 —Thereafter 1,594 —Total lease payments 39,215 1,857Less imputed interest (5,391) (19)
Total lease liability $ 33,824 $ 1,838
For the six months ended June 30, 2020 and 2019, the Company estimated its annual effective tax rate and applied this effective tax rate to its year-to-date pretax income at the end of the interim reporting period. The tax effect of unusual or infrequently occurring items, including effects of changes in tax laws or rates and changes in judgment about the realizability of deferred tax assets, are reported in the interim period in which they occur. The Company’s 2020 estimated annual effective tax rate, including discrete items, is 14.2%. The Company had an income tax benefit of $20.4 million for the six months ended June 30, 2020, comprising a discrete income tax expense of $1.0 million and income tax benefit of $21.4 million based on a loss before tax of $143.6 million.
Income tax expense of $89.0 million for the six months ended June 30, 2019 was calculated based on an estimated annual effective tax rate of 29.4% for the period.
The Company utilizes the “more likely than not” standard in recognizing a tax benefit in its financial statements. For the six months ended June 30, 2020 and the year ended December 31, 2019, the Company had $14.2 million of unrecognized tax benefits. If accrual for interest or penalties is required, it is the Company’s policy to include these as a component of income tax expense.
The Company is subject to taxation in the United States and its various states, as well as Australia and its various localities. In the United States and Australia, the first tax return was lodged for the year ended December 31, 2018.
On March 27, 2020, the United States Congress enacted the Coronavirus Aid, Relief and Economic Security Act, or CARES Act, to provide certain relief as a result of the COVID-19 outbreak. The CARES Act (PL 116-136), allows for a five-year carryback for losses arising in tax years beginning in 2018, 2019 and 2020.
As there was U.S. taxable income in tax years 2018 and 2019, there is an opportunity to carryback the 2020 losses in order to receive a refund of taxes assessed in these tax years of approximately $16.7 million. By virtue of carrying back net operating losses, there will be no longer an opportunity to utilize foreign tax credits in these tax years.
12. Income Taxes

Notes to Consolidated Financial Statements
Coronado Global Resources Inc. 26
The Company’s SFA, comprises of Facility A ($350 million loan facility), Facility B (A$130 million bank guarantee facility) and Facility C ($200 million loan facility). The SFA has a termination date of February 15, 2023.
The SFA is a revolving credit facility under which the Company may borrow funds from Facility A and/or Facility C for a period of one, two, three or six months, each referred to as a Term. The interest rate is set at the commencement of each Term. At the end of each Term, the Company may elect to repay the loan or extend any loan amount outstanding for a further period of one, two, three or six months. The Term of the loan cannot extend beyond the termination date of the SFA.
Due to the global impacts of COVID-19 on the demand and pricing for metallurgical coal and the resulting uncertainties associated with the pandemic, on May 25, 2020, the Company entered into an agreement with its lenders in the SFA to waive compliance with certain financial covenants for the period from May 25, 2020 to February 28, 2021, or the waiver period. A breach of these financial covenants at the end of, or after, the waiver period will constitute an event of default under the SFA and all amounts outstanding at that point may become due and payable. The terms of the SFA will revert to the originally agreed terms at the end of the waiver period.
As at June 30, 2020 the Company met its financial covenants and other undertakings under the SFA. The Company is pursuing a number of strategic initiatives to strengthen its liquidity and is actively engaged with its Lenders in relation to the extension of the waiver, referred to above, beyond February 28, 2021. These steps are expected to ensure the continuing availability of the SFA beyond February 28, 2021.
During the six months ended June 30, 2020, the Company borrowed a total amount of $145.0 million under the SFA for working capital and corporate purposes. Repayments of $34.0 million were made during the six months ended June 30, 2020.
The total interest bearing liabilities outstanding under the SFA was $441.0 million and $ 330.0 million as at June 30, 2020 and December 31, 2019, respectively.
The following is a summary of the contract obligations as of June 30, 2020:
(US$ thousands) Current Non-current TotalCoal leases contract liability $ 843 $ 21,021 $ 21,864
Stanwell below market coal supply agreement 34,382 165,070 199,452$ 35,225 $ 186,091 $ 221,316
The following is a summary of the contract obligations as of December 31, 2019:
(US$ thousands) Current Non-current TotalCoal leases contract liability 843 21,312 22,155Stanwell below market coal supply agreement 36,092 183,565 219,657
$ 36,935 $ 204,877 $ 241,812
On August 14, 2018 the Company completed the purchase of the Stanwell Reserved Area, or the SRA, adjacent to the current Curragh mining tenements. This area was acquired on a deferred consideration basis and on acquisition the Company recognized a “Right-to-mine-asset” and a corresponding deferred consideration liability of $155.2 million, calculated using a pre-tax discount rate of 13% representing fair value of the arrangements at the date of acquisition. The deferred consideration liability will reflect passage of time changes by way of an annual accretion at the pre-tax discount rate of 13% while the liability will decrease as domestic coal is supplied to Stanwell from the SRA. The accretion of deferred consideration is recognized in “Interest expense, net” in the unaudited Condensed Consolidated Statements of Operations and Comprehensive Income.
(US$ thousands)
June 30,
2020
December 31,
2019
Stanwell Reserved Area deferred consideration $ 181,400 $ 174,605
$ 181,400 $ 174,605
13. Interest Bearing Liabilities
14. Contract Obligations
15. Deferred Consideration Liability

Notes to Consolidated Financial Statements
Coronado Global Resources Inc. 27
Basic earnings per share of common stock is computed by dividing net income attributable to the Company for the period, by the weighted-average number of shares of common stock outstanding during the same period. Diluted earnings per share of common stock is computed by dividing net income attributable to the Company by the weighted-average number of shares of common stock outstanding adjusted to give effect to potentially dilutive securities.
Basic and diluted earnings per share was calculated as follows (in thousands, except per share data):
Three Months Ended Six Months Ended(US$ thousands, except per share data) June 30, 2020 June 30, 2019 June 30, 2020 June 30, 2019Numerator:
Net (loss) income $ (114,330) $ 117,506 $ (123,196) $ 214,326Less: Net loss attributable to Non-controlling interest (2) (4) (4) (4)
Net (loss) income attributable to Company stockholders
$ (114,328) $ 117,510 $ (123,192) $ 214,330
Denominator (in thousands): Weighted-average shares of common stock outstanding 96,652 96,652 96,652 96,652Effects of dilutive shares — 3 — 4Weighted average diluted shares of common stock outstanding
96,652 96,655 96,652 96,656Earnings Per Share (US$):
Basic (1.18) 1.22 (1.27) 2.22Dilutive (1.18) 1.22 (1.27) 2.22
(a) Derivatives
The Company may use derivative financial instruments to manage its financial risks in the normal course of operations, including foreign currency risks, commodity price risk related to purchase of raw materials (such as gas or diesel) and interest rate risk. Derivatives for speculative purposes are strictly prohibited under the Treasury Risk Management Policy approved by the Board of Directors.
The financing counterparties to the derivative contracts potentially expose the Company to credit-related risk. Credit risk is the risk that a third party might fail to fulfill its performance obligations under the terms of the financial instrument. The Company mitigates credit risk by entering into derivative contracts with high credit quality counterparties, limiting the amount of exposure to each counterparty and frequently monitoring their financial condition.
Forward fuel contracts
In 2019, the Company entered into forward derivative contracts to hedge its exposure to diesel fuel that is used, or expects to use, at its operations in Australia, or Australian Operations, during 2020. During the six month period ended June 30, 2020, the Company entered into additional derivative contracts in relation to diesel fuel that it expects to consume at its Australian Operations during 2021. The aggregate notional amount for all outstanding forward diesel fuel derivative contracts designated as cash flow hedges were $82.2 million at June 30, 2020.
Unrealized losses, net of tax, recognized in “Accumulated other comprehensive income/(loss)” as at June 30, 2020, are expected to be recognized into “Cost of coal revenues” in the Unaudited Condensed Statements of Operations and Comprehensive Income, $16.0 million within the next 12 months and $4.1 million within 6 months thereafter, when the hedged transaction impacts income. Refer to Note 18 “Other comprehensive loss” for further disclosure.
Forward foreign currency contracts
The Australian Operations utilize the cash it generates from its US$ denominated coal sales revenue to fund its operating costs, which are predominantly in A$. The Company enters into forward foreign currency contracts to hedge its foreign exchange exposure on a portion of the US$ denominated coal sales revenue at Curragh, whose functional currency is A$.
The aggregated notional amount of the outstanding forward foreign currency derivative contracts designated as cash flow hedges were $57.5 million as at June 30, 2020. The unrealized loss of $0.1 million, net of tax, recognized in “Accumulated other comprehensive income/(loss)” at June 30, 2020, is expected to be recognized into “Coal revenues” in the Unaudited Condensed Statements of Operations and Comprehensive Income within the next 6 months, when the hedged transaction impacts income. Refer to Note 18 “Other comprehensive loss” for further disclosure.
During the six month period ended June 30, 2020, the Company entered into additional forward foreign currency derivative contracts to manage its exposure to US$ at the Australian Operations. The aggregate notional amount for the outstanding forward foreign currency derivative contracts was $55.1 million at June 30, 2020. The unrealized gain of $1.4 million, net of tax, was recognized in “Other, net” in the Unaudited Condensed Statements of Operations and Comprehensive Income.
16. Earnings per Share
17. Derivatives and Fair Value Measurement

Notes to Consolidated Financial Statements
Coronado Global Resources Inc. 28
The fair value of foreign currency and diesel fuel derivatives reflected in the accompanying unaudited Condensed Consolidated Balance Sheet are set forth in the table below:
June 30, 2020 December 31, 2019
(US$ thousands) Classification Derivative asset
Derivative liability
Derivative asset
Derivative liability
Forward fuel contracts Other current assets — — 3,180 —Other current liabilities — 15,991 — —Other non-current liabilities — 4,106 — —
Forward foreign currency contracts Other current assets 1,510 — 953 —Other current liabilities — 54 — —
1,510 20,151 4,133 —
The following table presents our details of foreign currency and diesel fuel outstanding contracts:
June 30, 2020 December 31, 2019
(in thousands)
Notional amount
(thousands)
Unit of measure
Varying maturity dates
Notional amount
(thousands)Unit of
measureVarying
maturity dates
Forward fuel contracts 199,636 Liters July 2020 - December 2021 121,957 Liters
January 2020 – December 2020
Forward foreign currency contracts
112,632 US$ July 2020 - December 2020
24,300 US$ January 2020 –
March 2020
(b) Fair Value of Financial Instruments
The fair value of a financial instrument is the amount that will be received to sell an asset or paid to transfer a liability in an orderly transaction between market participants at the measurement date. The fair values of financial instruments involve uncertainty and cannot be determined with precision.
The Company utilizes valuation techniques that maximize the use of observable inputs and minimize the use of unobservable inputs to the extent possible. The Company determines fair value based on assumptions that market participants would use in pricing an asset or liability in the market. When considering market participant assumptions in fair value measurements, the following fair value hierarchy distinguishes between observable and unobservable inputs, which are categorized in one of the following levels:
Level 1 Inputs: Unadjusted quoted prices in active markets for identical assets or liabilities accessible to the reporting entity at the measurement date.
Level 2 Inputs: Other than quoted prices that are observable for the asset or liability, either directly or indirectly, for substantially the full term of the asset or liability.
Level 3 Inputs: Unobservable inputs for the asset or liability used to measure fair value to the extent that observable inputs are not available, thereby allowing for situations in which there is little, if any, market activity for the asset or liability at measurement date.
Financial Instruments Measured on a Recurring Basis
As of June 30, 2020, the Company has the following liabilities that are required to be measured at fair value on a recurring basis:
Forward commodity contracts: valued based on a valuation that is corroborated by the use of market-based pricing (Level 2)
Foreign currency forward contracts: valued based on a valuation that is corroborated by the use of market-based pricing (Level 2)
Contingent royalty: fair value is determined using the Black-Scholes option pricing formula (Level 3)

Notes to Consolidated Financial Statements
Coronado Global Resources Inc. 29
The following tables set forth the hierarchy of the Company’s net financial liabilities positions for which fair value is measured on a recurring basis as of June 30, 2020:
Assets/(Liabilities)
(US$ thousands) Level 1 Level 2 Level 3 TotalForward commodity contracts $ — $ (20,097) $ — $ (20,097)
Forward foreign currency contracts — 1,456 — 1,456$ — $ (18,641) $ — $ (18,641)
The Company’s net financial liability positions for which fair value is measured on a recurring basis as of December 31, 2019 was as follows:
Assets/(Liabilities)
(US$ thousands) Level 1 Level 2 Level 3 TotalForward commodity contracts $ — $ 3,180 $ — $ 3,180Forward foreign currency contracts — 953 — 953Contingent royalty — — (1,543) (1,543)
$ — $ 4,133 $ (1,543) $ 2,590
Contingent Royalty Consideration
Key assumptions in the valuation include the gross sales price forecast, export volume forecast, volatility, the risk-free rate, and credit-spread of the Company.
Quantitative Information about Level 3 Fair Value Measurements
(US$ thousands)Fair value at
June 30, 2020Valuation technique Unobservable input Range
(Weighted Avg.)
Contingent Royalty Liability $ — Projected cash flows
Gross sales price forecast per ton
$67.1 to $105.2 ($81.7)
Export volume forecast (000’s)
1,816 tons over 9 months
Given the remaining period of the Contingent Royalty obligation is short-term, the valuation technique has been changed from Black-Scholes Option model to projected cash flows.
As a result of the decline in market coal price and the increase of the agreed floor price as the agreement reaches maturity, the Company's projected cash flows resulted in no Contingent royalty liability as at June 30, 2020.
Value Share Mechanism
As part of the acquisition of Curragh on March 29, 2018, the Company agreed to pay a 25% royalty to the seller on sales from metallurgical coal mined at Curragh over a two-year period in the form of a Value Share Mechanism, or VSM. The VSM expired in March 2020. There were no VSM payments during the six months period ended June 30, 2020.

Notes to Consolidated Financial Statements
Coronado Global Resources Inc. 30
The following methods and assumptions are used to estimate the fair value of other financial instruments as of June 30, 2020 and December 31, 2019:
Cash and restricted cash, accounts receivable, accounts payable, accrued expenses, lease liabilities and other current financial liabilities: The carrying amounts reported in the unaudited Condensed Consolidated Balance Sheets approximate fair value due to the short maturity of these instruments.
Deposits and reclamation bonds, lease liabilities, interest bearing liabilities and other financial liabilities: The fair values approximate the carrying values reported in the unaudited Condensed Consolidated Balance Sheets.
Accumulated other comprehensive loss consisted of the following at June 30, 2020:
Net unrealized gain (loss)
(US$ thousands)
Foreign currency
translation adjustments
Cash flow fuel hedges
Cash flow foreign
currency hedges
Total
Balance at December 31, 2019 (48,265) 2,378 681 (45,206)
Net current-period other comprehensive income (loss):
Loss in other comprehensive income (loss) before reclassifications (14,406) (30,796) (4,355) (49,557)
Loss reclassified from accumulated other comprehensive income (loss) — 9,809 3,449 13,258
Tax effects — 6,983 264 7,247
Total net current-period other comprehensive loss (14,406) (14,004) (642) (29,052)
Balance at June 30, 2020 (62,671) (11,626) 39 (74,258)
(a) Mineral Leases
The Company leases mineral interests and surface rights from land owners under various terms and royalty rates. The future minimum royalties under these leases are as follows:
(US$ thousands) Amount
Year ending December 31,
2020 3,450
2021 5,373
2022 5,208
2023 5,133
2024 5,010
Thereafter 25,465
Total 49,639
Mineral leases are not in scope of ASC 842 and continue to be accounted for under the guidance in ASC 932, Extractive Activities – Mining.
Other Financial Instruments
18. Other Comprehensive Income
19. Commitments

Notes to Consolidated Financial Statements
Coronado Global Resources Inc. 31
(b) Other commitments
As of June 30, 2020, purchase commitments for capital expenditures were $25.9 million, all of which is obligated within the next 12 months.
In Australia, the Company has generally secured the ability to transport coal through rail contracts and coal export terminal contracts that are primarily funded through take-or-pay arrangements with terms ranging up to 11 years. In the U.S., the Company typically negotiates its rail and coal terminal access on an annual basis. As of June 30, 2020, these Australian and U.S. commitments under take-or-pay arrangements totaled $1.5 billion, of which approximately $101.2 million is obligated within the next year.
In the normal course of business, the Company is a party to certain guarantees and financial instruments with off-balance sheet risk, such as letters of credit and performance or surety bonds. No liabilities related to these arrangements are reflected in the Company’s unaudited Condensed Consolidated Balance Sheets. Management does not expect any material losses to result from these guarantees or off-balance sheet financial instruments.
Facility B of the SFA provides A$130 million for issuing multicurrency bank guarantees. At June 30, 2020, Facility B of the SFA had been utilized to issue A$68.9 million of bank guarantees on behalf of the Company.
For the U.S. Operations in order to provide the required financial assurance, the Company generally uses surety bonds for post-mining reclamation and workers’ compensation obligations. The Company can also use bank letters of credit to collateralize certain obligations. As of June 30, 2020, the Company had outstanding surety bonds of $40.0 million, to secure various obligations and commitments.
Curragh is a co-appellant to proceedings in the Queensland Supreme Court brought by Aurizon. Aurizon’s claim relates to costs relating to the co-defendants’ use of the Wiggins Island Coal Export Terminal Pty Ltd, or WICET, rail links, in particular, whether the “First Milestone Target Date”, which triggers certain “WIRP Fee” payments under the Wiggins Island Rail Project Deed, or WIRP Deed, has been achieved. The trial for this matter concluded in September 2018 and judgement was delivered by the Supreme Court in July 2019. Ultimately, Aurizon was successful in that trial and a determination was made that a WIRP Fee premium is payable by the defendants under the WIRP Deed. The defendants appealed the decision in the Queensland Court of Appeal and the appeal hearing was held in March 2020. Judgement has been reserved by the Court of Appeal and is not expected to be delivered before August 2020. Resolution of this dispute would also result in the Company’s below rail access to WICET (of 1.5 MMtpa) becoming a firm contractual capacity entitlement (and the subject of a 20 year take-or-pay access agreement) instead of an ad hoc entitlement only. The Company’s unaudited Condensed Consolidated Balance Sheet includes an estimated loss contingency associated with these proceedings of approximately $5.3 million as at June 30, 2020.
Should the defendant’s appeal process be unsuccessful, the amount of the WIRP Fee may materially differ from our current estimation.
From time to time, the Company becomes a party to other legal proceedings in the ordinary course of business in Australia, the U.S. and other countries where the Company does business. Based on current information, the Company believes that such other pending or threatened proceedings are likely to be resolved without a material adverse effect on its financial condition, results of operations or cash flows.
The liabilities recorded in relation to the above litigation do not include estimated future costs associated with legal representation, which, in accordance with the Company’s policy, are expensed as incurred. In management’s opinion, the Company is not currently involved in any legal proceedings, which individually or in the aggregate could have a material effect on the financial condition, results of operations and/or liquidity of the Company.
20. Contingencies

.
Coronado Global Resources Inc. 32
Appendix A – Cautionary Notice Regarding Forward – Looking StatementsThis report contains forward-looking statements concerning our business, operations, financial performance and condition, the coal, steel and other industries, as well as our plans, objectives and expectations for our business, operations, financial performance and condition. Forward-looking statements may be identified by words such as "may," "could," "believes," "estimates," "expects," "intends," "considers", “forecasts”, “targets” and other similar words that involve risk and uncertainties. Forward-looking statements provide management's current expectations or predictions of future conditions, events or results. All statements that address operating performance, events or developments that we expect or anticipate will occur in the future are forward-looking statements. They may include estimates of revenues, income, earnings per share, cost savings, capital expenditures, dividends, share repurchases, liquidity, capital structure, market share, industry volume, or other financial items, descriptions of management’s plans or objectives for future operations, or descriptions of assumptions underlying any of the above. All forward-looking statements speak only as of the date they are made and reflect the company's good faith beliefs, assumptions and expectations, but they are not guarantees of future performance or events. Furthermore, the company disclaims any obligation to publicly update or revise any forward-looking statement, except as required by law. By their nature, forward-looking statements are subject to risks and uncertainties that could cause actual results to differ materially from those suggested by the forward-looking statements. Factors that might cause such differences include, but are not limited to, a variety of economic, competitive and regulatory factors, many of which are beyond the company's control, that are described in our Annual Report on Form 10-K filed with the ASX and SEC on 24 February 2020, as well as additional factors we may describe from time to time in other filings with the ASX and SEC. You may get such filings for free at our website at www.coronadoglobal.com.au. You should understand that it is not possible to predict or identify all such factors and, consequently, you should not consider any such list to be a complete set of all potential risks or uncertainties.

.
Coronado Global Resources Inc. 33
Appendix B – Reconciliation of Non-GAAP Financial MeasuresHow We Evaluate our Operations
We evaluate our operations based on the volume of coal we can safely produce and sell in compliance with regulatory standards, and the prices we receive for our coal. Our sales volume and sales prices are largely dependent upon the terms of our coal sales contracts, for which prices generally are set based on daily index averages, on a quarterly basis or annual fixed price contracts.
Our management uses a variety of financial and operating metrics to analyze our performance. These metrics are significant factors in assessing our operating results and profitability. These financial and operating metrics include: (i) safety and environmental metrics; (ii) total sales volumes and average realized price per Mt sold, which we define as total coal revenues divided by total sales volume; (iii) Met sales volumes and average realized Met price per Mt sold, which we define as Met coal revenues divided by Met sales volume; (iv) average segment mining costs per Mt sold, which we define as mining costs divided by sales volumes for the respective segment; and (v) average segment operating costs per Mt sold, which we define as segment operating costs divided by sales volumes for the respective segment.
Coal revenues are shown on our statement of operations and comprehensive income exclusive of other revenues. Generally, export sale contracts for our Australian Operations require us to bear the cost of freight from our mines to the applicable outbound shipping port, while freight costs from the port to the end destination are typically borne by the customer. Sales to the export market from our U.S. Operations are generally recognized when title to the coal passes to the customer at the mine load out similar to a domestic sale. For our domestic sales, customers typically bear the cost of freight. As such, freight expenses are excluded from cost of coal revenues to allow for consistency and comparability in evaluating our operating performance.
Non-GAAP Financial Measures; Other Measures
This report which includes a discussion of results of operations includes references to and analysis of certain non-GAAP measures (as described below) which are financial measures not recognised in accordance with U.S. GAAP. Non-GAAP financial measures are used by the Company and investors to measure operating performance.
Adjusted EBITDA, a non-GAAP measure, is defined as earnings before interest, tax, depreciation, depletion and amortization and other foreign exchange losses. Adjusted EBITDA is not intended to serve as an alternative to U.S. GAAP measures of performance and may not be comparable to similarly titled measures presented by other companies. A reconciliation of Adjusted EBITDA to its most directly comparable measure under U.S. GAAP is included below.
Segment Adjusted EBITDA is defined as Adjusted EBITDA by operating and reporting segment, adjusted for certain transactions, eliminations or adjustments that our CODM does not consider for making decisions to allocate resources among segments or assessing segment performance. Segment Adjusted EBITDA is used as a supplemental financial measure by management and by external users of our financial statements such as investors, industry analysts and lenders to assess the operating performance of the business.
Mining costs, a non-GAAP measure, is based on reported cost of coal revenues, which is shown on our statement of operations and comprehensive income exclusive of freight expense, Stanwell rebate, other royalties, depreciation, depletion and amortization and selling, general and administrative expenses, adjusted for other items that do not relate directly to the costs incurred to produce coal at mine. Mining costs excludes these cost components as our CODM does not view these costs as directly attributable to the production of coal. Mining costs is used as a supplemental financial measure by management, providing an accurate view of the costs directly attributable to the production of coal at our mining segments, and by external users of our financial statements, such as investors, industry analysts and ratings agencies, to assess our mine operating performance in comparison to the mine operating performance of other companies in the coal industry.

.
Coronado Global Resources Inc. 34
1. Mining and operating costs for the six months ended 30 June 2020 compared to six months ended 30 June 2019
A reconciliation of segment costs and expenses, segment operating costs, segment mining costs and segment mining costs per tonne is shown below:
For Six Months Ended June 30, 2020
AustraliaUnited States
Other /corporate Total
Total costs and expenses 506,686 244,891 13,726 765,303Less: Selling, general and administrative expense — — (13,353) (13,353)Less: Depreciation, depletion and amortization (40,080) (46,396) (373) (86,849)Total operating costs 466,606 198,495 — 665,101Less: Other royalties (37,508) (5,947) — (43,455)Less: Stanwell rebate (57,415) — — (57,415)Less: Freight expenses (70,220) (12,666) — (82,886)Less: Other non-mining costs (2,622) (6,336) — (8,958)Total mining costs 298,841 173,546 — 472,387Sales Volume excluding non-produced coal (MMt) 5.5 2.7 — 8.2Mining cost per Mt sold ($) 53.9 64.3 — 57.3
For Six Months Ended June 30, 2019
AustraliaUnited States
Other /corporate Total
Total costs and expenses 564,658 331,930 18,156 914,744Less: Selling, general and administrative expense (332) — (17,979) (18,311)Less: Depreciation, depletion and amortization (42,157) (42,945) (177) (85,279)Total operating costs 522,169 288,985 — 811,154Less: Other royalties (77,100) (16,322) — (93,422)Less: Stanwell rebate (94,674) — — (94,674)Less: Freight expenses (78,194) (11,168) — (89,362)Total mining costs 272,201 261,495 — 533,696Sales Volume excluding non-produced coal (MMt) 6.4 4.0 — 10.4Mining cost per Mt sold ($) 42.6 65.4 — 51.4
2. Average realised price reconciliation
For the six months ended 30 June 2020
(In US$’000, except for volume data) AustraliaUnited States Consolidated
Metallurgical coal revenues 407,831 234,198 642,029Volume of Metallurgical coal sold (MMt) 3.9 2.7 6.6Average realised metallurgical coal price per Mt sold 104.8 86.6 97.3
For the six months ended 30 June 2019
(In US$’000, except for volume data) AustraliaUnited States Consolidated
Metallurgical coal revenues 727,964 407,535 1,135,499Volume of Metallurgical coal sold (MMt) 4.8 3.5 8.3Average realised metallurgical coal price per Mt sold 152.3 117.0 137.5
3. Adjusted EBITDA
Three months ended Six Months EndedJune 30, June 30,
2020 2019 2020 2019(US$ thousands) (US$ thousands)
Net (loss) income $ (114,330) $ 117,506 $ (123,196) $ 214,326Depreciation, depletion and amortization 41,547 45,508 86,849 85,279Interest expense (net of income) 12,064 9,087 24,318 17,264Other foreign exchange losses (gains) 9,777 3,157 4,217 (557)Income tax (benefit) expense (22,646) 47,033 (20,355) 89,043Impairment of assets 63,111 — 63,111 —
Consolidated adjusted EBITDA $ (10,477) $ 222,291 $ 34,944 $ 405,355

.
Coronado Global Resources Inc. 35
4. Net tangible asset backing per Ordinary Share/CDI
30 June 2020 31 December 2019($ in thousands)
Total Assets 2,101,309 2,214,854Less: Goodwill 28,008 28,008Less: Intangible assets 4,318 5,079Less: Total Liabilities 1,409,382 1,346,913Net tangible assets 659,601 834,854
Number of ordinary shares 96,651,692 96,651,692Net tangible assets backing per ordinary Security $ 6.82 8.64Number of CDIs 966,516,920 966,516,920Net tangible assets backing per CDI $ 0.68 0.86