Resources and Energy Quarterly · Foreword . The Resources and Energy Quarterly provides data on...
73
DECEMBER QUARTER 2014 Resources and Energy Quarterly WWW.INDUSTRY.GOV.AU
Transcript of Resources and Energy Quarterly · Foreword . The Resources and Energy Quarterly provides data on...
DECEMBER QUARTER 2014
Resources and Energy Quarterly
WWW.INDUSTRY.GOV.AU

Further Information For more information on data or government initiatives please access the report from the Department’s website at: www.industry.gov.au. Acknowledgements Individual commodity notes have identified authors. Cover image source: Thinkstock © Commonwealth of Australia 2014 ISSN 1839-5007 [ONLINE] Vol. 4, no. 2
This work is copyright. Apart from any use as permitted under the Copyright Act 1968, no part may be reproduced or altered by any process without prior written permission from the Australian Government. Requests and inquiries concerning reproduction and rights should be addressed to:
Department of Industry, GPO Box 9839, Canberra ACT 2601 or by emailing [email protected]
Creative Commons licence With the exception of the Coat of Arms, this publication is licensed under a Creative Commons Attribution 3.0 Australia Licence. Creative Commons Attribution 3.0 Australia Licence is a standard form license agreement that allows you to copy, distribute, transmit and adapt this publication provided that you attribute the work.
A summary of the licence terms is available from: http://creativecommons.org/licenses/by/3.0/au/deed.en
The full licence terms are available from: http://creativecommons.org/licenses/by/3.0/au/legalcode
The Commonwealth’s preference is that you attribute this publication (and any material sourced from it) using the following wording: Source: Licensed from the Commonwealth of Australia under a Creative Commons Attribution 3.0 Australia Licence.
Resources and Energy Quarterly, December 2014 1
Foreword The Resources and Energy Quarterly provides data on the performance of Australia’s resources and energy sectors and analysis of key commodity markets. This release of the Resources and Energy Quarterly contains an update of short-term commodity forecasts and overviews of key commodity market issues. Domestic production is continuing to expand for key commodities contributing to the significant pressure on commodity prices that has emerged over 2014. While export volumes will grow over 2014-15, export values are forecast to decline by 10 per cent due to weaker prices. The significant increase in supply of key commodities along with subdued growth in demand will see a continuation of price pressures through 2015. Mark Cully Chief Economist Department of Industry
Resources and Energy Quarterly, December 2014 2

Contents Forward 2
Macroeconomic outlook 4
Steel 12
Iron ore 17
Metallurgical coal 23
Thermal coal 26
Gas 31
Oil 35
Uranium 40
Gold 41
Aluminium 45
Copper 50
Nickel 54
Zinc 58
Trade summary charts 61
Resources and Energy Quarterly, December 2014 3
Macroeconomic outlook
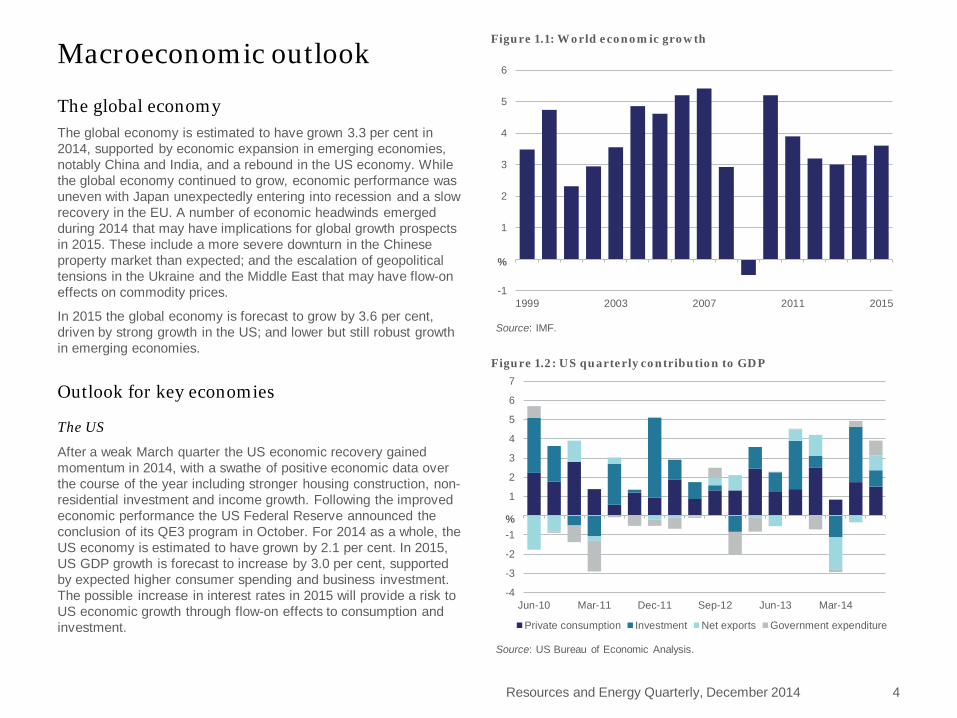
The global economy The global economy is estimated to have grown 3.3 per cent in 2014, supported by economic expansion in emerging economies, notably China and India, and a rebound in the US economy. While the global economy continued to grow, economic performance was uneven with Japan unexpectedly entering into recession and a slow recovery in the EU. A number of economic headwinds emerged during 2014 that may have implications for global growth prospects in 2015. These include a more severe downturn in the Chinese property market than expected; and the escalation of geopolitical tensions in the Ukraine and the Middle East that may have flow-on effects on commodity prices.
In 2015 the global economy is forecast to grow by 3.6 per cent, driven by strong growth in the US; and lower but still robust growth in emerging economies.
Outlook for key economies
The US
After a weak March quarter the US economic recovery gained momentum in 2014, with a swathe of positive economic data over the course of the year including stronger housing construction, non-residential investment and income growth. Following the improved economic performance the US Federal Reserve announced the conclusion of its QE3 program in October. For 2014 as a whole, the US economy is estimated to have grown by 2.1 per cent. In 2015, US GDP growth is forecast to increase by 3.0 per cent, supported by expected higher consumer spending and business investment. The possible increase in interest rates in 2015 will provide a risk to US economic growth through flow-on effects to consumption and investment.
Resources and Energy Quarterly, December 2014 4
-1
1
2
3
4
5
6
1999 2003 2007 2011 2015
%
Figure 1.1: World economic growth
Source: IMF.
-4
-3
-2
-1
1
2
3
4
5
6
7
Jun-10 Mar-11 Dec-11 Sep-12 Jun-13 Mar-14
%
Figure 1.2: US quarterly contribution to GDP
Private consumption Investment Net exports Government expenditure
Source: US Bureau of Economic Analysis.

China
China’s GDP growth is estimated at 7.2 per cent in 2014, with the downturn in the property sector in response to tighter credit conditions, oversupply and weak buying interest acting as a major drag on growth. The effects of the weaker property sector spread to construction, investment, industrial production, and electricity generation, which also exhibited weak growth. It is expected that the government will implement measures to mitigate the slowdown including easing purchase restrictions, lowering taxes and loosening monetary policy settings.
The downturn in the property sector is expected to persist in the near term as the housing stock is drawn down and government support measures will take time to have an effect. While growth in the sector is forecast to improve gradually towards the end of 2015, it is unlikely to return to previous growth rates. Investment in infrastructure development is expected to be a key driver of economic growth in early 2015 following the announcement of almost US$200 billion in projects towards the end of 2014.
Resources and Energy Quarterly, December 2014 5
-2
2
4
6
8
10
12
Jun-10 Mar-11 Dec-11 Sep-12 Jun-13 Mar-14
%ytd
Figure 1.3: China quarterly contribution to GDP
final consumption expenditure gross capital formation net exports
Source: CEIC.
5
10
15
20
25
30
Manufacturing Railways Real estate Electricity Total
%ytd
Figure 1.4: China fixed asset investment by sector
Sep-13 Dec-13 Mar-14 Jun-14 Sep-14Source: CEIC.
-40
-20
20
40
60
80
100
120
Mar-08 Dec-08 Sep-09 Jun-10 Mar-11 Dec-11 Sep-12 Jun-13 Mar-14
%yr
Figure 1.5: China’s residential sales and starts
Starts Sales
Data is three month moving average of monthly growth rate. Source: CEIC.
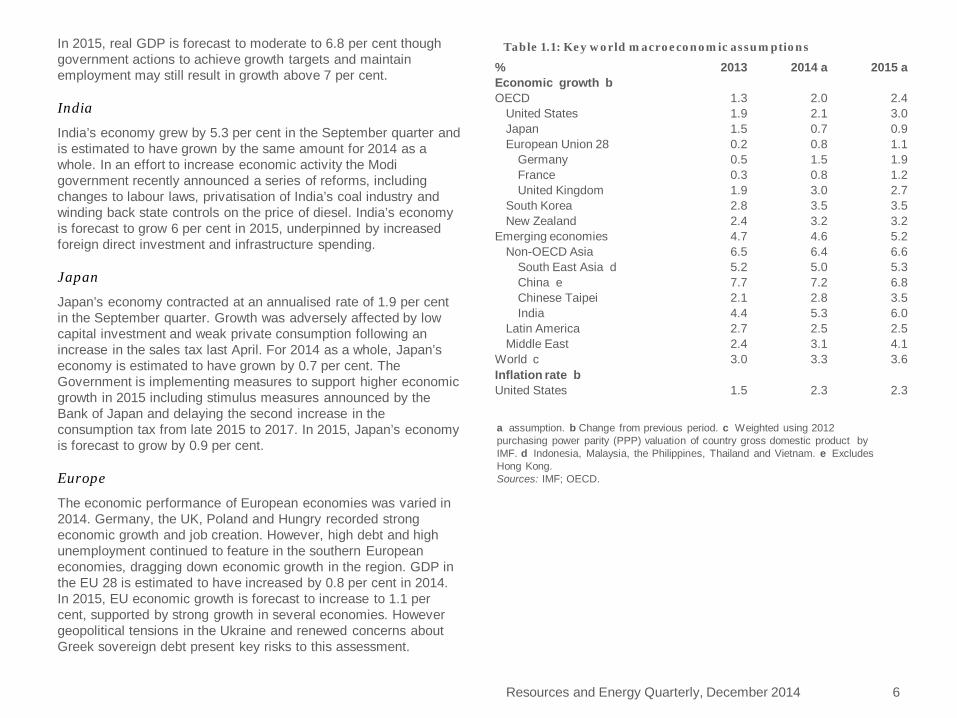
In 2015, real GDP is forecast to moderate to 6.8 per cent though government actions to achieve growth targets and maintain employment may still result in growth above 7 per cent.
India
India’s economy grew by 5.3 per cent in the September quarter and is estimated to have grown by the same amount for 2014 as a whole. In an effort to increase economic activity the Modi government recently announced a series of reforms, including changes to labour laws, privatisation of India’s coal industry and winding back state controls on the price of diesel. India’s economy is forecast to grow 6 per cent in 2015, underpinned by increased foreign direct investment and infrastructure spending.
Japan
Japan’s economy contracted at an annualised rate of 1.9 per cent in the September quarter. Growth was adversely affected by low capital investment and weak private consumption following an increase in the sales tax last April. For 2014 as a whole, Japan’s economy is estimated to have grown by 0.7 per cent. The Government is implementing measures to support higher economic growth in 2015 including stimulus measures announced by the Bank of Japan and delaying the second increase in the consumption tax from late 2015 to 2017. In 2015, Japan’s economy is forecast to grow by 0.9 per cent.
Europe
The economic performance of European economies was varied in 2014. Germany, the UK, Poland and Hungry recorded strong economic growth and job creation. However, high debt and high unemployment continued to feature in the southern European economies, dragging down economic growth in the region. GDP in the EU 28 is estimated to have increased by 0.8 per cent in 2014. In 2015, EU economic growth is forecast to increase to 1.1 per cent, supported by strong growth in several economies. However geopolitical tensions in the Ukraine and renewed concerns about Greek sovereign debt present key risks to this assessment.
Resources and Energy Quarterly, December 2014 6
Table 1.1: Key world macroeconomic assumptions
% 2013 2014 a 2015 a Economic growth b OECD 1.3 2.0 2.4
United States 1.9 2.1 3.0 Japan 1.5 0.7 0.9 European Union 28 0.2 0.8 1.1
Germany 0.5 1.5 1.9 France 0.3 0.8 1.2 United Kingdom 1.9 3.0 2.7
South Korea 2.8 3.5 3.5 New Zealand 2.4 3.2 3.2
Emerging economies 4.7 4.6 5.2 Non-OECD Asia 6.5 6.4 6.6
South East Asia d 5.2 5.0 5.3 China e 7.7 7.2 6.8 Chinese Taipei 2.1 2.8 3.5 India 4.4 5.3 6.0
Latin America 2.7 2.5 2.5 Middle East 2.4 3.1 4.1
World c 3.0 3.3 3.6 Inflation rate b United States 1.5 2.3 2.3
a assumption. b Change from previous period. c Weighted using 2012 purchasing power parity (PPP) valuation of country gross domestic product by IMF. d Indonesia, Malaysia, the Philippines, Thailand and Vietnam. e Excludes Hong Kong. Sources: IMF; OECD.
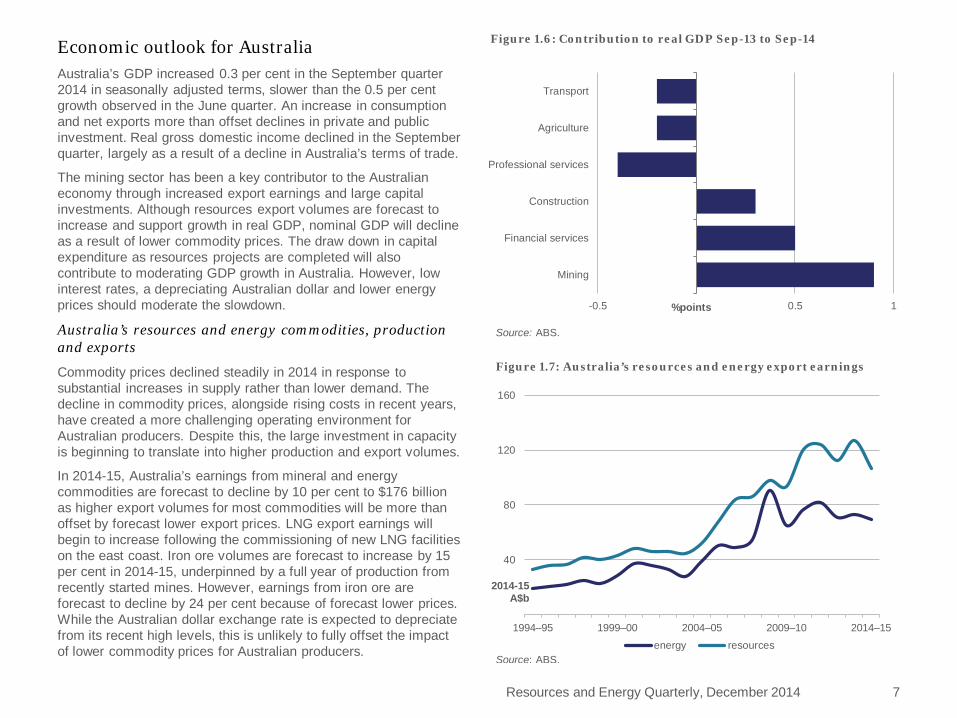
Economic outlook for Australia Australia’s GDP increased 0.3 per cent in the September quarter 2014 in seasonally adjusted terms, slower than the 0.5 per cent growth observed in the June quarter. An increase in consumption and net exports more than offset declines in private and public investment. Real gross domestic income declined in the September quarter, largely as a result of a decline in Australia’s terms of trade.
The mining sector has been a key contributor to the Australian economy through increased export earnings and large capital investments. Although resources export volumes are forecast to increase and support growth in real GDP, nominal GDP will decline as a result of lower commodity prices. The draw down in capital expenditure as resources projects are completed will also contribute to moderating GDP growth in Australia. However, low interest rates, a depreciating Australian dollar and lower energy prices should moderate the slowdown.
Australia’s resources and energy commodities, production and exports
Commodity prices declined steadily in 2014 in response to substantial increases in supply rather than lower demand. The decline in commodity prices, alongside rising costs in recent years, have created a more challenging operating environment for Australian producers. Despite this, the large investment in capacity is beginning to translate into higher production and export volumes.
In 2014-15, Australia’s earnings from mineral and energy commodities are forecast to decline by 10 per cent to $176 billion as higher export volumes for most commodities will be more than offset by forecast lower export prices. LNG export earnings will begin to increase following the commissioning of new LNG facilities on the east coast. Iron ore volumes are forecast to increase by 15 per cent in 2014-15, underpinned by a full year of production from recently started mines. However, earnings from iron ore are forecast to decline by 24 per cent because of forecast lower prices. While the Australian dollar exchange rate is expected to depreciate from its recent high levels, this is unlikely to fully offset the impact of lower commodity prices for Australian producers.
Resources and Energy Quarterly, December 2014 7
40
80
120
160
1994–95 1999–00 2004–05 2009–10 2014–15
2014-15 A$b
energy resourcesSource: ABS.
Figure 1.7: Australia’s resources and energy export earnings
-0.5 0.5 1
Mining
Financial services
Construction
Professional services
Agriculture
Transport
%points
Figure 1.6: Contribution to real GDP Sep-13 to Sep-14
Source: ABS.

Exploration
Exploration expenditure declined 29 per cent year-on-year in the September quarter as lower commodity prices encouraged cost cutting programs, including reduced exploration activity. With lower commodity prices forecast for 2014-15, a rebound in exploration expenditure appears unlikely in the short term. While minerals exploration declined, exploration for petroleum increased. However, the rapid decline in oil prices may affect petroleum exploration expenditure over the remainder of 2014-15.
Exploration at new deposits fell 47 per cent compared with the September quarter 2013, while exploration at existing deposits fell 18 per cent. In the September quarter exploration expenditure in Western Australia fell 25 per cent year-on-year to $858 million. With the exception of the Northern Territory, where exploration expenditure increased by 43 per cent, every other state also recorded large declines in exploration expenditure.
1.5
3
4.5
6
7.5
9
2006-07 2007-08 2008-09 2009-10 2010-11 2011-12 2012-13 2013-14
A$b
Figure 1.8: Australia’s exploration expenditure
Petroleum MineralSource: ABS.
Resources and Energy Quarterly, December 2014 8
200
400
600
800
1000
1200
Sep-2010 Sep-2011 Sep-2012 Sep-2013 Sep-2014
A$m
Figure 1.10: Mineral exploration, by deposit type
Existing Deposits New DepositsSource: ABS.
1
2
3
4
5
6
WA Qld NSW, Vic, Tas SA NT
A$b
Figure 1.9: State exploration expenditure
2010-11 2011-12 2012-13 2013-14Source: ABS.
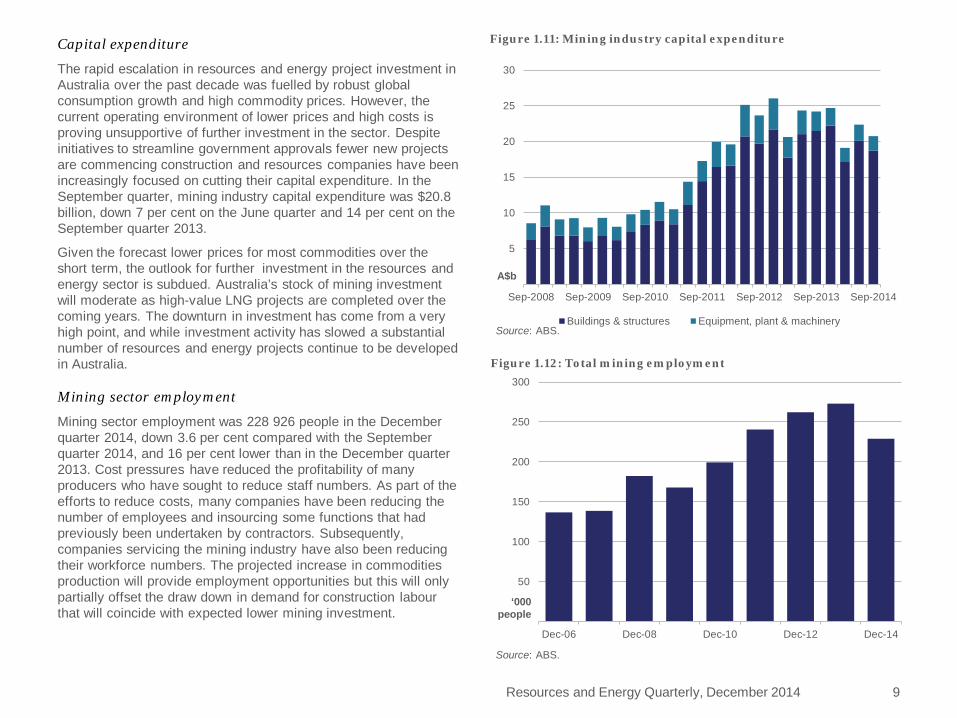
Capital expenditure
The rapid escalation in resources and energy project investment in Australia over the past decade was fuelled by robust global consumption growth and high commodity prices. However, the current operating environment of lower prices and high costs is proving unsupportive of further investment in the sector. Despite initiatives to streamline government approvals fewer new projects are commencing construction and resources companies have been increasingly focused on cutting their capital expenditure. In the September quarter, mining industry capital expenditure was $20.8 billion, down 7 per cent on the June quarter and 14 per cent on the September quarter 2013.
Given the forecast lower prices for most commodities over the short term, the outlook for further investment in the resources and energy sector is subdued. Australia’s stock of mining investment will moderate as high-value LNG projects are completed over the coming years. The downturn in investment has come from a very high point, and while investment activity has slowed a substantial number of resources and energy projects continue to be developed in Australia.
Mining sector employment
Mining sector employment was 228 926 people in the December quarter 2014, down 3.6 per cent compared with the September quarter 2014, and 16 per cent lower than in the December quarter 2013. Cost pressures have reduced the profitability of many producers who have sought to reduce staff numbers. As part of the efforts to reduce costs, many companies have been reducing the number of employees and insourcing some functions that had previously been undertaken by contractors. Subsequently, companies servicing the mining industry have also been reducing their workforce numbers. The projected increase in commodities production will provide employment opportunities but this will only partially offset the draw down in demand for construction labour that will coincide with expected lower mining investment.
Resources and Energy Quarterly, December 2014 9
5
10
15
20
25
30
Sep-2008 Sep-2009 Sep-2010 Sep-2011 Sep-2012 Sep-2013 Sep-2014
A$b
Figure 1.11: Mining industry capital expenditure
Buildings & structures Equipment, plant & machinerySource: ABS.
50
100
150
200
250
300
Dec-06 Dec-08 Dec-10 Dec-12 Dec-14
‘000 people
Figure 1.12: Total mining employment
Source: ABS.

Resources and Energy Quarterly, December 2014 10
Table 1.2: Key macroeconomic assumptions for Australia unit 2012–13 2013–14 2014–15 a
Economic growth bc % 2.6 3.1 2.5 Inflation rate b % 2.4 3.0 2.7 Interest rate d % 3.1 2.5 2.5 Exchange rate e US$/A$ 1.03 0.92 0.87
a assumption. b Change from previous period. c Seasonally adjusted chain volume measures. d Median RBA cash rate. e Average of daily rates. Sources: ABS; RBA.
Table 1.3: Outlook for Australia’s resources and energy commodities unit 2012–13 2013–14 2014–15 f % change
Value of exports Resources and energy A$m 174 490 195 004 175 912 –9.8 – real b A$m 183 829 200 270 175 912 –12.2 Energy A$m 67 494 71 466 69 476 –2.8 – real b A$m 71 107 73 395 69 476 –5.3 Resources A$m 106 996 123 539 106 435 –13.8 – real b A$m 112 722 126 874 106 435 –16.1 Mine production 167 510 187 204 168 875 –9.8 Gross value A$m 176 476 192 259 168 875 –12.2 b In current financial year Australian dollars. f forecast. Source: ABS.
Table 1.4: Australia’s resources and energy commodity exports, by selected commodities Volume Value
unit 2013–14 2014–15 f % change unit 2013–14 2014–15 f % change Alumina kt 18 614 17 061 –8.3 A$m 5 711 6 239 9.2 Aluminium kt 1 576 1 322 –16.1 A$m 3 477 3 149 –9.4 Copper kt 1 035 1 060 2.4 A$m 8 697 8 919 2.6 Gold t 279 288 3.2 A$m 13 009 12 654 –2.7 Iron ore Mt 651 747 14.7 A$m 74 681 56 965 –23.7 Nickel kt 226 228 1.0 A$m 3 216 3 677 14.3 Zinc kt 1 532 1 640 7.1 A$m 2 366 3 003 26.9 LNG Mt 24 26 11.2 A$m 16 305 17 568 7.8 Metallurgical coal Mt 180 183 1.7 A$m 23 254 22 563 –3.0 Thermal coal Mt 195 196 0.8 A$m 16 705 14 968 –10.4 Oil kbd 255 280 9.8 A$m 11 118 10 431 –6.2 Uranium t 6 701 6 359 –5.1 A$m 622 615 –1.2
f forecast. CAGR is compound annual growth rate, in percentage terms. Source: ABS.

A$1.5b
A$2.4b
A$3.5b
A$3.2b
A$5.7b
A$8.7b
A$11.1b
A$13.0b
A$16.7b
A$16.3b
A$23.3b
A$74.7b
A$1.5b
A$3.0b
A$3.1b
A$3.7b
A$6.2b
A$8.9b
A$10.4b
A$12.7b
A$15.0b
A$17.6b
A$22.6b
A$57.0b
15 30 45 60 75 90
Titanium and zircon
Zinc
Aluminium
Nickel
Alumina
Copper
Crude oil
Gold
Thermal coal
LNG
Metallurgical coal
Iron ore and pellets
A$b 2014–15 f 2013–14
Figure 1.13: Australia’s major resources and energy commodity exports
f forecast EUV is export unit value
2014–15 f volume EUV value
15% –34% –24%
2% –5% –3%
11% –3% 8%
1% –11% –10%
3% –6% –3%
10% –15% –6%
1% 1% 3%
–8% 19% 9%
5% 9% 14%
–16% 8% –9%
7% 19% 27%
10% –10% -1%
Resources and Energy Quarterly, December 2014 11

Steel Ben Witteveen
The downturn in China’s housing sector has been a key driver of lower steel consumption and production growth in 2014. Infrastructure spending is primed to increase in 2015, but the real estate market response to looser monetary policy and stimulatory incentives will be a key driver of steel demand.
World steel overview World steel consumption growth slowed in 2014, underpinned by lower growth in fixed asset investment in emerging economies. Total steel consumption is estimated to have increased 1.0 per cent and totalled 1657 million tonnes. By comparison world steel consumption increased 4 per cent in 2012 and 6 per cent in 2013.
In 2015 steel consumption is forecast to grow further, albeit at an even lower rate due to the downturn in China’s housing market. World steel consumption is forecast to increase 0.9 per cent to 1671 million tonnes.
World steel production is estimated to have increased 2.7 per cent in 2014 to around 1695 million tonnes. Production is forecast to increase 1.1 per cent in 2015 and total 1713 million tonnes.
China Overcapacity and an ongoing slump in consumption growth led to lower steel prices in 2014. During the year, benchmark prices for hot-rolled sheet and rebar declined 14 per cent and 16 per cent respectively. China’s steel prices are forecast to improve in 2015 supported by cuts to steel production capacity, robust growth in infrastructure investment and an eventual rebound in housing construction.
Resources and Energy Quarterly, December 2014 12
400
800
1200
1600
2000
2012 2013 2014 2015
Figure 2.1: World steel consumption
China Rest of world European Union 28 United States India Japan
Source: World Steel Association.
Mt
400
800
1200
1600
2000
2012 2013 2014 2015
Figure 2.2: World steel production
China Rest of world European Union 28 United States India Japan
Source: World Steel Association.
Mt
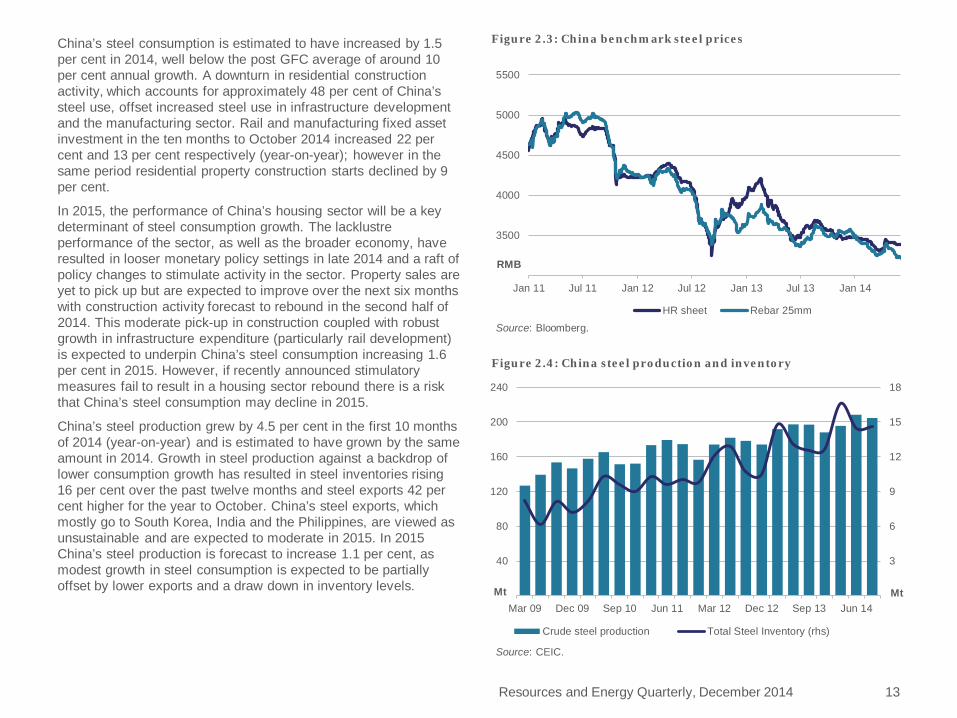
China’s steel consumption is estimated to have increased by 1.5 per cent in 2014, well below the post GFC average of around 10 per cent annual growth. A downturn in residential construction activity, which accounts for approximately 48 per cent of China’s steel use, offset increased steel use in infrastructure development and the manufacturing sector. Rail and manufacturing fixed asset investment in the ten months to October 2014 increased 22 per cent and 13 per cent respectively (year-on-year); however in the same period residential property construction starts declined by 9 per cent.
In 2015, the performance of China’s housing sector will be a key determinant of steel consumption growth. The lacklustre performance of the sector, as well as the broader economy, have resulted in looser monetary policy settings in late 2014 and a raft of policy changes to stimulate activity in the sector. Property sales are yet to pick up but are expected to improve over the next six months with construction activity forecast to rebound in the second half of 2014. This moderate pick-up in construction coupled with robust growth in infrastructure expenditure (particularly rail development) is expected to underpin China’s steel consumption increasing 1.6 per cent in 2015. However, if recently announced stimulatory measures fail to result in a housing sector rebound there is a risk that China’s steel consumption may decline in 2015.
China’s steel production grew by 4.5 per cent in the first 10 months of 2014 (year-on-year) and is estimated to have grown by the same amount in 2014. Growth in steel production against a backdrop of lower consumption growth has resulted in steel inventories rising 16 per cent over the past twelve months and steel exports 42 per cent higher for the year to October. China’s steel exports, which mostly go to South Korea, India and the Philippines, are viewed as unsustainable and are expected to moderate in 2015. In 2015 China’s steel production is forecast to increase 1.1 per cent, as modest growth in steel consumption is expected to be partially offset by lower exports and a draw down in inventory levels.
Resources and Energy Quarterly, December 2014 13
3500
4000
4500
5000
5500
Jan 11 Jul 11 Jan 12 Jul 12 Jan 13 Jul 13 Jan 14
Figure 2.3: China benchmark steel prices
HR sheet Rebar 25mm
Source: Bloomberg.
RMB
3
6
9
12
15
18
40
80
120
160
200
240
Mar 09 Dec 09 Sep 10 Jun 11 Mar 12 Dec 12 Sep 13 Jun 14Mt
Figure 2.4: China steel production and inventory
Crude steel production Total Steel Inventory (rhs)
Mt
Source: CEIC.
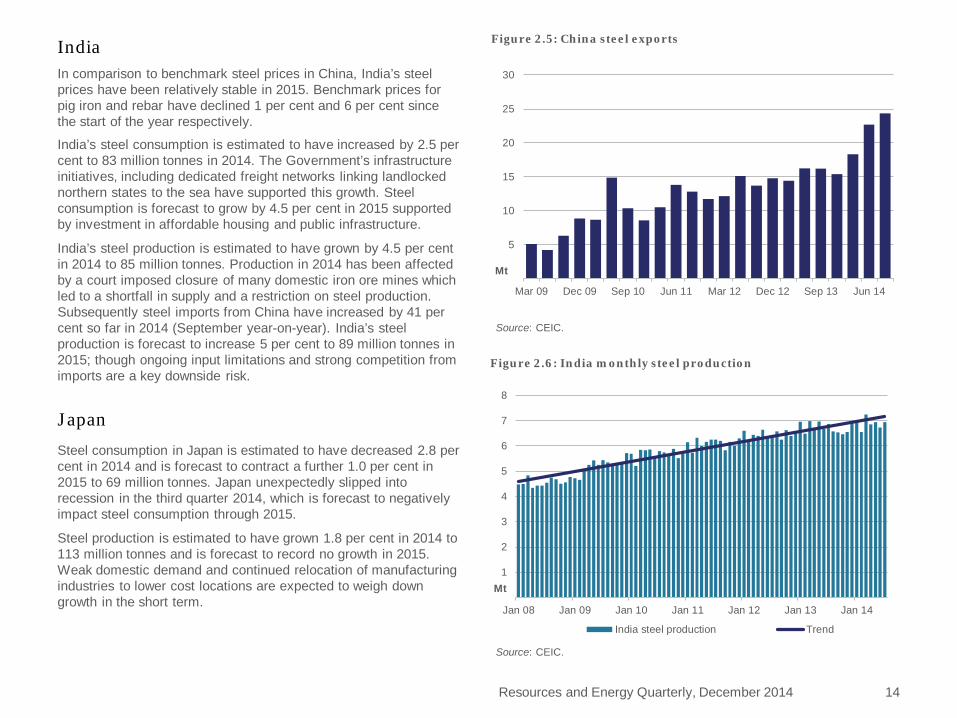
India In comparison to benchmark steel prices in China, India’s steel prices have been relatively stable in 2015. Benchmark prices for pig iron and rebar have declined 1 per cent and 6 per cent since the start of the year respectively.
India’s steel consumption is estimated to have increased by 2.5 per cent to 83 million tonnes in 2014. The Government’s infrastructure initiatives, including dedicated freight networks linking landlocked northern states to the sea have supported this growth. Steel consumption is forecast to grow by 4.5 per cent in 2015 supported by investment in affordable housing and public infrastructure.
India’s steel production is estimated to have grown by 4.5 per cent in 2014 to 85 million tonnes. Production in 2014 has been affected by a court imposed closure of many domestic iron ore mines which led to a shortfall in supply and a restriction on steel production. Subsequently steel imports from China have increased by 41 per cent so far in 2014 (September year-on-year). India’s steel production is forecast to increase 5 per cent to 89 million tonnes in 2015; though ongoing input limitations and strong competition from imports are a key downside risk.
Japan
Steel consumption in Japan is estimated to have decreased 2.8 per cent in 2014 and is forecast to contract a further 1.0 per cent in 2015 to 69 million tonnes. Japan unexpectedly slipped into recession in the third quarter 2014, which is forecast to negatively impact steel consumption through 2015.
Steel production is estimated to have grown 1.8 per cent in 2014 to 113 million tonnes and is forecast to record no growth in 2015. Weak domestic demand and continued relocation of manufacturing industries to lower cost locations are expected to weigh down growth in the short term.
Resources and Energy Quarterly, December 2014 14
5
10
15
20
25
30
Mar 09 Dec 09 Sep 10 Jun 11 Mar 12 Dec 12 Sep 13 Jun 14
Figure 2.5: China steel exports
Mt
Source: CEIC.
1
2
3
4
5
6
7
8
Jan 08 Jan 09 Jan 10 Jan 11 Jan 12 Jan 13 Jan 14
Figure 2.6: India monthly steel production
India steel production Trend
Source: CEIC.
Mt
United States
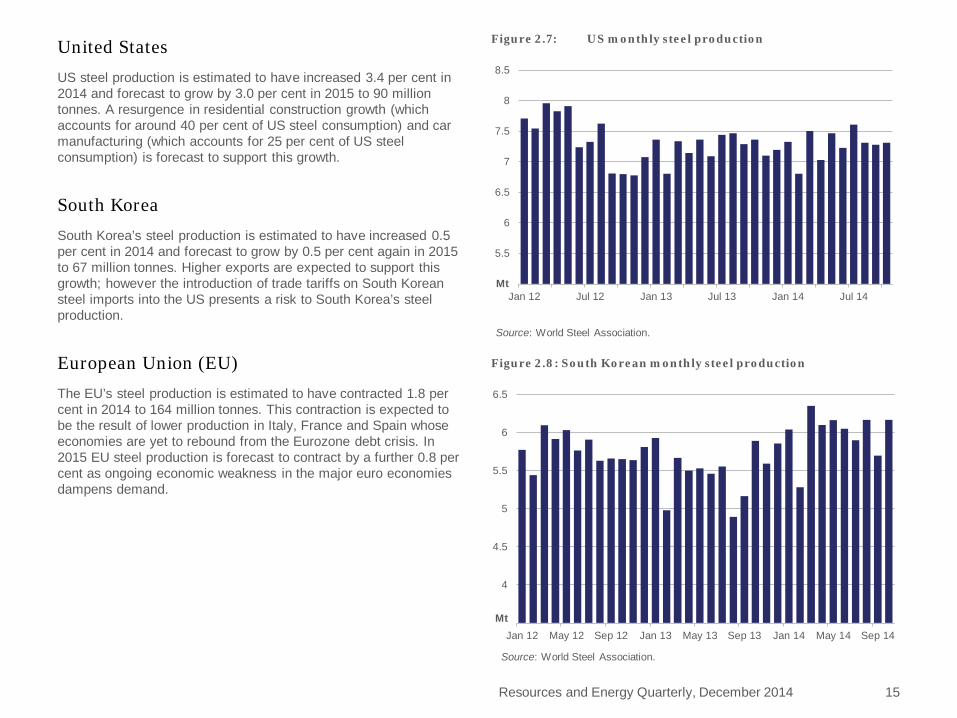
US steel production is estimated to have increased 3.4 per cent in 2014 and forecast to grow by 3.0 per cent in 2015 to 90 million tonnes. A resurgence in residential construction growth (which accounts for around 40 per cent of US steel consumption) and car manufacturing (which accounts for 25 per cent of US steel consumption) is forecast to support this growth.
South Korea
South Korea’s steel production is estimated to have increased 0.5 per cent in 2014 and forecast to grow by 0.5 per cent again in 2015 to 67 million tonnes. Higher exports are expected to support this growth; however the introduction of trade tariffs on South Korean steel imports into the US presents a risk to South Korea’s steel production.
European Union (EU)
The EU’s steel production is estimated to have contracted 1.8 per cent in 2014 to 164 million tonnes. This contraction is expected to be the result of lower production in Italy, France and Spain whose economies are yet to rebound from the Eurozone debt crisis. In 2015 EU steel production is forecast to contract by a further 0.8 per cent as ongoing economic weakness in the major euro economies dampens demand.
Resources and Energy Quarterly, December 2014 15
5.5
6
6.5
7
7.5
8
8.5
Jan 12 Jul 12 Jan 13 Jul 13 Jan 14 Jul 14
Figure 2.7: US monthly steel production
Mt
Source: World Steel Association.
4
4.5
5
5.5
6
6.5
Jan 12 May 12 Sep 12 Jan 13 May 13 Sep 13 Jan 14 May 14 Sep 14
Figure 2.8: South Korean monthly steel production
Source: World Steel Association.
Mt

Resources and Energy Quarterly, December 2014 16
Table 2.1: World steel consumption (Mt)
2012 2013 2014 f 2015 f % change
European Union 28 154 154 153 154 0.4
United States 108 106 107 107 0.5
Brazil 28 29 30 31 2.0
Russian Federation 49 50 51 51 1.0
China 688 772 783 796 1.6
Japan 69 71 69 69 -1.0
South Korea 56 54 55 56 1.5
India 77 81 83 87 4.5
World steel consumption 1546 1641 1657 1671 0.9
Table 2.2: Crude steel production (Mt)
2012 2013 2014 f 2015 f % change
European Union 28 169 167 164 163 -0.8
United States 89 87 90 93 3.0
Russian Federation 71 69 69 69 0.5
China 709 822 859 868 1.1
Japan 107 111 113 113 0.0
South Korea 69 66 66 67 0.5
India 77 81 85 89 5.0
World steel production 1537 1650 1695 1713 1.1
f forecast. Source: World Steel Association.
f forecast. Source: World Steel Association.
Iron ore Ben Witteveen
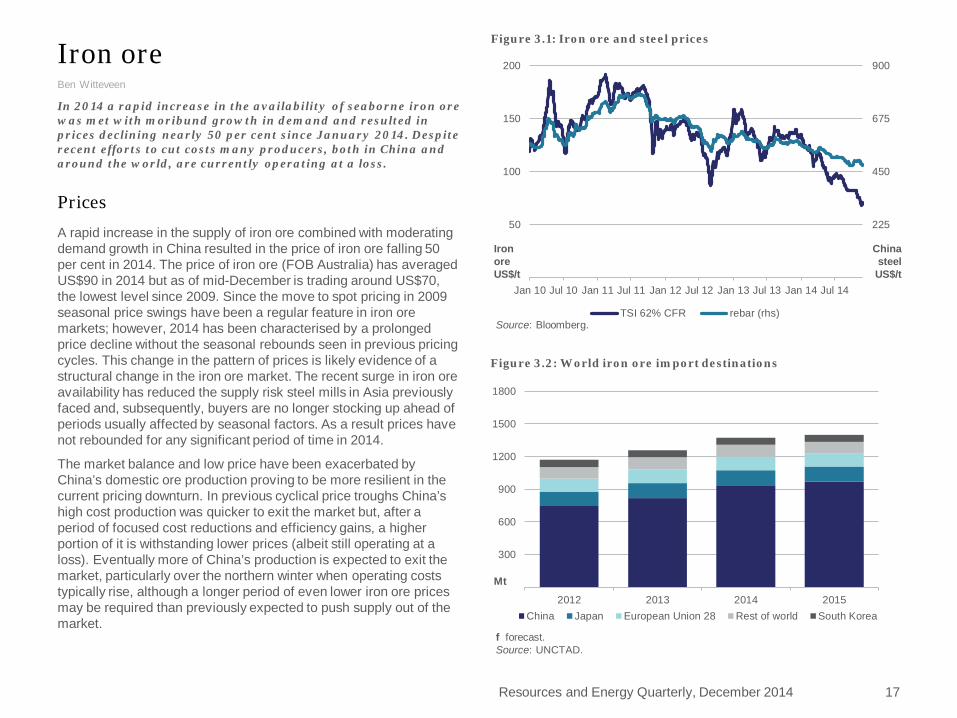
In 2014 a rapid increase in the availability of seaborne iron ore was met with moribund growth in demand and resulted in prices declining nearly 50 per cent since January 2014. Despite recent efforts to cut costs many producers, both in China and around the world, are currently operating at a loss.
Prices
A rapid increase in the supply of iron ore combined with moderating demand growth in China resulted in the price of iron ore falling 50 per cent in 2014. The price of iron ore (FOB Australia) has averaged US$90 in 2014 but as of mid-December is trading around US$70, the lowest level since 2009. Since the move to spot pricing in 2009 seasonal price swings have been a regular feature in iron ore markets; however, 2014 has been characterised by a prolonged price decline without the seasonal rebounds seen in previous pricing cycles. This change in the pattern of prices is likely evidence of a structural change in the iron ore market. The recent surge in iron ore availability has reduced the supply risk steel mills in Asia previously faced and, subsequently, buyers are no longer stocking up ahead of periods usually affected by seasonal factors. As a result prices have not rebounded for any significant period of time in 2014.
The market balance and low price have been exacerbated by China’s domestic ore production proving to be more resilient in the current pricing downturn. In previous cyclical price troughs China’s high cost production was quicker to exit the market but, after a period of focused cost reductions and efficiency gains, a higher portion of it is withstanding lower prices (albeit still operating at a loss). Eventually more of China’s production is expected to exit the market, particularly over the northern winter when operating costs typically rise, although a longer period of even lower iron ore prices may be required than previously expected to push supply out of the market.
Resources and Energy Quarterly, December 2014 17
225
450
675
900
50
100
150
200
Jan 10 Jul 10 Jan 11 Jul 11 Jan 12 Jul 12 Jan 13 Jul 13 Jan 14 Jul 14
Figure 3.1: Iron ore and steel prices
TSI 62% CFR rebar (rhs)Source: Bloomberg.
Iron ore US$/t
China steel US$/t
300
600
900
1200
1500
1800
2012 2013 2014 2015
Figure 3.2: World iron ore import destinations
China Japan European Union 28 Rest of world South Korea
Mt
f forecast. Source: UNCTAD.

Higher cost seaborne supplies are also likely to begin exiting the market in 2015. Many smaller and higher cost producers are already making negative cash margins, but unlike China’s domestic producers, do not have the backing to withstand this period of increased competition.
In 2015 the FOB price of iron ore is forecast to average US$63 a tonne, 28 per cent lower than 2014. The current market oversupply is expected to prevail through the start of 2015 in response to a likely ongoing cyclical downturn in China’s housing sector. Prices are forecast to rebound in the second half of 2015 as some producers cease production and housing construction activity in China starts to recover; however this rebound in the housing sector remains a key area of uncertainty. Further growth in low cost supplies from Australia and Brazil are also expected to offset production closures and maintain downward pressure on the iron ore price in 2015.
World trade in iron ore
Overview
Global trade in iron ore is estimated to have increased 10 per cent in 2014 to 1.35 billion tonnes, driven by a 24 per cent increase in Australian exports and a 10 per cent in Brazilian exports. China’s imports are estimated to have increased by 118 million tonnes as steel mills continued the switch from domestic to cheaper foreign sources of iron ore.
In 2015 world trade in iron ore is forecast to increase by 2.8 per cent to 1.4 billion tonnes, supported by a 7 per cent increase in Australian and Brazilian exports. However this increase is forecast to be partially offset by a reduction in exports from high cost producers.
Iron ore imports
China is estimated to have imported a record 938 million tonnes of iron ore in 2014, up 14 per cent on 2013. However this increase led to record high levels of port stocks which peaked at 106 million tonnes in June and only declined marginally in the six months to December.
Resources and Energy Quarterly, December 2014 18
40
80
120
160
200
40
60
80
100
120
Mar 10 Dec 10 Sep 11 Jun 12 Mar 13 Dec 13 Sep 14
Figure 3.4: Iron ore price and China port stocks
China iron ore port stocks TSI 62% CFR (rhs)
US$/t
Source: Bloomberg.
Mt
300
600
900
1200
1500
1800
2012 2013 2014 2015
Figure 3.3: World iron ore export sources
Australia Brazil Rest of world India (net exports) South Africa
Mt
f forecast. Sources: UNCTAD.
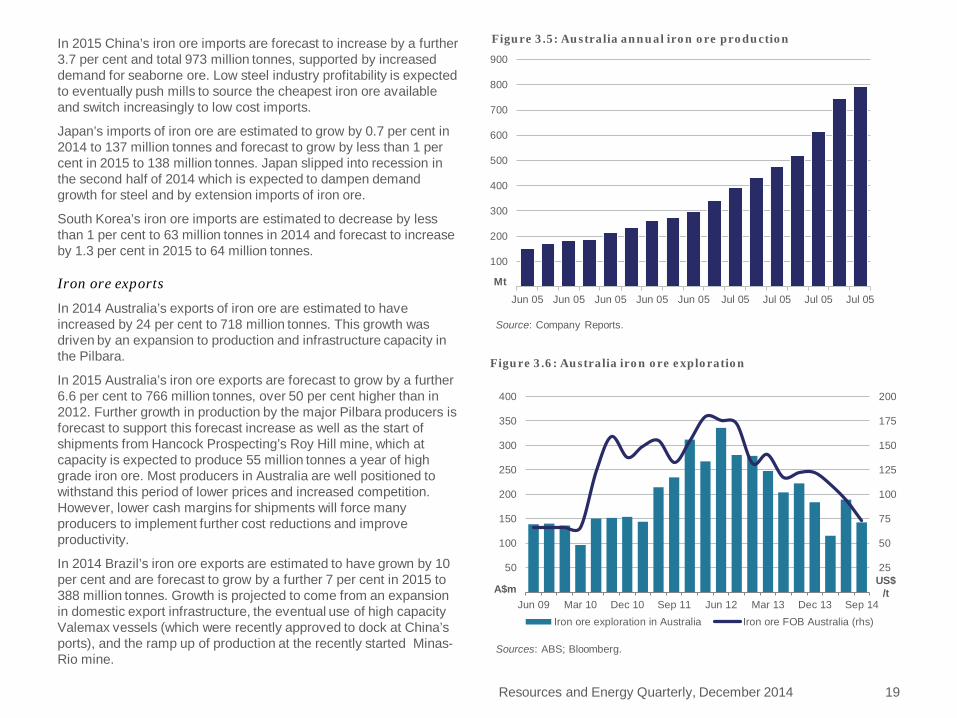
In 2015 China’s iron ore imports are forecast to increase by a further 3.7 per cent and total 973 million tonnes, supported by increased demand for seaborne ore. Low steel industry profitability is expected to eventually push mills to source the cheapest iron ore available and switch increasingly to low cost imports.
Japan’s imports of iron ore are estimated to grow by 0.7 per cent in 2014 to 137 million tonnes and forecast to grow by less than 1 per cent in 2015 to 138 million tonnes. Japan slipped into recession in the second half of 2014 which is expected to dampen demand growth for steel and by extension imports of iron ore.
South Korea’s iron ore imports are estimated to decrease by less than 1 per cent to 63 million tonnes in 2014 and forecast to increase by 1.3 per cent in 2015 to 64 million tonnes.
Iron ore exports
In 2014 Australia’s exports of iron ore are estimated to have increased by 24 per cent to 718 million tonnes. This growth was driven by an expansion to production and infrastructure capacity in the Pilbara.
In 2015 Australia’s iron ore exports are forecast to grow by a further 6.6 per cent to 766 million tonnes, over 50 per cent higher than in 2012. Further growth in production by the major Pilbara producers is forecast to support this forecast increase as well as the start of shipments from Hancock Prospecting’s Roy Hill mine, which at capacity is expected to produce 55 million tonnes a year of high grade iron ore. Most producers in Australia are well positioned to withstand this period of lower prices and increased competition. However, lower cash margins for shipments will force many producers to implement further cost reductions and improve productivity.
In 2014 Brazil’s iron ore exports are estimated to have grown by 10 per cent and are forecast to grow by a further 7 per cent in 2015 to 388 million tonnes. Growth is projected to come from an expansion in domestic export infrastructure, the eventual use of high capacity Valemax vessels (which were recently approved to dock at China’s ports), and the ramp up of production at the recently started Minas-Rio mine.
Resources and Energy Quarterly, December 2014 19
25
50
75
100
125
150
175
200
50
100
150
200
250
300
350
400
Jun 09 Mar 10 Dec 10 Sep 11 Jun 12 Mar 13 Dec 13 Sep 14
Figure 3.6: Australia iron ore exploration
Iron ore exploration in Australia Iron ore FOB Australia (rhs)
Sources: ABS; Bloomberg.
A$m US$
/t
100
200
300
400
500
600
700
800
900
Jun 05 Jun 05 Jun 05 Jun 05 Jun 05 Jul 05 Jul 05 Jul 05 Jul 05
Figure 3.5: Australia annual iron ore production
Source: Company Reports.
Mt

Resources and Energy Quarterly, December 2014 20
f forecast. Source: World Steel Association.
Table 3.2: World iron ore exports (Mt) 2012 2013 f 2014 f 2015 f % change
Australia 492 579 718 766 6.6 Brazil 327 330 362 388 7.0 India (net exports) 16 9 -3 -2 -19.9 Canada 35 36 34 29 -15.0 South Africa 54 48 46 43 -5.8
World iron ore trade 1 154 1 225 1 353 1 392 2.8
Table 3.1: World iron ore imports (Mt) 2012 2013 f 2014 f 2015 f % change
European Union 28 121 128 125 123 -1.6 Japan 131 136 137 138 0.4 China 745 820 938 973 3.7 South Korea 66 63 63 64 1.3

Australia
Exploration
Australia’s iron ore exploration expenditure decreased 40 per cent in the September quarter (year-on-year). The slump in the price of iron ore and the significant increase in Australian supply have reduced the incentive to search for new deposits. Based on forecast lower prices in 2015, exploration expenditure for iron ore in Australia is not expected to rebound in the short term.
Exports
In 2014-15, Australia’s iron ore export volumes are forecast to increase by 15 per cent and to total 747 million tonnes. Debottlenecking initiatives and higher production from existing mines are projected to support this growth. Production at Roy Hill is not forecast to begin operations in 2014-15, with most growth the result of higher shipments from Rio Tinto, BHP and Fortescue Metals Group. Despite increased export volumes and a more favourable exchange rate iron ore export values are forecast to decrease 24 per cent to $57 billion as a result of lower iron ore prices.
Resources and Energy Quarterly, December 2014 21
20
40
60
80
200
400
600
800
1998–99 2002–03 2006–07 2010–11 2014–15
Figure 3.7: Australia’s iron ore exports
volume value (rhs)Source: ABS.
Mt 2014-15 A$b

Resources and Energy Quarterly, December 2014 22
Table 5: Iron ore outlook unit 2013 2014 f 2015 f % change
World Prices b Iron ore c – nominal US$/t 125.8 87.8 63.0 -28.3 – real d US$/t 128.0 87.8 61.8 -29.7
2012–13 2013–14 2014–15 f % change Australia Production Iron and steel gs Mt 4.85 4.53 4.33 -4.4 Iron ore Mt 555.5 682.7 774.2 13.4 Exports Iron and steel gs Mt 0.99 0.87 0.85 -3.1 – nominal value A$m 820 724 689 -4.8 – real value h A$m 864 743 689 -7.3 Iron ore Mt 527.0 651.4 747.3 14.7 – nominal value A$m 57 075 74 681 56 965 -23.7 – real value h A$m 60 129 76 697 56 965 -25.7
b fob Australian basis c Spot price, 62% iron content basis. d In current calendar year US dollars. g Includes all steel items in ABS, Australian Harmonized Export Commodity Classification, chapter 72, ‘Iron and steel’, excluding ferrous waste and scrap and ferroalloys. h In current financial year Australian dollars. f forecast. s estimate. Sources: ABS; World Steel Association; UNCTAD.

Metallurgical coal Kate Penney
Metallurgical coal spot prices were relatively stable in 2014, a stark contrast to other bulk commodities, indicating a reasonably balanced market following announced mine closures. However, some operations remain unprofitable and it is likely that further closures will be announced during 2015, which may support higher prices towards the end of the year.
Prices Following a US$20 a tonne drop in the first three months of 2014, metallurgical coal spot prices were relatively stable over the remainder of 2014. Prices for low volatility hard coking coal (CFR China) were affected by surplus supply as well as relatively weak import demand and averaged around US$127 a tonne in the first eleven months of 2014, 22 per cent lower than 2013. Australian benchmark contract prices for high-quality metallurgical coal delivered in the December quarter settled at US$119 a tonne, down US$1 from the September quarter. For the year as a whole, benchmark contract prices averaged US$126 a tonne, 21 per cent lower than 2013.
Australian benchmark contract prices for high-quality metallurgical coal delivered in the March quarter 2015 are reported to have been settled at US$117 a tonne. There are a number of metallurgical coal operations around the world that are unprofitable at current prices, prompting some companies to close capacity. The closure of more than 20 million tonnes of capacity has been announced, and it is likely that further production cuts will be announced during 2015. Metallurgical coal prices are expected to remain subdued until these announced closures materialise and further capacity is closed. High quality hard coking coal contract prices are forecast to decline by 4.2 per cent to average US$120 a tonne in 2015.
110
160
210
260
310
360
Apr-11 Oct-11 Apr-12 Oct-12 Apr-13 Oct-13 Apr-14 Oct-14
US$/t
Figure 4.1:Metallurgical coal spot prices
Prem Low Vol HCC CFR Low Vol PCI CFR Semi Soft CFR
Source: Bloomberg.
100
200
300
400
1999 2003 2007 2011 2015
2014 US$/t
high quality hard coking semi-soft coking
Figure 4.2: Metallurgical coal benchmark prices, FOB Australia
Resources and Energy Quarterly, December 2014 23
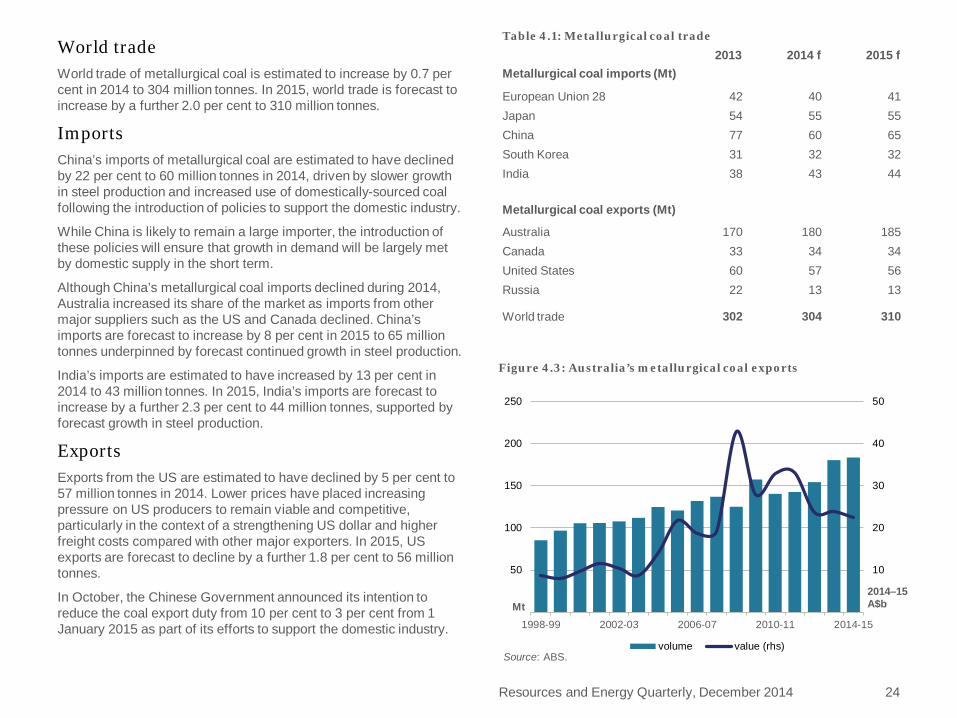
World trade World trade of metallurgical coal is estimated to increase by 0.7 per cent in 2014 to 304 million tonnes. In 2015, world trade is forecast to increase by a further 2.0 per cent to 310 million tonnes.
Imports China’s imports of metallurgical coal are estimated to have declined by 22 per cent to 60 million tonnes in 2014, driven by slower growth in steel production and increased use of domestically-sourced coal following the introduction of policies to support the domestic industry.
While China is likely to remain a large importer, the introduction of these policies will ensure that growth in demand will be largely met by domestic supply in the short term.
Although China’s metallurgical coal imports declined during 2014, Australia increased its share of the market as imports from other major suppliers such as the US and Canada declined. China’s imports are forecast to increase by 8 per cent in 2015 to 65 million tonnes underpinned by forecast continued growth in steel production.
India’s imports are estimated to have increased by 13 per cent in 2014 to 43 million tonnes. In 2015, India’s imports are forecast to increase by a further 2.3 per cent to 44 million tonnes, supported by forecast growth in steel production.
Exports Exports from the US are estimated to have declined by 5 per cent to 57 million tonnes in 2014. Lower prices have placed increasing pressure on US producers to remain viable and competitive, particularly in the context of a strengthening US dollar and higher freight costs compared with other major exporters. In 2015, US exports are forecast to decline by a further 1.8 per cent to 56 million tonnes.
In October, the Chinese Government announced its intention to reduce the coal export duty from 10 per cent to 3 per cent from 1 January 2015 as part of its efforts to support the domestic industry.
Resources and Energy Quarterly, December 2014 24
10
20
30
40
50
50
100
150
200
250
1998-99 2002-03 2006-07 2010-11 2014-15
2014–15 A$b Mt
Figure 4.3: Australia’s metallurgical coal exports
volume value (rhs)Source: ABS.
Table 4.1: Metallurgical coal trade 2013 2014 f 2015 f
Metallurgical coal imports (Mt)
European Union 28 42 40 41 Japan 54 55 55 China 77 60 65 South Korea 31 32 32 India 38 43 44
Metallurgical coal exports (Mt)
Australia 170 180 185 Canada 33 34 34 United States 60 57 56 Russia 22 13 13
World trade 302 304 310

Resources and Energy Quarterly, December 2014 25
Table 4.2: Metallurgical coal outlook unit 2012 2013 2014 f 2015 f % change
World Contract prices bc – nominal US$/t 210.0 158.5 125.5 120.3 –4.2 – real d US$/t 216.8 161.3 125.5 117.9 –6.1
2011–12 2012–13 2013–14 2014–15 f Australia Production Mt 146.9 159.5 180.7 189.2 4.7 Export volume Mt 142.4 154.2 180.5 183.5 1.7 – nominal value A$m 30 700 22 434 23 254 22 563 –3.0 – real value e A$m 33 079 23 635 23 882 22 563 –5.5
b fob Australian basis c Contract price assessment for high-quality hard coking coal. d In current calendar year US dollars. e In current financial year Australian dollars. f forecast. s estimate. Source: ABS.
While this will improve the cost competitiveness of China’s coal exports to Japan, South Korea and Chinese Taipei, it is unlikely to result in a major increase in export volumes.
Australia’s production and exports The environment of lower metallurgical coal prices has encouraged some Australian producers to close capacity. Despite a number of closures being announced during 2014, Australia’s production of metallurgical coal is forecast to increase by 4.7 per cent to 189 million tonnes in 2014-15, underpinned by recently completed projects such as Caval Ridge.
Australian producers continue to focus on cost-cutting exercises to remain competitive. For example, BHP Billiton announced that it had cut operating costs at its Queensland operations by 24 per cent. They intend to reduce costs by a further 10 per cent during the current financial year to be around US$90 a tonne.
In 2013-14, Australia’s exports of metallurgical coal increased by 17 per cent to 180.5 million tonnes. Export values increased by 3.7 per cent to $23.3 billion. In 2014-15, Australia’s exports of metallurgical coal are forecast to increase by 1.7 per cent to 183.5 million tonnes. Earnings are forecast to decline by 3.0 per cent to $22.6 billion as higher volumes and the effect of a depreciating dollar are more than offset by forecast lower prices.

Thermal coal Kate Penney
The thermal coal market was plagued by oversupply in 2014, which, coupled with weaker import demand from China, contributed to a steady decline in prices. The supply overhang is forecast to persist in 2015, keeping spot prices low.
Prices Thermal coal spot prices declined steadily during 2014 in response to surplus supply and measures implemented by the Chinese Government to support its domestic coal industry. Newcastle free on board spot prices began 2014 at around US$83 a tonne and progressively declined to around US$62 a tonne by mid-December.
The environment of sustained lower prices affected the profitability of many producers, which encouraged cost-cutting activities and mine closures during 2014. However, currency depreciation in several major producing regions such as South Africa, Indonesia and Colombia enabled some producers to remain viable and contributed to continued oversupply.
While coal consumption growth is forecast to remain strong in 2015, the global supply overhang is expected to persist and continue to keep downward pressure on prices. Benchmark prices for the Japanese Fiscal Year 2015 (JFY, April 2015 to March 2016) are forecast to settle 14 per cent lower at around US$70 a tonne.
World trade in thermal coal World thermal coal trade is estimated to have declined by 4.5 per cent to 1023 million tonnes in 2014, driven largely by lower imports into China following the introduction of trade targets. Despite the announcement of policy measures regarding coal use around the world, the relatively low-cost and reliability of coal will continue to support its use. In 2015, world trade is forecast to increase by 1.2 per cent to 1035 million tonnes.
80
100
120
140
160
180
Apr-11 Oct-11 Apr-12 Oct-12 Apr-13 Oct-13 Apr-14 Oct-14
US$/t
Figure 5.1:Thermal coal spot prices
Newcastle 6000kcal Richard's Bay 6000kcal QHD 5800kcal
Source: Bloomberg.
40
80
120
160
1999 2003 2007 2011 2015
2014 US$/t
Figure 5.2: JFY thermal coal prices
Resources and Energy Quarterly, December 2014 26

Imports China
According to the China National Coal Association, around 70 per cent of China’s coal producers are loss-making. In late 2014, the Chinese Government announced a suite of policy measures with the intention of reducing imports to support the domestic coal industry. Most of these measures are expected to have a minimal effect on total imports, with the exception of the directive to reduce coal imports by around 50 million tonnes in 2014. As part of this measure eight major state-owned utilities have been directed to reduce their imports by around 20 million tonnes between September and December with utilities that failed to comply to be penalised through a lower electricity generation quota.
China’s imports are estimated to have declined by 11 per cent to 222 million tonnes in 2014. Although China’s imports of thermal coal declined during 2014, Australia increased its market share displacing imports from other large suppliers including Indonesia and South Africa.
China’s electricity use is forecast to continue to grow in 2015 as its economy expands and household consumption increases. Around 70 gigawatts of coal-fired capacity is under construction or approved to help meet these requirements. While China’s coal use is forecast to increase in 2015, the volume of imports will be heavily influenced by policy directives. There have been reports that the Chinese Government intends to retain restrictions on imports in 2015. Given the policy uncertainty, utilities have been reluctant to enter into contracts for imported thermal coal. In 2015, China’s imports of thermal coal are forecast to increase by 3.6 per cent to 230 million tonnes, supported by increased electricity use and thermal power utilisation. If the Government introduces further coal trade targets, imports may be lower than forecast providing a downside risk to this assessment.
Resources and Energy Quarterly, December 2014 27
10
20
30
40
50
60
70
80
Jun-10 Mar-11 Dec-11 Sep-12 Jun-13 Mar-14
Mt
Figure 5.4: China’s quarterly coal imports by source
Indonesia Australia OtherSource: McCloskey.
300
600
900
1200
1500
Jun-10 Mar-11 Dec-11 Sep-12 Jun-13 Mar-14
Billion kWh
Figure 5.3: China’s quarterly electricity generation
thermal hydro nuclear windSource: CEIC.
India
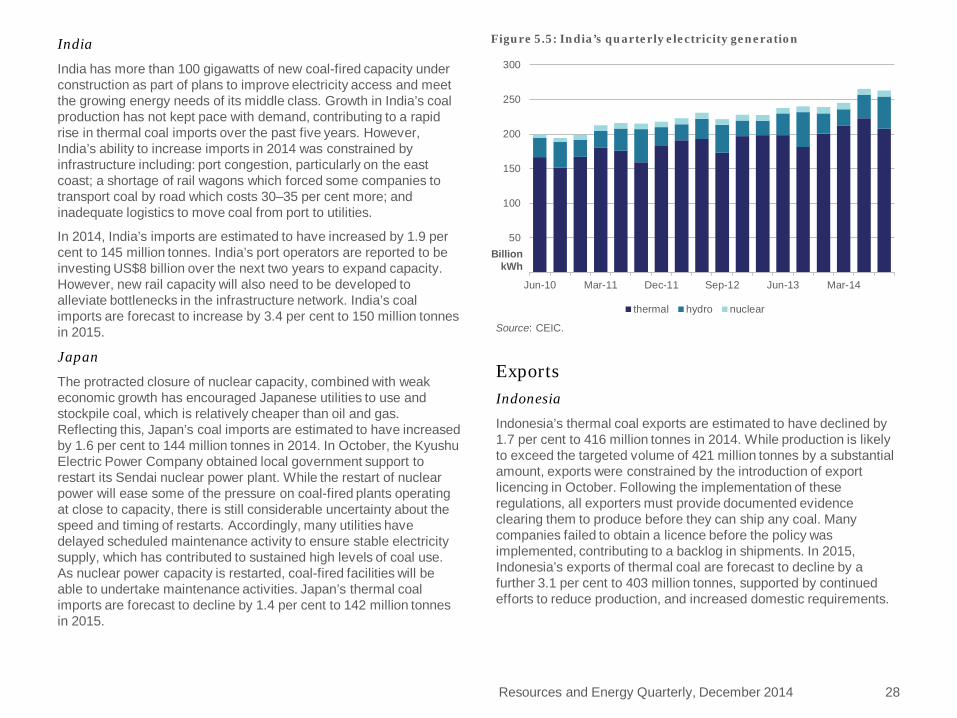
India has more than 100 gigawatts of new coal-fired capacity under construction as part of plans to improve electricity access and meet the growing energy needs of its middle class. Growth in India’s coal production has not kept pace with demand, contributing to a rapid rise in thermal coal imports over the past five years. However, India’s ability to increase imports in 2014 was constrained by infrastructure including: port congestion, particularly on the east coast; a shortage of rail wagons which forced some companies to transport coal by road which costs 30–35 per cent more; and inadequate logistics to move coal from port to utilities.
In 2014, India’s imports are estimated to have increased by 1.9 per cent to 145 million tonnes. India’s port operators are reported to be investing US$8 billion over the next two years to expand capacity. However, new rail capacity will also need to be developed to alleviate bottlenecks in the infrastructure network. India’s coal imports are forecast to increase by 3.4 per cent to 150 million tonnes in 2015.
Japan
The protracted closure of nuclear capacity, combined with weak economic growth has encouraged Japanese utilities to use and stockpile coal, which is relatively cheaper than oil and gas. Reflecting this, Japan’s coal imports are estimated to have increased by 1.6 per cent to 144 million tonnes in 2014. In October, the Kyushu Electric Power Company obtained local government support to restart its Sendai nuclear power plant. While the restart of nuclear power will ease some of the pressure on coal-fired plants operating at close to capacity, there is still considerable uncertainty about the speed and timing of restarts. Accordingly, many utilities have delayed scheduled maintenance activity to ensure stable electricity supply, which has contributed to sustained high levels of coal use. As nuclear power capacity is restarted, coal-fired facilities will be able to undertake maintenance activities. Japan’s thermal coal imports are forecast to decline by 1.4 per cent to 142 million tonnes in 2015.
Resources and Energy Quarterly, December 2014 28
Exports Indonesia
Indonesia’s thermal coal exports are estimated to have declined by 1.7 per cent to 416 million tonnes in 2014. While production is likely to exceed the targeted volume of 421 million tonnes by a substantial amount, exports were constrained by the introduction of export licencing in October. Following the implementation of these regulations, all exporters must provide documented evidence clearing them to produce before they can ship any coal. Many companies failed to obtain a licence before the policy was implemented, contributing to a backlog in shipments. In 2015, Indonesia’s exports of thermal coal are forecast to decline by a further 3.1 per cent to 403 million tonnes, supported by continued efforts to reduce production, and increased domestic requirements.
50
100
150
200
250
300
Jun-10 Mar-11 Dec-11 Sep-12 Jun-13 Mar-14
Billion kWh
Figure 5.5: India’s quarterly electricity generation
thermal hydro nuclear
Source: CEIC.
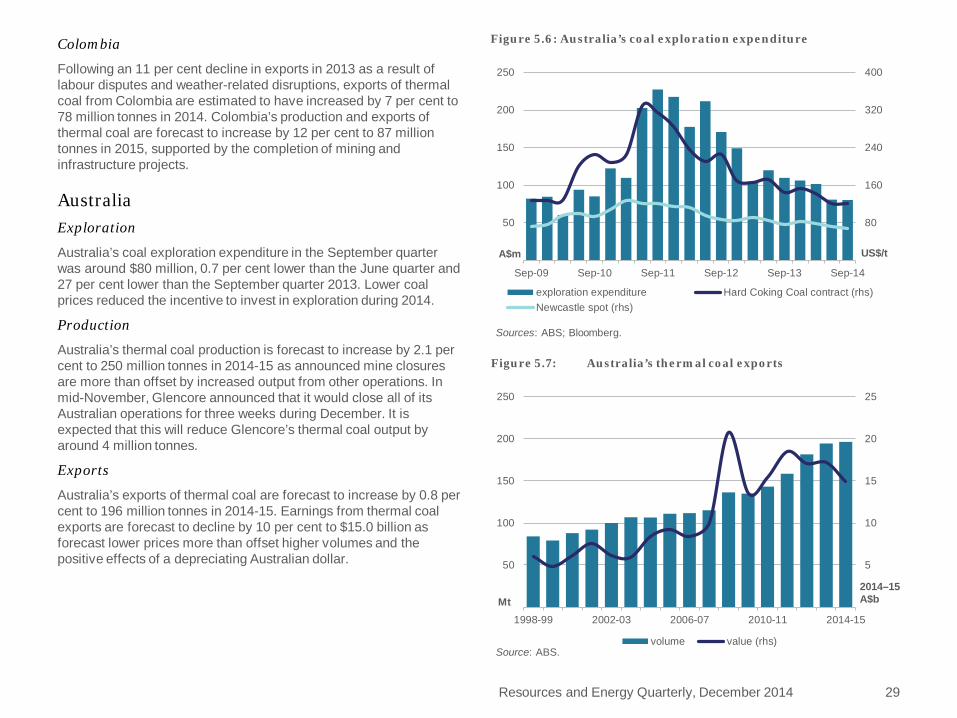
Colombia
Following an 11 per cent decline in exports in 2013 as a result of labour disputes and weather-related disruptions, exports of thermal coal from Colombia are estimated to have increased by 7 per cent to 78 million tonnes in 2014. Colombia’s production and exports of thermal coal are forecast to increase by 12 per cent to 87 million tonnes in 2015, supported by the completion of mining and infrastructure projects.
Australia Exploration
Australia’s coal exploration expenditure in the September quarter was around $80 million, 0.7 per cent lower than the June quarter and 27 per cent lower than the September quarter 2013. Lower coal prices reduced the incentive to invest in exploration during 2014.
Production
Australia’s thermal coal production is forecast to increase by 2.1 per cent to 250 million tonnes in 2014-15 as announced mine closures are more than offset by increased output from other operations. In mid-November, Glencore announced that it would close all of its Australian operations for three weeks during December. It is expected that this will reduce Glencore’s thermal coal output by around 4 million tonnes.
Exports
Australia’s exports of thermal coal are forecast to increase by 0.8 per cent to 196 million tonnes in 2014-15. Earnings from thermal coal exports are forecast to decline by 10 per cent to $15.0 billion as forecast lower prices more than offset higher volumes and the positive effects of a depreciating Australian dollar.
Resources and Energy Quarterly, December 2014 29
80
160
240
320
400
50
100
150
200
250
Sep-09 Sep-10 Sep-11 Sep-12 Sep-13 Sep-14
US$/t A$m
Figure 5.6: Australia’s coal exploration expenditure
exploration expenditure Hard Coking Coal contract (rhs)Newcastle spot (rhs)
Sources: ABS; Bloomberg.
5
10
15
20
25
50
100
150
200
250
1998-99 2002-03 2006-07 2010-11 2014-15
2014–15 A$b Mt
Figure 5.7: Australia’s thermal coal exports
volume value (rhs)Source: ABS.

Resources and Energy Quarterly, December 2014 30
b Japanese Fiscal Year (JFY), starting April 1, fob Australia basis. Australia–Japan average contract price assessment for steaming coal with a calorific value of 6700 kcal/kg gross air dried. c In current JFY US dollars. d In current financial year Australian dollars. f forecast. Sources: ABS; IEA; Coal Services Pty Ltd; Queensland Department of Natural Resources and Mines.
Table 5.1: Thermal coal outlook unit 2012 2013 2014 f 2015 f % change
World Contract prices b – nominal US$/t 115 95 82 70 –14.4 – real c US$/t 119 97 82 69 –16.1 Coal trade Mt 1 031 1 072 1 023 1 035 1.2 Imports Asia Mt 717 762 740 754 1.9
China Mt 235 250 222 230 3.6 Chinese Taipei Mt 59 61 62 63 1.6 India Mt 129 142 145 150 3.4 Japan Mt 132 142 144 142 –1.4 South Korea Mt 93 95 98 99 1.0
Europe Mt 235 229 206 207 0.2 European Union 27 Mt 187 184 159 157 –1.2 other Europe Mt 48 45 48 50 4.8
Exports Australia Mt 171 188 191 198 3.7 Colombia Mt 82 73 78 87 11.5 Indonesia Mt 384 423 416 403 –3.1 Russia Mt 113 117 108 105 –2.8 South Africa Mt 75 72 73 75 2.7 United States Mt 51 47 34 32 –5.9
2011–12 2012–13 2013–14 2014–15 f Australia Production Mt 215.9 238.9 245.1 250.1 2.1 Export volume Mt 158.4 181.7 194.6 196.2 0.8 – nominal value A$m 17 118 16 169 16 705 14 968 –10.4 – real value d A$m 18 445 17 035 17 156 14 968 –12.8
Gas Tom Willcock
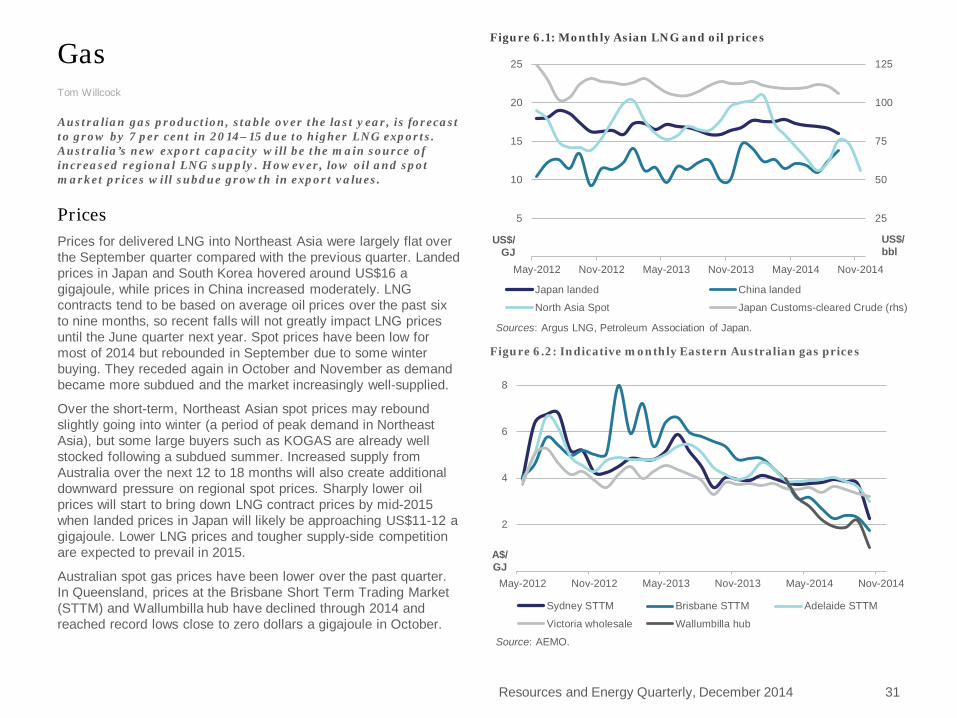
Australian gas production, stable over the last year, is forecast to grow by 7 per cent in 2014–15 due to higher LNG exports. Australia’s new export capacity will be the main source of increased regional LNG supply. However, low oil and spot market prices will subdue growth in export values.
Prices Prices for delivered LNG into Northeast Asia were largely flat over the September quarter compared with the previous quarter. Landed prices in Japan and South Korea hovered around US$16 a gigajoule, while prices in China increased moderately. LNG contracts tend to be based on average oil prices over the past six to nine months, so recent falls will not greatly impact LNG prices until the June quarter next year. Spot prices have been low for most of 2014 but rebounded in September due to some winter buying. They receded again in October and November as demand became more subdued and the market increasingly well-supplied.
Over the short-term, Northeast Asian spot prices may rebound slightly going into winter (a period of peak demand in Northeast Asia), but some large buyers such as KOGAS are already well stocked following a subdued summer. Increased supply from Australia over the next 12 to 18 months will also create additional downward pressure on regional spot prices. Sharply lower oil prices will start to bring down LNG contract prices by mid-2015 when landed prices in Japan will likely be approaching US$11-12 a gigajoule. Lower LNG prices and tougher supply-side competition are expected to prevail in 2015.
Australian spot gas prices have been lower over the past quarter. In Queensland, prices at the Brisbane Short Term Trading Market (STTM) and Wallumbilla hub have declined through 2014 and reached record lows close to zero dollars a gigajoule in October.
Resources and Energy Quarterly, December 2014 31
25
50
75
100
125
5
10
15
20
25
May-2012 Nov-2012 May-2013 Nov-2013 May-2014 Nov-2014
US$/ bbl
US$/ GJ
Japan landed China landed
North Asia Spot Japan Customs-cleared Crude (rhs)
Figure 6.1: Monthly Asian LNG and oil prices
Sources: Argus LNG, Petroleum Association of Japan.
2
4
6
8
May-2012 Nov-2012 May-2013 Nov-2013 May-2014 Nov-2014
A$/ GJ
Sydney STTM Brisbane STTM Adelaide STTM
Victoria wholesale Wallumbilla hub
Figure 6.2: Indicative monthly Eastern Australian gas prices
Source: AEMO.

The ramp up in CSG production in advance of the start of LNG exports from Gladstone has resulted in large volumes of uncontracted gas driving down domestic prices. The impact of this gas is also being felt in Sydney, where the STTM price is down sharply, and to a lesser extent in Adelaide and Victoria. Domestic spot gas prices are expected to remain low in the near term as LNG projects continue to provide increased supplies to the Eastern market with during their ramp up period.
Global LNG developments Total LNG imports by Australia’s main trading partners increased slightly in the September quarter. Japan and China, the destinations for around 95 per cent of Australia’s LNG exports, both imported more than in the June quarter. Low spot prices and increased winter demand are expected to result in December and March quarter imports to those countries continuing to increase. This is not expected to be the case in South Korea where high inventory levels following a mild summer will likely result in lower imports than last winter.
After four relatively flat years, global LNG imports are expected to increase more rapidly in 2015. Additional supply and lower prices will ease market tightness and are expected to be the main drivers of import growth in a number of regions. Low spot prices are expected to be particularly important in increasing European, Middle Eastern and South American imports. Increased regasification capacity will support greater imports into Southeast Asia and China, where growing energy demand and more competitive LNG prices will also result in increasing gas use. Total Asian LNG imports are forecast to grow from an estimated 182 million tonnes in 2014 to 188 million tonnes in 2015.
Effective global liquefaction capacity was around 245 million tonnes in 2014, unchanged from 2013. The only new project to have started by mid December was PNG LNG which offset declines in Africa. LNG capacity is forecast to grow to 258 million tonnes in 2015 as new Australian projects are completed. Some LNG supply capacity is also expected to return when Soyo LNG in Angola overcomes recent challenges and begins operating again.
Resources and Energy Quarterly, December 2014 32
50
100
150
200
250
300
2009 2010 2011 2012 2013 2014 2015
Mt
Japan South Korea China Rest of Asia Europe Rest of the World
Figure 6.4: Global LNG imports
Sources: Nexant and IEA.
50
100
150
200
250
300
2009 2010 2011 2012 2013 2014 2015
Mt
Australia Middle East Africa S.E. Asia Rest of the World
Figure 6.3: Global LNG supply capacity
Note: Includes allowances for plant downtime and maintenance. Source: Nexant.
Australia Production
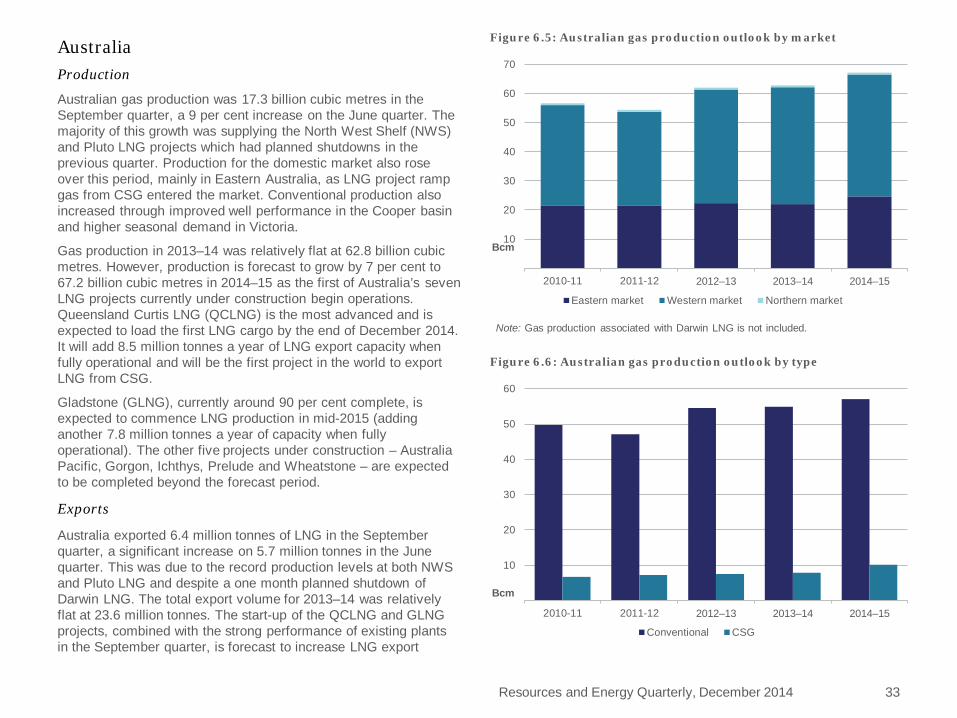
Australian gas production was 17.3 billion cubic metres in the September quarter, a 9 per cent increase on the June quarter. The majority of this growth was supplying the North West Shelf (NWS) and Pluto LNG projects which had planned shutdowns in the previous quarter. Production for the domestic market also rose over this period, mainly in Eastern Australia, as LNG project ramp gas from CSG entered the market. Conventional production also increased through improved well performance in the Cooper basin and higher seasonal demand in Victoria.
Gas production in 2013–14 was relatively flat at 62.8 billion cubic metres. However, production is forecast to grow by 7 per cent to 67.2 billion cubic metres in 2014–15 as the first of Australia’s seven LNG projects currently under construction begin operations. Queensland Curtis LNG (QCLNG) is the most advanced and is expected to load the first LNG cargo by the end of December 2014. It will add 8.5 million tonnes a year of LNG export capacity when fully operational and will be the first project in the world to export LNG from CSG.
Gladstone (GLNG), currently around 90 per cent complete, is expected to commence LNG production in mid-2015 (adding another 7.8 million tonnes a year of capacity when fully operational). The other five projects under construction – Australia Pacific, Gorgon, Ichthys, Prelude and Wheatstone – are expected to be completed beyond the forecast period.
Exports
Australia exported 6.4 million tonnes of LNG in the September quarter, a significant increase on 5.7 million tonnes in the June quarter. This was due to the record production levels at both NWS and Pluto LNG and despite a one month planned shutdown of Darwin LNG. The total export volume for 2013–14 was relatively flat at 23.6 million tonnes. The start-up of the QCLNG and GLNG projects, combined with the strong performance of existing plants in the September quarter, is forecast to increase LNG export
Resources and Energy Quarterly, December 2014 33
10
20
30
40
50
60
70
2010-11 2011-12 2012–13 2013–14 2014–15
Bcm
Eastern market Western market Northern market
Figure 6.5: Australian gas production outlook by market
Note: Gas production associated with Darwin LNG is not included.
10
20
30
40
50
60
2010-11 2011-12 2012–13 2013–14 2014–15
Bcm
Conventional CSG
Figure 6.6: Australian gas production outlook by type

volumes by 11 per cent in 2014–15, to 26.2 million tonnes.
LNG export values rose in the September quarter to $4.6 billion, from $4.4 billion in the June quarter. This was mainly due to increased volumes and the depreciating Australian dollar as prices were reasonably flat. Likewise, annual LNG export values are forecast to continue growing, from $16.3 billion in 2013–14 to $17.6 billion in 2014–15. This expected 8 per cent growth in nominal export values in 2014–15 will be due to increased volumes and the depreciating Australian dollar. Recent falls in the oil price will have a negative impact on LNG export values but will not be fully felt until mid-2015 due to the lagged oil price link in most Australian LNG contracts.
Resources and Energy Quarterly, December 2014 34
Table 6.1: Gas outlook unit 2012–13 2013–14 2014–15 f % change
Australia Production a Bcm 62.1 62.8 67.2 7.0 – Eastern market Bcm 22.4 22.0 24.7 12.1 – Western market Bcm 39.0 40.1 41.8 4.3 – Northern market Bcm 0.7 0.7 0.7 1.9 LNG export volume Mt c 23.8 23.6 26.2 11.2 – nominal value A$m 14 271 16 305 17 568 7.8 – real value b A$m 15 034 16 745 17 568 4.9
0
4
8
12
16
20
24
5
10
15
20
25
30
2004-05 2006-07 2008-09 2010-11 2012-13 2014-15
2014-15 $Ab Mt
Volume Value (rhs)
Figure 6.7: Australian LNG exports
a Production includes both sales gas and gas used in the production process (i.e. plant use). b In current financial year Australian dollars. c 1 million tonnes of LNG is equivalent to approximately 1.36 billion cubic metres of gas. f forecast. Sources: ABS, Company reports and World Bank.
Oil Kieran Bernie
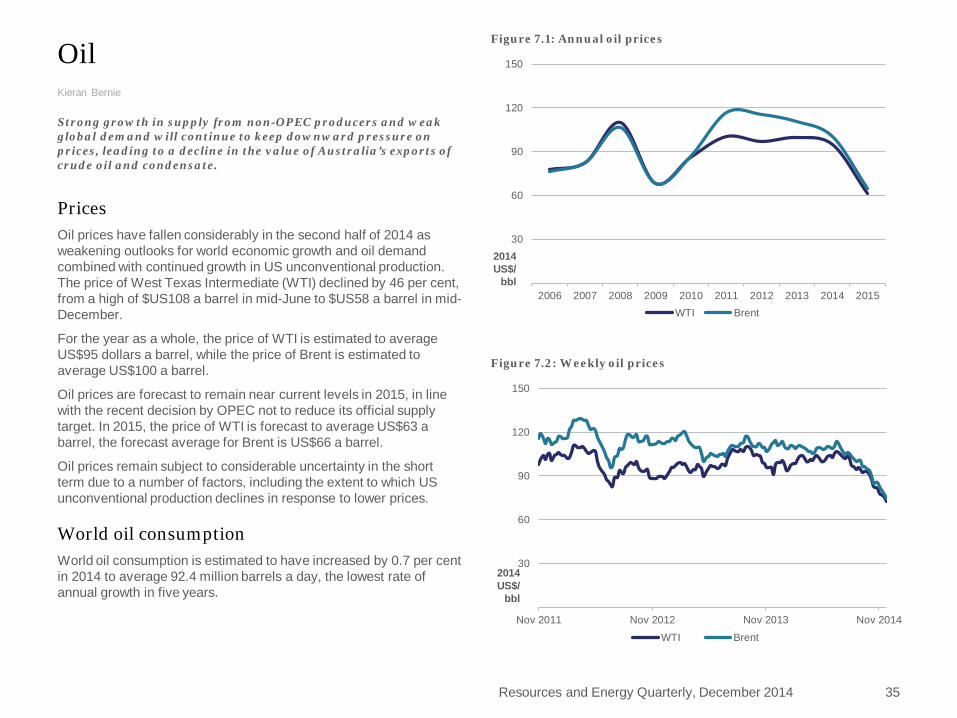
Strong growth in supply from non-OPEC producers and weak global demand will continue to keep downward pressure on prices, leading to a decline in the value of Australia’s exports of crude oil and condensate.
Prices Oil prices have fallen considerably in the second half of 2014 as weakening outlooks for world economic growth and oil demand combined with continued growth in US unconventional production. The price of West Texas Intermediate (WTI) declined by 46 per cent, from a high of $US108 a barrel in mid-June to $US58 a barrel in mid-December.
For the year as a whole, the price of WTI is estimated to average US$95 dollars a barrel, while the price of Brent is estimated to average US$100 a barrel.
Oil prices are forecast to remain near current levels in 2015, in line with the recent decision by OPEC not to reduce its official supply target. In 2015, the price of WTI is forecast to average US$63 a barrel, the forecast average for Brent is US$66 a barrel.
Oil prices remain subject to considerable uncertainty in the short term due to a number of factors, including the extent to which US unconventional production declines in response to lower prices.
World oil consumption World oil consumption is estimated to have increased by 0.7 per cent in 2014 to average 92.4 million barrels a day, the lowest rate of annual growth in five years.
Resources and Energy Quarterly, December 2014 35
30
60
90
120
150
2006 2007 2008 2009 2010 2011 2012 2013 2014 2015
Figure 7.1: Annual oil prices
WTI Brent
2014 US$/
bbl
30
60
90
120
150
Nov 2011 Nov 2012 Nov 2013 Nov 2014
Figure 7.2: Weekly oil prices
WTI Brent
2014 US$/
bbl

The slower rate of growth is a result of large absolute declines in consumption by Asian and European OECD economies, particularly Japan, and relatively weak demand growth in China. OECD consumption is estimated to decline by 0.9 per cent in 2014, to 45.6 barrels a day.
World oil consumption is forecast to increase by 1.2 per cent (1.1 million barrels a day) in 2015, reaching an average of 93.6 million barrels a day in line with improving global economic conditions.
Net growth will be driven by continued increases in consumption by non-OECD economies and smaller declines in consumption by OECD economies. Increases in non-OECD consumption will continue to be concentrated in Asian and Middle Eastern economies; notably China and India, which together, are forecast to consume an additional 380 thousand barrels a day in 2015.
World oil production Despite ongoing conflicts and sanctions affecting major suppliers, world oil production is estimated to have increased by 1.9 per cent in 2014, to average 93.1 million barrels a day.
The growth is the product of strong increases in supply from non-OPEC producers; particularly the United States, where unconventional oil production is contributing to record levels of output. Supply from non-OPEC producers now accounts for 61 per cent of global production.
OPEC production is estimated to decline by 0.2 per cent in 2014 to average 36.6 million barrels a day, with lower Libyan production outweighing increased production from Iraq and Iran.
World oil production is forecast to increase by 2.0 per cent in 2015, to reach an average of 94.9 million barrels a day. Continued growth in non-OPEC output is expected to provide most of this increase, with US production contributing almost half of the forecast growth.
Resources and Energy Quarterly, December 2014 36
-2
-1
0
1
2
3
2006 2007 2008 2009 2010 2011 2012 2013 2014 2015
mb/d
Figure 7.3: Growth in world oil consumption
OECD Non-OECD Total
Source: Department of Industry; IEA.
-2
-1
0
1
2
3
2006 2007 2008 2009 2010 2011 2012 2013 2014 2015
mb/d
Figure 7.4: Growth in world oil production
OPEC Non-OPEC Total
Source: IEA.

Resources and Energy Quarterly, December 2014 37
Australia’s production and exports Australia produced 352 thousand barrels of crude oil and condensate a day in the September quarter 2014; including 10 thousand barrels of crude oil from the new Balnaves project in the Carnarvon Basin. The restart of the Vincent oil field and higher output from the Gippsland Basin also contributed to higher production, offsetting lower output from the Fletcher-Finucane project, which was offline for part of the quarter.
Production is forecast to increase to an average of 381 thousand barrels a day in 2014-15, as additional output from the new Balnaves and Coniston projects will outweigh declining production from mature fields.
Exports of crude oil and condensate averaged 290 thousand barrels a day in the September quarter, 6.7 per cent higher than this time last year. Forecast exports for 2014-15 as a whole are slightly lower, at 280 thousand barrels a day, but still represent a 10 per cent increase over 2013-14.
The increase is consistent with higher production from fields in north-west Australia, which are the source most of Australia’s exports due to their proximity to regional trading hubs in Asia.
Despite higher export volumes, the value of Australia’s exports of crude oil and condensate are expected to fall in 2014-15. Export earnings are forecast to fall by $687 million, to $10.4 billion, as the effect of markedly lower prices should offset higher volumes and an assumed depreciation of the Australian dollar.
Production of refined products is forecast to decline considerably in in 2014-15. Output is forecast to decline by 25 per cent to 444 thousand barrels a day in line with the ceasation of refining activities at the Kurnell (October 2014) and Bulwer Island (by mid-2015) facilities.
As a result, Australia’s imports of refined products are forecast to increase sharply, from 423 thousand barrels a day in 2013-14, to 611 thousand barrels a day in 2014-15.
2
4
6
8
10
2001 2003 2005 2007 2009 2011 2013 2015mb/d
Figure 7.5: US production of crude oil
Tight oil Conventional
Note: Does not include condensate or NGLs Source: EIA.
100
200
300
400
500
600
2006-07 2008-09 2010-11 2012-13 2014-15
Crude oil Condensate LPG
kbd
Figure 7.6: Australian petroleum production

Resources and Energy Quarterly, December 2014 38
25
50
75
100
125
0.4
0.8
1.2
1.6
2.0
Sep-09 Sep-10 Sep-11 Sep-12 Sep-13 Sep-14
Expenditure WTI (rhs)
A$b US$/bbl
Source: ABS.
Figure 7.8: Australian petroleum exploration expenditure
3
6
9
12
15
100
200
300
400
500
1998-99 2002-03 2006-07 2010-11 2014-15
Volume Value (right axis)
kbd 2014-15 A$b
Figure 7.7: Australian crude oil and condensate exports
Source: ABS.

Table 7.1: Oil outlook Unit 2012 2013 2014 f 2015 f % change
World Production b Mbd 90.9 91.4 93.1 94.9 2.0 Consumption b Mbd 90.6 91.8 92.4 93.6 1.2 WTI crude oil price – nominal US$/bbl 94.1 97.8 94.7 62.6 –33.8 – real c US$/bbl 97.2 99.5 94.7 61.4 –35.1 Brent crude oil price – nominal US$/bbl 111.6 108.7 100.4 65.9 –34.4 – real c US$/bbl 115.3 110.6 100.4 64.6 –35.7
2011–12 2012–13 2013–14 2014–15 f % change Australia Crude oil and condensate Production b kbd 415 366 352 381 8.3 Export volume b kbd 300 272 255 280 9.8 – nominal value A$m 11 962 10 447 11 118 10 431 –6.2 – real value d A$m 12 889 11 006 11 418 10 431 –8.6 Imports b kbd 508 516 488 439 –10.1 LPG Production be kbd 66 61 66 76 15.0 Export volume b kbd 36 41 42 48 12.4 – nominal value A$m 971 1 088 1 265 1 252 –1.1 – real value d A$m 1 047 1 146 1 299 1 252 –3.7 Petroleum products Refinery production b kbd 655 636 589 444 –24.7 Exports bg kbd 20 16 11 10 –12.2 Imports b kbd 382 408 423 611 44.4 Consumption bh kbd 926 945 944 981 4.0
Resources and Energy Quarterly, December 2014 39
b Number of days in a year is assumed to be exactly 365. A barrel of oil equals 158.987 litres. c In current calendar year US dollars. d In current financial year Australian dollars. e Primary products sold as LPG. g Excludes LPG. h Domestic sales of marketable products. f forecast. Sources: ABS; IEA; Energy Information Administration (US Department of Energy); Geoscience Australia.
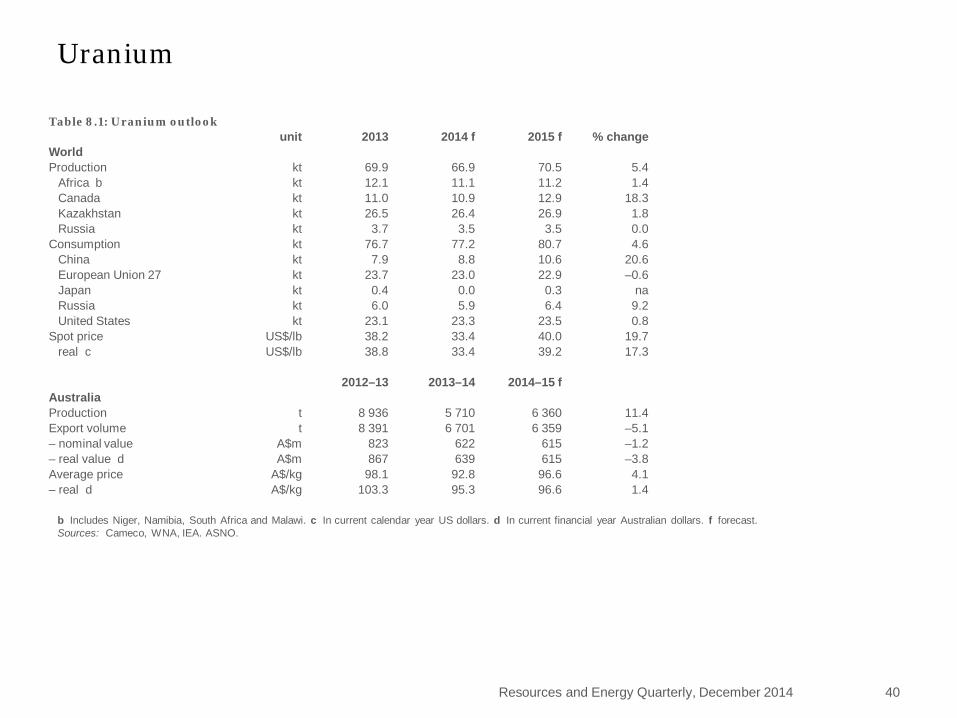
Table 8.1: Uranium outlook unit 2013 2014 f 2015 f % change
World Production kt 69.9 66.9 70.5 5.4
Africa b kt 12.1 11.1 11.2 1.4 Canada kt 11.0 10.9 12.9 18.3 Kazakhstan kt 26.5 26.4 26.9 1.8 Russia kt 3.7 3.5 3.5 0.0
Consumption kt 76.7 77.2 80.7 4.6 China kt 7.9 8.8 10.6 20.6 European Union 27 kt 23.7 23.0 22.9 –0.6 Japan kt 0.4 0.0 0.3 na Russia kt 6.0 5.9 6.4 9.2 United States kt 23.1 23.3 23.5 0.8
Spot price US$/lb 38.2 33.4 40.0 19.7 real c US$/lb 38.8 33.4 39.2 17.3
2012–13 2013–14 2014–15 f
Australia Production t 8 936 5 710 6 360 11.4 Export volume t 8 391 6 701 6 359 –5.1 – nominal value A$m 823 622 615 –1.2 – real value d A$m 867 639 615 –3.8 Average price A$/kg 98.1 92.8 96.6 4.1 – real d A$/kg 103.3 95.3 96.6 1.4
Resources and Energy Quarterly, December 2014 40
b Includes Niger, Namibia, South Africa and Malawi. c In current calendar year US dollars. d In current financial year Australian dollars. f forecast. Sources: Cameco, WNA, IEA. ASNO.
Uranium

Gold John Barber
Lacklustre jewellery demand and falling investor purchases of physical gold have placed downwards pressure on gold prices throughout most of 2014. In 2015, further falls are forecast as US monetary policy begins to step towards normal settings with the US Federal Reserve expected to raise interest rates at some point in the year.
Prices Gold prices continued to come under pressure from falling investor demand in the second half of 2014. A stream of positive US economic data that supports the case for higher interest rates at some point in 2015 and the end of the Federal Reserve’s QE3 bond purchases have led many investors to move away from gold in 2014. According to the World Gold Council, jewellery purchases have also moderated in 2014, despite lower gold prices, and placed further downward pressure on prices. In 2014 gold prices are estimated to average around US$1267 an ounce, down 10 per cent relative to 2013. In 2015 gold prices are forecast to decline a further 7 per cent and to average US$1178 an ounce with further falls in investment demand more than offsetting forecast moderate growth in physical consumption.
Consumption World gold demand is estimated to have declined marginally in 2014 as a result of substantially lower gold bar investment and moderately lower jewellery purchases. World Gold Council data indicates that in the first three quarters of 2014 world jewellery purchases declined 10 per cent and gold bar and coin purchases were down 44 per cent. Reduced purchases in China was the main driver of lower demand, with jewellery purchases and bar and coin investment in the September quarter down 41 per cent and 32 per cent, respectively.
0.0
1.0
2.0
3.0
4.0
5.0400
800
1200
1600
2000
Jul–08 Jul–09 Jul–10 Jul–11 Jul–12 Jul–13 Jul–14
Bond Rate %
US$ /oz
Figure 9.1: Daily gold prices
Gold price (AM fix) US 10yr bond rate
Sources: LBMA; US Federal Reserve.
400
800
1200
1600
2000
1999 2001 2003 2005 2007 2009 2011 2013 2015
2014 US$/oz
Figure 9.2: Quarterly gold prices
Source: LBMA.
Resources and Energy Quarterly, December 2014 41
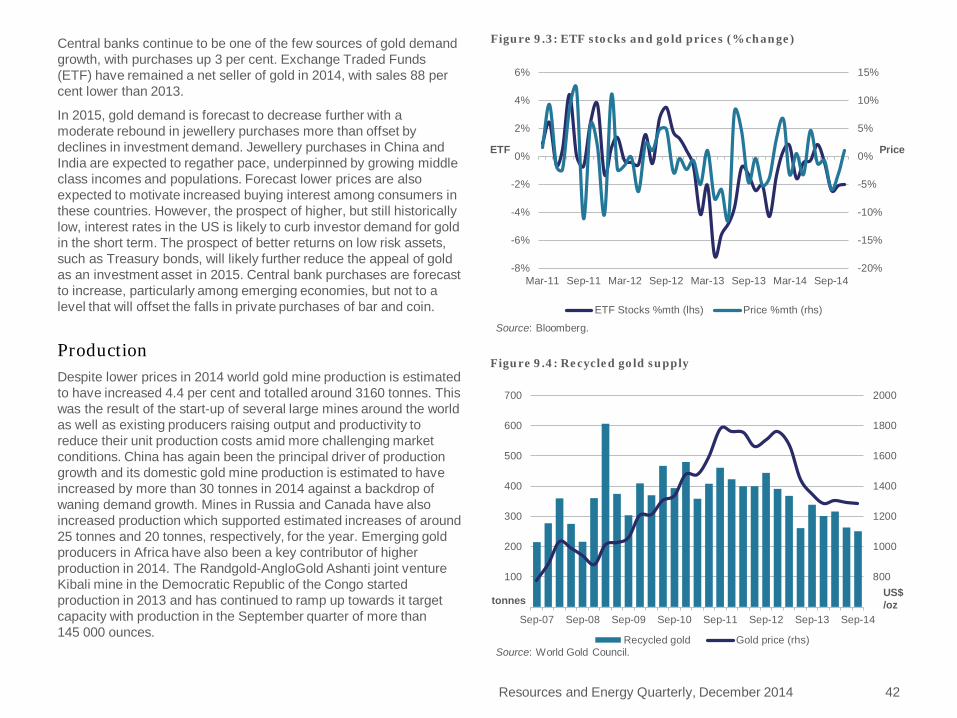
Central banks continue to be one of the few sources of gold demand growth, with purchases up 3 per cent. Exchange Traded Funds (ETF) have remained a net seller of gold in 2014, with sales 88 per cent lower than 2013.
In 2015, gold demand is forecast to decrease further with a moderate rebound in jewellery purchases more than offset by declines in investment demand. Jewellery purchases in China and India are expected to regather pace, underpinned by growing middle class incomes and populations. Forecast lower prices are also expected to motivate increased buying interest among consumers in these countries. However, the prospect of higher, but still historically low, interest rates in the US is likely to curb investor demand for gold in the short term. The prospect of better returns on low risk assets, such as Treasury bonds, will likely further reduce the appeal of gold as an investment asset in 2015. Central bank purchases are forecast to increase, particularly among emerging economies, but not to a level that will offset the falls in private purchases of bar and coin.
Production Despite lower prices in 2014 world gold mine production is estimated to have increased 4.4 per cent and totalled around 3160 tonnes. This was the result of the start-up of several large mines around the world as well as existing producers raising output and productivity to reduce their unit production costs amid more challenging market conditions. China has again been the principal driver of production growth and its domestic gold mine production is estimated to have increased by more than 30 tonnes in 2014 against a backdrop of waning demand growth. Mines in Russia and Canada have also increased production which supported estimated increases of around 25 tonnes and 20 tonnes, respectively, for the year. Emerging gold producers in Africa have also been a key contributor of higher production in 2014. The Randgold-AngloGold Ashanti joint venture Kibali mine in the Democratic Republic of the Congo started production in 2013 and has continued to ramp up towards it target capacity with production in the September quarter of more than 145 000 ounces.
Resources and Energy Quarterly, December 2014 42
-20%
-15%
-10%
-5%
0%
5%
10%
15%
-8%
-6%
-4%
-2%
0%
2%
4%
6%
Mar-11 Sep-11 Mar-12 Sep-12 Mar-13 Sep-13 Mar-14 Sep-14
Price ETF
Figure 9.3: ETF stocks and gold prices (% change)
ETF Stocks %mth (lhs) Price %mth (rhs)
Source: Bloomberg.
800
1000
1200
1400
1600
1800
2000
100
200
300
400
500
600
700
Sep-07 Sep-08 Sep-09 Sep-10 Sep-11 Sep-12 Sep-13 Sep-14
US$ /oz tonnes
Figure 9.4: Recycled gold supply
Recycled gold Gold price (rhs)Source: World Gold Council.
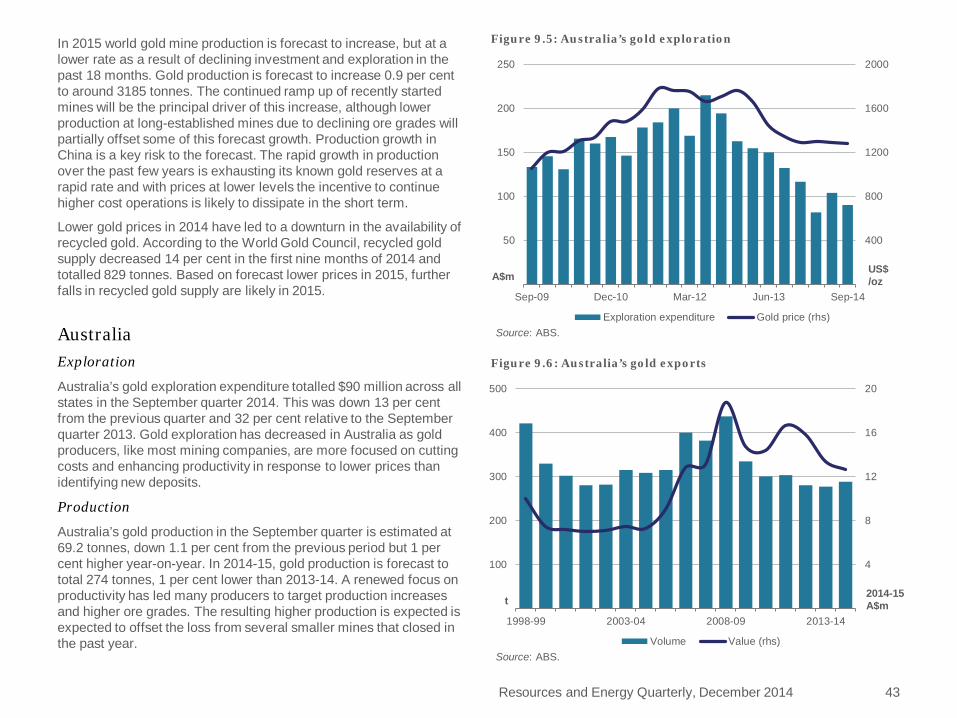
Resources and Energy Quarterly, December 2014 43
In 2015 world gold mine production is forecast to increase, but at a lower rate as a result of declining investment and exploration in the past 18 months. Gold production is forecast to increase 0.9 per cent to around 3185 tonnes. The continued ramp up of recently started mines will be the principal driver of this increase, although lower production at long-established mines due to declining ore grades will partially offset some of this forecast growth. Production growth in China is a key risk to the forecast. The rapid growth in production over the past few years is exhausting its known gold reserves at a rapid rate and with prices at lower levels the incentive to continue higher cost operations is likely to dissipate in the short term.
Lower gold prices in 2014 have led to a downturn in the availability of recycled gold. According to the World Gold Council, recycled gold supply decreased 14 per cent in the first nine months of 2014 and totalled 829 tonnes. Based on forecast lower prices in 2015, further falls in recycled gold supply are likely in 2015.
Australia Exploration
Australia’s gold exploration expenditure totalled $90 million across all states in the September quarter 2014. This was down 13 per cent from the previous quarter and 32 per cent relative to the September quarter 2013. Gold exploration has decreased in Australia as gold producers, like most mining companies, are more focused on cutting costs and enhancing productivity in response to lower prices than identifying new deposits.
Production
Australia’s gold production in the September quarter is estimated at 69.2 tonnes, down 1.1 per cent from the previous period but 1 per cent higher year-on-year. In 2014-15, gold production is forecast to total 274 tonnes, 1 per cent lower than 2013-14. A renewed focus on productivity has led many producers to target production increases and higher ore grades. The resulting higher production is expected is expected to offset the loss from several smaller mines that closed in the past year.
400
800
1200
1600
2000
50
100
150
200
250
Sep-09 Dec-10 Mar-12 Jun-13 Sep-14
US$ /oz A$m
Figure 9.5: Australia’s gold exploration
Exploration expenditure Gold price (rhs)Source: ABS.
4
8
12
16
20
100
200
300
400
500
1998-99 2003-04 2008-09 2013-14
2014-15 A$m t
Figure 9.6: Australia’s gold exports
Volume Value (rhs)Source: ABS.
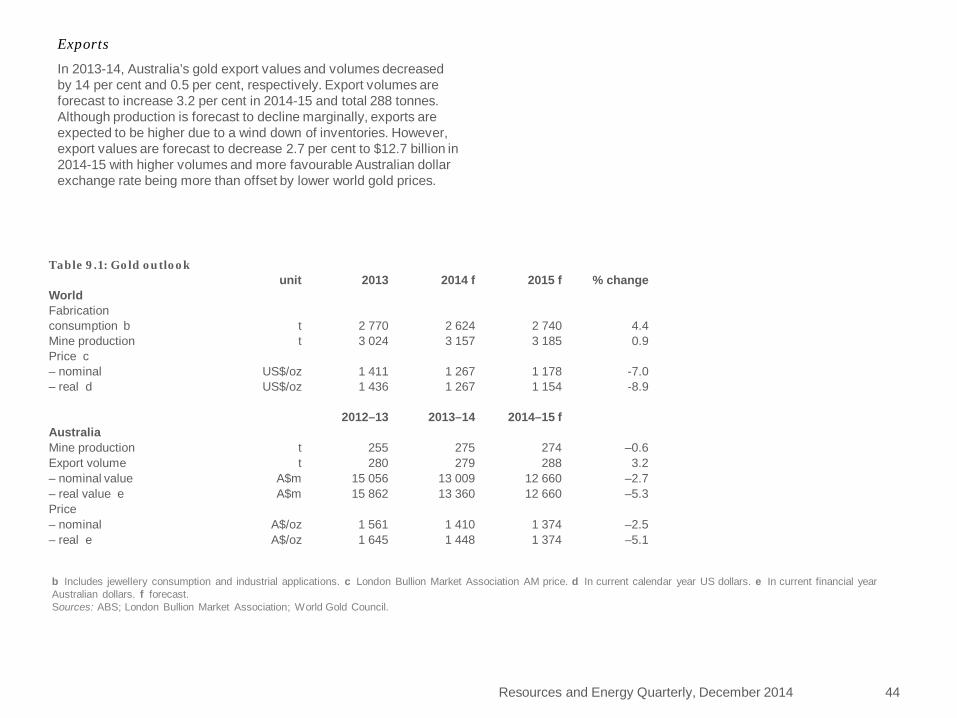
Resources and Energy Quarterly, December 2014 44
Exports
In 2013-14, Australia’s gold export values and volumes decreased by 14 per cent and 0.5 per cent, respectively. Export volumes are forecast to increase 3.2 per cent in 2014-15 and total 288 tonnes. Although production is forecast to decline marginally, exports are expected to be higher due to a wind down of inventories. However, export values are forecast to decrease 2.7 per cent to $12.7 billion in 2014-15 with higher volumes and more favourable Australian dollar exchange rate being more than offset by lower world gold prices.
Table 9.1: Gold outlook unit 2013 2014 f 2015 f % change
World Fabrication consumption b t 2 770 2 624 2 740 4.4 Mine production t 3 024 3 157 3 185 0.9 Price c – nominal US$/oz 1 411 1 267 1 178 -7.0 – real d US$/oz 1 436 1 267 1 154 -8.9
2012–13 2013–14 2014–15 f Australia Mine production t 255 275 274 –0.6 Export volume t 280 279 288 3.2 – nominal value A$m 15 056 13 009 12 660 –2.7 – real value e A$m 15 862 13 360 12 660 –5.3 Price – nominal A$/oz 1 561 1 410 1 374 –2.5 – real e A$/oz 1 645 1 448 1 374 –5.1
b Includes jewellery consumption and industrial applications. c London Bullion Market Association AM price. d In current calendar year US dollars. e In current financial year Australian dollars. f forecast. Sources: ABS; London Bullion Market Association; World Gold Council.

Aluminium Ben Witteveen
Smelter closures and curtailments implemented throughout the year are beginning to reduce oversupply and contribute to higher prices. However, rising input costs, spare capacity and tapering consumption growth in China will remain key challenges to the aluminium market in 2015.
Prices Aluminium spot prices fared well in 2014, increasing by 15 per cent from US$1756 a tonne in January to US$2015 a tonne in early-December. The closures and production curtailments undertaken in Canada, Australia and Europe started to address the oversupply created by the rapid growth in new capacity from China, the Middle East and India, with LME stocks declining to around 4.4 million tonnes by the end of October. For 2014 as a whole, the aluminium spot price is estimated to have averaged US$1835 a tonne.
In 2015 the price of aluminium is forecast to average US$2050 a tonne, an increase of 12 per cent relative to 2014. Aluminium production growth is forecast to outpace consumption and result in stocks increasing to 7.5 weeks of consumption in 2015. While high input costs are likely to support higher prices in 2015, the abundance of spare capacity in China that can respond quickly to higher prices will moderate any price recovery.
World consumption World aluminium consumption is estimated to have grown by 5 per cent in 2014 to 48.5 million tonnes, supported by strong consumption growth in emerging economies, particularly China, and a recovery in the US automotive sector. In 2014, China’s aluminium consumption is estimated to have increased by 8 per cent to 23.6 million tonnes.
Resources and Energy Quarterly, December 2014 45
2
4
6
8
10
12
500
1000
1500
2000
2500
3000
1999 2003 2007 2011 2015
Weeks of cons.
2014 US$/t
Figure 10.1: Annual aluminium prices and stocks
Stocks PricesSource: Bloomberg.
10
20
30
40
50
60
1999 2003 2007 2011 2015Mt
Figure 10.2: World aluminium consumption
USA Europe Rest of World ChinaSource: WMS,
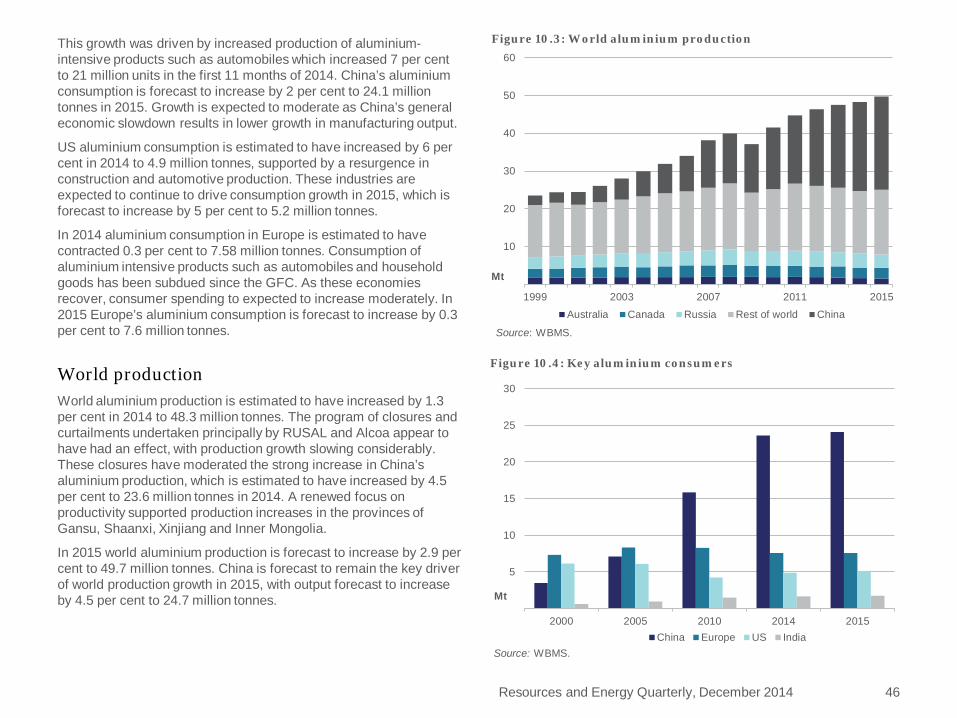
This growth was driven by increased production of aluminium-intensive products such as automobiles which increased 7 per cent to 21 million units in the first 11 months of 2014. China’s aluminium consumption is forecast to increase by 2 per cent to 24.1 million tonnes in 2015. Growth is expected to moderate as China’s general economic slowdown results in lower growth in manufacturing output.
US aluminium consumption is estimated to have increased by 6 per cent in 2014 to 4.9 million tonnes, supported by a resurgence in construction and automotive production. These industries are expected to continue to drive consumption growth in 2015, which is forecast to increase by 5 per cent to 5.2 million tonnes.
In 2014 aluminium consumption in Europe is estimated to have contracted 0.3 per cent to 7.58 million tonnes. Consumption of aluminium intensive products such as automobiles and household goods has been subdued since the GFC. As these economies recover, consumer spending to expected to increase moderately. In 2015 Europe’s aluminium consumption is forecast to increase by 0.3 per cent to 7.6 million tonnes.
World production World aluminium production is estimated to have increased by 1.3 per cent in 2014 to 48.3 million tonnes. The program of closures and curtailments undertaken principally by RUSAL and Alcoa appear to have had an effect, with production growth slowing considerably. These closures have moderated the strong increase in China’s aluminium production, which is estimated to have increased by 4.5 per cent to 23.6 million tonnes in 2014. A renewed focus on productivity supported production increases in the provinces of Gansu, Shaanxi, Xinjiang and Inner Mongolia.
In 2015 world aluminium production is forecast to increase by 2.9 per cent to 49.7 million tonnes. China is forecast to remain the key driver of world production growth in 2015, with output forecast to increase by 4.5 per cent to 24.7 million tonnes.
Resources and Energy Quarterly, December 2014 46
10
20
30
40
50
60
1999 2003 2007 2011 2015
Mt
Figure 10.3: World aluminium production
Australia Canada Russia Rest of world China
Source: WBMS.
5
10
15
20
25
30
2000 2005 2010 2014 2015
Mt
Figure 10.4: Key aluminium consumers
China Europe US IndiaSource: WBMS.

Production will continue to be underpinned by expanding capacity in the northwest provinces. Outside China, the commissioning of new smelters in India and the Middle East will support production increases of 23 per cent and 22 per cent to 2.5 million tonnes and 2.4 million tonnes, respectively.
Australia’s production and exports In 2014-15 Australia’s aluminium production is forecast to decrease by 13 per cent to 1.5 million tonnes following the closure of the Point Henry smelter in August. In line with lower production, export volumes are forecast to decrease by 16 per cent to 1.3 million tonnes. Forecast lower volumes will more than offset the effect of forecast higher prices and the expected depreciation of the Australian dollar. Export values are forecast to decline by 9.4 per cent to $3.2 billion.
Alumina In 2014 alumina prices are estimated to have increased by 1.8 per cent to average US$333 a tonne (FOB), supported by a rapid increase in China’s imports. In 2015, prices are forecast to increase by 0.6 per cent to average US$335 a tonne, underpinned by continued strong demand from China.
In 2014-15 Australia’s alumina production is forecast to decline by 7 per cent to 20 million tonnes as the full effect of the Gove refinery closure is realised. Reflecting forecast lower production, Australia’s exports of alumina are forecast to decline by 8 per cent to 17 million tonnes in 2014-15. Australia’s alumina export values are forecast to increase by 9 per cent to $6.2 billion as lower volumes are more than offset by forecast higher prices and the assumed depreciation of the Australian dollar.
Resources and Energy Quarterly, December 2014 47
4
8
12
16
20
1998-99 2002-03 2006-07 2010-11 2014-15
2
4
6
8
10
Mt
Figure 10.6: Australia’s alumina exports
Volume (rhs) Value (lhs)
2014-15 A$b
Source: ABS.
2
4
6
8
0.5
1
1.5
2
1998-99 2002-03 2006-07 2010-11 2014-15
Mt
Figure 10.5: Australia’s aluminium exports
Volume (lhs) Value (rhs)
2014-15 A$b
Source: ABS.
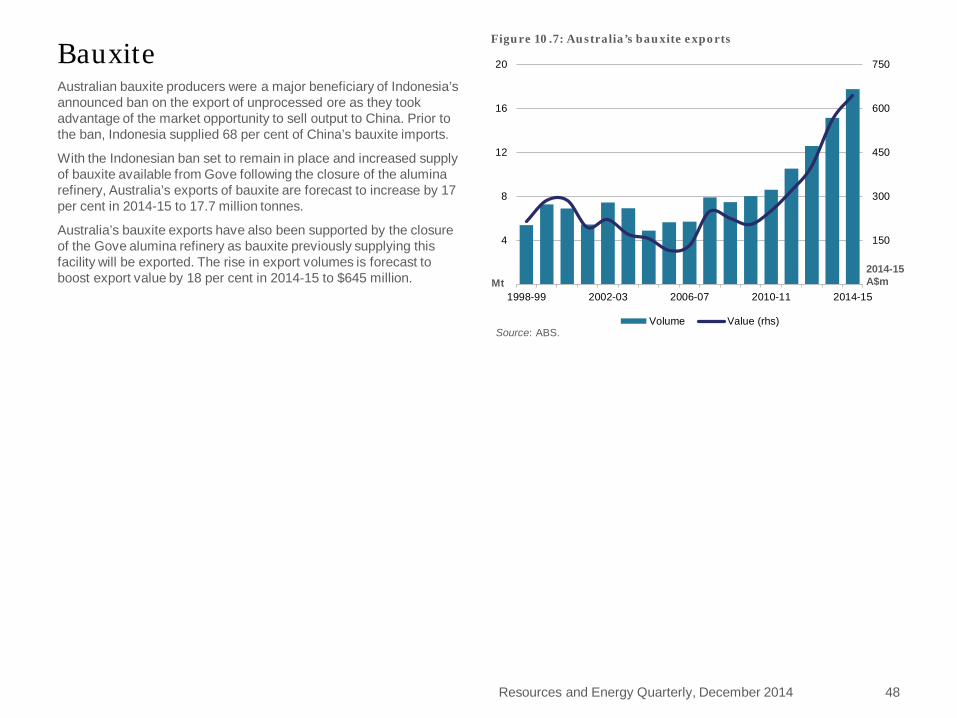
Bauxite Australian bauxite producers were a major beneficiary of Indonesia’s announced ban on the export of unprocessed ore as they took advantage of the market opportunity to sell output to China. Prior to the ban, Indonesia supplied 68 per cent of China’s bauxite imports.
With the Indonesian ban set to remain in place and increased supply of bauxite available from Gove following the closure of the alumina refinery, Australia’s exports of bauxite are forecast to increase by 17 per cent in 2014-15 to 17.7 million tonnes.
Australia’s bauxite exports have also been supported by the closure of the Gove alumina refinery as bauxite previously supplying this facility will be exported. The rise in export volumes is forecast to boost export value by 18 per cent in 2014-15 to $645 million.
Resources and Energy Quarterly, December 2014 48
150
300
450
600
750
4
8
12
16
20
1998-99 2002-03 2006-07 2010-11 2014-15
2014-15 A$m Mt
Figure 10.7: Australia’s bauxite exports
Volume Value (rhs)Source: ABS.
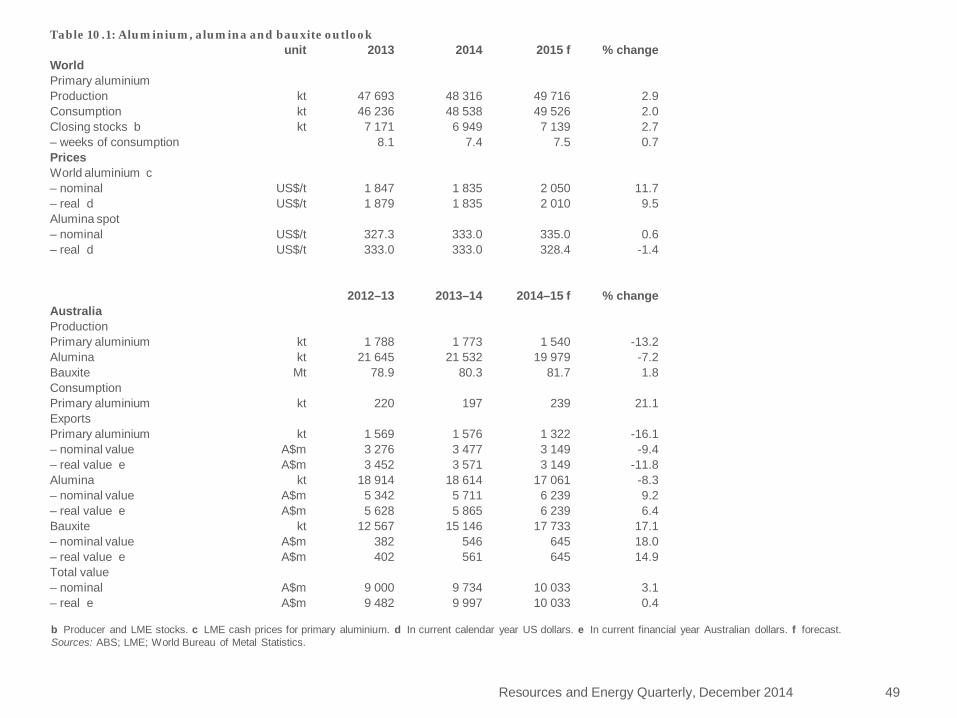
Resources and Energy Quarterly, December 2014 49
Table 10.1: Aluminium, alumina and bauxite outlook unit 2013 2014 2015 f % change
World Primary aluminium Production kt 47 693 48 316 49 716 2.9 Consumption kt 46 236 48 538 49 526 2.0 Closing stocks b kt 7 171 6 949 7 139 2.7 – weeks of consumption 8.1 7.4 7.5 0.7 Prices World aluminium c – nominal US$/t 1 847 1 835 2 050 11.7 – real d US$/t 1 879 1 835 2 010 9.5 Alumina spot – nominal US$/t 327.3 333.0 335.0 0.6 – real d US$/t 333.0 333.0 328.4 -1.4
2012–13 2013–14 2014–15 f % change Australia Production Primary aluminium kt 1 788 1 773 1 540 -13.2 Alumina kt 21 645 21 532 19 979 -7.2 Bauxite Mt 78.9 80.3 81.7 1.8 Consumption Primary aluminium kt 220 197 239 21.1 Exports Primary aluminium kt 1 569 1 576 1 322 -16.1 – nominal value A$m 3 276 3 477 3 149 -9.4 – real value e A$m 3 452 3 571 3 149 -11.8 Alumina kt 18 914 18 614 17 061 -8.3 – nominal value A$m 5 342 5 711 6 239 9.2 – real value e A$m 5 628 5 865 6 239 6.4 Bauxite kt 12 567 15 146 17 733 17.1 – nominal value A$m 382 546 645 18.0 – real value e A$m 402 561 645 14.9 Total value – nominal A$m 9 000 9 734 10 033 3.1 – real e A$m 9 482 9 997 10 033 0.4
b Producer and LME stocks. c LME cash prices for primary aluminium. d In current calendar year US dollars. e In current financial year Australian dollars. f forecast. Sources: ABS; LME; World Bureau of Metal Statistics.

Copper John Barber
Copper production and consumption continued to surge in 2014 but production disruptions have again thwarted hopes of a supply surplus. Copper prices declined further in 2014, defying the prevailing market balance and dwindling world copper stocks.
Prices Copper prices in the September quarter 2014 averaged US$6994 a tonne, up 3.1 per cent from the June quarter 2014. For 2014 as a whole, prices are estimated to have averaged around US$6940, 6.3 per cent lower than the average price for 2013. Copper price movements in 2014 defied market fundamentals with world copper stocks estimated to have decreased from 2.3 weeks of consumption at the end of 2013 to around 1.7 weeks of consumption at the end of 2014. Copper consumption growth has again outpaced the rise in production and the long-awaited copper surplus has seemingly been pushed forward another year, once again due to production disruptions in South America.
Copper prices are forecast to average US$6580 in 2015, 5 per cent lower than 2014 due to greater supply availability and the impact of a stronger US dollar. The risk of production disruptions is likely to remain a key factor affecting copper markets and may result in tighter supply conditions than forecast. World copper stocks are forecast to rebound to 2.3 weeks of consumption at the end of 2015.
Consumption World copper consumption is estimated to have totalled 22.6 million tonnes in 2014, 8 per cent higher than 2013 despite slowing economic growth in key emerging economies. China remained the main driver of world copper consumption in 2014 and its domestic
1.5
3
4.5
6
7.5
2000
4000
6000
8000
10000
1999 2001 2003 2005 2007 2009 2011 2013 2015
2014 US$/t
Stocks (rhs) Price (lhs)
Source: Bloomberg.
Figure 11.2: Annual copper prices and stocks
Weeks of cons.
Resources and Energy Quarterly, December 2014 50
2000
4000
6000
8000
10000
12000
2000 2002 2004 2006 2008 2010 2012 2014US$/t
Monthly LME spot 6 month moving averageSources: LME; Bloomberg.
Figure 11.1: Monthly LME copper price

Resources and Energy Quarterly, December 2014 51
Refined copper production in Asia is estimated to have increased by around 9 per cent in 2014, relative to 2013, to 11.7 million tonnes. Despite slowing economic growth in China, its refined copper output surged again in 2014 and increased by an estimated 14 per cent to around 7.8 million tonnes. This expansion was the result of higher output from new operations that outweighed government imposed shut downs directed as part of new environmental policies to reduce pollution. India’s refined copper production is estimated to have increased 20 per cent to 745 000 tonnes as a result of new capacity.
In 2015 world refined production is forecast to increase by 4.8 per cent to 23.5 million tonnes. Production in Europe is forecast to remain relatively stable at 3.5 million tonnes. Refined production in Asia is forecast to increase 6 per cent to 12.4 million tonnes. China and India are again expected to be the main drivers of higher refined copper production, but at lower growth rates. Refined copper production in North and South America is forecast to rise by 8 per cent in 2015 to total 5.5 million tonnes, with recovering US demand being a key factor underpinning rising refined production.
consumption is estimated to have increased by around 11 per cent to total 10.9 million tonnes. Copper consumption in South Korea and Chinese Taipei rebounded in 2014 after posting low growth rates in 2013. South Korea’s consumption is estimated to have increased 10 per cent to around 800 000 tonnes and Chinese Taipei’s consumption is estimated to have increased 11 per cent to around 485 000 tonnes.
Copper consumption in North and South America is estimated at 2.9 million tonnes in 2014, 4 per cent lower than 2013. Increased construction activity in the US has been mostly offset by lower copper use in other sectors as well as lower consumption in South American countries, particularly Brazil where copper consumption is estimated to have decreased by 12 per cent in 2014.
World copper consumption is forecast to rise by 2.8 per cent in 2015 to 23.2 million tonnes. China is expected to remain the largest consumer in 2015 and be the principal source of growth. China’s urban and industrial growth is expected to slow but still underpin a forecast 7 per cent increase in its copper consumption.
Production Mine production
Copper mine production is estimated to have been 18.4 million tonnes in 2014, 1.1 per cent higher than 2012. New mining operations moving towards full capacity underpinned continued growth in the supply of copper through 2014 but continued disruptions at key mines in South America again prevented world copper production reaching its full capacity. In 2015 copper mine production is forecast to increase by a further 6 per cent and total 19.7 million tonnes. However, production disruptions are expected to remain an ongoing downside risk to this forecast.
Refined production
In 2014 world refined copper production is estimated to have increased to 22.5 million tonnes, an increase of 5 per cent compared with 2013. This expansion was due mainly to growth in Asia, particularly China and India.
4000
8000
12000
16000
20000
2004 2005 2006 2007 2008 2009 2010 2011 2012 2013 2014
kt
Figure 11.3: World refined copper production
China Rest of Asia Chile Rest of America AustraliaSource: WBMS

Resources and Energy Quarterly, December 2014 52
Australia Exploration
Copper exploration expenditure in Australia totalled $44.2 million in the September quarter 2014. This was 19 per cent lower than the September quarter 2013 but 4 per cent higher than the June quarter 2014.
Mine production
Australia’s copper mine production is forecast to increase by 1.2 per cent in 2014-15 to around 997 000 tonnes. This rise is attributable to increasing production volumes from CuDeco’s recently completed Rocklands copper project in Queensland. Higher production at several mines across Australia as a result of productivity enhancements has been partially offset by the closure of the Mount Lyell mine in Tasmania and production disruptions at Aditya Birla’s Nifty mine in Western Australia.
Refined production
Australia’s refined copper production is forecast to remain unchanged in 2014-15 at around 510 000 tonnes. While the completion of planned maintenance at BHP Billiton’s Olympic Dam smelter resulted in below capacity refined copper production in the September quarter 2014, production was still 42 per cent higher than the previous year and is expected to return to normal production rates for the remainder of 2014-15.
Exports
In 2014-15 Australia’s copper export volumes are forecast to rise by 2.4 per cent to 1.06 million tonnes (by metal content). The value of copper exports is forecast to be $8.9 billion in 2014-15, 2.6 per cent higher than 2013-14. This forecast rise is due to both higher export volumes and higher Australian prices associated with a lower Australian dollar exchange rate.
2
4
6
8
10
12
14
200
400
600
800
1000
1200
1400
1998–99 2003–04 2008–09 2013–14 2018-19
2014-15 A$b
Figure 11.5: Australia’s copper exports
Volume (lhs) Value (rhs)
kt
Source: ABS.
2000
4000
6000
8000
10000
30
60
90
120
150
Sep-09 Sep-10 Sep-11 Sep-12 Sep-13 Sep-14
Figure 11.4: Australia’s copper exploration
Exploration expenditure Price (lhs)
A$m US$/t
Source: ABS.

Resources and Energy Quarterly, December 2014 53
b In current calendar year US dollars. c Quantities refer to gross weight of all ores and concentrates. d In current financial year Australian dollars. f forecast. Sources: ABS; International Copper Study Group; LME; World Bureau of Metal Statistics.
Table 11.1: Copper outlook
unit 2013 2014 f 2015 f % change World Production – mine kt 18 280 18 483 19 661 6.4 – refined kt 21 395 22 464 23 539 4.8 Consumption kt 20 993 22 585 23 226 2.8 Closing stocks kt 916 725 1 038 43.2 – weeks of consumption 2.3 1.7 2.3 39.2 Price LME – nominal US$/t 7 326 6 936 6 580 -5.1
USc/lb 332 315 298 -5.1 – real b US$/t 7 455 6 936 6 451 -7.0
USc/lb 338 315 293 -7.0
2012–13 2013–14 2014–15 f Australia Mine output kt 970 985 997 1.2 Refined output kt 454 505 508 0.6 Exports – ores and conc. c kt 2 182 2 122 2 178 2.7 – refined kt 360 456 456 0.0 Export value – nominal A$m 8 044 8 691 8 919 2.6 – real d A$m 8 474 8 926 8 919 -0.1

Nickel Ben Witteveen
Nickel prices traded within a wide range during 2014 in response to supply concerns, weak economic data from China and record LME stocks. The effects of the Indonesian ore export ban are expected to materialise in 2015 and support a transition to production from higher cost alternatives.
Prices The introduction of a ban on exports of unprocessed ores from Indonesia in January 2014 supported a 42 per cent increase in nickel spot prices in the first nine months of the year. Despite concerns over supply availability, LME stocks increased steadily over the course of the year due to an increase in nickel ore supply from the Philippines and the transfer of stocks from private warehouses following the Qingdao port scandal. The persistent increase in stocks alleviated some of the concerns over supply and contributed to a sharp fall in prices through October, effectively erasing the gains made during the year. For 2014 as a whole the price is estimated to have averaged US$16 893 a tonne, 12 per cent higher than 2013.
In 2015, the Indonesian ore export ban is expected to have more of an effect on world supply as opportunities for improved efficiency at refineries and other sources of supply diminish. Reduced supply availability is forecast to result in a drawdown in stocks and encourage a shift in nickel supply from sulphide ores to higher cost laterite ores. The combination of lower stocks and higher production costs are expected to support a forecast 8 per cent increase in nickel spot prices in 2015, to average $18 250 a tonne.
World Consumption World nickel consumption is estimated to have increased by 3.1 per cent in 2014 to 1.83 million tonnes.
Resources and Energy Quarterly, December 2014 54
5000
10000
15000
20000
25000
30000
Jun 10 Dec 10 Jun 11 Dec 11 Jun 12 Dec 12 Jun 13 Dec 13 Jun 14
Figure 12.1: Nickel daily price
Nickel LME 90 day moving average
US$/t
Source: Bloomberg.
3
6
9
12
15
10 000
20 000
30 000
40 000
50 000
1999 2003 2007 2011 2015
Weeks of cons.
2014 US$/t
Figure 12.2: Nickel prices and stocks
stocks (rhs) price
Source: LME.

Resources and Energy Quarterly, December 2014 55
In 2014 China’s nickel consumption is estimated to have increased 3 per cent to 920 000 tonnes, supported by an increase in production of stainless steel for infrastructure and automobile components. Growth in China’s consumption of nickel is forecast to slow to 1 per cent in 2015 as infrastructure and automobile production growth tapers. US nickel consumption is estimated to have increased 5 per cent in 2014 and is forecast to grow by 2 per cent in 2015 to 147 000 tonnes, driven by a recovery in automobile production and housing construction.
World Production In 2014 world mine production is estimated to have declined 9 per cent to 2.1 million tonnes, reflecting lower production in Indonesia. Increased production from the Philippines (up 6 per cent) and Russia (up 10 per cent) offset some of this decline. World mine production is forecast to decrease by a further 6 per cent in 2015 to 1.96 million tonnes as Indonesian production continues to contract until refining capability is developed.
World refined nickel production is estimated to have decreased 3.3 per cent in 2014 to 1.9 million tonnes and is forecast to decrease by 4.2 per cent in 2015 to 1.8 million tonnes. China’s ferronickel producers are expected to reduce production in response to limited supply availability and elevated prices for high quality ore.
Australia Exploration
Australia’s expenditure on nickel and cobalt exploration in the September quarter declined 36 per cent year-on-year to $24.3 million. Although prices were higher for much of 2014, this did not translate into increased exploration expenditure. Increased production in response to higher prices is expected to be achieved through restarting mines currently in care and maintenance.
50
100
150
200
250
300
2004 2006 2008 2010 2012 2014
Figure 12.3: Australia mine production
WA QLD TAS
Source: ABS.
kt
5000
10000
15000
20000
25000
30000
15
30
45
60
75
90
Sep-09 Jun-10 Mar-11 Dec-11 Sep-12 Jun-13 Mar-14
Nickel exploration a Nickel price (rhs)a. Includes cobalt. Sources: ABS; LME.
A$m US$t
Figure 12.4: Australia’s nickel exploration expenditure

Production
In 2014-15, Australian nickel mine production is forecast to decrease by 3.1 per cent to 218 000 tonnes. Lower production from Nickel West’s Perseverance mine, where operations have been suspended due to safety concerns, is forecast to offset higher production from the restart of several mines currently in care and maintenance.
Exports
Australia’s exports of nickel in 2014-15 are forecast to increase by 1.0 per cent to 228 000 tonnes, supported by an increase in production. Nickel export earnings are forecast to increase by 14 per cent to $3.7 billion in 2014-15 due to a combination of higher average nickel prices and an increase in export volumes.
Resources and Energy Quarterly, December 2014 56
2
4
6
8
10
12
50
100
150
200
250
300
1998–99 2002–03 2006–07 2010–11 2014–15
volume value (rhs)
Source: ABS.
kt 2014-15 A$b
Figure 12.5: Australia’s nickel exports

Resources and Energy Quarterly, December 2014 57
Table 12.1: Nickel outlook unit 2013 2014 s 2015 f % change
World Production – mine kt 2 275 2 078 1 955 –5.9 – refined kt 1 941 1 877 1 797 –4.2 Consumption kt 1 772 1 828 1 858 1.7 Stocks kt 353 402 341 –15.1 – weeks of consumption 10.4 11.4 9.6 –16.5 Price LME – nominal US$/t 15 025 16 893 18 250 8.0
Usc/lb 682 766 828 8.0 – real b US$/t 15 290 16 893 17 892 5.9
Usc/lb 694 766 812 5.9
2012–13 2013–14 2014–15 f % change Australia Production – mine cs kt 242 225 218 –3.1 – refined kt 135 140 141 1.1 – intermediate kt 61 70 75 7.8 Export volume ds kt 253 226 228 1.0 – nominal value s A$m 3 642 3 216 3 677 14.3 – real value es A$m 3 837 3 303 3 677 11.3
b In current calendar year US dollars. c Nickel content of domestic mine production. d Includes metal content of ores and concentrates, intermediate products and nickel metal. e In current financial year Australian dollars. f forecast. s estimate. Sources: ABS; International Nickel Study Group; LME; World Bureau of Metal Statistics.
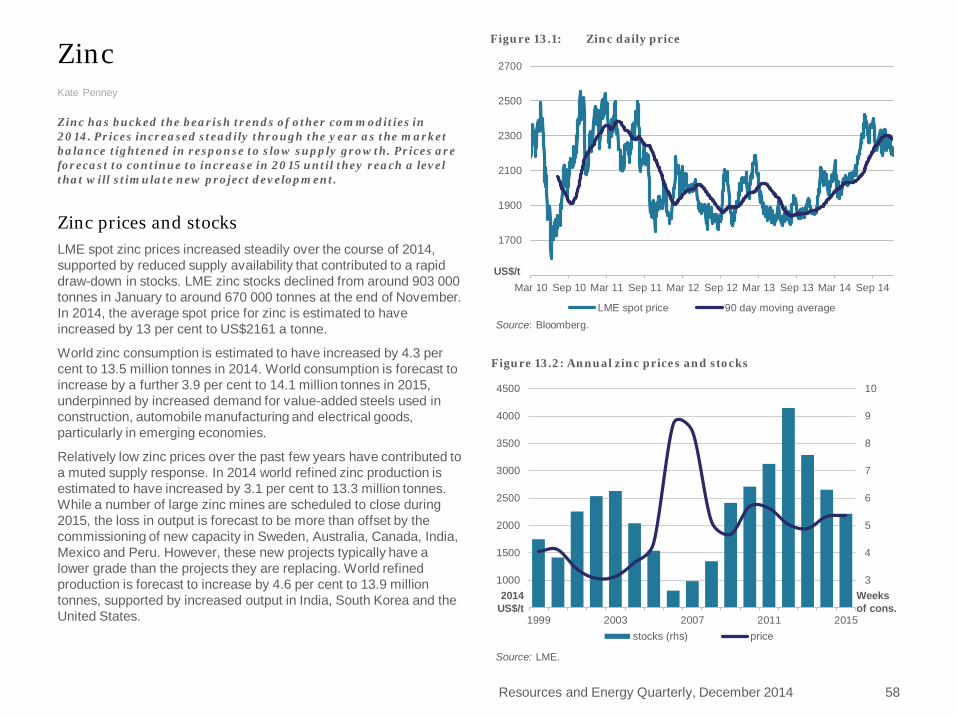
Zinc Kate Penney
Zinc has bucked the bearish trends of other commodities in 2014. Prices increased steadily through the year as the market balance tightened in response to slow supply growth. Prices are forecast to continue to increase in 2015 until they reach a level that will stimulate new project development.
Zinc prices and stocks LME spot zinc prices increased steadily over the course of 2014, supported by reduced supply availability that contributed to a rapid draw-down in stocks. LME zinc stocks declined from around 903 000 tonnes in January to around 670 000 tonnes at the end of November. In 2014, the average spot price for zinc is estimated to have increased by 13 per cent to US$2161 a tonne.
World zinc consumption is estimated to have increased by 4.3 per cent to 13.5 million tonnes in 2014. World consumption is forecast to increase by a further 3.9 per cent to 14.1 million tonnes in 2015, underpinned by increased demand for value-added steels used in construction, automobile manufacturing and electrical goods, particularly in emerging economies.
Relatively low zinc prices over the past few years have contributed to a muted supply response. In 2014 world refined zinc production is estimated to have increased by 3.1 per cent to 13.3 million tonnes. While a number of large zinc mines are scheduled to close during 2015, the loss in output is forecast to be more than offset by the commissioning of new capacity in Sweden, Australia, Canada, India, Mexico and Peru. However, these new projects typically have a lower grade than the projects they are replacing. World refined production is forecast to increase by 4.6 per cent to 13.9 million tonnes, supported by increased output in India, South Korea and the United States.
1700
1900
2100
2300
2500
2700
Mar 10 Sep 10 Mar 11 Sep 11 Mar 12 Sep 12 Mar 13 Sep 13 Mar 14 Sep 14
Figure 13.1: Zinc daily price
LME spot price 90 day moving average
US$/t
Source: Bloomberg.
Resources and Energy Quarterly, December 2014 58
3
4
5
6
7
8
9
10
1000
1500
2000
2500
3000
3500
4000
4500
1999 2003 2007 2011 2015
Figure 13.2: Annual zinc prices and stocks
stocks (rhs) price
2014 US$/t
Weeks of cons.
Source: LME.
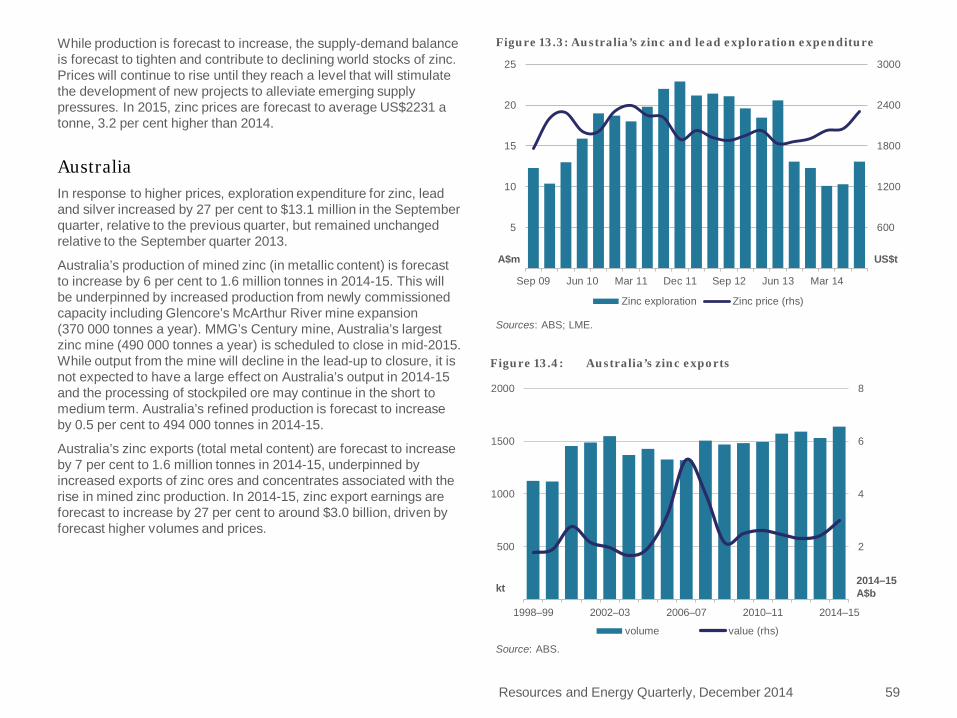
While production is forecast to increase, the supply-demand balance is forecast to tighten and contribute to declining world stocks of zinc. Prices will continue to rise until they reach a level that will stimulate the development of new projects to alleviate emerging supply pressures. In 2015, zinc prices are forecast to average US$2231 a tonne, 3.2 per cent higher than 2014.
Australia In response to higher prices, exploration expenditure for zinc, lead and silver increased by 27 per cent to $13.1 million in the September quarter, relative to the previous quarter, but remained unchanged relative to the September quarter 2013.
Australia’s production of mined zinc (in metallic content) is forecast to increase by 6 per cent to 1.6 million tonnes in 2014-15. This will be underpinned by increased production from newly commissioned capacity including Glencore’s McArthur River mine expansion (370 000 tonnes a year). MMG’s Century mine, Australia’s largest zinc mine (490 000 tonnes a year) is scheduled to close in mid-2015. While output from the mine will decline in the lead-up to closure, it is not expected to have a large effect on Australia’s output in 2014-15 and the processing of stockpiled ore may continue in the short to medium term. Australia’s refined production is forecast to increase by 0.5 per cent to 494 000 tonnes in 2014-15.
Australia’s zinc exports (total metal content) are forecast to increase by 7 per cent to 1.6 million tonnes in 2014-15, underpinned by increased exports of zinc ores and concentrates associated with the rise in mined zinc production. In 2014-15, zinc export earnings are forecast to increase by 27 per cent to around $3.0 billion, driven by forecast higher volumes and prices.
Resources and Energy Quarterly, December 2014 59
600
1200
1800
2400
3000
5
10
15
20
25
Sep 09 Jun 10 Mar 11 Dec 11 Sep 12 Jun 13 Mar 14
Zinc exploration Zinc price (rhs)
Sources: ABS; LME.
Figure 13.3: Australia’s zinc and lead exploration expenditure
A$m US$t
2
4
6
8
500
1000
1500
2000
1998–99 2002–03 2006–07 2010–11 2014–15
Figure 13.4: Australia’s zinc exports
volume value (rhs)
kt 2014–15 A$b
Source: ABS.
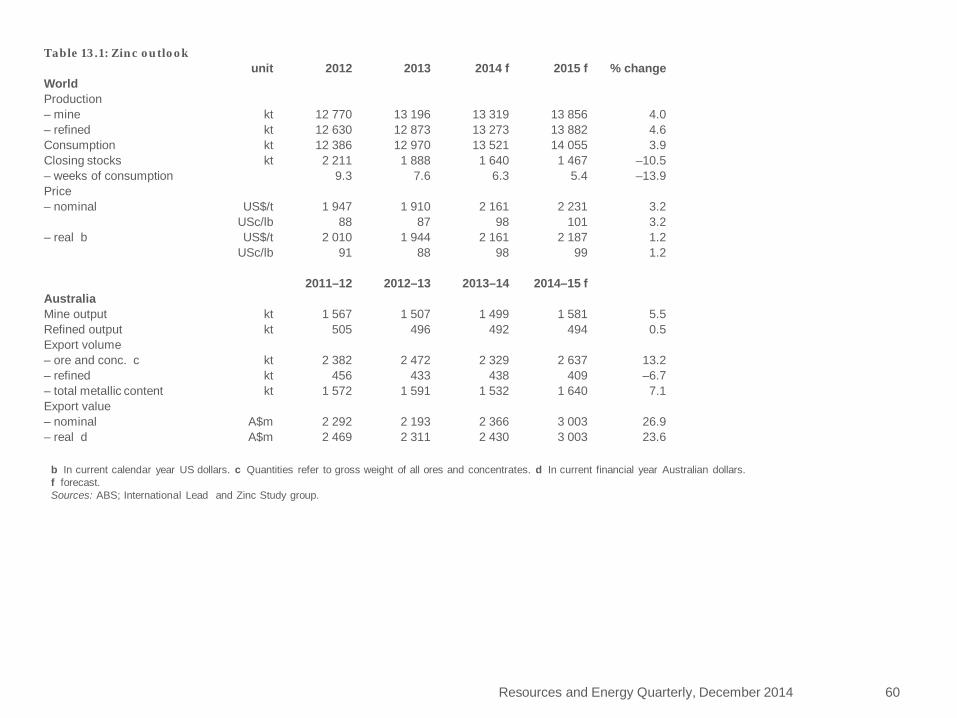
Resources and Energy Quarterly, December 2014 60
Table 13.1: Zinc outlook unit 2012 2013 2014 f 2015 f % change
World Production – mine kt 12 770 13 196 13 319 13 856 4.0 – refined kt 12 630 12 873 13 273 13 882 4.6 Consumption kt 12 386 12 970 13 521 14 055 3.9 Closing stocks kt 2 211 1 888 1 640 1 467 –10.5 – weeks of consumption 9.3 7.6 6.3 5.4 –13.9 Price – nominal US$/t 1 947 1 910 2 161 2 231 3.2
USc/lb 88 87 98 101 3.2 – real b US$/t 2 010 1 944 2 161 2 187 1.2
USc/lb 91 88 98 99 1.2
2011–12 2012–13 2013–14 2014–15 f Australia Mine output kt 1 567 1 507 1 499 1 581 5.5 Refined output kt 505 496 492 494 0.5 Export volume – ore and conc. c kt 2 382 2 472 2 329 2 637 13.2 – refined kt 456 433 438 409 –6.7 – total metallic content kt 1 572 1 591 1 532 1 640 7.1 Export value – nominal A$m 2 292 2 193 2 366 3 003 26.9 – real d A$m 2 469 2 311 2 430 3 003 23.6
b In current calendar year US dollars. c Quantities refer to gross weight of all ores and concentrates. d In current financial year Australian dollars. f forecast. Sources: ABS; International Lead and Zinc Study group.
Trade Summary Charts and Tables
Resources and Energy Quarterly, December 2014 61
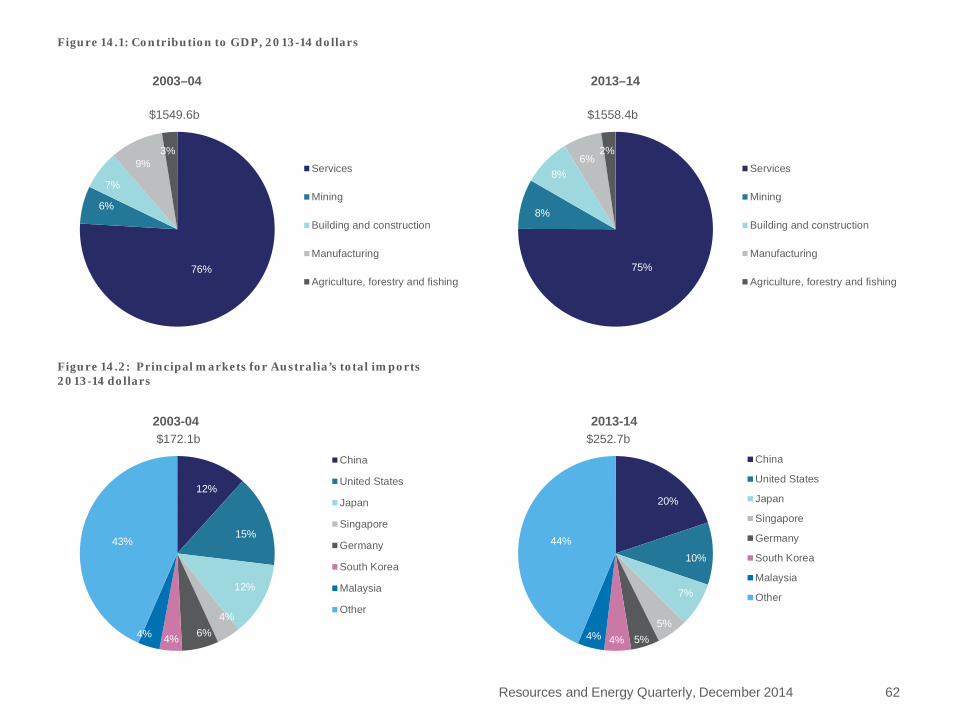
Resources and Energy Quarterly, December 2014 62
76%
6%
7%
9% 3%
2003–04
Services
Mining
Building and construction
Manufacturing
Agriculture, forestry and fishing
$1549.6b
Figure 14.1: Contribution to GDP, 2013-14 dollars
75%
8%
8% 6%
2%
2013–14
Services
Mining
Building and construction
Manufacturing
Agriculture, forestry and fishing
$1558.4b
12%
15%
12%
4% 6% 4% 4%
43%
2003-04
China
United States
Japan
Singapore
Germany
South Korea
Malaysia
Other
$172.1b
Figure 14.2: Principal markets for Australia’s total imports 2013-14 dollars
20%
10%
7%
5% 5% 4% 4%
44%
2013-14
China
United States
Japan
Singapore
Germany
South Korea
Malaysia
Other
$252.7b
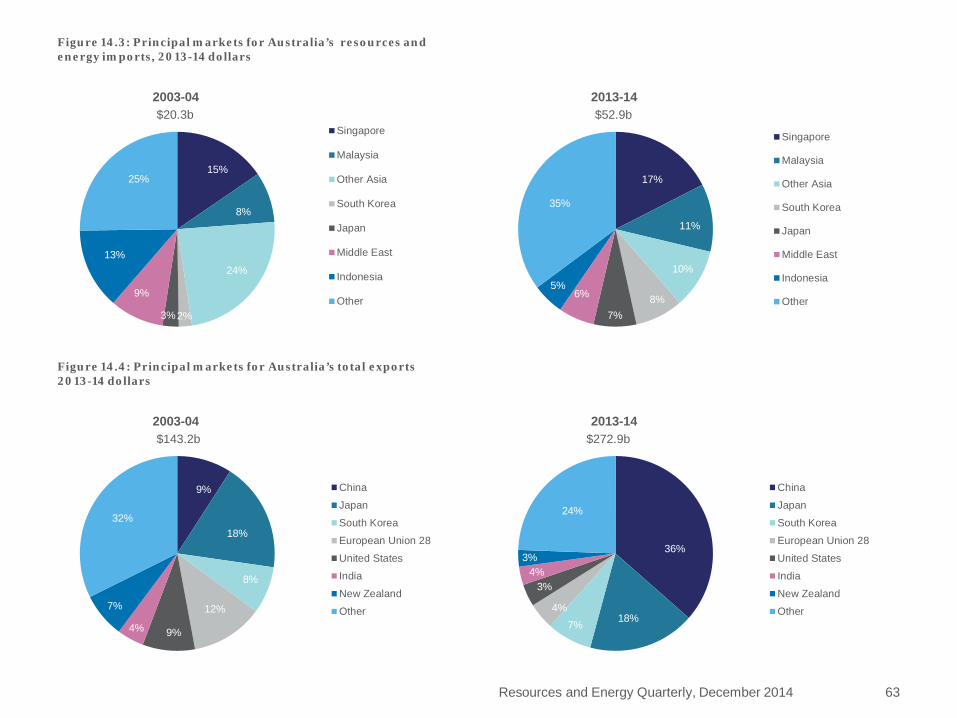
Resources and Energy Quarterly, December 2014 63
9%
18%
8%
12%
9% 4%
7%
32%
2003-04
China
Japan
South Korea
European Union 28
United States
India
New Zealand
Other
$143.2b
Figure 14.4: Principal markets for Australia’s total exports 2013-14 dollars
36%
18% 7% 4%
4% 3%
3%
24%
2013-14
China
Japan
South Korea
European Union 28
United States
India
New Zealand
Other
$272.9b
15%
8%
24%
2% 3%
9%
13%
25%
2003-04
Singapore
Malaysia
Other Asia
South Korea
Japan
Middle East
Indonesia
Other
$20.3b
Figure 14.3: Principal markets for Australia’s resources and energy imports, 2013-14 dollars
17%
11%
10%
8% 7%
6% 5%
35%
2013-14
Singapore
Malaysia
Other Asia
South Korea
Japan
Middle East
Indonesia
Other
$52.9b

Resources and Energy Quarterly, December 2014 64
10%
14%
11%
8% 8% 9%
3%
36%
2003-04
China
Japan
Other Asia
Korea, Rep. of
European Union 28
India
Thailand
Other
$43.8b
Figure 14.5: Principal markets for Australia’s resources exports, 2013-14 dollars
60%
11%
8%
7%
2% 1%
1% 9%
2013-14
China
Japan
Other Asia
Korea, Rep. of
European Union 28
India
Thailand
Other
$123.5b
38%
6% 13%
12%
5%
9%
17%
2003-04
Japan
China
Other Asia
South Korea
India
European Union 28
Other
$27.2b
Figure 14.6: Principal markets for Australia’s energy exports, 2013-14 dollars
41%
14% 12%
9%
7%
4%
13%
2013-14
Japan
China
Other Asia
South Korea
India
European Union 28
Other
$71.5b

Resources and Energy Quarterly, December 2014 65
13.9%
72.0%
14.1%
Proportion of merchandise exports
Rural
Mineral resources
Other merchandise
Figure 14.7: Contribution to exports by sector, 2010-11
11.5%
59.6%
11.7%
17.1%
Proportion of exports of goods and services
Rural
Mineral resources
Other merchandise
Services
14.1%
71.8%
14.1%
Proportion of merchandise exports
Rural
Mineral resources
Other merchandise
Figure 14.8: Contribution to exports by sector, 2011-12
11.8%
60.2%
11.8%
16.3%
Proportion of exports of goods and services
Rural
Mineral resources
Other merchandise
Services

Resources and Energy Quarterly, December 2014 66
15.7%
70.0%
14.3%
Proportion of merchandise exports
Rural
Mineral resources
Other merchandise
Figure 14.9: Contribution to exports by sector, 2012-13
13%
58%
12%
18%
Proportion of exports of goods and services
Rural
Mineral resources
Other merchandise
Services
15.2%
70.9%
13.9%
Proportion of merchandise exports
Rural
Mineral resources
Other merchandise
Figure 14.10: Contribution to exports by sector, 2013-14
12.6%
58.6%
11.5%
17.3%
Proportion of exports of goods and services
Rural
Mineral resources
Other merchandise
Services
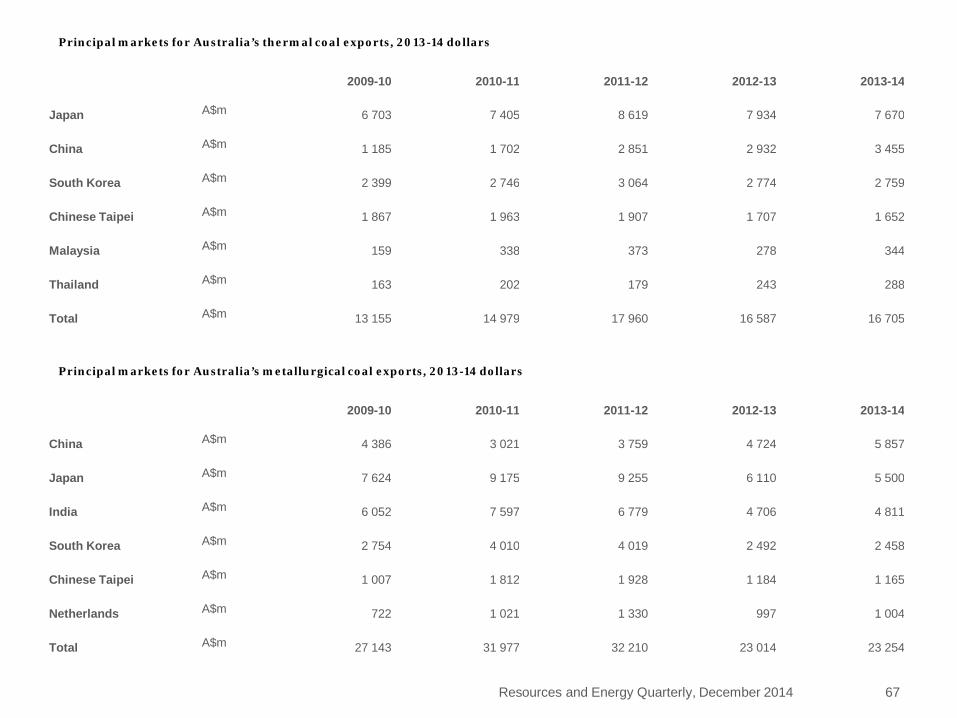
Principal markets for Australia’s thermal coal exports, 2013-14 dollars
2009-10 2010-11 2011-12 2012-13 2013-14
Japan A$m 6 703 7 405 8 619 7 934 7 670
China A$m 1 185 1 702 2 851 2 932 3 455
South Korea A$m 2 399 2 746 3 064 2 774 2 759
Chinese Taipei A$m 1 867 1 963 1 907 1 707 1 652
Malaysia A$m 159 338 373 278 344
Thailand A$m 163 202 179 243 288
Total A$m 13 155 14 979 17 960 16 587 16 705
Resources and Energy Quarterly, December 2014 67
Principal markets for Australia’s metallurgical coal exports, 2013-14 dollars
2009-10 2010-11 2011-12 2012-13 2013-14
China A$m 4 386 3 021 3 759 4 724 5 857
Japan A$m 7 624 9 175 9 255 6 110 5 500
India A$m 6 052 7 597 6 779 4 706 4 811
South Korea A$m 2 754 4 010 4 019 2 492 2 458
Chinese Taipei A$m 1 007 1 812 1 928 1 184 1 165
Netherlands A$m 722 1 021 1 330 997 1 004
Total A$m 27 143 31 977 32 210 23 014 23 254

Principal markets for Australia’s oil and gas exports, 2013-14 dollars
2009-10 2010-11 2011-12 2012-13 2013-14
Japan A$m 9 609 11 311 13 531 14 803 17 818
China A$m 1 963 3 202 3 809 2 781 3 823
South Korea A$m 2 650 2 815 1 828 2 224 3 118
Singapore A$m 2 402 2 017 2 862 2 760 2 297
Thailand A$m 1 290 1 883 1 025 844 1 641
India A$m 554 987 310 181 127
Total A$m 21 021 25 386 27 018 27 144 29 231
Resources and Energy Quarterly, December 2014 68
Principal markets for Australia’s gold exports, 2013-14 dollars
2009-10 2010-11 2011-12 2012-13 2013-14
China A$m 0 679 4 472 6 140 8 110
Singapore A$m 191 1 197 1 177 969 2 273
United Kingdom A$m 4 607 3 758 4 745 2 684 640
Turkey A$m 0 0 67 479 537
Thailand A$m 1 454 2 540 1 686 1 304 445
Switzerland A$m 13 9 35 294 345
Total A$m 14 383 13 970 16 222 15 445 13 009

Principal markets for Australia’s iron ore exports, 2013-14 dollars
2009-10 2010-11 2011-12 2012-13 2013-14
China A$m 27 856 42 887 45 602 43 021 57 039
Japan A$m 6 640 11 098 11 410 8 838 9 664
South Korea A$m 3 181 6 495 6 785 5 055 6 097
Chinese Taipei A$m 1 002 2 079 1 883 1 535 1 710
Indonesia A$m 0 0 0 0 110
India A$m 16 0 0 49 41
Total A$m 38 818 62 667 65 778 58 549 74 681
Resources and Energy Quarterly, December 2014 69
Principal markets for Australia’s aluminium exports, 2013-14 dollars
2009-10 2010-11 2011-12 2012-13 2013-14
Japan A$m 1 442 1 506 1 387 1 030 1 114
South Korea A$m 860 933 614 695 680
Chinese Taipei A$m 501 558 390 468 443
Thailand A$m 428 348 344 374 303
China A$m 133 147 199 153 233
Indonesia A$m 265 279 317 255 195
Total A$m 4 247 4 484 3 984 3 361 3 477

Principal markets for Australia’s copper exports, 2013-14 dollars
2009-10 2010-11 2011-12 2012-13 2013-14
China A$m 2 269 2 637 2 619 3 115 3 939
Japan A$m 1 309 1 467 1 559 1 657 1 621
India A$m 1 306 1 446 1 523 1 138 945
Malaysia A$m 321 696 736 694 611
South Korea A$m 893 1 083 903 450 580
Philippines A$m 185 197 20 144 285
Total A$m 7 200 9 039 8 919 8 251 8 697
Resources and Energy Quarterly, December 2014 70
Principal markets for Australia’s iron and steel exports, 2013-14 dollars
2009-10 2010-11 2011-12 2012-13 2013-14
United States A$m 299 288 172 132 105
New Zealand A$m 107 95 89 81 94
Thailand A$m 119 153 116 103 36
Indonesia A$m 44 56 52 45 36
Philippines A$m 1 2 2 3 19
Brazil A$m 73 39 87 16 18
Total A$m 1 240 1 399 1 032 842 724

Contacts
General Manager Wayne Calder [email protected] (02) 6243 7901
Resources Program John Barber [email protected] (02) 6243 7988
Gas Market Program Ross Lambie [email protected] (02) 6243 7548
Energy Program Allison Ball [email protected] (02) 6243 7500
Data and Statistics Program Geoff Armitage [email protected] (02) 6243 7510
Research and Analysis Program
Arif Syed [email protected] (02) 6243 7504
Resources and Energy Quarterly, December 2014 71