Resource Use and GHG Emissions by Aquaculture … Use...The culture systems investigated in this...
28
Strengthening Adaptive Capacities to the Impacts of Climate Change in Resource poor Small- scale Aquaculture and Aquatic resources-dependent Sector in the South and South-east Asian Region - AquaClimate Resource use and greenhouse gas emissions by aquaculture systems in the case study areas Prepared by Akvaplan-niva together with the Centre of Excellence on enVironmental strategy for GREEN business (VGREEN), Thailand In partnership with: Network of Aquaculture Centres for Asia- Pacific (NACA) Faculty of Fisheries KASETSART UNIVERSITY Bangkok, Thailand Norwegian Institute for Agriculture and Environmental Research With funding support from the Norwegian Agency for Development Cooperation (NORAD)
Transcript of Resource Use and GHG Emissions by Aquaculture … Use...The culture systems investigated in this...

Strengthening Adaptive Capacities to the Impacts of Climate Change in Resource poor Small-
scale Aquaculture and Aquatic resources-dependent Sector in the South and South-east Asian
Region - AquaClimate
Resource use and greenhouse gas emissions by aquaculture
systems in the case study areas
Prepared by Akvaplan-niva together with
the Centre of Excellence on enVironmental strategy for GREEN business (VGREEN), Thailand
In partnership with:
Network of Aquaculture Centres for Asia-
Pacific (NACA)
Faculty of Fisheries
KASETSART UNIVERSITY
Bangkok, Thailand
Norwegian Institute for Agriculture and
Environmental Research
With funding support from the Norwegian Agency for Development Cooperation (NORAD)

Introduction
Aquaculture is seen as a potential production system to compensate with the declining production
from marine capture to meet the global demand for food. The growth of aquaculture is
continuously increased much more than other food sectors. Especially in the developing countries
where it is the main hub of production, the aquaculture sector has played a significant role not only
for food but also for socio-economic benefits in terms of foreign revenue, job creation and local
livelihood.
However, the aquaculture sector has also been receiving a great deal of criticisms on its potential
environmental impacts. The potential impacts from aquaculture systems often highlighted are:
GHG emissions, Water pollution, and Resource use (i.e. wild seed, fish in-fish out ration). Recently,
there is a major interest on its potential emissions of GHG (Greenhouse Gas) which is being the
international agenda on climate change mitigation as well as adaptation.
In order to identify culture systems that produce the most greenhouse gas emissions (GHGs) and
prioritise better practices for the culture systems with high environmental impact, the different
case studies need to be benchmarked against each other and other aquaculture technologies. This
analysis uses resource use analysis to estimate the resource use and nutrient impact to the
environment and Life Cycle analyses to estimate GHG emission. In this way the aquaculture culture
systems that are resource heavy or have high GHG emissions can be highlighted and best practice
guidelines to reduce impacts. The analysis assesses the GHG emissions and resource use per tonne
of food produced by the case study culture systems.
The culture systems investigated in this study vary between very high intensive Pangasius catfish
culture through semi-intensive culture systems (P. monodon shrimp culture in India and milkfish
pond production in the Philippines to extensive P. monodon shrimp culture systems in Vietnam.
In Vietnam, the case study was on P. monodon shrimp culture under improved extensive farming
conditions. Farmers undertaking improved extensive farming also typically undertake polyculture of
tiger shrimp with mud crab and highly intensive Pangasius catfish culture in ponds using pumper
water and complete diets. The case study in the Philippines was on milkfish pond farming in shallow
extensive ponds tend (about 30-40 cm deep) and typically use tidal changes to manage water
movement into and out from the farm. The majority of extensive pond farms rely on fertilization of
ponds and primary production as the feed source of fish. In India, the csase study was on semi-
intensive P.monofdon shrimp culture in Andhra Pradesh which contributes more than half of India’s
shrimp production and the state has been at the forefront of the industry since the beginning. Here
shrimp culture relies on pumped water and aeration which are heavy cost elements and technical
uncertainties, risking both the technical and economic viability.
The Bangkok Declaration and Strategy for Aquaculture Development Beyond 2000 [NACA/FAO
2000] expressed the need to develop resource-efficient farming systems which make efficient use
of water, land, seed and feed inputs by exploring the potential for commercial use of species
feeding low in the food chain. Although significant resource competition exists, significant
technological advancements in aquaculture over the past decade have occurred to make
production systems less consumptive of land, water and energy, to the point where aquaculture
resource use, overall, is comparable to poultry production.
However, the next 20 years will see an increase in the efficient use of land, water, food, seed and
energy through intensification and widespread adoption of integrated agriculture-aquaculture

farming ecosystems approaches. However, this will not be enough to increase aquaculture
production as these will improve only the efficiency of use, and increase aquaculture yields per unit
of inputs. A growing population will require aquaculture to expand rapidly into land and water
areas that are currently held as common pool resources (commons). This raises issues of access to
and management of common pool resources, which could result in conflicts with exiting users and
potentially acute social, political, and economic problems.
Assessing environmental performance of aquaculture is difficult because activities and potential
impacts are extremely diverse. However there is an increasing emphasis on using holistic analyses
to compare overall impacts of different agricultural production systems and to assess impacts and
resource use within a production process to identify opportunities for increasing resource use
efficiency. Life Cycle Assessment is the most common comprehensive analytical tool currently used
to quantify environmental impacts of a production process. The LCA concept has been formalized
into an analytical methodology under ISO 14000 standards and has been proposed as a measure of
environmental performance and sustainability by numerous agencies and environmental groups.
The LCA approach is useful because the impacts of all activities involved in production, use, and
retirement of a product are expressed in a single “common currency”—energy use, for example—
thereby making it easy to compare impacts among various products, processes, or activities. Life
cycle assessment must have clearly defined boundaries because impacts can, in theory, flow almost
endlessly upstream and downstream of the actual production process. For example, an energy LCA
for aquaculture may include energy costs to procure pelagic fish for reduction to fish meal that will
be used in feeds. The energy cost of fishing is primarily embodied in the fuel used by the fishing
vessel, but can also include the energy used to manufacture the fishing vessel, to produce the steel
and fiberglass used to fabricate the vessel, to produce the nylon used in nets, and so on. In this
analysis the boundary for analysis is set to the production phase only. Production data and resource
use was collected through detailed questionnaires from owner operators. Combining the power of
LCA with individual resource use indicators based on specific impacts provides a comprehensive set
of tools for assessing environmental performance.
1. Life Cycle analysis
To assess the GHG emissions associated with aquaculture systems, Life Cycle Assessment (LCA) is
the selected analytical tool to evaluate the potential impacts from the compiling of inputs and
outputs of the whole life cycle stages of product covering from raw material production,
manufacturing, distribution, consumption and final disposal. The methodology is internationally
standardized in ISO 14040/44: 2006 and has been applied in agri-food products including aquatic
products. LCA is based on the holistic approach thus offering the most comprehensive analysis and
giving the most possible impacts that can occur. More importantly, GHG emissions or called in LCA
as “Global Warming Potential” is not the only aspect considered in LCA but also other categories,
such as Eutrophication, Resource depletion, Stratospheric Ozone Depletion, Eco-toxicity, etc. It is
also worth to highlight the unique characteristics of LCA results as the relative potential impacts in
quantitative terms, which are very useful for making management or policy decisions.
All of the issues mentioned above have led to the question “Which aquaculture practices would be
friendly for climate and environment?” and “How can the environmental performance of
aquaculture systems be improved?” – which are the ultimate goal of this LCA study.

1.2 LCA methodology
Goal and scope
The goal of LCA study was aimed to evaluate the potential impacts associated with inputs and
outputs into different pond-based aquaculture system of Pangasius (Viet Nam), Black tiger prawn
(Viet Nam), Black tiger prawn (India), and Milkfish (Philippines). The system boundary was at the
farm-gate level, thus covering the hatchery, farm and feed production activities (Figure 1). However,
related transports in all stages are excluded. The functional unit was set as one ton of fish/shrimp
(wet weight). The impact categories of interest are: Biotic resource use (wild seed, fish-in:fish-out),
Abiotic resource use (land, water, and energy), Global Warming Potential, and Eutrophication
Potential. The impact methodology used was based on midpoint impact by following the CML2
Baseline 2000 method. The results of LCA study would be used to identify the hot spots where
improvement can be made, including the potential options for environmental performance
improvement.
Figure 1: System boundary of LCA study
Data collection
The required inventory data were identified, i.e. the associated inputs and outputs in each stage of
the system boundary. The foreground data were mainly from the primary data collected via
questionnaires. The amount of inputs and outputs were based on the average data of annual
production in 2010. The background data, such as the production of inputs, were gathered from the
literatures most relevant to the studied site (Table 1-4).
Table 1: List of required inventory data and sources of data of the inputs and output from milkfish
farming system in Philippines

Life cycle
stage
Data source
Primary data Secondary data
Farm Inputs: Background data:
Hatchery-reared seed Electricity production
Land Diesel production and combustion
Water Limestone production
Feed Vitamin production
Electricity Feed production
Vitamin
Limestone
Diesel
Outputs:
Milkfish
Total N
Total P
Table 2: List of required inventory data and sources of data of the inputs and output from shrimp
farming system in India
Life cycle
stage
Data source
Primary data Secondary data
Hatchery Inputs: Background data:
Wild broodstock Electricity production
Land Fertilizer production
Water Probiotic production
Artemia Crop production (feed ingredients)
Feed Feed production
Electricity
Fertilizer
Outputs:
Hatchery-reared seed
Waste water
Total N
Total P
Farm Inputs: Background data:
Hatchery-reared seed Electricity production
Land Diesel production and combustion
Water Limestone production
Feed Feed production
Electricity
Limestone
Diesel
Outputs:
Shrimp
Wastewater
Total N
Total P

Table 3: List of required inventory data and sources of data of the inputs and output from shrimp
farming system in Viet Nam
Life cycle
stage
Data source
Primary data Secondary data
Hatchery Inputs: Background data:
Wild broodstock Electricity production
Land Fertilizer production
Water Feed production
Feed
Electricity
Fertilizer
Outputs:
Hatchery-reared seed
Waste water
Total N
Total P
Farm Inputs: Background data:
Hatchery-reared seed Electricity production
Land Diesel production and combustion
Water Limestone production
Feed Feed production
Electricity
Limestone
Diesel
Outputs:
Shrimp
Wastewater
Total N
Total P
Table 4: List of required inventory data and sources of data of the inputs and output from Pangasius
catfish farming system in Viet Nam
Life cycle
stage
Data source
Primary data Secondary data
Hatchery Inputs: Background data:
Wild broodstock Electricity production
Land Fertilizer production
Water Feed production
Feed
Electricity
Fertilizer
Outputs:
Hatchery-reared seed
Waste water
Total N
Total P
Farm Inputs: Background data:

Hatchery-reared seed Electricity production
Land Vitamin production
Water Feed production
Feed Probiotic production
Electricity
Vitamin
Probiotic
Outputs:
Pangasius
Waste water
Total N
Total P
1.3 Results
Inventory analysis results
The inputs and outputs in quantitative terms were analysed and expressed in terms of quantity per
ton of fish/shrimp to reflect the material intensity level as well as the resource use efficiency (Table
5-8).
Table 5: Inventory table of the inputs and output from milkfish farming system in Philippines
Life cycle stage Inventory item Amount Unit
Farm Inputs:
Hatchery-reared
seed
67,573 numbers
Compound feed 6.07 kg
Electricity 0 kWh
Limestone 0 kg
Diesel 0 L
Water 8,010 m3
Outputs:
Milk fish 1,000 kg
Wastewater 8,010 m3
Total N NA mg/L
Total P NA mg/L
P. monodon shrimp (Indian)
Table 6: Inventory table of the inputs and output from shrimp farming system in India
Life cycle stage Inventory item Amount Unit
Hatchery Inputs:
Compound feed 5 kg
Electricity 229 kWh
Fertilizer 2 kg
Probiotic 2 kg
Artemia 4.5 kg
Water used 35 m3

Outputs:
Hatchery-reared
seed
1,000,000 numbers
Wastewater 35 m3
Total N 0.59 mg/L
Total P 0.11 mg/L
Farm Inputs:
Hatchery-reared
seed
NA numbers
Compound feed 1,499 kg
Electricity 2,732 kWh
Limestone 62 kg
Fuel 1,326 L
Water 33,155 m3
Outputs:
Shrimp 1,000 kg
Waste water 33,155 m3
Total N NA mg/L
Total P NA mg/L
P. monodon shrimp (Viet Nam)
Table 7: Inventory table of the inputs and output from shrimp farming system in Viet Nam
Life cycle stage Inventory item Amount Unit
Hatchery Inputs:
Compound feed NA kg
Electricity NA kWh
Fertilizer NA kg
Probiotic NA kg
Artemia NA kg
Outputs:
Hatchery seed NA numbers
Waste water NA m3
Total N NA mg/L
Total P NA mg/L
Farm Inputs:
Hatchery-reared
seed
NA numbers
Compound feed NA kg
Electricity NA kWh
Limestone NA kg
Diesel NA L
Water NA m3
Outputs:
Shrimp NA kg
Wastewater NA m3
Total N NA mg/L
Total P NA mg/L
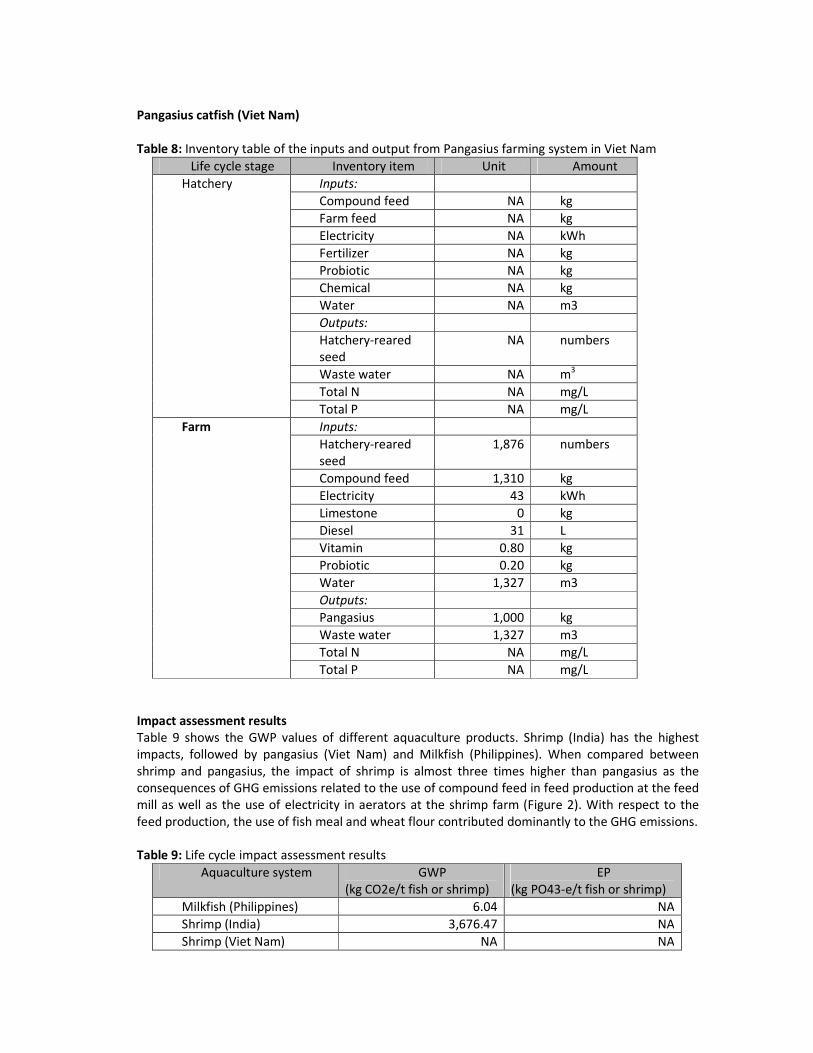
Pangasius catfish (Viet Nam)
Table 8: Inventory table of the inputs and output from Pangasius farming system in Viet Nam
Life cycle stage Inventory item Unit Amount
Hatchery Inputs:
Compound feed NA kg
Farm feed NA kg
Electricity NA kWh
Fertilizer NA kg
Probiotic NA kg
Chemical NA kg
Water NA m3
Outputs:
Hatchery-reared
seed
NA numbers
Waste water NA m3
Total N NA mg/L
Total P NA mg/L
Farm Inputs:
Hatchery-reared
seed
1,876 numbers
Compound feed 1,310 kg
Electricity 43 kWh
Limestone 0 kg
Diesel 31 L
Vitamin 0.80 kg
Probiotic 0.20 kg
Water 1,327 m3
Outputs:
Pangasius 1,000 kg
Waste water 1,327 m3
Total N NA mg/L
Total P NA mg/L
Impact assessment results
Table 9 shows the GWP values of different aquaculture products. Shrimp (India) has the highest
impacts, followed by pangasius (Viet Nam) and Milkfish (Philippines). When compared between
shrimp and pangasius, the impact of shrimp is almost three times higher than pangasius as the
consequences of GHG emissions related to the use of compound feed in feed production at the feed
mill as well as the use of electricity in aerators at the shrimp farm (Figure 2). With respect to the
feed production, the use of fish meal and wheat flour contributed dominantly to the GHG emissions.
Table 9: Life cycle impact assessment results
Aquaculture system GWP
(kg CO2e/t fish or shrimp)
EP
(kg PO43-e/t fish or shrimp)
Milkfish (Philippines) 6.04 NA
Shrimp (India) 3,676.47 NA
Shrimp (Viet Nam) NA NA

Pangasius (Viet Nam) 1,327.90 NA
Figure 2: Contribution analysis of GWP results of different aquaculture products
4. Discussion
Figure 3 shows the comparative GWP figures of different aquaculture products. The level of GHG
emissions of Indian shrimp is lower than Chinese shrimp and French trout, but higher than Canadian
salmon, Norwegian salmon, Indonesian tilapia, Vietnamese pangasius catfish, and Filipino milkfish.
Vietnamese pangasius and Filipino milkfish are much lower than the others, as it requires rather low
level of inputs and no use of electricity.

Figure 3: Comparative GWP figures of different aquaculture products
Conclusions
The GHG emissions from aquaculture products are mainly from the use of compound feed and
electricity for aerators. Thus, the feeding management and the optimal operation of aerators must
be given the attention in order to reduce the GHG emissions. More importantly, the potential
impacts associated with feed ingredients especially fish meal and wheat flour should be taken into
account at the feed mill. The energy performance of aerators used should also be considered at the
farm, i.e. aerators with high-energy efficiency are preferred with the monitoring of optimal level of
oxygen in ponds. Another considerable factor affecting to the potential impacts of aquaculture
systems are related to the quality of seed which is linked to the farm productivity (though the
impacts from seed production itself is rather low) and therefore the GWP values.
2. Analysis of feed resource use
Nutrient requirement for the fish and shrimp production in ponds is provided either by natural
productivity of the pond or by feed. This ratio varies with the culture system. A large proportion of
the nutrient requirements for semi-intensive milkfish pond and shrimp pond production are
provided by pond water productivity (phytoplankton, zooplankton and other micro-organisms)
which is enhanced by using organic and/or inorganic fertilisers. On the other hand, almost all the
nutrient requirements for intensive Pangasius catfish pond production are provided by inert feeds.
In some cases aquaculture feed often incorporates high levels of fish meal and fish oil provided from
wild stocks and so aquaculture fish may not be a net producer of fish.
Feeds are usually are the most costly aquaculture input, and feed ingredient production, feed
manufacture and transport constitute large proportion of energy inputs to aquaculture production.
The efficiency of feed use varies between species, feed quality and feeding strategy. This can vary
between culture systems and species where the feed conversion rate for salmon is close to 1:1,
Milkfish cage production at 2.5:1 using inert feeds to grouper cage production at 5:1 using trash fish.

Not all the nutrients produced through the feed are taken up by the fish with the majority of
nutrients lost to the environment either as solids (uneaten feed or faeces) or as dissolved nutrients
(excretion). These nutrients are assimilated by the environment but if there are excess nutrients,
they can form an anoxic layer on the seabed surface or cause eutrophication or trigger algal blooms.
It also is significant to note that the amount of waste generated per unit of production decreases as
the FCR declines.
The most widely used indicator of production and feed use efficiency in aquaculture is the feed
conversion ratio (FCR). This indicator is calculated as follows:
FCR = feed provided, kg
Net aquacultural production, kg
Aquaculture uses most of the world’s fishmeal (68%) and fish oil (88%) with the balance used by
intensive livestock agriculture and for pet foods (Tacon, 2005; Tacon et al., 2006; Tacon and Metian,
2008). Salmon, trout and shrimp aquaculture which account for less than 10% of world aquaculture
production, use an estimated 26% of the world’s fish meal, but 74% of the fish oil (Tacon and
Metian, 2008). However, Tacon and Metian (2008) predict that fishmeal and oil use in aquaculture
will decrease while aquaculture production grows significantly, and that fish meal/oil will
increasingly be diverted from uses as bulk feed products to high priced, specialty, feed ingredients.
Fish Oil
Fish oil also is a component of some of aquaculture feeds. There is a finite supply of fish meal and
oil. Because fish oil has traditionally been viewed as a by-product of fish meal production, more
concern has been expressed in the past about the fish meal supply than the fish oil supply. The yield
of fish oil from reduction fisheries is significantly lower than the yield of fish meal. This suggests that
fish oil may in the future be a scarcer commodity than fish meal for use in aquafeeds. It takes 10 to
20 kg live fish to produce a kilogram of fish oil, but the quantity varies greatly by species and season
(Tacon et al., 2006).
However, “fish-oil ratios” and feed-fish equivalences that include oil are more difficult to calculate
and interpret than those for fish meal because of the large variation in fish oil yield and the history
of fish oil as a by-product of fish meal production. Nevertheless, the wild fisheries conservation
benefit of substituting vegetable oil for fish oil in aquaculture feeds is great. The main problem with
complete substitution is that marine species need long-chain polyunsaturated fatty acids in their
diet and fish oils are an excellent source. Also, the fatty acid profile of fish produced on feeds
containing only vegetable oil is different than fish produced with feeds containing fish oil, and this
may change the taste of the fish.
Fish meal
Fish used for making fish meal are provided primarily from wild pelagic fishery. In fish meal
manufacturing, the ratio of live fish to fish meal is about 4.5. Fish meal can also be produced from
the offal from processing of wild-caught or farmed fish. Offal contains more ash and less protein
than live fish, and fish meal from offal is of lower quality than that from live fish. Nevertheless, fish
meal from offal can be used in many applications to supplement marine fish meal. Shrimp heads
from processing can be used to make shrimp head meal that can be used in animal feeds.
Environmentalists are concerned over inefficient use of feed fish to make fish meal and fish oil for
aquaculture feeds. Feed fish are a component of world fisheries production, and it can be logically
argued that unless a Fish-in to fish out ratio (FIFO) of 1.0 or less is obtained, feed-based aquaculture
detracts from world fisheries production.

Currently, about 40% of aquaculture depends on formulated feeds: 100% of salmon, 83% of shrimp,
38% of carp (Tacon and Metian, 2008). An estimated 72% of all use of global aquaculture feeds is by
low trophic level herbivorous and omnivorous aquatic organisms (carps, tilapias, milkfish and
shrimp) each of which dominates in various countries.
Fish-in Fish-out Ratio (FIFO)
One of the current concerns in the aquaculture sector is the amount of wild fish that is required to
produce farmed fish. A number of different methods have been developed to calculate the amount
of wild fish that it takes to produce one tonne of farmed fish. One such methodology is based on the
Fish-in : Fish-out ratio (FIFO ratio). Using dry pellets, FIFO ratios for salmon range between 3:1 to
10:1 with Tacon and Metian (2008) calculating a FIFO ratio of 4.9:1 for salmon production, indicating
that 4.9 tonnes of wild fish are required to produce 1 tonne of farmed salmon.
A number of authors have developed methodologies for calculating FIFO ratios. These include:
• Tilapia Aquaculture Dialogue draft v2.0 (WWF, 2009),
• Tacon and Metian (2008),
• International Fishmeal and Fish Oil Organisation (IFFO) methodology (Jackson, 2009),
• EWOS methodology for fatty fish such as salmon (EWOS, 2009)
Table 1. Trends in Fish-In Fish-Out Ratios from 1995 to 2008 (Tacon and Metian, 2008).
Subsidised aquaculture FIFO (1995) FIFO (2008)
Salmon 7.5 4.9
Trout 6.0 3.4
Eels 5.2 3.5
Misc. Marine Fish 3.0 2.2
Shrimp 1.9 1.4
Net production aquaculture
Chinese and Indian major carps 0.2
Milkfish 0.2
Tilapia 0.4
American catfish 0.5
Freshwater prawns 0.6
The following provides a brief review of the assumptions that are used in the various models.
1. Tilapia Aquaculture Dialogue draft v2.0 Methodology
These models are based on the weight of fish caught and produced, and provide Fish Feed Efficiency
Ratios for fishmeal and fish oil.
(% fish meal in feed) x (eFCR)
FFERmeal = ------------------------------------------
22.2
(% fish oil in feed) x (eFCR)
FFERoil = --------------------------------------
5.0
The model assumes that the fishmeal produced from the fish caught for fish oil is wasted.

2. Tacon and Metian (2009)
The method used by Tacon and Metian (2009) effectively assumes that the excess fishmeal
produced from the fish caught for fish oil is wasted. In fact it is used as ingredients and materials for
other feed production. The IFFO (2009) method addresses this issue, but fails to recognise that
cultured salmon have a higher lipid level than the average wild fish. The models assume a yield of
fishmeal and fish oil of 22.5 and 5 percent on a wet weight to dry weight basis respectively.
3. IFFO methodology (Jackson, 2009)
The IFFO method applies the following equation:
Level of fishmeal in the diet + level of fish oil in the diet
IFFO FIFO Ratio = --------------------------------------------------------------------- x FCR
Yield of fishmeal from wild fish + level of fish oil from wild fish
This model corrects the Tacon and Metian (2009) model that implies that the extra fishmeal is
wasted and takes into account of both the fishmeal and fish oil use. However, the model is biased
against fish with high lipid levels such as salmon, trout and eels due to the differential between
some species of cultured fish with high lipid level compared to wild fish used for the production of
fish meal and fish oil.
4. EWOS methodology
The EWOS model compensates for fish that have relatively high fish oil concentrations (e.g. salmon)
on the basis of nutrients used and produced, and compares the ratios using the same assumptions
(fish meal and fish oil yields). The nutrient based ratio corrects this bias, and is the preferred ratios
to use for fatty fish such as salmon, trout and eels. The calculations are as follows:
For Marine Protein.
kg marine protein used
Marine Protein Dependency Ratio = -----------------------------------
kg marine protein produced
FMfeed x PrFM x eFCR
MPDR = -----------------------------------------
PrtSalm
where
MPDR Marine Protein Dependency Ratio
FMfeed Concentration of fishmeal in the feed (%)
PrFM Concentration of protein in fishmeal (as a proportion)
eFCR economic Feed Conversion Ratio
PrtSalm Concentration of protein in the salmon on whole fish basis (%)

For Marine Oil
Kg marine oil used
Marine Oil Dependency Ratio = -----------------------------------
Kg marine oil produced
(Fofeed x FMfeed x FoFM)) x eFCR
MPDR = ---------------------------------------------------
OilSalm
where
MODR Marine Oil Dependency Ratio
FoFeed Concentration of fish oil in the feed (%)
FMfeed Concentration of fishmeal in the feed (%)
FoFM Concentration of fish oil in fishmeal (as a proportion)
eFCR economic Feed Conversion Ratio
OilSalm Concentration of oil in the salmon on whole fish basis (%)
For the purpose of this report, the IFFO formula was adopted and used to analyse the results of this
study as the trial species do not have high lipid levels when compared to salmon, and accounts for
other uses of the unused fishmeal and fish oil which is not the case with the method used by Tacon
and Metian (2009).
The estimated FIFO ratios for the case study culture systems used the following formula;
Level of fishmeal in the diet + level of fish oil in the diet
------------------------------------------------------------------------- x FCR
Yield of fish meal from wild fish+ yield of fish oil from wild fish
The results indicate that the FIFO ratio for the case study culture systems was as follows
Table 2. Results of AquaClimate case study analysis for FIFO Ratio
Case study culture system FIFO
Shrimp pond culture, India 1.23
Pangasius pond culture, Vietnam 0.28
Shrimp pond culture, Vietnam 0.07
Milkfish pond culture, Philippines 0.00
The difference between the Indian and Vietnamese shrimp FIFOs is in large part because the
Vietnamese system depends on natural productivity rather than feed input; catfish and milkfish FIFO
is low because they are omnivorous/herbivorous and can be grown on lower protein diets / algal
mats
The case study results were benchmarked against other estimated FIFO ratios as follows:
Table 3.Fish In Fish Out Ratios (Adapted from Tacon and Metian, 2008)
Subsidized aquaculture FIFO (2008)
Salmon 4.9
Trout 3.4
Eels 3.5

Misc. Marine Fish 2.2
Shrimp 1.4
Shrimp in India (AC) 1.23
Net production aquaculture
Freshwater prawns 0.6
American catfish 0.5
Tilapia 0.4
Pangasius catfish (AC)
Chinese and Indian major carps 0.2
Milkfish 0.2
Shrimp in Vietnam (AC) 0.07
Milkfish in Philippines(AC) 0.0
*AC = AquaClimate results
Figure 1. Comparison of wild fishery resource use efficiency (Fish-in Fish-out ratio)
Note. There is a difference in the intensities of the production systems. Vietnamese shrimp
systems are ‘low' intensity shrimp culture systems Indian shrimp and Philippine milkfish are
‘medium' intensity culture systems and Pangasius catfish culture systems are very intensive
culture systems.
3. Analysis of water Resource use
Water use in aquaculture can be extreme—as high as 45 m3/kg of fish production (FAO). The
potential for increased water use efficiencies in aquaculture is higher than terrestrial systems.
Globally about 1.2 m3 (or 1200 liters) of water is needed to produce 1 kg of grain used in animal
feed (Verdegem et al., 2006). A kg of tilapia can be produced with no consumptive freshwater use
(cages, seawater farming systems), or using as little as 50 L of freshwater (Rothbard and Peretz,
2002). Seawater aquaculture systems (mariculture) can use brackishwaters unsuitable for
agriculture; plus, integrated, land-based saltwater faming is possible (Fedoroff et al., 2010).
0
1
2
3
4
5
6
Salmon Trout Eels Misc.
Marine Fish
Shrimp
T&M
Shrimp,
India - AC
Freshwater
prawns
American
catfish
Tilapia Catfish,
Vietnam -
AC
Major carps Milkfish
T&M
Shrimp,
Vietnam -
AC
Milkfish,
Philippines -
AC
SU
BS
IDIS
ED
PR
OD
UC
TIO
N

Water use in aquaculture may be classified as either total use or consumptive use (Boyd, 2005).
Total water use is the sum of all inflows (precipitation, runoff, seepage, and management additions)
to production facilities. Much of the water entering production facilities passes downstream in
effluent discharge. Consumptive water use includes reduction in stream flow as a result of
increased evaporation and seepage from the aquaculture facility, freshwater from wells, and water
removed in biomass of aquatic animals at harvest (Boyd, 2005). Water in harvest biomass averages
about 0.75 m3/t, a minor quantity that usually can be ignored.
Boyd (2005) proposed indices for water use and water value that can be calculated for either total
or consumptive use as follows:
Water use index,m3/t = Water use,m3
Production, t
Total water use varies greatly in aquaculture depending mainly upon the culture method used.
Cage and net pen culture use water passively as it passes through the nets by the currents and
raceway culture uses the most water where water actively passes through the tanks by gravity or
pump. Water use in ponds varies with the intensity of production, frequency of draining, and
amount of water exchange employed.
Consumptive use of freshwater in aquaculture is an important conservation issue. Total and
consumptive water use is the same for cage and net pen culture, for the only water consumed is
that incorporated into biomass. In raceway culture, water in biomass plus evaporation from
raceways is consumptive use.
Table 3. Results of AquaClimate case study analysis for water use
Case study culture system m3/t
Shrimp pond culture, Vietnam 47,500
Shrimp pond culture, India 33,155
Milkfish pond culture, Philippines 8,010
Pangasius pond culture, Vietnam 1,327
These results were benchmarked against other estimates of water resource use as follows;
Table 4. Low water use - Average use less than 3000 cubic meters/tonne product. Adapted from
Costa-Pierce
Systems Estimated water use
(m3/t product)
Comments
Seawater farming
(halophytes, marine fish,
shellfish, seaweeds,
euryhaline fish such as tilapia)
0 - 100 Freshwater use is for makeup waters to
replace evaporation in land-based
farming systems. Hodges et al. (1993);
www.seawaterfoundation.org; Federoff
et al. (2010)
Recirculating aquaculture
systems
500 - 1,400 Intensive Africa catfish, eel and turbot
fed complete feeds Verdegem et al.
(2006)
Pangasius culture in Vietnam 1,327 Intensive striped catfish culture in
ponds using complete feeds.
AquaClimate

Freshwater fish production 2,700 Intensively mixed pond with production
of 100 MT/ha/yr. Verdegem et al.
(2006)
Tilapia 2,800 Brummett (1997)
Table 5. Medium water use Average use 3000 - 10,000 cubic meters/tonne product
Systems Estimated Freshwater
Use (m3/t product)
Comments
Catfish 3,350 (with reuse for
irrigation)
Brummett (1997)
Catfish 4,000 - 16,000 (low -
undrained embankment
ponds, high - drained
watershed ponds)
Eliminating well water as
consumptive use would decrease
water use in embankments ponds
to 2,600 - 3,200. Boyd (2005)
Fish in freshwater ponds 5,200 If infiltration, drainage and recharge
are considered green water
Pangasius catfish Vietnam 6,400 average industry
wide
Phan et al. (2009)
Fish in freshwater ponds 4,700 - 7,800 Production of 10-20 MT/ha/yrwith
night time aeration
Milkfish culture in the
Philippines
8,010 Semi-intensive milkfish culture in
ponds using supplementary feeds.
AquaClimate
Table 6. High water use (average use >10,000 cubic meters/tonne product)
Systems Estimated water Use
(m3/t product)
Comments
Shrimp farming in ponds 11,000 – 43,000 Beveridge et al. (1991) *
Fish culture 11,500 Fed freshwater species Verdegem et al.
(2006)
Trout (90% recycling) 25,000 (252,000
withdrawal)
Brummett (1997)
Fish in freshwater ponds 30,100 Production of 30 MT/ha/yr with20%
water exchange Verdegem et al. (2006)
Shrimp culture in India 35,155 Semi –intensive striped monodon shrimp
culture in ponds. AquaClimate
Extensive fish culture 45,000 No feed Verdegem et al. (2006)
Shrimp culture in
Vietnam
50,179 Semi –intensive striped monodon shrimp
culture in ponds. AquaClimate
Pangasius catfish
Vietnam
up to 59,700 Wide range from 700 to 59,700
Phan et al. (2009)
Trout (75% recycling) 63,000 (252,000
withdrawal)
Brummett (1997)
* This figure may not still be accurate as in the 90’s shrimp farms used to undertake regular
water changes. However, that practice stopped when whitespot virus became prevalent and
farmers minimised water exchange to reduce risk of disease entry.

Figure 2. Comparison of direct water use efficiency (m3/t)
Note. There is a difference in the intensities of the production systems. Vietnamese shrimp
systems are ‘low' intensity shrimp culture systems Indian shrimp and Philippine milkfish are
‘medium' intensity culture systems and Pangasius catfish culture systems are very intensive
culture systems.
Total water use is important where water is pumped into aquaculture facilities, for there is an
energy cost for doing so. In marine shrimp culture, large amounts of water may be pumped into
ponds to effect water exchanges. Total water use also is important where water right issues are
involved.
Competition may occur between aquaculture and other water uses (Yoo and Boyd, 1994; Boyd et
al., 2005). Withdrawal of groundwater for use in ponds may lower water table levels and lessen the
discharge of other wells in the vicinity. Installation of several ponds on a watershed may lessen
downstream flow. Some large, flow-through aquaculture facilities may take water from streams,
irrigation systems, or other sources and discharge into different water courses. Although these
aquaculture facilities do not consume large amounts of water, they may alter downstream flow
patterns and lessen the amount of water available to other users. Cage and net pen culture
consumes little water and coastal ponds for brackish water aquaculture consume none.
Nevertheless, these facilities may interfere with the use of water bodies or adjacent land areas by
other resource users.
Table X Comparison of Aquaculture production against other livestock production
Case study culture system m3/t
Shrimp pond culture, Vietnam 47,500 AquaClimate
Beef 15,000 -43,000 Smil (2008); Pimentel and Pimentel (2003)
Shrimp pond culture, India 33,155 AquaClimate
Pork 10,000 Smil (2008)
0
10,000
20,000
30,000
40,000
50,000
60,000
70,000

Milkfish pond culture, Philippines 8,010 AquaClimate
Pork 6,000 Pimentel and Pimentel (2003)
Chicken 4,000 Smil (2008)
Broiler Chickens 3,500 Pimentel and Pimentel (2003)
Egg production 2,700 Verdegem et al. (2006)
Milk production 2,700 Verdegem et al. (2006)
Pangasius pond culture, Vietnam 1,327 AquaClimate
4. Analysis of land resource use
Aquaculture uses land in two ways. First, aquaculture facilities occupy a defined area or space on
land or in water; however, facility area accounts for only a portion of the total land or water area
needed to produce an aquaculture crop. Additional ecosystem area is needed to provide support or
service functions. The two most important of those functions are food production and waste
treatment (Boyd, 2006; Boyd and Polioudakis, 2006).
Land-based aquaculture converts land surface area to water surface area. Pond production data
reflect this land use when reported as biomass harvested per unit water surface area. However,
land use for production facilities in not always conveniently reported in area terms. Production in
raceways, tanks, and indoor water reuse systems is reported on a volume (kg/m3, for example) or
water-flow (kg/m3 per sec, for example) basis because the culture unit surface area usually is small.
Cages, net pens, and shellfish plots do not use land in the traditional sense, but they occupy space
in water bodies.
When expressed on an area basis, the land or water area needed per unit production of
aquaculture crop varies over more than two orders of magnitude. At one extreme are highly
intensive water recirculating systems, which are capable of annually producing 1,000 to 2,000
tonnes of fish per hectare of culture unit (Timmons et al., 2001) or 350 tonnes of Pangasius catfish
per hectare. Fish and shrimp production in ponds requires several hundred times the land area
compared with intensive recirculating systems.
In addition to surface area devoted to culture of aquatic organisms, land surface area must be
dedicated to support of production facilities. Pond aquaculture requires embankments, intake and
discharge canals, settling basins, and pump stations. Aquaculture facilities have access roads,
parking lots, storage areas, staging areas, space for administrative and service buildings, etc. Boyd
(2010) estimated that with watershed catfish ponds in Alabama that the land used for support
purposes typically is about 25% of pond water surface area. Watersheds normally have other uses,
and although necessary for aquaculture, they are not dedicated specifically to aquaculture.
In marine shrimp culture, canals are used to supply and discharge water at farms. Farms of 25 ha or
more in size usually have support areas of about 25% of water surface areas, but the support area
may increase to as much as 50% at smaller farms. Catfish pond facilities in Mississippi typically have
only 10–15% of the total land area devoted to support, and the support area as a proportion of
total land area decreases slightly as farm size increases (Keenum and Waldrop, 1988). For a farm
with a total land area of 65 ha, 2% of the area is used for buildings, parking, feed storage, etc., 13%
of the area is in embankments, and the water surface comprises 85% of the area. For a farm with a
total area of 260 ha, the estimates are 1%, 11%, and 88%, respectively.
Table 7. Results of AquaClimate case study analysis for land use
Case study culture system m2/t
Shrimp pond culture, Vietnam 80,594

Shrimp pond culture, India 14,095
Milkfish pond culture, Philippines 2,339
Pangasius pond culture, Vietnam 24.16
The large land use by shrimp farming in Vietnam again reflects the very low intensity of the system.
These results were benchmarked against other estimates of water resource use as follows;
Table 8. Efficiencies of land use for aquaculture system. Adapted from Verdegem et al. (2006).
System types Descriptions Production
(kg/ha/year)
Efficiency of land
use (m2/MT)
Extensive On-farm resources 100 - 500 20,000 - 100,000
Semi-intensive
shrimp (Vietnam)
Very low intensity system with some
supplemental feed use
120 80,594
Extensive On-farm resources, fertilizers 100 - 1000 10,000 - 100,000
Semi-intensive
shrimp (India)
Low intensity system with supplemental
feeds,
710 14,095
Semi-intensive Supplemental feeds, static 2,000 - 8,000 1,250 - 5,000
Extensive Milkfish
(Philippines)
Supplemental feeds, 4,270 2,339
Semi-intensive Supplemental feeds, water exchanges 4,000 - 20,000 500 - 2,500
Semi-intensive Supplemental feeds, water exchanges,
night aeration
15,000 - 35,000 300 - 700
Intensive Complete feeds, water exchanges, night
aeration
20,000 - 50,000 200 - 500
Intensive Complete feeds, water exchanges,
constant aeration
20,000 -
100,000
100 - 500
Intensive
Pangasius (Vietnam)
Complete feeds 4,130,000 24.16

Figure 3. Comparison of land use efficiency (m2/t log scale)
In addition to the physical space occupied by the facility, land is required to produce plant meals
and oils for aquafeeds. Corn meal, soybean meal, peanut meal, cottonseed meal, wheat middlings,
rice flour, and vegetable oils are common plant products used in aquafeeds. Cotton seed meal and
wheat middlings are by-products of cotton fiber and wheat flour production. Vegetable oils are
extracted from soybeans, peanuts, corn, and other seeds in the process of making meals. Their use
in aquafeeds usually does not require land dedicated specifically for production. Land must be
dedicated specifically for the production of corn, soybean, peanut, and certain other plant meals
used in aquafeeds.
In addition to land area for facilities and to produce food, ecosystem area is needed to assimilate
wastes produced during aquaculture. In ponds and recirculating systems, significant quantities of
waste produced during culture are treated within the facility, and there is relatively little external
area needed for waste treatment. On the other hand, much of the waste produced in raceway and
net pen culture is discharged directly to the outside environment. The ability of the external
ecosystem to assimilate those wastes may limit aquaculture production either by polluting the
surrounding water to the point where animal welfare inside the facility is endangered (“self-
pollution”) or by imposing limits to the amount of waste that can be discharged due to regulatory
constraints. In addition to effects on aquaculture production, waste discharge into public waters
creates societal externalities such as degraded water quality, water treatment costs, and other
downstream impacts.
However in this study we do not estimate land requirement for feed ingredient production or
effluent water treatment.
5. Analysis of energy resource use
There are many uses of energy in aquaculture including energy used for construction of facilities,
production of liming materials, fertilizers, production and transport of feed and feed ingredients,
1.00
10.00
100.00
1,000.00
10,000.00
100,000.00

operation of machines and vehicles during culture and harvesting, processing, transportation, etc.
However, only two of these energy inputs can be readily estimated at the farm level. These are
energy uses for pumping water and for mechanical aeration, and, at the farm level, they are the
major, direct energy inputs. This discussion will be limited to pumping and aeration, but studies of
total energy use per tonne of aquaculture production should be conducted for a number of species
and culture methods.
Mechanical aerators powered by internal combustion engines or electric motors are used to
supplement the natural supply of dissolved oxygen in grow-out systems. Aeration allows greater
stocking and feeding rates to increase production.
Aeration rates in pond aquaculture often are expressed in horsepower per hectare or horsepower
applied per volume (Boyd and Tucker, 1998). In channel catfish farming, aeration usually is applied
at 4 to 8 hp/ha, while in intensive marine shrimp culture, rates of 10 to 30 hp/ha may be applied.
Use of electricity typically is measured in kilowatt·hours (kW·h), and 1 hp = 0.745 kW. However,
there are inefficiencies in the use of electricity by machines, and for aerators, the typical efficiency
is about 90% (Boyd, 1998). Thus, electricity use for aeration can be estimated as follows:
Aeration energy, kW = Aerator power, hp × Aeration time, hr × 0.745 kW/hp
Production, t × 0.9
Aerators in channel catfish ponds in the southeastern United States normally are operated between
May and September for about 10 h/night. Aeration at 6 hp/ha in a catfish pond will use 7,599 kW·h
of electricity during a crop year or about 950 kW·h/t for production of 8,000 kg/ha.
Production of marine shrimp in a pond with 15 hp aeration/ha might be 8,000 kg/ha for a 120-day
crop. Aeration usually is supplied 24 h per day for at least 100 days, but only half of the aerators
may be operated during the day. The total electrical use will be about 27,000 kW·h or 3,375
kW·h/t—over three times the amount of aeration used for channel catfish.
In Asia, paddlewheel aerators often are driven by small, internal combustion engines powered by
diesel fuel or gasoline. Energy use can be estimated from fuel consumption; 1 L diesel fuel is equal
to 3.27 kW-h while 1 L of gasoline equates to 2.21 kW-h (Yoo and Boyd, 1994).
The energy use for pumping water to supply ponds can be estimated as follows:
P = γQH
E
where P = power required by pump (kW), γ= specific weight of water (9.81 kN/m3), Q = discharge
(m3/sec), H = pumping head (m), and E = pump efficiency (decimal fraction).
Boyd and Tucker (1995) used this equation and water management data to estimate that about
1,275 kW·h of electricity typically would be used to fill a 1-ha channel catfish ponds. Annual energy
use for pumping water to maintain water levels would be less than 500 kW·h in humid climates and
up to 2,000 kW·h in arid climates. Assuming total energy use of 1,775 kW·h//ha per year for catfish
ponds in a humid climate, the energy use for pumping would be about 296 kW·h/t as compared to
950 kW·h/t for aeration.
Table 9. Results of AquaClimate case study analysis for energy use
Case study culture system MJ/t
Shrimp pond culture, India 57,718

Pangasius pond culture, Vietnam 1,287
Shrimp pond culture, Vietnam 517
Milkfish pond culture, Philippines 2
The Indian shrimp culture system has a much larger energy use compared to the other culture
systems due to the use of pumps and aerators. Al though Pangasius catfish culture also uses pumps
for water exchange, Pangasius catfish energy use is surprisingly efficient because of the economies
of scale offered by its extreme intensity. The Vietnamese shrimp and milkfish power use is low
because they don’t use aeration and/or are system is tidally fed.
These results were benchmarked against other estimates of water resource use as follows;
Table 10. Efficiencies of energy use for aquaculture system. Adapted from Costa-Pierce
Food Systems Production (MT/ha) MJ/MT References
Canada Salmon Net Pen
Water-Based
1,000 26,900 Ayer and Tyedmers (2008)
Canada Salmon Bag System
Water-Based
1,733 37,300 Ayer and Tyedmers (2008)
Canada Salmon Flow-through
Land Based
2,138 132,000 Ayer and Tyedmers (2008)
Canada Salmon Recirculating
Land-Based
2,406 233,000 Ayer and Tyedmers (2008)
Table 4. Comparison of direct energy use efficiency (MJ/t)
Note. There is a difference in the intensities of the production systems. Vietnamese shrimp
systems are ‘low' intensity shrimp culture systems Indian shrimp and Philippine milkfish are
1
10
100
1,000
10,000
100,000
1,000,000

‘medium' intensity culture systems and Pangasius catfish culture systems are very intensive
culture systems.
Studies using modified LCA methodology consistently show that the energy used to produce
aquafeeds dominates the energetics of aquaculture production. For example, more than 75% of the
total energy cost of producing Atlantic salmon in net pens is used in procuring or growing feed
ingredients and manufacturing the feed (Folke, 1988; Troell et al., 2004; Tyedmers, 2004; Ellingsen
and Aanondsen, 2006). The remaining energy inputs, in order of importance, were fuel and
electricity used to operate the facility, embodied energy costs (manufacture, maintenance, etc.)
associated with physical infrastructure, and energy used to produce smolts). Feed production
dominates the energy budgets of all aquaculture systems relying on aquafeeds, regardless of
species (Troell et al., 2004).
Life-cycle assessment of energy use can include post-harvest functions such as processing, freezing,
refrigeration, storage, transportation, marketing, waste treatment, and even household activities
such as refrigeration, freezing, and cooking. Energy use in these activities apparently has not been
assessed for aquaculture but may be an important part of the overall energy costs of delivering
aquaculture products to a consumer’s plate. For example, energy used in on-farm production of the
United States food supply accounts for only about 20% of the energy used to deliver food to the
consumer’s plate (Heller and Keoleian, 2000). Post-harvest processing and transportation each
consume about 15% and household preparation accounts for more than 30% of the total energy
consumed. Ultimately, it will be economically and socially imperative to improve the energy
efficiency of all aspects of the food-supply chain. However, it is possible that greater overall gains in
energy savings can be made by improving the efficiencies of processing, transport, retailing, and
even household storage and preparation than can be made by improving energy efficiency in the
production sector. This may have particular relevancy in aquaculture, where important products
are produced only in certain regions (marine shrimp in the tropics; salmon in the north-temperate)
and are stored and shipped long distances for ultimate consumption.
Energy comparisons between systems have become part of more detailed analyses of life cycles
(Papatryphon et al., 2004; Ayer and Tyedmers, 2008). Comparisons of these with terrestrial farming
show clearly the huge production benefits of intensive aquaculture albeit at a much higher energy
cost, contained mostly in feed (Ayer and Tyedmers, 2008). Over the coming decades, increasing
global energy, processing, shipping/transportation costs of both products and feeds are predicted
(FAO, 2008; Tacon and Metian, 2008).
In this study, we only consider the use of energy on the farm.
Table X Comparison of Aquaculture production against other livestock production
Case study culture system MJ/t Reference
Shrimp pond culture, India 57,718 AquaClimate
Norwegian Chicken 55,000 Munkung and Gheewala, 2007
Swedish Beef 33,000 Munkung and Gheewala, 2007
Pangasius pond culture, Vietnam 1,287 AquaClimate
Shrimp pond culture, Vietnam 517 AquaClimate
Milkfish pond culture, Philippines 2 AquaClimate
6. Analysis of wild seed and broodstock resource use
Capture-based aquaculture (CBA) does not have full control of the life cycle and relies on the
collection of seed, fry, fingerlings or broodstock from the wild. In other cases a proportion of the

seed is still collected from the wild as there is insufficient production of seed from hatcheries or
broodstock collected from the wild as it is difficult to condition mature broodstock artificially.
It is also used on low-value fish species that are sometimes extensively farmed with minimum
inputs. The main concern related to the collection of wild seed or broiodstock is whether the wild
fishery has a negative impact on wild stocks of the targeted species as well as non-targeted species.
Much is still unknown about early life history stage dynamics, however it is assumed that there is
some degree of linkage between seed collection and adult fisheries particularly when billions of
seeds taken each year such as was the case for milkfish.
Milk fish
Milkfish fry can either be obtained through collection from coastal areas or littoral waters or can be
produced in captivity. The supply of wild fry is often unpredictable; catches in recent years have
diminished and cannot satisfy the demand from ongrowing farms. Milkfish fry are phemonenally
abundant. Total catch potentials are not known but some 1.35 billion fry were collected in the
Philippines in 1974 and 700-800 million fry are collected in Indonesia each year. These fry go into a
grow-out culture industry that produces 285 000t of milkfish a year in southeast Asia.
Wild-caught fry are collected with fine-mesh seines and bag nets of various indigenous designs and
the most commonly used gear are push net 'sweepers' and dragged seines.
Shrimp
Due to their larger size and better survival, captured wild seeds were used commonly in south Asia
for extensive ponds, which require a minimal amount of seed for stocking. However, the use of wild
seeds has been reduced, due to overfishing and the outbreak of white spot disease in shrimp
nursery grounds. Therefore most Penaeus monodon grow-out farms now rely solely on hatchery-
produced seeds.
Indian monodon shrimp hatcheries were totally dependent upon the capture of gravid females
from the wild as a by catch from near shore shrimp trawling but there were shortages and it was
found that wild shrimp have a prevalence of MBV and WSSV. When MBV is less WSSV is more
significant and vice versa. This has triggered the research to condition broodstock in ponds.
Pangasius
Traditionally, aquaculture enterprises in the Mekong Basin were capture-based. Large numbers of
tra catfish larvae (Pangasianodon hypophthalmus) were, until recently, caught in the upper Mekong
delta near the border between Viet Nam and Cambodia. The fishery was concentrated in Chao Doc
and Tan Chau districts of An Giang Provinces in Viet Nam. Estimates from 1977 suggest that 200 to
800 million fry, 0.9 – 1.7 cm in length, were caught annually (based on data from An Giang
Department of Agriculture, cited in Trong, Hao and Griffiths, 2002). Pangasianodon hypophthalmus
were first artificially propagated in Thailand in 1959, and the technology has since spread
throughout south-east Asia (Trong, Hao and Griffiths, 2002).
However the aquaculture of Pangasiid catfishes is now largely based on hatchery produced seed. In
2006 there were 130 hatcheries (An Giang 15; Can Tho 5; Tien Giang 4; Vinh Long 3; and Dong Thap
103) in the Mekong Delta region of Viet Nam producing 10 billion catfish larvae and the production
of Pangasianodon hypophthalmus fingerlings reached 1 billion

7. Resource use and Global Warming Potential mitigation strategies
Fishmeal and fish oil use
Research on the use of agricultural meals and oils to replace use of fish meals and fish oil is a major
subject of aquaculture research and development (Watanabe, 2002; Opstvedt et al., 2003). Turchini
et al. (2009) reported that for all of the major aquaculture fish species 60–75% of dietary fish oil can
be substituted with alternative lipid sources without significantly affecting growth performance,
feed efficiency, and feed intake.
Terrestrial proteins and oils from soybeans, sunflowers and lupins are more readily available than
the fishmeal supplies. Soybeans have high protein content of around 28%, peas have around 22%,
and these have good amino acid profiles. However, soybean meal processing can create protein
concentrates with protein levels of greater than 50% (Bell and Waagbo, 2008). Vegetable oils have
very low EPA and DHA levels. However, substitution of plant oils upwards of 50% of added dietary
oil has not resulted in growth reductions or increased mortalities in fish such as salmon and trout.
Further research is required to identify feed ingredients that have the potential to eliminate the
needs for fishmeal and oils in aquaculture. For example beta-glucans that stimulate the immune
system of fish and protect against the effects of bacterial furunculosis also allow reductions in
fishmeal contents in diets to 25% (Skretting ). Phospholipids and antioxidants from other feed
ingredients (such as algal, bacterial, yeasts meals and oils) have the potential to provide the
required nutrient for good production performance with the inclusion of no marine fishmeal and
oil.
Water use (to be expanded)
Intensification
Biosecurity
Land use (to be expanded)
Intensification
Recapture (to be expanded)
Mangroves
Rice
Orchards
8. Better management practices to reduce greenhouse gas emissions and resource use (to be
expanded)
Existing BMPs for shrimp, catfish should serve as a starting point, as they are basically about
improving resource use efficiency and animal health, and will reduce greenhouse gas emissions
simply by reducing wastage. E.g.:
• Emission - reducing management strategies that also improve farmer income include:
o Improving animal health (everything from good pond preparation to screening seed
for disease), to reduce mortalities and crop losses. This ultimately reduces wastage
of feed and other inputs, and keeps the real world FCR and FIFO good.
o Other better management practices (for example there are quite a few things that
can be done to optimise feed use (although seldom practiced), such as feeding to

support the economically optimum growth rate rather than the biological maximum,
mixed feeding schedules, monitoring and storage etc.)
o Selective breeding to improve biological performance of the animals per unit input.
• Resource reduction strategies
o The case study data suggest that a moderate degree of intensification can
dramatically improve efficiency with regards to water and land use, probably power
too. It is worth noting that the most intensive system - catfish - is also the most
efficient user of power, land, water (this is partly also a species difference - tough, air
breathing, tolerant of crowding, deep ponds and environmental difference - Mekong
water supply).
o Grow low food chain species - herbivorous milkfish and omnivorous catfish are more
efficient from a FIFO perspective than carnivorous shrimp.
o Etc.
9. Conclusion
References.
Boyd, C.E., Tucker, C., McNevin, A., Bostick, K. & J. Clay. Indicators of resource use efficiency and
environmental performance in fish and crustacean aquaculture. Rev. Fisheries Sci. 15:327-360.
Costa-Pierce, B.A., Bartley, D.M., Hasan, M., Yusoff, F., Kaushik,S.J., Rana, K., Lemos, D., Bueno, P.
and Yakupitiyage, A. 2011. Responsible use of resources for sustainable aquaculture. Global
Conference on Aquaculture 2010, Sept. 22-25, 2010, Phuket, Thailand. Food and Agriculture
Organization of the United Nations (FAO), Rome, Italy.
NACA/FAO, 2000. Aquaculture Development Beyond 2000: the Bangkok Declaration and Strategy.
Conference on Aquaculture in the Third Millennium, 20-25 February 2000, Bangkok, Thailand.
NACA, Bangkok and FAO, Rome. 27pp.
Poulsen, A.; Griffiths, D.; Nam, S.; Nguyen, T.T. 2008. Capture-based aquaculture of Pangasiid
catfishes and snakeheads in the Mekong River Basin. In A. Lovatelli and P.F. Holthus (eds). Capture-
based aquaculture. Global overview. FAO Fisheries Technical Paper. No. 508. Rome, FAO. pp. 69–
91.