Choosing Wisely and Healthcare Resource Stewardship Council (HRSC)

centre for advanced engineering • christchurch • new zealand
Resource Stewardship and
Waste Minimisation
Towards a Sustainable New Zealand
Lesley Stone
EDITOR
ISBN 0-908993-36-6
Printing History
First published December 2003
Reprinted February 2004
All rights reserved. No part of this publication may be reproduced, stored in a retrieval
system, transmitted, or otherwise disseminated, in any form or by any means, except for
the purposes of research or private study, criticism or review, without the prior permission
of the Centre for Advanced Engineering.
Copyright
© 2003 Centre for Advanced Engineering
Publisher
Centre for Advanced Engineering
University of Canterbury
Private Bag 4800
Christchurch
New Zealand
Editorial Services, Graphics and Book Design
Charles Hendtlass, Centre for Advanced Engineering
Printing
Wickliffe Press, Christchurch
Cover Design
Hudson Design, Christchurch
Disclaimer
It will be noted that the authorship of this document has been attributed to the many individuals and organisationswho have been involved in its production. While all sections have been subject to review and final editing, theopinions expressed remain those of the authors responsible and do not necessarily reflect the views of the Centrefor Advanced Engineering.
Page iii
1 Contents
Acknowledgements ......................................................................................................................... v
CAE .................................................................................................................................................. vi
Part 1: The Context for Resource Stewardship andWaste Minimisation in New Zealand
1 Introduction .................................................................................................................................. 3
2 The Political Context .................................................................................................................... 7
3 Change Mechanisms ................................................................................................................. 13
4 Learning from Experience .......................................................................................................... 23
Part 2: Industry Sector Reports
5 The Dairy Sector ........................................................................................................................ 33
6 The Meat Sector ........................................................................................................................ 51
7 The Forestry Sector ................................................................................................................... 75
8 The Built Environment Sector .................................................................................................... 99
9 The Tourism Sector ................................................................................................................. 131
10 The Retail Sector ..................................................................................................................... 153
11 The Plastics Sector .................................................................................................................. 173
Part 3: Resource Stewardship: Improving theContribution of Waste Minimisation
12 Revisiting the Context .............................................................................................................. 205
13 Sector Group Responses ........................................................................................................ 207
14 Towards Resource Stewardship .............................................................................................. 225
Appendices: Instruments, Tools and Change Agents
1 Regulatory, Economic and Voluntary Instruments and Tools with Examples of their use in a Range of Countries ........................................................................................ 237
2 Brief Descriptions of a Range of NGOs that Work with Business on Resource Stewardship or Waste Minimisatio-related Activities ............................................................... 243
Index ............................................................................................................................................. 249

Page iv
Page v
Acknowledgements
SponsorsThe Centre for Advanced Engineering is most grateful to the following organisations that have gener-ously provided financial support for this project:
Sustainable Management Fund, Ministry for the Environment
Auckland Regional Council Christchurch City Council
Clutha District Council Dunedin City Council
Environment Canterbury Environment Southland
Gisborne District Council Rodney District Council
Southland District Council Taranaki Regional Council
West Coast Regional Council
Steering Committee
CAE also appreciates the help and guidance provided by members of the Steering Committeethroughout the project. The assistance of Ket Bradshaw, Ministry for the Environment, duringpreparation of this book is also gratefully acknowledged.
Allan Goddard, Auckland Regional council (Chairman)
Brigid Preston (then Ministry for the Environment)
Christine Byrch (then Christchurch City Council)
Clare Feeney (Environment and Business Group)
Dana Peterson (Ministry for the Environment)
Greg Brown (Eco$ense)
Jan Gregor (Environmental Science and Research Ltd)
Jim Bradley (Montgomery Watson Harza)
John Lumsden (Centre for Advanced engineering)
Lesley Stone (University of Auckland)
Norman Thom (University of Auckland)
Page vi
CAE at a Glance• is a not-for-profit organisation, established in 1987
• has a well-established, proven record of achievement
• is based at the University of Canterbury campus
• is concerned with issues of national and international importance
• is helping to develop new solutions through advancing engineering knowledge and practice
• is helping inform and educate New Zealand communities about technology matters.
Our MissionTo advance New Zealand's economic growth and social progress through broadening nationalunderstanding of emerging technologies and facilitating early adoption of advanced technologysolutions.
How we OperateCAE was built on a vision to raise this country's technical knowledge for the benefit of NewZealanders. CAE operates as a Charitable Trust under a Trust Deed registered by the Universityof Canterbury. The success to date of CAE is a result of the determination of the University ofCanterbury and CAE's former and current Trustees to actively promote and encourage theuptake of advanced engineering and technology. In doing so, CAE plays a strong integratingrole within New Zealand's engineering and technology sectors, undertaking major projects thatseek to build this country's technological capabilities in areas of national importance.Collaboration and the dissemination of knowledge are the cornerstone to achieving that goal.CAE's organisational strength lies in its ability to facilitate expert groups and provide theknowledge transfer capability to build upon the findings of specific project activity.
Historically, CAE activities have involved strong participation and financial support byindustry and the engineering profession. Much of its work has been directed at projects that gobeyond conventional engineering practice so as to create new perspectives on emergingtechnology trends to New Zealand. Its strategy is to be seen as a neutral, far-sightedcommentator on technology and engineering-related matters.
CAE's ContributionsBy progressing knowledge and technological understanding, CAE is uniquely positioned tofacilitate an expanding role for the engineering profession and to bring about a real change inthe technological capability of New Zealand. The organisation offers well-established projectmanagement skills and a wide network of academic, research, professional and business links,both national and international. As a knowledge broker, CAE gathers, interprets anddisseminates knowledge and information through the publication of books, the conduct ofseminars and conferences, and via its website.
Contact Details
Mail: CAE, University of Canterbury Campus, Private Bag 4800, Christchurch,New Zealand
Street Address: 39 Creyke Road, Ilam, Christchurch
Telephone: +64 3 364 2478Fax: +64 3 364 2069e-mail: [email protected]: www.caenz.com
CAE

Part 1:
The Context for Resource
Stewardship and Waste
Minimisation in New Zealand

Page 3Introduction
1Introduction
Lesley Stone1
1.1 BackgroundIn 1992, the Centre for Advanced Engineering (CAE) published Our Waste: Our Responsibility(CAE, 1992). This book, which became a much-used resource for waste practitioners in NewZealand, resulted from a major CAE project that involved over 120 people and included severalinternational experts.
The book was very much a product of its time. Three of its four main parts covered the thenprimary areas of debate: what to do with hazardous waste, how to progress from dumps toengineered landfills, and how to prevent contamination of water supplies. The remaining partcovered many new and emerging concepts that viewed wastes as resources and focused on theneed to prevent, reduce, re-use and recycle them in that order of priority. The term that wasused to describe the approaches within this hierarchy was ‘waste minimisation’.
This new publication arises out of a need to update the waste minimisation section (Part 2) ofOur Waste: Our Responsibility, and is based on the CAE Resource Stewardship: Waste Minimisa-tion (RS:WM) project, which was set up specifically for this purpose. It follows the earlierrelease, in April 2000, of Management of Hazardous Waste and Landfill Guidelines, Parts 3 and 4respectively of the original book, and becomes a companion volume in the CAE series, nowsubtitled: Towards a Sustainable New Zealand. The project has been substantially funded by agrant from the Sustainable Management Fund with further contributions from local andregional councils. The sponsors are acknowledged in the front of this book.
The goal of the CAE RS:WM project is to advance environmental sustainability in NZ bysharing knowledge, experience and tools to improve waste minimisation practices and raise thelevel of resource stewardship. A strong motivation is the need to ensure that waste managementpractitioners have access to the latest information. Fulfilling this need is a fundamental part ofthe journey towards sustainability.
The need for information is also consistent with The New Zealand Waste Strategy (MfE/LGNZ,2002). This document, prepared by the Ministry for the Environment (MfE) and released inMarch 2002, with its inclusive approach to both wastes and waste management options, hassignalled that there is now widespread recognition of the need for a comprehensive, integratedapproach to material and resource efficiency at every stage of production and consumption.
Over ten years have now passed since Our Waste: Our Responsibility was published by CAE and,to many people, waste minimisation has tended to become synonymous with the lower end ofthe hierarchy: i.e., re-use and recycling. Much has been achieved in New Zealand by the manygroups that have focused on these activities, and it is important for this work to continue, but itis not enough.
Significant benefits lie in encouraging people (and organisations) to consider the comparativeadvantages of avoiding and minimising the generation of waste in the first place. This isconsidered a significant issue for New Zealand. The ability to use resources in the most efficientand sustainable manner lies at the very root of the problem, and provides a large part of thesolution.
Quite apart from the fundamental underlying issues of sustainability, there is also the important
1 University of Auckland
Page 4 Resource Stewardship and Waste Minimisation
fact that New Zealand trades heavily on its ‘clean and green’ image and cannot afford to placethis image at risk. It is clear that, if the perception should change, it may do untold damage tothe economy.
In the past decade since Our Waste: Our Responsibility was published there has been a growingappetite for change in the way the environment is managed, and this has largely been drivenby:
• a change in the political context with respect to wastes of all kinds and waste minimisation;
• an increase in the use of instruments and tools to promote waste minimisation;
• an increase in activities of relevance to waste minimisation, particularly amongst non-governmental organisations (NGOs);
• research into the effectiveness of waste minimisation programmes; and more recently,
• pressure derived from the Kyoto Protocol concerning processes that emit gaseous waste.
These drivers are important because they reflect the context within which any further progresswill occur. Context is important because it affects the receptiveness of society to change, and itinfluences the effectiveness of change programmes (e.g. Eero, Grendstad and Wollebak, 2001).Later chapters will discuss each of these drivers and their relevance to further progress.
Waste minimisation activities are an important part of New Zealand’s journey towards sustain-ability. This book is about whether, how, and to what extent, these activities are really contribut-ing towards this journey.
The book has been divided into three parts.
• Part One provides a background to waste minimisation in New Zealand; particularly how itrelates to resource stewardship and an overview of the drivers mentioned above. Theseinclude: political context, instruments and tools, the role of non-government organisations,and the results of research into the effectiveness of waste minimisation programmes.
• Part Two provides an insight into the current status of waste minimisation and resourcestewardship in New Zealand within seven industry sectors that form a major part of theNew Zealand economy: dairy, meat, forestry, building, tourism, retail and plastics.
• Part Three provides a summary and discussion of the key findings, followed by conclusionsand recommendations.
1.2 Why Resource Stewardship?The term ‘resource stewardship’ has been used here because it is a fundamentally importantfacet of the drive towards the goal of a more sustainable future. Clearly, the processes that useresources and create waste have an important part to play in this journey. This section outlineshow the term encapsulates the ultimate purpose of waste minimisation, and how it relates toother concepts and approaches.
Resource stewardship reflects recognition of the need to assume greater responsibility forresources. This requirement is implicit in the concept of sustainable development, i.e. the needfor society to develop in a way that “meets the needs of the present without compromising theability of future generations to meet their own needs” (WCSD, 1987).
Resource stewardship is enshrined in the Resource Management Act 1991 (RMA), the principalpurpose of which is to promote the sustainable management of natural and physical resources(s5). It is also implicit in the ‘sustainability principles’ of the Energy Efficiency and ConservationAct 2000 (EEC Act) (s6).
Resource stewardship is also consistent with the Maori concepts of kaitiaki and kaitiakitanga. The
Page 5Introduction
NZ Waste Strategy defines kaitiaki as “guardians or stewards of resources who promote theintegrity of the resource” and kaitiakitanga as “guardianship over the land and its resources”. Inthe RMA, kaitiakitanga is similarly defined as “the exercise of guardianship” which, “in relationto a resource, includes the ethic of stewardship based on the nature of the resource itself” (s2).The Maori view is very relevant. There is much that society, in general, can learn from theseconcepts and, in doing so, gain a better understanding of how people and nature are irrevocablyintertwined.
Many times in the past decade, a new concept or approach has been promoted as the ‘one trueway’ to achieve sustainability. This often has had more to do with the limited availability offunding for sustainability-related initiatives in New Zealand and the competition that it engen-ders, than the inherent superiority of any one concept or approach. Its effect, often, is to confusemany of those who would normally be in the target audience for sustainability initiatives, toshut down communication, to minimise the availability of resources, and to limit the learningthat can occur when experiences are shared.
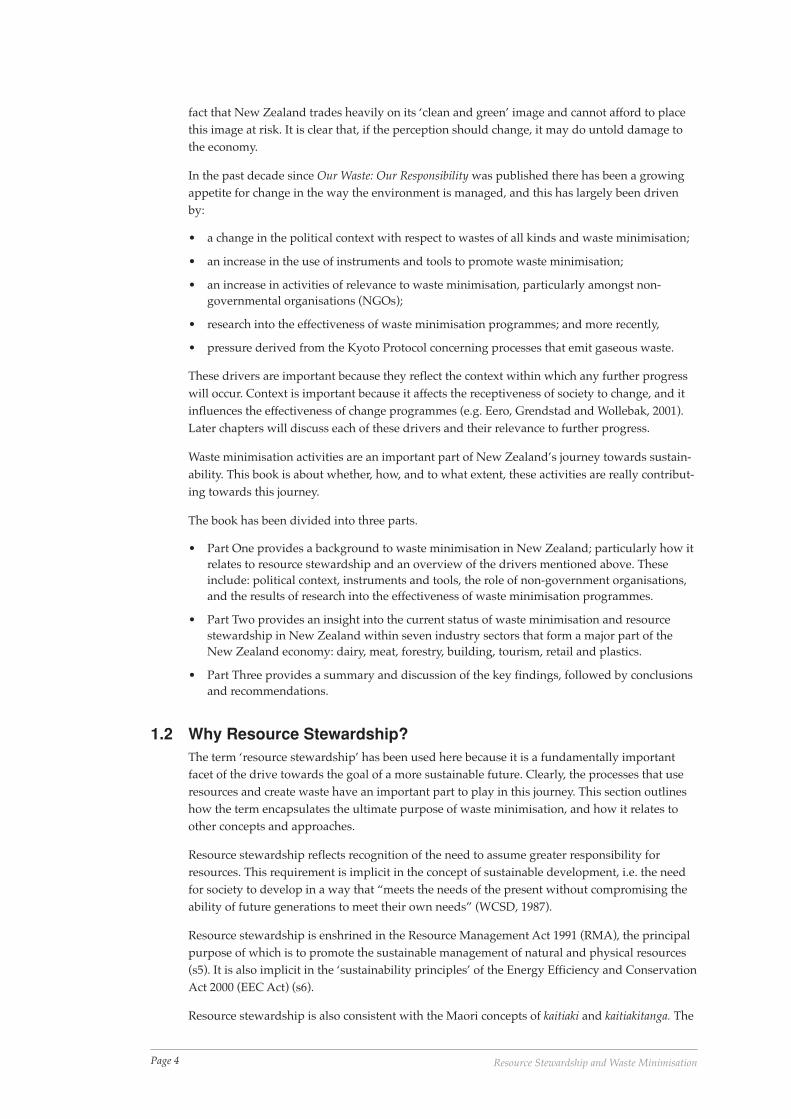
Care is thus required to avoid resource stewardship being seen as the next in a long line ofconcepts that have been applied to waste management over the past 10 - 20 years (e.g. seeFigure 1.1). Within this context, resource stewardship could be touted as the new high point in aprogression from ‘end-of-pipe’ types of approaches that focus on dealing with wastes once theyare generated (e.g. re-directed disposal, treatment, remediation), to ‘up-the-pipe’ types ofapproaches that focus on dealing with the sources of waste (e.g. cleaner production, pollutionprevention). Such a framework, however, would not be helpful.
The diagram in Figure 1.1 implies that initiatives lower down the list are inferior. This is unfairand unhelpful. There are many examples in New Zealand where people have worked hard toreduce the effects of wastes on the environment, and to reduce wastage by having resourcesremoved from the waste stream and re-used or recycled. All of these are important roles thatcontribute in one way or another towards a more sustainable society.
1900 2000
Year
Indiscriminate dumping
Re-directed disposal
Treatment
Remediation
External re-use, recycling, recovery
Reduction at source
Resource Stewardship???
Figure 1.1: Resource stewardship presented as the latest in a succession of waste-relatedconcepts and approaches
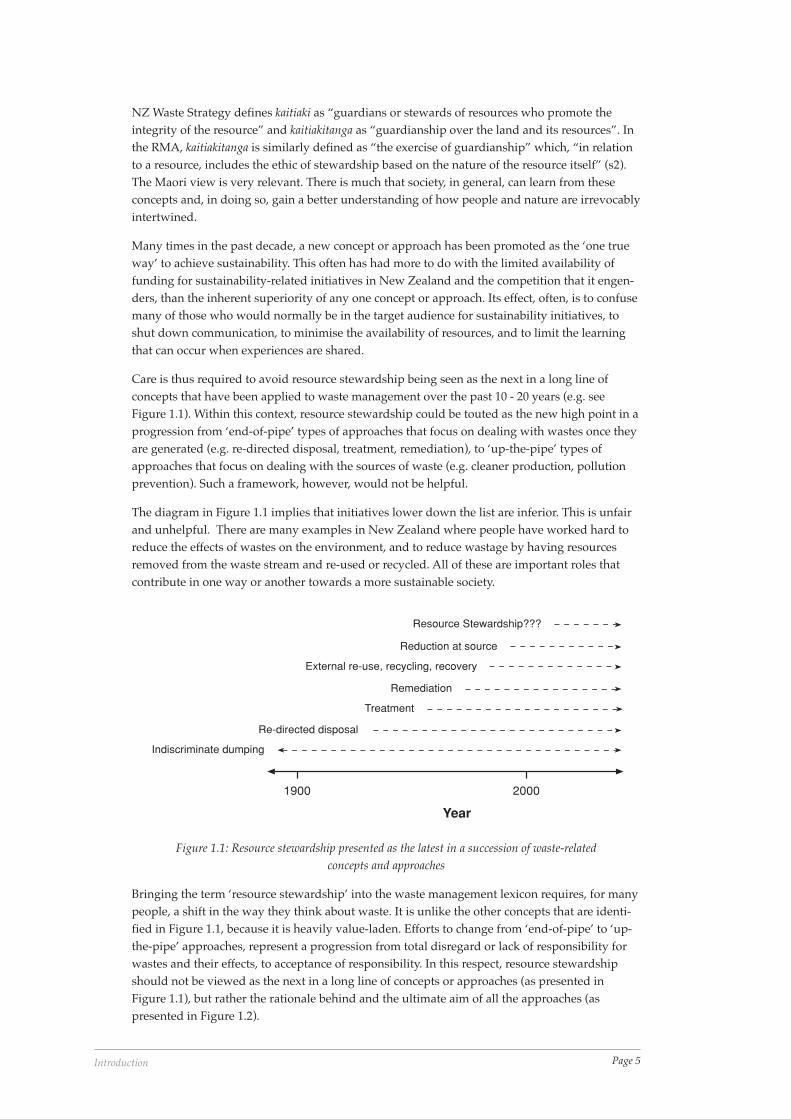
Bringing the term ‘resource stewardship’ into the waste management lexicon requires, for manypeople, a shift in the way they think about waste. It is unlike the other concepts that are identi-fied in Figure 1.1, because it is heavily value-laden. Efforts to change from ‘end-of-pipe’ to ‘up-the-pipe’ approaches, represent a progression from total disregard or lack of responsibility forwastes and their effects, to acceptance of responsibility. In this respect, resource stewardshipshould not be viewed as the next in a long line of concepts or approaches (as presented inFigure 1.1), but rather the rationale behind and the ultimate aim of all the approaches (aspresented in Figure 1.2).
Page 6 Resource Stewardship and Waste Minimisation
1900 2000
Year
Indiscriminate dumping
Re-directed disposal
Treatment
Remediation
External re-use, recycling, recovery
Reduction at source
ResourceStewardship
Figure 1.2: Resource stewardship presented as the ultimate aim of all concepts and approaches
As such, resource stewardship can provide an integrating mechanism for the waste managementindustry. The progression shown in Figure 1.1 occurred as a result of a sequence of peoplestanding up and arguing for a switch to an alternative approach: from dumps to landfills, fromlandfills to recycling, from recycling to reduction at source, etc. One outcome of this was the‘waste management hierarchy’, which has found its way into much of the rhetoric of the pastdecade (and even into law2).
The waste hierarchy was essentially based on the need to bring about a change in values.However, it tended to create something of an ‘us-and-them’ culture wherein the achievementsin the ‘upper’ levels had more status than those in the ‘lower’ levels. An obvious example canbe found in external recycling initiatives. They are ‘lower’ in the hierarchy, but they are oftenvery successful in terms of public participation. They can also result (relatively easily) in what isessentially a huge switch in values: from one where wastes are simply dumped to one wherethey are viewed as resources worth conserving. The hierarchical approach not only de-valuesthese types of initiatives, but de-values the often considerable passion that those who worktowards them have for the environment.
The ultimate aim is to place greater focus on resource stewardship, which requires a shift invalues from irresponsibility to responsibility, and to evaluate ANY initiatives in terms of thecontribution they are making towards that shift, rather than their level within the hierarchy.
1.3 ReferencesCAE, 1992. Our Waste, Our Responsibility: Towards Sustainable Waste Management in New Zealand,Centre for Advanced Engineering, University of Canterbury, Christchurch.
Eero, O, Grendstad, G and Wollebak, D, 2001. “Correlates of environmental behaviours: bring-ing back social context”, Environment and Behaviour 33: 181-208.
MfE/LGNZ, 2002. The NZ Waste Strategy: Towards Zero Waste and a Sustainable New Zealand, NZMinistry for the Environment and Local Government NZ, Wellington.
RMA, 1991. New Zealand Resource Management Act, 1991
WCSD, 1987. Our Common Future: Report of the World Commission on Sustainable Development,Oxford University Press, Oxford.
2 The Local Government Act 1974 was amended in 1996 to include a requirement for local authorities to develop wastemanagement plans that incorporate the waste management hierarchy.
Page 7The Political Context
2The Political Context
Lesley Stone1
2.1 IntroductionA major change that has occurred in the past decade is that waste minimisation has moved frombeing little more than something to provide a measure of satisfaction to environmental sensibili-ties, to now being recognised at the highest levels as an important part of waste management inNew Zealand. Three recent initiatives are indicative of this changing political context.
• the New Zealand Waste Strategy (MfE);
• the Lifeafterwaste Programme (WasteMINZ); and
• the Energy Efficiency and Conservation Strategy (EECA).
These three initiatives each vary in content and detail. Yet, they each share commonalities inthat they were all developed within the context of sustainability; they are all cognisant of theTreaty of Waitangi; and they all recognise the need for resource stewardship. In particular, theWaste Strategy and the Energy Efficiency and Conservation (EEC) Strategy both extend respon-sibility for the environment within government beyond MfE to include local government andthe Ministry of Energy. The EEC Strategy is, arguably, more robust than the Waste Strategybecause it is supported by legislation, but this depends on how much weight the documents,and the institutions that are responsible for their implementation, carry.
2.2 The New Zealand Waste StrategyThe New Zealand Waste Strategy was published in March 2002 and resulted from a collabora-tive effort between the Ministry for the Environment (MfE) and Local Government NewZealand (LGNZ). Included in its development was an advisory group made up of a range ofprofessionals working within the waste management field (the Working Group on WasteMinimisation and Management), a review by local government officers, and an extensive publicconsultation phase. It has three core goals:
• lowering the social costs and risks of waste;
• reducing the damage to the environment from waste generation and disposal; and
• increasing economic benefit by more efficient use of materials (resources).
Most importantly, the Waste Strategy recognises that reducing waste cannot succeed withoutsystems that manage wastes from the point of generation through to disposal. Hence, a moreeffective, integrated approach to material and resource efficiency is needed at every stage ofproduction and consumption.
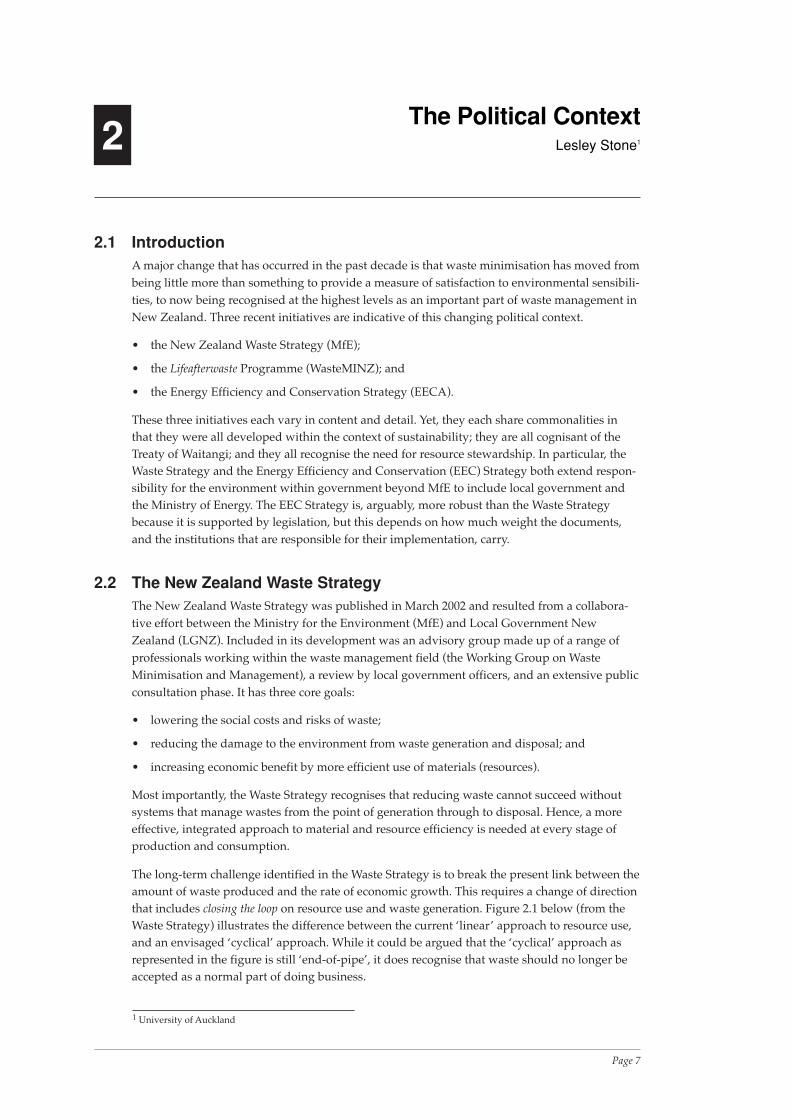
The long-term challenge identified in the Waste Strategy is to break the present link between theamount of waste produced and the rate of economic growth. This requires a change of directionthat includes closing the loop on resource use and waste generation. Figure 2.1 below (from theWaste Strategy) illustrates the difference between the current ‘linear’ approach to resource use,and an envisaged ‘cyclical’ approach. While it could be argued that the ‘cyclical’ approach asrepresented in the figure is still ‘end-of-pipe’, it does recognise that waste should no longer beaccepted as a normal part of doing business.
1 University of Auckland

Page 8 Resource Stewardship and Waste Minimisation
The Strategy identifies six core principles that will guide both central and local government.These are widely used in other developed countries and are consistent with OECD principlesfor strategic waste prevention.
• Global citizenship – New Zealand’s responsibility to protect the environment extendsbeyond its borders.
• Kaitiakitanga/Stewardship – Everyone has a responsibility for looking after the environ-ment, and for the impact of products and wastes they make, use and discard.
• Extended producer responsibility – Producers have a responsibility for their productsthroughout the product’s life-cycle, from production through to final disposal.
• Full-cost pricing – The environmental effects of production, distribution, consumption anddisposal of goods and services should be consistently costed.
• Life-cycle principle – Products and substances should be designed, produced and managedso all environmental effects are accounted for and minimised during generation, use,recovery and disposal.
• Precautionary principle – Where decision-makers have limited information or understand-ing of the possible effects of an activity, and there are significant risks or uncertainties, aprecautionary approach should be taken.
Section 3 of the Waste Strategy is important because it sets out criteria for prioritising actionsthat will achieve the Strategy’s vision and goals. Five core policies in the Strategy form a basisfor action.
1. There is a need for a sound legislative basis for waste minimisation that clarifies the functionof key players and recognises the Crown’s responsibility under the Treaty of Waitangi.
2. Further development and application of pricing policies that reflect the full cost of wastedisposal are crucial and form a cornerstone of the strategy.
3. The protection of environmental and public health demands high standards. A priority inthe strategy is the implementation and monitoring of environmental standards.
4. Effective waste minimisation is hampered by a lack of good information. The strategyrecognises the role of central government in setting up national information systems andfacilitating public information and education programmes.
5. More efficient use of materials (resources) will have the biggest long-term impact on wastereduction.
Linear — Current
Recover Produce Use
RecoverProduce
Use
Closing the loop — Future
Figure 2.1: Linear versus cyclical approaches to resource use (New Zealand Waste Strategy)

Page 9The Political Context
The New Zealand Waste Strategy is important because it presents a new vision for minimisingwaste in accordance with the government’s commitment to reducing the waste stream and localgovernment’s desire for more effective and efficient waste management and minimisation. Italso provides a vision for the future management of wastes in New Zealand and sets out apractical programme of both medium and long-term actions. The Strategy’s underlying argu-ment for resource stewardship is compelling and it should be considered essential reading forall those involved in the management of waste.
2.3 The Lifeafterwaste ProgrammeLifeafterwaste is a Waste Management Institute of New Zealand (WasteMINZ) initiative designedto help people change the way they think about waste. The programme is important because itwas developed as part of a consultative process that involved a broad cross-section of the wastemanagement sector. This sector, from which WasteMINZ draws its membership, representsmany interests including central and local government, industry, waste management companiesand professionals, NGOs and educational institutions.
The interests of WasteMINZ members cover the full spectrum of waste-related activitiesincluding disposal, remediation, treatment, recovery, recycling, re-use, reduction and preven-tion, and all of these interests were represented in some way in the consultation process that theorganisation undertook to develop the Lifeafterwaste programme.
The Lifeafterwaste programme is consistent with the New Zealand Waste Strategy and is veryforward looking. It is designed to make people think about waste other than as something to bediscarded, a notion that is encapsulated in its vision:
To achieve lifeafterwaste we New Zealanders need to change the way we act ... With individualcommitment and action we can make the change from waste disposal to waste avoidance, we canbe a resource efficient nation and we can clean up our environment ... Let’s make the commitmentto close the loop on waste...
The Lifeafterwaste programme includes a set of Change Principles that form the basis for changeactions. These are summarised below.
• An opportunity exists to make New Zealand truly ‘clean and green’, before that imagebecomes tarnished and reflects reality.
• All change must take place within the framework of sustainable development.
• New Zealand needs to become resource efficient. The focus must be on linking wasteavoidance, material reuse and recycling with the upstream benefits of resource conservationand efficiency, pollution prevention and sustainable development.
• Waste and the environment need to be managed in an holistic way and include all wastessuch as sewage, stormwater, gaseous emissions, agricultural runoff, and the inefficient useor misuse of resources such as water, air, energy and land.
• A single set of actions is needed that can be clearly understood.
• Everyone needs to be committed and must feel that the initiative has honesty and integrity.
• There needs to be a single set of targets that are ‘realistic and attainable’ so progress andsuccess can be measured.
The Change Actions based on these principles address the need for:
• personal acceptance of responsibility;
• education and ‘know how’;
• recognition of the ‘special” nature of the New Zealand environment;
Page 10 Resource Stewardship and Waste Minimisation
• dispelling inaccurate perceptions, particularly as they relate to sources and solutions;
• recognition of the economic value of resource efficiency and the role of consumers; and
• leadership from within all sectors.
These give rise to a number of Sector Challenges, identified as:
• integration of the efforts of all contributing sectors in making the connection between waste,resource use and environmental degradation;
• collaboration, integration and consistency among local authorities;
• mechanisms to ensure that costs accurately reflect environmental (and social) outcomes; and
• the development of infrastructure, as well as secure markets.
The Lifeafterwaste programme is very relevant to the way that current thinking on sustainabilityis changing. It was produced following extensive consultation by an organisation (WasteMINZ)whose disparate members are known to have had many disagreements in the past on wasteissues and is, quite possibly, one of the most integrative and forward-looking statements onwaste management that has been published in New Zealand.
2.4 The Energy Efficiency and Conservation StrategyThis strategy was developed by the Energy Efficiency and Conservation Authority (EECA) inresponse to a requirement under the Energy Efficiency and Conservation Act 2001 (EEC Act). Itwas developed during a 15-month process that included: a set of ‘vision pieces’ produced bykey ‘energy commentators’; stakeholder workshops; hui, and ‘numerous one-on-one meetings’.In addition, a draft strategy was aired in presentations around the country and public submis-sions were called for and taken into consideration.
The EEC Act requires the strategy to “give effect to the Government’s policy on the promotionin New Zealand of energy efficiency, energy conservation, and the use of renewable sources ofenergy”.
The EEC Act also established the Energy Efficiency and Conservation Authority. EECA is a‘perpetual’ Crown entity charged with the role of meeting the EEC Act’s purpose. Its functionsinclude: encouraging, promoting and supporting energy efficiency, energy conservation and theuse of renewable sources of energy. EECA’s essential purpose is to:
• provide advice to the Minister of Energy;
• assist the Minister to prepare and administer the EEC Strategy;
• raise public awareness;
• promote relevant practices and technologies;
• arrange for relevant research, assessments, demonstrations and studies;
• monitor and review progress; and
• publish relevant information, research, and other material.
EECA also has the power to provide grants, awards or loans, develop regulations for energyefficiency in, and labelling of, products and services.
Organisations such as councils, major companies, community trusts, professional bodies andgovernment departments are key partners in the EEC Strategy, and in EECA’s business. Thesepartnerships put practical programmes into action to deliver energy efficiency results. As wellas promoting the wise use of energy, EECA also promotes the use of renewable sources ofenergy, which are vital in achieving sustainable energy (Dahlberg, pers. com., 2002).
The EEC Strategy was developed within the context of a vision of a ‘sustainable energy
Page 11The Political Context
economy’, that includes energy efficiency, energy conservation and the use of renewable energysystems. It includes various ‘policy directions’, goals, ‘high-level’ targets, as well as a set ofpolicy ‘measures’ and sector-specific programmes.
The policy directions set the direction for the strategy and are described as “continuing im-provement in our energy efficiency” and a “progressive transition to renewable sources ofenergy”. The goals are to:
• reduce the emissions of CO2;
• reduce the local environmental impacts of energy production and use;
• improve the country’s economic performance and the value it derives from energy;
• promote the development of industry through the use of energy efficiency and conservation;
• improve the resilience of the New Zealand economy to future disruptions or price rises; and
• improve community health and welfare by enhancing energy efficiency and availability.
These policies are reflected in two high-level targets to be achieved by 2012:
• to improve the efficiency of energy use across the whole economy by at least 20%; and
• to increase the supply of renewable energy by 25-55PJ.
A number of policy measures have been set in place to help achieve these targets and these aresupported by various sector-specific programmes covering central and local government,energy supply, industry (including agriculture), buildings and appliances; and transport.
The Energy Efficiency and Conservation Strategy is important because energy is a resource. Ithas long been recognised by some within the waste management sector that resource steward-ship and waste minimisation need to be applied to energy as well as material resources.
2.5 ReferencesDahlberg, R, 2002. Energy Efficiency and Conservation Authority (pers. com.)

Page 12 Resource Stewardship and Waste Minimisation
Page 13Change Mechanisms
3Change Mechanisms
Lesley Stone1
3.1 IntroductionThe term ‘tools’ can be used in different ways when referring to waste minimisation. Themechanisms or devices that are used to promote resource stewardship and waste minimisationon a societal level (e.g. laws, taxes, voluntary agreements) are sometimes referred to as ‘tools’but are also known as ‘instruments’. The ‘step-by-step’ types of guides, manuals, managementsystems, etc., that are developed and used to assist individual householders, businesses or otherorganisations to undertake waste minimisation, are more commonly known as ‘tools’.
The ‘Lifeafterwaste’ programme, New Zealand Waste Strategy and Energy Efficiency andConservation Strategy, described in Chapter 2, are effective instruments for encouraging wasteminimisation to occur at all levels, and they incorporate references to some of the other instru-ments that are available (e.g. policies, targets and educational programmes).
Although a start has been made in New Zealand, a much wider range of instruments is avail-able and in use in other countries. Generally, these fall into three categories: regulatory, eco-nomic and voluntary. Examples of the types of instruments and tools in these three categoriesare provided in the ‘Toolbox’ included in Appendix 1. The majority of countries use a range oftools and instruments to encourage waste minimisation. This is because no one instrument (ortool) is likely to work in isolation. Also, the changes that are required of society can be signifi-cant. For example, a change from ‘out-of-sight, out-of-mind’ types of values, where wastes areconsidered to be someone else’s problem, to ‘there is no such thing as waste’, where unwantedmaterials are recognised as valuable resources that need to be conserved, requires acceptance ofresponsibility by the individual.
While many programmes focus on behavioural change, it is important to recognise the role ofvalues in informing behaviour. Behavioural change can only be regarded as sustainable in thelong-term if values are changed (e.g., see Stern et. al., 1995; Schein, 1992; Argyris, 1999).
Values, however, can be extremely difficult to change because they have developed within asocial context that continually enforces and reinforces them. Stern, et. al. (1995) in their model of‘environmental behaviour’ suggest that, in order to change values, it is necessary to change theinstitutional structure and constraints within society. Institutional structure is about the way inwhich formal aspects of society (e.g. laws, policies, economic systems, religious doctrines,educational curricula) act together to reinforce certain values. Different instruments tend totarget different parts of this institutional context, so it is not surprising that more than oneinstrument is needed to try to bring about the value changes necessary to institute behaviouralchange. Since institutional structures and constraints are different for different social groupings(e.g. different countries, communities or sector groups), it follows that the instruments are morelikely to be effective if they are chosen strategically for each specific social context.
3.2 An International ExampleIn the USA, for example, the Emergency Planning and Community Right-to-Know Act of 1986(EPCRA), together with the Pollution Prevention Act of 1990 (PPA), were used to establish theUS Environmental Protection Agency (USEPA)’s ‘Toxics Release Inventory’ (TRI). The legisla-
1 University of Auckland
Page 14 Resource Stewardship and Waste Minimisation
tion was enacted within the context of public concern about and demands for information onchemical releases to the environment beyond the factory fence (USEPA, 2002). This concernstemmed from a series of high profile incidents involving toxic, persistent and/or bio-accumu-lative hazardous substances (e.g. Seveso, Bhopal) and the discovery of contaminated sites allacross the US, the most notorious of which was found at Love Canal in New York State. TheEPCRA, the TRI and the PPA were designed to act together to rectify some of the institutionalinadequacies that resulted in these types of incidents.
The EPCRA, among other things, requires industrial facilities to report on the annual releases ofa range of 650 hazardous wastes (over a particular threshold level) and requires the USEPA andStates to collect this information and make it available to the public via the inventory. The PPArequires the inclusion within the inventory of further information on the waste managementand reduction at source activities of the industries. The TRI works in conjunction with generaland industry-specific voluntary programmes that are designed to assist individual businesses toreduce their wastes at source. It is also complemented by public campaigns run by non-govern-mental organisations (NGOs), e.g. Environmental Defense and the Unison Institute. Thesecampaigns encourage the public to become aware of and put pressure on the corporationswithin their neighbourhoods that are releasing TRI substances. They do so with the use of toolssuch as Environmental Defense’s ‘Chemical Scorecard’ (www.scorecard.org) and the UnisonInstitute’s ‘RTKNet’ (www.rtknet.org). These public campaigns are clearly recognised as animportant part of the whole project and are openly promoted by the USEPA.
The USEPA has found this particular combination of regulatory and voluntary instruments/tools to be extraordinarily effective in reducing hazardous waste. The ‘33/50 Program’, forexample, was a trial programme that actively engaged reporting businesses and worked closelywith them to assist them to set targets, and develop and implement programmes to reduce atsource 17 priority pollutants. The programme achieved reductions of over 407 millions tonnes(60%) in the 8 year period during which the results were monitored (USEPA, 1999).
3.3 Instruments and Tools in New ZealandNew Zealand uses few legal and economic instruments to encourage the uptake of wasteminimisation or other activities related to resource stewardship. The Resource Management Act1991 (RMA), provides overarching legislation relevant to resource stewardship. Though itrequires sustainable management of natural and physical resources (s.5), it is simply not specificenough to encourage waste minimisation. Under the RMA, wastes are only dealt with as ‘end ofpipe’ sources of effects, not as resources that need to be conserved and stewarded. Any methodscan be used to deal with wastes, as long as environmental effects are avoided, remedied ormitigated. While it could be argued that avoidance of effects may lead to waste minimisation, itis important to emphasise that it is effects, not wastes that are required to be avoided, and thatthere is still a choice of remedying or mitigating the effects they cause. While this may be seenas a deficiency in the RMA, it is also a matter of how the Act is used rather than, necessarily, anyfault in the legislation. Not producing waste will always be more sustainable than having to relyon mitigation of the effects.
The only economic instruments that have so far been used within New Zealand and that arerelevant for waste minimisation, are included within by-laws that are specific to particularregions, cities and districts. Practical examples include: stickers that are bought and placed onbags for collecting household solid waste (e.g. North Shore City Council) and pre-paid bagsused for the same purpose (e.g. Opotiki); a tax on wastes disposed of in landfills (e.g.Christchurch City Council), and permit costs that control discharges of industrial waste intosewers (e.g. those administered by Watercare Services in parts of the Auckland Region). Acarbon tax has been identified as an appropriate option for enabling New Zealand to meet itsobligations under the Kyoto Protocol, but this is unlikely to be in place before 2007, and cer-
Page 15Change Mechanisms
tainly not before the Protocol comes into force (Reuters, 2002).
Regulatory instrumentsPrior to 1996, New Zealand’s most specific legislation with regards to waste was Part XXXI(s.538 - 544) of the Local Government Act 1974, which covered local authorities responsibilitieswith respect to “refuse collection and disposal”. The Local Government Amendment Act 1996(No. 4) replaced this with a new Part XXXI that required local authorities to “promote effectiveand efficient waste management” within their districts, particularly with regard to environmen-tal and economic costs and benefits, and pubic health (s.538). The new Part XXXI also requiredlocal authorities to develop (in consultation with members of the public), adopt and implementa waste management plan that includes the collection, as well as reduction, reuse, recycling,recovery, treatment, or disposal of waste (s.539).
The Act defines these terms as follows, and requires that they be incorporated into the plans inthe following order of priority (italics added):
‘Reduction’ means lessening waste generation.
‘Reuse’ means the further using of products in their existing form for their original purpose or asimilar purpose.
‘Recycling’ means the reprocessing of waste materials to produce new products.
‘Recovery’ means extraction of materials or energy from waste for further use or processing andincludes, but is not limited to, making materials into compost.
‘Treatment’ means, in relation to waste, subjecting the waste to any physical, biological, orchemical process to change the volume or character of that waste so that it may be disposed ofwith no or reduced significant adverse effect on the environment.
‘Disposal’ means final deposit of waste on land set apart for the purpose.
The Local Government Act also provides for local authorities to make by-laws (s.542); providegrants to assist in the reduction, reuse, recycling, recovery, treatment, or disposal of waste(s.543); and allocate costs in a way that will “effectively and appropriately promote the objec-tives of the plan”, including the ability to establish economic incentives and disincentives(s.544).
The Local Government Act 2002 includes a requirement for a waste management plan that isconsistent with the requirements laid out in s.539 of the Local Government Act 1974 (andpresumably its latter replacement, the 1996 amendment), and for the plan to be adopted by 30June 2005 (if such a plan is not already in place) (s.286).
Interestingly, the majority of local government plans tend to focus mostly on solid waste whileneglecting other wastes. This may be due to the long-standing focus on ‘refuse’ as per thedictates of the Local Government Act 1974, and the failure to appreciate that this focus is absentfrom the replacement Part XXXI. The New Zealand Waste Strategy clearly attempts to extendthe scope of waste management activities beyond ‘refuse’ to include solid, liquid and gaseouswastes. However, the Strategy does not specifically include ozone depleting or greenhouse gasforming wastes, nor does it include non-point source wastes and waste energy.
The omission of ozone depleting and greenhouse gases, which the Strategy notes are subject toexisting programmes, may reflect the different institutional context (provided by the Montrealand Kyoto Protocols, and the regulatory instruments that apply them nationally). However, it ishoped that the programmes that cover these types of substances are integrated with those thatarise from the Strategy, so that they complement and reinforce one another. Non-point sources

Page 16 Resource Stewardship and Waste Minimisation
of pollution are addressed by separate work programmes. Examples are the emissions fromcars, which may present difficulties because of their mobile nature, and nutrient run-off fromfarms. They could easily be integrated under a ‘resource stewardship’ banner.
Waste energy is covered by the Energy Efficiency and Conservation Act 2000 (EEC Act), thepurpose of which is to promote energy efficiency, energy conservation, and the use of renewablesources of energy in New Zealand.
It is clear that the enactment of legislation such as the EEC Act provides the opportunity toenhance the extent to which different types of instruments are able to be used by government,both at a central as well as a local level. In this regard, the regulatory requirements at thepresent time with respect to energy wastage are far more detailed and specific than those for themajority of other wastes.
Voluntary InstrumentsAs far as minimising non-energy wastes is concerned, government programmes in NewZealand have tended to focus more on voluntary, rather than regulatory and economic types ofinstruments. These have included: demonstration projects such as the multi-sector Target Zeroproject (Brown, 2000), single sector hospitality, construction and demolition, printing, andhealth projects, as well as general and specific guides or manuals such as the Cleaner Produc-tion Guidelines (MfE, 1994).
The demonstration projects usually aim to show how particular concepts and methods apply tospecific activities. They mostly involve assisting participating businesses and/or other organisa-tions to undertake a step-by-step process that includes quantifying wastes, and identifying,assessing and implementing options for improvement. One of the more common processes usedfor businesses is summarised in Fig. 3.1 and was originally derived from the USEPA’s WasteMinimization Opportunity Assessment Manual (USEPA, 1988), which in turn had its origins inthe quality management movement.
commitment
planning & organisation
assessment
identification of optionsfor improvement
evaluation of options
implementation of options
monitoring & review
Figure 3.1: Common stages in the waste minimisation processes applied to businesses.
The change process includes making a commitment to the project, planning and organisation,an assessment or audit phase, the identification, evaluation and implementation of options forimprovement, monitoring and review. This basic process is echoed in many of the guides andmanuals that have been produced since, including MfE’s early Cleaner Production Guidelines(MfE, 1994), and the more recent “Industry Guide to Zero Waste”, published by the NewZealand Business Council for Sustainable Development (NZBCSD, 2002).
Page 17Change Mechanisms
While all of the derivatives have been altered in some way to reflect particular nuances, theprocesses are still basically mechanistic, and do not take into account the socio-political dynam-ics within organisations, and the environment within which they exist.
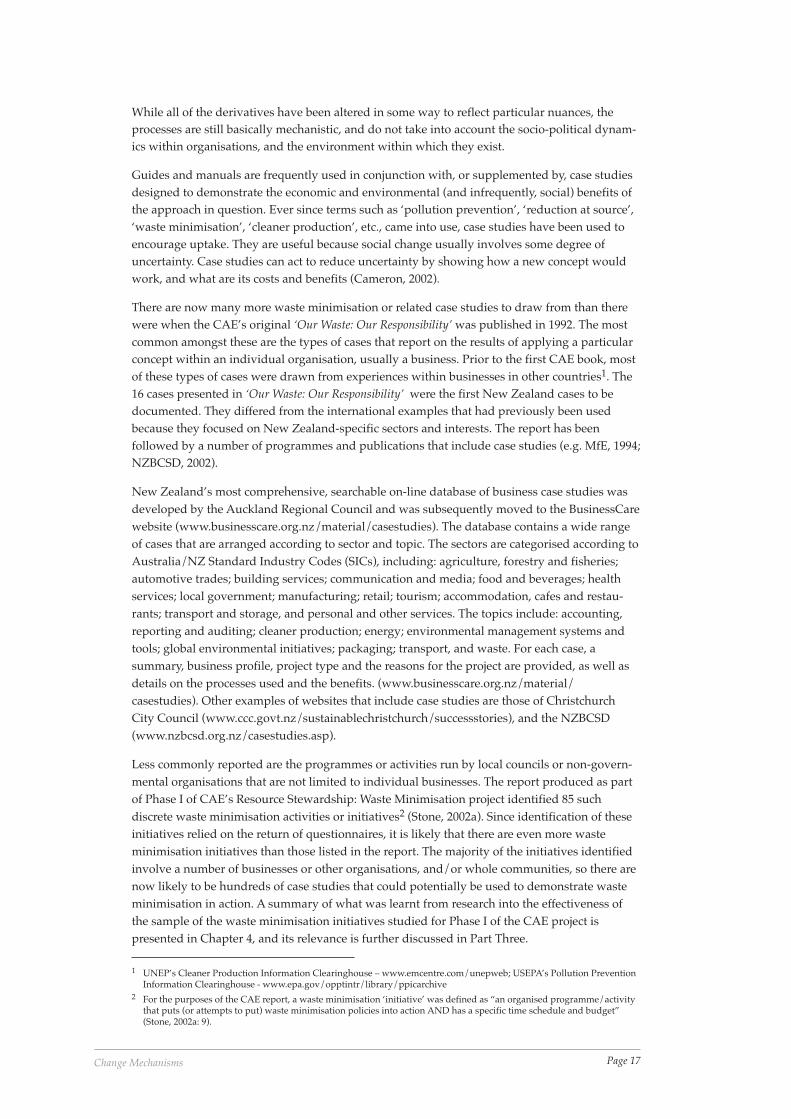
Guides and manuals are frequently used in conjunction with, or supplemented by, case studiesdesigned to demonstrate the economic and environmental (and infrequently, social) benefits ofthe approach in question. Ever since terms such as ‘pollution prevention’, ‘reduction at source’,‘waste minimisation’, ‘cleaner production’, etc., came into use, case studies have been used toencourage uptake. They are useful because social change usually involves some degree ofuncertainty. Case studies can act to reduce uncertainty by showing how a new concept wouldwork, and what are its costs and benefits (Cameron, 2002).
There are now many more waste minimisation or related case studies to draw from than therewere when the CAE’s original ‘Our Waste: Our Responsibility’ was published in 1992. The mostcommon amongst these are the types of cases that report on the results of applying a particularconcept within an individual organisation, usually a business. Prior to the first CAE book, mostof these types of cases were drawn from experiences within businesses in other countries1. The16 cases presented in ‘Our Waste: Our Responsibility’ were the first New Zealand cases to bedocumented. They differed from the international examples that had previously been usedbecause they focused on New Zealand-specific sectors and interests. The report has beenfollowed by a number of programmes and publications that include case studies (e.g. MfE, 1994;NZBCSD, 2002).
New Zealand’s most comprehensive, searchable on-line database of business case studies wasdeveloped by the Auckland Regional Council and was subsequently moved to the BusinessCarewebsite (www.businesscare.org.nz/material/casestudies). The database contains a wide rangeof cases that are arranged according to sector and topic. The sectors are categorised according toAustralia/NZ Standard Industry Codes (SICs), including: agriculture, forestry and fisheries;automotive trades; building services; communication and media; food and beverages; healthservices; local government; manufacturing; retail; tourism; accommodation, cafes and restau-rants; transport and storage, and personal and other services. The topics include: accounting,reporting and auditing; cleaner production; energy; environmental management systems andtools; global environmental initiatives; packaging; transport, and waste. For each case, asummary, business profile, project type and the reasons for the project are provided, as well asdetails on the processes used and the benefits. (www.businesscare.org.nz/material/casestudies). Other examples of websites that include case studies are those of ChristchurchCity Council (www.ccc.govt.nz/sustainablechristchurch/successstories), and the NZBCSD(www.nzbcsd.org.nz/casestudies.asp).
Less commonly reported are the programmes or activities run by local councils or non-govern-mental organisations that are not limited to individual businesses. The report produced as partof Phase I of CAE’s Resource Stewardship: Waste Minimisation project identified 85 suchdiscrete waste minimisation activities or initiatives2 (Stone, 2002a). Since identification of theseinitiatives relied on the return of questionnaires, it is likely that there are even more wasteminimisation initiatives than those listed in the report. The majority of the initiatives identifiedinvolve a number of businesses or other organisations, and/or whole communities, so there arenow likely to be hundreds of case studies that could potentially be used to demonstrate wasteminimisation in action. A summary of what was learnt from research into the effectiveness ofthe sample of the waste minimisation initiatives studied for Phase I of the CAE project ispresented in Chapter 4, and its relevance is further discussed in Part Three.
1 UNEP’s Cleaner Production Information Clearinghouse – www.emcentre.com/unepweb; USEPA’s Pollution PreventionInformation Clearinghouse - www.epa.gov/opptintr/library/ppicarchive
2 For the purposes of the CAE report, a waste minimisation ‘initiative’ was defined as “an organised programme/activitythat puts (or attempts to put) waste minimisation policies into action AND has a specific time schedule and budget”(Stone, 2002a: 9).
Page 18 Resource Stewardship and Waste Minimisation
The chapters that follow in Part Two include case studies, but they are presented in a way that isdesigned to provide insight into some of the learning processes that occur during implementa-tion, rather than the detailed methods, costs and benefits that have to date been the focus of casematerial.
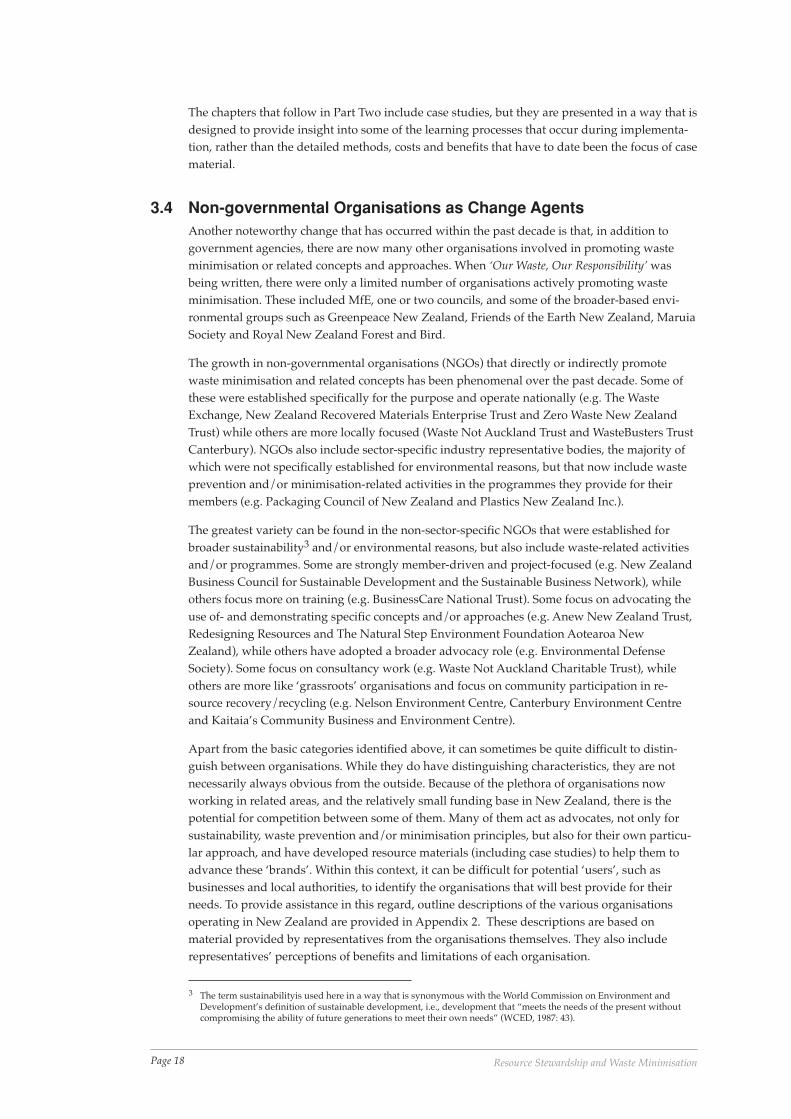
3.4 Non-governmental Organisations as Change AgentsAnother noteworthy change that has occurred within the past decade is that, in addition togovernment agencies, there are now many other organisations involved in promoting wasteminimisation or related concepts and approaches. When ‘Our Waste, Our Responsibility’ wasbeing written, there were only a limited number of organisations actively promoting wasteminimisation. These included MfE, one or two councils, and some of the broader-based envi-ronmental groups such as Greenpeace New Zealand, Friends of the Earth New Zealand, MaruiaSociety and Royal New Zealand Forest and Bird.
The growth in non-governmental organisations (NGOs) that directly or indirectly promotewaste minimisation and related concepts has been phenomenal over the past decade. Some ofthese were established specifically for the purpose and operate nationally (e.g. The WasteExchange, New Zealand Recovered Materials Enterprise Trust and Zero Waste New ZealandTrust) while others are more locally focused (Waste Not Auckland Trust and WasteBusters TrustCanterbury). NGOs also include sector-specific industry representative bodies, the majority ofwhich were not specifically established for environmental reasons, but that now include wasteprevention and/or minimisation-related activities in the programmes they provide for theirmembers (e.g. Packaging Council of New Zealand and Plastics New Zealand Inc.).
The greatest variety can be found in the non-sector-specific NGOs that were established forbroader sustainability3 and/or environmental reasons, but also include waste-related activitiesand/or programmes. Some are strongly member-driven and project-focused (e.g. New ZealandBusiness Council for Sustainable Development and the Sustainable Business Network), whileothers focus more on training (e.g. BusinessCare National Trust). Some focus on advocating theuse of- and demonstrating specific concepts and/or approaches (e.g. Anew New Zealand Trust,Redesigning Resources and The Natural Step Environment Foundation Aotearoa NewZealand), while others have adopted a broader advocacy role (e.g. Environmental DefenseSociety). Some focus on consultancy work (e.g. Waste Not Auckland Charitable Trust), whileothers are more like ‘grassroots’ organisations and focus on community participation in re-source recovery/recycling (e.g. Nelson Environment Centre, Canterbury Environment Centreand Kaitaia’s Community Business and Environment Centre).
Apart from the basic categories identified above, it can sometimes be quite difficult to distin-guish between organisations. While they do have distinguishing characteristics, they are notnecessarily always obvious from the outside. Because of the plethora of organisations nowworking in related areas, and the relatively small funding base in New Zealand, there is thepotential for competition between some of them. Many of them act as advocates, not only forsustainability, waste prevention and/or minimisation principles, but also for their own particu-lar approach, and have developed resource materials (including case studies) to help them toadvance these ‘brands’. Within this context, it can be difficult for potential ‘users’, such asbusinesses and local authorities, to identify the organisations that will best provide for theirneeds. To provide assistance in this regard, outline descriptions of the various organisationsoperating in New Zealand are provided in Appendix 2. These descriptions are based onmaterial provided by representatives from the organisations themselves. They also includerepresentatives’ perceptions of benefits and limitations of each organisation.
3 The term sustainabilityis used here in a way that is synonymous with the World Commission on Environment andDevelopment’s definition of sustainable development, i.e., development that “meets the needs of the present withoutcompromising the ability of future generations to meet their own needs” (WCED, 1987: 43).
Page 19Change Mechanisms
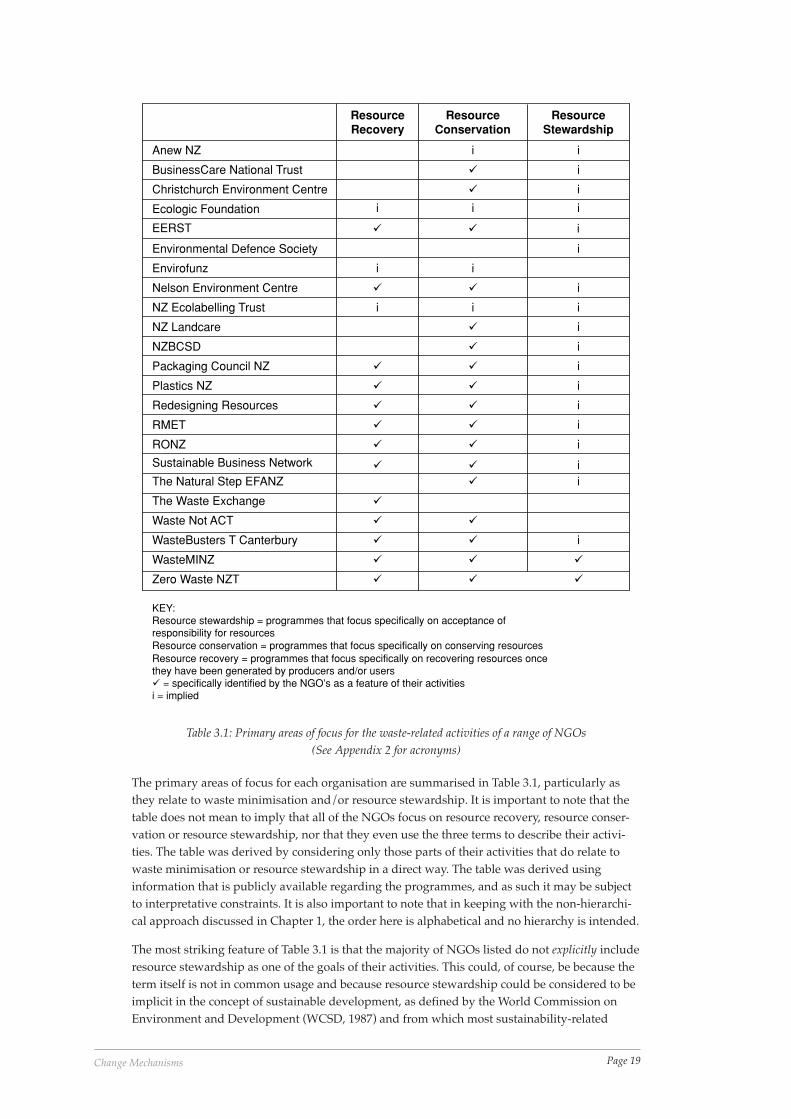
The primary areas of focus for each organisation are summarised in Table 3.1, particularly asthey relate to waste minimisation and/or resource stewardship. It is important to note that thetable does not mean to imply that all of the NGOs focus on resource recovery, resource conser-vation or resource stewardship, nor that they even use the three terms to describe their activi-ties. The table was derived by considering only those parts of their activities that do relate towaste minimisation or resource stewardship in a direct way. The table was derived usinginformation that is publicly available regarding the programmes, and as such it may be subjectto interpretative constraints. It is also important to note that in keeping with the non-hierarchi-cal approach discussed in Chapter 1, the order here is alphabetical and no hierarchy is intended.
The most striking feature of Table 3.1 is that the majority of NGOs listed do not explicitly includeresource stewardship as one of the goals of their activities. This could, of course, be because theterm itself is not in common usage and because resource stewardship could be considered to beimplicit in the concept of sustainable development, as defined by the World Commission onEnvironment and Development (WCSD, 1987) and from which most sustainability-related
Environmental Defence Society i
Envirofunz i i
Nelson Environment Centre � � i
NZ Ecolabelling Trust i i i
NZ Landcare � i
NZBCSD � i
Packaging Council NZ � � i
Plastics NZ � � i
Redesigning Resources � � i
RMET � � i
RONZ � � i
� � iSustainable Business Network
The Natural Step EFANZ � i
The Waste Exchange �
Waste Not ACT � �
WasteBusters T Canterbury � � i
WasteMINZ � � �
Zero Waste NZT � � �
KEY:Resource stewardship = programmes that focus specifically on acceptance ofresponsibility for resourcesResource conservation = programmes that focus specifically on conserving resourcesResource recovery = programmes that focus specifically on recovering resources oncethey have been generated by producers and/or users� = specifically identified by the NGO’s as a feature of their activitiesi = implied
ResourceRecovery
ResourceConservation
ResourceStewardship
Anew NZ i i
BusinessCare National Trust � i
Christchurch Environment Centre � i
Ecologic Foundation i i i
� � iEERST
Table 3.1: Primary areas of focus for the waste-related activities of a range of NGOs(See Appendix 2 for acronyms)

Page 20 Resource Stewardship and Waste Minimisation
concepts are drawn. However, it is important to note that while resource stewardship may resultfrom programmes that have sustainability-related imperatives, this will not necessarily be thecase. A programme is more likely to deliver resource stewardship if it is explicitly identified asone of the goals of the programme in question, and if the programme is designed to achieve thatgoal. In addition, recent studies on the effectiveness of waste minimisation programmes (Stone,2002a, 2002b) appear to confirm that, for resource stewardship to be achieved, it not only needsto be set as a goal and contribute to the design of programmes, but it also needs to be used as abasis for evaluating and improving programmes.
In addition to providing a summary of their activities (see Appendix 2), NGO representativeswere also asked to provide insight into the benefits and limitations of their activities. Despitethe perception amongst many NGOs that they are unique, there were some striking similarities.Commonly perceived benefits included: provision of resources and advice; networking; 'on-the-ground' follow-up for programme participants; presentation of a range of concepts, andindependence. Common limitations were the availability of resources and the limitations of theservice offered. The latter was more common amongst NGOs that do not have a particularsector whom they represent and who are strongly membership driven. The similarities benefitsand limiations between majority of NGOs do seem to suggest that it could be worthwhile torationalise and integrate NGO activities in this area.
Those who have been working towards resource stewardship or waste minimisation over thepast decade will have noticed how NGOs have changed. There is a considerable differencebetween the NGOs that promoted waste prevention and minimisation when the first CAEreport ‘Our Waste: Our Responsibility’ was published and those that are doing so now. Theenvironmental NGOs of a decade ago tended to be issue specific, campaigning organisationsthat responded to specific environmental problems and took direct-action (e.g. Greenpeace NewZealand). They were membership-based and so did not have the resource constraints that arenow identified by some of the NGOs, but they were equally not membership-constrainedbecause their membership was broad and community-based, not sector specific.
Another important distinction is that early NGOs were often ‘pressure’ groups. Since theirzenith in the late eighties, early nineties, these organisations have largely dropped from thepicture, as least as far as resource stewardship/waste minimisation is concerned, and have beenreplaced by NGOs that tend to be ‘softer’ towards business. The latter focus on working with,and assisting, businesses to adopt practices that are more sustainable. This is not in itself aproblem. Indeed there will, until sustainability is achieved, always be a strong need for this typeof work, though the reality is that the NGOs that are currently operating in this field areworking with a relatively small number of businesses. At most, their collective membership canbe counted in a few hundreds in a country that has over 280,000 enterprises (StatsNZ, 2002).Although progress has been made, this suggests that the substantial reliance on voluntaryuptake of sustainability concepts and approaches has not always been very effective in the pastdecade.
3.5 ReferencesArgyris, C, 1999. On Organizational Learning, (2nd Ed.), Blackwell, Malden, Mass.
Brown, G, 2000. “You too can profit from cleaner production and waste minimisation”, Brochurereporting the results of the Target Zero project, produced by Ecosense Ltd., with fundingfrom the New Zealand Ministry for the Environment, Wellington.
Cameron, L D, 2002. Changing Waste Minimisation and other Environmental Behaviours throughCommunity Interventions, Technical Report, Environment Waikato, Hamilton.
MfE, 1994. Cleaner Production Guidelines, New Zealand Ministry for the Environment,Wellington.
Page 21Change Mechanisms
NZBCSD, 2002. Industry Guide to Zero Waste: Towards zero waste and a Sustainable New Zealand,New Zealand Business Council for Sustainable Development, Auckland.
Reuters, 2002. “New Zealand plans carbon tax to meet Kyoto targets”, Graeme Peters, Reuters,18 October, www.enn.com/news/wire-stories/2002/10/10182002/reu_48744.asp
Schein, E, 1992. Organizational culture and leadership, (2nd ed.). Jossey-Bass, San Francisco.
StatsNZ, 2002. New Zealand business demographic statistics (as at February, 2002): Table 4.Statistics New Zealand website: www.stats.govt.nz/domino/external/pasfull/pasfull.nsf/7cf46ae26dcb6800cc256a62000a 2248/4c2567ef00247c6acc256c62000ceab2?OpenDocument
Stern, P C, Dietz, T and Guagnano, G A, 1995. “The new ecological paradigm in social psycho-logical context”, Environmental Behaviour 27: 723-743.
Stone, L-J, 2002a. “Assessment of waste minimisation activities in New Zealand”, Centre forAdvanced Engineering (CAE) Resource Stewardship/Waste Minimisation Project, Phase 1Report, CAE, University of Canterbury, Christchurch, 86pp.
Stone, L-J, 2002b. Sustainability programmes for business: Place and practice within the context ofrelevant developments in organisation theory, PhD thesis, University of Auckland, New Zealand.341pp
USEPA, 1988. Waste Minimization Opportunity Assessment Manual, Hazardous Waste EngineeringResearch Laboratory, US Environmental Protection Agency, Cincinatti.
USEPA, 1999. 33/50 Program: The final record, US Environmental Protection Agency, WashingtonD.C. EPA-745-R-99-004 .
USEPA, 2002. Toxics Release Inventory Program, US Environmental Protection Agency, Washing-ton D.C. http://www.epa.gov/tri/whatis.htm
WCSD, 1987. Our Common Future: Report of the World Commission on Sustainable Development,Oxford University Press, Oxford.
3.6 AcknowledgementsThanks are due to María José Baldoni for assisting in the gathering of summary information onNew Zealand NGOs, and also to the NGO representatives, particularly those who so generouslyprovided valuable insights into the benefits and limitations of their organisations.

Page 22 Resource Stewardship and Waste Minimisation
Page 23Learning from Experience
4Learning from Experience
Lesley Stone1
4.1 Introduction‘The previous chapters in Part One serve to introduce another important change that hasoccurred within the last decade. Many, many people have now been involved in the implemen-tation of activities of relevance to waste minimisation, and their experiences will have influ-enced their understanding of how implementation works. The knowledge that is gained fromexperience is a valuable asset, but all too often it remains with one person or within a particulargroup. Objective evaluations of waste minimisation activities remain few and far between.
This chapter summarises the results of two New Zealand studies that aimed to provide a betterunderstanding of the factors that contribute to the success or failure of waste minimisation andother related initiatives. The first was an assessment of past and present waste minimisationactivities initiated in New Zealand by local councils, NGOs or businesses, targeting communi-ties or businesses (Stone, 2002a), and was undertaken by CAE as a preliminary exercise leadingto the Resource Stewardship: Waste Minimisation project. The second was an evaluation of theeffectiveness of a multi-sectoral demonstration project that primarily targeted businesses (Stone,2002b). Together, the results of these studies provide valuable insights into the lessons that canbe learnt from waste minimisation programmes and used to improve the potential for success.
This chapter also provides an introduction to the sector-specific chapters that follow.
4.2 Assessing Waste Minimisation Activities in New ZealandThe first phase of CAE’s RS:WM Project (Stone, 2002a) attempted to draw out some of thislearning by interviewing representatives from a sample of 17 waste minimisation initiatives oractivities. While the purpose of the research was to improve the evaluation of waste minimisa-tion initiatives, it included questions designed to provide insight into the factors that contributeto the success and/or failure of such initiatives.
The detailed results of the research are available under separate cover from CAE(www.caenz.com) and will not be repeated here. However, it does seem useful by way ofintroduction to the chapters that follow, to summarise what the research teaches us about theimplementation of resource stewardship and waste minimisation. The research identified threeareas of learning that have the potential to improve the effectiveness of these types of pro-grammes and made recommendations on the development of programmes, the necessarysupport mechanisms, and their contribution to sustainability.
Development of programmes:
• Goals need to be integrated across programmes and regions.
• Success needs to be carefully defined.
• Targets need to be carefully considered and set.
• Monitoring programmes need to be designed in a way that is appropriate for the goals.
• Success needs to be evaluated.
• The results need to be used to improve outcomes.
1 University of Auckland
Page 24 Resource Stewardship and Waste Minimisation
Provision of support for programmes/initiatives
• Particular efforts need to be made to maintain and enhance commitment, motivation andenthusiasm.
• Champions need to be acknowledged and developed.
• Important relationships (e.g. between NGOs, local authorities and target audiences) need tobe developed and enhanced, as does competence.
Making progress towards sustainability
• Costs and benefits need to be evaluated in economic, environmental and social terms.
• That economic viability needs to be de-coupled from success.
• That a life cycle approach is necessary, but does not need to be a dominant feature of allprogrammes.
• That it is important to ensure that the programme does result in progress ‘up the wastemanagement hierarchy’.
Comments in previous chapters emphasise that it is not necessarily important for all initiatives/programmes to ensure progress ‘up’ the hierarchy. It may be more useful, in the interests ofinclusiveness and integration, to recognise that all waste minimisation activities need to contrib-ute to resource stewardship irrespective of their ‘level’ within the waste hierarchy.
The CAE Phase 1 report noted that:
“...ultimately, the most important criterion against which to measure the effectiveness of wasteminimisation initiatives is the extent to which they lead their target audiences to accept responsi-bility for the wastes they generate and, as a result, make changes to what they buy and how they
use their resources” (Stone, 2002a).
However, it is also important to note that the report also emphasised that:
“...this is probably the most difficult criterion to measure and it appears from the research to be
outside the scope of the majority of the initiatives studied. Certainly none of them appear to havebeen measured in these terms. The results suggest that it would be a mistake at this point torecommend that all waste minimisation initiatives be measured according to these terms. The
results suggest that it would be more useful to recommend that initiatives should focus on (andtheir success be measured according to) the areas that are compatible with the interests andcapabilities of those involved” (Stone, 2002a).
Another important outcome of the research was recognition of the importance of social factorsin the change process. The CAE report pointed out that:
“...waste minimisation is essentially about social change, but very little research has been done on
the effectiveness of waste minimisation activities in achieving this” (Stone, 2002a).
Another key recommendation was that it is not necessarily possible to transfer waste minimisa-tion programmes/initiatives to other regions or industry types. For real change to occur,programmes must be developed so that they reflect differing needs, areas of interest andsources of motivation. It is interesting to note that this recommendation suggests that broad-based campaigns such as a recent national campaign are highly unlikely to have any real effecton values. This research suggests that money may be better spent on developing capacity andsupport at a local level, rather than trying to apply a ‘one-size-fits-all’ approach nationally (formore discussion on this, see Stone, 2002c).
Page 25Learning from Experience
4.3 Improving Business ProgrammesThe findings from the CAE assessment of waste minimisation activities complement the resultsof earlier research into the effectiveness of sustainability programmes for business. This researchwas conducted in fulfillment of a PhD thesis in Environmental Science at the University ofAuckland (see Stone, 2002b). The research was unique in that it was the first to undertake an in-depth analysis of the dynamics of change within organisations attempting to put ‘cleanerproduction’ (CP) or ‘pollution prevention’ (PP) into practice. The research was conducted byevaluating the effectiveness of a CP/PP demonstration1 project. While others have conductedevaluations of these types of projects (e.g. Chandak, 1994; Hillary, 1999), this research wasdifferent because organisation theory, specifically as it relates to change and learning, was usedas the basis for developing a new model for improving the effectiveness of sustainabilityprogrammes for business.
While the prescriptive nature of CP and PP distinguishes them from more generic environmen-tal management systems (EM), the programme components are similar. Fig. 3.1 shows commonphases in a generic CP/PP/EM change model. The results of the evaluation could potentially beapplied to improve other business initiatives that use similar components.
The research evaluated New Zealand’s Target Zero (TZ) programme, a two-year, multi-com-pany project designed to demonstrate the value and applicability of CP in New Zealand. TZwas considered suitable for evaluation because it used a relatively standard methodology thathas been applied in CP and PP demonstration projects around the world for the past decade. Itwas the largest and most well-resourced project of its kind in New Zealand and was thereforecomparable, in terms of scale and support, with similar projects in other countries.
The project involved 23 organisations (mostly businesses) in two regions in New Zealand. Italso involved, in supporting roles, the New Zealand Ministry for the Environment (the primaryfunding agency), the Electricity Corporation of New Zealand (project management), localcouncils, power retailers, consultants (as facilitators) and students (as assistants).
The evaluation was conducted in three parts. Part I used a ‘traditional’ approach to evaluationresearch (e.g. Ellis, 1996) that required participants to report, at the end of the project, on itssuccess, benefits and value, as well as ways in which it could have been improved. Part II useda ‘quasi-experimental’ methodology that required participants to provide insight into theexistence of various indicators of EM, CP/PP, organisational culture and personal attitudesbefore, during and after the project. The results from the demonstration group were comparedwith those from a randomly selected ‘control’ group2. Representatives from organisations in thisgroup were surveyed at the same times as those in the demonstration group. Part III used amixture of ‘objectives-based’, ‘expert-opinion’ and ‘goal-free’ approaches to provide in-depthinsight into the dynamics of change within the organisations. The information was provided inthe form of monthly progress reports that were written by consultants acting as facilitators foreach of the demonstration organisations.
In general, the results of Part I of the evaluation suggested that the project was successful.Participants believed that their organisations had benefited from increased awareness of waste-related issues, as well as the resultant environmental improvements and financial savings. Theyattributed this success to the external support that had been provided.
Indeed, in superficial terms, the project could be considered to have been successful. Over $2
1 A CP ‘demonstration’ project is designed to demonstrate the effectiveness of the CP approach in enabling a business toprevent or reduce wastes and/or emissions at source and thereby deliver economic and environmental benefits.Demonstration projects generally involve a number of businesses, whose staff are trained in- and assisted to apply someform of the generic change model presented in Fig. 1.3. Early examples include the Landskrona project in Sweden, thePREPARE project in The Netherlands, the Aire and Calder project in the UK, and the DESIRE project in India.
2 The ‘control’ group consisted of a group of businesses that had been randomly selected within the two regions coveredby the TZ project. They were similar in size and activity type to those from the demonstration group, but were notparticipating in the TZ project.
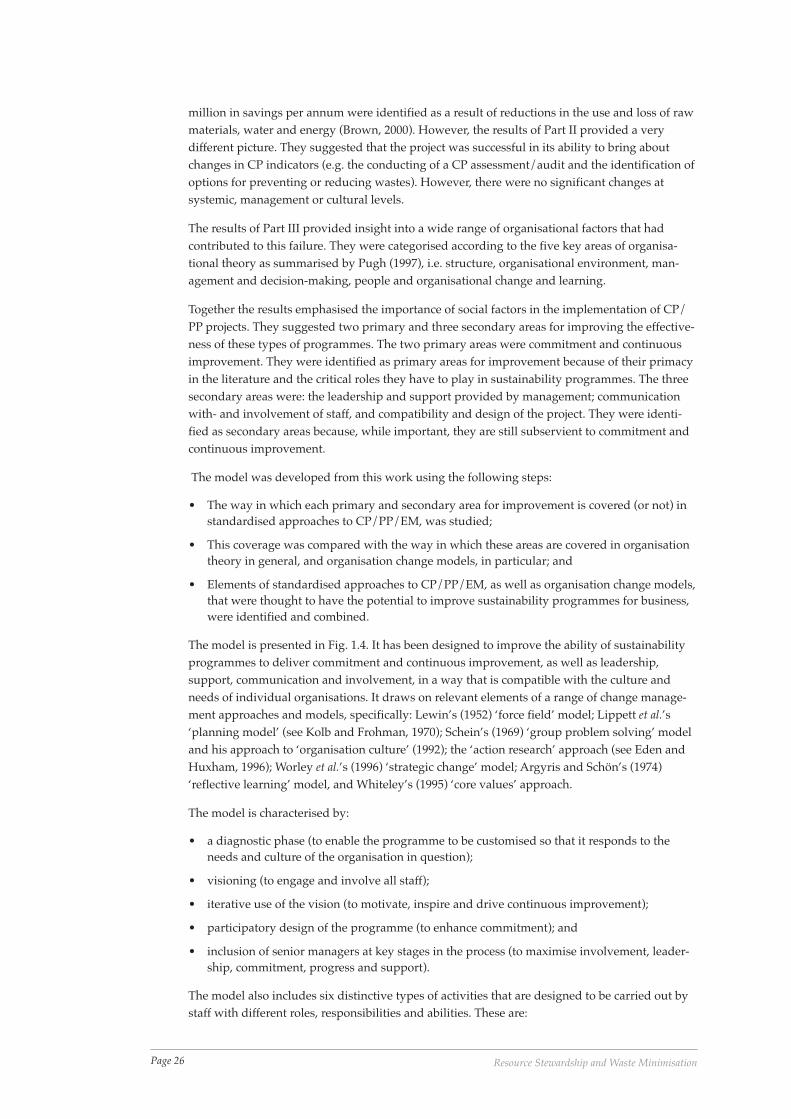
Page 26 Resource Stewardship and Waste Minimisation
million in savings per annum were identified as a result of reductions in the use and loss of rawmaterials, water and energy (Brown, 2000). However, the results of Part II provided a verydifferent picture. They suggested that the project was successful in its ability to bring aboutchanges in CP indicators (e.g. the conducting of a CP assessment/audit and the identification ofoptions for preventing or reducing wastes). However, there were no significant changes atsystemic, management or cultural levels.
The results of Part III provided insight into a wide range of organisational factors that hadcontributed to this failure. They were categorised according to the five key areas of organisa-tional theory as summarised by Pugh (1997), i.e. structure, organisational environment, man-agement and decision-making, people and organisational change and learning.
Together the results emphasised the importance of social factors in the implementation of CP/PP projects. They suggested two primary and three secondary areas for improving the effective-ness of these types of programmes. The two primary areas were commitment and continuousimprovement. They were identified as primary areas for improvement because of their primacyin the literature and the critical roles they have to play in sustainability programmes. The threesecondary areas were: the leadership and support provided by management; communicationwith- and involvement of staff, and compatibility and design of the project. They were identi-fied as secondary areas because, while important, they are still subservient to commitment andcontinuous improvement.
The model was developed from this work using the following steps:
• The way in which each primary and secondary area for improvement is covered (or not) instandardised approaches to CP/PP/EM, was studied;
• This coverage was compared with the way in which these areas are covered in organisationtheory in general, and organisation change models, in particular; and
• Elements of standardised approaches to CP/PP/EM, as well as organisation change models,that were thought to have the potential to improve sustainability programmes for business,were identified and combined.
The model is presented in Fig. 1.4. It has been designed to improve the ability of sustainabilityprogrammes to deliver commitment and continuous improvement, as well as leadership,support, communication and involvement, in a way that is compatible with the culture andneeds of individual organisations. It draws on relevant elements of a range of change manage-ment approaches and models, specifically: Lewin’s (1952) ‘force field’ model; Lippett et al.’s‘planning model’ (see Kolb and Frohman, 1970); Schein’s (1969) ‘group problem solving’ modeland his approach to ‘organisation culture’ (1992); the ‘action research’ approach (see Eden andHuxham, 1996); Worley et al.’s (1996) ‘strategic change’ model; Argyris and Schön’s (1974)‘reflective learning’ model, and Whiteley’s (1995) ‘core values’ approach.
The model is characterised by:
• a diagnostic phase (to enable the programme to be customised so that it responds to theneeds and culture of the organisation in question);
• visioning (to engage and involve all staff);
• iterative use of the vision (to motivate, inspire and drive continuous improvement);
• participatory design of the programme (to enhance commitment); and
• inclusion of senior managers at key stages in the process (to maximise involvement, leader-ship, commitment, progress and support).
The model also includes six distinctive types of activities that are designed to be carried out bystaff with different roles, responsibilities and abilities. These are:
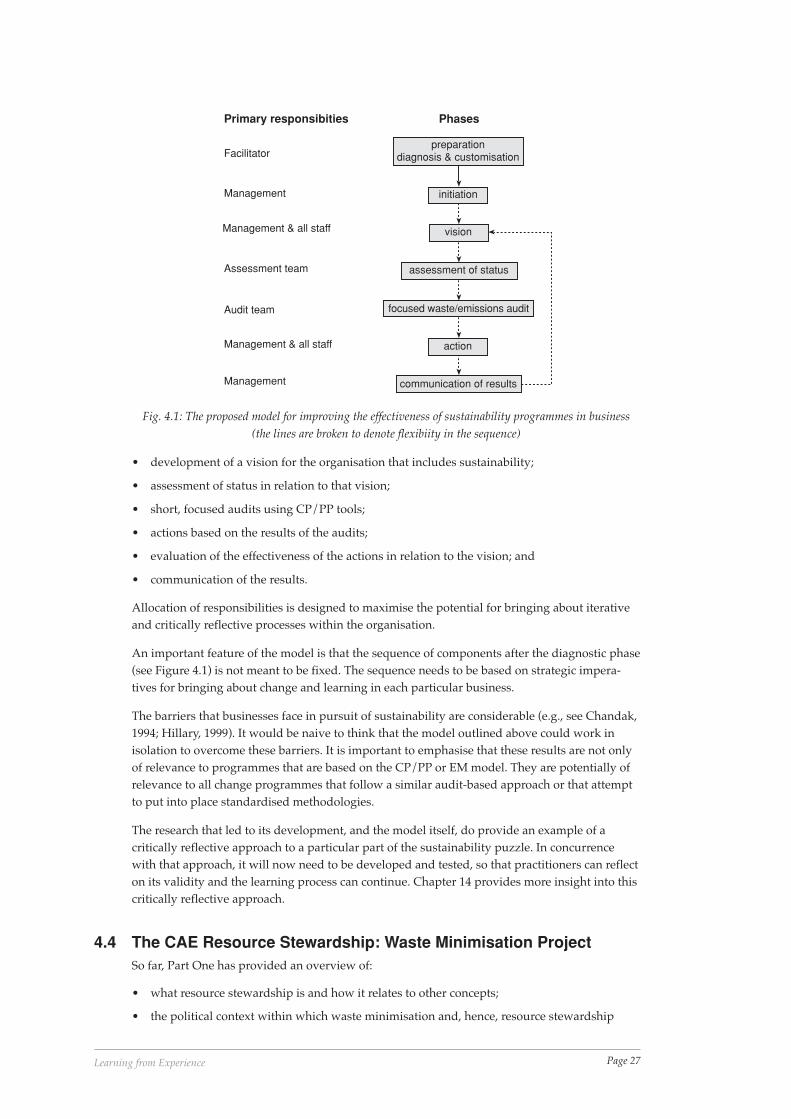
Page 27Learning from Experience
• development of a vision for the organisation that includes sustainability;
• assessment of status in relation to that vision;
• short, focused audits using CP/PP tools;
• actions based on the results of the audits;
• evaluation of the effectiveness of the actions in relation to the vision; and
• communication of the results.
Allocation of responsibilities is designed to maximise the potential for bringing about iterativeand critically reflective processes within the organisation.
An important feature of the model is that the sequence of components after the diagnostic phase(see Figure 4.1) is not meant to be fixed. The sequence needs to be based on strategic impera-tives for bringing about change and learning in each particular business.
The barriers that businesses face in pursuit of sustainability are considerable (e.g., see Chandak,1994; Hillary, 1999). It would be naive to think that the model outlined above could work inisolation to overcome these barriers. It is important to emphasise that these results are not onlyof relevance to programmes that are based on the CP/PP or EM model. They are potentially ofrelevance to all change programmes that follow a similar audit-based approach or that attemptto put into place standardised methodologies.
The research that led to its development, and the model itself, do provide an example of acritically reflective approach to a particular part of the sustainability puzzle. In concurrencewith that approach, it will now need to be developed and tested, so that practitioners can reflecton its validity and the learning process can continue. Chapter 14 provides more insight into thiscritically reflective approach.
4.4 The CAE Resource Stewardship: Waste Minimisation ProjectSo far, Part One has provided an overview of:
• what resource stewardship is and how it relates to other concepts;
• the political context within which waste minimisation and, hence, resource stewardship
Phases
preparationdiagnosis & customisation
initiation
vision
assessment of status
focused waste/emissions audit
action
communication of results
Primary responsibities
Facilitator
Management
Management & all staff
Assessment team
Audit team
Management & all staff
Management
Fig. 4.1: The proposed model for improving the effectiveness of sustainability programmes in business(the lines are broken to denote flexibiity in the sequence)
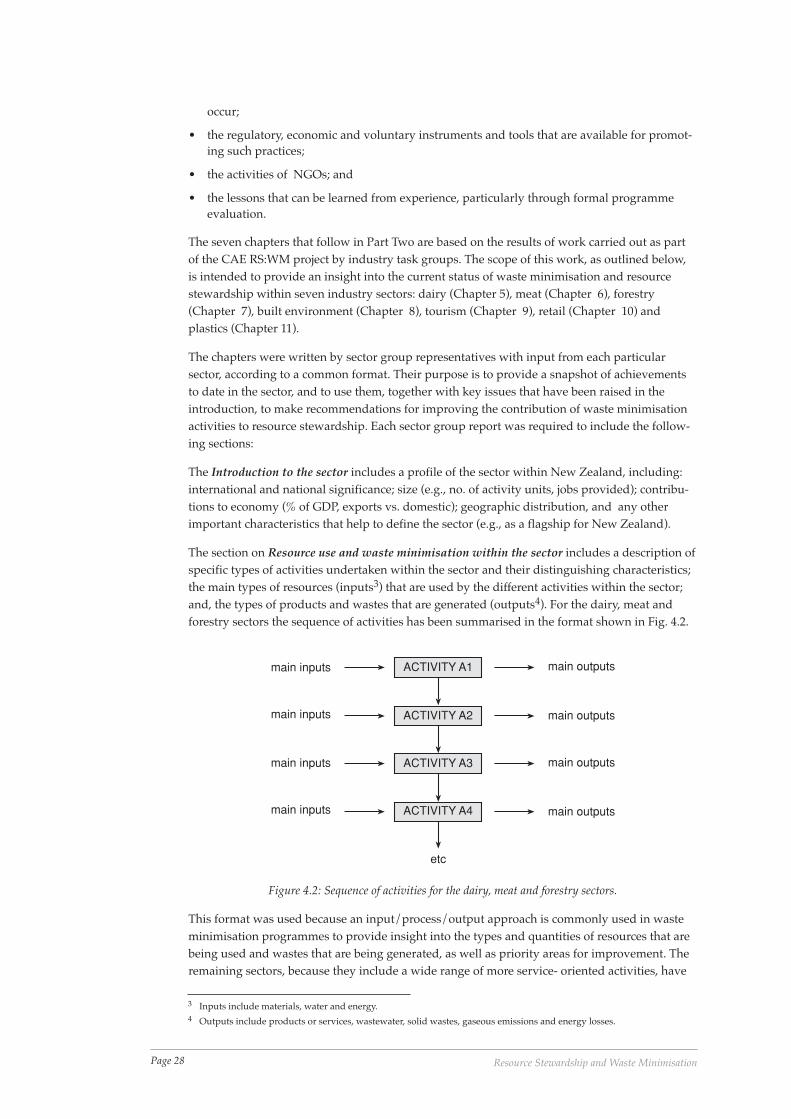
Page 28 Resource Stewardship and Waste Minimisation
occur;
• the regulatory, economic and voluntary instruments and tools that are available for promot-ing such practices;
• the activities of NGOs; and
• the lessons that can be learned from experience, particularly through formal programmeevaluation.
The seven chapters that follow in Part Two are based on the results of work carried out as partof the CAE RS:WM project by industry task groups. The scope of this work, as outlined below,is intended to provide an insight into the current status of waste minimisation and resourcestewardship within seven industry sectors: dairy (Chapter 5), meat (Chapter 6), forestry(Chapter 7), built environment (Chapter 8), tourism (Chapter 9), retail (Chapter 10) andplastics (Chapter 11).
The chapters were written by sector group representatives with input from each particularsector, according to a common format. Their purpose is to provide a snapshot of achievementsto date in the sector, and to use them, together with key issues that have been raised in theintroduction, to make recommendations for improving the contribution of waste minimisationactivities to resource stewardship. Each sector group report was required to include the follow-ing sections:
The Introduction to the sector includes a profile of the sector within New Zealand, including:international and national significance; size (e.g., no. of activity units, jobs provided); contribu-tions to economy (% of GDP, exports vs. domestic); geographic distribution, and any otherimportant characteristics that help to define the sector (e.g., as a flagship for New Zealand).
The section on Resource use and waste minimisation within the sector includes a description ofspecific types of activities undertaken within the sector and their distinguishing characteristics;the main types of resources (inputs3) that are used by the different activities within the sector;and, the types of products and wastes that are generated (outputs4). For the dairy, meat andforestry sectors the sequence of activities has been summarised in the format shown in Fig. 4.2.
ACTIVITY A1
ACTIVITY A2
ACTIVITY A3
ACTIVITY A4
main inputs main outputs
main inputs
main inputs
main inputs
main outputs
main outputs
main outputs
etc
Figure 4.2: Sequence of activities for the dairy, meat and forestry sectors.
This format was used because an input/process/output approach is commonly used in wasteminimisation programmes to provide insight into the types and quantities of resources that arebeing used and wastes that are being generated, as well as priority areas for improvement. Theremaining sectors, because they include a wide range of more service- oriented activities, have
3 Inputs include materials, water and energy.4 Outputs include products or services, wastewater, solid wastes, gaseous emissions and energy losses.
Page 29Learning from Experience
adapted this format in ways that provide similar insights, but that are unique to the sectorsthemselves. In addition, this section includes (wherever possible) estimates of total quantities ofinputs and outputs for each of the activities in the sector. The processes and/or services aredescribed, as well as any reduction, re-use, recycling and recovery that may occur beforeresources are finally discarded as wastes. Case studies are included to provide insight into thelearning process that is occurring within each sector.
The next section on Resource stewardship within the sector, provides insight into the extent towhich resource stewardship is (or isn’t) occurring within the sector. It also identifies anyobstacles to, and opportunities for, enhancing the contribution that waste minimisation makesto resource stewardship within the sector.
The section on Governance of the sector identifies and briefly describes any relevant standards,guidelines and codes of practice that apply to the sector. It also includes an indication of theextent to which: 1) they are used, and 2) they contribute to resource use and stewardship withinthe sector.
The section on Drivers for change within the sector includes current influences on the sector(i.e. what currently drives and constrains it). This includes social, economic and environmentalinfluences at local, regional, national and international levels (where relevant), as well as thekey relationships within the sector and how sector or producer/provider responsibility isexercised. This section provides insight into how these drivers affect resource use and steward-ship within the sector. It also describes how existing and potential drivers could be harnessedto improve resource use and stewardship, and identifies any other drivers that have the poten-tial to bring about change in the future.
Finally, Conclusions and recommendations draws key conclusions from the way resourcestewardship and waste minimisation occur within the sector, and attempts to answer twoquestions: 1) What can be learned from current practices? and 2) How can the sector movetowards resource stewardship and reducing the generation of wastes? It includes a set ofrecommendations on how the sector’s contribution to resource stewardship in New Zealandcould be improved.
The CAE project and this publication have provided a unique opportunity to critically reflect onachievements to date and to learn from past experience. Part Three considers the informationpresented in the industry sector chapters within the context of waste generation in NewZealand, and includes recommendations on what needs to occur for New Zealand to make realprogress towards resource stewardship. These recommendations are not presented as a set ofprescriptive tools, but rather in response to the results of the project. Together, the chapters aimto enhance readers’ knowledge of resource stewardship and the role of waste minimisation.They aim to provide decision-makers and practitioners with insights that will help them tochange their thinking from waste minimisation to resource stewardship.
The CAE project has involved a generous amount of voluntary effort on the part of many in theproject team and CAE gratefully acknowledges and appreciates the effort that has been made.There have, of course, also been significant costs involved and the project would not have beenpossible without substantial assistance from the Sustainable Management Fund as well asfinancial contributions from many territorial and regional councils. The councils that contrib-uted to the project are listed in the Acknowledgements at the front of this book.
4.5 ReferencesArgyris, C and Schön, D A, 1974. Theory in practice: Increasing professional practice, Jossey-Bass,
San Francisco.
Brown, G, 2000. “You too can profit from cleaner production and waste minimisation”, Brochure
Page 30 Resource Stewardship and Waste Minimisation
reporting the results of the Target Zero project, produced by Ecosense Ltd., with fundingfrom the New Zealand Ministry for the Environment, Wellington.
Chandak, R P, 1994. “Demonstrating cleaner production in SME’s in India: UNIDO-NPCexperience of project ‘DESIRE’”, in: Proceedings of the Third High Level Advisory Seminar onCleaner Production, United Nations Environment Programme, 12-14 October, Warsaw.
Eden, C and Huxham, C, 1996. “Action research for the study of organizations”, in: S R Clegg, CHardy and W R Nord (eds.), Handbook of Organization Studies, Sage, London. pp 526-542
Ellis, L, 1996. Research Methodologies for the Social Sciences, McGraw-Hill, New York.
Hillary, R, 1999. Evaluation of Study Reports on the Barriers, Opportunities and Drivers for Small- andMedium-sized Enterprises in the Adoption of Environmental Management Systems, Reportsubmitted to the Environment Directorate, UK Dept. of Trade and Industry, London.
Kolb, D A and Frohman, A L, 1970. “An organization development approach to consulting”,Sloan Management Review 12: 51-65.
Lewin, K, 1952. Field Theory in Social Science: Selected Theoretical Papers, (published post-humously) D Cartwright (ed.), Tavistock, London.
Pugh, D S (Ed.), 1997. Organisation theory: Selected Readings, (4th ed.), Penguin Books, London.
Schein, E, 1969. Process Consultation: Its Role in Organization Development, Addison-Wesley,Reading, Mass.
Schein, E, 1992. Organizational Culture and Leadership, (2nd ed.). Jossey-Bass, San Francisco.
Stone, L-J, 1994. “Progress towards cleaner production, and the role of life cycle analysis inwaste management”, in Our Waste: Our Responsibility, Centre for Advanced Engineering,University of Canterbury, Christchurch.
Stone, L-J, 2002a. “Assessment of waste minimisation activities in New Zealand”, Centre forAdvanced Engineering (CAE) Resource Stewardship/Waste Minimisation Project, Phase 1Report, CAE, University of Canterbury, Christchurch, 86pp.
Stone, L-J. 2002b. Sustainability Programmes for Business: Place and Practice within the Context ofRelevant Developments in Organisation Theory, PhD thesis, University of Auckland.
Stone, L-J. 2002c. “From lifewith...to lifeafterwaste: A Strategic Approach”, in Proceedings of theWaste Management Institute of New Zealand Annual Conference, Rotorua, 6-8 Nov.
UNEP, 2000. International Cleaner Production Information Centre: Technical case studies, UnitedNations Environment Programme, Division of Technology, Industry and Economics website:www.emcentre.com/unepweb/tec_case/index.htm.
Whiteley, A, 1995. Managing change: A Core Values Approach, Macmillan Education, Australia.
Worley, C G, Hitchin, D E and Ross W E, 1996. Integrated Strategic Change: How OD BuildsCompetitive Advantage, Addison-Wesley, Reading, Mass.
Part 2:
Industry Sector
Reports

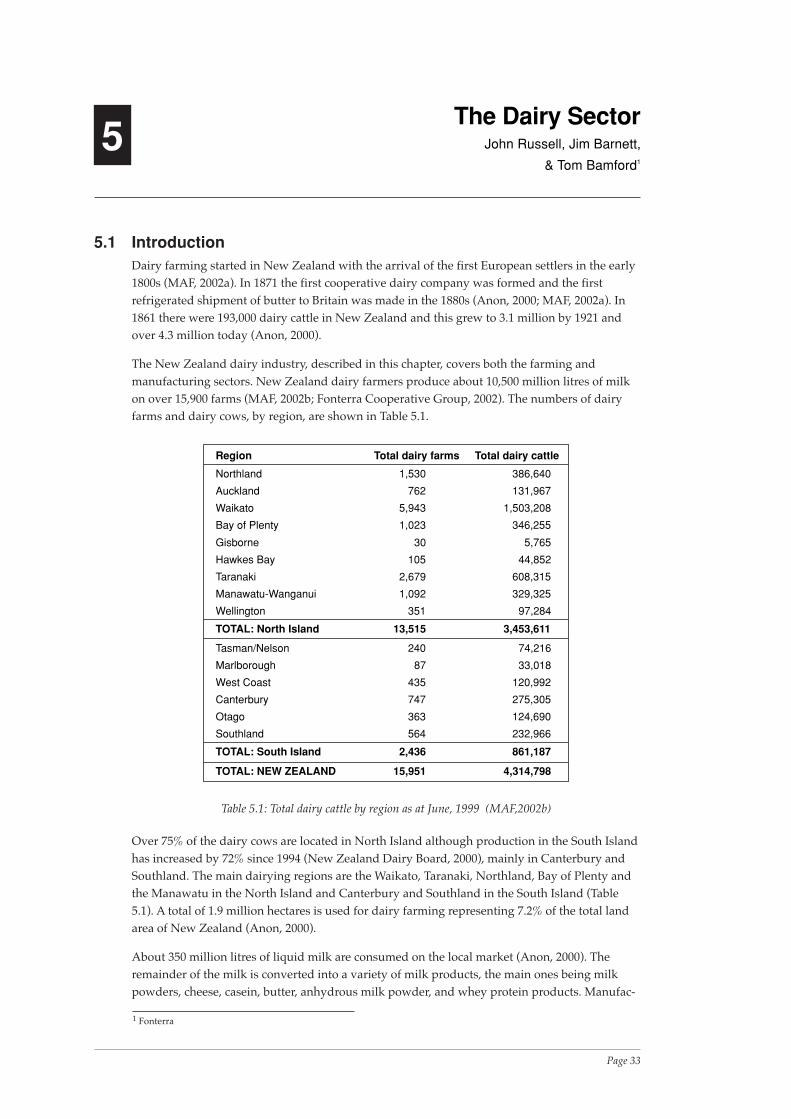
Page 33The Dairy Sector
5The Dairy Sector
John Russell, Jim Barnett,
& Tom Bamford1
5.1 IntroductionDairy farming started in New Zealand with the arrival of the first European settlers in the early1800s (MAF, 2002a). In 1871 the first cooperative dairy company was formed and the firstrefrigerated shipment of butter to Britain was made in the 1880s (Anon, 2000; MAF, 2002a). In1861 there were 193,000 dairy cattle in New Zealand and this grew to 3.1 million by 1921 andover 4.3 million today (Anon, 2000).
The New Zealand dairy industry, described in this chapter, covers both the farming andmanufacturing sectors. New Zealand dairy farmers produce about 10,500 million litres of milkon over 15,900 farms (MAF, 2002b; Fonterra Cooperative Group, 2002). The numbers of dairyfarms and dairy cows, by region, are shown in Table 5.1.
Region Total dairy farms Total dairy cattle
Northland 1,530 386,640
Auckland 762 131,967
Waikato 5,943 1,503,208
Bay of Plenty 1,023 346,255
Gisborne 30 5,765
Hawkes Bay 105 44,852
Taranaki 2,679 608,315
Manawatu-Wanganui 1,092 329,325
Wellington 351 97,284
TOTAL: North Island 13,515 3,453,611
Tasman/Nelson 240 74,216
Marlborough 87 33,018
West Coast 435 120,992
Canterbury 747 275,305
Otago 363 124,690
Southland 564 232,966
TOTAL: South Island 2,436 861,187
TOTAL: NEW ZEALAND 15,951 4,314,798
Table 5.1: Total dairy cattle by region as at June, 1999 (MAF,2002b)
Over 75% of the dairy cows are located in North Island although production in the South Islandhas increased by 72% since 1994 (New Zealand Dairy Board, 2000), mainly in Canterbury andSouthland. The main dairying regions are the Waikato, Taranaki, Northland, Bay of Plenty andthe Manawatu in the North Island and Canterbury and Southland in the South Island (Table5.1). A total of 1.9 million hectares is used for dairy farming representing 7.2% of the total landarea of New Zealand (Anon, 2000).
About 350 million litres of liquid milk are consumed on the local market (Anon, 2000). Theremainder of the milk is converted into a variety of milk products, the main ones being milkpowders, cheese, casein, butter, anhydrous milk powder, and whey protein products. Manufac-
1 Fonterra
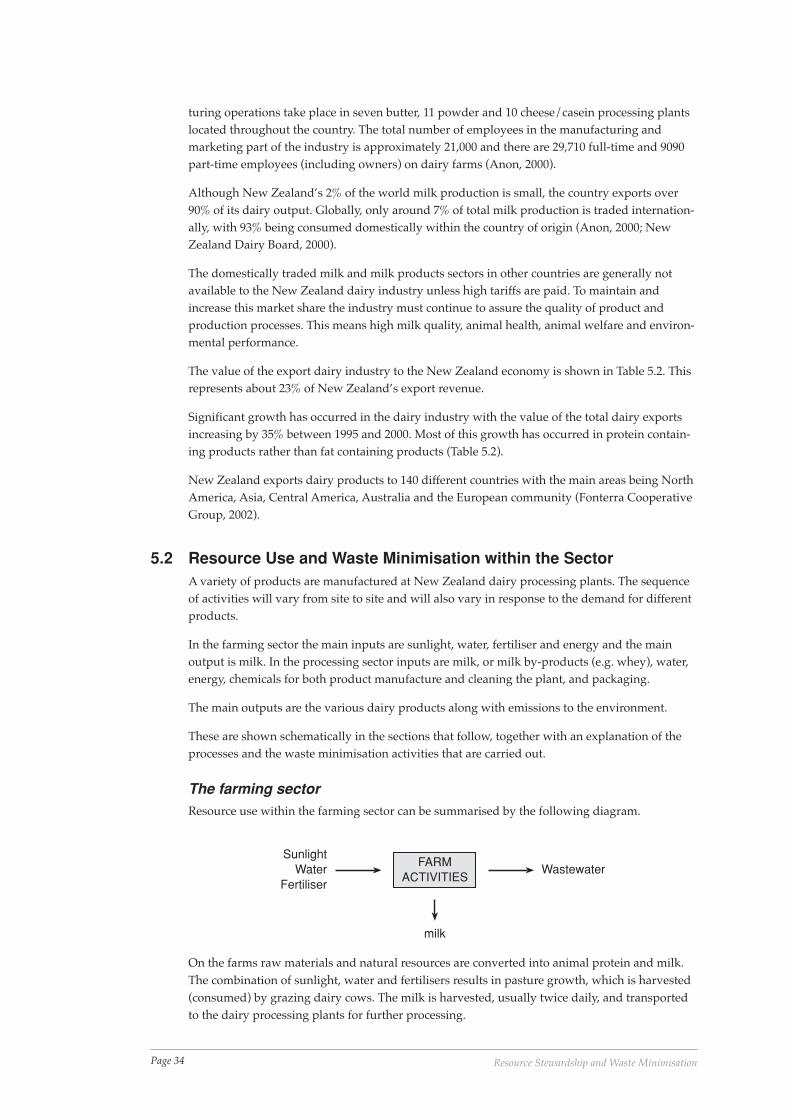
Page 34 Resource Stewardship and Waste Minimisation
turing operations take place in seven butter, 11 powder and 10 cheese/casein processing plantslocated throughout the country. The total number of employees in the manufacturing andmarketing part of the industry is approximately 21,000 and there are 29,710 full-time and 9090part-time employees (including owners) on dairy farms (Anon, 2000).
Although New Zealand’s 2% of the world milk production is small, the country exports over90% of its dairy output. Globally, only around 7% of total milk production is traded internation-ally, with 93% being consumed domestically within the country of origin (Anon, 2000; NewZealand Dairy Board, 2000).
The domestically traded milk and milk products sectors in other countries are generally notavailable to the New Zealand dairy industry unless high tariffs are paid. To maintain andincrease this market share the industry must continue to assure the quality of product andproduction processes. This means high milk quality, animal health, animal welfare and environ-mental performance.
The value of the export dairy industry to the New Zealand economy is shown in Table 5.2. Thisrepresents about 23% of New Zealand’s export revenue.
Significant growth has occurred in the dairy industry with the value of the total dairy exportsincreasing by 35% between 1995 and 2000. Most of this growth has occurred in protein contain-ing products rather than fat containing products (Table 5.2).
New Zealand exports dairy products to 140 different countries with the main areas being NorthAmerica, Asia, Central America, Australia and the European community (Fonterra CooperativeGroup, 2002).
5.2 Resource Use and Waste Minimisation within the SectorA variety of products are manufactured at New Zealand dairy processing plants. The sequenceof activities will vary from site to site and will also vary in response to the demand for differentproducts.
In the farming sector the main inputs are sunlight, water, fertiliser and energy and the mainoutput is milk. In the processing sector inputs are milk, or milk by-products (e.g. whey), water,energy, chemicals for both product manufacture and cleaning the plant, and packaging.
The main outputs are the various dairy products along with emissions to the environment.
These are shown schematically in the sections that follow, together with an explanation of theprocesses and the waste minimisation activities that are carried out.
The farming sectorResource use within the farming sector can be summarised by the following diagram.
SunlightWater
Fertiliser
milk
WastewaterFARM
ACTIVITIES
On the farms raw materials and natural resources are converted into animal protein and milk.The combination of sunlight, water and fertilisers results in pasture growth, which is harvested(consumed) by grazing dairy cows. The milk is harvested, usually twice daily, and transportedto the dairy processing plants for further processing.
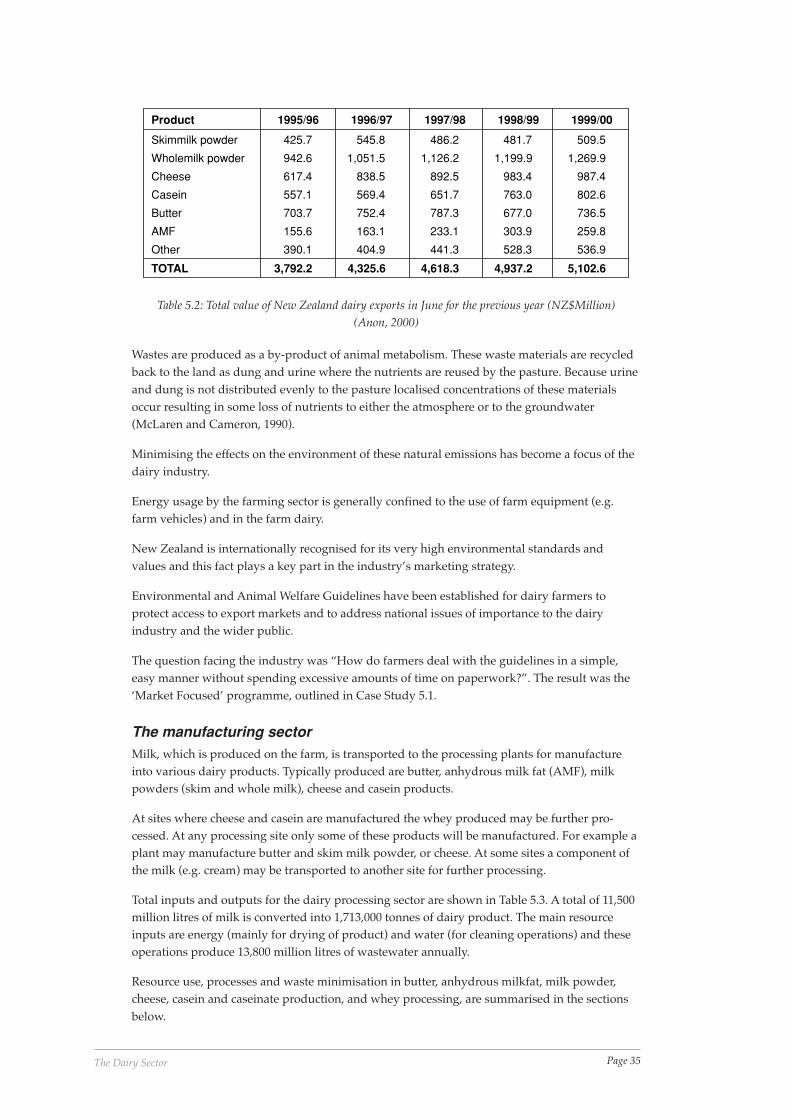
Page 35The Dairy Sector
Wastes are produced as a by-product of animal metabolism. These waste materials are recycledback to the land as dung and urine where the nutrients are reused by the pasture. Because urineand dung is not distributed evenly to the pasture localised concentrations of these materialsoccur resulting in some loss of nutrients to either the atmosphere or to the groundwater(McLaren and Cameron, 1990).
Minimising the effects on the environment of these natural emissions has become a focus of thedairy industry.
Energy usage by the farming sector is generally confined to the use of farm equipment (e.g.farm vehicles) and in the farm dairy.
New Zealand is internationally recognised for its very high environmental standards andvalues and this fact plays a key part in the industry’s marketing strategy.
Environmental and Animal Welfare Guidelines have been established for dairy farmers toprotect access to export markets and to address national issues of importance to the dairyindustry and the wider public.
The question facing the industry was “How do farmers deal with the guidelines in a simple,easy manner without spending excessive amounts of time on paperwork?”. The result was the‘Market Focused’ programme, outlined in Case Study 5.1.
The manufacturing sectorMilk, which is produced on the farm, is transported to the processing plants for manufactureinto various dairy products. Typically produced are butter, anhydrous milk fat (AMF), milkpowders (skim and whole milk), cheese and casein products.
At sites where cheese and casein are manufactured the whey produced may be further pro-cessed. At any processing site only some of these products will be manufactured. For example aplant may manufacture butter and skim milk powder, or cheese. At some sites a component ofthe milk (e.g. cream) may be transported to another site for further processing.
Total inputs and outputs for the dairy processing sector are shown in Table 5.3. A total of 11,500million litres of milk is converted into 1,713,000 tonnes of dairy product. The main resourceinputs are energy (mainly for drying of product) and water (for cleaning operations) and theseoperations produce 13,800 million litres of wastewater annually.
Resource use, processes and waste minimisation in butter, anhydrous milkfat, milk powder,cheese, casein and caseinate production, and whey processing, are summarised in the sectionsbelow.
Product 1995/96 1996/97 1997/98 1998/99 1999/00
Skimmilk powder 425.7 545.8 486.2 481.7 509.5
Wholemilk powder 942.6 1,051.5 1,126.2 1,199.9 1,269.9
Cheese 617.4 838.5 892.5 983.4 987.4
Casein 557.1 569.4 651.7 763.0 802.6
Butter 703.7 752.4 787.3 677.0 736.5
AMF 155.6 163.1 233.1 303.9 259.8
Other 390.1 404.9 441.3 528.3 536.9
TOTAL 3,792.2 4,325.6 4,618.3 4,937.2 5,102.6
Table 5.2: Total value of New Zealand dairy exports in June for the previous year (NZ$Million)(Anon, 2000)
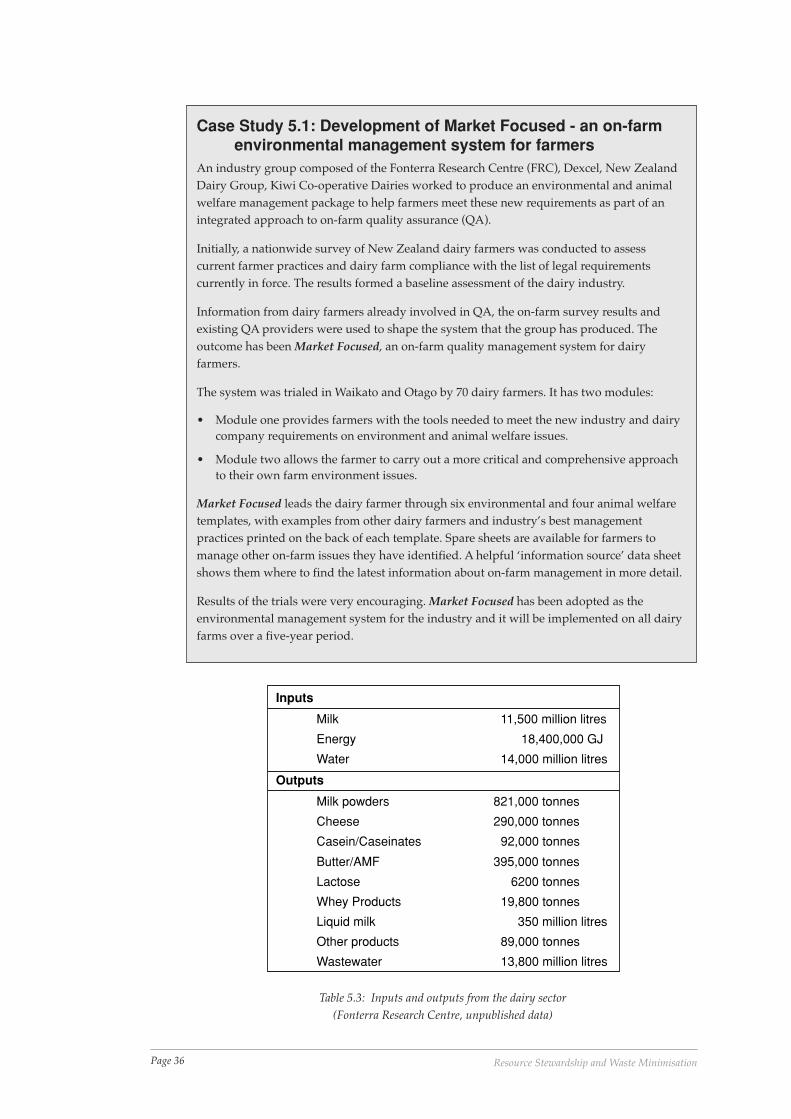
Page 36 Resource Stewardship and Waste Minimisation
Case Study 5.1: Development of Market Focused - an on-farmenvironmental management system for farmers
An industry group composed of the Fonterra Research Centre (FRC), Dexcel, New ZealandDairy Group, Kiwi Co-operative Dairies worked to produce an environmental and animalwelfare management package to help farmers meet these new requirements as part of anintegrated approach to on-farm quality assurance (QA).
Initially, a nationwide survey of New Zealand dairy farmers was conducted to assesscurrent farmer practices and dairy farm compliance with the list of legal requirementscurrently in force. The results formed a baseline assessment of the dairy industry.
Information from dairy farmers already involved in QA, the on-farm survey results andexisting QA providers were used to shape the system that the group has produced. Theoutcome has been Market Focused, an on-farm quality management system for dairyfarmers.
The system was trialed in Waikato and Otago by 70 dairy farmers. It has two modules:
• Module one provides farmers with the tools needed to meet the new industry and dairycompany requirements on environment and animal welfare issues.
• Module two allows the farmer to carry out a more critical and comprehensive approachto their own farm environment issues.
Market Focused leads the dairy farmer through six environmental and four animal welfaretemplates, with examples from other dairy farmers and industry’s best managementpractices printed on the back of each template. Spare sheets are available for farmers tomanage other on-farm issues they have identified. A helpful ‘information source’ data sheetshows them where to find the latest information about on-farm management in more detail.
Results of the trials were very encouraging. Market Focused has been adopted as theenvironmental management system for the industry and it will be implemented on all dairyfarms over a five-year period.
Inputs
Milk 11,500 million litres
Energy 18,400,000 GJ
Water 14,000 million litres
Outputs
Milk powders 821,000 tonnes
Cheese 290,000 tonnes
Casein/Caseinates 92,000 tonnes
Butter/AMF 395,000 tonnes
Lactose 6200 tonnes
Whey Products 19,800 tonnes
Liquid milk 350 million litres
Other products 89,000 tonnes
Wastewater 13,800 million litres
Table 5.3: Inputs and outputs from the dairy sector(Fonterra Research Centre, unpublished data)
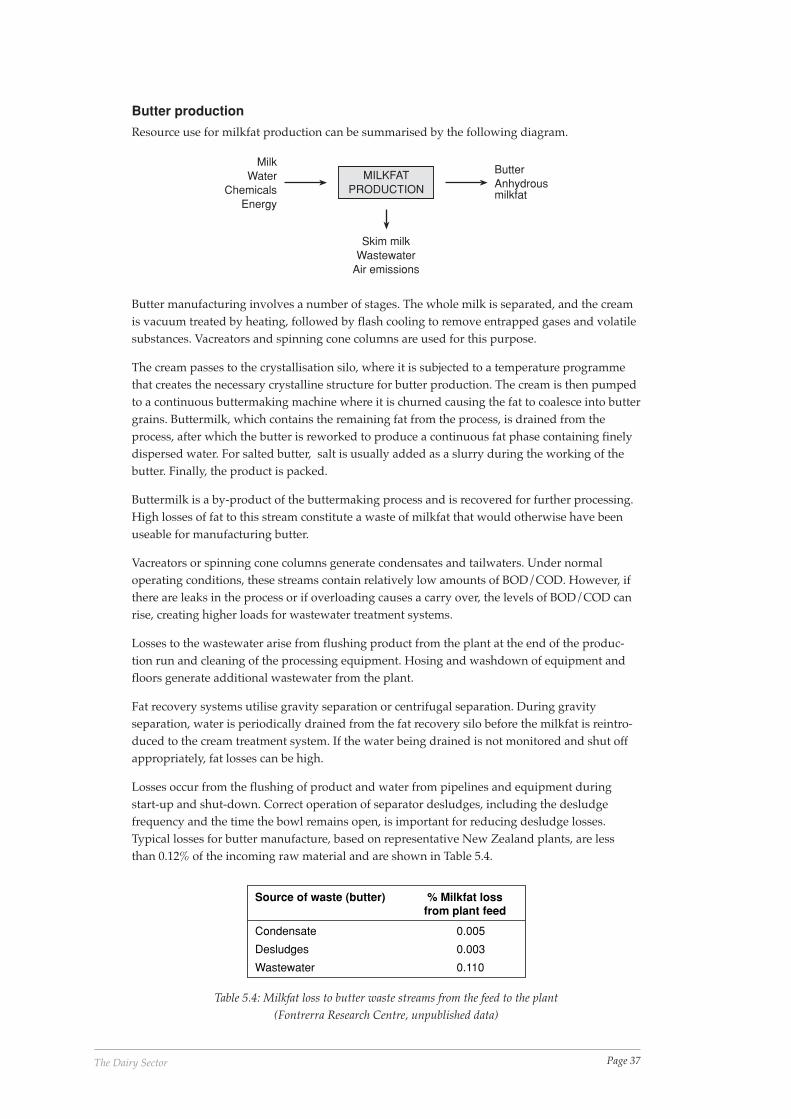
Page 37The Dairy Sector
Butter production
Resource use for milkfat production can be summarised by the following diagram.
Skim milkWastewater
Air emissions
MILKFATPRODUCTION
MilkWater
ChemicalsEnergy
ButterAnhydrousmilkfat
Butter manufacturing involves a number of stages. The whole milk is separated, and the creamis vacuum treated by heating, followed by flash cooling to remove entrapped gases and volatilesubstances. Vacreators and spinning cone columns are used for this purpose.
The cream passes to the crystallisation silo, where it is subjected to a temperature programmethat creates the necessary crystalline structure for butter production. The cream is then pumpedto a continuous buttermaking machine where it is churned causing the fat to coalesce into buttergrains. Buttermilk, which contains the remaining fat from the process, is drained from theprocess, after which the butter is reworked to produce a continuous fat phase containing finelydispersed water. For salted butter, salt is usually added as a slurry during the working of thebutter. Finally, the product is packed.
Buttermilk is a by-product of the buttermaking process and is recovered for further processing.High losses of fat to this stream constitute a waste of milkfat that would otherwise have beenuseable for manufacturing butter.
Vacreators or spinning cone columns generate condensates and tailwaters. Under normaloperating conditions, these streams contain relatively low amounts of BOD/COD. However, ifthere are leaks in the process or if overloading causes a carry over, the levels of BOD/COD canrise, creating higher loads for wastewater treatment systems.
Losses to the wastewater arise from flushing product from the plant at the end of the produc-tion run and cleaning of the processing equipment. Hosing and washdown of equipment andfloors generate additional wastewater from the plant.
Fat recovery systems utilise gravity separation or centrifugal separation. During gravityseparation, water is periodically drained from the fat recovery silo before the milkfat is reintro-duced to the cream treatment system. If the water being drained is not monitored and shut offappropriately, fat losses can be high.
Losses occur from the flushing of product and water from pipelines and equipment duringstart-up and shut-down. Correct operation of separator desludges, including the desludgefrequency and the time the bowl remains open, is important for reducing desludge losses.Typical losses for butter manufacture, based on representative New Zealand plants, are lessthan 0.12% of the incoming raw material and are shown in Table 5.4.
Source of waste (butter) % Milkfat lossfrom plant feed
Condensate 0.005
Desludges 0.003
Wastewater 0.110
Table 5.4: Milkfat loss to butter waste streams from the feed to the plant(Fontrerra Research Centre, unpublished data)
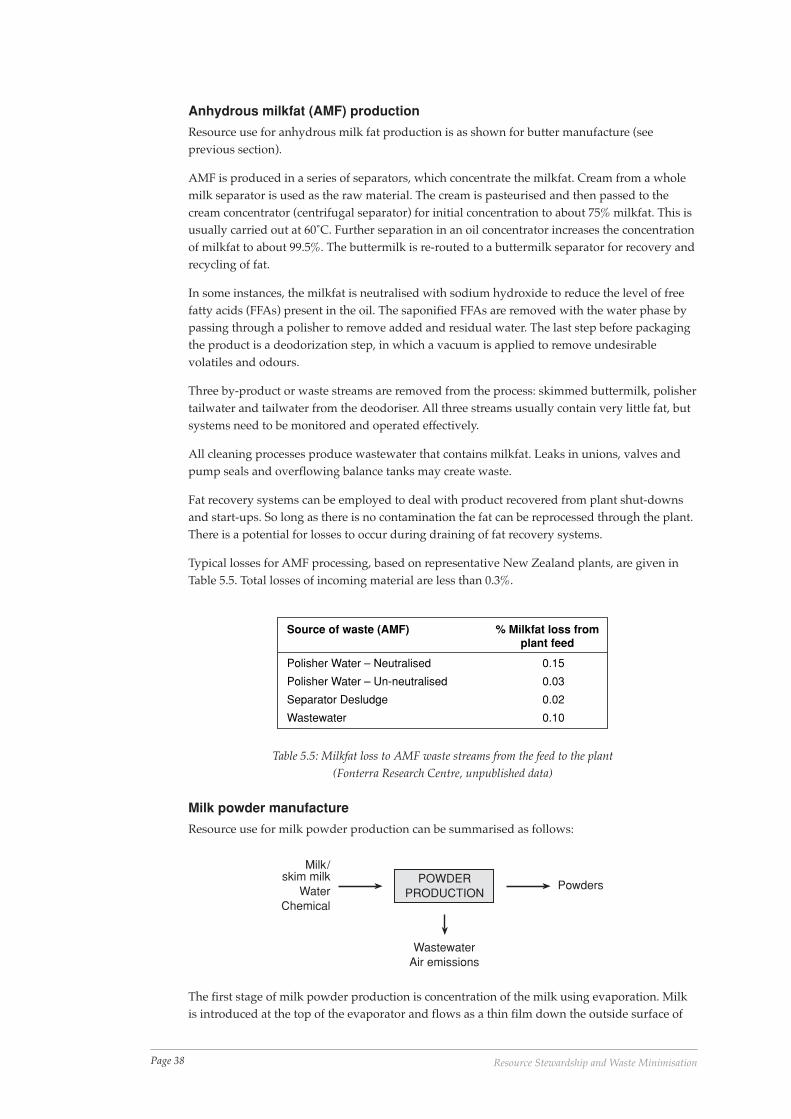
Page 38 Resource Stewardship and Waste Minimisation
Anhydrous milkfat (AMF) production
Resource use for anhydrous milk fat production is as shown for butter manufacture (seeprevious section).
AMF is produced in a series of separators, which concentrate the milkfat. Cream from a wholemilk separator is used as the raw material. The cream is pasteurised and then passed to thecream concentrator (centrifugal separator) for initial concentration to about 75% milkfat. This isusually carried out at 60˚C. Further separation in an oil concentrator increases the concentrationof milkfat to about 99.5%. The buttermilk is re-routed to a buttermilk separator for recovery andrecycling of fat.
In some instances, the milkfat is neutralised with sodium hydroxide to reduce the level of freefatty acids (FFAs) present in the oil. The saponified FFAs are removed with the water phase bypassing through a polisher to remove added and residual water. The last step before packagingthe product is a deodorization step, in which a vacuum is applied to remove undesirablevolatiles and odours.
Three by-product or waste streams are removed from the process: skimmed buttermilk, polishertailwater and tailwater from the deodoriser. All three streams usually contain very little fat, butsystems need to be monitored and operated effectively.
All cleaning processes produce wastewater that contains milkfat. Leaks in unions, valves andpump seals and overflowing balance tanks may create waste.
Fat recovery systems can be employed to deal with product recovered from plant shut-downsand start-ups. So long as there is no contamination the fat can be reprocessed through the plant.There is a potential for losses to occur during draining of fat recovery systems.
Typical losses for AMF processing, based on representative New Zealand plants, are given inTable 5.5. Total losses of incoming material are less than 0.3%.
Source of waste (AMF) % Milkfat loss fromplant feed
Polisher Water – Neutralised 0.15
Polisher Water – Un-neutralised 0.03
Separator Desludge 0.02
Wastewater 0.10
Table 5.5: Milkfat loss to AMF waste streams from the feed to the plant(Fonterra Research Centre, unpublished data)
Milk powder manufacture
Resource use for milk powder production can be summarised as follows:
WastewaterAir emissions
POWDERPRODUCTION
Milk/skim milk
WaterChemical
Powders
The first stage of milk powder production is concentration of the milk using evaporation. Milkis introduced at the top of the evaporator and flows as a thin film down the outside surface of
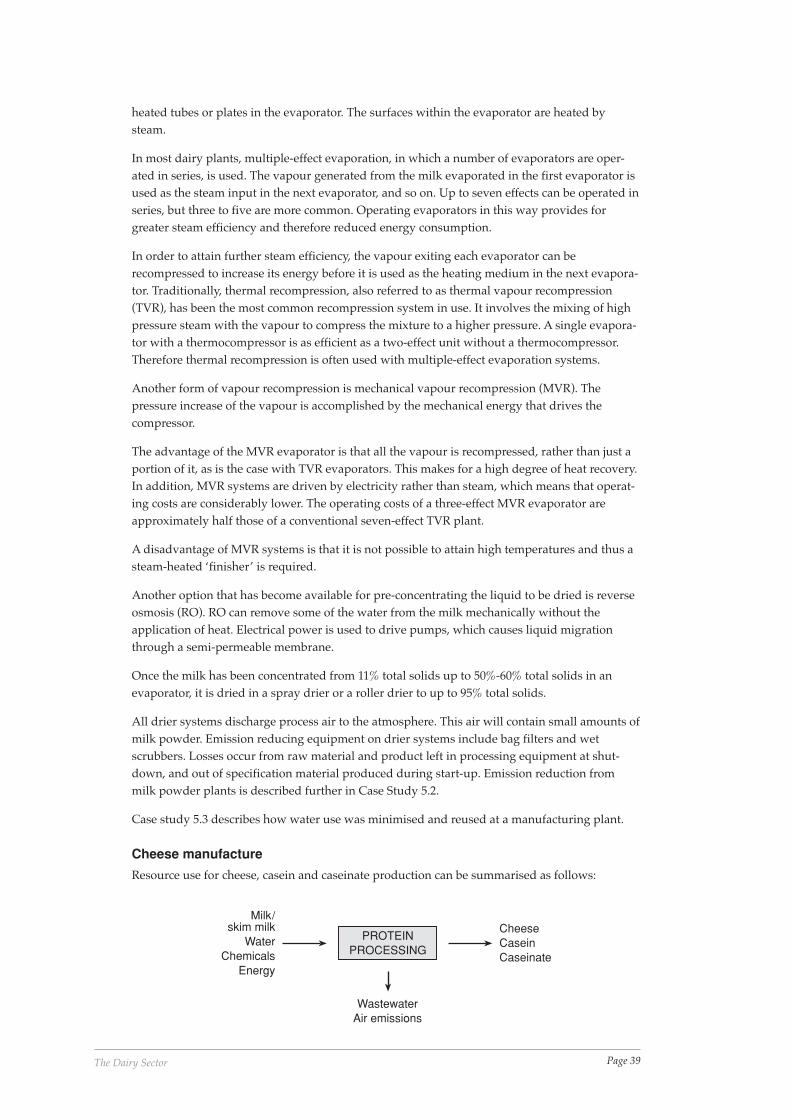
Page 39The Dairy Sector
heated tubes or plates in the evaporator. The surfaces within the evaporator are heated bysteam.
In most dairy plants, multiple-effect evaporation, in which a number of evaporators are oper-ated in series, is used. The vapour generated from the milk evaporated in the first evaporator isused as the steam input in the next evaporator, and so on. Up to seven effects can be operated inseries, but three to five are more common. Operating evaporators in this way provides forgreater steam efficiency and therefore reduced energy consumption.
In order to attain further steam efficiency, the vapour exiting each evaporator can berecompressed to increase its energy before it is used as the heating medium in the next evapora-tor. Traditionally, thermal recompression, also referred to as thermal vapour recompression(TVR), has been the most common recompression system in use. It involves the mixing of highpressure steam with the vapour to compress the mixture to a higher pressure. A single evapora-tor with a thermocompressor is as efficient as a two-effect unit without a thermocompressor.Therefore thermal recompression is often used with multiple-effect evaporation systems.
Another form of vapour recompression is mechanical vapour recompression (MVR). Thepressure increase of the vapour is accomplished by the mechanical energy that drives thecompressor.
The advantage of the MVR evaporator is that all the vapour is recompressed, rather than just aportion of it, as is the case with TVR evaporators. This makes for a high degree of heat recovery.In addition, MVR systems are driven by electricity rather than steam, which means that operat-ing costs are considerably lower. The operating costs of a three-effect MVR evaporator areapproximately half those of a conventional seven-effect TVR plant.
A disadvantage of MVR systems is that it is not possible to attain high temperatures and thus asteam-heated ‘finisher’ is required.
Another option that has become available for pre-concentrating the liquid to be dried is reverseosmosis (RO). RO can remove some of the water from the milk mechanically without theapplication of heat. Electrical power is used to drive pumps, which causes liquid migrationthrough a semi-permeable membrane.
Once the milk has been concentrated from 11% total solids up to 50%-60% total solids in anevaporator, it is dried in a spray drier or a roller drier to up to 95% total solids.
All drier systems discharge process air to the atmosphere. This air will contain small amounts ofmilk powder. Emission reducing equipment on drier systems include bag filters and wetscrubbers. Losses occur from raw material and product left in processing equipment at shut-down, and out of specification material produced during start-up. Emission reduction frommilk powder plants is described further in Case Study 5.2.
Case study 5.3 describes how water use was minimised and reused at a manufacturing plant.
Cheese manufacture
Resource use for cheese, casein and caseinate production can be summarised as follows:
WastewaterAir emissions
PROTEINPROCESSING
Milk/skim milk
WaterChemicals
Energy
CheeseCaseinCaseinate
Page 40 Resource Stewardship and Waste Minimisation
During the manufacture of cheese, whole milk is passed through a separator that removes partof the cream component. The milk is then pasteurised, and a bacterial culture and rennet isadded. The enzyme activity of the rennet and bacterial action creates conditions that allow themilk to coagulate into curds and whey.
The curd is separated from the whey and, where necessary, salt is added to the curd. Wheyresulting from the salt addition processes is known as salt whey.
The cheese blocks are packed to allow ripening to occur.
Case Study 5.2: Reducing air emissionsMilk powder driers that were fitted with cyclone powder collectors lost up to 1% of the skimmilk powder to the atmosphere. The milk powder was subsequently deposited on thesurrounding neighbourhood. The introduction of baghouses to recover particulates (fines)from the milk powder manufacturing process has been an industry initiative to address thisproblem and at the same time recover useful product. Following the introduction ofbaghouses, emissions of powder fines from the drier stacks have been completelyeliminated. The powder fines are collected and sold for animal feed (calf milk replacement).
A recent innovation to the industry has been clean-in-place baghouses. These have nowbeen installed at two new drier plants. The new baghouses can be cleaned regularly,allowing the fines collected to be reintegrated with the main product powder.
Case Study 5.3: Reducing and reusing waterThe number of dairy manufacturing sites in New Zealand has been decreasing, while at thesame time the quantity of milk processed on the remaining sites has been increasing. As aresult larger amounts of processing and cleaning water are required. A flow-on consequenceof high water use during the manufacturing process is high wastewater production.
Therefore, the large sites also produce large volumes of wastewater that require more landfor irrigation treatment, or larger treatment plants if adverse effects on receiving waters areto be avoided. Hence the industry has focused on minimising the volume of water used inthe manufacturing process and reusing water where possible.
Systems to recover and reuse the water used to rinse the manufacturing plants afterchemical cleaning have been installed at many sites and cooling water is now routinelyreused in a closed circuit with cooling towers used to remove excess heat from the water.
Milk consists of approximately 80% water, much of which is removed during themanufacture of milk powders and whey products. The Whareroa processing site hasinstalled a plant to recover and treat milk condensate from the site’s powder plants. Thetreated condensate is used primarily as a demineralised water source for the cleaning ofmembrane plants. Reverse osmosis polishing plants have been installed at the Stirling andthe Lichfield cheese and whey protein concentrate factories to treat permeate from the wheyproduct plants to a standard suitable for cleaning the membrane plants. In all of these casesthe recovered water is replacing water that would otherwise be drawn from a local watersource and would then require treatment in a demineralisation plant to remove the mineralspresent in the water.
As a result of these measures water use within the industry has reduced from 2.8 m3 ofwater per m3 of milk processed in the 1970s to about 1.2 m3/m3 milk at present. With watertreatment costs of $0.18/m3 and wastewater treatment costs of $0.37/m3, savings of $10million per year at current production levels across the industry have been realised.
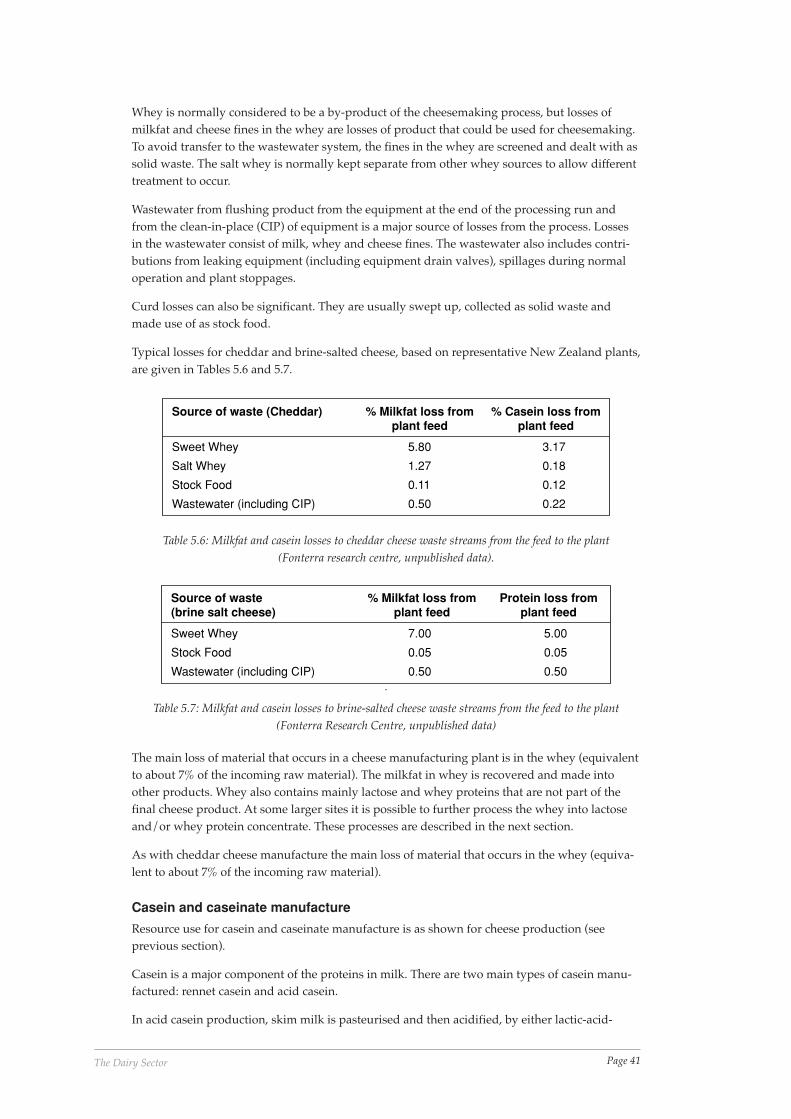
Page 41The Dairy Sector
Whey is normally considered to be a by-product of the cheesemaking process, but losses ofmilkfat and cheese fines in the whey are losses of product that could be used for cheesemaking.To avoid transfer to the wastewater system, the fines in the whey are screened and dealt with assolid waste. The salt whey is normally kept separate from other whey sources to allow differenttreatment to occur.
Wastewater from flushing product from the equipment at the end of the processing run andfrom the clean-in-place (CIP) of equipment is a major source of losses from the process. Lossesin the wastewater consist of milk, whey and cheese fines. The wastewater also includes contri-butions from leaking equipment (including equipment drain valves), spillages during normaloperation and plant stoppages.
Curd losses can also be significant. They are usually swept up, collected as solid waste andmade use of as stock food.
Typical losses for cheddar and brine-salted cheese, based on representative New Zealand plants,are given in Tables 5.6 and 5.7.
Source of waste (Cheddar) % Milkfat loss fromplant feed
% Casein loss fromplant feed
Sweet Whey 5.80 3.17
Salt Whey 1.27 0.18
Stock Food 0.11 0.12
Wastewater (including CIP) 0.50 0.22
Table 5.6: Milkfat and casein losses to cheddar cheese waste streams from the feed to the plant(Fonterra research centre, unpublished data).
Source of waste(brine salt cheese)
% Milkfat loss fromplant feed
Protein loss fromplant feed
Sweet Whey 7.00 5.00
Stock Food 0.05 0.05
Wastewater (including CIP) 0.50 0.50
Table 5.7: Milkfat and casein losses to brine-salted cheese waste streams from the feed to the plant(Fonterra Research Centre, unpublished data)
The main loss of material that occurs in a cheese manufacturing plant is in the whey (equivalentto about 7% of the incoming raw material). The milkfat in whey is recovered and made intoother products. Whey also contains mainly lactose and whey proteins that are not part of thefinal cheese product. At some larger sites it is possible to further process the whey into lactoseand/or whey protein concentrate. These processes are described in the next section.
As with cheddar cheese manufacture the main loss of material that occurs in the whey (equiva-lent to about 7% of the incoming raw material).
Casein and caseinate manufacture
Resource use for casein and caseinate manufacture is as shown for cheese production (seeprevious section).
Casein is a major component of the proteins in milk. There are two main types of casein manu-factured: rennet casein and acid casein.
In acid casein production, skim milk is pasteurised and then acidified, by either lactic-acid-
.
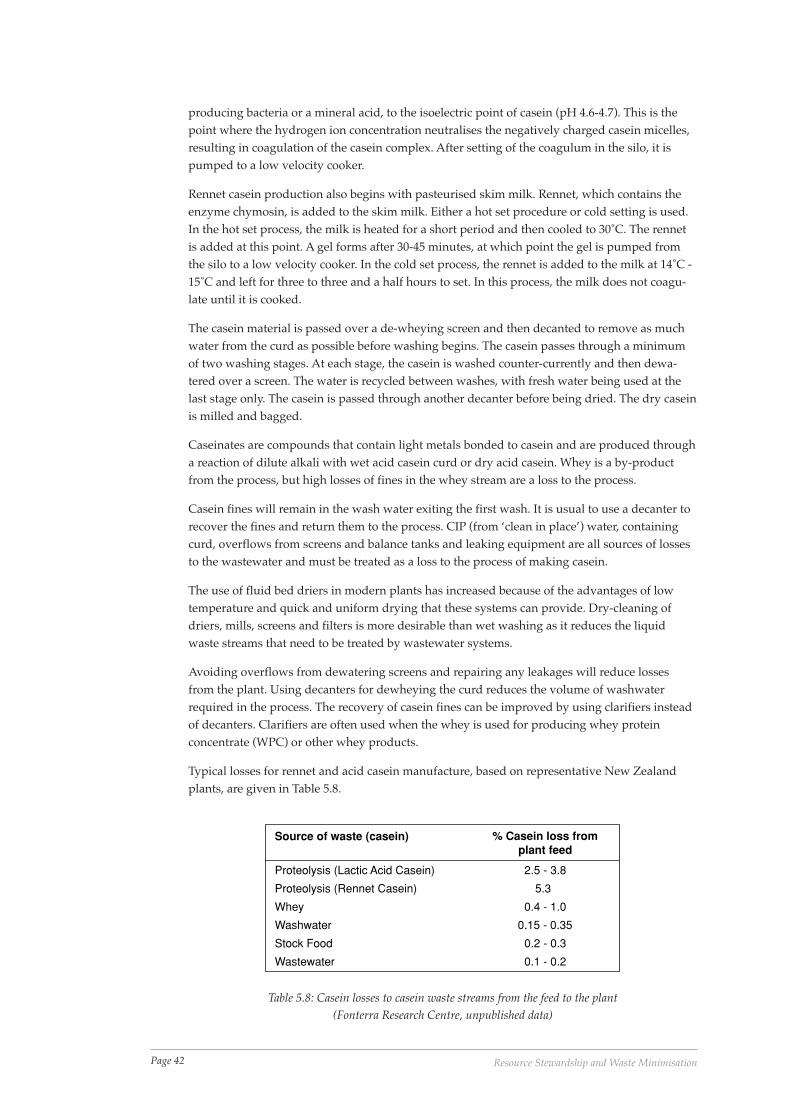
Page 42 Resource Stewardship and Waste Minimisation
producing bacteria or a mineral acid, to the isoelectric point of casein (pH 4.6-4.7). This is thepoint where the hydrogen ion concentration neutralises the negatively charged casein micelles,resulting in coagulation of the casein complex. After setting of the coagulum in the silo, it ispumped to a low velocity cooker.
Rennet casein production also begins with pasteurised skim milk. Rennet, which contains theenzyme chymosin, is added to the skim milk. Either a hot set procedure or cold setting is used.In the hot set process, the milk is heated for a short period and then cooled to 30˚C. The rennetis added at this point. A gel forms after 30-45 minutes, at which point the gel is pumped fromthe silo to a low velocity cooker. In the cold set process, the rennet is added to the milk at 14˚C -15˚C and left for three to three and a half hours to set. In this process, the milk does not coagu-late until it is cooked.
The casein material is passed over a de-wheying screen and then decanted to remove as muchwater from the curd as possible before washing begins. The casein passes through a minimumof two washing stages. At each stage, the casein is washed counter-currently and then dewa-tered over a screen. The water is recycled between washes, with fresh water being used at thelast stage only. The casein is passed through another decanter before being dried. The dry caseinis milled and bagged.
Caseinates are compounds that contain light metals bonded to casein and are produced througha reaction of dilute alkali with wet acid casein curd or dry acid casein. Whey is a by-productfrom the process, but high losses of fines in the whey stream are a loss to the process.
Casein fines will remain in the wash water exiting the first wash. It is usual to use a decanter torecover the fines and return them to the process. CIP (from ‘clean in place’) water, containingcurd, overflows from screens and balance tanks and leaking equipment are all sources of lossesto the wastewater and must be treated as a loss to the process of making casein.
The use of fluid bed driers in modern plants has increased because of the advantages of lowtemperature and quick and uniform drying that these systems can provide. Dry-cleaning ofdriers, mills, screens and filters is more desirable than wet washing as it reduces the liquidwaste streams that need to be treated by wastewater systems.
Avoiding overflows from dewatering screens and repairing any leakages will reduce lossesfrom the plant. Using decanters for dewheying the curd reduces the volume of washwaterrequired in the process. The recovery of casein fines can be improved by using clarifiers insteadof decanters. Clarifiers are often used when the whey is used for producing whey proteinconcentrate (WPC) or other whey products.
Typical losses for rennet and acid casein manufacture, based on representative New Zealandplants, are given in Table 5.8.
Source of waste (casein) % Casein loss fromplant feed
Proteolysis (Lactic Acid Casein) 2.5 - 3.8
Proteolysis (Rennet Casein) 5.3
Whey 0.4 - 1.0
Washwater 0.15 - 0.35
Stock Food 0.2 - 0.3
Wastewater 0.1 - 0.2
Table 5.8: Casein losses to casein waste streams from the feed to the plant(Fonterra Research Centre, unpublished data)
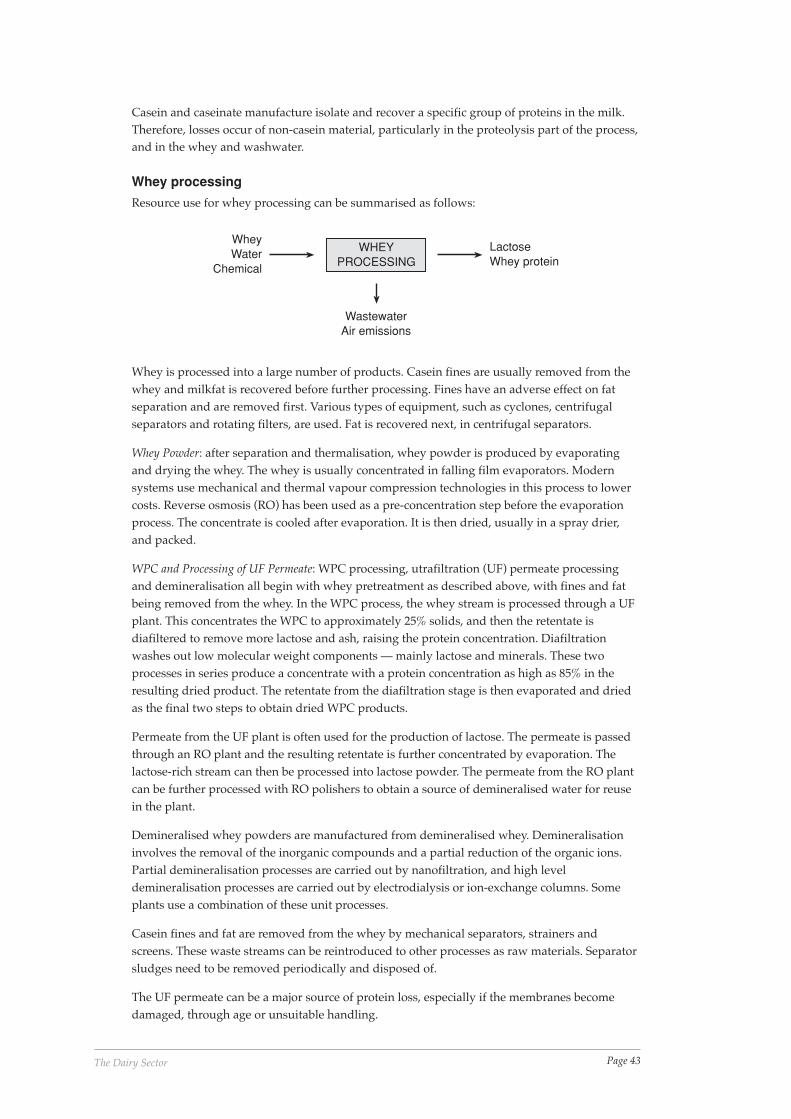
Page 43The Dairy Sector
Casein and caseinate manufacture isolate and recover a specific group of proteins in the milk.Therefore, losses occur of non-casein material, particularly in the proteolysis part of the process,and in the whey and washwater.
Whey processing
Resource use for whey processing can be summarised as follows:
WastewaterAir emissions
WHEYPROCESSING
WheyWater
Chemical
LactoseWhey protein
Whey is processed into a large number of products. Casein fines are usually removed from thewhey and milkfat is recovered before further processing. Fines have an adverse effect on fatseparation and are removed first. Various types of equipment, such as cyclones, centrifugalseparators and rotating filters, are used. Fat is recovered next, in centrifugal separators.
Whey Powder: after separation and thermalisation, whey powder is produced by evaporatingand drying the whey. The whey is usually concentrated in falling film evaporators. Modernsystems use mechanical and thermal vapour compression technologies in this process to lowercosts. Reverse osmosis (RO) has been used as a pre-concentration step before the evaporationprocess. The concentrate is cooled after evaporation. It is then dried, usually in a spray drier,and packed.
WPC and Processing of UF Permeate: WPC processing, utrafiltration (UF) permeate processingand demineralisation all begin with whey pretreatment as described above, with fines and fatbeing removed from the whey. In the WPC process, the whey stream is processed through a UFplant. This concentrates the WPC to approximately 25% solids, and then the retentate isdiafiltered to remove more lactose and ash, raising the protein concentration. Diafiltrationwashes out low molecular weight components — mainly lactose and minerals. These twoprocesses in series produce a concentrate with a protein concentration as high as 85% in theresulting dried product. The retentate from the diafiltration stage is then evaporated and driedas the final two steps to obtain dried WPC products.
Permeate from the UF plant is often used for the production of lactose. The permeate is passedthrough an RO plant and the resulting retentate is further concentrated by evaporation. Thelactose-rich stream can then be processed into lactose powder. The permeate from the RO plantcan be further processed with RO polishers to obtain a source of demineralised water for reusein the plant.
Demineralised whey powders are manufactured from demineralised whey. Demineralisationinvolves the removal of the inorganic compounds and a partial reduction of the organic ions.Partial demineralisation processes are carried out by nanofiltration, and high leveldemineralisation processes are carried out by electrodialysis or ion-exchange columns. Someplants use a combination of these unit processes.
Casein fines and fat are removed from the whey by mechanical separators, strainers andscreens. These waste streams can be reintroduced to other processes as raw materials. Separatorsludges need to be removed periodically and disposed of.
The UF permeate can be a major source of protein loss, especially if the membranes becomedamaged, through age or unsuitable handling.
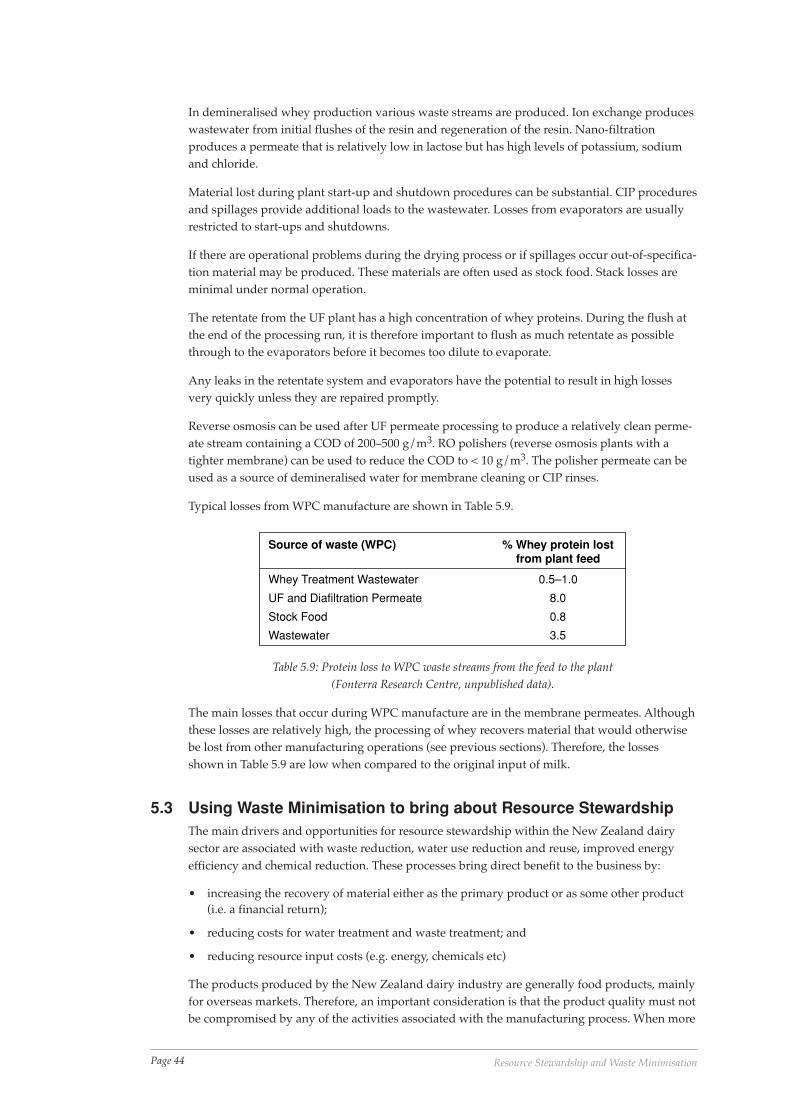
Page 44 Resource Stewardship and Waste Minimisation
In demineralised whey production various waste streams are produced. Ion exchange produceswastewater from initial flushes of the resin and regeneration of the resin. Nano-filtrationproduces a permeate that is relatively low in lactose but has high levels of potassium, sodiumand chloride.
Material lost during plant start-up and shutdown procedures can be substantial. CIP proceduresand spillages provide additional loads to the wastewater. Losses from evaporators are usuallyrestricted to start-ups and shutdowns.
If there are operational problems during the drying process or if spillages occur out-of-specifica-tion material may be produced. These materials are often used as stock food. Stack losses areminimal under normal operation.
The retentate from the UF plant has a high concentration of whey proteins. During the flush atthe end of the processing run, it is therefore important to flush as much retentate as possiblethrough to the evaporators before it becomes too dilute to evaporate.
Any leaks in the retentate system and evaporators have the potential to result in high lossesvery quickly unless they are repaired promptly.
Reverse osmosis can be used after UF permeate processing to produce a relatively clean perme-ate stream containing a COD of 200–500 g/m3. RO polishers (reverse osmosis plants with atighter membrane) can be used to reduce the COD to < 10 g/m3. The polisher permeate can beused as a source of demineralised water for membrane cleaning or CIP rinses.
Typical losses from WPC manufacture are shown in Table 5.9.
Source of waste (WPC) % Whey protein lostfrom plant feed
Whey Treatment Wastewater 0.5–1.0
UF and Diafiltration Permeate 8.0
Stock Food 0.8
Wastewater 3.5
Table 5.9: Protein loss to WPC waste streams from the feed to the plant(Fonterra Research Centre, unpublished data).
The main losses that occur during WPC manufacture are in the membrane permeates. Althoughthese losses are relatively high, the processing of whey recovers material that would otherwisebe lost from other manufacturing operations (see previous sections). Therefore, the lossesshown in Table 5.9 are low when compared to the original input of milk.
5.3 Using Waste Minimisation to bring about Resource StewardshipThe main drivers and opportunities for resource stewardship within the New Zealand dairysector are associated with waste reduction, water use reduction and reuse, improved energyefficiency and chemical reduction. These processes bring direct benefit to the business by:
• increasing the recovery of material either as the primary product or as some other product(i.e. a financial return);
• reducing costs for water treatment and waste treatment; and
• reducing resource input costs (e.g. energy, chemicals etc)
The products produced by the New Zealand dairy industry are generally food products, mainlyfor overseas markets. Therefore, an important consideration is that the product quality must notbe compromised by any of the activities associated with the manufacturing process. When more
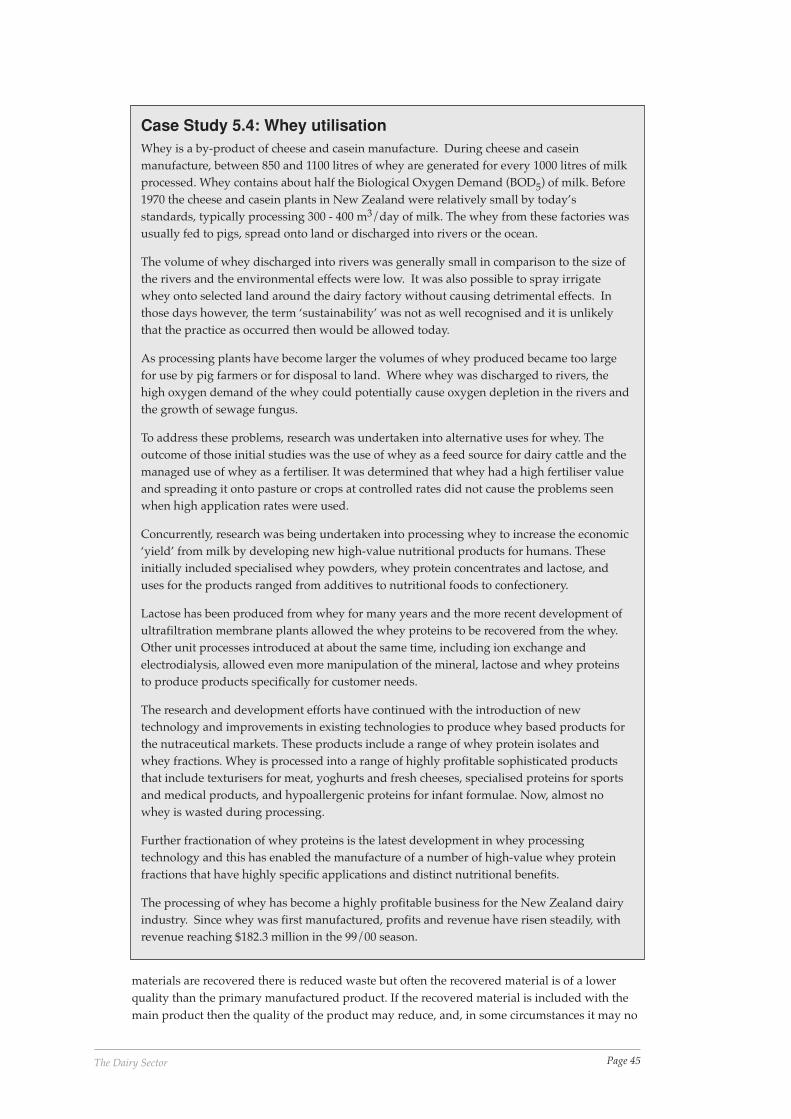
Page 45The Dairy Sector
Case Study 5.4: Whey utilisationWhey is a by-product of cheese and casein manufacture. During cheese and caseinmanufacture, between 850 and 1100 litres of whey are generated for every 1000 litres of milkprocessed. Whey contains about half the Biological Oxygen Demand (BOD5) of milk. Before1970 the cheese and casein plants in New Zealand were relatively small by today’sstandards, typically processing 300 - 400 m3/day of milk. The whey from these factories wasusually fed to pigs, spread onto land or discharged into rivers or the ocean.
The volume of whey discharged into rivers was generally small in comparison to the size ofthe rivers and the environmental effects were low. It was also possible to spray irrigatewhey onto selected land around the dairy factory without causing detrimental effects. Inthose days however, the term ‘sustainability’ was not as well recognised and it is unlikelythat the practice as occurred then would be allowed today.
As processing plants have become larger the volumes of whey produced became too largefor use by pig farmers or for disposal to land. Where whey was discharged to rivers, thehigh oxygen demand of the whey could potentially cause oxygen depletion in the rivers andthe growth of sewage fungus.
To address these problems, research was undertaken into alternative uses for whey. Theoutcome of those initial studies was the use of whey as a feed source for dairy cattle and themanaged use of whey as a fertiliser. It was determined that whey had a high fertiliser valueand spreading it onto pasture or crops at controlled rates did not cause the problems seenwhen high application rates were used.
Concurrently, research was being undertaken into processing whey to increase the economic‘yield’ from milk by developing new high-value nutritional products for humans. Theseinitially included specialised whey powders, whey protein concentrates and lactose, anduses for the products ranged from additives to nutritional foods to confectionery.
Lactose has been produced from whey for many years and the more recent development ofultrafiltration membrane plants allowed the whey proteins to be recovered from the whey.Other unit processes introduced at about the same time, including ion exchange andelectrodialysis, allowed even more manipulation of the mineral, lactose and whey proteinsto produce products specifically for customer needs.
The research and development efforts have continued with the introduction of newtechnology and improvements in existing technologies to produce whey based products forthe nutraceutical markets. These products include a range of whey protein isolates andwhey fractions. Whey is processed into a range of highly profitable sophisticated productsthat include texturisers for meat, yoghurts and fresh cheeses, specialised proteins for sportsand medical products, and hypoallergenic proteins for infant formulae. Now, almost nowhey is wasted during processing.
Further fractionation of whey proteins is the latest development in whey processingtechnology and this has enabled the manufacture of a number of high-value whey proteinfractions that have highly specific applications and distinct nutritional benefits.
The processing of whey has become a highly profitable business for the New Zealand dairyindustry. Since whey was first manufactured, profits and revenue have risen steadily, withrevenue reaching $182.3 million in the 99/00 season.
materials are recovered there is reduced waste but often the recovered material is of a lowerquality than the primary manufactured product. If the recovered material is included with themain product then the quality of the product may reduce, and, in some circumstances it may no
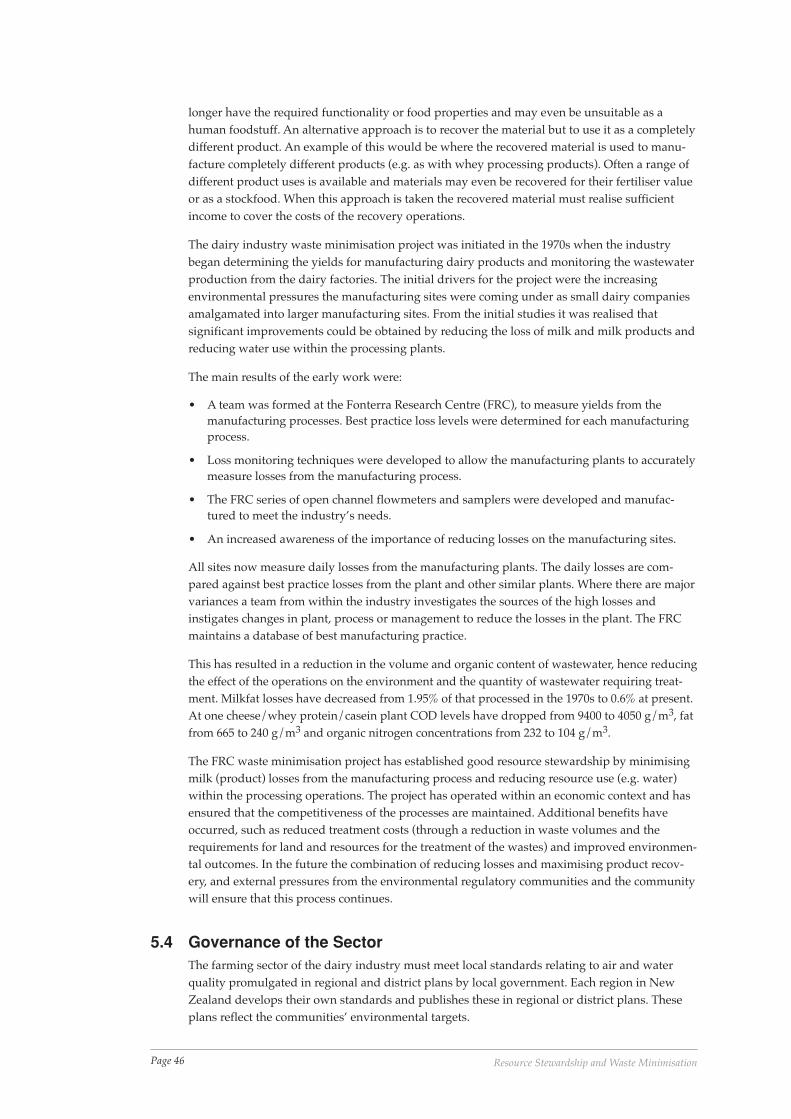
Page 46 Resource Stewardship and Waste Minimisation
longer have the required functionality or food properties and may even be unsuitable as ahuman foodstuff. An alternative approach is to recover the material but to use it as a completelydifferent product. An example of this would be where the recovered material is used to manu-facture completely different products (e.g. as with whey processing products). Often a range ofdifferent product uses is available and materials may even be recovered for their fertiliser valueor as a stockfood. When this approach is taken the recovered material must realise sufficientincome to cover the costs of the recovery operations.
The dairy industry waste minimisation project was initiated in the 1970s when the industrybegan determining the yields for manufacturing dairy products and monitoring the wastewaterproduction from the dairy factories. The initial drivers for the project were the increasingenvironmental pressures the manufacturing sites were coming under as small dairy companiesamalgamated into larger manufacturing sites. From the initial studies it was realised thatsignificant improvements could be obtained by reducing the loss of milk and milk products andreducing water use within the processing plants.
The main results of the early work were:
• A team was formed at the Fonterra Research Centre (FRC), to measure yields from themanufacturing processes. Best practice loss levels were determined for each manufacturingprocess.
• Loss monitoring techniques were developed to allow the manufacturing plants to accuratelymeasure losses from the manufacturing process.
• The FRC series of open channel flowmeters and samplers were developed and manufac-tured to meet the industry’s needs.
• An increased awareness of the importance of reducing losses on the manufacturing sites.
All sites now measure daily losses from the manufacturing plants. The daily losses are com-pared against best practice losses from the plant and other similar plants. Where there are majorvariances a team from within the industry investigates the sources of the high losses andinstigates changes in plant, process or management to reduce the losses in the plant. The FRCmaintains a database of best manufacturing practice.
This has resulted in a reduction in the volume and organic content of wastewater, hence reducingthe effect of the operations on the environment and the quantity of wastewater requiring treat-ment. Milkfat losses have decreased from 1.95% of that processed in the 1970s to 0.6% at present.At one cheese/whey protein/casein plant COD levels have dropped from 9400 to 4050 g/m3, fatfrom 665 to 240 g/m3 and organic nitrogen concentrations from 232 to 104 g/m3.
The FRC waste minimisation project has established good resource stewardship by minimisingmilk (product) losses from the manufacturing process and reducing resource use (e.g. water)within the processing operations. The project has operated within an economic context and hasensured that the competitiveness of the processes are maintained. Additional benefits haveoccurred, such as reduced treatment costs (through a reduction in waste volumes and therequirements for land and resources for the treatment of the wastes) and improved environmen-tal outcomes. In the future the combination of reducing losses and maximising product recov-ery, and external pressures from the environmental regulatory communities and the communitywill ensure that this process continues.
5.4 Governance of the SectorThe farming sector of the dairy industry must meet local standards relating to air and waterquality promulgated in regional and district plans by local government. Each region in NewZealand develops their own standards and publishes these in regional or district plans. Theseplans reflect the communities’ environmental targets.
Page 47The Dairy Sector
To meet these standards the industry has developed the Dairy Industry Environmental andAnimal Welfare Policies. These policies include issues relating to animal welfare (physical andhealth needs of animals, tail docking, inductions, bobby calf collection and casualty cattle) andthe environmental (residues, human wastes, wetlands, farm dairy effluent, water quality andfertiliser usage). Environmental issues identified in the guidelines are:
• Residues. Preventing stock access to contaminated site, ensuring that correct withholdingperiods are used for all animal remedies and treatments, and prohibiting the application ofindustrial wastes that contain toxic contaminants to dairy farms or pasture that will be usedon dairy farms.
• Human Waste. Prohibiting human waste application to dairy farms or to crops and pasturethat will be fed to dairy cows.
• Access to Wetlands: Preservation of all existing significant wetlands, and control of stockaccess to such wetlands to avoid destruction of native flora and fauna.
• Farm Dairy Effluent. The disposal of farm dairy effluent is to be undertaken in a manner thatdoes not present significant risks to human health or aquatic systems. The disposal of sucheffluent must meet the requirements of the Resource Management Act and regional plans.
• Water Quality. The industry’s goal is to maintain and enhance water quality in dairycatchments. Approaches to achieve this include preventing stock access to waterways andthe planting of stream banks (riparian management).
• Fertiliser Usage. The goal is to minimise nutrient losses to groundwater and rivers. Nutrientbudgeting is an approach to achieve this goal.
The processing sector is required to meet all national standards for food quality as well as anyadditional standards relating to individual overseas markets.
In the past, responsibility for meeting standards was largely up to individual processingcompanies, although the Fonterra Research Centre (formerly the New Zealand Dairy ResearchInstitute) took a lead role in developing methodologies and standards for the industry. Asamalgamations of the processing companies have occurred requirements for resource use andmanagement have become standardised and coordination of both effort and approach is nowpossible. Standards are being progressively implemented by the company shareholder organisa-tions with the assistance of technology transfer groups such as the Dexcel Consulting OfficerService.
The processing sector has also begun using ISO 14000 environmental management systems. ISO14000 allows the processing plants to achieve environmental performance to a recognisedinternational standard. This has benefits in assuring international customers that the productsthey are purchasing are manufactured with suitable regard to environmental issues. It isexpected that all the major New Zealand manufacturing plants will be accredited to the ISO14000 standard by 2005.
Of prime importance in implementing good resource stewardship is to have an effectiveawareness and education policy in place. This is more easily managed in the manufacturingpart of the sector where company and site training programmes can be implemented. In thefarming part of the dairy sector awareness programmes are more difficult to implement.Individual farmers are responsible for their own part of the business (the farm) and how theyachieve their business outcomes. The large number of individual farmers makes achieving acommon standard more difficult. Considerable effort is now going in to developing goodtechnology transfer/learning programmes for farmers and their farm workers.
5.5 Drivers for Change within the Sector
Page 48 Resource Stewardship and Waste Minimisation
The initial drivers for change within the dairy sector were related to external pressures, espe-cially from the regulatory authorities and the community and because the amalgamation ofsmall dairy processing plants had increased the environmental effects at fewer sites. Imposedon these drivers were the need to ensure that the dairy sector remained competitive. These samepressures still exist today but additional features have become important.
The main drivers for waste minimisation and good resource management within the dairyindustry today are:
• The clean-green marketing strategy. In various markets elements of New Zealand being cleanand green is used to some degree. Ensuring that operations within New Zealand supportthese images is an important driver for good waste management practices being imple-mented. The long-term benefit is that New Zealand can remain in these markets and use theclean green image effectively.
• Regulatory requirements. The main environmental legislation in New Zealand is the ResourceManagement Act. This impacts directly on both the farming and manufacturing sector toensure that emissions to air and water are minimised.
• Community expectations. The community requirements for environmental well-being arerelated to the regional council requirements through the resource consent procedures.Community expectations are often complex involving aspects of resource protection, wasteminimisation, environmental protection and economic well being.
• Customer requirements. Customers are exerting pressures on the New Zealand dairy industryby inspecting farms and processing plants and ensuring that appropriate standards are metthroughout the production chain. These pressures have concentrated mainly on the foodsafety area, but increasingly environmental issues are being considered.
Of paramount importance both to the dairy industry and to New Zealand as a whole is that theindustry remains competitive. The dairy industry took a lead in this area by implementing thewaste minimisation project. This area is still seen as important today and is effective because itattributes a cost to poor resource or environmental performance.
5.6 Conclusions and RecommendationsThe New Zealand dairy industry has been a leader in resource stewardship in New Zealand.Each manufacturing plant undertakes routine loss monitoring and has processes in place toensure that losses are minimised and non-conformances are dealt with effectively. Work iscontinuing in this area at both a research and implementation level through the investigation ofnew and improved systems for minimising water and chemical usage in the plants.
As new technologies become available they are evaluated to ensure that they meet the requiredenvironmental or resource minimisation requirements and also that they do not adversely affecteither the manufacturing process or the final product.
More recently the farming sector has come under increased pressure to minimise effects on theenvironment. To achieve improved environmental performance in the farming sector theindustry has developed a series of policies and guidelines. Although the final outcome of thesepolicies is to ensure that environmental and product quality standards are met the result isimproved management of the resources that go into the farming sector. One of the main areas isin improved fertiliser management.
The New Zealand dairy industry is in a position where it can utilise the existing and newstructures that are being developed to improve resource management within the sector. Ap-proximately 95% of the milk produced in New Zealand is supplied to a single company —Fonterra Co-operative Group. This structure allows a coordinated approach to be taken toresource stewardship. Common goals can be set with national coordination of loss monitoring

Page 49The Dairy Sector
and reduction methodologies.
5.7 ReferencesAnon, 2000. New Zealand Official Yearbook 2000, 102nd edition, Statistics New Zealand,
Wellington.
Fonterra Cooperative Group, 2002. Fonterra Facts and Figures, http://fonterra.com/facts, 29April 2002.
MAF, 2002a. Dairy, http://www.maf.govt.nz/MAFnet/sectors/dairy, 24 October 2002.
MAF, 2002b. Dairy Cattle by Herd size Groups and regional Council - New Zealand Agriculture, http://www.maf.govt.nz/statistics/primaryindustries//livestock/dairy, 24 October 2002.
McLaren, R G and Cameron, K C, 1990. Soil Science: an Introduction to the Properties and manage-ment of New Zealand Soils, Oxford University Press, Melbourne.
New Zealand Dairy Board, 2000. Dairy Facts and Figures 1999/2000, New Zealand Dairy Board,Wellington, New Zealand.

Page 50 Resource Stewardship and Waste Minimisation
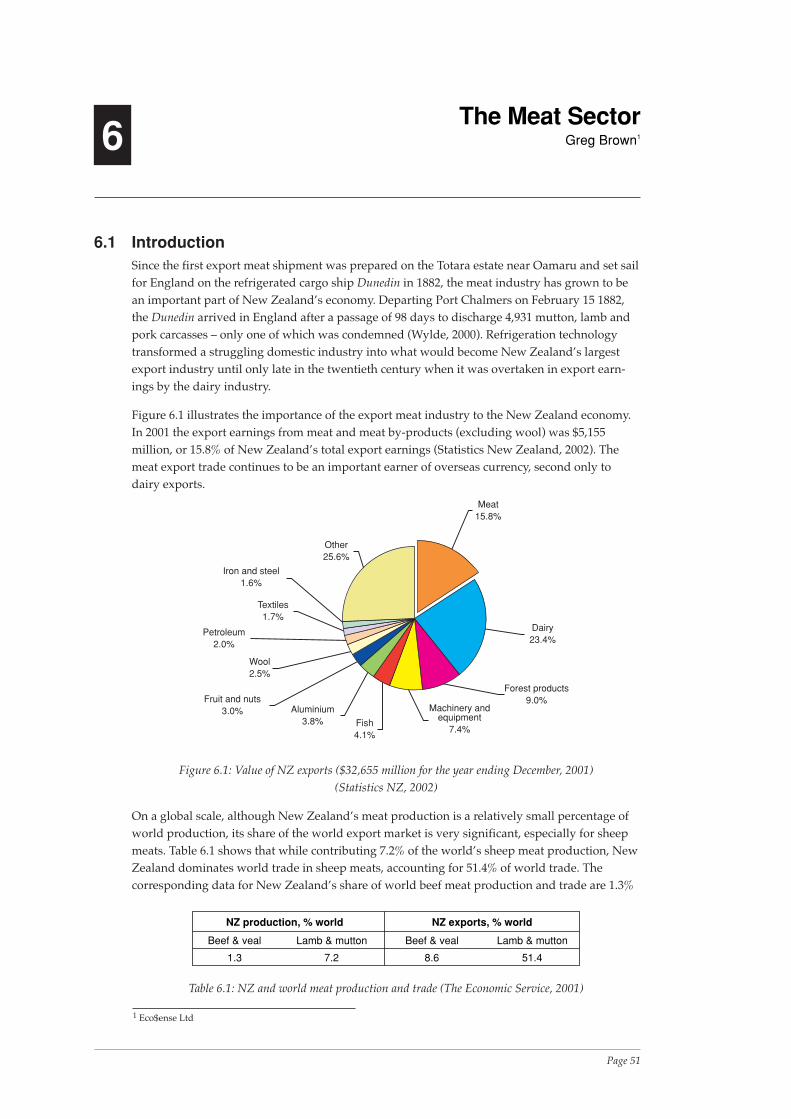
Page 51The Meat Sector
6The Meat Sector
Greg Brown1
6.1 IntroductionSince the first export meat shipment was prepared on the Totara estate near Oamaru and set sailfor England on the refrigerated cargo ship Dunedin in 1882, the meat industry has grown to bean important part of New Zealand’s economy. Departing Port Chalmers on February 15 1882,the Dunedin arrived in England after a passage of 98 days to discharge 4,931 mutton, lamb andpork carcasses – only one of which was condemned (Wylde, 2000). Refrigeration technologytransformed a struggling domestic industry into what would become New Zealand’s largestexport industry until only late in the twentieth century when it was overtaken in export earn-ings by the dairy industry.
Figure 6.1 illustrates the importance of the export meat industry to the New Zealand economy.In 2001 the export earnings from meat and meat by-products (excluding wool) was $5,155million, or 15.8% of New Zealand’s total export earnings (Statistics New Zealand, 2002). Themeat export trade continues to be an important earner of overseas currency, second only todairy exports.
Meat15.8%
Dairy23.4%
Forest products9.0%
Machinery andequipment
7.4%Fish4.1%
Aluminium3.8%
Fruit and nuts3.0%
Wool2.5%
Petroleum2.0%
Textiles1.7%
Iron and steel1.6%
Other25.6%
Figure 6.1: Value of NZ exports ($32,655 million for the year ending December, 2001)(Statistics NZ, 2002)
On a global scale, although New Zealand’s meat production is a relatively small percentage ofworld production, its share of the world export market is very significant, especially for sheepmeats. Table 6.1 shows that while contributing 7.2% of the world’s sheep meat production, NewZealand dominates world trade in sheep meats, accounting for 51.4% of world trade. Thecorresponding data for New Zealand’s share of world beef meat production and trade are 1.3%
NZ production, % world NZ exports, % world
Beef & veal Lamb & mutton Beef & veal Lamb & mutton
1.3 7.2 8.6 51.4
Table 6.1: NZ and world meat production and trade (The Economic Service, 2001)
1 Eco$ense Ltd
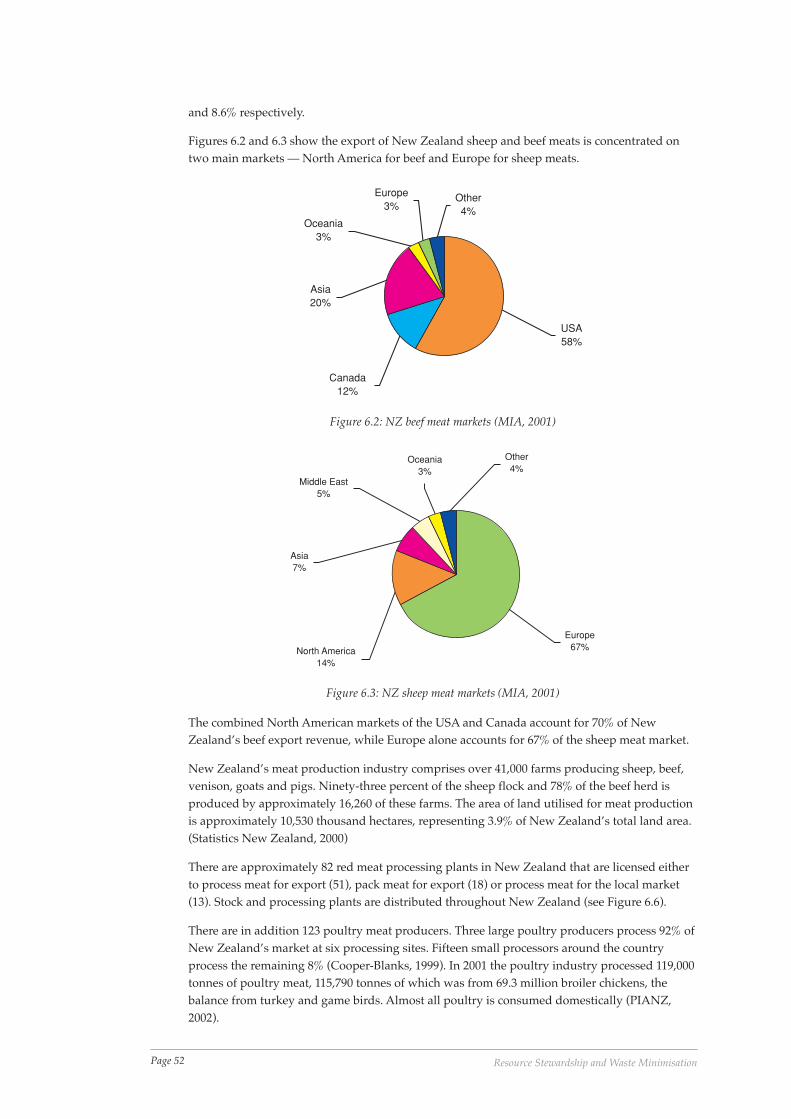
Page 52 Resource Stewardship and Waste Minimisation
and 8.6% respectively.
Figures 6.2 and 6.3 show the export of New Zealand sheep and beef meats is concentrated ontwo main markets — North America for beef and Europe for sheep meats.
Europe3%
Other4%
Oceania3%
Asia20%
Canada12%
USA58%
Figure 6.2: NZ beef meat markets (MIA, 2001)
Other4%
Europe67%North America
14%
Asia7%
Middle East5%
Oceania3%
Figure 6.3: NZ sheep meat markets (MIA, 2001)
The combined North American markets of the USA and Canada account for 70% of NewZealand’s beef export revenue, while Europe alone accounts for 67% of the sheep meat market.
New Zealand’s meat production industry comprises over 41,000 farms producing sheep, beef,venison, goats and pigs. Ninety-three percent of the sheep flock and 78% of the beef herd isproduced by approximately 16,260 of these farms. The area of land utilised for meat productionis approximately 10,530 thousand hectares, representing 3.9% of New Zealand’s total land area.(Statistics New Zealand, 2000)
There are approximately 82 red meat processing plants in New Zealand that are licensed eitherto process meat for export (51), pack meat for export (18) or process meat for the local market(13). Stock and processing plants are distributed throughout New Zealand (see Figure 6.6).
There are in addition 123 poultry meat producers. Three large poultry producers process 92% ofNew Zealand’s market at six processing sites. Fifteen small processors around the countryprocess the remaining 8% (Cooper-Blanks, 1999). In 2001 the poultry industry processed 119,000tonnes of poultry meat, 115,790 tonnes of which was from 69.3 million broiler chickens, thebalance from turkey and game birds. Almost all poultry is consumed domestically (PIANZ,2002).

Page 53The Meat Sector
The production of the major meat species is summarised in Figure 6.4.
The production of all meats (excluding deer and goat) illustrated in Figure 6.4 totalled 1,315,000tonnes (bone-in basis) in 2001, of which sheep and beef meats comprised 87.6%.
Poultry9%
Beef44%
Bobby veal1%
Mutton9%
Lamb33%
Pigmeats4%
Figure 6.4: NZ meat production data (excluding deer and goat) by weight, bone-in(The Economic Service, 2001)
New Zealand exports around 80% of the beef kill and 90% of the sheep kill. In 2001 the red meatindustry slaughtered 26.3 million lambs, 5.44 million sheep, 2.21 million cattle, 148,000 goatsand 474,000 deer (The Economic Service, 2001).
Figure 6.5 shows an overall decline in the total kill since 1980. However, what is notable is thatalthough sheep stock numbers have dropped by 22% over the last decade, lamb meat produc-tion has increased over that period by 14% as a result of significantly improved lambingpercentages, up from 100% in 1990 to 116% in 2001.
45000
40000
35000
30000
25000
20000
15000
10000
5000
0
1980 1990 2001Year
Liv
esto
ck S
lau
gh
ter
(’00
0 h
ead
)
Lamb Sheep Cattle Deer
Figure 6.5: NZ livestock slaughtering (The Economic Service, 2001)
New Zealand’s ability to compete on the world market is in large part due to the use of pastoralfarming. While in itself having an effect on land-use, there is increasing competition from dairyconversions of sheep and beef farms and an increase in forestry on formerly pastoral land.
Land use competition has had an impact on the meat sector. Over the eight year period to 2001,1692 dairy conversions displaced 4 million beef and sheep stock units. Over a similar timeframe, 340,000 hectares of farmland was converted to forestry, reducing pastoral area by 2.5%and displacing 1.5 million sheep and beef (The Economic Service, 2002). There is also increasingcompetition for agricultural land from the development of lifestyle blocks (MacKay, A., Pers.comm.).
Page 54 Resource Stewardship and Waste Minimisation
The 16,260 commercial farms that account for 93% of the sheep and 78% of the beef productionrespectively provide paid employment for an estimated 24,400 people (including the owner).The remaining smallholdings (approximately 24,000) provide further employment opportuni-ties.
Table 6.2 shows that the meat processing and associated by-product industries also providesignificant employment.
Processing activity Employment
Sheep and beef farming
Meat processing
34,000
20,430
Poultry 1,840
Leather 1,820
Fellmongery 460
Oil and fat production 310
Shearing, top dressing and contract services 18,000
Total 78,860
Table 6.2: Employment in the meat and associated by-product industries (Stats. NZ, 2001)
In total, approximately 5% of the New Zealand (full time equivalent) work force are employedby the meat and associated industries. Including other support services such as farm supplies,transport and finance increases the level of employment to over 6%.
Figure 6.6 shows the geographic spread of farms and livestock production around New Zealandby regional council, as well as the main meat processing facilities.
6.2 Resource Use and Waste Minimisation within the SectorResources are used within the meat industry across three primary areas of activity — farming,transport and processing.
The main quantifiable inputs into the farming sector are land, energy and fertiliser, although thefarming sector is heavily dependent on the natural resources of water and solar radiation. Allbut solar radiation is manageable to some extent by the farmer.
Fertiliser consumption is often quoted as an indicator of the economic well-being of the farmingsector. On that basis, the latest figures available indicate that farming is in good heart, purchas-ing the highest recorded input of fertiliser since the early 1970s. In 2001 the beef and cattlefarming sector purchased 2,899,800 tonnes of fertiliser, of which an estimated 65% is manufac-tured superphosphate, or fertilisers containing superphosphate. (The farm-input figuresexclude the energy used for fertiliser manufacture). (The Economic Service, 2001).
Figure 6.7 shows the major inputs and outputs from the meat sector from farm productionthrough to the processing plant.
The primary resource inputs into meat processing are stock, energy (principally electricity, gasand coal), water, packaging and labour. In terms of energy, the meat processing demand iscomparable to the combined farm energy and livestock transport energy demand.
National on-farm electricity and fuel consumption figures have been estimated from MAFmodel farm data (MAF, 2001), which provides stock unit based costs for farm expenses. Thereappears to be an opportunity to improve the data collection in the agricultural sector, poten-tially expanding the scope of data presented in the context of the national farm model. Trans-port related fuel consumption data has been calculated from data estimated by a transport

Page 55The Meat Sector
Type Farms StockBeef/sheep 990 615,321 (81%)Pigs/goats/deer 100 91,060
Bay of Plenty
Type Farms StockBeef/sheep 3080 1,127,165 (52%)Pigs/goats/deer 74 50,310
Northland
Type Farms StockBeef/sheep 1270 1,888,680 (85%)Pigs/goats/deer 30 31,207
Gisborne
Type Farms StockBeef/sheep 3410 657,509 (73%)Pigs/goats/deer 80 58,149
Auckland
Type Farms StockBeef/sheep 4060 3,545,080 (81%)Pigs/goats/deer 200 253,188
Waikato
Type Farms StockBeef/sheep 1150 939,785 (87%)Pigs/goats/deer 48 46,400
Taranaki
Type Farms StockBeef/sheep 694 505,843 (88%)Pigs/goats/deer 92 43,248
Tasman
Type Farms StockBeef/sheep 180 156,201 (66%)Pigs/goats/deer 33 36,650
West Coast
Type Farms StockBeef/sheep 2900 5.043.566 (89%)Pigs/goats/deer 78 115,317
Hawkes Bay
Type Farms StockBeef/sheep 3690 7,707,458 (90%)Pigs/goats/deer 77 191,153
Manawatu/Wanganui
Type Farms StockBeef/sheep 2280 6,967,927 (97%)Pigs/goats/deer 306 403,129
Southland
Type Farms StockBeef/sheep 2640 7,861,471 (96%)Pigs/goats/deer 159 188,828
Otago
Type Farms StockBeef/sheep 4750 9,733,301 (95%)Pigs/goats/deer 560 621,245
Canterbury
Type Farms StockBeef/sheep 440 1,028,995 (92%)Pigs/goats/deer 41 40,843
Marlborough
Type Farms StockBeef/sheep 1200 2,452,593 (93%)Pigs/goats/deer 69 46,129
Wellington
Export meat processing,packhouse or abbatoir
Poultry processing (6 main plants only)
Note: Percentage sheep (xx%)
Figure 6.6: Distribution of livestock, farms and processing plants(MAF, 2001; Meat NZ, 2001)
operator and is indicative only.
Processing energy data has been derived from available meat industry survey data (EECA,1996) extrapolated to the present day using a suitable improvement factor (Lovatt, Pers. comm.,2002). Water and wastewater data has been estimated primarily from limited research data andis indicative only.
The following sections trace the flow of stock from the farm to the processing plant and discussthe level of resource stewardship evident within four key areas:
• land use;
• stock management;
• transport; and
• meat processing.
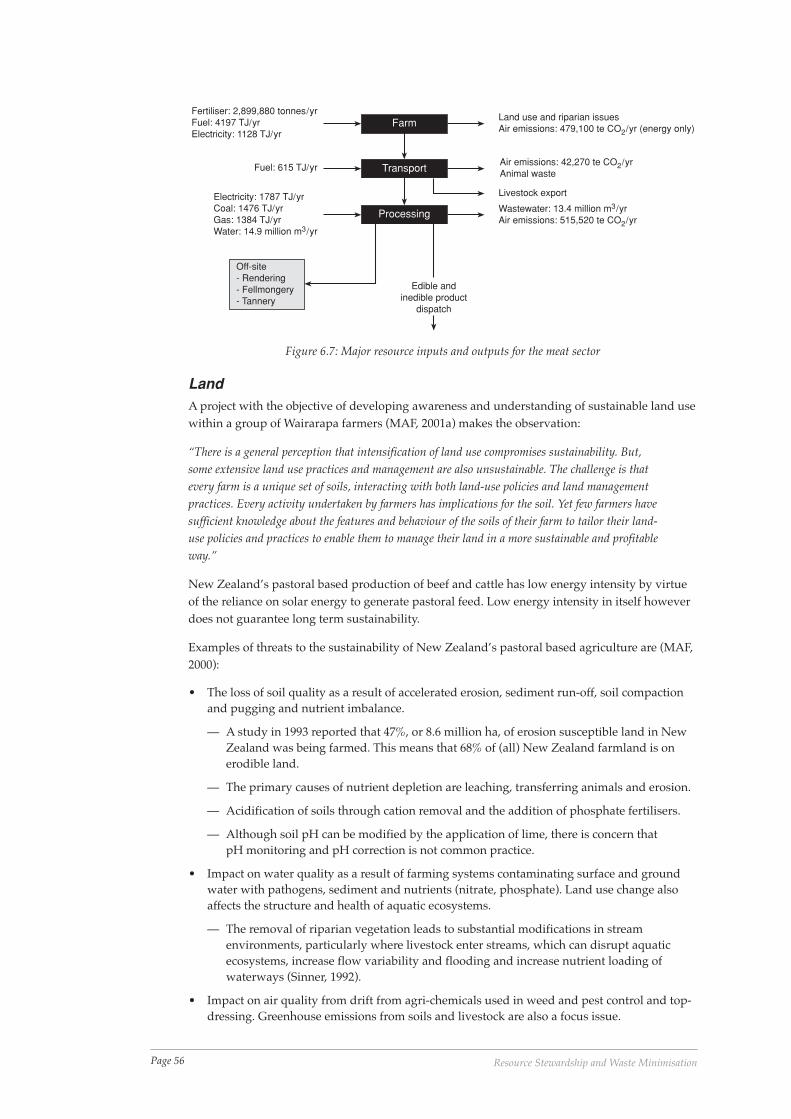
Page 56 Resource Stewardship and Waste Minimisation
LandA project with the objective of developing awareness and understanding of sustainable land usewithin a group of Wairarapa farmers (MAF, 2001a) makes the observation:
“There is a general perception that intensification of land use compromises sustainability. But,some extensive land use practices and management are also unsustainable. The challenge is thatevery farm is a unique set of soils, interacting with both land-use policies and land managementpractices. Every activity undertaken by farmers has implications for the soil. Yet few farmers havesufficient knowledge about the features and behaviour of the soils of their farm to tailor their land-use policies and practices to enable them to manage their land in a more sustainable and profitableway.”
New Zealand’s pastoral based production of beef and cattle has low energy intensity by virtueof the reliance on solar energy to generate pastoral feed. Low energy intensity in itself howeverdoes not guarantee long term sustainability.
Examples of threats to the sustainability of New Zealand’s pastoral based agriculture are (MAF,2000):
• The loss of soil quality as a result of accelerated erosion, sediment run-off, soil compactionand pugging and nutrient imbalance.
— A study in 1993 reported that 47%, or 8.6 million ha, of erosion susceptible land in NewZealand was being farmed. This means that 68% of (all) New Zealand farmland is onerodible land.
— The primary causes of nutrient depletion are leaching, transferring animals and erosion.
— Acidification of soils through cation removal and the addition of phosphate fertilisers.
— Although soil pH can be modified by the application of lime, there is concern thatpH monitoring and pH correction is not common practice.
• Impact on water quality as a result of farming systems contaminating surface and groundwater with pathogens, sediment and nutrients (nitrate, phosphate). Land use change alsoaffects the structure and health of aquatic ecosystems.
— The removal of riparian vegetation leads to substantial modifications in streamenvironments, particularly where livestock enter streams, which can disrupt aquaticecosystems, increase flow variability and flooding and increase nutrient loading ofwaterways (Sinner, 1992).
• Impact on air quality from drift from agri-chemicals used in weed and pest control and top-dressing. Greenhouse emissions from soils and livestock are also a focus issue.
Farm
Transport
Processing
Land use and riparian issuesAir emissions: 479,100 te CO2/yr (energy only)
Air emissions: 42,270 te CO2/yrAnimal waste
Livestock export
Wastewater: 13.4 million m3/yrAir emissions: 515,520 te CO2/yr
Edible andinedible product
dispatch
Fertiliser: 2,899,880 tonnes/yrFuel: 4197 TJ/yrElectricity: 1128 TJ/yr
Fuel: 615 TJ/yr
Electricity: 1787 TJ/yrCoal: 1476 TJ/yrGas: 1384 TJ/yrWater: 14.9 million m3/yr
Off-site- Rendering- Fellmongery- Tannery
Figure 6.7: Major resource inputs and outputs for the meat sector
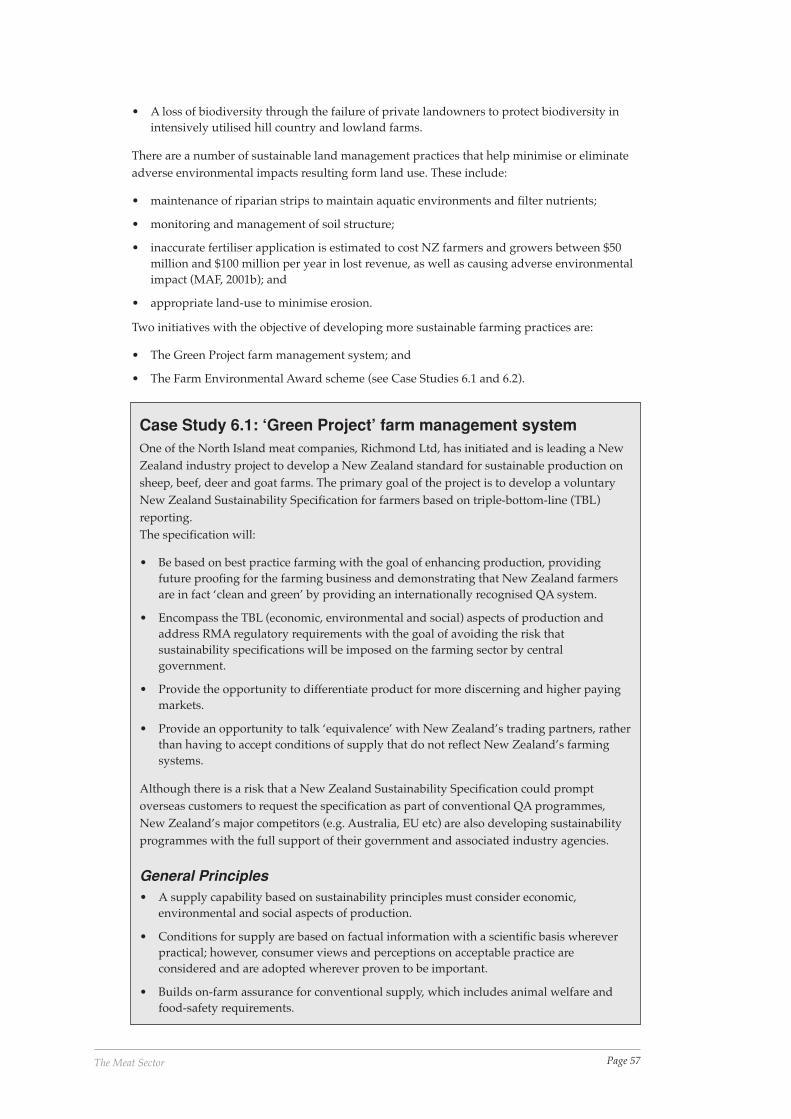
Page 57The Meat Sector
• A loss of biodiversity through the failure of private landowners to protect biodiversity inintensively utilised hill country and lowland farms.
There are a number of sustainable land management practices that help minimise or eliminateadverse environmental impacts resulting form land use. These include:
• maintenance of riparian strips to maintain aquatic environments and filter nutrients;
• monitoring and management of soil structure;
• inaccurate fertiliser application is estimated to cost NZ farmers and growers between $50million and $100 million per year in lost revenue, as well as causing adverse environmentalimpact (MAF, 2001b); and
• appropriate land-use to minimise erosion.
Two initiatives with the objective of developing more sustainable farming practices are:
• The Green Project farm management system; and
• The Farm Environmental Award scheme (see Case Studies 6.1 and 6.2).
Case Study 6.1: ‘Green Project’ farm management systemOne of the North Island meat companies, Richmond Ltd, has initiated and is leading a NewZealand industry project to develop a New Zealand standard for sustainable production onsheep, beef, deer and goat farms. The primary goal of the project is to develop a voluntaryNew Zealand Sustainability Specification for farmers based on triple-bottom-line (TBL)reporting.The specification will:
• Be based on best practice farming with the goal of enhancing production, providingfuture proofing for the farming business and demonstrating that New Zealand farmersare in fact ‘clean and green’ by providing an internationally recognised QA system.
• Encompass the TBL (economic, environmental and social) aspects of production andaddress RMA regulatory requirements with the goal of avoiding the risk thatsustainability specifications will be imposed on the farming sector by centralgovernment.
• Provide the opportunity to differentiate product for more discerning and higher payingmarkets.
• Provide an opportunity to talk ‘equivalence’ with New Zealand’s trading partners, ratherthan having to accept conditions of supply that do not reflect New Zealand’s farmingsystems.
Although there is a risk that a New Zealand Sustainability Specification could promptoverseas customers to request the specification as part of conventional QA programmes,New Zealand’s major competitors (e.g. Australia, EU etc) are also developing sustainabilityprogrammes with the full support of their government and associated industry agencies.
General Principles• A supply capability based on sustainability principles must consider economic,
environmental and social aspects of production.
• Conditions for supply are based on factual information with a scientific basis whereverpractical; however, consumer views and perceptions on acceptable practice areconsidered and are adopted wherever proven to be important.
• Builds on-farm assurance for conventional supply, which includes animal welfare andfood-safety requirements.
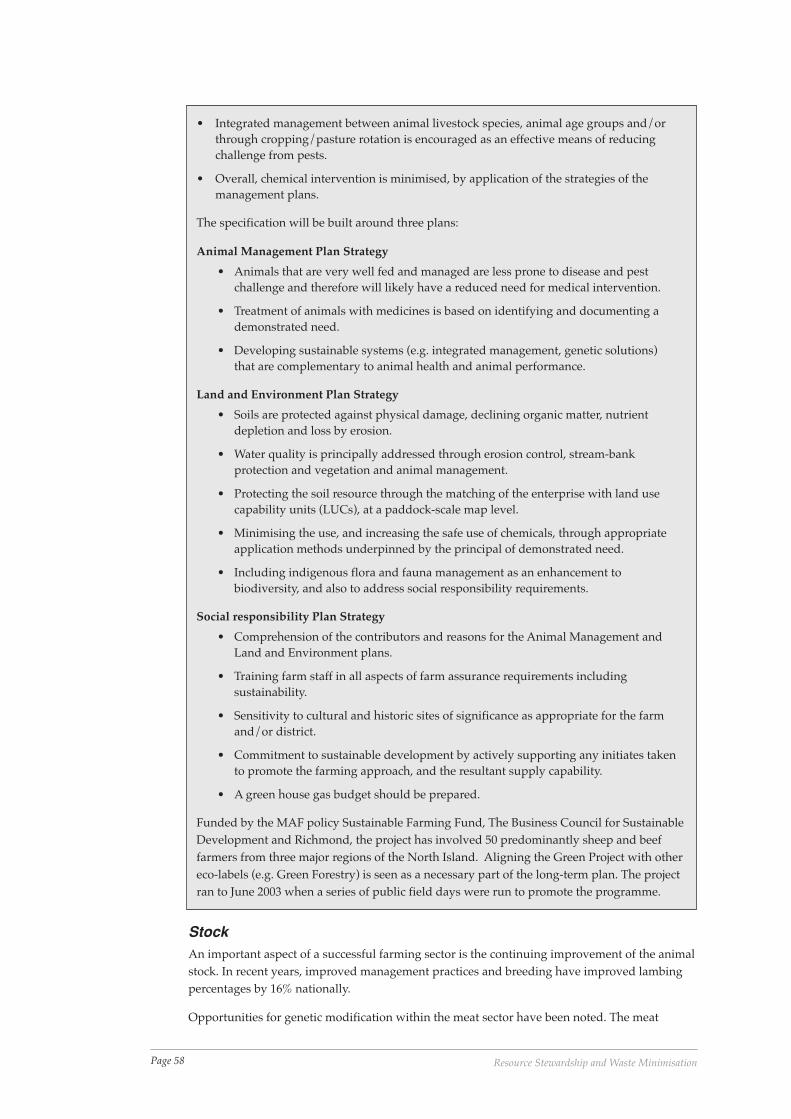
Page 58 Resource Stewardship and Waste Minimisation
StockAn important aspect of a successful farming sector is the continuing improvement of the animalstock. In recent years, improved management practices and breeding have improved lambingpercentages by 16% nationally.
Opportunities for genetic modification within the meat sector have been noted. The meat
• Integrated management between animal livestock species, animal age groups and/orthrough cropping/pasture rotation is encouraged as an effective means of reducingchallenge from pests.
• Overall, chemical intervention is minimised, by application of the strategies of themanagement plans.
The specification will be built around three plans:
Animal Management Plan Strategy
• Animals that are very well fed and managed are less prone to disease and pestchallenge and therefore will likely have a reduced need for medical intervention.
• Treatment of animals with medicines is based on identifying and documenting ademonstrated need.
• Developing sustainable systems (e.g. integrated management, genetic solutions)that are complementary to animal health and animal performance.
Land and Environment Plan Strategy
• Soils are protected against physical damage, declining organic matter, nutrientdepletion and loss by erosion.
• Water quality is principally addressed through erosion control, stream-bankprotection and vegetation and animal management.
• Protecting the soil resource through the matching of the enterprise with land usecapability units (LUCs), at a paddock-scale map level.
• Minimising the use, and increasing the safe use of chemicals, through appropriateapplication methods underpinned by the principal of demonstrated need.
• Including indigenous flora and fauna management as an enhancement tobiodiversity, and also to address social responsibility requirements.
Social responsibility Plan Strategy
• Comprehension of the contributors and reasons for the Animal Management andLand and Environment plans.
• Training farm staff in all aspects of farm assurance requirements includingsustainability.
• Sensitivity to cultural and historic sites of significance as appropriate for the farmand/or district.
• Commitment to sustainable development by actively supporting any initiates takento promote the farming approach, and the resultant supply capability.
• A green house gas budget should be prepared.
Funded by the MAF policy Sustainable Farming Fund, The Business Council for SustainableDevelopment and Richmond, the project has involved 50 predominantly sheep and beeffarmers from three major regions of the North Island. Aligning the Green Project with othereco-labels (e.g. Green Forestry) is seen as a necessary part of the long-term plan. The projectran to June 2003 when a series of public field days were run to promote the programme.
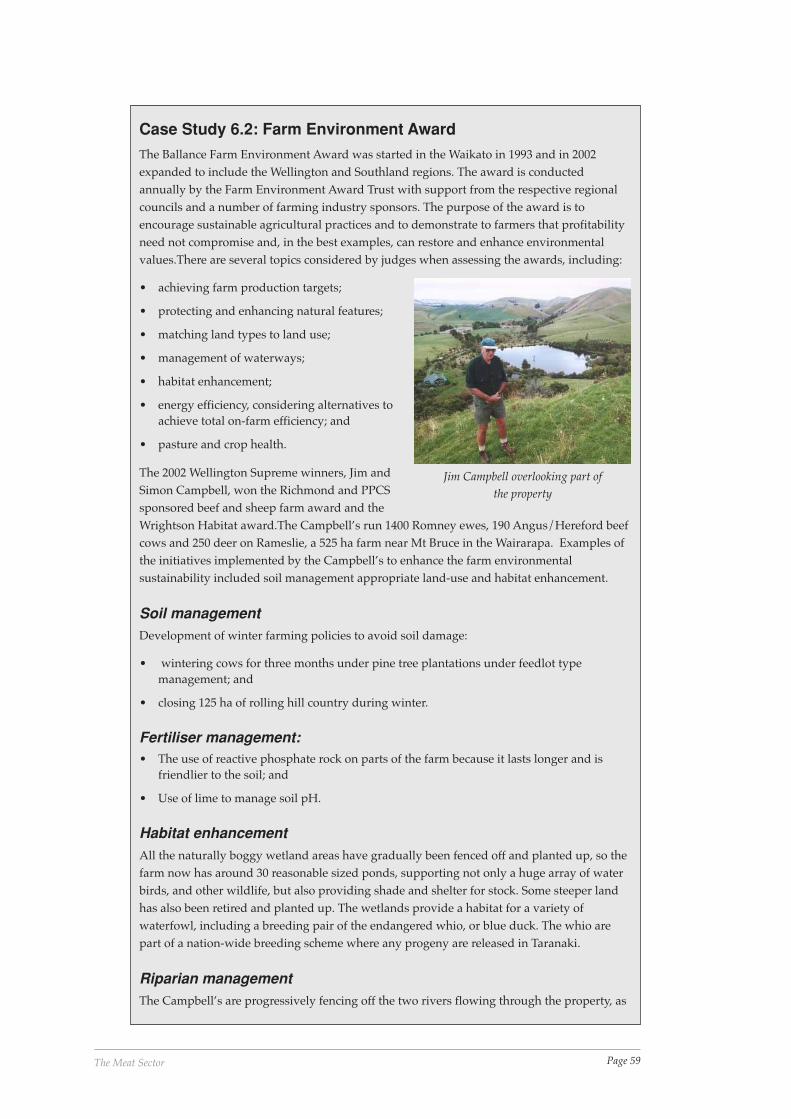
Page 59The Meat Sector
Case Study 6.2: Farm Environment Award
The Ballance Farm Environment Award was started in the Waikato in 1993 and in 2002expanded to include the Wellington and Southland regions. The award is conductedannually by the Farm Environment Award Trust with support from the respective regionalcouncils and a number of farming industry sponsors. The purpose of the award is toencourage sustainable agricultural practices and to demonstrate to farmers that profitabilityneed not compromise and, in the best examples, can restore and enhance environmentalvalues.There are several topics considered by judges when assessing the awards, including:
• achieving farm production targets;
• protecting and enhancing natural features;
• matching land types to land use;
• management of waterways;
• habitat enhancement;
• energy efficiency, considering alternatives toachieve total on-farm efficiency; and
• pasture and crop health.
The 2002 Wellington Supreme winners, Jim andSimon Campbell, won the Richmond and PPCSsponsored beef and sheep farm award and theWrightson Habitat award.The Campbell’s run 1400 Romney ewes, 190 Angus/Hereford beefcows and 250 deer on Rameslie, a 525 ha farm near Mt Bruce in the Wairarapa. Examples ofthe initiatives implemented by the Campbell’s to enhance the farm environmentalsustainability included soil management appropriate land-use and habitat enhancement.
Soil managementDevelopment of winter farming policies to avoid soil damage:
• wintering cows for three months under pine tree plantations under feedlot typemanagement; and
• closing 125 ha of rolling hill country during winter.
Fertiliser management:• The use of reactive phosphate rock on parts of the farm because it lasts longer and is
friendlier to the soil; and
• Use of lime to manage soil pH.
Habitat enhancementAll the naturally boggy wetland areas have gradually been fenced off and planted up, so thefarm now has around 30 reasonable sized ponds, supporting not only a huge array of waterbirds, and other wildlife, but also providing shade and shelter for stock. Some steeper landhas also been retired and planted up. The wetlands provide a habitat for a variety ofwaterfowl, including a breeding pair of the endangered whio, or blue duck. The whio arepart of a nation-wide breeding scheme where any progeny are released in Taranaki.
Riparian managementThe Campbell’s are progressively fencing off the two rivers flowing through the property, as
Jim Campbell overlooking part ofthe property
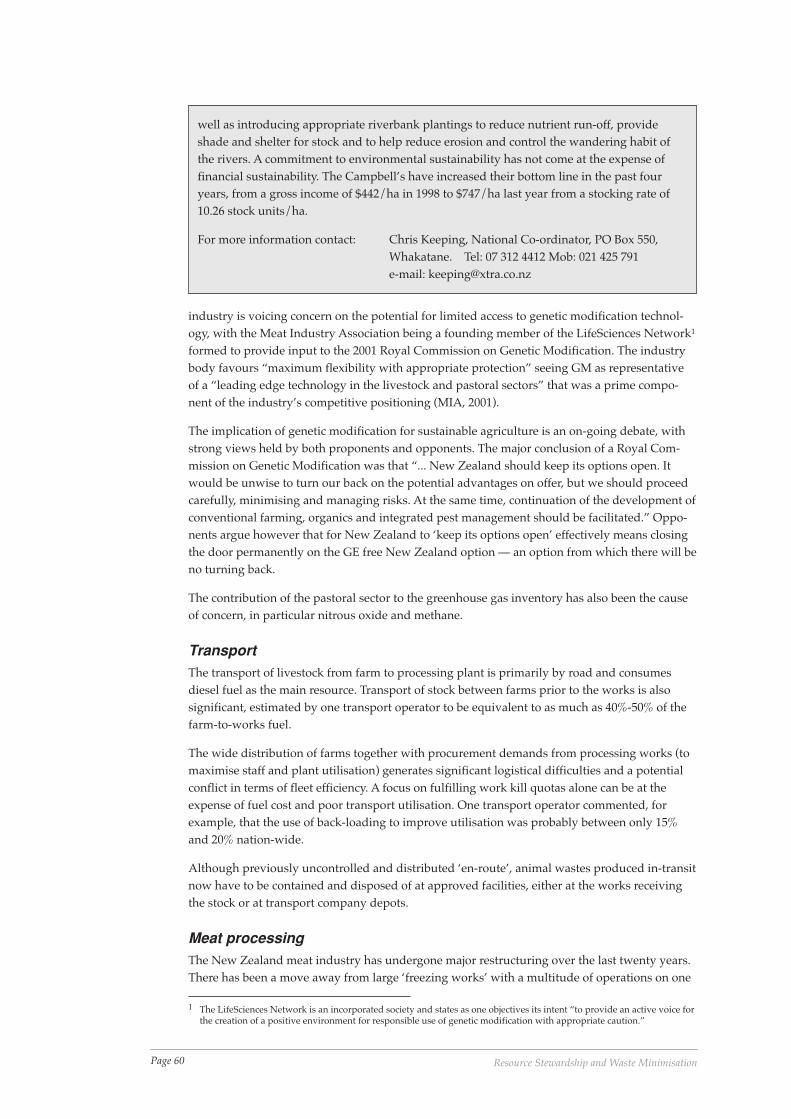
Page 60 Resource Stewardship and Waste Minimisation
industry is voicing concern on the potential for limited access to genetic modification technol-ogy, with the Meat Industry Association being a founding member of the LifeSciences Network1
formed to provide input to the 2001 Royal Commission on Genetic Modification. The industrybody favours “maximum flexibility with appropriate protection” seeing GM as representativeof a “leading edge technology in the livestock and pastoral sectors” that was a prime compo-nent of the industry’s competitive positioning (MIA, 2001).
The implication of genetic modification for sustainable agriculture is an on-going debate, withstrong views held by both proponents and opponents. The major conclusion of a Royal Com-mission on Genetic Modification was that “... New Zealand should keep its options open. Itwould be unwise to turn our back on the potential advantages on offer, but we should proceedcarefully, minimising and managing risks. At the same time, continuation of the development ofconventional farming, organics and integrated pest management should be facilitated.” Oppo-nents argue however that for New Zealand to ‘keep its options open’ effectively means closingthe door permanently on the GE free New Zealand option — an option from which there will beno turning back.
The contribution of the pastoral sector to the greenhouse gas inventory has also been the causeof concern, in particular nitrous oxide and methane.
TransportThe transport of livestock from farm to processing plant is primarily by road and consumesdiesel fuel as the main resource. Transport of stock between farms prior to the works is alsosignificant, estimated by one transport operator to be equivalent to as much as 40%-50% of thefarm-to-works fuel.
The wide distribution of farms together with procurement demands from processing works (tomaximise staff and plant utilisation) generates significant logistical difficulties and a potentialconflict in terms of fleet efficiency. A focus on fulfilling work kill quotas alone can be at theexpense of fuel cost and poor transport utilisation. One transport operator commented, forexample, that the use of back-loading to improve utilisation was probably between only 15%and 20% nation-wide.
Although previously uncontrolled and distributed ‘en-route’, animal wastes produced in-transitnow have to be contained and disposed of at approved facilities, either at the works receivingthe stock or at transport company depots.
Meat processingThe New Zealand meat industry has undergone major restructuring over the last twenty years.There has been a move away from large ‘freezing works’ with a multitude of operations on one
well as introducing appropriate riverbank plantings to reduce nutrient run-off, provideshade and shelter for stock and to help reduce erosion and control the wandering habit ofthe rivers. A commitment to environmental sustainability has not come at the expense offinancial sustainability. The Campbell’s have increased their bottom line in the past fouryears, from a gross income of $442/ha in 1998 to $747/ha last year from a stocking rate of10.26 stock units/ha.
For more information contact: Chris Keeping, National Co-ordinator, PO Box 550,Whakatane. Tel: 07 312 4412 Mob: 021 425 791e-mail: [email protected]
1 The LifeSciences Network is an incorporated society and states as one objectives its intent “to provide an active voice forthe creation of a positive environment for responsible use of genetic modification with appropriate caution.”
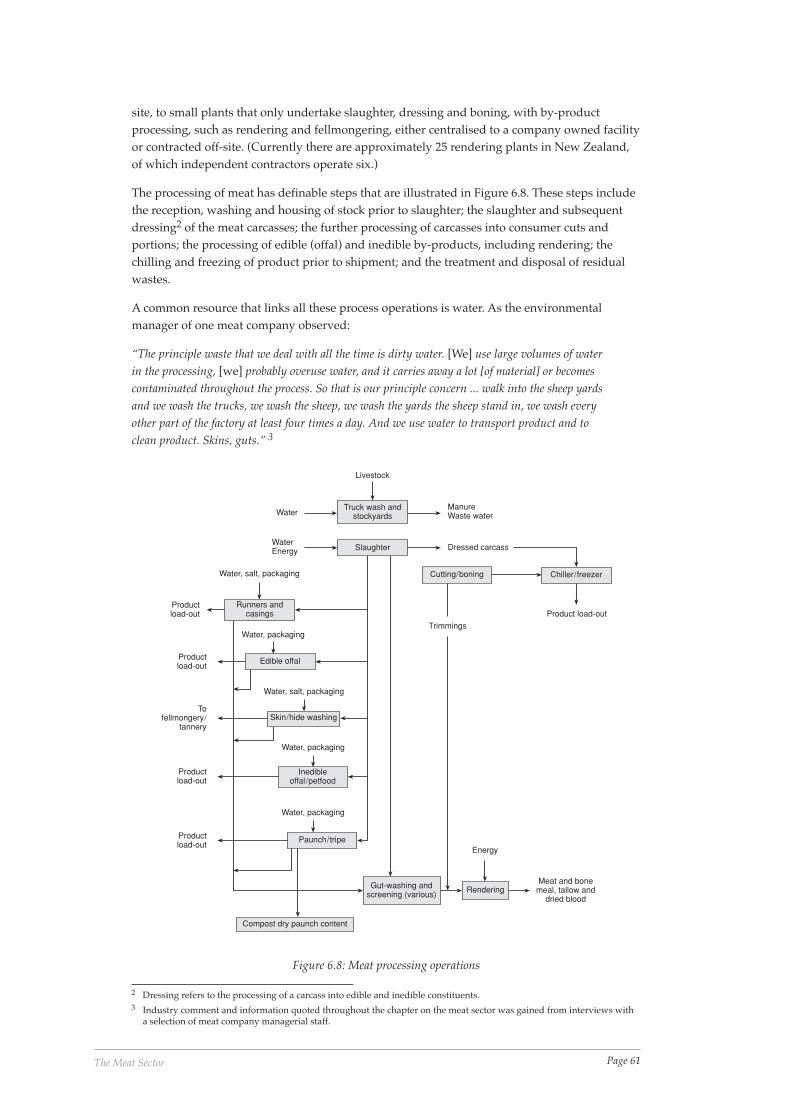
Page 61The Meat Sector
site, to small plants that only undertake slaughter, dressing and boning, with by-productprocessing, such as rendering and fellmongering, either centralised to a company owned facilityor contracted off-site. (Currently there are approximately 25 rendering plants in New Zealand,of which independent contractors operate six.)
The processing of meat has definable steps that are illustrated in Figure 6.8. These steps includethe reception, washing and housing of stock prior to slaughter; the slaughter and subsequentdressing2 of the meat carcasses; the further processing of carcasses into consumer cuts andportions; the processing of edible (offal) and inedible by-products, including rendering; thechilling and freezing of product prior to shipment; and the treatment and disposal of residualwastes.
A common resource that links all these process operations is water. As the environmentalmanager of one meat company observed:
“The principle waste that we deal with all the time is dirty water. [We] use large volumes of waterin the processing, [we] probably overuse water, and it carries away a lot [of material] or becomescontaminated throughout the process. So that is our principle concern ... walk into the sheep yardsand we wash the trucks, we wash the sheep, we wash the yards the sheep stand in, we wash everyother part of the factory at least four times a day. And we use water to transport product and toclean product. Skins, guts.” 3
Truck wash andstockyards
Slaughter
Cutting/boning Chiller/freezer
Runners andcasings
Edible offal
Skin/hide washing
Inedibleoffal/petfood
Paunch/tripe
Compost dry paunch content
Gut-washing andscreening (various)
Rendering
Livestock
Water
WaterEnergy
ManureWaste water
Dressed carcass
Productload-out
Tofellmongery/
tannery
Productload-out
Productload-out
Water, salt, packaging
Water, packaging
Water, salt, packaging
Water, packaging
Water, packaging
Trimmings
Product load-outProductload-out
Energy
Meat and bonemeal, tallow and
dried blood
Figure 6.8: Meat processing operations
2 Dressing refers to the processing of a carcass into edible and inedible constituents.3 Industry comment and information quoted throughout the chapter on the meat sector was gained from interviews with
a selection of meat company managerial staff.

Page 62 Resource Stewardship and Waste Minimisation
The potential environmental impact of meat processing is large. For example, the untreatedwastewater discharged from processing all the stock slaughtered in 2001 was equivalent to thewastewater that would be generated in a year by a population of about 1 million people.
A breakdown of a typical meat processing operation is given in Fig. 6.8.
The process of restructuring has heralded the advent of more modern plants and technology,which together with improved operational practices, has seen an improvement in plant effi-ciency. For example, over the period of major restructuring between 1980 and 1995, the overallenergy intensity (energy used to process a tonne of meat) was reduced by about 42% to 4.57 GJ/tonne (EECA, 1996). It is anticipated that a current review of energy use in the meat industry,due to be published late 2002, will show a continuing downward trend to about 4.10 GJ/tonne.
The introduction of new and more efficient technology alsohas a role in improving resource stewardship. The process oftransferring a new technology into an industry sector requiresthe co-operation, support and a degree of risk taking from anumber of players. The installation of a superheated steamdryer to dry meat and bone meal at Lowe Corporation’sHawera site is a good example (see Case Study 6.3).
Rising energy costs have prompted companies to commissionenergy audits to identify new opportunities for reducingenergy use, or review opportunities previously rejected.Concern over the impact of ratification of the Kyoto agreement is also providing some impetusto review energy use. New Zealand’s short-term hydro storage and vulnerability to drought,coupled with uncertainty regarding the gas resource, add impetus to maintaining the industriesrecent trends of reducing energy use.
Superheated steam dryer at LoweCorp, Hawera
Case Study 6.3: Superheated steam drying — introducing newtechnology
Superheated steam (SHS) drying, also called airless drying, uses a SHS atmosphere to dryproduct as the SHS vapour displaces air from the system. The absence of oxygen reduces thepossibility of product burning and product degradation, and dries product using lessenergy than conventional drying systems.
In conventional meat and bone meal dryers, whether indirect or directly fired, all of thewater evaporated from the product is vented from the dryer. In contrast, a SHS dryer re-uses a proportion of the water vapour evaporated from the product as the heating mediumby recirculating the vapour through a heat exchanger. The heat exchanger heats the vapourto a temperature well above that where it would normally condense, and the SHS is thenrecirculated to the dryer. Similar to conventional dryers, the excess vapour is condensed toproduce hot water. The SHS dryer uses an indirect heat exchanger that reduces the volumeof non-condensable vapour (mainly hot air) and consequently the size and cost of thecondensers.
Making it happenThe installation of the SHS dryer at Hawera has highlighted the importance of some of thekey elements necessary for successful technology transfer: industry sponsorship and vision,applied research, experienced commercial partners and an innovative ‘early adopter’ withinindustry.
In 1997 Meat New Zealand, the sponsor of the programme, commissioned AgResearch’sMIRINZ centre to investigate the potential and benefits of superheated steam drying
Page 63The Meat Sector
The meat-processing sector is also a high water user. While in some areas the abundant supplyof water means water use minimisation has been a low priority, in many areas water consump-tion is more critical. Examples are areas where drought situations, or threatened groundwatersources, have forced significant improvement in water use efficiency.
A lot of the improvements in meat plant resource efficiency have been through engineeringchanges or technology improvements that do not depend on staff behavioural change. Someexamples are listed in Table 6.3. Other examples include:
• The industry-wide introduction of accelerated conditioning and ageing of lamb carcassesreduced chiller holding time and energy use (and improving product quality).
technology in the meat industry. A pilot plant built by MIRINZ demonstrated thetechnology’s product quality and energy efficiency potential. In late 1998, Trevor Arnoldfrom Lowe Corporation attended a MIRINZ project update and became interested in thepotential for the SHS design to reduce the energy costs of drying meat and bone meal.Subsequent pilot plant trials of material from the Hawera plant demonstrated two benefitsto Lowe Corp, in addition to energy savings, that convinced them to proceed with the newtechnology. The ability of the dried meal to meet the rigorous Japanese meat and bone mealtime-temperature sterilisation requirements, and the high quality of gelatine recovered fromthe bone particles.
Commercialising the technology was not without obstacle. The first commercial partnerdecided not to proceed due to technical concerns. The project stalled. In 1999 KeithEngineering, now Pinches Consolidated Industries, began working with Lowe Corp, MeatNZ and AgResearch to solve some heat exchange and corrosion issues and turn the conceptinto a commercial reality.
In mid-2002, five years after project inception, Lowe Corp staff at the Hawera renderingplant began operating the first fully-functional superheated steam meat and bone mealdryer in the world.
What it meansTo successfully transfer new technology requires a combination of timing, commitment andco-operation. All the stakeholders involved in the process have had a critical role to play:
• Meat NZ — Vision and seed finance.
• AgResearch/MIRINZ — Technical and research capability, industry contacts.
• Lowe Corporation — A willingness to innovate.
• Pinches — Practical engineering and commercial experience.
For Lowe Corporation, Trevor Arnold says that, “Although we initially got involved for theenergy savings, ultimately it has been the ability to produce a high quality gelatine productthat will pay for the investment. The energy savings are a bonus.”The application ofsuperheated steam drying is not limited to meat and bone meal. The technology haspotential in a wide range of areas including wood drying, cereal drying and the drying ofwaste sludge.
For more information contact:
Max Morley Trevor ArnoldPinches Consolidated Industries Lowe CorporationPhone: 09 266 9005 Hastingse-mail: [email protected] Phone: 06 878 338
Page 64 Resource Stewardship and Waste Minimisation
• The installation of refrigeration heat recovery systems at several plants has reduced thefossil fuel demand for hot water heating.
• Advances in meat packaging technology that has resulted in polyethylene packaging beingused more efficiently.
One plant realised a 20% reduction in water use, a 50% reduction in effluent BOD and a 67%reduction in effluent suspended solids by implementing a range of engineering solutions. TheEngineering Manager has recognised however that many opportunities will only be realised byinvolving staff in the improvement process (see Case Study 6.4).
Minimising the impact of waste on the environment has meant that the principle activity formost companies is to collect, treat and contain waste through a range of steps – for exampleprimary screening to primary treatment to secondary treatment and irrigation on to land. Wasteminimisation, which has the added benefit of broader resource savings, is not yet an inherentpart of business practice.
The enactment of the Resource Management Act in 1991 has focussed companies on reducingenvironmental impact, not on improving resource efficiency.
Meat companies have over the last 10 years significantly reduced the impact of their dischargeson the environment, principally by investing in improved end-of-pipe treatment. The opera-tions manager of one company commented that the installation of polishing wetlands at one ofthe company’s sites to treat secondary effluent was a result of the discharge conditions deter-mined through the RMA consent process.
Case Study 6.4. Involving staff in the improvement processWith the exception of the mid 1980s when meat by-products were supporting weak meatcommodity prices, rendering departments have generally been neglected in terms ofmanagement support and investment. Although returning value on what would otherwisebe an intolerable waste burden, rendering systems have not benefited from the level ofinvestment of time and resources necessary to make the same efficiency gains that have beenevident in meat processing. Many plants have taken the step of contracting rendering off-site to independent companies.
The Engineering Manager at one meat processing plant however has introduced a team-based approach where operators and engineering staff work together to identifyopportunities for process improvement within the rendering department. He knew therendering plant was not performing well and that by improving the operationalperformance, material that was currently contributing to the effluent load could beprocessed into valuable product.
After only six months, the collaborative approach had identified several ways of improvingperformance with the result that, without the need for any capital expenditure, companyrevenue was increased by $400,000. This was a result of a combination of a 7% increase inproduct yield, a reduction in effluent treatment costs and an improvement in tallow quality.The Engineering Manager has also observed a significant improvement in staff morale.
Despite the rendering team generating significant improvement in environmental andeconomic performance, and staff morale, at minimal cost, the Engineering Managercommented that the rest of the management team is, inexplicably, resistant to transferringthis approach to different departments.
From the Engineering Manager’s perspective, staff are the company’s most valuableresource.

Page 65The Meat Sector
The treatment systems used by the meat industry are usually a combination of the following:
• Primary screening: Screening followed by sedimentation or dissolved air flotation.
— solids can be rendered (depending on quality), composted or land-filled
• Primary treatment
— physico-chemical treatment, or
— anaerobic lagoons
• Secondary treatment: Aerobic lagoons
• Discharge of secondary treated effluent:
— through irrigation onto pasture or forestry, or
— through a constructed wetland.
What was once disposed of as waste is now in many cases put to beneficial reuse. ExamplesRichmond Ltd have initiated include:
• static pile composting of paunch grass from Hawkes Bay meat plants;
• vermiculture composting of paunch grass from Waikato meat plant; and
• the utilisation of methane produced from a covered anaerobic effluent lagoon in theDargaville plant boiler.
The processing of an inherently heterogeneous raw material is necessarily a complex operation.No two animals are identical and the ranges of operations required to extract the maximumvalue are numerous.
Stock are received and housed until slaughter, at which point the carcass begins to be brokendown into constituent parts. The primary separation is into edible meat and offal and inedibleproducts.
The edible meat portion was traditionally exported as whole frozen carcasses that were brokendown into retail portions by the receiving market. In recent years the focus has shifted to addingvalue within New Zealand, with a strong emphasis on further processing of retail cuts or bonedproduct, and an increasing proportion of chilled, rather than frozen, product.
For example, in the 1986/87 season, 63% of lamb was exported in carcass form. In the 2000/01season, only 8% were exported as carcasses, 76% as retail cuts and 16% as boneless product. Inthe 2000 season, 12% of lamb product was exported chilled (The Economic Service, 2002).
Case Study 6.5. The ‘dropped meat’ programmeThe preparation of retail cuts and boneless meat portions have added considerable value toNew Zealand meat exports. Improving the yield of added value products has been a focusindustry wide.
One meat processing company reported that by implementing a range of measures itsboning and cutting room yields had improved by about 3%. In an industry where over 90%of red meat production is further processed, a 3% improvement in yield means largerevenue gains. Improvements have been realised through improvements in operatortechnique, training and action, to stop product from dropping onto the floor.
One aspect of this improvement has been the reduction of meat dropped onto the floor.Dropped meat has to be downgraded to pet-food or rendered product and loses up to 80%of its value. Eliminating ‘dropped meat’ also means the avoidance of wasted production
Page 66 Resource Stewardship and Waste Minimisation
The meat industry has however made significant progress over the last 10 years in its evalua-tion of resource use. Steps recently taken by one company include:
• implementing a regular monitoring programme enabling a packaging mass balance to becompleted so that yields and percent waste can be determined;
• including regular measurement of all identifiable waste opportunities since 2000; and
• running a weekly internal benchmarking programme updating all plant managers on arange of indicators including energy, transport and labour on a per carcass basis.
Table 6.3 gives examples of a range of waste minimisation options that have been implementedwithin meat processing facilities. The information presented in Table 6.3 has been drawn from arange of industry sources.
6.3 Using Waste Minimisation to bring about Resource StewardshipWaste minimisation has continued to gain ground in the meat industry over the last decade andthere are numerous examples that clearly demonstrate the role of waste minimisation inreducing resource use. There is ample evidence of the value of waste minimisation to the meatindustry. However, waste minimisation, as pointed out by one industry manager, continues tooccupy a ‘back seat’ and is still ‘depressingly uncommon’. For many companies, waste minimi-sation has been something incidental or thought of later. Certainly when the opportunities areidentified and the financial benefit quantified there is support, but it is not yet integrated intobusiness practice.
One company manager, when asked if results of a wide range of waste minimisation projectswithin his company have had any influence on senior management’s attitude to resourcestewardship, responded with an emphatic “No. Hell no!”
In contrast, another company manager believed that waste minimisation has had a positiveimpact on senior management and that attitudes have shifted over recent years. He cited anumber of initiatives within the company that indicate this shift, including improved boningyields, farm quality assurance programmes and increasing awareness of the importance ofsustainable farming or good farming practice. He believed the introduction of kerb-side recy-cling has also had a role to play, raising the awareness amongst operational staff and manage-ment alike, of environmental issues.
Although many companies run profit improvement programmes, where different departmentsare required to identify opportunities to improve profit, these initiatives remain profit-drivenand as yet do not include a sustainable management driver. In most cases, although significantresource as well as economic benefits result, the extent to which resource stewardship andsustainability are highlighted is dependent more on the individuals involved than the valuesand drivers of the company.
One company manager commented that despite having implemented a well-structured profitimprovement programme, there was a need to upgrade the level and quality of on-goingmonitoring and reporting. One example cited was that despite the routine reporting of render-
time as well as the additional processing resources necessary to process meat into lowervalue pet-food or rendered products.
The ‘dropped meat’ programme included a combination of engineering changes as well asimproving staff awareness and operating practise. The engineering changes includedmeasures as simple as altering the edge of the processing tables to retain meat andimproving conveying systems to eliminate drop-off points.
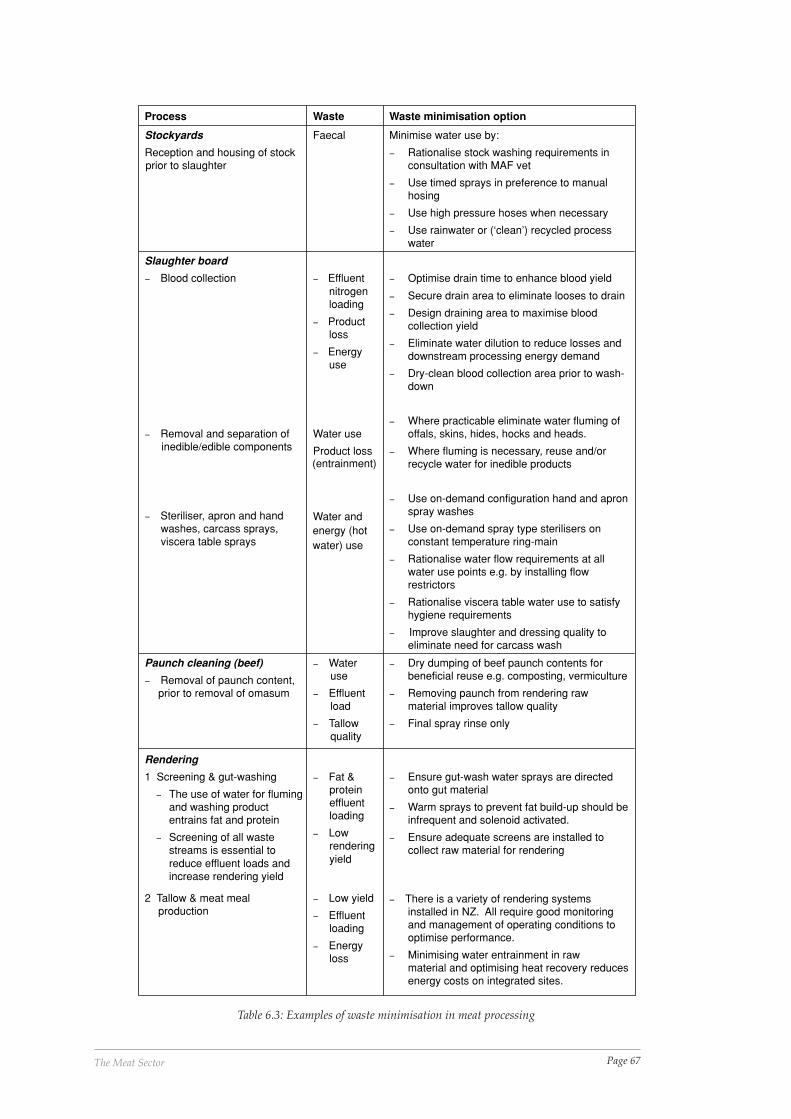
Page 67The Meat Sector
Process Waste Waste minimisation option
Stockyards
Reception and housing of stockprior to slaughter
Faecal Minimise water use by:
− Rationalise stock washing requirements inconsultation with MAF vet
− Use timed sprays in preference to manualhosing
− Use high pressure hoses when necessary
− Use rainwater or (‘clean’) recycled processwater
Slaughter board
− Blood collection
− Removal and separation ofinedible/edible components
− Steriliser, apron and handwashes, carcass sprays,viscera table sprays
− Effluentnitrogenloading
− Productloss
− Energyuse
Water use
Product loss(entrainment)
Water and
− Optimise drain time to enhance blood yield
− Secure drain area to eliminate looses to drain
− Design draining area to maximise bloodcollection yield
− Eliminate water dilution to reduce losses anddownstream processing energy demand
− Dry-clean blood collection area prior to wash-down
− Where practicable eliminate water fluming ofoffals, skins, hides, hocks and heads.
− Where fluming is necessary, reuse and/orrecycle water for inedible products
− Use on-demand configuration hand and apronspray washes
− Use on-demand spray type sterilisers onconstant temperature ring-main
− Rationalise water flow requirements at allwater use points e.g. by installing flowrestrictors
− Rationalise viscera table water use to satisfyhygiene requirements
− Improve slaughter and dressing quality toeliminate need for carcass wash
Paunch cleaning (beef)
− Removal of paunch content,prior to removal of omasum
− Wateruse
− Effluentload
− Tallowquality
− Dry dumping of beef paunch contents forbeneficial reuse e.g. composting, vermiculture
− Removing paunch from rendering rawmaterial improves tallow quality
− Final spray rinse only
energy (hotwater) use
Rendering
1 Screening & gut-washing
− The use of water for flumingand washing productentrains fat and protein
− Screening of all wastestreams is essential toreduce effluent loads andincrease rendering yield
− Fat &proteineffluentloading
− Lowrenderingyield
− Ensure gut-wash water sprays are directedonto gut material
− Warm sprays to prevent fat build-up should beinfrequent and solenoid activated.
− Ensure adequate screens are installed tocollect raw material for rendering
2 Tallow & meat mealproduction
− Low yield
− Effluentloading
− Energyloss
− There is a variety of rendering systemsinstalled in NZ. All require good monitoringand management of operating conditions tooptimise performance.
− Minimising water entrainment in rawmaterial and optimising heat recovery reducesenergy costs on integrated sites.
Table 6.3: Examples of waste minimisation in meat processing

Page 68 Resource Stewardship and Waste Minimisation
ing yield data, poor performance was neither identified nor acted upon. The systems in placewere not developed to the extent that staff could fully manage their own work or processenvironment.
The same manager also voiced the concern that even if systems were upgraded, there was noguarantee that the time and resources would be available to enable staff to be proactive andmake positive changes. The support structures would need to be in place, otherwise staff wouldbecome frustrated and disillusioned.
Another obstacle cited was that the multi-process nature of meat processing sites often resultedin sites becoming internally fragmented. Because product and waste were transferred fromdepartment to department, staff could not appreciate the ‘big picture’ and had no interest inactivity or impacts beyond their own department.
According to three of the meat company managers interviewed, to move waste minimisationforward requires a combination of better communication, a commitment to training and aconscious effort to integrate waste minimisation into already existing profit improvementprogrammes. Suggestions included:
• introduce brainstorming to encourage ‘different’ thinking. Initially between plant managersto encourage cross-fertilisation of ideas;
• re-focus profit-driven project teams on waste minimisation;
• raise awareness and regularly update plant managers of the methods and technologies thatare available to reduce waste;
• introduce small teams and maintain consistent improvement; and
• training, training and more training.
If these experiences and comments were representative of the meat industry, they wouldindicate that cost reduction and resource stewardship are not yet adequately linked. Theresources made available to staff to minimise waste are influenced strongly by what are theperceived priorities, or drivers, within the meat sector.
In the late 1990s the environment was mooted as the next significant market pressure to influ-ence the New Zealand meat industry, following on from earlier demands for verifiable qualityassurance systems. Several companies as a consequence were seriously evaluating the implica-tions of becoming accredited to ISO 14001. The rapid and industry-wide adoption of ISO9001systems has not, however, been repeated with ISO14001.
According to the environmental manager of one company, the major issues for the meat indus-try as identified by the customer are in priority order food safety, animal welfare, with theenvironment a ‘distant third’. Although the necessary resources are allocated as a high priorityto ensure environmental consent requirements are met, for most companies the resources do notextend to the level necessary to integrate waste minimisation into work practice.
One company manager perceived a systems approach to management as the way to implementwaste minimisation on a company-wide scale. The barrier to this approach for his company wasa lack of resources. The staff familiar with a systems approach needed to be teamed with thestaff who ‘make it happen’, but they do not have the opportunity to work together to developthose systems. A primary reason is that the systems staff always have other priority tasks suchas the development of quality systems, or HACCP, and their resource is not available. Thecompany manager, referring to how the lower priority assigned waste minimisation has limitedits effectiveness, commented that:
“I think the primary cause for [waste minimisation] not being effective [in our company] isthat we haven’t matched the resources that we have put into food safety programmes and quality
Page 69The Meat Sector
management programmes [in] the environmental area at all. So the environment is taking thirdplace and we are lacking a trained group of people that instinctively act and operate in that [area].We tend to be production driven rather than minimising waste ... we have put more training effortinto our people in the food safety and animal welfare aspects than we have in waste minimisation.”
6.4 Governance of the SectorAs a major export sector, legislation and associated standards governing procedures andpractises within the industry have been developed or have evolved over time to satisfy overseasmarket requirements. The most notable example is the Animal Products Act 1999 (NZFSA,2002). The Animal Products Act (APA) will at the conclusion of a transition period (1 Nov 1999to 1 Nov 2002) effectively replace the Meat Act. The objective of the APA is to provide a regula-tory basis for the management of the risk associated with the production and processing ofanimal products and to facilitate access into overseas markets. The APA requires all animalstraded to be ‘fit for intended purpose’, and for them to conform to the New Zealand animalproduct standards that are contained in part 1 of the Animal Product Regulations 2000. Afoundational component of the risk management system prescribed by the Act is the require-ment for meat exporters to have a documented programme to identify and manage hazards.The risk management programme must be based on the principles of Hazard Analysis andCritical Control Point (HACCP). In addition there is provision for:
• regulated control schemes where hazards cannot be effectively managed by the businessoperator’s individual risk management programmes; and
• safeguards that ensure that overseas market access requirements are consistently met, and tomanage risks to the integrity and reputation of New Zealand’s official assurances andsystems.
A major impact of the APA on the meat industry’s ability to improve resource stewardship hasbeen the acute urgency the Act has placed on the development of a verifiable risk managementprogramme, and the pressure this has placed on staff and management resources. A lack of timeand resources are frequently cited as reasons for a lack of progress in minimising waste.
A notable positive outcome of the implementation of the Act has been a focus on productintegrity throughout the supply chain. In part, it could be argued that the Act has helped tofocus meat processing companies on farm practice, which has resulted in initiatives such as theGreen Project (see Case Study 6.1).
The Resource Management Act4 has also had, and continues to have, a major influence on themeat industry. The focus of this legislation is on minimising environmental effects and does notdirectly encourage responsible resource use. As a consequence, most meat companies havefocused on meeting agreed resource consent conditions by improving the level of waste treat-ment, rather than the nature or quantities of resources used in the first place. Although wasteminimisation can make a major contribution to reducing waste loads and the consequent capitalinvestment, the RMA does not currently make this type of approach mandatory.
The third piece of legislation with the potential to influence resource stewardship is the Healthand Safety in Employment Act, which contains principles that are applicable to resourcestewardship. The reduction of work place hazards encourages a systematic approach of identifi-cation, elimination, isolation, reduction and protection that parallels waste minimisation(clauses 7-10). The training, monitoring and reporting provisions are also compatible. One meatcompany representative commented in particular that the requirement within the legislation toinvolve employees in the development of health and safety procedures (clause 14) was synergis-tic with his efforts to encourage staff to reduce processing waste.
4 All New Zealand legislation can be viewed at http://rangi.knowledge-basket.co.nz/gpacts/actlists.html
Page 70 Resource Stewardship and Waste Minimisation
6.5 Drivers for Change within the SectorThe meat industry, as a major exporter, is exposed to both national and international influences.As with any business, the priority attached to these influences determines the level of resourceallocated.
The priority drivers currently within the processing sector are:
• food hygiene;
• animal welfare; and
• environment.
As previously indicated, with the exception of meeting the legislative requirements of theResource Management Act, environmental issues do not attract the same level of resources asfood hygiene or animal welfare. One company manager commented that:
“The primary drive within [the] company at the moment is to rewrite all of our food safetyprogrammes into risk management plans under the Animal Products Act. And that’s one year’swork for one manager and people at each plant.”
Food hygiene and animal welfare are both directed by legislation through the Animal ProductsAct, but more especially by the major international customers.
One of the large UK supermarket chains has recently asked to inspect meat production practiceson-farm principally from an animal welfare perspective. One meat company manager com-mented that their supermarket customers want to be assured that the animal from which themeat they are purchasing has been produced has been treated humanely and responsibly, bothon the farm and at the processing plant.
Although not directly influencing resource stewardship yet, a focus on meat production ishaving the effect of requiring meat companies to consider their supply chain. Although thecurrent focus appears limited to animal welfare, will customers in the future want to be reas-sured that farming, or perhaps processing, practices are responsible and sustainable?
Closely associated to food hygiene are the recent BSE and foot and mouth outbreaks in Britain.These outbreaks have emphasised the damage this type of outbreak can have on market access,which in New Zealand’s case would decimate the export meat trade. Consequently there hasbeen an increased focus on tightening procedures and putting contingency plans in place toidentify and isolate early any potential outbreaks.
BSE in particular may also have implications for downstream processing. As a consequence ofthe BSE outbreak in Britain, the EU has progressively tightened regulations regarding thefeeding of meat and bone meal to farm animals. European Commission decision 2002/248/ECof 27 March 2002 effectively places a total ban on the feeding of animal proteins to any farmedanimal (not only ruminants), that are bred for food:
“Member States shall prohibit the feeding of:(a) proteins derived from animals to ruminants;(b) processed animal proteins to farmed animals which are kept, fattened or bred for the
production of food.”
This regulation, if implemented in New Zealand, would have the effect of devaluing renderedproduct, potentially reducing it to boiler or incinerator fuel.
Nationally, there is concern regarding the shortage of a skilled workforce, both tradesman andshop floor staff. Increasing automation and computer-based systems in modern meat processingplants require higher levels of numeracy and literacy, and the meat industry is constrained by a
Page 71The Meat Sector
lack of skilled labour. As one manager commented:
“Using sophisticated scanning technology at product load-out has highlighted for us the lack ofnumeracy and literacy amongst the labour force.”
A combination of rising energy prices and the potential for a carbon tax as a result of NewZealand ratifying the Kyoto Protocol has provided new impetus for the meat industry toreassess energy use. Both rising prices and a tax have the effect of changing the cost benefit ofenergy-related improvements, and companies are now revisiting projects previously rejected asnot cost-effective as well as looking for new opportunities to reduce energy use. A companymanager commented:
“Looking at opportunities you know with the ratification of the Kyoto agreement coming in —starting to worry like hell about that. And starting to revisit some projects which previouslydidn’t have very good paybacks. Their financial profile will change if the carbon tax comes in ... orsomething shifts.”
Another driver that is common to most industry and relevant to the meat industry relates topublic relations and image — either a desire to avoid negative publicity or to attract positivepublicity. One company manager stated that environmental initiatives within his company werenot implemented out of a sense of environmental responsibility, but rather to avoid negativepublicity and to stay out of the limelight. For this company, the desire to avoid negative PR isclearly the dominant driver. This company’s position, however, does not discount the fact theother companies may be looking to build some sense of environmental responsibility into theirproduct brand. Examples include Richmond’s leading role in ‘Green Project’ (Case Study 6.1)and their support together with PPCS of the Environmental Farm Awards (Case Study 6.2).
6.6 Conclusions and RecommendationsThere is no doubt that the meat processing industry has put significant investment into improv-ing process efficiencies over the last decade. There is evidence also of a growing awareness andchanges in farm management practices that reflect a shift toward resource stewardship (seeCase Studies 6.1 and 6.2). The evidence equally suggests however that a commitment to re-source stewardship is not mainstream practice, and that for the majority of meat-relatedbusinesses a waste minimisation approach remains a nice-to-do, rather than a must-do.
New Zealand has been a land of seemingly bountiful natural resources and there is significantattitudinal inertia to overcome before many New Zealand business appreciate the true value ofthese resources and accord them higher priority. Many of these resources, though of intrinsicallyhigh value, have been provided at a relatively low price. Water for example is used extensivelyin meat processing and in some locations is available for the cost of an extraction permit.
The increase of more intensive agricultural and horticultural production have resulted in watershortages in some parts of New Zealand, which have changed work practices, albeit tempo-rarily in some cases until the crisis passed. Similarly, a lack of hydro storage has impactedelectricity prices and caused meat companies to revisit energy efficiency options.
There has been a significant increase in the amount of added-value processing of export meat. Afocus of profit improvement programmes in several companies on this aspect of meat process-ing has resulted in increases in production yields. In the absence of a strong financial driver orapparent resource shortage, there has not been the same degree of focus on other resources usedwithin the industry. The processing industry is still described by company staff as productiondriven.
One company representative believed there were extensive opportunities to reduce resource useand make substantial cost savings by applying waste minimisation principles, by “... doing the

Page 72 Resource Stewardship and Waste Minimisation
basics”. There is ample evidence that minimising waste and using resources wisely is good forthe environment and the bottom line. Resource stewardship and sound economic performanceare not mutually exclusive, but complementary.
Integrating waste minimisation into all aspects of meat processing would improve the meatsector’s contribution to resource stewardship while benefiting the industries economic perfor-mance and marketing image. While it is possible overseas market demands may help to drivesustainability into the industry, this is by no means a given and can not be depended upon. Forexample, the anticipated requirement for ISO14001 has not eventuated, and environmentalpressures are perceived to have diminished.
A more proactive position for the meat industry would be to actively reduce waste and improveefficiency in all aspects of its business, which as well as providing economic benefit, wouldprepare the industry for any future market-driven demands from overseas customers. Somerecommendations to assist the meat industry to move in this direction are outlined below.
Recent attention by overseas customers on animal welfare issues has resulted in meat compa-nies becoming actively involved in on-farm, transport and processing plant-related stockmanagement issues. Customer concerns have helped catalyse a number of initiatives looking atsupply chain issues. The importance of sustainable farm practices is gaining prominence, withone example being the joint sponsorship by the PCCS and Richmond of the beef and sheep farmaward in the 2002 Ballance Farm Environment Awards (see Case Study 6.1).
Another recent initiative is the Green Project, which has the objective of developing a minimumvoluntary New Zealand standard for the sustainable production of sheep, beef, deer and goat(see Case Study 6.2). This jointly-funded project includes Richmond Ltd as the lead meatcompany. The Green Project is still under development.
Recommendation
• Continue the co-ordinated development of sustainable farming initiatives that includes keystakeholders such as the meat processing industry, Federated Farmers, local governmentand MAF.
• Move toward supply contracts that require compliance with the developed sustainablefarming standard.
The meat industry draws on a broad range of suppliers and as an industry group it commandssignificant purchasing power. The extension of the supply chain concept to encompass widerpurchasing requirements would benefit the level of awareness within the industry of environ-mental responsibility as well as reducing the industries environmental impact.
Recommendation
• Introduce environmental purchasing policies to lever off the sector’s purchasing power.
The meat processing companies have implemented a wide range of positive measures to reducewaste and improve resource efficiency. For the most part this has not been the result of asystematic approach to reducing waste, but rather a strong production and product yield focuson profit improvement. As a consequence, although the industry is less resource intensive than10-15 years ago, there remains a significant opportunity to reduce waste.
Recommendation
• Integrate waste minimisation as a core principle within all profit improvement programmes.
• Develop company policy, monitoring systems and accountability (e.g. key performanceindicators) that integrate profit improvement and resource stewardship across all companyoperations and processes.
Page 73The Meat Sector
6.7 ReferencesCooper-Blanks, B, 1999. The New Zealand Poultry Meat Industry, Poultry Industry Association of
New Zealand, Auckland.
EECA, 1996. Energy-wise Monitoring Quarterly, Issue 3, Energy Efficiency and ConservationAuthority, Wellington.
MAF, 2000. RM Update, Issue 4 April 2000, Ministry of Agriculture and Forestry, Wellington.
MAF, 2001. Sheep and Beef Monitoring Report, July 2001, Ministry of Agriculture and Forestry,Wellington.
MAF, 2001a. Wairarapa - Soils Awareness for Sustainable and Profitable Land Use, SustainableFarming Fund project 01/211, Ministry of Agriculture and Forestry, Wellington.
MAF, 2001b. Fertiliser Placement QA Programme, Sustainable Farming Fund project 01/061,Ministry of Agriculture and Forestry, Wellington.
Meat NZ, 2001. The Business of New Zealand Meat, Meat New Zealand, Wellington.
MIA, 2001. Meat Industry Association Annual Report 2001, Meat Industry Association, Wellington.
NZFSA, 2000. Summary of the Animal Products Act 1999, New Zealand Food Safety Authority,Wellington. www.nzfsa.govt.nz/animalproducts/legislation/summary.htm
PIANZ, 2002. Industry Summary 2002, Poultry Industry Association of New Zealand, Auckland.
Sinner J, 1992. Agriculture and Water Quality in New Zealand, MAF Technical Paper 92/17.Ministry of Agriculture and Forestry, Wellington.
Statistics New Zealand, 2000. Agricultural Production Statistics, Statistics New Zealand,Wellington.
Statistics New Zealand, 2001. New Zealand Business Demographic Statistics, Statistics NewZealand, Wellington.
Statistics New Zealand, 2002. Overseas Merchandise Trade (Exports), Statistics New Zealand,Wellington.
The Economic Service, 2001. Annual Review of the NZ Sheep and Beef Industry, 2000-01, TheEconomic Service, Wellington.
The Economic Service, 2002. A Global Perspective on Meat Markets and New Zealand, The EconomicService, Wellington.
Wylde, A, 2000. The Nineteenth Century Heritage: Refrigeration and The Meat Industry,www.techhistory.co.nz/pages/Meat.htm
6.8 AcknowledgementsGrateful thanks to the Economic Service, the meat industry representatives for their time andvaluable input, the Wellington Regional Farm Environment Award personnel and Punawaifarm for their assistance confirming on-farm data.

Page 74 Resource Stewardship and Waste Minimisation
Page 75The Forestry Sector
7The Forestry Sector
Angela Duignan1, Peter Hall1,
Per Nielsen3 & John Gifford3
7.1 IntroductionForests cover 30 percent of New Zealand’s land area, providing habitat for flora and faunawhilst conserving soil, improving water quality and creating recreational facilities. Plantationforestry in New Zealand began at the turn of the last century in response to a foreseen depletionof our native forests as people were using more timber than they were growing. Pinus radiatawas introduced to New Zealand in the late 1920s and, since that time, continual improvementand research has produced a tree that can be harvested in short rotations of twenty-five to thirtyyears compared with 50 and sometimes 100 years overseas (NZFI, 2002).
Plantation forests cover 1.7 million hectares or 6% of New Zealand’s land area, the bulk ofwhich are in Pinus radiata. New Zealand’s climate and soil ensures that tree growth is highlyproductive with yields of 400-500 m3 per hectare (NZFI, 2002). Whenever a stand of trees isharvested, stems are removed then the site is prepared for replanting the following year. Thispractice of sustainable yield forestry ensures New Zealand’s forests can provide fuel and fibrefor domestic and overseas markets in the distant future. Radiata will continue to be the majorplantation species for many years to come, however attention is increasingly focussed on thepotential of other species such as Douglas Fir and Eucalyptus for specific sites and uses.
Wood product production involves over ten separate stages. These include planting, growing,harvesting, processing, secondary processing, marketing, and retail. Once the product is in use,the final product stages are recycling or reuse, disposal and finally combustion or decomposi-tion. New Zealand has completed around 15-20 life cycle assessments (LCA) studies that relateto forestry and construction materials with a further 20 relevant studies identified from interna-tional literature, which are compiled in Gifford et. al. (1998).
The forestry industry can be divided into log production and wood processing sectors. Anestimated 18.5 Mm3 of wood were harvested in the year ended March 2001, the majority fromplanted forests in the central North Island. Figure 7.1 illustrates the size of plantation forests byregion with the Central North Island the largest area of 576,000 ha. Wood harvested from NewZealand’s forests are used to make a wide range of products for use in domestic, commercialand industrial applications. New Zealand’s forest industry supplies 1.1% of world and 8.8% ofAsia pacific’s forest products trade from just 0.05% of the world’s forest products trade (NZFI,2002). Table 7.1 summarises primary production of annual harvest and the volume of productsexported. Logs, sawn timber and pulp are the main products with approximately one third ofproduce exported overseas. Timber as a building material has many natural benefits due to itsstrength, light weight, simple construction systems, durability, aesthetic quality, warmth,biodegradability, renewability, and low embodied energy.
Forestry accounts for 4% of GDP. Overall 70% of the forest products produced or 13 Mm3 areexported in raw and processed forms, earning New Zealand $3.6 billion and ranking forestrythird in terms of commodity exports (FIC, 2001).
Large areas of marginal agricultural land were converted to forestry during a significantplanting boom back in the 1970s. These trees are ready to be harvested and as a result, by 2010the industry will potentially have 12.5 Mm3 of wood additional to its current processing and logexport requirements, to export as logs or to process into added-value products. This ‘wave of
1 Forest Research (since left); 2 Forest Research; 3 Forest Research (corresponding author)
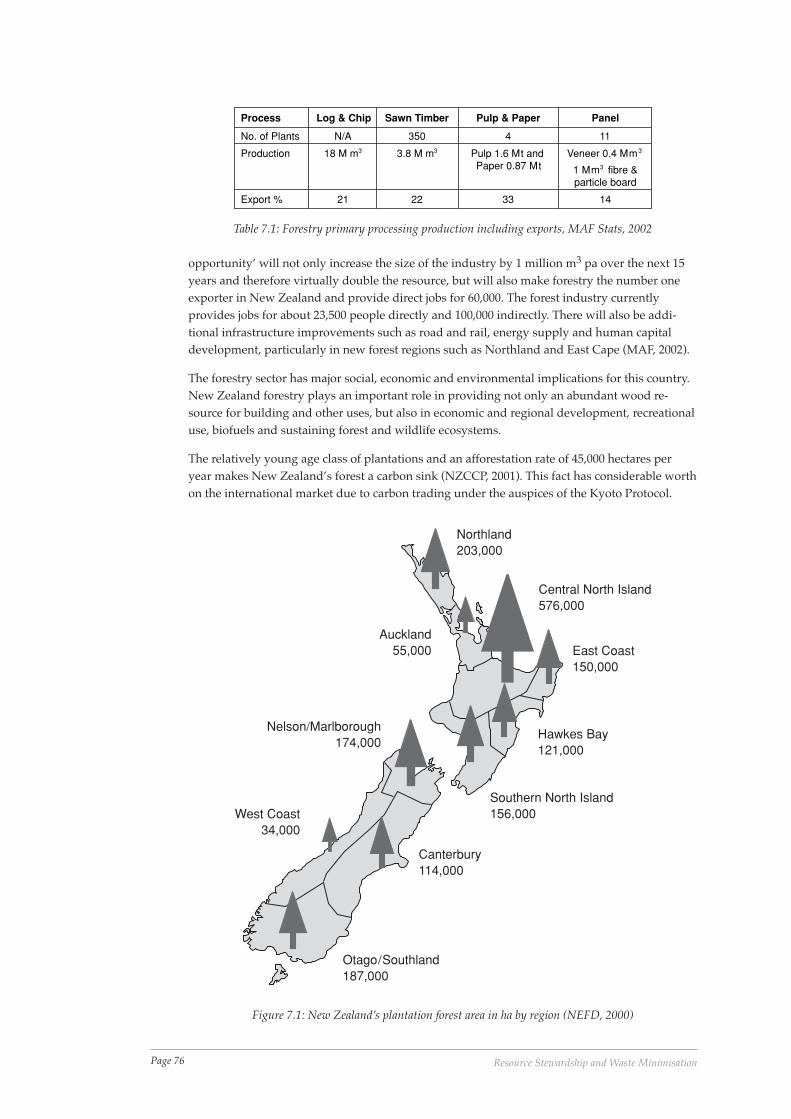
Page 76 Resource Stewardship and Waste Minimisation
opportunity’ will not only increase the size of the industry by 1 million m3 pa over the next 15years and therefore virtually double the resource, but will also make forestry the number oneexporter in New Zealand and provide direct jobs for 60,000. The forest industry currentlyprovides jobs for about 23,500 people directly and 100,000 indirectly. There will also be addi-tional infrastructure improvements such as road and rail, energy supply and human capitaldevelopment, particularly in new forest regions such as Northland and East Cape (MAF, 2002).
The forestry sector has major social, economic and environmental implications for this country.New Zealand forestry plays an important role in providing not only an abundant wood re-source for building and other uses, but also in economic and regional development, recreationaluse, biofuels and sustaining forest and wildlife ecosystems.
The relatively young age class of plantations and an afforestation rate of 45,000 hectares peryear makes New Zealand’s forest a carbon sink (NZCCP, 2001). This fact has considerable worthon the international market due to carbon trading under the auspices of the Kyoto Protocol.
Process Log & Chip Sawn Timber Pulp & Paper Panel
No. of Plants N/A 350 4 11
Production 18 M m3 3.8 M m3 Pulp 1.6 Mt andPaper 0.87 Mt
Veneer 0.4 Mm3
1 Mm3 fibre &particle board
Export % 21 22 33 14
Table 7.1: Forestry primary processing production including exports, MAF Stats, 2002
Otago/Southland187,000
Canterbury114,000
West Coast34,000
Nelson/Marlborough174,000
Southern North Island156,000
Hawkes Bay121,000
East Coast150,000
Central North Island576,000
Northland203,000
Auckland55,000
Figure 7.1: New Zealand’s plantation forest area in ha by region (NEFD, 2000)
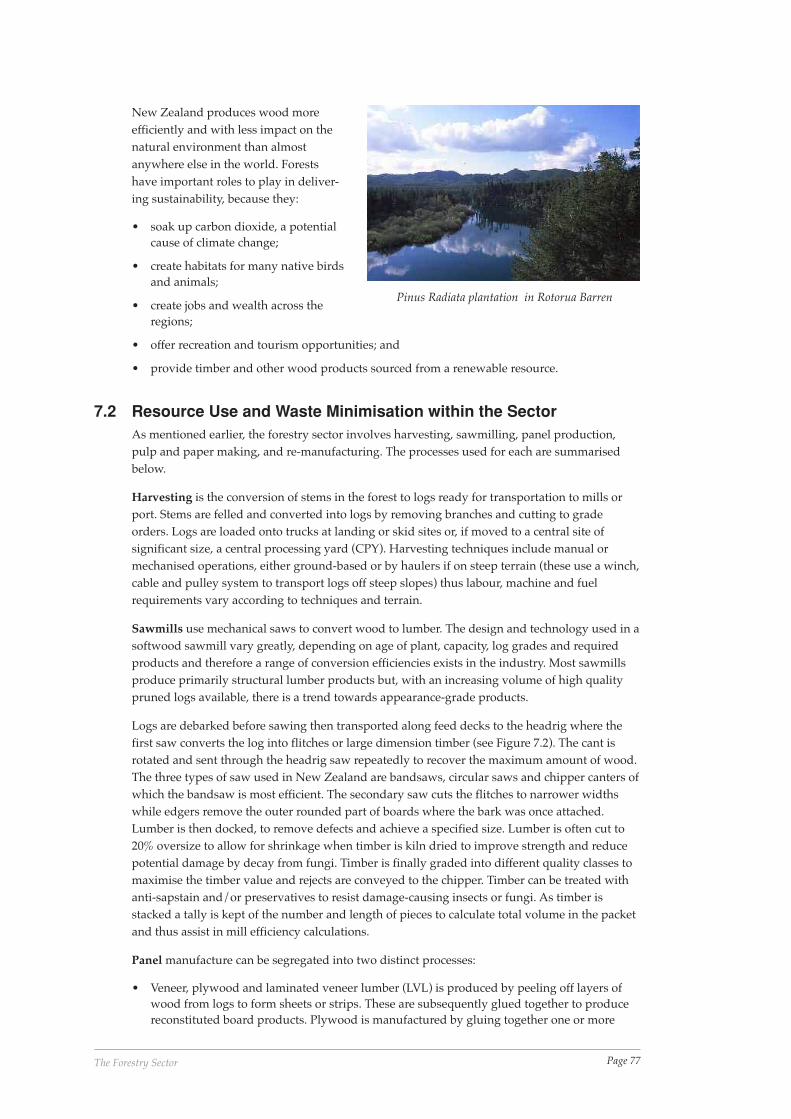
Page 77The Forestry Sector
New Zealand produces wood moreefficiently and with less impact on thenatural environment than almostanywhere else in the world. Forestshave important roles to play in deliver-ing sustainability, because they:
• soak up carbon dioxide, a potentialcause of climate change;
• create habitats for many native birdsand animals;
• create jobs and wealth across theregions;
• offer recreation and tourism opportunities; and
• provide timber and other wood products sourced from a renewable resource.
7.2 Resource Use and Waste Minimisation within the SectorAs mentioned earlier, the forestry sector involves harvesting, sawmilling, panel production,pulp and paper making, and re-manufacturing. The processes used for each are summarisedbelow.
Harvesting is the conversion of stems in the forest to logs ready for transportation to mills orport. Stems are felled and converted into logs by removing branches and cutting to gradeorders. Logs are loaded onto trucks at landing or skid sites or, if moved to a central site ofsignificant size, a central processing yard (CPY). Harvesting techniques include manual ormechanised operations, either ground-based or by haulers if on steep terrain (these use a winch,cable and pulley system to transport logs off steep slopes) thus labour, machine and fuelrequirements vary according to techniques and terrain.
Sawmills use mechanical saws to convert wood to lumber. The design and technology used in asoftwood sawmill vary greatly, depending on age of plant, capacity, log grades and requiredproducts and therefore a range of conversion efficiencies exists in the industry. Most sawmillsproduce primarily structural lumber products but, with an increasing volume of high qualitypruned logs available, there is a trend towards appearance-grade products.
Logs are debarked before sawing then transported along feed decks to the headrig where thefirst saw converts the log into flitches or large dimension timber (see Figure 7.2). The cant isrotated and sent through the headrig saw repeatedly to recover the maximum amount of wood.The three types of saw used in New Zealand are bandsaws, circular saws and chipper canters ofwhich the bandsaw is most efficient. The secondary saw cuts the flitches to narrower widthswhile edgers remove the outer rounded part of boards where the bark was once attached.Lumber is then docked, to remove defects and achieve a specified size. Lumber is often cut to20% oversize to allow for shrinkage when timber is kiln dried to improve strength and reducepotential damage by decay from fungi. Timber is finally graded into different quality classes tomaximise the timber value and rejects are conveyed to the chipper. Timber can be treated withanti-sapstain and/or preservatives to resist damage-causing insects or fungi. As timber isstacked a tally is kept of the number and length of pieces to calculate total volume in the packetand thus assist in mill efficiency calculations.
Panel manufacture can be segregated into two distinct processes:
• Veneer, plywood and laminated veneer lumber (LVL) is produced by peeling off layers ofwood from logs to form sheets or strips. These are subsequently glued together to producereconstituted board products. Plywood is manufactured by gluing together one or more
Pinus Radiata plantation in Rotorua Barren
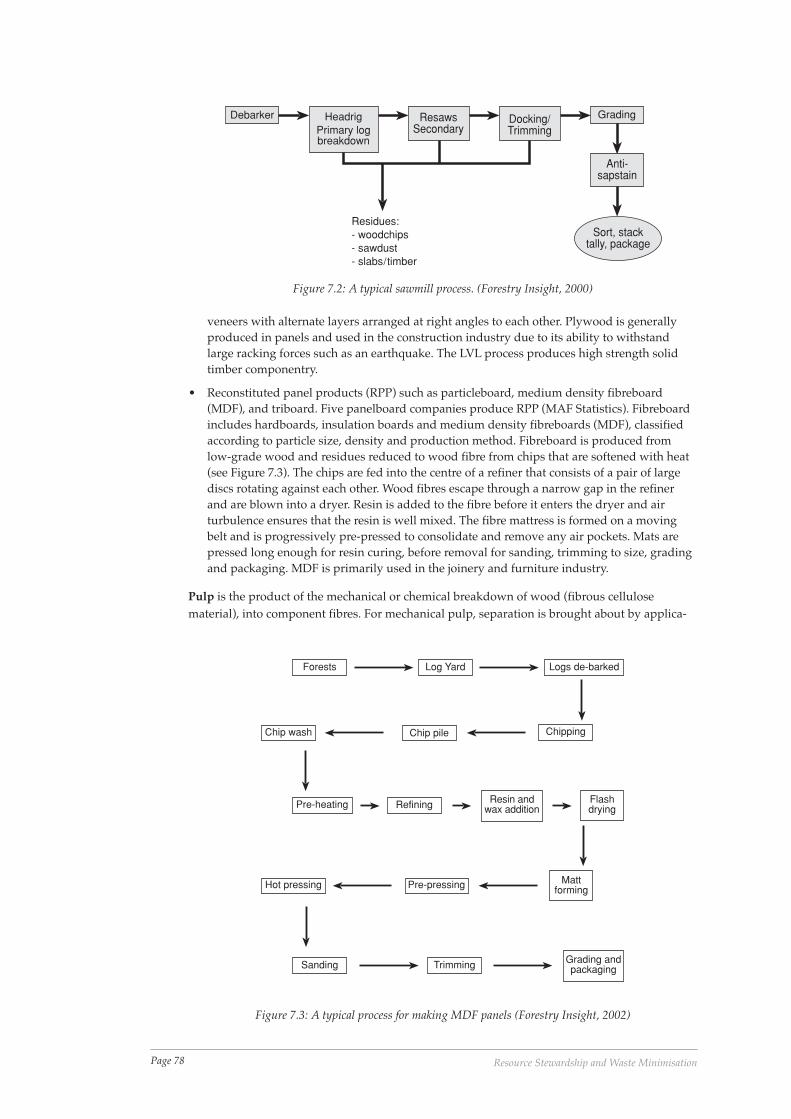
Page 78 Resource Stewardship and Waste Minimisation
veneers with alternate layers arranged at right angles to each other. Plywood is generallyproduced in panels and used in the construction industry due to its ability to withstandlarge racking forces such as an earthquake. The LVL process produces high strength solidtimber componentry.
• Reconstituted panel products (RPP) such as particleboard, medium density fibreboard(MDF), and triboard. Five panelboard companies produce RPP (MAF Statistics). Fibreboardincludes hardboards, insulation boards and medium density fibreboards (MDF), classifiedaccording to particle size, density and production method. Fibreboard is produced fromlow-grade wood and residues reduced to wood fibre from chips that are softened with heat(see Figure 7.3). The chips are fed into the centre of a refiner that consists of a pair of largediscs rotating against each other. Wood fibres escape through a narrow gap in the refinerand are blown into a dryer. Resin is added to the fibre before it enters the dryer and airturbulence ensures that the resin is well mixed. The fibre mattress is formed on a movingbelt and is progressively pre-pressed to consolidate and remove any air pockets. Mats arepressed long enough for resin curing, before removal for sanding, trimming to size, gradingand packaging. MDF is primarily used in the joinery and furniture industry.
Pulp is the product of the mechanical or chemical breakdown of wood (fibrous cellulosematerial), into component fibres. For mechanical pulp, separation is brought about by applica-
Debarker HeadrigPrimary logbreakdown
ResawsSecondary
Docking/Trimming
Grading
Anti-sapstain
Residues:- woodchips- sawdust- slabs/timber
Sort, stacktally, package
Figure 7.2: A typical sawmill process. (Forestry Insight, 2000)
Forests Log Yard Logs de-barked
ChippingChip pileChip wash
Pre-heating Refining Resin andwax addition
Flashdrying
MattformingPre-pressingHot pressing
Sanding Trimming Grading andpackaging
Figure 7.3: A typical process for making MDF panels (Forestry Insight, 2002)
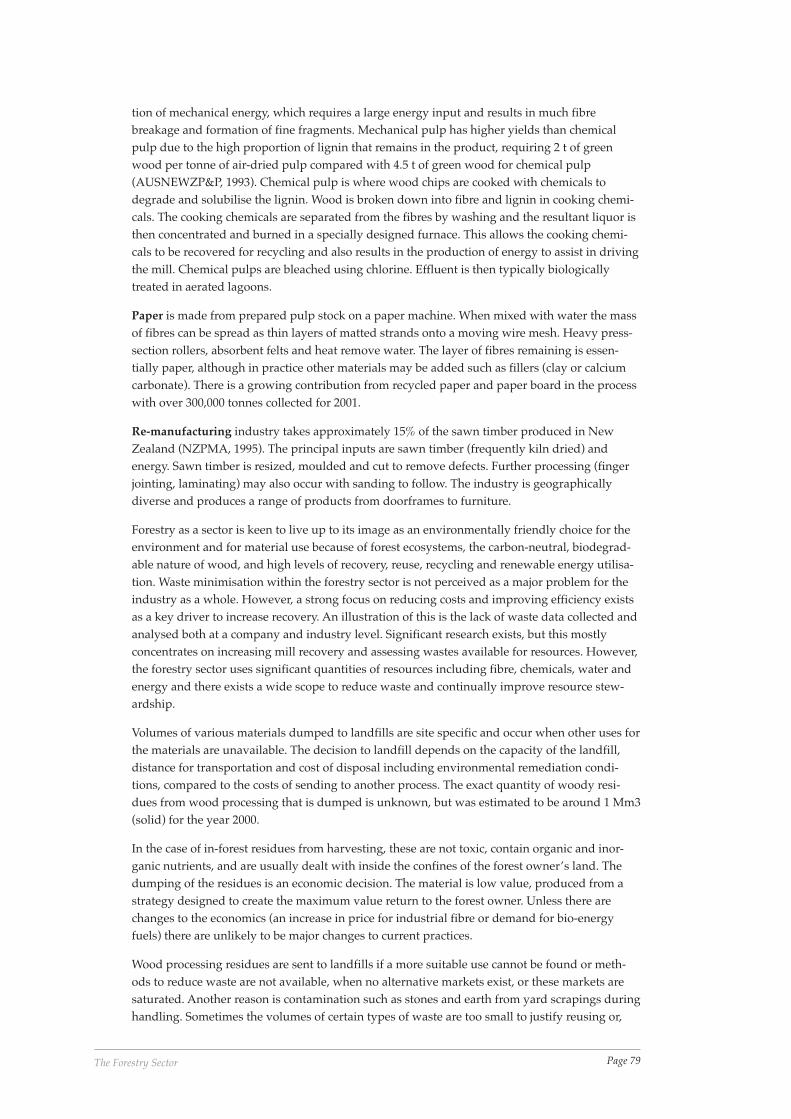
Page 79The Forestry Sector
tion of mechanical energy, which requires a large energy input and results in much fibrebreakage and formation of fine fragments. Mechanical pulp has higher yields than chemicalpulp due to the high proportion of lignin that remains in the product, requiring 2 t of greenwood per tonne of air-dried pulp compared with 4.5 t of green wood for chemical pulp(AUSNEWZP&P, 1993). Chemical pulp is where wood chips are cooked with chemicals todegrade and solubilise the lignin. Wood is broken down into fibre and lignin in cooking chemi-cals. The cooking chemicals are separated from the fibres by washing and the resultant liquor isthen concentrated and burned in a specially designed furnace. This allows the cooking chemi-cals to be recovered for recycling and also results in the production of energy to assist in drivingthe mill. Chemical pulps are bleached using chlorine. Effluent is then typically biologicallytreated in aerated lagoons.
Paper is made from prepared pulp stock on a paper machine. When mixed with water the massof fibres can be spread as thin layers of matted strands onto a moving wire mesh. Heavy press-section rollers, absorbent felts and heat remove water. The layer of fibres remaining is essen-tially paper, although in practice other materials may be added such as fillers (clay or calciumcarbonate). There is a growing contribution from recycled paper and paper board in the processwith over 300,000 tonnes collected for 2001.
Re-manufacturing industry takes approximately 15% of the sawn timber produced in NewZealand (NZPMA, 1995). The principal inputs are sawn timber (frequently kiln dried) andenergy. Sawn timber is resized, moulded and cut to remove defects. Further processing (fingerjointing, laminating) may also occur with sanding to follow. The industry is geographicallydiverse and produces a range of products from doorframes to furniture.
Forestry as a sector is keen to live up to its image as an environmentally friendly choice for theenvironment and for material use because of forest ecosystems, the carbon-neutral, biodegrad-able nature of wood, and high levels of recovery, reuse, recycling and renewable energy utilisa-tion. Waste minimisation within the forestry sector is not perceived as a major problem for theindustry as a whole. However, a strong focus on reducing costs and improving efficiency existsas a key driver to increase recovery. An illustration of this is the lack of waste data collected andanalysed both at a company and industry level. Significant research exists, but this mostlyconcentrates on increasing mill recovery and assessing wastes available for resources. However,the forestry sector uses significant quantities of resources including fibre, chemicals, water andenergy and there exists a wide scope to reduce waste and continually improve resource stew-ardship.
Volumes of various materials dumped to landfills are site specific and occur when other uses forthe materials are unavailable. The decision to landfill depends on the capacity of the landfill,distance for transportation and cost of disposal including environmental remediation condi-tions, compared to the costs of sending to another process. The exact quantity of woody resi-dues from wood processing that is dumped is unknown, but was estimated to be around 1 Mm3(solid) for the year 2000.
In the case of in-forest residues from harvesting, these are not toxic, contain organic and inor-ganic nutrients, and are usually dealt with inside the confines of the forest owner’s land. Thedumping of the residues is an economic decision. The material is low value, produced from astrategy designed to create the maximum value return to the forest owner. Unless there arechanges to the economics (an increase in price for industrial fibre or demand for bio-energyfuels) there are unlikely to be major changes to current practices.
Wood processing residues are sent to landfills if a more suitable use cannot be found or meth-ods to reduce waste are not available, when no alternative markets exist, or these markets aresaturated. Another reason is contamination such as stones and earth from yard scrapings duringhandling. Sometimes the volumes of certain types of waste are too small to justify reusing or,
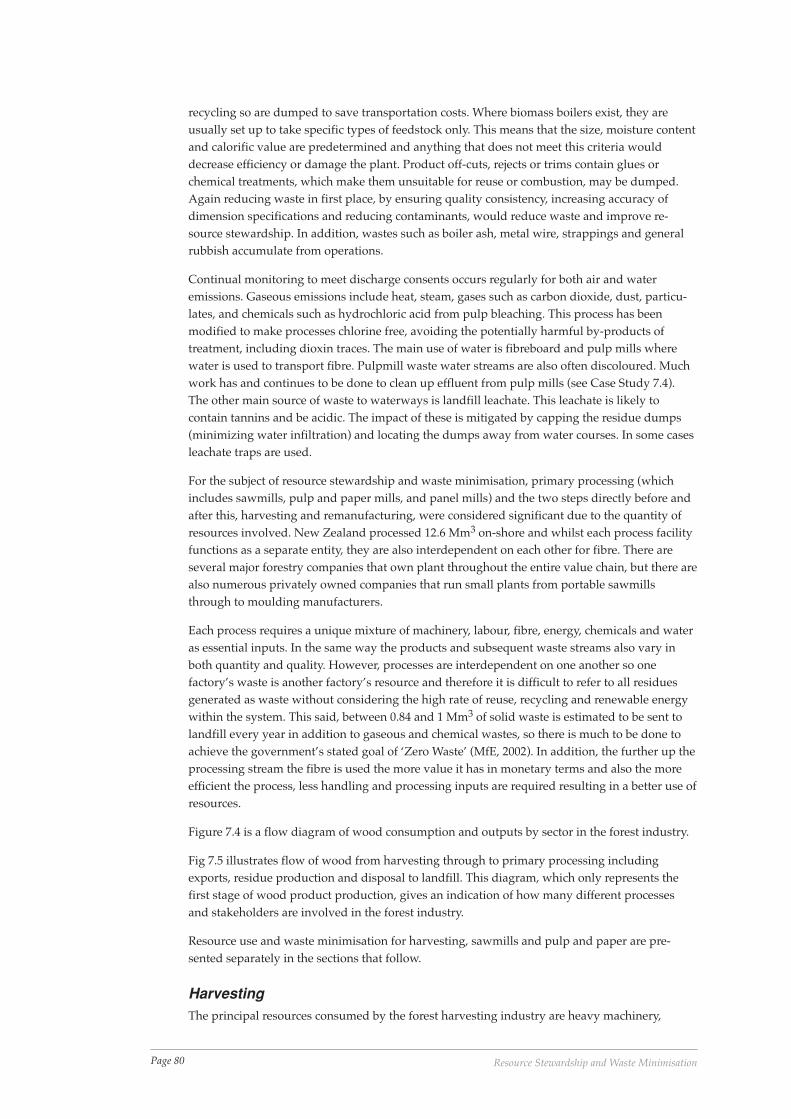
Page 80 Resource Stewardship and Waste Minimisation
recycling so are dumped to save transportation costs. Where biomass boilers exist, they areusually set up to take specific types of feedstock only. This means that the size, moisture contentand calorific value are predetermined and anything that does not meet this criteria woulddecrease efficiency or damage the plant. Product off-cuts, rejects or trims contain glues orchemical treatments, which make them unsuitable for reuse or combustion, may be dumped.Again reducing waste in first place, by ensuring quality consistency, increasing accuracy ofdimension specifications and reducing contaminants, would reduce waste and improve re-source stewardship. In addition, wastes such as boiler ash, metal wire, strappings and generalrubbish accumulate from operations.
Continual monitoring to meet discharge consents occurs regularly for both air and wateremissions. Gaseous emissions include heat, steam, gases such as carbon dioxide, dust, particu-lates, and chemicals such as hydrochloric acid from pulp bleaching. This process has beenmodified to make processes chlorine free, avoiding the potentially harmful by-products oftreatment, including dioxin traces. The main use of water is fibreboard and pulp mills wherewater is used to transport fibre. Pulpmill waste water streams are also often discoloured. Muchwork has and continues to be done to clean up effluent from pulp mills (see Case Study 7.4).The other main source of waste to waterways is landfill leachate. This leachate is likely tocontain tannins and be acidic. The impact of these is mitigated by capping the residue dumps(minimizing water infiltration) and locating the dumps away from water courses. In some casesleachate traps are used.
For the subject of resource stewardship and waste minimisation, primary processing (whichincludes sawmills, pulp and paper mills, and panel mills) and the two steps directly before andafter this, harvesting and remanufacturing, were considered significant due to the quantity ofresources involved. New Zealand processed 12.6 Mm3 on-shore and whilst each process facilityfunctions as a separate entity, they are also interdependent on each other for fibre. There areseveral major forestry companies that own plant throughout the entire value chain, but there arealso numerous privately owned companies that run small plants from portable sawmillsthrough to moulding manufacturers.
Each process requires a unique mixture of machinery, labour, fibre, energy, chemicals and wateras essential inputs. In the same way the products and subsequent waste streams also vary inboth quantity and quality. However, processes are interdependent on one another so onefactory’s waste is another factory’s resource and therefore it is difficult to refer to all residuesgenerated as waste without considering the high rate of reuse, recycling and renewable energywithin the system. This said, between 0.84 and 1 Mm3 of solid waste is estimated to be sent tolandfill every year in addition to gaseous and chemical wastes, so there is much to be done toachieve the government’s stated goal of ‘Zero Waste’ (MfE, 2002). In addition, the further up theprocessing stream the fibre is used the more value it has in monetary terms and also the moreefficient the process, less handling and processing inputs are required resulting in a better use ofresources.
Figure 7.4 is a flow diagram of wood consumption and outputs by sector in the forest industry.
Fig 7.5 illustrates flow of wood from harvesting through to primary processing includingexports, residue production and disposal to landfill. This diagram, which only represents thefirst stage of wood product production, gives an indication of how many different processesand stakeholders are involved in the forest industry.
Resource use and waste minimisation for harvesting, sawmills and pulp and paper are pre-sented separately in the sections that follow.
HarvestingThe principal resources consumed by the forest harvesting industry are heavy machinery,
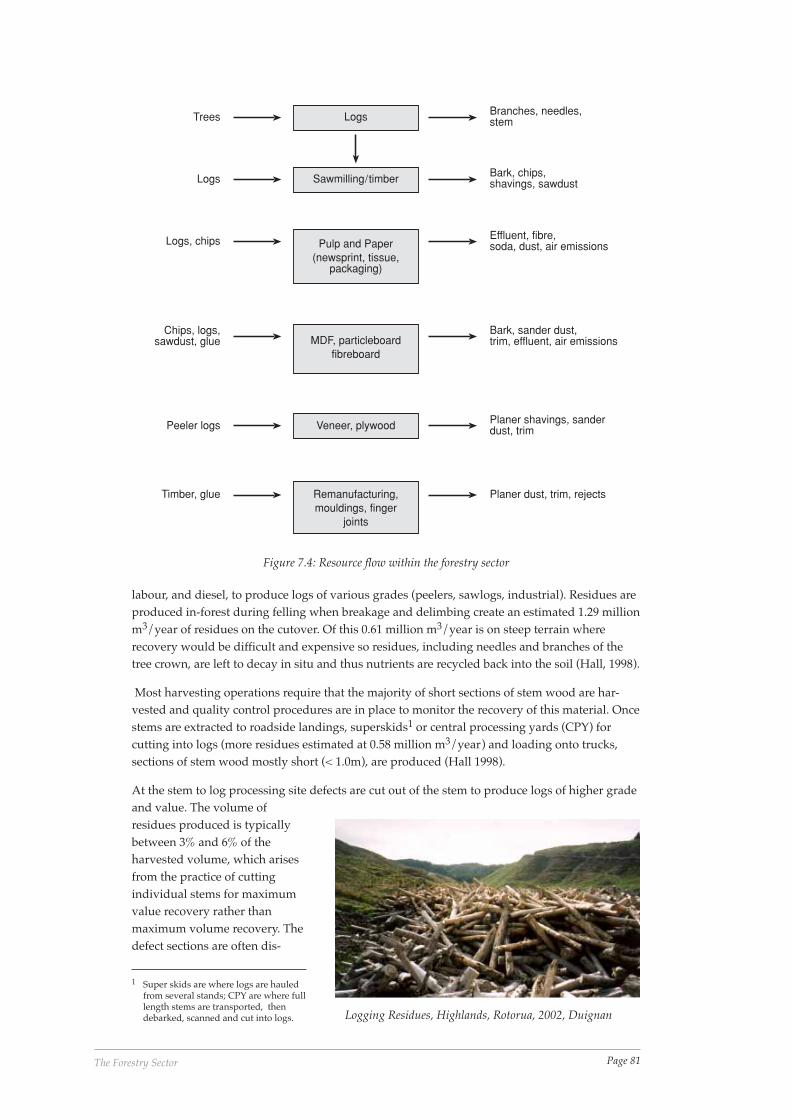
Page 81The Forestry Sector
labour, and diesel, to produce logs of various grades (peelers, sawlogs, industrial). Residues areproduced in-forest during felling when breakage and delimbing create an estimated 1.29 millionm3/year of residues on the cutover. Of this 0.61 million m3/year is on steep terrain whererecovery would be difficult and expensive so residues, including needles and branches of thetree crown, are left to decay in situ and thus nutrients are recycled back into the soil (Hall, 1998).
Most harvesting operations require that the majority of short sections of stem wood are har-vested and quality control procedures are in place to monitor the recovery of this material. Oncestems are extracted to roadside landings, superskids1 or central processing yards (CPY) forcutting into logs (more residues estimated at 0.58 million m3/year) and loading onto trucks,sections of stem wood mostly short (< 1.0m), are produced (Hall 1998).
At the stem to log processing site defects are cut out of the stem to produce logs of higher gradeand value. The volume ofresidues produced is typicallybetween 3% and 6% of theharvested volume, which arisesfrom the practice of cuttingindividual stems for maximumvalue recovery rather thanmaximum volume recovery. Thedefect sections are often dis-
Bark, chips,shavings, sawdust
Logs
Sawmilling/timber
Pulp and Paper(newsprint, tissue,
packaging)
MDF, particleboardfibreboard
Veneer, plywood
Remanufacturing,mouldings, finger
joints
Trees
Logs
Logs, chips
Chips, logs,sawdust, glue
Peeler logs
Timber, glue Planer dust, trim, rejects
Planer shavings, sanderdust, trim
Bark, sander dust,trim, effluent, air emissions
Effluent, fibre,soda, dust, air emissions
Branches, needles,stem
Figure 7.4: Resource flow within the forestry sector
Logging Residues, Highlands, Rotorua, 2002, Duignan
1 Super skids are where logs are hauledfrom several stands; CPY are where fulllength stems are transported, thendebarked, scanned and cut into logs.
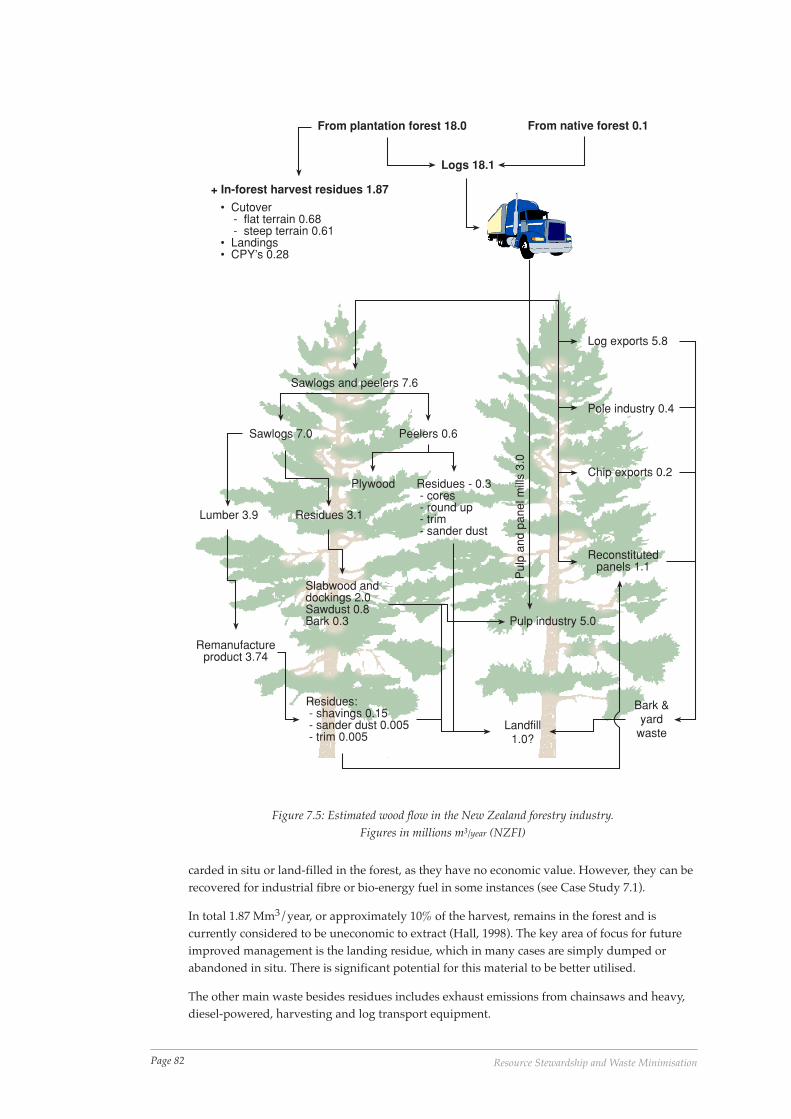
Page 82 Resource Stewardship and Waste Minimisation
From plantation forest 18.0 From native forest 0.1
Logs 18.1
+ In-forest harvest residues 1.87
• Cutover - flat terrain 0.68 - steep terrain 0.61 • Landings • CPY’s 0.28
Sawlogs and peelers 7.6
Sawlogs 7.0 Peelers 0.6
Lumber 3.9 Residues 3.1
Plywood Residues - 0.3 - cores - round up - trim - sander dust
Remanufactureproduct 3.74
Residues: - shavings 0.15 - sander dust 0.005 - trim 0.005
Slabwood anddockings 2.0Sawdust 0.8Bark 0.3
Log exports 5.8
Pole industry 0.4
Chip exports 0.2
Reconstitutedpanels 1.1
Bark &yard
wasteLandfill
1.0?
Pulp industry 5.0
Pul
p an
d pa
nel m
ills
3.0
Figure 7.5: Estimated wood flow in the New Zealand forestry industry.Figures in millions m3/year (NZFI)
carded in situ or land-filled in the forest, as they have no economic value. However, they can berecovered for industrial fibre or bio-energy fuel in some instances (see Case Study 7.1).
In total 1.87 Mm3/year, or approximately 10% of the harvest, remains in the forest and iscurrently considered to be uneconomic to extract (Hall, 1998). The key area of focus for futureimproved management is the landing residue, which in many cases are simply dumped orabandoned in situ. There is significant potential for this material to be better utilised.
The other main waste besides residues includes exhaust emissions from chainsaws and heavy,diesel-powered, harvesting and log transport equipment.
Page 83The Forestry Sector
SawmillsAll sawmills produce residues including wood chips, shavings, slabs, sawdust and bark. For2001, the amount of log input required to produce 1 m3 of rough sawn timber was 1.89 m3 or anefficiency of 53% for planted production forest, an increase of 4% from 1990. For natural forestsin 2001 the conversion rate is lower at 52% due to the predominance of hardwoods (MAF Stats,2002). The final destination of these residues depends on markets for fibre and fuel on their ownsite and at other processing plants. Many mills use sawdust and bark as fuel for boilers thatproduce predominantly heat and, at times, electricity to run the mill and this renewable energyoffers significant savings on disposal and energy costs. In addition biofuel is carbon neutral ifsourced from sustainably-managed forests as the carbon released on combustion as carbondioxide was absorbed by the tree during growth (Matthews, 2001).
Table 7.2 shows the destination of residues from sawmills by volume and illustrates improve-ments in sawmill efficiency in the last decade. Where no market exists for residues they aredumped to landfills. However, there was a 22% decrease in the amount of residues sent tolandfill despite a 60% increase in total volume of wood processed, as conversion increased andresidue markets increased for pulp mills etc (MAF Stats, 2000).
MDF productionMDF was introduced to New Zealand in 1976. New Zealand produces 875,000 cubic metresannually, less than 20 per cent of which is sold locally (BIS Shrapnel 2001). Predominant domes-tic uses include furniture, cabinetry, joinery, doors and it is estimated that MDF users accountfor 20%-30 % of furniture manufacturers, 60%-70 % of joiners and 90%-99 % of cabinet makers.There are four main manufacturers of MDF and increasingly their fibre input is sourced fromresidues, rather than chipping logs, which contributes to making MDF a recycled product.
Pulp and paperPulp and paper manufacturing produces a range of outputs to air, land and water especially if achemical pulp process is involved. Due to the large-scale nature of these plants and their highdemand for heat and steam, most of the residual material is used for fuel or recycled back asraw materials. Recycling of water, fibre, chemicals and the calorific value of the spent cookingliquor from the Kraft Recovery process is a critical practice in pulp mills as the chemical processis economically dependent on the recovery of chemicals. Technical problems, however, such assilica content of the liquor, sometimes set a limit to the possibilities of closure of the mill
Case Study 7.1: Fibre Recovery Limited — Kaingaroa ForestKaingaroa is a large (149,000 hectare) mature forest in the central North Island. Harvestingpractices have changed, from stem to log processing at individual landing scatteredthroughout the forest to central processing yards where up to 900,000 m3 per annum isprocessed. Consequently stem wood residues are produced in significant volumes (20,000m3 per annum) at a single location. In situ dumping of the residues was not possible so asystem was developed to create a range of products from the stem wood residues. The stemwood residues are segregated by length. The longer sections are debarked and chipped tocreate a feed stock suitable for pulp chip.
The shorter sections are fed into a large tub-grinder, screened for fines and oversize and theresulting product is suitable feedstock (flake) for particleboard plants. The fines anddebarker waste can be mixed and sold as boiler fuel. Keys to this operation are the scale ofthe harvesting operations and the ability to transport some of the material in oversize trucksand local demand for all three products.
Alastair Deakin. Fletcher Challenge Forest
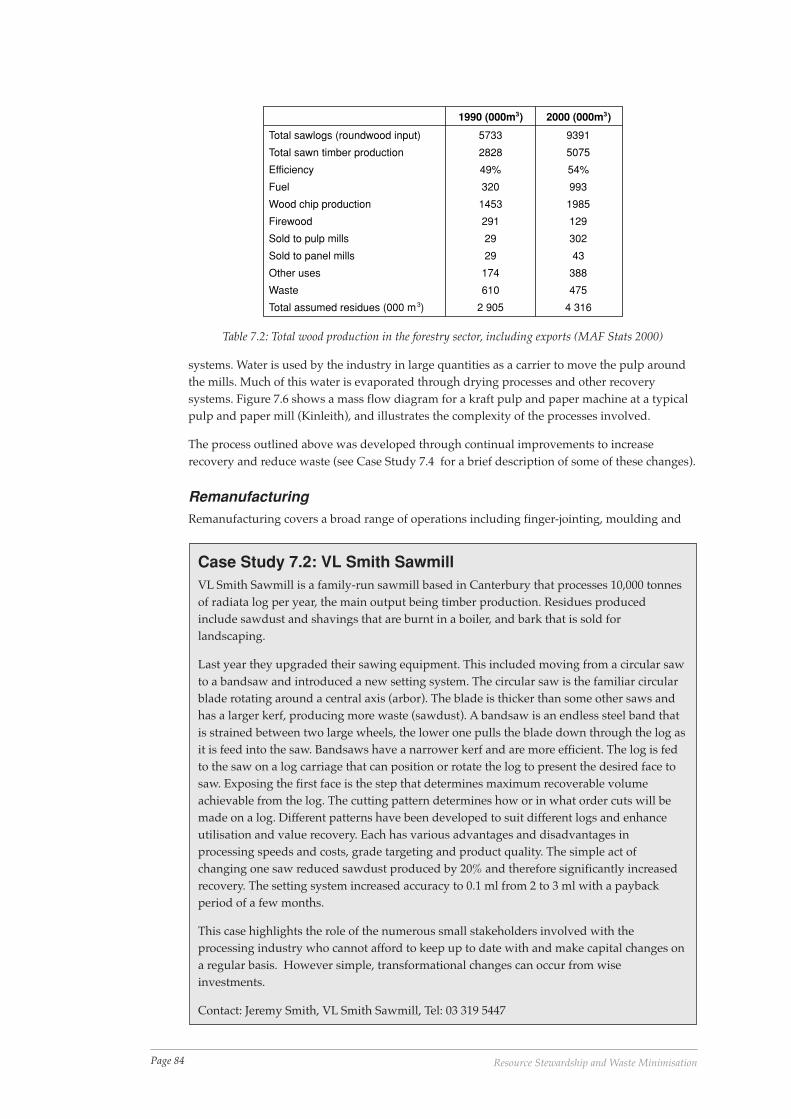
Page 84 Resource Stewardship and Waste Minimisation
systems. Water is used by the industry in large quantities as a carrier to move the pulp aroundthe mills. Much of this water is evaporated through drying processes and other recoverysystems. Figure 7.6 shows a mass flow diagram for a kraft pulp and paper machine at a typicalpulp and paper mill (Kinleith), and illustrates the complexity of the processes involved.
The process outlined above was developed through continual improvements to increaserecovery and reduce waste (see Case Study 7.4 for a brief description of some of these changes).
RemanufacturingRemanufacturing covers a broad range of operations including finger-jointing, moulding and
1990 (000m3) 2000 (000m3)
Total sawlogs (roundwood input) 5733 9391
Total sawn timber production 2828 5075
Efficiency 49% 54%
Fuel 320 993
Wood chip production 1453 1985
Firewood 291 129
Sold to pulp mills 29 302
Sold to panel mills 29 43
Other uses 174 388
Waste 610 475
Total assumed residues (000 m3) 2 905 4 316
Table 7.2: Total wood production in the forestry sector, including exports (MAF Stats 2000)
Case Study 7.2: VL Smith SawmillVL Smith Sawmill is a family-run sawmill based in Canterbury that processes 10,000 tonnesof radiata log per year, the main output being timber production. Residues producedinclude sawdust and shavings that are burnt in a boiler, and bark that is sold forlandscaping.
Last year they upgraded their sawing equipment. This included moving from a circular sawto a bandsaw and introduced a new setting system. The circular saw is the familiar circularblade rotating around a central axis (arbor). The blade is thicker than some other saws andhas a larger kerf, producing more waste (sawdust). A bandsaw is an endless steel band thatis strained between two large wheels, the lower one pulls the blade down through the log asit is feed into the saw. Bandsaws have a narrower kerf and are more efficient. The log is fedto the saw on a log carriage that can position or rotate the log to present the desired face tosaw. Exposing the first face is the step that determines maximum recoverable volumeachievable from the log. The cutting pattern determines how or in what order cuts will bemade on a log. Different patterns have been developed to suit different logs and enhanceutilisation and value recovery. Each has various advantages and disadvantages inprocessing speeds and costs, grade targeting and product quality. The simple act ofchanging one saw reduced sawdust produced by 20% and therefore significantly increasedrecovery. The setting system increased accuracy to 0.1 ml from 2 to 3 ml with a paybackperiod of a few months.
This case highlights the role of the numerous small stakeholders involved with theprocessing industry who cannot afford to keep up to date with and make capital changes ona regular basis. However simple, transformational changes can occur from wiseinvestments.
Contact: Jeremy Smith, VL Smith Sawmill, Tel: 03 319 5447
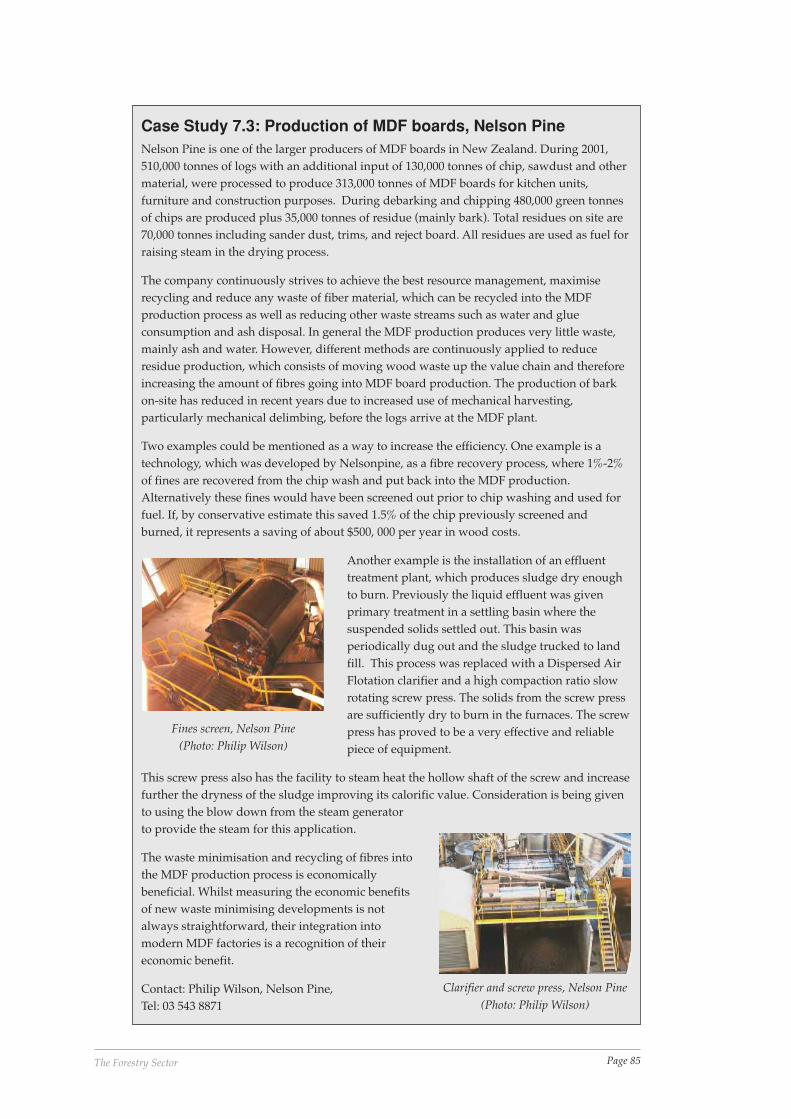
Page 85The Forestry Sector
Case Study 7.3: Production of MDF boards, Nelson PineNelson Pine is one of the larger producers of MDF boards in New Zealand. During 2001,510,000 tonnes of logs with an additional input of 130,000 tonnes of chip, sawdust and othermaterial, were processed to produce 313,000 tonnes of MDF boards for kitchen units,furniture and construction purposes. During debarking and chipping 480,000 green tonnesof chips are produced plus 35,000 tonnes of residue (mainly bark). Total residues on site are70,000 tonnes including sander dust, trims, and reject board. All residues are used as fuel forraising steam in the drying process.
The company continuously strives to achieve the best resource management, maximiserecycling and reduce any waste of fiber material, which can be recycled into the MDFproduction process as well as reducing other waste streams such as water and glueconsumption and ash disposal. In general the MDF production produces very little waste,mainly ash and water. However, different methods are continuously applied to reduceresidue production, which consists of moving wood waste up the value chain and thereforeincreasing the amount of fibres going into MDF board production. The production of barkon-site has reduced in recent years due to increased use of mechanical harvesting,particularly mechanical delimbing, before the logs arrive at the MDF plant.
Two examples could be mentioned as a way to increase the efficiency. One example is atechnology, which was developed by Nelsonpine, as a fibre recovery process, where 1%-2%of fines are recovered from the chip wash and put back into the MDF production.Alternatively these fines would have been screened out prior to chip washing and used forfuel. If, by conservative estimate this saved 1.5% of the chip previously screened andburned, it represents a saving of about $500, 000 per year in wood costs.
Another example is the installation of an effluenttreatment plant, which produces sludge dry enoughto burn. Previously the liquid effluent was givenprimary treatment in a settling basin where thesuspended solids settled out. This basin wasperiodically dug out and the sludge trucked to landfill. This process was replaced with a Dispersed AirFlotation clarifier and a high compaction ratio slowrotating screw press. The solids from the screw pressare sufficiently dry to burn in the furnaces. The screwpress has proved to be a very effective and reliablepiece of equipment.
This screw press also has the facility to steam heat the hollow shaft of the screw and increasefurther the dryness of the sludge improving its calorific value. Consideration is being givento using the blow down from the steam generatorto provide the steam for this application.
The waste minimisation and recycling of fibres intothe MDF production process is economicallybeneficial. Whilst measuring the economic benefitsof new waste minimising developments is notalways straightforward, their integration intomodern MDF factories is a recognition of theireconomic benefit.
Contact: Philip Wilson, Nelson Pine,Tel: 03 543 8871
Fines screen, Nelson Pine(Photo: Philip Wilson)
Clarifier and screw press, Nelson Pine(Photo: Philip Wilson)
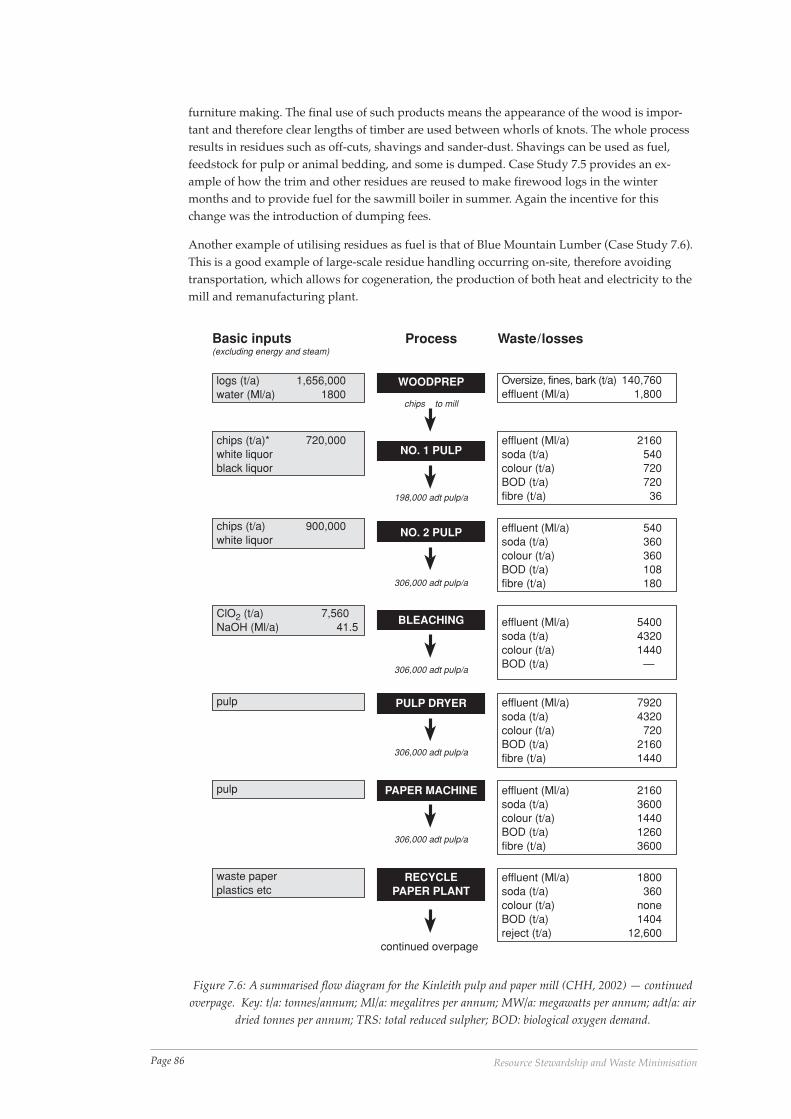
Page 86 Resource Stewardship and Waste Minimisation
furniture making. The final use of such products means the appearance of the wood is impor-tant and therefore clear lengths of timber are used between whorls of knots. The whole processresults in residues such as off-cuts, shavings and sander-dust. Shavings can be used as fuel,feedstock for pulp or animal bedding, and some is dumped. Case Study 7.5 provides an ex-ample of how the trim and other residues are reused to make firewood logs in the wintermonths and to provide fuel for the sawmill boiler in summer. Again the incentive for thischange was the introduction of dumping fees.
Another example of utilising residues as fuel is that of Blue Mountain Lumber (Case Study 7.6).This is a good example of large-scale residue handling occurring on-site, therefore avoidingtransportation, which allows for cogeneration, the production of both heat and electricity to themill and remanufacturing plant.
logs (t/a) 1,656,000water (Ml/a) 1800
chips (t/a)* 720,000white liquorblack liquor
chips (t/a) 900,000white liquor
ClO2 (t/a) 7,560NaOH (Ml/a) 41.5
pulp
pulp
waste paperplastics etc
Oversize, fines, bark (t/a) 140,760effluent (Ml/a) 1,800
effluent (Ml/a) 2160soda (t/a) 540colour (t/a) 720BOD (t/a) 720fibre (t/a) 36
effluent (Ml/a) 540soda (t/a) 360colour (t/a) 360BOD (t/a) 108fibre (t/a) 180
effluent (Ml/a) 5400soda (t/a) 4320colour (t/a) 1440BOD (t/a) —
effluent (Ml/a) 7920soda (t/a) 4320colour (t/a) 720BOD (t/a) 2160fibre (t/a) 1440
effluent (Ml/a) 2160soda (t/a) 3600colour (t/a) 1440BOD (t/a) 1260fibre (t/a) 3600
effluent (Ml/a) 1800soda (t/a) 360colour (t/a) noneBOD (t/a) 1404reject (t/a) 12,600
WOODPREP
NO. 1 PULP
NO. 2 PULP
BLEACHING
PULP DRYER
PAPER MACHINE
RECYCLEPAPER PLANT
chips to mill
198,000 adt pulp/a
306,000 adt pulp/a
306,000 adt pulp/a
306,000 adt pulp/a
306,000 adt pulp/a
Basic inputs(excluding energy and steam)
Process Waste/losses
continued overpage
Figure 7.6: A summarised flow diagram for the Kinleith pulp and paper mill (CHH, 2002) — continuedoverpage. Key: t/a: tonnes/annum; Ml/a: megalitres per annum; MW/a: megawatts per annum; adt/a: air
dried tonnes per annum; TRS: total reduced sulpher; BOD: biological oxygen demand.
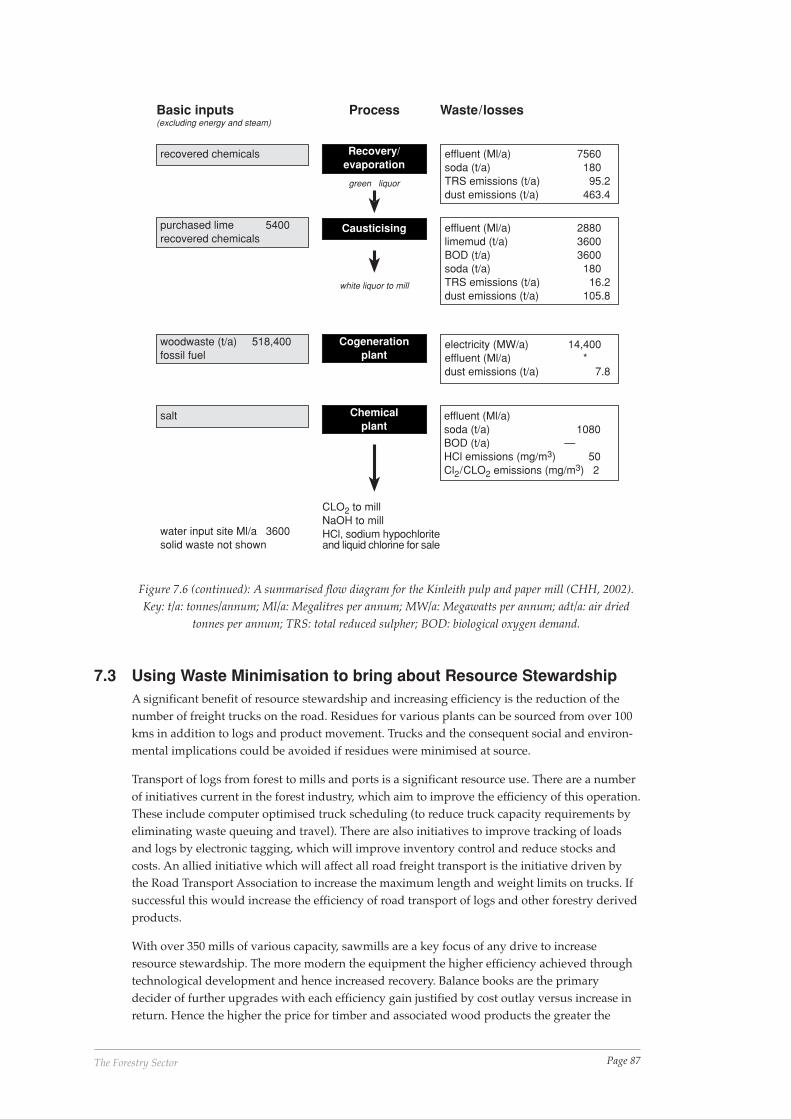
Page 87The Forestry Sector
7.3 Using Waste Minimisation to bring about Resource StewardshipA significant benefit of resource stewardship and increasing efficiency is the reduction of thenumber of freight trucks on the road. Residues for various plants can be sourced from over 100kms in addition to logs and product movement. Trucks and the consequent social and environ-mental implications could be avoided if residues were minimised at source.
Transport of logs from forest to mills and ports is a significant resource use. There are a numberof initiatives current in the forest industry, which aim to improve the efficiency of this operation.These include computer optimised truck scheduling (to reduce truck capacity requirements byeliminating waste queuing and travel). There are also initiatives to improve tracking of loadsand logs by electronic tagging, which will improve inventory control and reduce stocks andcosts. An allied initiative which will affect all road freight transport is the initiative driven bythe Road Transport Association to increase the maximum length and weight limits on trucks. Ifsuccessful this would increase the efficiency of road transport of logs and other forestry derivedproducts.
With over 350 mills of various capacity, sawmills are a key focus of any drive to increaseresource stewardship. The more modern the equipment the higher efficiency achieved throughtechnological development and hence increased recovery. Balance books are the primarydecider of further upgrades with each efficiency gain justified by cost outlay versus increase inreturn. Hence the higher the price for timber and associated wood products the greater the
effluent (Ml/a) 7560soda (t/a) 180TRS emissions (t/a) 95.2dust emissions (t/a) 463.4
effluent (Ml/a) 2880limemud (t/a) 3600BOD (t/a) 3600soda (t/a) 180TRS emissions (t/a) 16.2dust emissions (t/a) 105.8
electricity (MW/a) 14,400effluent (Ml/a) *dust emissions (t/a) 7.8
effluent (Ml/a)soda (t/a) 1080BOD (t/a) —HCl emissions (mg/m3) 50Cl2/CLO2 emissions (mg/m3) 2
recovered chemicals
purchased lime 5400recovered chemicals
woodwaste (t/a) 518,400fossil fuel
salt
water input site Ml/a 3600solid waste not shown
Recovery/evaporation
Causticising
Cogenerationplant
Chemicalplant
Process Waste/lossesBasic inputs(excluding energy and steam)
green liquor
white liquor to mill
CLO2 to millNaOH to millHCl, sodium hypochloriteand liquid chlorine for sale
Figure 7.6 (continued): A summarised flow diagram for the Kinleith pulp and paper mill (CHH, 2002).Key: t/a: tonnes/annum; Ml/a: Megalitres per annum; MW/a: Megawatts per annum; adt/a: air dried
tonnes per annum; TRS: total reduced sulpher; BOD: biological oxygen demand.
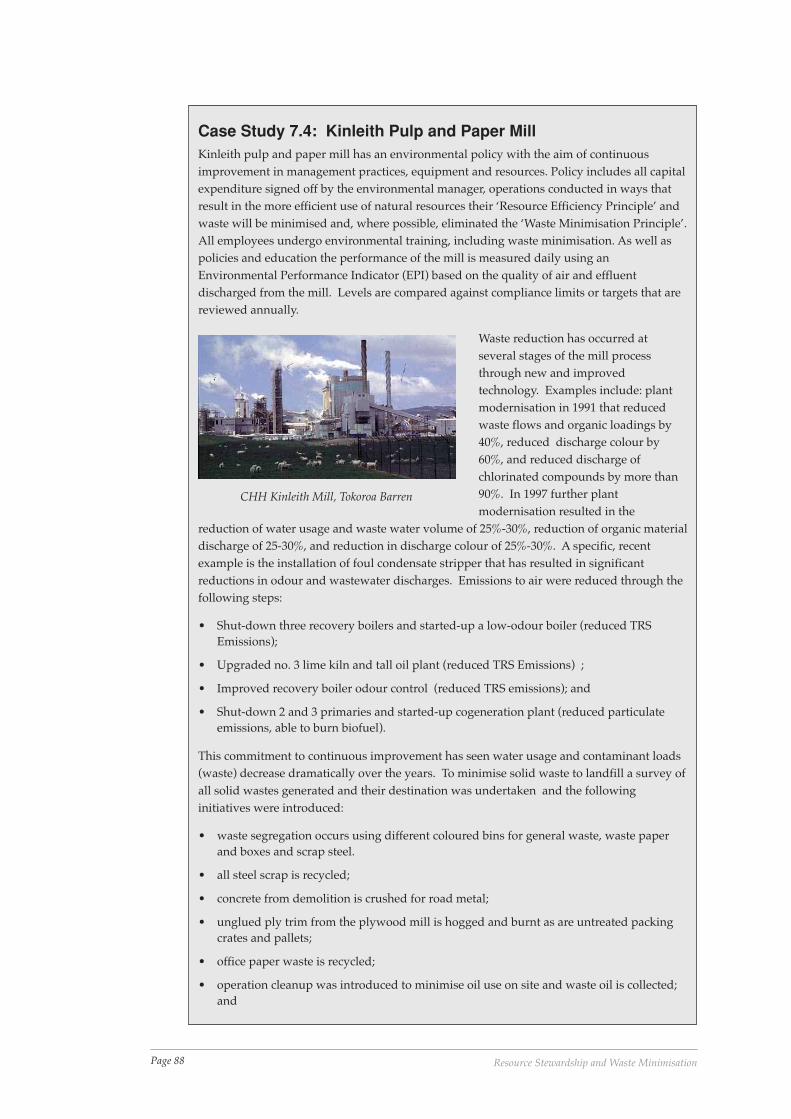
Page 88 Resource Stewardship and Waste Minimisation
Case Study 7.4: Kinleith Pulp and Paper MillKinleith pulp and paper mill has an environmental policy with the aim of continuousimprovement in management practices, equipment and resources. Policy includes all capitalexpenditure signed off by the environmental manager, operations conducted in ways thatresult in the more efficient use of natural resources their ‘Resource Efficiency Principle’ andwaste will be minimised and, where possible, eliminated the ‘Waste Minimisation Principle’.All employees undergo environmental training, including waste minimisation. As well aspolicies and education the performance of the mill is measured daily using anEnvironmental Performance Indicator (EPI) based on the quality of air and effluentdischarged from the mill. Levels are compared against compliance limits or targets that arereviewed annually.
Waste reduction has occurred atseveral stages of the mill processthrough new and improvedtechnology. Examples include: plantmodernisation in 1991 that reducedwaste flows and organic loadings by40%, reduced discharge colour by60%, and reduced discharge ofchlorinated compounds by more than90%. In 1997 further plantmodernisation resulted in the
reduction of water usage and waste water volume of 25%-30%, reduction of organic materialdischarge of 25-30%, and reduction in discharge colour of 25%-30%. A specific, recentexample is the installation of foul condensate stripper that has resulted in significantreductions in odour and wastewater discharges. Emissions to air were reduced through thefollowing steps:
• Shut-down three recovery boilers and started-up a low-odour boiler (reduced TRSEmissions);
• Upgraded no. 3 lime kiln and tall oil plant (reduced TRS Emissions) ;
• Improved recovery boiler odour control (reduced TRS emissions); and
• Shut-down 2 and 3 primaries and started-up cogeneration plant (reduced particulateemissions, able to burn biofuel).
This commitment to continuous improvement has seen water usage and contaminant loads(waste) decrease dramatically over the years. To minimise solid waste to landfill a survey ofall solid wastes generated and their destination was undertaken and the followinginitiatives were introduced:
• waste segregation occurs using different coloured bins for general waste, waste paperand boxes and scrap steel.
• all steel scrap is recycled;
• concrete from demolition is crushed for road metal;
• unglued ply trim from the plywood mill is hogged and burnt as are untreated packingcrates and pallets;
• office paper waste is recycled;
• operation cleanup was introduced to minimise oil use on site and waste oil is collected;and
CHH Kinleith Mill, Tokoroa Barren
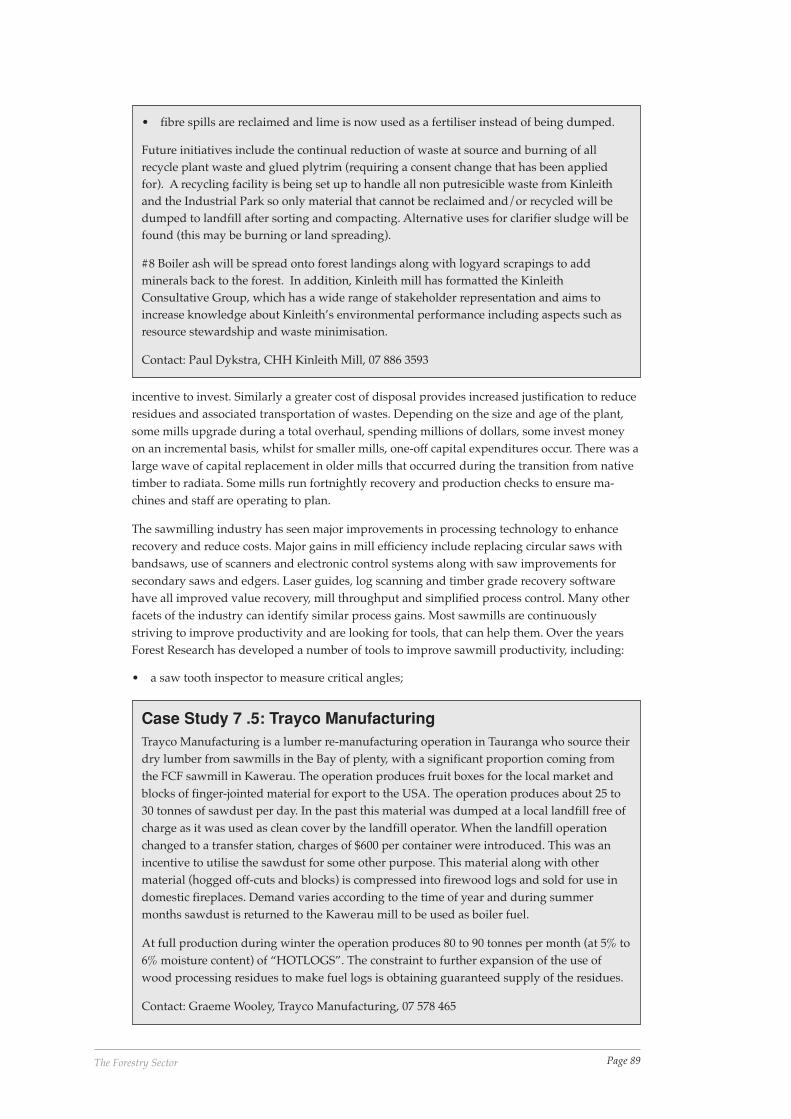
Page 89The Forestry Sector
incentive to invest. Similarly a greater cost of disposal provides increased justification to reduceresidues and associated transportation of wastes. Depending on the size and age of the plant,some mills upgrade during a total overhaul, spending millions of dollars, some invest moneyon an incremental basis, whilst for smaller mills, one-off capital expenditures occur. There was alarge wave of capital replacement in older mills that occurred during the transition from nativetimber to radiata. Some mills run fortnightly recovery and production checks to ensure ma-chines and staff are operating to plan.
The sawmilling industry has seen major improvements in processing technology to enhancerecovery and reduce costs. Major gains in mill efficiency include replacing circular saws withbandsaws, use of scanners and electronic control systems along with saw improvements forsecondary saws and edgers. Laser guides, log scanning and timber grade recovery softwarehave all improved value recovery, mill throughput and simplified process control. Many otherfacets of the industry can identify similar process gains. Most sawmills are continuouslystriving to improve productivity and are looking for tools, that can help them. Over the yearsForest Research has developed a number of tools to improve sawmill productivity, including:
• a saw tooth inspector to measure critical angles;
• fibre spills are reclaimed and lime is now used as a fertiliser instead of being dumped.
Future initiatives include the continual reduction of waste at source and burning of allrecycle plant waste and glued plytrim (requiring a consent change that has been appliedfor). A recycling facility is being set up to handle all non putresicible waste from Kinleithand the Industrial Park so only material that cannot be reclaimed and/or recycled will bedumped to landfill after sorting and compacting. Alternative uses for clarifier sludge will befound (this may be burning or land spreading).
#8 Boiler ash will be spread onto forest landings along with logyard scrapings to addminerals back to the forest. In addition, Kinleith mill has formatted the KinleithConsultative Group, which has a wide range of stakeholder representation and aims toincrease knowledge about Kinleith’s environmental performance including aspects such asresource stewardship and waste minimisation.
Contact: Paul Dykstra, CHH Kinleith Mill, 07 886 3593
Case Study 7 .5: Trayco ManufacturingTrayco Manufacturing is a lumber re-manufacturing operation in Tauranga who source theirdry lumber from sawmills in the Bay of plenty, with a significant proportion coming fromthe FCF sawmill in Kawerau. The operation produces fruit boxes for the local market andblocks of finger-jointed material for export to the USA. The operation produces about 25 to30 tonnes of sawdust per day. In the past this material was dumped at a local landfill free ofcharge as it was used as clean cover by the landfill operator. When the landfill operationchanged to a transfer station, charges of $600 per container were introduced. This was anincentive to utilise the sawdust for some other purpose. This material along with othermaterial (hogged off-cuts and blocks) is compressed into firewood logs and sold for use indomestic fireplaces. Demand varies according to the time of year and during summermonths sawdust is returned to the Kawerau mill to be used as boiler fuel.
At full production during winter the operation produces 80 to 90 tonnes per month (at 5% to6% moisture content) of “HOTLOGS”. The constraint to further expansion of the use ofwood processing residues to make fuel logs is obtaining guaranteed supply of the residues.
Contact: Graeme Wooley, Trayco Manufacturing, 07 578 465
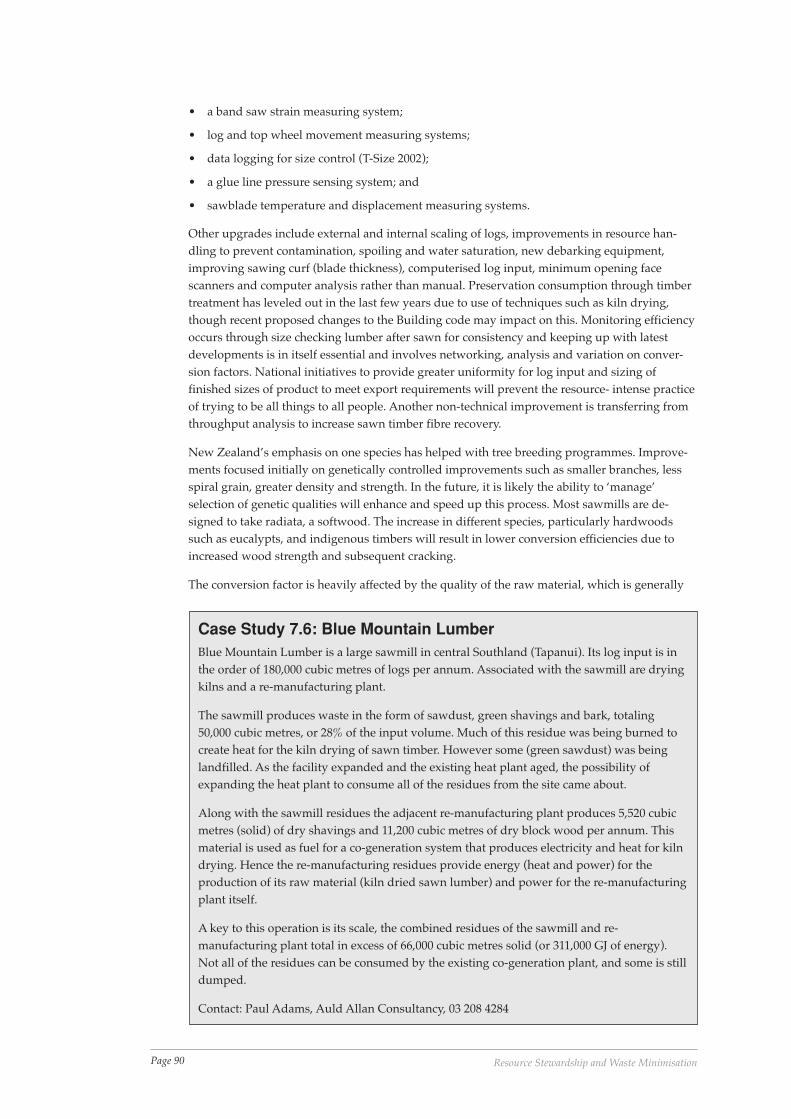
Page 90 Resource Stewardship and Waste Minimisation
• a band saw strain measuring system;
• log and top wheel movement measuring systems;
• data logging for size control (T-Size 2002);
• a glue line pressure sensing system; and
• sawblade temperature and displacement measuring systems.
Other upgrades include external and internal scaling of logs, improvements in resource han-dling to prevent contamination, spoiling and water saturation, new debarking equipment,improving sawing curf (blade thickness), computerised log input, minimum opening facescanners and computer analysis rather than manual. Preservation consumption through timbertreatment has leveled out in the last few years due to use of techniques such as kiln drying,though recent proposed changes to the Building code may impact on this. Monitoring efficiencyoccurs through size checking lumber after sawn for consistency and keeping up with latestdevelopments is in itself essential and involves networking, analysis and variation on conver-sion factors. National initiatives to provide greater uniformity for log input and sizing offinished sizes of product to meet export requirements will prevent the resource- intense practiceof trying to be all things to all people. Another non-technical improvement is transferring fromthroughput analysis to increase sawn timber fibre recovery.
New Zealand’s emphasis on one species has helped with tree breeding programmes. Improve-ments focused initially on genetically controlled improvements such as smaller branches, lessspiral grain, greater density and strength. In the future, it is likely the ability to ‘manage’selection of genetic qualities will enhance and speed up this process. Most sawmills are de-signed to take radiata, a softwood. The increase in different species, particularly hardwoodssuch as eucalypts, and indigenous timbers will result in lower conversion efficiencies due toincreased wood strength and subsequent cracking.
The conversion factor is heavily affected by the quality of the raw material, which is generally
Case Study 7.6: Blue Mountain LumberBlue Mountain Lumber is a large sawmill in central Southland (Tapanui). Its log input is inthe order of 180,000 cubic metres of logs per annum. Associated with the sawmill are dryingkilns and a re-manufacturing plant.
The sawmill produces waste in the form of sawdust, green shavings and bark, totaling50,000 cubic metres, or 28% of the input volume. Much of this residue was being burned tocreate heat for the kiln drying of sawn timber. However some (green sawdust) was beinglandfilled. As the facility expanded and the existing heat plant aged, the possibility ofexpanding the heat plant to consume all of the residues from the site came about.
Along with the sawmill residues the adjacent re-manufacturing plant produces 5,520 cubicmetres (solid) of dry shavings and 11,200 cubic metres of dry block wood per annum. Thismaterial is used as fuel for a co-generation system that produces electricity and heat for kilndrying. Hence the re-manufacturing residues provide energy (heat and power) for theproduction of its raw material (kiln dried sawn lumber) and power for the re-manufacturingplant itself.
A key to this operation is its scale, the combined residues of the sawmill and re-manufacturing plant total in excess of 66,000 cubic metres solid (or 311,000 GJ of energy).Not all of the residues can be consumed by the existing co-generation plant, and some is stilldumped.
Contact: Paul Adams, Auld Allan Consultancy, 03 208 4284
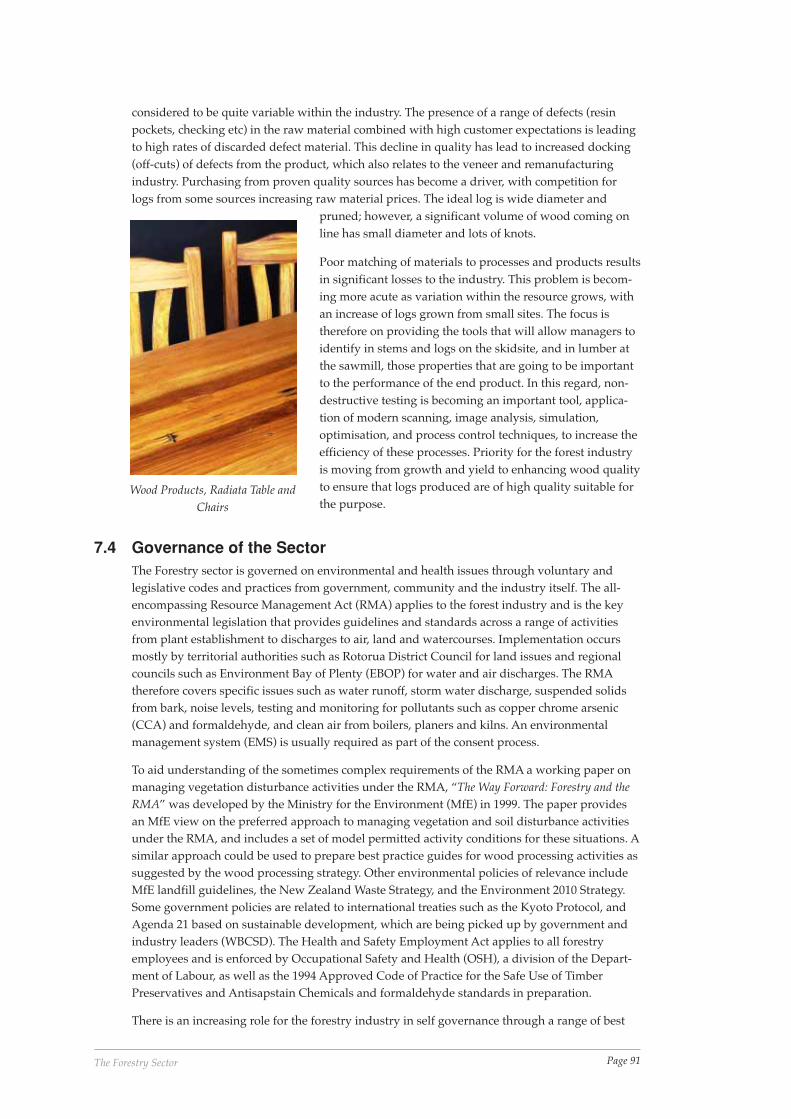
Page 91The Forestry Sector
considered to be quite variable within the industry. The presence of a range of defects (resinpockets, checking etc) in the raw material combined with high customer expectations is leadingto high rates of discarded defect material. This decline in quality has lead to increased docking(off-cuts) of defects from the product, which also relates to the veneer and remanufacturingindustry. Purchasing from proven quality sources has become a driver, with competition forlogs from some sources increasing raw material prices. The ideal log is wide diameter and
pruned; however, a significant volume of wood coming online has small diameter and lots of knots.
Poor matching of materials to processes and products resultsin significant losses to the industry. This problem is becom-ing more acute as variation within the resource grows, withan increase of logs grown from small sites. The focus istherefore on providing the tools that will allow managers toidentify in stems and logs on the skidsite, and in lumber atthe sawmill, those properties that are going to be importantto the performance of the end product. In this regard, non-destructive testing is becoming an important tool, applica-tion of modern scanning, image analysis, simulation,optimisation, and process control techniques, to increase theefficiency of these processes. Priority for the forest industryis moving from growth and yield to enhancing wood qualityto ensure that logs produced are of high quality suitable forthe purpose.
7.4 Governance of the SectorThe Forestry sector is governed on environmental and health issues through voluntary andlegislative codes and practices from government, community and the industry itself. The all-encompassing Resource Management Act (RMA) applies to the forest industry and is the keyenvironmental legislation that provides guidelines and standards across a range of activitiesfrom plant establishment to discharges to air, land and watercourses. Implementation occursmostly by territorial authorities such as Rotorua District Council for land issues and regionalcouncils such as Environment Bay of Plenty (EBOP) for water and air discharges. The RMAtherefore covers specific issues such as water runoff, storm water discharge, suspended solidsfrom bark, noise levels, testing and monitoring for pollutants such as copper chrome arsenic(CCA) and formaldehyde, and clean air from boilers, planers and kilns. An environmentalmanagement system (EMS) is usually required as part of the consent process.
To aid understanding of the sometimes complex requirements of the RMA a working paper onmanaging vegetation disturbance activities under the RMA, “The Way Forward: Forestry and theRMA” was developed by the Ministry for the Environment (MfE) in 1999. The paper providesan MfE view on the preferred approach to managing vegetation and soil disturbance activitiesunder the RMA, and includes a set of model permitted activity conditions for these situations. Asimilar approach could be used to prepare best practice guides for wood processing activities assuggested by the wood processing strategy. Other environmental policies of relevance includeMfE landfill guidelines, the New Zealand Waste Strategy, and the Environment 2010 Strategy.Some government policies are related to international treaties such as the Kyoto Protocol, andAgenda 21 based on sustainable development, which are being picked up by government andindustry leaders (WBCSD). The Health and Safety Employment Act applies to all forestryemployees and is enforced by Occupational Safety and Health (OSH), a division of the Depart-ment of Labour, as well as the 1994 Approved Code of Practice for the Safe Use of TimberPreservatives and Antisapstain Chemicals and formaldehyde standards in preparation.
There is an increasing role for the forestry industry in self governance through a range of best
Wood Products, Radiata Table andChairs
Page 92 Resource Stewardship and Waste Minimisation
practice and operations guidelines such as New Zealand Forest Code of Practice, and NewZealand Forest Accord. Forest Industries Training produce several operations guidelinesincluding cable logging, ground-based logging, tree felling, land preparation, and forestroading manual. Industry groups such as the Pine Manufacturers Association (NZPMA) andthe Timber Industry Federation (TIF) liaise closely with members to ensure quality standardsare maintained. For example TIF recommend standards across the industry including gradesizes and pack sizes, to ensure mills are producing the same product to the same standard.There are significant gains from uniform practices such as using the same measurement units.For example, clearwood, best quality timber is exported to the US and specifications are there-fore in feet where as other measurements are in metres.
New Zealand is an active participant in the Montreal Process. The Montreal Process is theWorking Group on Criteria and Indicators for the Conservation and Sustainable Management ofTemperate and Boreal Forests. It was formed in Geneva, Switzerland, in June 1994 to developand implement internationally agreed criteria and indicators for the conservation and sustain-able management of temperate and boreal forests. As a guarantee of environmental perfor-mance, many companies have also sought some form of forest certification, which demonstratesthat their forest management operations do not cause irrevocable harm to our land, air, waterand wildlife, and respects community interests and cultural heritage. Forest StewardshipCouncil certification applies to the majority of forestry companies in New Zealand. Principle 5,Criterion 3, states forest management should minimise waste associated with harvesting andon-site processing operations and avoid damage to other forest resources (FSC, 1998). Appendix1 contains the full text of the FSC Principles and Criteria. There are also provisions for reducingthe amount of chemicals applied and safe removal of waste oil and chemicals. Forest Certifica-tion is of particular importance for native logging practises such as Silver Beech harvesting onthe West Coast.
In addition, the public at large continue to be involved in setting environmental standardsthrough local community and Iwi consultation for RMA applications, and general expectationsfrom neighbours and tourists on issues such as odour and visual waste. Industries such as thepulp and paper industry, which are often identified as major sources of pollution, are the targetof a lot of public concern. Increasingly stakeholder pressure is concentrating on the environ-mental and social performance of companies.
7.5 Drivers for Change within the SectorA key driver for change is the price of wood at an international commodity level. As a primaryprocessing industry, forestry is dependent on fluctuating prices driven by off-shore demand andcurrency exchange rate. If these combine to push prices for logs, chip and pulp up, resourcestewardship becomes more critical. To maintain competitiveness there is a continual drive toimprove efficiency and quality performance, and to reduce waste and close systems. Verycompetitive markets are driving the improvements in efficiency, with relative log prices andcosts perceived to increase whilst sawn timber price remains static, therefore owner operatorsare always looking at better ways of doing things. Another driver for change within the sector isthe application of awareness of fibre recovery to other inputs such as chemicals and energy andachievement of waste minimization through improved conversion rates.
So, while the major driver of waste minimisation is economic, environmental considerationsalso play a role, such as those required under the RMA. The introduction of the New ZealandWaste Strategy (MfE, 2002) has put the onus on companies and authorities to reduce the volumeof material sent to landfill. Putting a price on resources that reflect their true value is the fastestway to reduce waste. However, many companies are small- to medium-sized and have a limitedability to continually upgrade and modernise plant. This can result in very inefficient plantsoperating and the corresponding production of wastes. However, when knowledge of ‘best
Page 93The Forestry Sector
technologies’ is available, upgrades can often occur with impressive payback periods (see CaseStudy 7.2, above).
The Wood Processing Strategy (WPS) is a partnership between the forest industry and centraland local government. WPS aims to accelerate the development of wood processing and get thebest value from the regional expansion of wood by attracting new investment, processing atleast 50% of the increased harvest in New Zealand, and maximising wealth creation, employ-ment and infrastructure. (WPS, 2002). If there is a rush of new processing plants installed, it isimportant that these plants incorporate resource stewardship for environmental, social andeconomic benefits. To aid plants through the planning process, the WPS is proposing a defini-tive best practice standard or code of practice for wood processing industries to be established,which would include industry training and measuring the success of the code.
Such a best practice guide could incorporate consideration of issues such as:
• dust emissions (particularly from sawmill and MDF activities);
• noise issues (particularly in relation to possible double shift or 24 hour operations);
• fugitive emissions (particularly formaldehyde emissions from MDF and LVL operations);
• stack emissions;
• log handling issues, including yard stormwater controls;
• traffic issues;
• avoidance of site contamination (particularly for timber preservation activities);
• lighting and glare issues; and
• monitoring requirements and measurement methods.
With resource consent compliance, there is some indication that the wood processing industrycould improve its practices. In the Bay of Plenty Region, for example, while wood processingindustries accounted for one-quarter of the consents assessed, these industries accounted for50% of those rated as having a ‘poor’ compliance record (Environment BOP, 2000). Site manage-ment issues were cited as primary reasons for non-compliance with resource consent require-ments.
Increasing harvest and therefore residue volumes will increase the scale of supply and disposalissues. Expansion of wood processing at a district level may provide demand opportunities forwood residues as fuel in some regions (Northland, East Coast) where energy supply is currentlylimited for other energy sources (gas, coal and electricity). However, fragmentation of resourceby region and owner is a constraint to progress with the utilisation of in-forest residues (andother woody residues). Gas is currently widely used in the wood processing industry; if thesupply of gas becomes constrained (and the price rises) some users of gas may seek alternativeand renewable fuel sources, such as forestry and wood processing residues. The Energy Effi-ciency and Conservation Act (EECA) and the subsequent EECA strategy aims to encourage andincentivise energy efficiency improvements in existing and new industry. The forestry sector isresponsible for about 10% of the country’s energy demand, half of this is met through self-generation of bio-energy. The wood processing strategy in association with the Bio-energyAssociation of New Zealand (BANZ) aims to optimise the amount of bio-fuels used for process-ing and this will increase the value of wastes and reduce emissions from and dependence onnon-renewable fossil fuels (BANZ, 2002).
Over the next decade the cost of disposing of waste to the environment and the cost for naturalresources such as water will increase. Therefore more efficient use of raw materials and adecrease in the amount of waste generated through awareness of resource stewardship andwaste minimisation programmes is a key to minimise environmental impact. Avoiding these
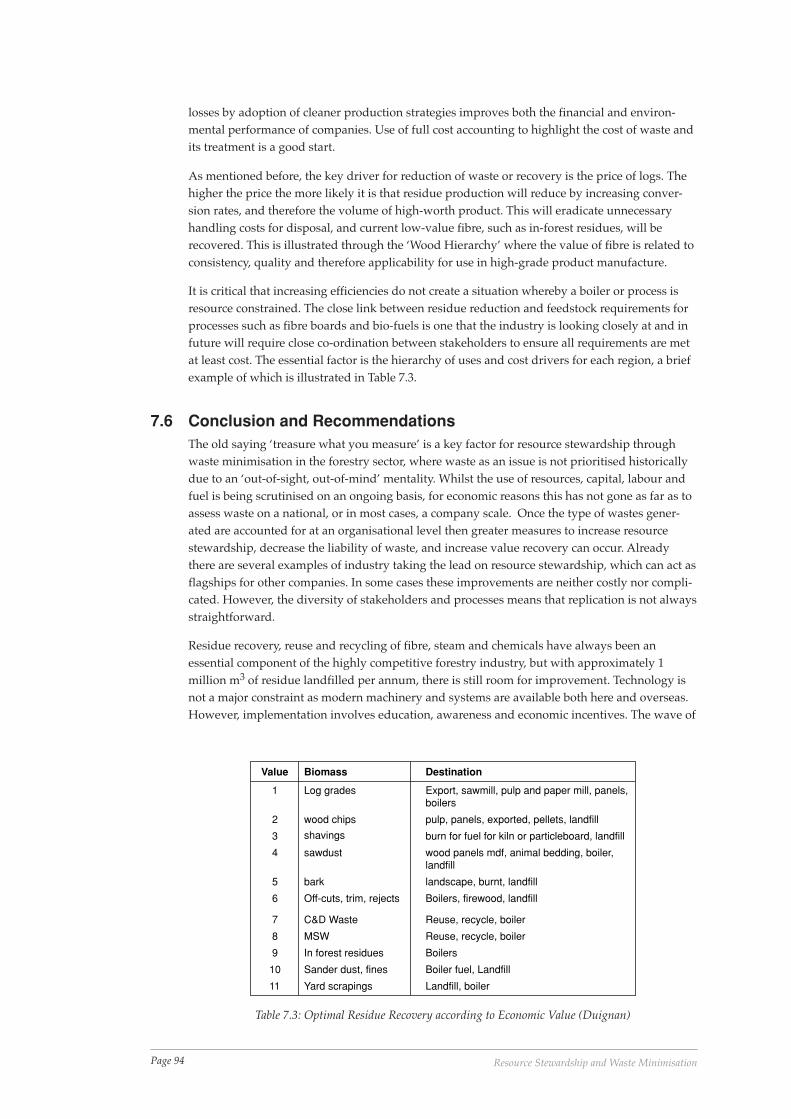
Page 94 Resource Stewardship and Waste Minimisation
losses by adoption of cleaner production strategies improves both the financial and environ-mental performance of companies. Use of full cost accounting to highlight the cost of waste andits treatment is a good start.
As mentioned before, the key driver for reduction of waste or recovery is the price of logs. Thehigher the price the more likely it is that residue production will reduce by increasing conver-sion rates, and therefore the volume of high-worth product. This will eradicate unnecessaryhandling costs for disposal, and current low-value fibre, such as in-forest residues, will berecovered. This is illustrated through the ‘Wood Hierarchy’ where the value of fibre is related toconsistency, quality and therefore applicability for use in high-grade product manufacture.
It is critical that increasing efficiencies do not create a situation whereby a boiler or process isresource constrained. The close link between residue reduction and feedstock requirements forprocesses such as fibre boards and bio-fuels is one that the industry is looking closely at and infuture will require close co-ordination between stakeholders to ensure all requirements are metat least cost. The essential factor is the hierarchy of uses and cost drivers for each region, a briefexample of which is illustrated in Table 7.3.
7.6 Conclusion and RecommendationsThe old saying ‘treasure what you measure’ is a key factor for resource stewardship throughwaste minimisation in the forestry sector, where waste as an issue is not prioritised historicallydue to an ‘out-of-sight, out-of-mind’ mentality. Whilst the use of resources, capital, labour andfuel is being scrutinised on an ongoing basis, for economic reasons this has not gone as far as toassess waste on a national, or in most cases, a company scale. Once the type of wastes gener-ated are accounted for at an organisational level then greater measures to increase resourcestewardship, decrease the liability of waste, and increase value recovery can occur. Alreadythere are several examples of industry taking the lead on resource stewardship, which can act asflagships for other companies. In some cases these improvements are neither costly nor compli-cated. However, the diversity of stakeholders and processes means that replication is not alwaysstraightforward.
Residue recovery, reuse and recycling of fibre, steam and chemicals have always been anessential component of the highly competitive forestry industry, but with approximately 1million m3 of residue landfilled per annum, there is still room for improvement. Technology isnot a major constraint as modern machinery and systems are available both here and overseas.However, implementation involves education, awareness and economic incentives. The wave of
Value Biomass Destination
1 Log grades Export, sawmill, pulp and paper mill, panels,boilers
2 wood chips pulp, panels, exported, pellets, landfill
3 shavings burn for fuel for kiln or particleboard, landfill
4 sawdust wood panels mdf, animal bedding, boiler,landfill
5 bark landscape, burnt, landfill
6 Off-cuts, trim, rejects Boilers, firewood, landfill
7 C&D Waste Reuse, recycle, boiler
8 MSW Reuse, recycle, boiler
9 In forest residues Boilers
10 Sander dust, fines Boiler fuel, Landfill
11 Yard scrapings Landfill, boiler
Table 7.3: Optimal Residue Recovery according to Economic Value (Duignan)
Page 95The Forestry Sector
opportunity has the potential to transform not just the forestry sector but also energy, waste andthe wider economy at large. It is therefore crucial that resource stewardship is given the prece-dence it deserves in planning strategies, such as the best practice guidelines currently beingdeveloped, based on financial, economic and social reasoning.
As described by Forestry Insights (Forestry Insight, 2002):
“New ideas and technologies, more efficient process management, a better trained and moresophisticated workforce and marketing of improvements are required if the forest productsindustry is to continue to reduce waste at source.”
7.7 AcknowledgementsUnless otherwise stated all statistical figures on forest industry production are from MAFForestry Statistics 2001. The Forestry Insights web site demonstrates forestry processing tech-niques. Thanks are due to the Forest Research staff and all those from industry who contributedtheir time (see Chapter 7 Appendix for full list of contributors).
7.8 ReferencesAustralian and New Zealand Pulp and Paper Industry, 1993. Year Book.
BANZ, 2002. Mission Statement, www.bioenergy.org.nz/aboutBanz.html
BIS Shrapnel Forestry Group, 2000. The Australian and New Zealand Furniture Industries.
CHH, Kinleith Mill, 2002. Cleaner Production Pre-Assessment
Environment BOP, March 2000. Compliance Monitoring Report – Small Scale Air Discharge Con-sents. Environment Bay of Plenty Environmental Report, 2000/05
Forest Industry Council, 2001. http://nzfic.nzforestry.co.nz/wps_brief.asp
Forestry Insight Guide to Sawmill, 2002. www.insights.co.nz.
FSC, Forest Stewardship Council, 1998. www.fscoax.org.
Gifford, J et al., 1998. Life Cycle Analysis of Wood Products Report, Forest Research.
Hall, P, 1999. Effect of Logmaking on Production of Stem Wood Residue at Landings, Liro Report Vol24, No.4.
Hall, P, 1998. “Logging Residue at Landings”, NZ Forestry, Vol 43, Number 1
MAF, 2002. Ministry for Agriculture and Forestry, Statistics www.maf.govt.nz/statistics/primaryindustries/forestry/index.htm
www.maf.govt.nz/forestry/woodprocessing/index.htm#Composite%20Panels
Matthews, R and Robertson, K, 2001. “Answers to ten frequently asked questions aboutbioenergy, carbon sinks and their role in global climate change”, IEA Bioenergy, Task 38
Ministry for the Environment, October 1999. The Way Forward: Forestry and the RMA, Ministryfor the Environment Publication ME 330
Ministry for the Environment, 2002. The New Zealand Waste Strategy Towards Zero Waste and aSustainable New Zealand.
NEFD, 2000. National Exotic Forest Description.
NZ Forest Industry (NZFI), 2000/2001. Facts and Figures.

Page 96 Resource Stewardship and Waste Minimisation
NZCCP, 2001. New Zealand Climate Change Programme, Forest Sinks and the Kyoto Protocol, MAF
NZPMA, 1995. New Zealand Pine Manufacturer’s Association.
The Complete Reference on the Australian and New Zealand Pulp and Paper Industry, 1993,Year Book.
Wood Processing Strategy, 2001. Implications of the Resource Management Act for the Wood Process-ing Industry, Prepared for The Resource Management Act Working Group, by MitchellPartnerships
WPS Wood Processing Strategy, 2002. www.industrynz.govt.nz/industry/wood-processing/default.asp.
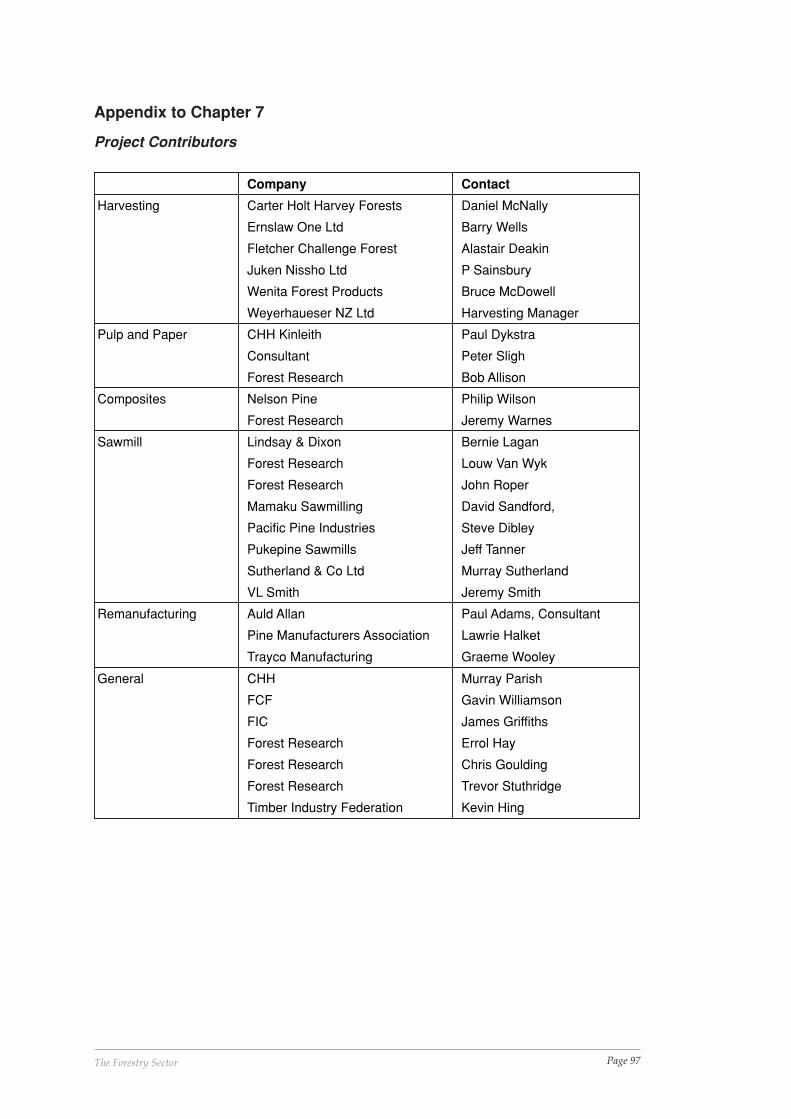
Page 97The Forestry Sector
Company Contact
Harvesting Carter Holt Harvey Forests Daniel McNally
Ernslaw One Ltd Barry Wells
Fletcher Challenge Forest Alastair Deakin
Juken Nissho Ltd P Sainsbury
Wenita Forest Products Bruce McDowell
Weyerhaueser NZ Ltd Harvesting Manager
Pulp and Paper CHH Kinleith Paul Dykstra
Consultant Peter Sligh
Forest Research Bob Allison
Composites Nelson Pine Philip Wilson
Forest Research Jeremy Warnes
Sawmill Lindsay & Dixon Bernie Lagan
Forest Research Louw Van Wyk
Forest Research John Roper
Mamaku Sawmilling David Sandford,
Pacific Pine Industries Steve Dibley
Pukepine Sawmills Jeff Tanner
Sutherland & Co Ltd Murray Sutherland
VL Smith Jeremy Smith
Remanufacturing Auld Allan Paul Adams, Consultant
Pine Manufacturers Association Lawrie Halket
Trayco Manufacturing Graeme Wooley
General CHH Murray Parish
FCF Gavin Williamson
FIC James Griffiths
Forest Research Errol Hay
Forest Research Chris Goulding
Forest Research Trevor Stuthridge
Timber Industry Federation Kevin Hing
Appendix to Chapter 7
Project Contributors

Page 98 Resource Stewardship and Waste Minimisation
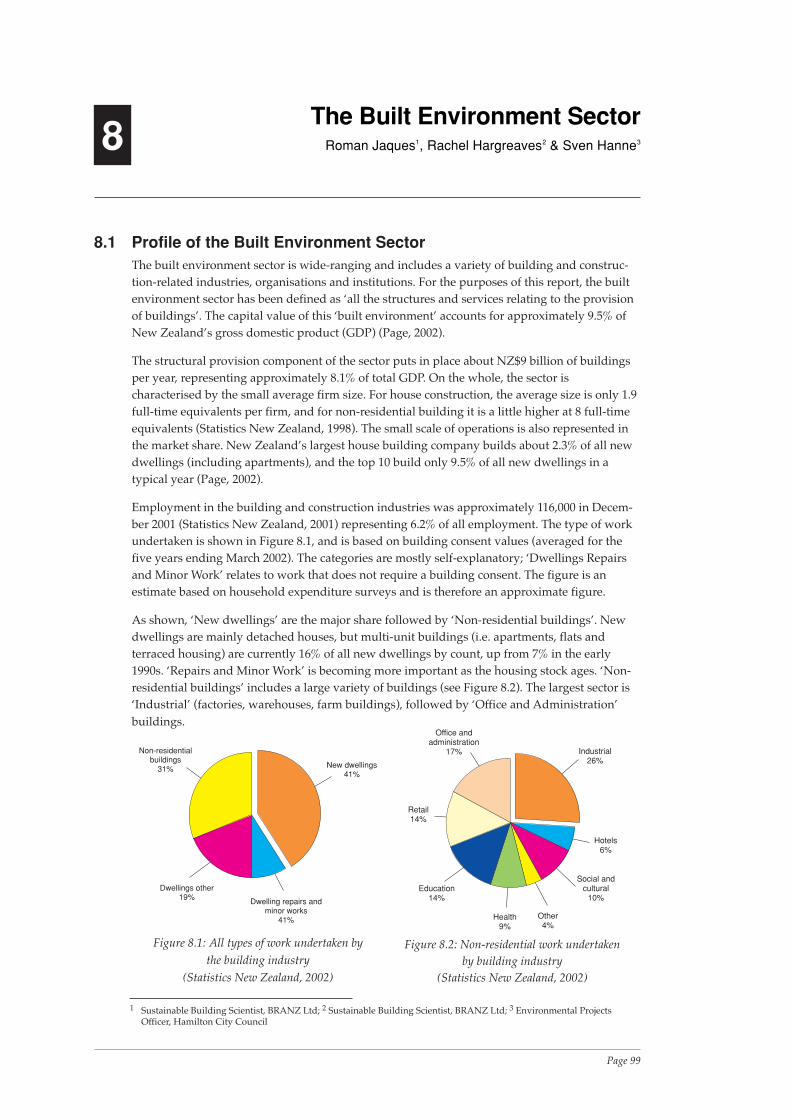
Page 99The Built Environment Sector
8The Built Environment Sector
Roman Jaques1, Rachel Hargreaves2 & Sven Hanne3
8.1 Profile of the Built Environment SectorThe built environment sector is wide-ranging and includes a variety of building and construc-tion-related industries, organisations and institutions. For the purposes of this report, the builtenvironment sector has been defined as ‘all the structures and services relating to the provisionof buildings’. The capital value of this ‘built environment’ accounts for approximately 9.5% ofNew Zealand’s gross domestic product (GDP) (Page, 2002).
The structural provision component of the sector puts in place about NZ$9 billion of buildingsper year, representing approximately 8.1% of total GDP. On the whole, the sector ischaracterised by the small average firm size. For house construction, the average size is only 1.9full-time equivalents per firm, and for non-residential building it is a little higher at 8 full-timeequivalents (Statistics New Zealand, 1998). The small scale of operations is also represented inthe market share. New Zealand’s largest house building company builds about 2.3% of all newdwellings (including apartments), and the top 10 build only 9.5% of all new dwellings in atypical year (Page, 2002).
Employment in the building and construction industries was approximately 116,000 in Decem-ber 2001 (Statistics New Zealand, 2001) representing 6.2% of all employment. The type of workundertaken is shown in Figure 8.1, and is based on building consent values (averaged for thefive years ending March 2002). The categories are mostly self-explanatory; ‘Dwellings Repairsand Minor Work’ relates to work that does not require a building consent. The figure is anestimate based on household expenditure surveys and is therefore an approximate figure.
As shown, ‘New dwellings’ are the major share followed by ‘Non-residential buildings’. Newdwellings are mainly detached houses, but multi-unit buildings (i.e. apartments, flats andterraced housing) are currently 16% of all new dwellings by count, up from 7% in the early1990s. ‘Repairs and Minor Work’ is becoming more important as the housing stock ages. ‘Non-residential buildings’ includes a large variety of buildings (see Figure 8.2). The largest sector is‘Industrial’ (factories, warehouses, farm buildings), followed by ‘Office and Administration’buildings.
New dwellings41%
Dwelling repairs andminor works
41%
Dwellings other19%
Non-residentialbuildings
31%
Figure 8.1: All types of work undertaken bythe building industry
(Statistics New Zealand, 2002)
Industrial26%
Hotels6%
Social andcultural
10%
Other4%
Health9%
Education14%
Retail14%
Office andadministration
17%
Figure 8.2: Non-residential work undertakenby building industry
(Statistics New Zealand, 2002)
1 Sustainable Building Scientist, BRANZ Ltd; 2 Sustainable Building Scientist, BRANZ Ltd; 3 Environmental ProjectsOfficer, Hamilton City Council
Page 100 Resource Stewardship and Waste Minimisation
This physical and economic profile of the built environment stock shows the share of thevarious types of buildings. Two of the more significant types — residential houses and officebuildings will be examined in the following sections. Three key ‘themes’ where improvedresource stewardship can be achieved in relation to this stock will be explored in some detail.The key themes are:
• urban sprawl;
• material waste; and
• energy use.
These themes have been selected based on their global importance (i.e. issues that impactbeyond regional/national boundaries), their lifecycle impacts (i.e. issues associated withcontinuing impacts over the lifecycle of a building), and their potential for change (i.e. theability of addressing the problem).
Urban SprawlUrban sprawl is defined as dispersed development outside compact urban centres into subur-ban and rural areas — or more simply, wasteful use of urban space. New Zealand’s urban spaceis almost 900,000 hectares, which is 3% of our total land area (MfE, 1997a). Urban space cangenerally be defined as those areas either built upon, such as buildings and infrastructure, orused for recreational and community purposes (Bachels, Newman and Kenworthy, 1998).Eighty-five percent of New Zealand’s population live in this ‘space’ — one of the highest ratesof urbanism in the world (PCE, 1998).
While a 3% urban land area can hardly be called crowded, the question is are we using itwisely? Many would argue that we are not (RSNZ, 1998; Memon and Perkins, 2000). Our citiesare continuing to expand at relatively low densities. Since 1969 the area of land classed as urbanhas trebled (MfE, 1997a). The fact that much of this outward development and associatedinfrastructure provision has been on resource rich land — floodplains, estuaries and coastline —means that urban sprawl is a critical resource stewardship issue. Not only is it important interms of lost agricultural land, biodiversity and open space, but inner city decay and loss ofcommunity character means that urban sprawl has many economic and social implications aswell.
Material WasteWorldwide, the construction of buildings consumes approximately three billion tonnes of rawmaterials, or 40% of the total material flow into the global economy (Roodman and Lenssen,1995). The huge quantities of construction and demolition (C&D) waste created in all high-consumption countries illustrates how remote the goal of sustainable construction is. Solidwaste creation is one of the big pressures that the construction sector places on the environment.It lags far behind other industries in terms of resource efficiency (reduced material consump-tion, increased reuse, and recycling). For example, a new automobile contains 70% recycledcontent, but a new building usually contains less than 1% reclaimed materials (Kibert andLanguell, 2000). A more efficient use of materials, including products with an increased recycledcontent, and the implementation of recycling processes are necessary if the construction sectoraims to overcome its poor environmental track record.
In New Zealand C&D waste accounts for approximately 20% of all landfill waste (Street, 1997).However, it should be noted that not all C&D waste is landfilled. For example, in the AucklandRegion, in addition to the 670,000 tonnes of waste disposed of in landfills in 1995 (of whichapproximately 198,000 tonnes, or 30%, is C&D waste), another 526,000 tonnes of C&D wastewas disposed of in cleanfills (MfE, 1997b). This makes the total amount of C&D waste disposedof in Auckland for 1995 stand at 724,000 tonnes. This exceeded all other waste types.
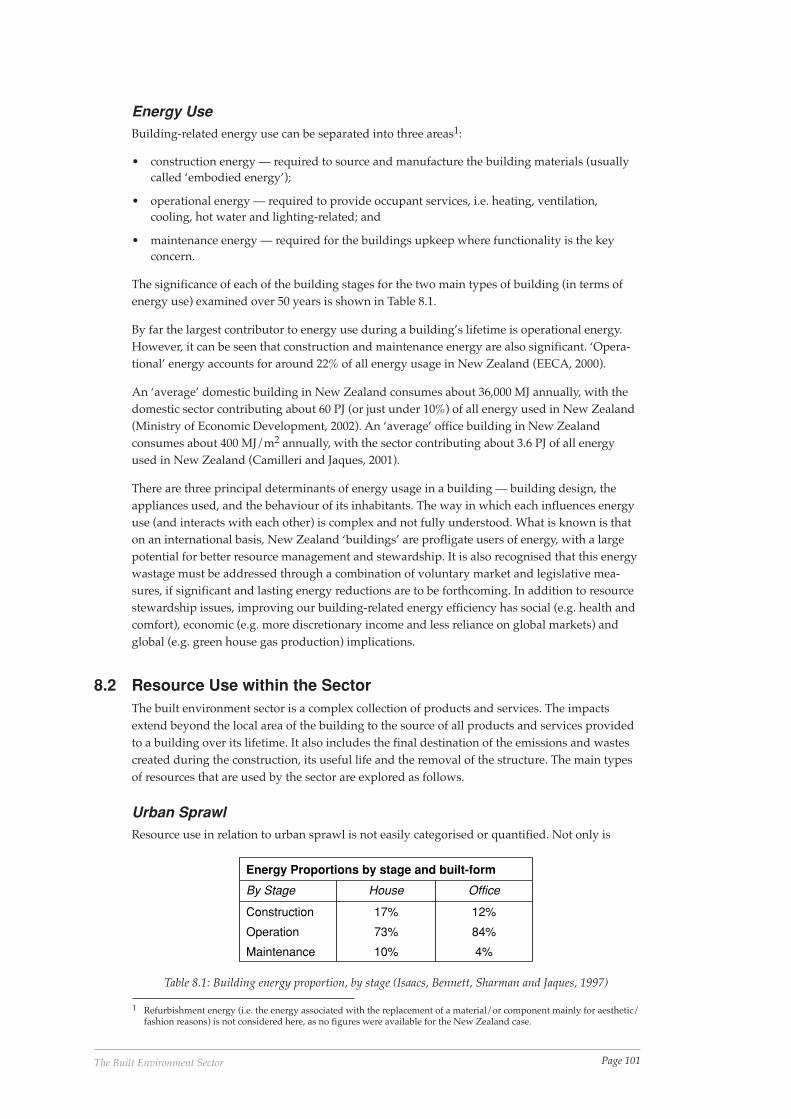
Page 101The Built Environment Sector
Energy UseBuilding-related energy use can be separated into three areas1:
• construction energy — required to source and manufacture the building materials (usuallycalled ‘embodied energy’);
• operational energy — required to provide occupant services, i.e. heating, ventilation,cooling, hot water and lighting-related; and
• maintenance energy — required for the buildings upkeep where functionality is the keyconcern.
The significance of each of the building stages for the two main types of building (in terms ofenergy use) examined over 50 years is shown in Table 8.1.
By far the largest contributor to energy use during a building’s lifetime is operational energy.However, it can be seen that construction and maintenance energy are also significant. ‘Opera-tional’ energy accounts for around 22% of all energy usage in New Zealand (EECA, 2000).
An ‘average’ domestic building in New Zealand consumes about 36,000 MJ annually, with thedomestic sector contributing about 60 PJ (or just under 10%) of all energy used in New Zealand(Ministry of Economic Development, 2002). An ‘average’ office building in New Zealandconsumes about 400 MJ/m2 annually, with the sector contributing about 3.6 PJ of all energyused in New Zealand (Camilleri and Jaques, 2001).
There are three principal determinants of energy usage in a building — building design, theappliances used, and the behaviour of its inhabitants. The way in which each influences energyuse (and interacts with each other) is complex and not fully understood. What is known is thaton an international basis, New Zealand ‘buildings’ are profligate users of energy, with a largepotential for better resource management and stewardship. It is also recognised that this energywastage must be addressed through a combination of voluntary market and legislative mea-sures, if significant and lasting energy reductions are to be forthcoming. In addition to resourcestewardship issues, improving our building-related energy efficiency has social (e.g. health andcomfort), economic (e.g. more discretionary income and less reliance on global markets) andglobal (e.g. green house gas production) implications.
8.2 Resource Use within the SectorThe built environment sector is a complex collection of products and services. The impactsextend beyond the local area of the building to the source of all products and services providedto a building over its lifetime. It also includes the final destination of the emissions and wastescreated during the construction, its useful life and the removal of the structure. The main typesof resources that are used by the sector are explored as follows.
Urban SprawlResource use in relation to urban sprawl is not easily categorised or quantified. Not only is
Energy Proportions by stage and built-form
By Stage House Office
Construction 17% 12%
Operation 73% 84%
Maintenance 10% 4%
Table 8.1: Building energy proportion, by stage (Isaacs, Bennett, Sharman and Jaques, 1997)
1 Refurbishment energy (i.e. the energy associated with the replacement of a material/or component mainly for aesthetic/fashion reasons) is not considered here, as no figures were available for the New Zealand case.
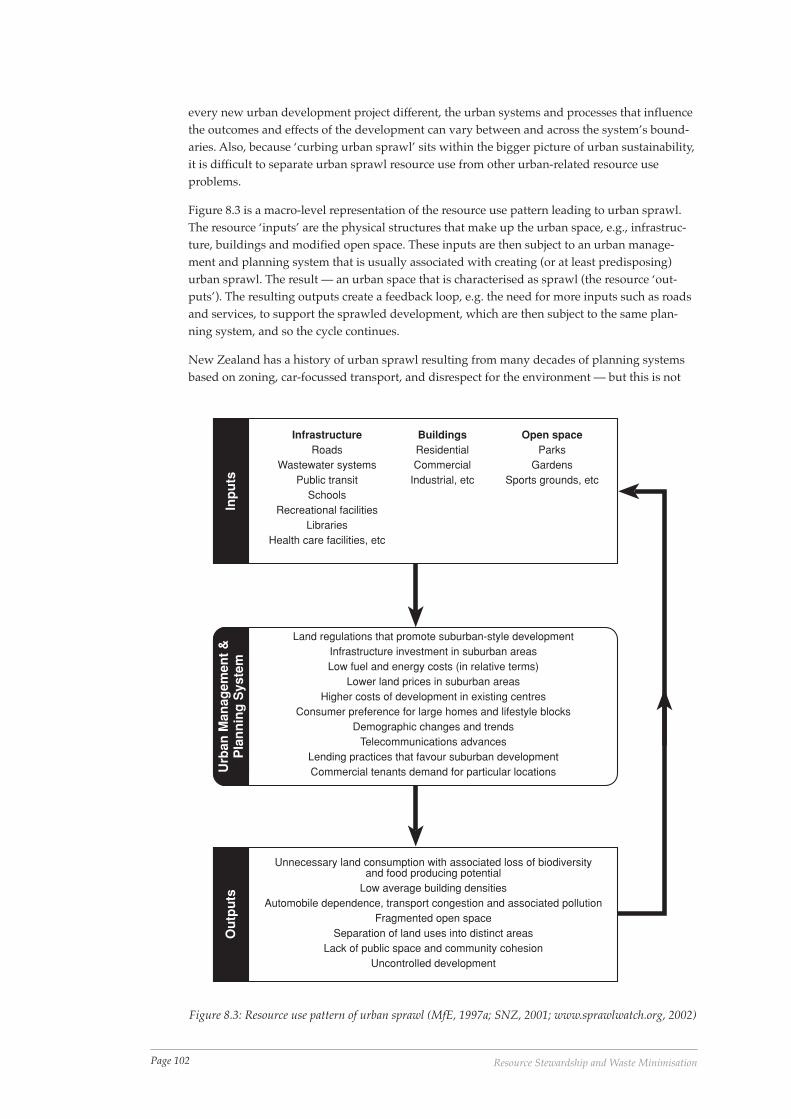
Page 102 Resource Stewardship and Waste Minimisation
every new urban development project different, the urban systems and processes that influencethe outcomes and effects of the development can vary between and across the system’s bound-aries. Also, because ‘curbing urban sprawl’ sits within the bigger picture of urban sustainability,it is difficult to separate urban sprawl resource use from other urban-related resource useproblems.
Figure 8.3 is a macro-level representation of the resource use pattern leading to urban sprawl.The resource ‘inputs’ are the physical structures that make up the urban space, e.g., infrastruc-ture, buildings and modified open space. These inputs are then subject to an urban manage-ment and planning system that is usually associated with creating (or at least predisposing)urban sprawl. The result — an urban space that is characterised as sprawl (the resource ‘out-puts’). The resulting outputs create a feedback loop, e.g. the need for more inputs such as roadsand services, to support the sprawled development, which are then subject to the same plan-ning system, and so the cycle continues.
New Zealand has a history of urban sprawl resulting from many decades of planning systemsbased on zoning, car-focussed transport, and disrespect for the environment — but this is not
InfrastructureRoads
Wastewater systemsPublic transit
SchoolsRecreational facilities
LibrariesHealth care facilities, etc
Open spaceParks
GardensSports grounds, etc
BuildingsResidentialCommercial
Industrial, etc
Inp
uts
Land regulations that promote suburban-style developmentInfrastructure investment in suburban areasLow fuel and energy costs (in relative terms)
Lower land prices in suburban areasHigher costs of development in existing centres
Consumer preference for large homes and lifestyle blocksDemographic changes and trends
Telecommunications advancesLending practices that favour suburban developmentCommercial tenants demand for particular locations
Unnecessary land consumption with associated loss of biodiversityand food producing potential
Low average building densitiesAutomobile dependence, transport congestion and associated pollution
Fragmented open spaceSeparation of land uses into distinct areas
Lack of public space and community cohesionUncontrolled development
Ou
tpu
tsU
rban
Man
agem
ent
&P
lan
nin
g S
yste
m
Figure 8.3: Resource use pattern of urban sprawl (MfE, 1997a; SNZ, 2001; www.sprawlwatch.org, 2002)
Page 103The Built Environment Sector
always the pre-determined outcome. Local government, as key players in the management ofland use (and thus the prevention of sprawl), have a range of governance mechanisms toensure, support and encourage resource stewardship and waste minimisation. In this context,the desired outcome for urban space is reduced resource use, reduced waste and emissions,greater liveability, improved urban systems and processes — all combining to enhance thequality of the urban environment.
Material Waste and Energy UseA building’s life cycle includes raw material extraction, product manufacturing, construction,maintenance, retrofitting, and waste management at the building’s retirement — in total this iscommonly known as a ‘cradle to grave’ approach. There are no legal requirements or financialincentives established in New Zealand that would encourage or force the construction anddemolition industry to avoid, reduce, reuse or recycle their wastes. Consequently, all builtinfrastructure has been described as ‘waste in transit’ (Guthrie and Wolveridge, 1998), that is tosay, based on today’s linear resource flow economy, all materials in use by society will becomewaste at the end of their useful life span.
Figure 8.4 illustrates the inputs required for the creation of a building, the resources used duringthe building’s lifetime, the energy consumed when the building is finally disposed of, and theresulting emissions to air, water and land. The figure shows that the ‘standard industry practice’for the reuse and recycling of building materials as inputs is only significant for the constructionof new buildings.
The timeline on the left of Figure 8.4 is reflective of a ‘typical’ project set-up. The time betweenthe initial concept and the start of construction takes several months, with the length of time forthe structure to serve its useful purpose (or economic life) usually being 50 or more years.
For houses, energy demand by end-use is estimated to be made up of 38% water heating, 36%space heating, 7% refrigeration with the rest (at 26%) going to cooking, lighting and other(Massey University, 1992). Domestic energy sector demand, by fuel type, is electricity (71%),wood (14%), coal (7%), gas (7%) and other (1%). In summary, domestic buildings energy use iswater and space heating dominated, with electricity being the most common fuel type.
For offices, energy-end use demand is divided into those buildings which are internally loaddominated (ILD) i.e. for heating, ventilation and cooling, and those which are skin load domi-nated (SLD) i.e. the building structure. Whatever sub-category they are, it is thought to makelittle difference to the amount of their overall ‘per floor area’ energy consumption. Heating (at38% for ILD buildings and 53% of SLD) and lighting (38% for both) make up by far the bulk ofthe energy requirements (CAE, 1996). The energy sources are mainly electricity and gas, at 60%and 15% of total energy, respectively (Ministry of Commerce, 1997).
It comes as no surprise that the last determinant of energy use — the occupant — generallyplaces very little importance on the benefits of energy efficiency. The BRANZ Advisory Helpline(for both industry and the public) consistently fields calls from people who have only thevaguest impressions of what energy efficiency/insulation is all about, with whole buildinginsulation being one of the most misunderstood parts of the design process (Bruce, 2002).
8.3 Standard Practice within the Building SectorThis Section examines what is currently occurring within the sector to illustrate the standardpractice of dealing with waste. However, a principal characteristic of the sector is the widevariety of activities that are undertaken and the uniqueness of each project. In other words, eachproject is designed for specific circumstances, and thus has its own peculiar problems. As aresult there is a spectrum of ‘standard’ practice within the sector.
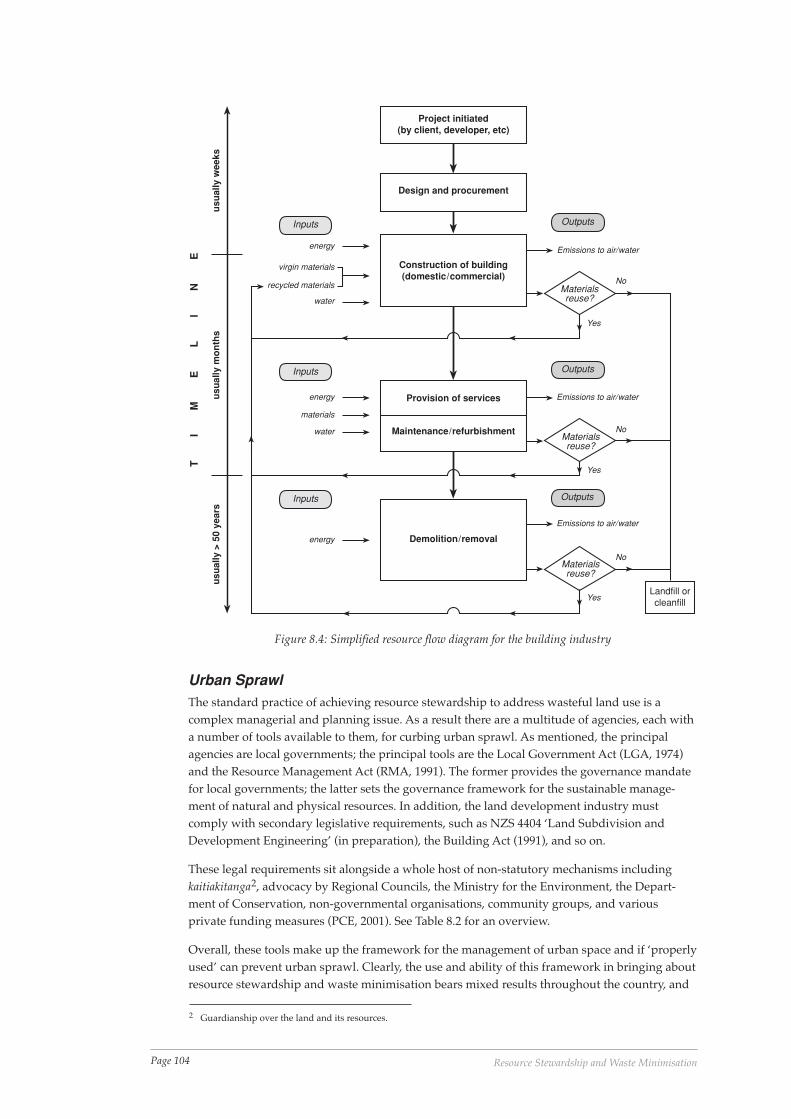
Page 104 Resource Stewardship and Waste Minimisation
Inputs
Inputs
Inputs Outputs
Outputs
Outputs
Materialsreuse?
Materialsreuse?
Materialsreuse?
Emissions to air/water
Emissions to air/water
Emissions to air/water
energy
virgin materials
recycled materials
water
energy
materials
water
energy
Yes
No
No
No
Yes
YesLandfill orcleanfill
Project initiated(by client, developer, etc)
Design and procurement
Construction of building(domestic/commercial)
Provision of services
Maintenance/refurbishment
Demolition/removal
usu
ally
wee
ksu
sual
ly m
on
ths
usu
ally
> 5
0 ye
ars
T
I
M
E
L
I
N
E
Figure 8.4: Simplified resource flow diagram for the building industry
Urban SprawlThe standard practice of achieving resource stewardship to address wasteful land use is acomplex managerial and planning issue. As a result there are a multitude of agencies, each witha number of tools available to them, for curbing urban sprawl. As mentioned, the principalagencies are local governments; the principal tools are the Local Government Act (LGA, 1974)and the Resource Management Act (RMA, 1991). The former provides the governance mandatefor local governments; the latter sets the governance framework for the sustainable manage-ment of natural and physical resources. In addition, the land development industry mustcomply with secondary legislative requirements, such as NZS 4404 ‘Land Subdivision andDevelopment Engineering’ (in preparation), the Building Act (1991), and so on.
These legal requirements sit alongside a whole host of non-statutory mechanisms includingkaitiakitanga2, advocacy by Regional Councils, the Ministry for the Environment, the Depart-ment of Conservation, non-governmental organisations, community groups, and variousprivate funding measures (PCE, 2001). See Table 8.2 for an overview.
Overall, these tools make up the framework for the management of urban space and if ‘properlyused’ can prevent urban sprawl. Clearly, the use and ability of this framework in bringing aboutresource stewardship and waste minimisation bears mixed results throughout the country, and
2 Guardianship over the land and its resources.

Page 105The Built Environment Sector
across and between jurisdictional boundaries. In addition, defining whether urban sprawl hasoccurred in an urban area, who or what is to blame, and how it can be remedied or prevented —or even whether urban sprawl is ‘bad’ — continues to be debated in the planning literature(Searle, 1998). It is not the purpose of this section to become involved in this debate, or critiquethe management framework3, but to highlight New Zealand’s settlement pattern as a result ofit.
New Zealand’s current settlement pattern and demographic profile shows migration back to theurban centres paradoxically occurring at the same time as the suburban areas continue toexpand (Gjerde, 2000). This can be seen in the growing number of medium-density, mixed-usecommunities that have been built or are under construction in the main urban centres, e.g. theBeaumont Quarter, Auckland, Tapu te Ranga Marae in Wellington, and Lancewood Courts inBeckenham, Christchurch. Demand is continuing for revitalised, higher density and/or mixed-use living (Ledbury and Frisbie, 2002). On the other hand, expansion can be seen all over thecountry, for example:
• Rodney District, a rural and coastal area north of Auckland, has growth rates of 81%compared to Auckland’s 31%;
• Wellington’s Kapiti Coast, another rural-coastal area, has grown 47% in contrast to theregion’s 8%; and
• Similar areas like Waimakariri and Selwyn have grown 37% and 28% respectively, comparedto Christchurch’s 12% (BRANZ, Fletcher Challenge and Forest Research, 2000).
From a resource stewardship and waste minimisation perspective, the key limiting factor is howthe various land management agencies can positively contribute to good quality urban designwithin the existing land management framework.
Material WasteDesigners can affect waste creation throughout the lifecycle of a building. However, a recentstudy conducted by BRANZ found that there is very little importance placed by designers onwaste minimisation, compared to other design criteria (Jaques, 1998). Starting with buildingcomponent specification, a great deal of construction waste results from overestimating materialneeds. This includes having excess materials delivered to the site or mixing more material onsite than the project requires at the time. Surplus materials made up 14 % of construction site
Legal Requirements Non-statutory Mechanisms
RMA, LGA: Codes of Practice
District Plans Strategic Plans
Regional Coastal Plans Community Plans
Regional Policy Statements Iwi Management Plans
National Policy Statements Conservation Covenants, QEII Trust
NZS 4404 ‘Land Subdivision and DevelopmentEngineering’
Management Agreements
Land Transfer Act 1954 Lotteries Grants
Building Act 1991 Purchase
Building Code Handbook 1992, etc Guidelines
Handbooks
Heritage Orders, etc
Table 8.2: Overview of the tools available for urban management (PCE, 2001; SNZ, 2001)
3 An investigation of the land management framework can be found in ‘Managing Change in Paradise, SustainableDevelopment in Peri-urban Areas’ PCE, 2001.
Page 106 Resource Stewardship and Waste Minimisation
waste in a study of construction sites in Auckland (Patterson, 1995).
Not only are there problems with surplus materials, damaged materials account for a significantportion of construction waste. The biggest concern with damaged materials is that the companypays for material, delivery, handling and disposal without receiving any benefits. Goods areoften damaged when they are delivered in excess or when they arrive before they are needed,thus requiring additional handling or makeshift storage.
Another standard practice is the non-transfer of surplus materials from a completed operationin one building to the next or from one part of a larger building to another where similarmaterials are to be used. This largely applies to such materials as partly used bags of plaster,sheets, cut sheets of plasterboard and hardboard, partly used cans of paint and adhesives aswell as nails and screws. Waste is also particularly common with bulk or loose materials, suchas aggregates, which, if allowed to spread during mixing operations results in sand and aggre-gate being trampled into the soil and rendered useless (Broughton, 1965).
Waste composition varies within the C&D waste stream, depending on the kind of work carriedout. Waste arising from renovation projects is different to that of new construction projects,because timber, windows, doors and sheet material make up a larger than average componentof the waste stream. Renovation projects can involve the removal of parts of a structure, demoli-tion projects aim at leaving a clear site and are generally the point within a structure’s life cyclewhen the single largest amount of waste materials is produced. Each kind of project representsunique opportunities for material recovery.
The differences in the waste streams are reflective of the differing types of building work —construction, renovation/fit-out and demolition. Each determines different approaches to‘standard practice’. The wastes generated at construction sites are more likely to be recycledthan demolition wastes due to the relative ease in separating the materials and compilingsimilar materials. Materials resulting from renovation work are usually generated in too smallamounts to warrant multiple bins on site and thereby make material recovery more compli-cated. Demolition waste is inherently more contaminated and is often commingled from thestart, making it much harder to separate at the source. It also tends to include a wider range ofmaterials.
Despite these problems, waste minimisation is particularly relevant as nearly all constructionand demolition waste can be recycled or reused. However, it lags far behind other industries inresource efficiency. One of the reasons for this lack of success is that there is still limited aware-ness of waste minimisation or its benefits by New Zealand’s construction industry. Manybusinesses consider the cost of disposing of waste simply as a cost of doing business. Materialwaste is seen neither as a problem or an opportunity, with the cost of disposal simply passed onto clients.
In fact, many businesses link waste minimisation with an environmental movement that willresult in cost with no financial benefit (Boyle, 1998). There is no legislation in New Zealand thatfocuses purely on waste prevention. The focus of the Resource Management Act on effects onthe environment moves the issue from the production of waste to the effects of the wasteproduced. There is no requirement for companies to reduce their material waste or to evenimplement waste reduction measures. Furthermore, the lack of interest by consumers in NewZealand in environmentally-friendly products and services discourages businesses fromundertaking environmental programmes. Despite this somewhat pessimistic picture, thenumber of examples of best practice emerging is encouraging.
Energy UseStandard practice is determined by the key supporting documents relating to the energyefficiency requirements of the New Zealand Building Code (NZBC) Clause H1: Energy Efficiency.
Page 107The Built Environment Sector
These are NZS 4218 (Standards New Zealand, 1996a) for small buildings, NZS 4243 (StandardsNew Zealand, 1996b) for the thermal envelope of large buildings, and NZS 4305 (StandardsNew Zealand, 1996c) for the hot water system use. These are part of a package of standards,guidelines and calculation methods available to the designer to assess the energy efficiency oftheir building. A summary of this package is given in Table 8.3.
It should be noted that all the legislative requirements described in Table 8.3 target new build-ings only — even though by far the largest gains in energy efficiency is to be made in retrofit-ting or the extensive refurbishment of the bulk of the existing building stock. In terms of thedesign process for both houses and office buildings, designers have little motivation for increas-ing the insulation requirements above the minimum code requirements. Many building officialsand building certifiers don’t know how to apply the code so energy efficiency is largely ignored(Bruce, 2002). The design process is largely first-cost focused. This inevitably results in abuilding that is less comfortable and uses more energy than it needs to.
In New Zealand, extensive use of standard house plans is made, with little attention given toeven the basic, low/no-cost energy efficiency aspects such as orientation, location, internalplanning, and window aspects (otherwise termed as ‘passive solar design’). Most homebuyerslack information, motivation and funding to achieve good energy efficiency (EECA, 2000a). Inmany cases, energy usage is driven by poor levels of insulation, damp conditions and limitedavailability of useful sunlight. The relative energy efficiency of household appliances variesconsiderably, depending on the age and country of origin of the individual appliance (EECA,2000a). There is little uptake of solar water heater units, or high efficiency or direct gas andwater space heating.
There is a lack of integration in the design process for office buildings, with building specialists(service engineers, product suppliers and contractors) rarely being consulted at the conceptualstage of the building. It has been shown that the initial design (incorporating the schematicdesign and design development) has by far the greatest potential energy savings of any stage inthe design process (CAE, 1996). In more recently built offices, there has been a trend for install-ing fully air-conditioned services, even though New Zealand’s climate is temperate and full airconditioning is not widely needed. This is at least in part because of the current perception thatthose that are air-conditioned are higher quality and attract a higher price premium (Saville-Smith, 1998). Also, often buildings are operated in less than ideal manner, which results inenergy inefficiencies. The reason for incorrect commissioning is thought to be because ofpressures to complete the construction contract, resulting in the HVAC services never operatingas designed (EECA, 2000a). Standard practice ensures that little post-occupancy evaluation willbe carried out, so that little knowledge is derived from the way occupants operate and maintainthem.
Legal Requirements Non-statutory Mechanisms
The New Zealand Building Act 1991 General Guides
The New Zealand Building Code (NZBC)
Mainly H1(Energy efficiency) but also E3 (InternalMoisture)
TLA Guides
The codes and standards associated with the NZBC1 Bulletins
The Energy Efficiency (Energy Using Products)Regulations 2002
Calculation Tools
Handbooks
Energy Saver Funding throughCentral Government.
1 The NZBC is performance based with the ‘associated’ standards being acceptable solutions (but not the only means of compliance)
Table 8.3: Tools available for good energy efficient design
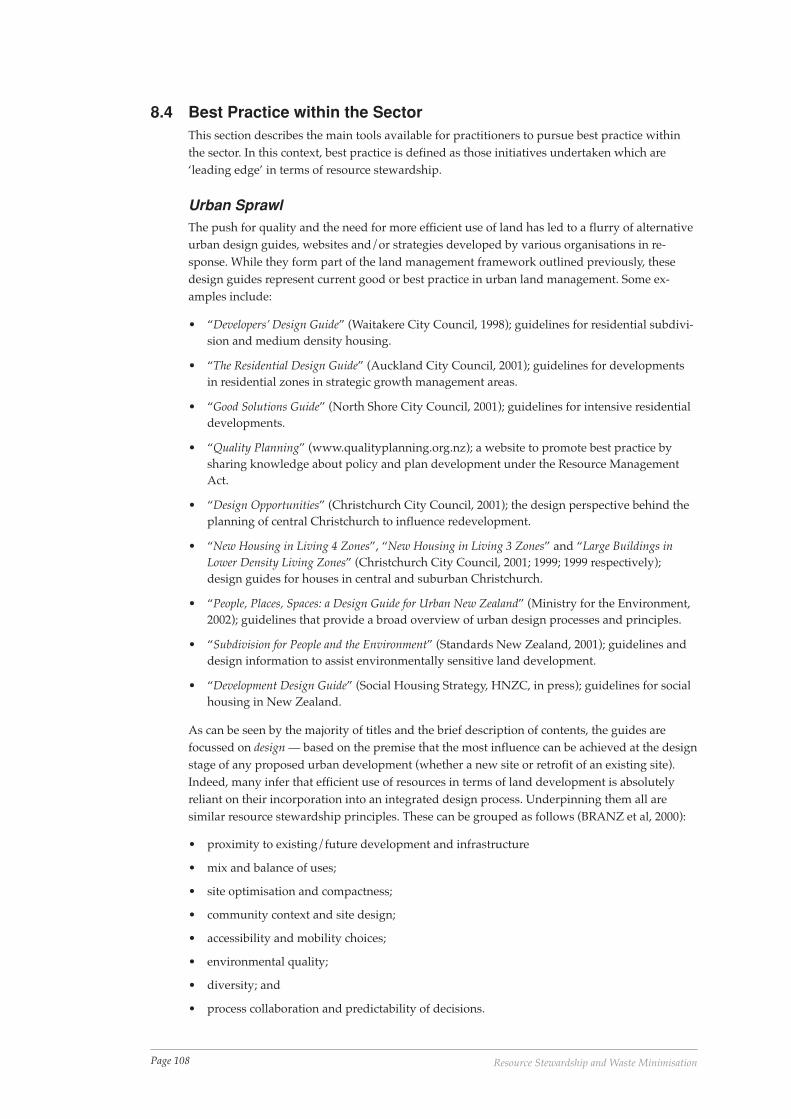
Page 108 Resource Stewardship and Waste Minimisation
8.4 Best Practice within the SectorThis section describes the main tools available for practitioners to pursue best practice withinthe sector. In this context, best practice is defined as those initiatives undertaken which are‘leading edge’ in terms of resource stewardship.
Urban SprawlThe push for quality and the need for more efficient use of land has led to a flurry of alternativeurban design guides, websites and/or strategies developed by various organisations in re-sponse. While they form part of the land management framework outlined previously, thesedesign guides represent current good or best practice in urban land management. Some ex-amples include:
• “Developers’ Design Guide” (Waitakere City Council, 1998); guidelines for residential subdivi-sion and medium density housing.
• “The Residential Design Guide” (Auckland City Council, 2001); guidelines for developmentsin residential zones in strategic growth management areas.
• “Good Solutions Guide” (North Shore City Council, 2001); guidelines for intensive residentialdevelopments.
• “Quality Planning” (www.qualityplanning.org.nz); a website to promote best practice bysharing knowledge about policy and plan development under the Resource ManagementAct.
• “Design Opportunities” (Christchurch City Council, 2001); the design perspective behind theplanning of central Christchurch to influence redevelopment.
• “New Housing in Living 4 Zones”, “New Housing in Living 3 Zones” and “Large Buildings inLower Density Living Zones” (Christchurch City Council, 2001; 1999; 1999 respectively);design guides for houses in central and suburban Christchurch.
• “People, Places, Spaces: a Design Guide for Urban New Zealand” (Ministry for the Environment,2002); guidelines that provide a broad overview of urban design processes and principles.
• “Subdivision for People and the Environment” (Standards New Zealand, 2001); guidelines anddesign information to assist environmentally sensitive land development.
• “Development Design Guide” (Social Housing Strategy, HNZC, in press); guidelines for socialhousing in New Zealand.
As can be seen by the majority of titles and the brief description of contents, the guides arefocussed on design — based on the premise that the most influence can be achieved at the designstage of any proposed urban development (whether a new site or retrofit of an existing site).Indeed, many infer that efficient use of resources in terms of land development is absolutelyreliant on their incorporation into an integrated design process. Underpinning them all aresimilar resource stewardship principles. These can be grouped as follows (BRANZ et al, 2000):
• proximity to existing/future development and infrastructure
• mix and balance of uses;
• site optimisation and compactness;
• community context and site design;
• accessibility and mobility choices;
• environmental quality;
• diversity; and
• process collaboration and predictability of decisions.
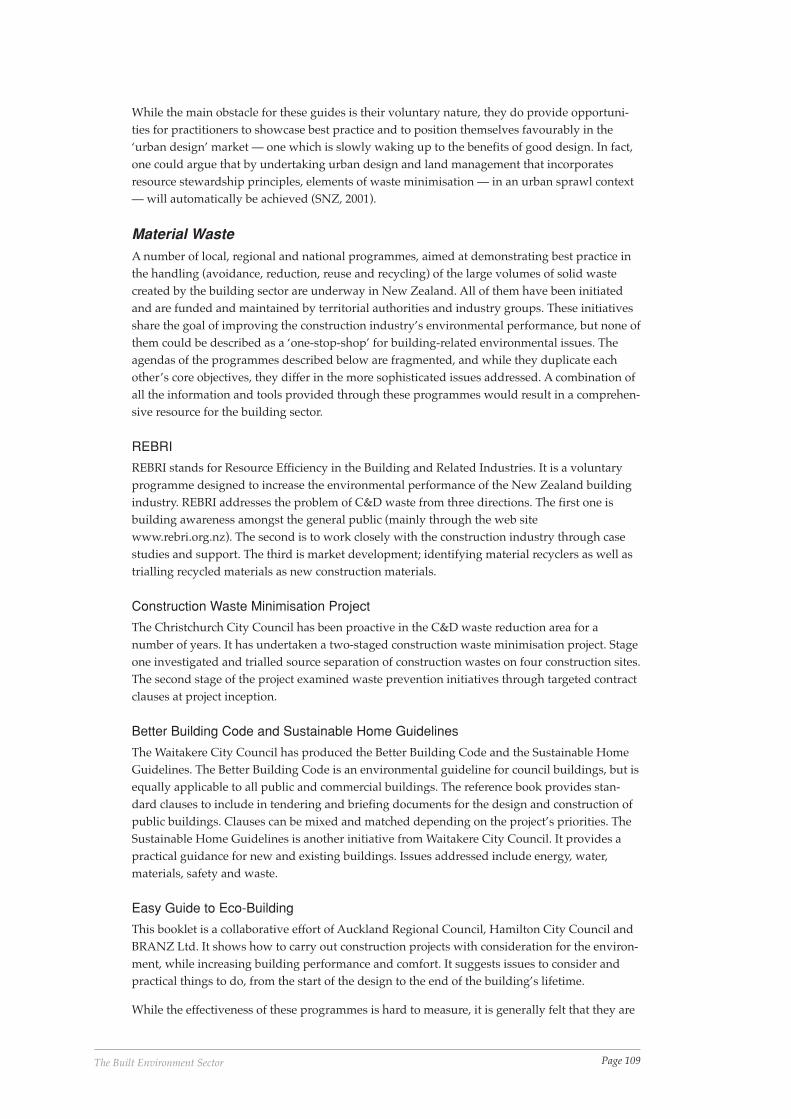
Page 109The Built Environment Sector
While the main obstacle for these guides is their voluntary nature, they do provide opportuni-ties for practitioners to showcase best practice and to position themselves favourably in the‘urban design’ market — one which is slowly waking up to the benefits of good design. In fact,one could argue that by undertaking urban design and land management that incorporatesresource stewardship principles, elements of waste minimisation — in an urban sprawl context— will automatically be achieved (SNZ, 2001).
Material WasteA number of local, regional and national programmes, aimed at demonstrating best practice inthe handling (avoidance, reduction, reuse and recycling) of the large volumes of solid wastecreated by the building sector are underway in New Zealand. All of them have been initiatedand are funded and maintained by territorial authorities and industry groups. These initiativesshare the goal of improving the construction industry’s environmental performance, but none ofthem could be described as a ‘one-stop-shop’ for building-related environmental issues. Theagendas of the programmes described below are fragmented, and while they duplicate eachother’s core objectives, they differ in the more sophisticated issues addressed. A combination ofall the information and tools provided through these programmes would result in a comprehen-sive resource for the building sector.
REBRI
REBRI stands for Resource Efficiency in the Building and Related Industries. It is a voluntaryprogramme designed to increase the environmental performance of the New Zealand buildingindustry. REBRI addresses the problem of C&D waste from three directions. The first one isbuilding awareness amongst the general public (mainly through the web sitewww.rebri.org.nz). The second is to work closely with the construction industry through casestudies and support. The third is market development; identifying material recyclers as well astrialling recycled materials as new construction materials.
Construction Waste Minimisation Project
The Christchurch City Council has been proactive in the C&D waste reduction area for anumber of years. It has undertaken a two-staged construction waste minimisation project. Stageone investigated and trialled source separation of construction wastes on four construction sites.The second stage of the project examined waste prevention initiatives through targeted contractclauses at project inception.
Better Building Code and Sustainable Home Guidelines
The Waitakere City Council has produced the Better Building Code and the Sustainable HomeGuidelines. The Better Building Code is an environmental guideline for council buildings, but isequally applicable to all public and commercial buildings. The reference book provides stan-dard clauses to include in tendering and briefing documents for the design and construction ofpublic buildings. Clauses can be mixed and matched depending on the project’s priorities. TheSustainable Home Guidelines is another initiative from Waitakere City Council. It provides apractical guidance for new and existing buildings. Issues addressed include energy, water,materials, safety and waste.
Easy Guide to Eco-Building
This booklet is a collaborative effort of Auckland Regional Council, Hamilton City Council andBRANZ Ltd. It shows how to carry out construction projects with consideration for the environ-ment, while increasing building performance and comfort. It suggests issues to consider andpractical things to do, from the start of the design to the end of the building’s lifetime.
While the effectiveness of these programmes is hard to measure, it is generally felt that they are
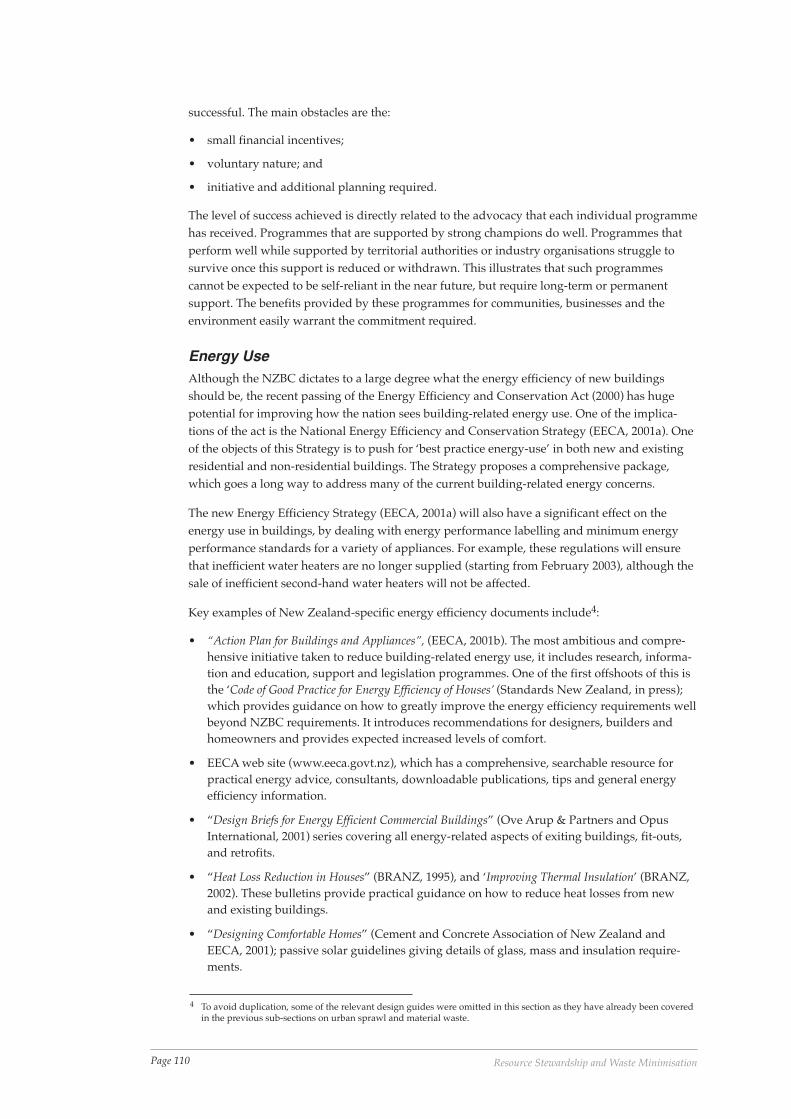
Page 110 Resource Stewardship and Waste Minimisation
successful. The main obstacles are the:
• small financial incentives;
• voluntary nature; and
• initiative and additional planning required.
The level of success achieved is directly related to the advocacy that each individual programmehas received. Programmes that are supported by strong champions do well. Programmes thatperform well while supported by territorial authorities or industry organisations struggle tosurvive once this support is reduced or withdrawn. This illustrates that such programmescannot be expected to be self-reliant in the near future, but require long-term or permanentsupport. The benefits provided by these programmes for communities, businesses and theenvironment easily warrant the commitment required.
Energy UseAlthough the NZBC dictates to a large degree what the energy efficiency of new buildingsshould be, the recent passing of the Energy Efficiency and Conservation Act (2000) has hugepotential for improving how the nation sees building-related energy use. One of the implica-tions of the act is the National Energy Efficiency and Conservation Strategy (EECA, 2001a). Oneof the objects of this Strategy is to push for ‘best practice energy-use’ in both new and existingresidential and non-residential buildings. The Strategy proposes a comprehensive package,which goes a long way to address many of the current building-related energy concerns.
The new Energy Efficiency Strategy (EECA, 2001a) will also have a significant effect on theenergy use in buildings, by dealing with energy performance labelling and minimum energyperformance standards for a variety of appliances. For example, these regulations will ensurethat inefficient water heaters are no longer supplied (starting from February 2003), although thesale of inefficient second-hand water heaters will not be affected.
Key examples of New Zealand-specific energy efficiency documents include4:
• “Action Plan for Buildings and Appliances”, (EECA, 2001b). The most ambitious and compre-hensive initiative taken to reduce building-related energy use, it includes research, informa-tion and education, support and legislation programmes. One of the first offshoots of this isthe ‘Code of Good Practice for Energy Efficiency of Houses’ (Standards New Zealand, in press);which provides guidance on how to greatly improve the energy efficiency requirements wellbeyond NZBC requirements. It introduces recommendations for designers, builders andhomeowners and provides expected increased levels of comfort.
• EECA web site (www.eeca.govt.nz), which has a comprehensive, searchable resource forpractical energy advice, consultants, downloadable publications, tips and general energyefficiency information.
• “Design Briefs for Energy Efficient Commercial Buildings” (Ove Arup & Partners and OpusInternational, 2001) series covering all energy-related aspects of exiting buildings, fit-outs,and retrofits.
• “Heat Loss Reduction in Houses” (BRANZ, 1995), and ‘Improving Thermal Insulation’ (BRANZ,2002). These bulletins provide practical guidance on how to reduce heat losses from newand existing buildings.
• “Designing Comfortable Homes” (Cement and Concrete Association of New Zealand andEECA, 2001); passive solar guidelines giving details of glass, mass and insulation require-ments.
4 To avoid duplication, some of the relevant design guides were omitted in this section as they have already been coveredin the previous sub-sections on urban sprawl and material waste.
Page 111The Built Environment Sector
Developing substantially self-heating houses and incorporating energy efficient water heatingsystems and appliances could reduce home energy use by 40% to 50% of current levels, whileproviding increased levels of comfort. A similarly aggressive programme for existing homescould reduce energy use levels by approximately 20% in more recent homes, increasing to about60% in older villas (EECA, 2000a). For office buildings, energy savings from retrofits can cut enduse energy requirements by 15% to 25% for heating and 25% to 40% for lighting. If energyefficiencies are incorporated into a new building or a major retrofit, the potential energy savingcan approach 75% (CAE, 1996). These programmes also have other co-benefits, such as employ-ment opportunities and social benefits (e.g. improved health and comfort), as well as beingbetter able to cope with climate change (Camilleri and Jaques, 2001).
The obstacles for the uptake of more energy efficient buildings are well documented (CAE,1996; Saville-Smith, 1998; and EECA, 2000a), and include:
For domestic buildings:
• high initial capital cost;
• other priorities (too busy and/or regard making changes as inconvenient);
• consider there will be a reduction in home comfort as a result;
• consider they are already efficient and nothing more can be done;
• other household members frustrate their efforts to be more efficient; and
• limited understanding and availability of ‘energy efficient technologies’.
For office buildings:
• little incentive as energy efficiency doesn’t lead to lower capital costs;
• no simple measure of building performance by which energy efficiency could be measured;
• little professional encouragement or recognition from the design fraternity for energyefficient design; and
• the tenancy-landlord problem, where the landlord does not directly benefit from reductionsin energy costs (paid by the tenant) resulting from energy efficiency improvements.
These obstacles present several opportunities, which the wider building-related industry isaddressing. To change the public’s and building fraternities present (low) perception of build-ing-related energy efficiency initiatives there must be three operators working in unison:
• AWARENESS — through education (whether through seminars, workshops, flyers ordemonstration projects). The appeal to ‘health’ and ‘comfort’ issues should be made inconjunction with energy efficiency.
• TOOLS — for assisting design and retrofitting/refurbishment, so that a more accurateindication of how building performance will change as a result.
• MOTIVATION — where the awareness and tools result in some action being taken theremust be appropriate back up legislation.
8.5 Case Studies of Best Practice within the Building SectorThe following case studies investigate possibilities for the reduction and diversion of waste foraddressing resource stewardship and waste minimisation within the built environment sector inNew Zealand.
Urban SprawlGood quality urban design is the key to curbing urban sprawl. Recent attempts at ‘packingmore people into less space’ has led to poor developments and a public backlash at the whole
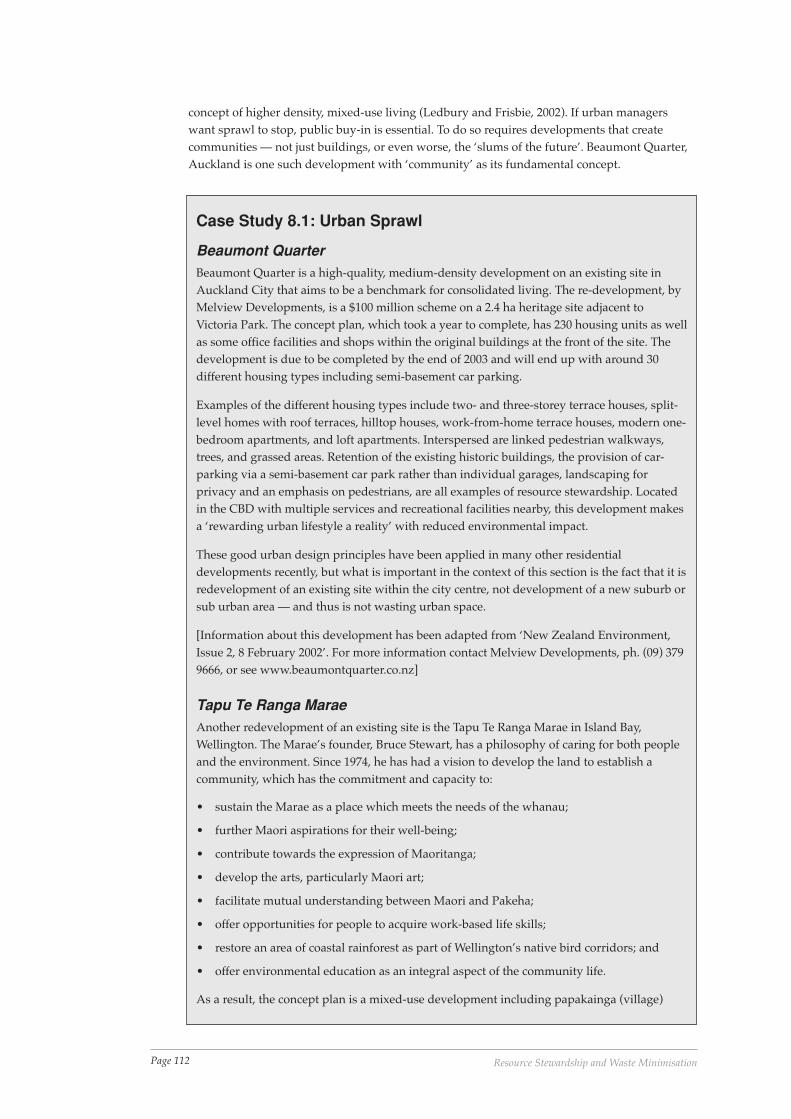
Page 112 Resource Stewardship and Waste Minimisation
concept of higher density, mixed-use living (Ledbury and Frisbie, 2002). If urban managerswant sprawl to stop, public buy-in is essential. To do so requires developments that createcommunities — not just buildings, or even worse, the ‘slums of the future’. Beaumont Quarter,Auckland is one such development with ‘community’ as its fundamental concept.
Case Study 8.1: Urban Sprawl
Beaumont QuarterBeaumont Quarter is a high-quality, medium-density development on an existing site inAuckland City that aims to be a benchmark for consolidated living. The re-development, byMelview Developments, is a $100 million scheme on a 2.4 ha heritage site adjacent toVictoria Park. The concept plan, which took a year to complete, has 230 housing units as wellas some office facilities and shops within the original buildings at the front of the site. Thedevelopment is due to be completed by the end of 2003 and will end up with around 30different housing types including semi-basement car parking.
Examples of the different housing types include two- and three-storey terrace houses, split-level homes with roof terraces, hilltop houses, work-from-home terrace houses, modern one-bedroom apartments, and loft apartments. Interspersed are linked pedestrian walkways,trees, and grassed areas. Retention of the existing historic buildings, the provision of car-parking via a semi-basement car park rather than individual garages, landscaping forprivacy and an emphasis on pedestrians, are all examples of resource stewardship. Locatedin the CBD with multiple services and recreational facilities nearby, this development makesa ‘rewarding urban lifestyle a reality’ with reduced environmental impact.
These good urban design principles have been applied in many other residentialdevelopments recently, but what is important in the context of this section is the fact that it isredevelopment of an existing site within the city centre, not development of a new suburb orsub urban area — and thus is not wasting urban space.
[Information about this development has been adapted from ‘New Zealand Environment,Issue 2, 8 February 2002’. For more information contact Melview Developments, ph. (09) 3799666, or see www.beaumontquarter.co.nz]
Tapu Te Ranga MaraeAnother redevelopment of an existing site is the Tapu Te Ranga Marae in Island Bay,Wellington. The Marae’s founder, Bruce Stewart, has a philosophy of caring for both peopleand the environment. Since 1974, he has had a vision to develop the land to establish acommunity, which has the commitment and capacity to:
• sustain the Marae as a place which meets the needs of the whanau;
• further Maori aspirations for their well-being;
• contribute towards the expression of Maoritanga;
• develop the arts, particularly Maori art;
• facilitate mutual understanding between Maori and Pakeha;
• offer opportunities for people to acquire work-based life skills;
• restore an area of coastal rainforest as part of Wellington’s native bird corridors; and
• offer environmental education as an integral aspect of the community life.
As a result, the concept plan is a mixed-use development including papakainga (village)
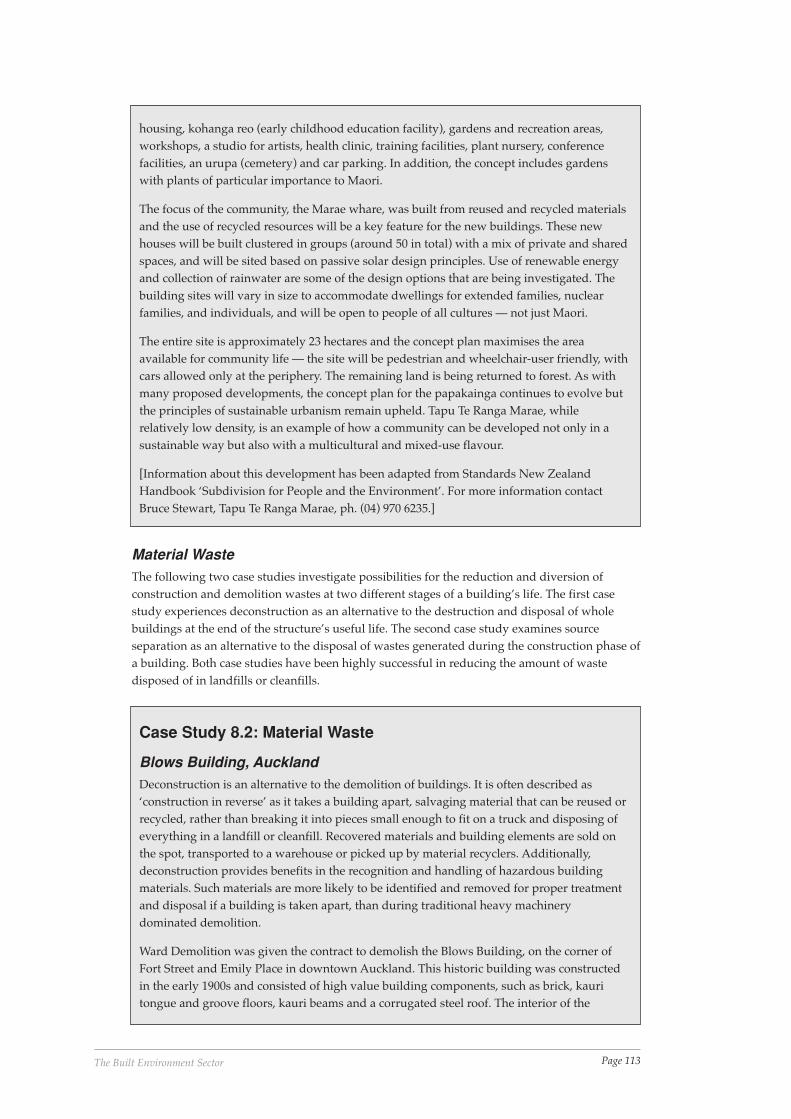
Page 113The Built Environment Sector
Material WasteThe following two case studies investigate possibilities for the reduction and diversion ofconstruction and demolition wastes at two different stages of a building’s life. The first casestudy experiences deconstruction as an alternative to the destruction and disposal of wholebuildings at the end of the structure’s useful life. The second case study examines sourceseparation as an alternative to the disposal of wastes generated during the construction phase ofa building. Both case studies have been highly successful in reducing the amount of wastedisposed of in landfills or cleanfills.
housing, kohanga reo (early childhood education facility), gardens and recreation areas,workshops, a studio for artists, health clinic, training facilities, plant nursery, conferencefacilities, an urupa (cemetery) and car parking. In addition, the concept includes gardenswith plants of particular importance to Maori.
The focus of the community, the Marae whare, was built from reused and recycled materialsand the use of recycled resources will be a key feature for the new buildings. These newhouses will be built clustered in groups (around 50 in total) with a mix of private and sharedspaces, and will be sited based on passive solar design principles. Use of renewable energyand collection of rainwater are some of the design options that are being investigated. Thebuilding sites will vary in size to accommodate dwellings for extended families, nuclearfamilies, and individuals, and will be open to people of all cultures — not just Maori.
The entire site is approximately 23 hectares and the concept plan maximises the areaavailable for community life — the site will be pedestrian and wheelchair-user friendly, withcars allowed only at the periphery. The remaining land is being returned to forest. As withmany proposed developments, the concept plan for the papakainga continues to evolve butthe principles of sustainable urbanism remain upheld. Tapu Te Ranga Marae, whilerelatively low density, is an example of how a community can be developed not only in asustainable way but also with a multicultural and mixed-use flavour.
[Information about this development has been adapted from Standards New ZealandHandbook ‘Subdivision for People and the Environment’. For more information contactBruce Stewart, Tapu Te Ranga Marae, ph. (04) 970 6235.]
Case Study 8.2: Material Waste
Blows Building, AucklandDeconstruction is an alternative to the demolition of buildings. It is often described as‘construction in reverse’ as it takes a building apart, salvaging material that can be reused orrecycled, rather than breaking it into pieces small enough to fit on a truck and disposing ofeverything in a landfill or cleanfill. Recovered materials and building elements are sold onthe spot, transported to a warehouse or picked up by material recyclers. Additionally,deconstruction provides benefits in the recognition and handling of hazardous buildingmaterials. Such materials are more likely to be identified and removed for proper treatmentand disposal if a building is taken apart, than during traditional heavy machinerydominated demolition.
Ward Demolition was given the contract to demolish the Blows Building, on the corner ofFort Street and Emily Place in downtown Auckland. This historic building was constructedin the early 1900s and consisted of high value building components, such as brick, kauritongue and groove floors, kauri beams and a corrugated steel roof. The interior of the

Page 114 Resource Stewardship and Waste Minimisation
building was fitted out with plasterboard, hardwood planks, and similar materials.
To salvage as many of the valuable materials as possible, demolition by hand, followed bycareful machinery application was chosen. To do this kind of demolition successfully, time isof the utmost importance. During the first stage the interior of the building was removed. Thisprovided the main source of waste going to landfill, as there were no recycling outlets forgypsum wallboard. Stage two involved salvaging the roof, joists and floorboards, followed bycontrolled dismantling of the walls to salvage the bricks. The salvaged materials were:
• Timber – 150m3 of kauri, ranging from 6” x 1” tongue and groove flooring to 12” x 10”beams, and 10” x 3” joists. Some timber was sold directly, and the rest re-sawn and sold asfloorboards.
• Bricks – 875 pallets of 400 bricks each were cleaned and chipped for resale.
• Rubble, broken bricks – Crushed and sold as aggregate
• Steel roofing – Good quality steel was sold for reuse, the rest was crushed and sold to ametal recycler.
The described demolition, which aimed to salvage as much material as possible, took sixweeks and cost the developer NZ$35,000. A rapid demolition of the same building usingheavy machinery with no attempt to salvage would only have taken two to three weeks, butwould have cost up to NZ$180,000. Savings on the demolition costs were NZ$153,000 or morethan 85%. Ninety-five percent of the demolition materials or about 270 truckloads weresalvaged. The job generated more employment than a non-salvage demolition job would havegenerated. The reduced disposal costs, and the profit from materials sold, easily covered thelabour costs.
The economic benefits were due to Ward Demolition’s ability to sell salvaged materials, thereduced need for heavy machinery and significantly reduced tipping fees — 95% of all thematerials were diverted from landfill.
[Information about this project has been adapted from a case study undertaken by theAuckland Regional Council as part of ‘Project C&D’. For more information contact the REBRIco-ordinator via www.rebri.org.nz.]
AUT Sports & Recreation Centre, Akoranga CampusSource separation is the collection of wastes on the construction site where they are produced.Materials are collected in separate bins, cages or piles depending on their material type andlevel of contamination. Source separation creates material streams that can be directlyforwarded to users or reprocessors. It thereby avoids the disposal of large quantities of wasteto landfill and uses them as a replacement for materials, which would otherwise have to beextracted from the diminishing stock of non-renewable resources. The scraps and wastesgenerated at construction sites are more likely to be recyclable than demolition wastes due tothe relative ease in separating materials and the lower degree of contamination.
Hawkins Construction was contracted by Auckland University of Technology (AUT) toconstruct a new sports and recreation centre at their Akoranga Campus on Auckland’s NorthShore. The construction site within the Akoranga Campus was an empty lot, so no demolitionwas necessary. Construction of a new sports and recreation centre started in early April 2000.The total construction time was nine months.
The materials to be separated on site were chosen on the basis of quantity, recyclability(outlets), and the value of scrap or recycled material. Subcontractors were introduced on theirarrival to the site of the aims and requirements of the trial. An area on site was assigned as theseparation centre and all bins were marked and colour-coded according to their content.
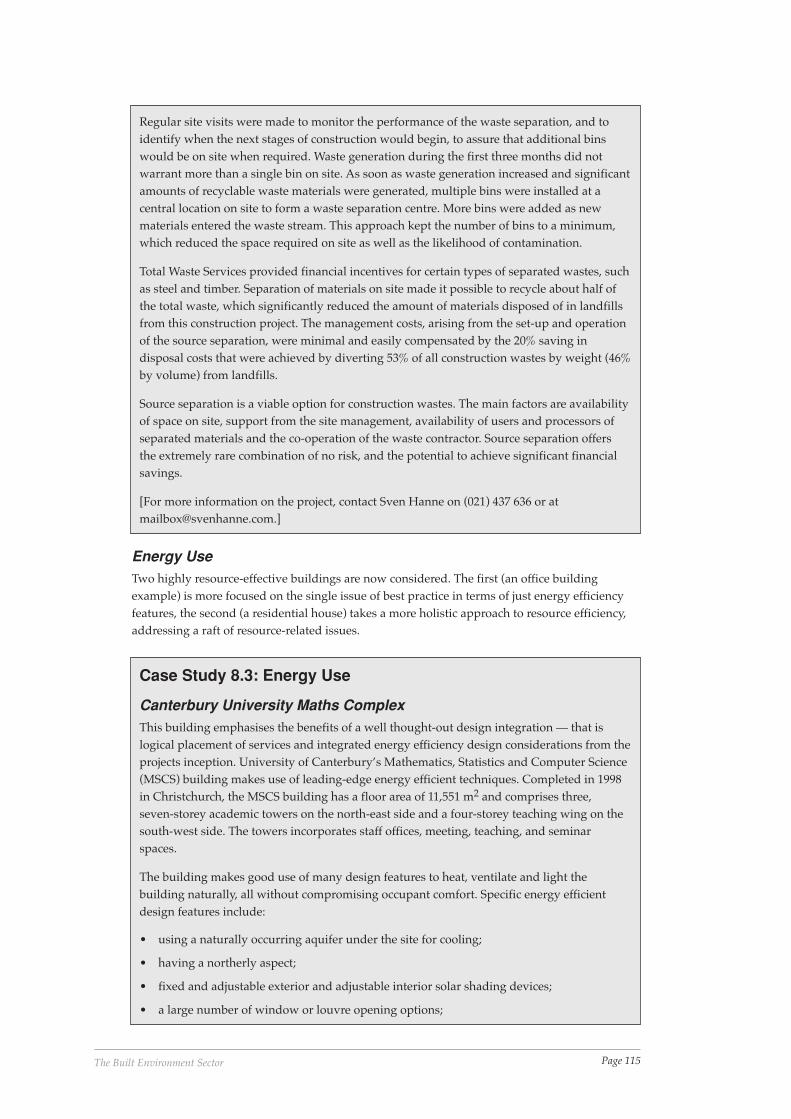
Page 115The Built Environment Sector
Energy UseTwo highly resource-effective buildings are now considered. The first (an office buildingexample) is more focused on the single issue of best practice in terms of just energy efficiencyfeatures, the second (a residential house) takes a more holistic approach to resource efficiency,addressing a raft of resource-related issues.
Regular site visits were made to monitor the performance of the waste separation, and toidentify when the next stages of construction would begin, to assure that additional binswould be on site when required. Waste generation during the first three months did notwarrant more than a single bin on site. As soon as waste generation increased and significantamounts of recyclable waste materials were generated, multiple bins were installed at acentral location on site to form a waste separation centre. More bins were added as newmaterials entered the waste stream. This approach kept the number of bins to a minimum,which reduced the space required on site as well as the likelihood of contamination.
Total Waste Services provided financial incentives for certain types of separated wastes, suchas steel and timber. Separation of materials on site made it possible to recycle about half ofthe total waste, which significantly reduced the amount of materials disposed of in landfillsfrom this construction project. The management costs, arising from the set-up and operationof the source separation, were minimal and easily compensated by the 20% saving indisposal costs that were achieved by diverting 53% of all construction wastes by weight (46%by volume) from landfills.
Source separation is a viable option for construction wastes. The main factors are availabilityof space on site, support from the site management, availability of users and processors ofseparated materials and the co-operation of the waste contractor. Source separation offersthe extremely rare combination of no risk, and the potential to achieve significant financialsavings.
[For more information on the project, contact Sven Hanne on (021) 437 636 or [email protected].]
Case Study 8.3: Energy Use
Canterbury University Maths ComplexThis building emphasises the benefits of a well thought-out design integration — that islogical placement of services and integrated energy efficiency design considerations from theprojects inception. University of Canterbury’s Mathematics, Statistics and Computer Science(MSCS) building makes use of leading-edge energy efficient techniques. Completed in 1998in Christchurch, the MSCS building has a floor area of 11,551 m2 and comprises three,seven-storey academic towers on the north-east side and a four-storey teaching wing on thesouth-west side. The towers incorporates staff offices, meeting, teaching, and seminarspaces.
The building makes good use of many design features to heat, ventilate and light thebuilding naturally, all without compromising occupant comfort. Specific energy efficientdesign features include:
• using a naturally occurring aquifer under the site for cooling;
• having a northerly aspect;
• fixed and adjustable exterior and adjustable interior solar shading devices;
• a large number of window or louvre opening options;
Page 116 Resource Stewardship and Waste Minimisation
• an atrium which brings natural light into the core of the building while doubling as aventilation chimney;
• the use of carefully positioned thermal mass to maintain even indoor temperatures; and
• the use of insulated precast concrete panels which doubles as a thermal storage medium.
All these provisions contributed to keeping the direct energy requirements down to a low143 kWh/m2, which is within the new NEECS target value of 150 kWh/m2 (this compares toan average office building of around 400 kWh/m2). As part of energy efficiency strategies,the lighting is designed to a very economical 9 W/m2 of floor area — half of the energyintensity specified by the New Zealand standard, and means that the effects of waste heatfrom the lighting are reduced. The building has achieved this through a combination ofpassive means (using natural air flows) as well as mechanically assisted air conditioning. Inaddition to this, the building is recognised as being structurally efficient — for example, theceiling in the teaching block also serves as a thermal sink and provides space for servicessuch as sprinklers and ventilation.
A post occupancy survey was carried out three years after completion and the occupantsrated it highly in terms of the provision of lighting, comfort, temperature, air quality andnoise. The key to the success of this design was the careful planning and integration ofdesign specialists from the project’s inception. This resulted in a high-quality building whichnot only has lower operation costs but also a lower capital cost compared to a typicalbuilding of its size. As a result, the university has been prompted to include energyconsumption benchmarks into briefs for new buildings.
Many of the concepts and features associated with this building are applicable to officebuildings. Passive solar design features, integrated service design and post occupancyevaluation checks are all techniques with well documented benefits to make buildings moreeffective amenity providers.
[Information about this development has been adapted from Energy Wise News, Issues #59(1998) and #75 (2002). For more information on the post occupancy evaluation, contact DrGeorge Baird at [email protected] ]
Waitakere’s Eco-Friendly HomeThe second example considers some of the latest energy efficient technologies wrappedwithin an ‘environmentally friendly’ framework. Not only energy related resources areconsidered, but also material resources, water resources, air quality, health, and economicconsiderations. This 156 m2 detached house, completed in 1998, is a single-storey dwellinglocated in the suburb of Kelston, in Waitakere City. The design incorporates indoor-outdoorfeatures in which three building wings surround a U-shaped courtyard. The aim was tobuild an eco-friendly home, which was sensitive to nature, and healthy and sympathetic tothe lifestyle of its occupants. For this building, energy efficiency is one of a palette ofresource issues examined as part of the overall environmental assessment.
The energy efficiency features can be divided into whole house initiatives and those relatedto major appliances. Many passive solar aspects were included for the whole house. Thefloors, walls and ceilings all have insulation far beyond the code requirements, with a fifth ofthe total window area double-glazed. The warmer living spaces are located on the northernaspect and good use is made of carefully-sized overhangs to reduce summertimeoverheating. A portion of the total floor area is designed as a heat sink (by means of a sun-exposed concrete and tile combination) and good use is made of cross-ventilation forsummertime cooling. Many of the major appliances are also energy efficient. Heat-pumptechnology is used for both space and water heating, reducing energy consumption by a
Page 117The Built Environment Sector
8.6 Governance of the SectorThis Section provides an overview of the governance of the built environment sector and whereapplicable, the extent to which it contributes to resource stewardship. Governance is defined asthe mix of legislative, non-statutory, public and private ‘managerial structures’ which contributeto leadership within each of the key themes.
Urban SprawlIn an earlier section, the management framework for the control of urban areas was outlined.The key pieces of legislation in this package were highlighted, namely the Local GovernmentAct 1974 and the Resource Management Act 1991. Secondary legislative governance is providedby other legal documents such as NZS 4404 (in preparation), the Land Transfer Act 1952, theBuilding Act 1991 and the Building Code Handbook 1992. The recently released SNZ Handbook‘Subdivision for People and the Environment’ (Standards New Zealand, 2001), while not yetstatutory, provides governance in that it aims to provide certainty for urban managers wantingto progress resource stewardship in an urban context.
This emerging legislative basis and the increasing production of urban design guidance by localauthorities (as outlined above), is occurring in tandem with a ‘policy push’ by the Ministry forthe Environment towards more sustainable urban design and an increasing interest in urbanissues in general. This means that there is likely to be greater emphasis placed on inter-depart-mental co-ordination over policies related to urban development, and more central governmentguidance in relation to alternative design solutions.
Guidance is also being provided at the regional and local level in Auckland and Christchurchwith the strategic documents “Auckland Regional Growth Forum” (Auckland Regional Council,1999) and “Future Path” (www.futurepath.org.nz) respectively. Each strategic document is basedon a 50-year vision. These over-arching documents provide long-term guidance/governance forquality urban development. They aim to provide strategic direction for our urban space in sucha way as to influence the land management framework to improve quality of life.
In summary, governance in an urban sprawl context is being provided at central, regional and
factor of four. Both the cook top (which uses magnetic induction) and the dishwasher arehighly energy efficient. Water efficient taps, mixers and showers also contribute to energyefficiency, by reducing the amount of hot water needed.
Unfortunately, this house has not been monitored so a picture of its actual performance isunavailable. However, as a showcase of what can be achieved under ‘typical’ budgetaryrestraints while being acceptable to the wider property market, this home has beensuccessful. Perhaps the most striking thing about the building is its ‘normalcy’. Althoughleading-edge technology has been applied, it has an unremarkable street-view and integrateswell into the urban environment. As for the former office-building example, it was also builtfor a reasonable expense.
In terms of the energy efficient features, many of the low or no-cost examples used withinthis design can be freely (and usually easily) applied to other house designs — principallypassive solar design. However, the other features which have a higher initial cost (such asthe heat pump technology used for space and water heating) are also applicable but morefocused on the longer-term aspects.
[Information about this development has been adapted from Waitakere City Council’sbooklet ‘Eco-Friendly Home’. Further enquiries should be directed to Waitakere CityCouncil’s Waitakere Properties Ltd.]
Page 118 Resource Stewardship and Waste Minimisation
local levels via legislative and non-legislative mechanisms — some of which have been high-lighted in this Section.
Material WasteCurrent legislation regulating the generation and management of wastes is exclusively reactive,dealing with waste materials once these are created (end-of-pipe solutions), rather than proac-tive, targeting waste generators and promoting cleaner production techniques. There is no lawin place in New Zealand with waste minimisation specifically in mind. But the need for such apiece of legislation is increasing. So far it has been proactive territorial authorities that havestruggled to implement tougher regulations regarding the production of waste with the existingset of legislative instruments. With the arrival of the New Zealand Waste Strategy, this challengehas reached another order of magnitude.
The New Zealand Waste Strategy (www.mfe.govt.nz) launched in March 2002 aims to changethe emphasis from the current end-of-pipe approach, which focuses on waste disposal, to apreventive management concept, which focuses on a more efficient use of materials, wasteprevention and resource recovery. The Waste Strategy promotes cleaner production and outlinesspecific, practical targets for various waste streams. But it is a strategy, not a piece of legislationand therefore it does not have the power to enforce compliance. The Ministry for the Environ-ment has indicated that a failure of the market to respond to the strategy and alter their opera-tions to support the strategy goals would lead to making the strategy mandatory, but no specifictimeframe, or measures have been named. As a result of this lack of direct governance, allapplicable existing legislation is under scrutiny to identify acts and laws that can be employedto manage the ever-increasing waste problem.
As with urban sprawl, there are a number of laws that relate to waste management within theconstruction industry. The main sources of regulations for promoting waste minimisationwould be regional or district plan rules under the Resource Management Act (RMA, 1991), byconditions attached to resource consents granted under it, and bylaws under the Local Govern-ment Act (LGA, 1974) and the Health Act (1956). The New Zealand Building Act (1991) limitsthe power of territorial authorities and thereby acts as a barrier to the enforcement of wasteminimisation initiatives in the construction sector.
An outline of the major pieces of existing legislation affecting the generation and handling ofwaste can be found in Appendix 1. While it is possible for territorial authorities to initiateavoidance and recovery of construction and demolition wastes using existing legislation, it is socomplicated that few authorities are likely to succeed in implementing this mechanism.
The Waste Strategy recognises that New Zealand lacks a central agency, as well as the compre-hensive legislation dedicated to the management and minimisation of wastes that other OECDcountries have. These issues will be addressed in the current review of the Local GovernmentAct. In the meantime local authorities will have to try to reduce the vast amounts of C&D wastewith a mix of laws and bylaws that were never designed for the task. While this may be easierto implement and face less opposition from the industry, it lacks the practicability and thesymbolic function a purpose built piece of legislation would have.
Energy useKey building-related energy efficiency/conservation requirements are the NZBC and itsassociated standards (NZS 4218 (1996a), NZS 4243 (1996b) and NZS 4214 (1996d)), and theupcoming Energy Efficiency Regulations 2002 (which govern the sale of energy efficient items).The main drivers for having energy efficiency performance standards at all are seen to befulfilling central government energy policy having national positive interest — being good forall in terms of health, independence from non-renewables, etc (Isaacs, 1999). However, in futureupgrades, the basis for the changes is more likely to be influenced by the Energy Efficiency and
Page 119The Built Environment Sector
Conservation Act 2000 and the resulting National Energy Efficiency and Conservation Strategy(NEECS) (EECA, 2001a). In the future this could become more important because of NewZealand’s environmental obligations — i.e. the Kyoto Protocol.
The NEECS programmes will, in all likelihood, have significant and far-reaching impacts on theway New Zealanders think about and use building-related energy. It provides practical volun-tary and mandatory measures and instruments, drawing upon the assistance of a wide range oforganisations — including research, community groups, TLA’s, central government agencies,and Standards New Zealand. The buildings’ ‘Action Plan’ targets all three determinants ofbuilding energy use — building envelope, appliances and the occupants — thereby having thebest chance of success.
To some degree, energy efficiency will also be influenced by non-mandatory measures — a hostof which have recently come out of the umbrella of ‘good urban design’. The three instigators ofthese guidelines — central government, local government and Standards New Zealand have allbeen very active in promoting the benefits of energy efficient design features (whether directlyor indirectly). The major examples were discussed earlier.
It is recognised that for a durable programme to operate successfully, there must be a goodstrategic mix of both market and mandatory measures. Saville-Smith (1998) suggests that theconstruction industry could be more responsive to energy efficiency5 without regulatoryintervention, through promotion, provision of information to consumers and the developmentof affordable products. To some degree, this has been addressed by the building industry,through a variety of initiatives, including the “Gib Living Solutions Home Owners Guide”(Winstone Wallboards, 2000) and the New Zealand Cement and Concrete Association’s “Design-ing Comfortable Homes” (NZCCA, 2001). These target issues of comfort rather than the longer-term economic/environmental or other benefits.
It is difficult to determine the influence of any these documents on actual design considerationsgiven that very little, if any, monitoring has been carried out. It is also difficult to gauge howmuch they contribute to resource use and stewardship within the building sector. However, it isexpected that these initiatives will be greatly aided by the growing environmental concerns andawareness of environmental issues in general — largely thanks to the Kyoto Protocol.
8.7 Drivers for ChangeThis Section describes the main driving factors, influences and mechanisms behind the emer-gence of resource stewardship principles within the building sector.
Urban SprawlDespite the current management framework in place to avoid wasteful use of land, there isincreasing pressure from councils for more guidance. Hence, the shift of focus from regulationto strategy — seen by the development of long-term strategies for urban areas (as discussedearlier). This mix of governance mechanisms should encourage a more integrated approach, asthey bring local governments, communities, infrastructure providers and the private sectortogether — or at least provide a common goal to work towards.
While the drivers for this change can also be viewed as barriers to progress, the change of focustowards improved resource stewardship can typically be grouped as (BRANZ et al, 2000):
• Land price and availability — characterised by zoning that does not facilitate higher densityresidential development, high development costs of brownfield sites, and buyer demand forlarger, detached sites.
5 Energy efficiency is used here as a proxy for climate change, as it is essentially a subset of it.
Page 120 Resource Stewardship and Waste Minimisation
• Transport — characterised by relatively ineffective public transport systems, road conges-tion, and a public who are ‘married’ to their cars.
• Infrastructure cost and capacity — infrastructure costs for low-density greenfield develop-ments are high.
• Environmental pollution — urban sprawl has given rise to significant environmental andhealth impacts, e.g. declining air and water quality, vehicle emission pollution, and otherhealth problems due to reduced leisure time and exercise.
• Demographics — an aging population combined with changes in family structures hasimpacts on housing choice and demand.
• Lifestyle — quality of life is very important. People want easy access to their place ofemployment, home and leisure pursuits.
All of these features are driving the push for improved stewardship of urban areas. The gover-nance mix of the urban management sector, the legislative and non-statutory framework, andthe shift of focus towards strategic planning and guidance, all point to the same outcome —prevention of uncontrolled human settlement development. Taking a resource stewardshipapproach means that it is possible to have growth without sprawl! The results:
• management of growth;
• security of community; sense of place and space;
• quality of life;
• preservation of the natural environment;
• better use of resources, both natural and supplied; and
• better building and infrastructure design.
As these results become realised, they create a positive feedback loop, and thus strengthen thedriving forces further.
Material WasteThe previous section illustrated the current lack of regulatory guidance on waste minimisationand recycling, but there are indirect pressures, based on statutory requirements in other areas aswell as from non-governmental sources, towards a change in the current management of C&Dwaste. Similar to current legislation (as described above), these pressures are focused on the endof the pipe — land disposal (landfills and cleanfills), with the exception of the New ZealandWaste Strategy (Ministry for the Environment, 2002a) which aims to introduce cleaner produc-tion into New Zealand industries. The pressure resulting from land disposal operations and theNew Zealand Waste Strategy can be separated into three groups — although in some cases thelines are blurred:
Social
• hard to site new landfills due to opposition from NIMBY6 and local communities; and
• decreasing acceptance of the generation of waste.
Environmental
• existing landfill sites had to close due to conflicts with the RMA;
• currently illegally operating cleanfills will be monitored or closed due to the RMA and theNew Zealand Waste Strategy (Ministry for the Environment, 2002a); and
• cleanfills will be monitored more closely, therefore more materials need to be taken to the
6 Not In My Back Yard – local residents who oppose the siting of landfills, incinerators, etc close to their homes.
Page 121The Built Environment Sector
more expensive landfills, based on Ministry for the Environment’s Cleanfill Guidelines(2002b).
Economic
• rising cost of waste disposal:
— full cost pricing according to Ministry for the Environment’s Landfill Full CostAccounting Guide (2002c);
— expensive process of siting new landfills due to opposition from NIMBY & localcommunities; and
— closer monitoring of cleanfills will require more materials to be sent to landfills initiatedby Ministry for the Environment’s Cleanfill Guidelines (2002b).
While all these pressures discourage the continuation of current waste generation and disposalpractices, purely financial calculations of disposal costs do not capture the plentiful less-quantifiable benefits, which accrue to construction companies as a result of improved environ-mental performance. These include improved public image and goodwill, and improved staffmorale. Both of the latter foster loyalty and lengthen relationships. The opportunity costs of notaddressing waste are anything but negligible. In the near future companies will be recognisedfor activities (or lack thereof) that create environmental and social value for their stakeholders,in addition to economic value.
As a result of a case study, one Auckland based waste service company has found that support-ing source separation (logistically as well as financially) has been perceived well by theircustomers and given them access to building sites of larger construction companies whooriginally dealt exclusively with a preferred waste management contractor. Many site manag-ers, foremen, builders and site workers have commented to them that they prefer to send theirwaste materials to recycling or reuse rather than to the landfill. During trials it has turned outthat waste materials collected in separate containers are more likely to be reused on site, thanthose collected as mixed waste. This reduces the amount of waste as well as the cost of materialsper project.
Energy UseTo a large extent, the main ‘driver’ of building energy efficiency is the statutory requirementsunder the New Zealand Building Code (NZBC, 1991). The New Zealand Building Act (NZBA,1991) requires the provision for necessary controls relating to building work having particularregard for the need to facilitate the efficient use of energy (in the case of new buildings) duringthe buildings lifetime. The Building Act is enacted through the NZBC, which sets minimumstandards for new buildings. These minimum standards depend on variables such as thebuilding’s type, location and size. Domestic and office buildings have a requirement to achievean ‘adequate’ degree of energy efficiency when energy is used for modifying temperature orhumidity or both, providing hot water and (for larger commercial building only) providingartificial lighting. The term ‘adequate’ is important, as the required energy efficiency measuresin the code were never intended to achieve ‘good’ (i.e. energy efficient) design (Isaacs, 1995).However, there is a misconception by both the public and the building industry that Coderequirements represent ‘good’ rather than ‘minimum’ practice.
New Zealand’s building-related energy-use picture becomes even bleaker when considering theentire building stock. It is estimated that 70% of housing stock was built before it was subject toany mandatory energy efficiency requirements (EECA, 2000a). Nearly half of the houses in thestock (i.e. 600,000) were under-insulated. It is estimated nearly 100% of commercial buildingswere built before they were subject to mandatory building code energy efficiency requirements,with virtually the entire stock probably not able to meet the new energy efficiency standard forlarge buildings (EECA, 2000a). This all makes for a very energy-inefficient building stock.
Page 122 Resource Stewardship and Waste Minimisation
The ‘bottom line’ is that most architects do not perceive energy efficient design as importantenough to place it high on the list of factors they consider most important to define goodarchitecture. Thus, they don’t incorporate energy efficiency features to a notable extent in theirworks. Other ‘economically themed’ drivers affect the energy efficiency initiatives in themarketplace. However, these are more secondary in nature. These include the cost of varioustypes of energy (mostly electricity), which is, on an international scale, very inexpensive. Powercrises (such as in Auckland in 2000) are only a short-term driver, as its perceived importanceand therefore influence is fleeting.
In terms of social-related initiatives, there are a variety of resources available including: Internetsites (such as www.eeca.govt.nz, www.ecan.govt.nz), general guidelines (such as ‘People, Places,Spaces’ (Ministry for the Environment, 2002), ‘Passive Solar Design in New Zealand Homes’ (EECA,2000b), detailed technical information such as ‘Design for the Sun’ (EECA, 1994) and BRANZTechnical Bulletins), and design-specific tools (such as BRANZ’s ‘ALF3’ (Stoecklein and Bassett,2000)), demonstration homes (in Auckland and Wellington), and services (such as the recentlylaunched PV Association and private contractors), and education (such as the Universities andPolytechnics architecture, design and engineering courses). Just how influential any one of theseresources are in changing peoples attitudes and modifying behaviour is unknown.
The NEECS (EECA, 2001a) can be seen in as an environmental initiative — and should be veryinfluential in changing peoples attitudes to better resource management in terms of the builtenvironment. Core initiatives include:
• The forthcoming ‘Better’ and ‘Best’ design standards for non-residential buildings in placeby 2005. This will set an easily defined target, and benchmark all buildings.
• The piloting of the integrated design team in 2002/2003 which will culminate in energyefficient designers for commercial buildings and the best performing building award in 2004onwards
• A new standard for the operation and commissioning of energy efficient commercialbuildings by 2004.
• The development of a national Home and (non-residential) Buildings Energy Rating Scheme(HERS and BERS, respectively), which may result in mandatory HERS consumer informa-tion for house sales by 2006.
The Kyoto Protocol, which has been ratified by New Zealand, will also have some influence onenergy use in buildings. Consumers will have to pay a noticeable extra on their power bill, evenif the proposed small tax (at $25/t carbon) is introduced. Consumers may respond by eitherconserving more or becoming more energy efficient.
In addition to national initiatives, some local authorities have are also been proactive in thepromotion of energy efficiency (whether by a environmental stewardship or economic andsocial). An example of this is Christchurch City Council’s energy efficient showhome and webresources available for both new and existing residential and office buildings(www.ccc.govt.nz). These initiatives are likely to result in a greater awareness of energy effi-ciency issues, and create market incentives and demand for effective products and services.
8.8 Conclusions and RecommendationsThis section draws conclusions and makes recommendations on how to progress further interms of improved resource stewardship, by examining the lessons to be learned from existing‘standard’ and ‘best’ practice.
Urban SprawlIt is clear from the preceding Sections that good tools for improving urban land use are avail-
Page 123The Built Environment Sector
able from a variety of sources, and that use of these is reflected in the move towards good urbanplanning. However, while positive examples of good urban design and planning are emerging,they are still few and far between and continue to be hindered by legislative constraints. Thedifficulty in preventing urban sprawl is that the constraints and barriers that are described ashindering consolidated planning, can equally be described as drivers and opportunities. Forexample zoning and rule-based planning is routinely criticised, but if written in a more proac-tive way, could require more design led planning processes to be employed. This means thatimproving resource stewardship in a land use context is both conceptually and logisticallychallenging. Overall, the lessons learned from standard and best practice can be summarised asfollows:
• good tools are available from a variety of sources;
• there is a move towards good urban planning;
• there are good examples emerging, but few in number;
• drivers/constraints and opportunities/barriers to preventing urban sprawl can be the same;
• the RMA does not address urban design issues specifically; and
• not everyone thinks urban sprawl is a resource use problem.
By identifying these lessons, what further needs to be done to improve resource stewardshipwithin the land management paradigm to minimise wasteful use of urban space?
We suggest two recommendations with regard to urban sprawl:
• Create an organisational structure to focus attention on urban issues, e.g. an ‘Urban LandInstitute’ or ‘Ministry of Urban Affairs’7.
• Create partnerships. Partnerships must be created amongst developers, architects, planners,the construction and building products industry, professional organisations, regulatoryauthorities, and the community. This is seen as necessary to champion resource stewardshipprinciples and ensure consistent, ongoing implementation of them.
Material WasteIt has been illustrated that the waste stream described as C&D waste is highly heterogeneouswith its constituents depending on the stage within a structure’s life cycle and the type of workundertaken. Correspondingly, the options and challenges for resource stewardship vary. Ingeneral, based on the types, quality and volumes of materials consumed and the amount ofwaste produced, the construction sector has a high potential for recycling and reintroduction ofrecycled materials. Currently no advantage is taken of this potential.
The discussion of the generation and management of solid wastes within the building sectorillustrates that current standard practice is based on cheap and easy disposal of waste materialsat landfills and cleanfills. Construction professionals as well as their customers are generally notinterested in waste reduction but accept its generation as part of the construction process.Additionally, the small size of an average construction firm and the conservative nature of theindustry obstruct the distribution of information on better and best practice, and acts as anencumbrance to change. While recycling is well perceived amongst construction professionalswhen involved in trials, only short-term changes are made. The small additional effort required,prevents firms from continuing with recycling programmes on their own. Furthermore, materi-als collected for recycling are usually not re-introduced into the construction process but down-cycled into materials of lesser quality than their origins, and therefore not valued as a resource.
It has been shown that a substantial body of knowledge on better and best practice is available
7 Since the time of writing this chapter (May 2002), Hon. Marian Hobbs has been appointed as the Minister responsible forUrban Affairs.
Page 124 Resource Stewardship and Waste Minimisation
to industry professionals as well as to the general public. While none of these guides arecomprehensive, they represent a good amount of information and support, which is available atlittle or no cost. The guides are based on case studies carried out in different parts of NewZealand and have been successful in reducing and diverting waste volumes going to landfillsand cleanfills. Most industry trials have focused on end-of-pipe solutions rather than avoidingwastes through design changes, although design guides illustrating how to incorporate wastereduction during the design stages are available. The main obstacle for all these programmesappears to be their voluntary nature.
At the time of writing, there was no legislation in place in New Zealand aimed at the reductionof waste produced. While current legislation may technically enable local government to requirewaste reduction or recycling on construction sites, it is unpractical to implement and question-able whether such conditions would withstand challenging in the Environment Court.
The Ministry for the Environment has provided guidance with the introduction of the NewZealand Waste Strategy. In addition to aiming for a general reduction of waste volumes, ittargets individual sectors on the basis of their waste volumes and their hazard to the environ-ment. Construction and demolition waste is one of these targeted groups because of the exces-sive waste volumes it produces. While the introduction of this strategy has not altered the legalvacuum, it has put waste reduction in the spotlight.
To achieve the goals set by the strategy, a comprehensive national programme, based onindustry education, incentives and a statutory framework, will be required. Statutory require-ments could include diversion, recycling and recycled content quotas. Additionally, the disposalof construction and demolition waste needs to be monitored and controlled more closely andthe disposal of all waste must be charged on a full cost basis. Simple measures have the poten-tial to reduce C&D waste by 50%, overseas examples show that more sophisticated measurescan exceed 90% diversion.
Energy UseBuilding-related energy use and efficiency has a very low profile, both in the design fraternityand the public domain. Associated with this is the fact that New Zealand’s domestic and officebuilding stock operates inefficiently, with a large proportion having little thermal insulationinstalled. It is known that there is ample opportunity to greatly reduce energy demand —whether through retrofitting or within new building design.
The reasons for its low profile are many and they are well documented. To raise this profile andpromote long-term change, three ‘operators’ must work in unison — awareness, tools andmotivation. These should be presented as a mixture of voluntary and legislative measures,embracing both the ‘carrot’ and the ‘stick’ approaches.
To a large extent, this ideal — based on these three operators — is embraced by the newlyreleased NEECS “Action Plan for Buildings and Appliances”. The NEECS has three overarchingobjectives:
• upgrade the energy efficiency rating of existing homes and commercial buildings;
• achieve best practice design in new buildings; and
• improve appliance energy efficiency to best practice.
For the first time, the New Zealand building industry is about to have specific tools (in the formof The Code of Good Practice for new residential and commercial buildings) to easily measure theirperformance. Designs will be able to be benchmarked in a quantitative manner for not onlyenergy use/savings but its associated comfort benefits. This will give market differentiation fordevelopers with likely positive feedback from potential building owners. This ‘market transfor-mation’ activity based on the ‘carrot approach’ will, in all likelihood have sustained long-
Page 125The Built Environment Sector
reaching consequences. In terms of the existing stock (which has the greatest potential forimprovement), the NEECS also provides a variety of programmes to improve their energyefficiency, addressing both the physical and management (commissioning) aspects.
These NEECS programmes for new and existing buildings will undoubtedly have flow-oneffects. For example, as new home owners become aware of the choice between having aminimally Code insulated house or a more comfortable option, expectations of higher qualitywill need to be met. As the market becomes better informed, pressure is put on exceeding theminimum expectation required by mandatory standards.
8.9 ReferencesAuckland Regional Council, 1999. Auckland Regional Growth Forum. Auckland.
Auckland Regional Council, 2001. The Residential Design Guide. Auckland.
Bachels, M, Newman, P, Kenworthy, J, 1998. “Intractable problem or attractive opportunity:reducing urban transport energy use in New Zealand cities — an international comparison”,Proceedings of Solar ’98, Australian and New Zealand Solar Energy Society.
Boyle, C, 1998. “Cleaner production in New Zealand”, Journal of Cleaner Production, No.7, pp 59-67.
BRANZ, Fletcher Challenge, Forest Research, 2000. Smart Growth, BRANZ, Judgeford,Wellington.
BRANZ, 1995. Heat Loss Reduction in Houses. Bulletin Number 334. Judgeford,, Wellington.
BRANZ, 2002. Improving Thermal Insulation. Bulletin Number 427. Judgeford, Wellington.
Broughton, H F, 1965. Economic Site Organization and Building Supervision, E & F N Spon, Lon-don, United Kingdom.
Bruce, E, 2002. BRANZ Advisory Help Line, Personal Communication.
Building Act (1991), Government Press, Wellington.
Camilleri, M and Jaques, R, 2001. Implications of Climate Change for the Construction Sector: OfficeBuildings, BRANZ, Judgeford, Wellington.
Cement and Concrete Association of New Zealand and Energy Efficiency and ConservationAuthority, 2001. Designing Comfortable Homes, Published by Cement and Concrete Association ofNew Zealand, Wellington.
Centre for Advanced Engineering (CAE), 1996. Energy Efficiency – A guide to Current and Emerg-ing Technologies. Volume 1 – Buildings and Transportation, University of Canterbury, Christchurch.
Dalloz, A, 1997. The contribution of New Zealand local authorities to the promotion of cleaner produc-tion: Are rules appropriate instruments? The example of the building industry in the Auckland Region.Department of Planning, University of Auckland. Auckland.
Energy Efficiency and Conservation Act, 2000. Government Press, Wellington.
Energy Efficiency and Conservation Authority, 1994 ed. Design for the sun. Volume 1: WorkingManual. Residential Design Guidelines for New Zealand, Wellington.
Energy Efficiency and Conservation Authority, 2000a. Draft National Energy Efficiency andConservation Strategy – The Built Environment, EECA, Wellington.
Energy Efficiency and Conservation Authority, 2000b. Passive Solar Design for New Zealand
Page 126 Resource Stewardship and Waste Minimisation
Homes, Wellington.
Energy Efficiency and Conservation Authority, 2001a. National Energy Efficiency and ConservationStrategy, Wellington.
Energy Efficiency and Conservation Authority, 2001b. National Energy Efficiency and ConservationStrategy. Action Plan: Buildings and Appliances Programme – Towards a sustainable energy future,EECA, Wellington.
Energy Wise News, 1998. “Maths School puts green design into the equation”, Energy WiseNews, No.59, pp 8-12.
Energy Wise News, 2002. “The proof of the building”, Energy Wise News, No.75, pp 22-24.
Gjerde, M, 2000. “Planning friendly cities for the future”, New Zealand Concrete, March 2000, pp10-16.
Guthrie, P., Wolveridge, C, 1998. “Minimising waste in construction”, The Sustainable CityConference, Auckland, Institution of Professional Engineers New Zealand.
Health Act, 1956. Government Press, Wellington.
Isaacs, N, Lee, J, Donn, M, 1995. Energy Efficiency in the NZ Buildings Code – A New Structure.Centre for Building Performance Research, Victoria University of Wellington, Wellington.
Isaacs, N, Bennett, A, Sharman, W and Jaques, R, 1997. “Legislative opportunities to reduce CO2
emissions in New Zealand, Presented at CIB TG8 Second International Conference on ‘Buildings andthe Environment’, Paris, 9-12 June.
Jaques, R, 1998. The Influence of Design and Procurement on Construction Site Waste Generation – APilot Study, BRANZ, Judgeford, Wellington.
Kibert and Languell, 2000. Implementing Deconstruction in Florida: Material Reuse Issues, Disassem-bly Techniques, Economics and Policy, Centre for Construction and Environment, University ofFlorida, Gainesville.
Ledbury, M and Frisbie, L, 2002. “The changing face of New Zealand housing”, New ZealandEnvironment, 8 Feb 2002, pp 9-11.
Local Government Act (LGA), 1974. Government Press, Wellington.
Massey University, 1992. End Use Database for the New Zealand Economy, Palmerston North.
Memon, P A and Perkins, H, (Eds.), 2000. Environmental Planning and Management in NewZealand, Dunmore Press Ltd, Palmerston North.
Ministry of Commerce, 1997. New Zealand Energy Data File 1997, Ministry of Commerce,Wellington.
Ministry of Economic Development, 2002. Energy data web site www.med.govt.nz. AccessedJune 2002.
Ministry for the Environment, 1997a. The State of New Zealand’s Environment, Ministry for theEnvironment, Wellington, New Zealand.
Ministry for the Environment, 1997b. National Waste Data Report, Ministry for the Environment,Wellington, New Zealand.
Ministry for the Environment, 2002a. The New Zealand Waste Strategy – Towards zero waste and asustainable New Zealand, Wellington.
Page 127The Built Environment Sector
Ministry for the Environment, 2002b. A Guide to Managing Cleanfills, Wellington.
Ministry for the Environment, 2002c. Landfill Full Cost Accounting Guide for New Zealand,Wellington.
Ministry for the Environment, 2002d. People, Places, Spaces. A design guide for urban New Zealand,Wellington.
New Zealand Building Act, 1991. Government Press,Wellington.
New Zealand Building Code, 1991. Government Press, Wellington.
North Shore City Council, 2001. Good Solutions Guide, Auckland.
Ove Arup and Partners New Zealand and Opus International, 2001. Design Briefs for EnergyEfficient Commercial Buildings, prepared for the Energy Efficiency and Conservation Authority,Wellington.
Page, Ian, 2002. BRANZ Building Economist, Personal communication.
Parliamentary Commissioner for the Environment, 1998. The Cities and their People. NewZealand’s Urban environment, Parliamentary Commissioner for the Environment, Wellington.
Parliamentary Commissioner for the Environment, 2001. Managing Change in Paradise. Sustain-able Development in Peri-urban Areas, Parliamentary Commissioner for the Environment,Wellington.
Patterson, C, 1995. Preliminary Investigation of Construction and Demolition Waste in the AucklandRegion, Auckland Regional Council, Auckland.
Resource Management Act (RMA), 1991. Government Press, Wellington.
Roodman, D M and Lenssen, N, 1995. “Construction Destruction”, In Petersen, J (Ed) A BuildingRevolution: How Ecology and Health Concerns are Transforming Construction, Worldwatch Paper124, March 1995, Worldwatch Institute, Washington DC.
Royal Society of New Zealand, 1998. “Urban Sustainability in New Zealand”, Proceedings of aworkshop sponsored by the RSBNZ, UNESCO and PCE, October 1998, RSNZ Miscellaneous Series53.
Saville-Smith, K, 1998. The Social Dynamics of Climate Change Responsive Housing, Centre forResearch, Evaluation and Social Assessment, Wellington.
Searle, G, 1998. “How green is urban consolidation?”, Architecture Bulletin, Nov 98, 16.
Standards New Zealand. NZS 4218, 1996a. Energy Efficiency for Housing, Wellington.
Standards New Zealand. NZS 4243, 1996b. Energy Efficiency – Large Buildings, Wellington.
Standards New Zealand. NZS 4305, 1996c. Energy Efficiency – Domestic Type Hot Water Systems,Wellington.
Standards New Zealand. NZS 4214, 1996d. Methods for Determining the Total Thermal Resistancesof Parts of Buildings, Wellington.
Standards New Zealand, 2001. New Zealand Handbook 44:2001. Subdivision for People and theEnvironment. Standards New Zealand, Wellington.
Statistics New Zealand, 1998. Annual Business Frame Update for 1998, Statistics New Zealand,Wellington.
Page 128 Resource Stewardship and Waste Minimisation
Statistics New Zealand, 2001. Statistics New Zealand Quarterly Survey, December 2001, StatisticsNew Zealand, Wellington.
Statistics New Zealand, 2002. Building Consent Series - 5 year Averages, March 2002, Wellington.
Street, A, 1997. Composition of Waste. Auckland Region July 1996 – June 1997, Auckland RegionalCouncil, Auckland.
Stoecklein, Albrecht and Bassett, Mark, 2000. ALF3 – The ‘Annual Loss Factor’ Method. A designtool for energy efficient houses, BRANZ, Judgeford, Wellington.
The Building Act, 1991. Government Press, Wellington.
Waitakere City Council, 1999. Eco-Friendly Home – an example of a sustainable, healthy and environ-mentally friendly home, WCC, Auckland.
Waitakere City Council, 2000. The Better Building Code, WCC, Auckland.
Winstone Wallboards, 2000. Gib Living Solutions Home Owners Guide, Auckland.
www.sprawlwatch.org. Accessed May 2002.
www.beaumontquarter.co.nz. Accessed May 2002.
Page 129The Built Environment Sector
Appendix to Chapter 8: Key New Zealand construction waste-related legislation
The Resource Management Act 1991 (RMA)The RMA has a single, overarching purpose: to promote the sustainable management of naturaland physical resources. Although there is no reference to the concept of cleaner production inthe RMA, the cleaner production approach does not conflict with the purpose of the act, and itcan significantly contribute to achieving this purpose (Dalloz, 1997). However, since the RMAfocuses on effects, the major concern with regard to resource consents lies in the discharge ofwastes into the environment. Businesses negotiate with waste service companies to accept theirwastes, and are then not liable for the pollution from their waste – it is the responsibility of thecompany treating and disposing of the waste materials. In many cases the waste-producingcompany has limited knowledge of the wastes they produce and dispose of, their only concernis the cost of disposal, and this cost is often minimal. As a result, companies do not deemcleaner production programmes essential. Overseas there is a growing trend towards usingregulations at the building permit or consent stage to influence the waste generated byconstruction and demolition projects. In New Zealand, the implementation of wastemanagement plans, detailing how waste will be reduced, could be imposed as a conditionattached to resource consents. A performance bond could be required to ensure theirimplementation. The purpose of waste management plans would have to be specified in districtplans in accordance with the RMA.
The Local Government Act 1974 (LGA) and Local Government BylawsThe Local Government Act (LGA) defines, in very general terms, the purpose and functions oflocal governments (i.e. regional councils, city councils and district councils). The Act onlyallows local government to undertake activities listed in the Act and it usually goes further byprescribing how those activities must be undertaken. The LGA imposes on territorial authoritiesthe duty to “make provision for the collection and reduction, reuse, recycling, recovery,treatment, or disposal of waste in the district”. While this mentions the steps of the wastemanagement hierarchy, no order of preference is assigned to the individual processes, therebyputting avoidance on the same level with disposal. The LGA also provides territorial authoritieswith the power to make bylaws with regard to waste management. These can prohibit thedeposit of waste, or of specific classes of waste, or imposition costs to create incentives for wasteminimisation.
The Health Act 1956This act provides local authorities with the option to make bylaws to “improve, promote orprotect” public health and prevent or abate “nuisances”. Nuisances can be created by“accumulations” of wastes or deposits likely to be injurious to health and by the burning ofwaste material and other refuse from any business activity, so that it can harm public health.These regulations could be used to regulate certain aspects of construction and demolitionwork, such as the disposal and burning of waste on building sites, and the handling, applicationand storage of hazardous substances during building works. However, under this act, territorialauthorities would not be able to make bylaws regulating building products and imposing thedesign of healthy buildings. The Health Act has been amended by the Building Act so as to limitthe powers of territorial authorities to make bylaws regarding building design.
The Building Act 1991The Building Act is concerned with the control of building design and construction, and focusesmainly on the protection of human safety, health, property and amenity during the constructionand the use of buildings. The issues of resource-efficient design and waste minimisation onconstruction sites are not addressed; the overall environmental impact of building materials and

Page 130 Resource Stewardship and Waste Minimisation
techniques are not considered. Section 7(2) of the Building Act in fact limits the power ofterritorial authorities to impose requirements additional or more stringent than the BuildingCode under the RMA, unless this is justified by a particular planning or resource managementissue.
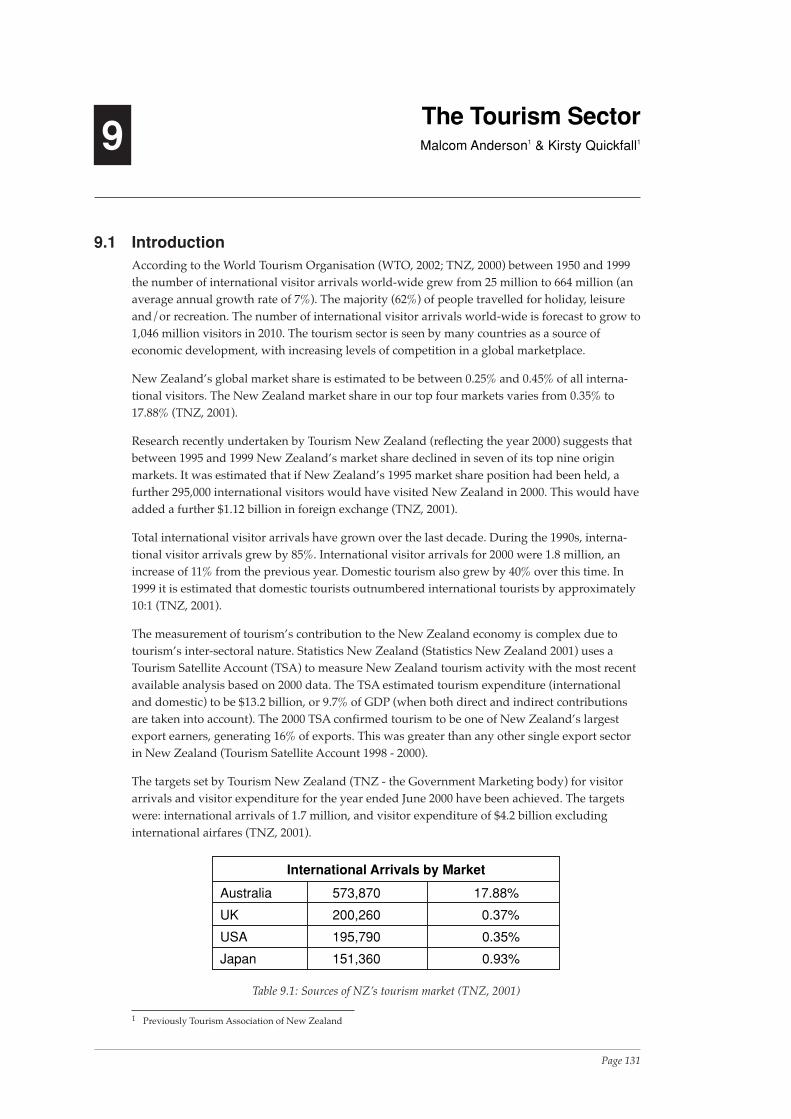
Page 131The Tourism Sector
9The Tourism SectorMalcom Anderson1 & Kirsty Quickfall1
9.1 IntroductionAccording to the World Tourism Organisation (WTO, 2002; TNZ, 2000) between 1950 and 1999the number of international visitor arrivals world-wide grew from 25 million to 664 million (anaverage annual growth rate of 7%). The majority (62%) of people travelled for holiday, leisureand/or recreation. The number of international visitor arrivals world-wide is forecast to grow to1,046 million visitors in 2010. The tourism sector is seen by many countries as a source ofeconomic development, with increasing levels of competition in a global marketplace.
New Zealand’s global market share is estimated to be between 0.25% and 0.45% of all interna-tional visitors. The New Zealand market share in our top four markets varies from 0.35% to17.88% (TNZ, 2001).
Research recently undertaken by Tourism New Zealand (reflecting the year 2000) suggests thatbetween 1995 and 1999 New Zealand’s market share declined in seven of its top nine originmarkets. It was estimated that if New Zealand’s 1995 market share position had been held, afurther 295,000 international visitors would have visited New Zealand in 2000. This would haveadded a further $1.12 billion in foreign exchange (TNZ, 2001).
Total international visitor arrivals have grown over the last decade. During the 1990s, interna-tional visitor arrivals grew by 85%. International visitor arrivals for 2000 were 1.8 million, anincrease of 11% from the previous year. Domestic tourism also grew by 40% over this time. In1999 it is estimated that domestic tourists outnumbered international tourists by approximately10:1 (TNZ, 2001).
The measurement of tourism’s contribution to the New Zealand economy is complex due totourism’s inter-sectoral nature. Statistics New Zealand (Statistics New Zealand 2001) uses aTourism Satellite Account (TSA) to measure New Zealand tourism activity with the most recentavailable analysis based on 2000 data. The TSA estimated tourism expenditure (internationaland domestic) to be $13.2 billion, or 9.7% of GDP (when both direct and indirect contributionsare taken into account). The 2000 TSA confirmed tourism to be one of New Zealand’s largestexport earners, generating 16% of exports. This was greater than any other single export sectorin New Zealand (Tourism Satellite Account 1998 - 2000).
The targets set by Tourism New Zealand (TNZ - the Government Marketing body) for visitorarrivals and visitor expenditure for the year ended June 2000 have been achieved. The targetswere: international arrivals of 1.7 million, and visitor expenditure of $4.2 billion excludinginternational airfares (TNZ, 2001).
International Arrivals by Market
Australia 573,870 17.88%
UK 200,260 0.37%
USA 195,790 0.35%
Japan 151,360 0.93%
Table 9.1: Sources of NZ’s tourism market (TNZ, 2001)
1 Previously Tourism Association of New Zealand
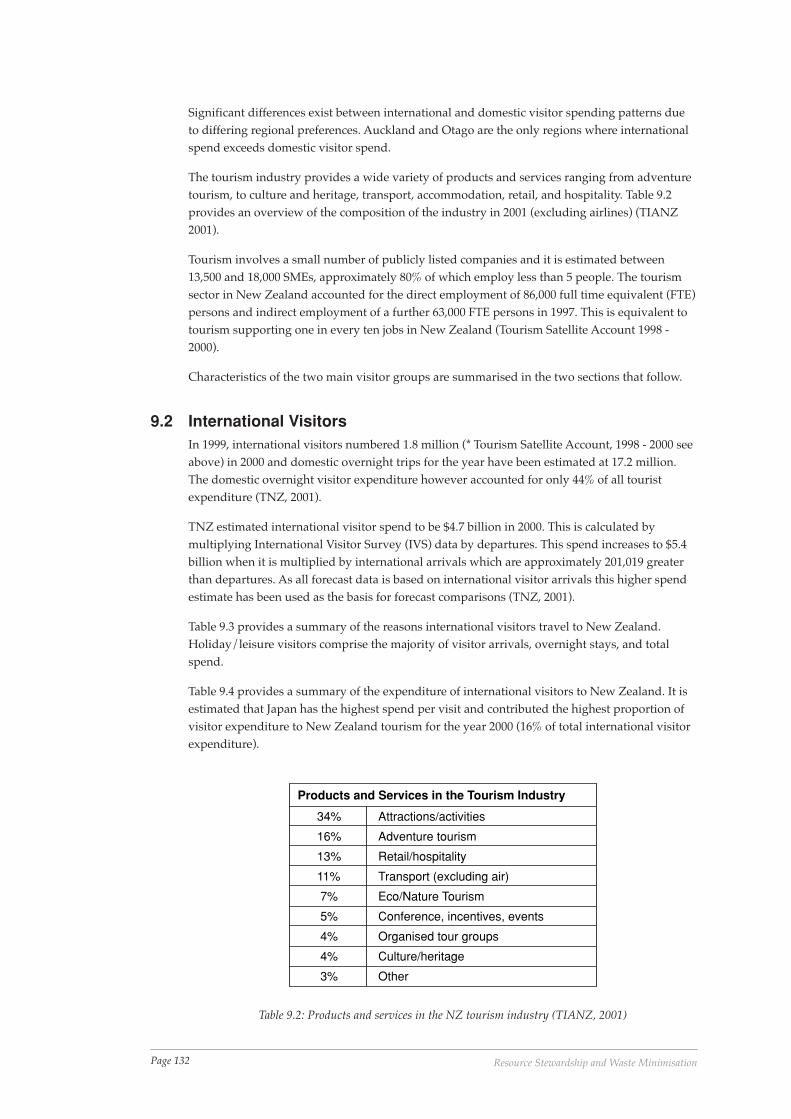
Page 132 Resource Stewardship and Waste Minimisation
Significant differences exist between international and domestic visitor spending patterns dueto differing regional preferences. Auckland and Otago are the only regions where internationalspend exceeds domestic visitor spend.
The tourism industry provides a wide variety of products and services ranging from adventuretourism, to culture and heritage, transport, accommodation, retail, and hospitality. Table 9.2provides an overview of the composition of the industry in 2001 (excluding airlines) (TIANZ2001).
Tourism involves a small number of publicly listed companies and it is estimated between13,500 and 18,000 SMEs, approximately 80% of which employ less than 5 people. The tourismsector in New Zealand accounted for the direct employment of 86,000 full time equivalent (FTE)persons and indirect employment of a further 63,000 FTE persons in 1997. This is equivalent totourism supporting one in every ten jobs in New Zealand (Tourism Satellite Account 1998 -2000).
Characteristics of the two main visitor groups are summarised in the two sections that follow.
9.2 International VisitorsIn 1999, international visitors numbered 1.8 million (* Tourism Satellite Account, 1998 - 2000 seeabove) in 2000 and domestic overnight trips for the year have been estimated at 17.2 million.The domestic overnight visitor expenditure however accounted for only 44% of all touristexpenditure (TNZ, 2001).
TNZ estimated international visitor spend to be $4.7 billion in 2000. This is calculated bymultiplying International Visitor Survey (IVS) data by departures. This spend increases to $5.4billion when it is multiplied by international arrivals which are approximately 201,019 greaterthan departures. As all forecast data is based on international visitor arrivals this higher spendestimate has been used as the basis for forecast comparisons (TNZ, 2001).
Table 9.3 provides a summary of the reasons international visitors travel to New Zealand.Holiday/leisure visitors comprise the majority of visitor arrivals, overnight stays, and totalspend.
Table 9.4 provides a summary of the expenditure of international visitors to New Zealand. It isestimated that Japan has the highest spend per visit and contributed the highest proportion ofvisitor expenditure to New Zealand tourism for the year 2000 (16% of total international visitorexpenditure).
Products and Services in the Tourism Industry
34% Attractions/activities
16% Adventure tourism
13% Retail/hospitality
11% Transport (excluding air)
7% Eco/Nature Tourism
5% Conference, incentives, events
4% Organised tour groups
4% Culture/heritage
3% Other
Table 9.2: Products and services in the NZ tourism industry (TIANZ, 2001)
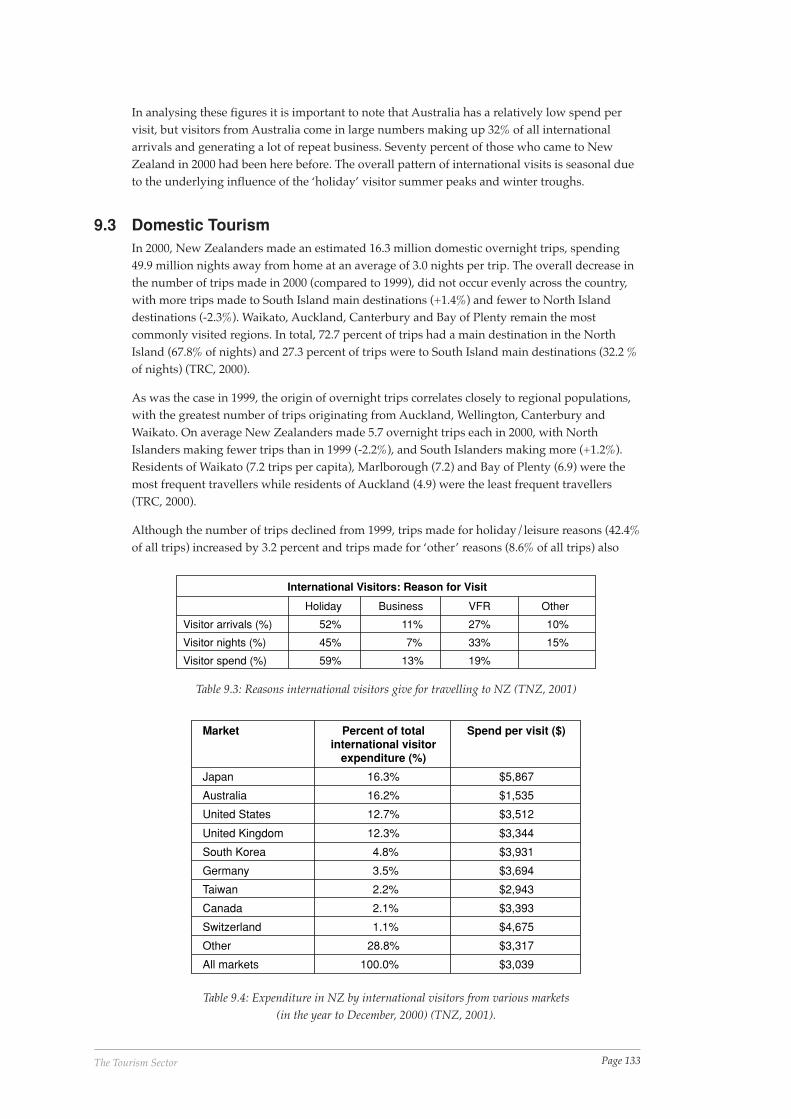
Page 133The Tourism Sector
In analysing these figures it is important to note that Australia has a relatively low spend pervisit, but visitors from Australia come in large numbers making up 32% of all internationalarrivals and generating a lot of repeat business. Seventy percent of those who came to NewZealand in 2000 had been here before. The overall pattern of international visits is seasonal dueto the underlying influence of the ‘holiday’ visitor summer peaks and winter troughs.
9.3 Domestic TourismIn 2000, New Zealanders made an estimated 16.3 million domestic overnight trips, spending49.9 million nights away from home at an average of 3.0 nights per trip. The overall decrease inthe number of trips made in 2000 (compared to 1999), did not occur evenly across the country,with more trips made to South Island main destinations (+1.4%) and fewer to North Islanddestinations (-2.3%). Waikato, Auckland, Canterbury and Bay of Plenty remain the mostcommonly visited regions. In total, 72.7 percent of trips had a main destination in the NorthIsland (67.8% of nights) and 27.3 percent of trips were to South Island main destinations (32.2 %of nights) (TRC, 2000).
As was the case in 1999, the origin of overnight trips correlates closely to regional populations,with the greatest number of trips originating from Auckland, Wellington, Canterbury andWaikato. On average New Zealanders made 5.7 overnight trips each in 2000, with NorthIslanders making fewer trips than in 1999 (-2.2%), and South Islanders making more (+1.2%).Residents of Waikato (7.2 trips per capita), Marlborough (7.2) and Bay of Plenty (6.9) were themost frequent travellers while residents of Auckland (4.9) were the least frequent travellers(TRC, 2000).
Although the number of trips declined from 1999, trips made for holiday/leisure reasons (42.4%of all trips) increased by 3.2 percent and trips made for ‘other’ reasons (8.6% of all trips) also
International Visitors: Reason for Visit
Holiday Business VFR Other
Visitor arrivals (%) 52% 11% 27% 10%
Visitor nights (%) 45% 7% 33% 15%
Visitor spend (%) 59% 13% 19%
Table 9.3: Reasons international visitors give for travelling to NZ (TNZ, 2001)
Market Percent of totalinternational visitor
expenditure (%)
Spend per visit ($)
Japan 16.3% $5,867
Australia 16.2% $1,535
United States 12.7% $3,512
United Kingdom 12.3% $3,344
South Korea 4.8% $3,931
Germany 3.5% $3,694
Taiwan 2.2% $2,943
Canada 2.1% $3,393
Switzerland 1.1% $4,675
Other 28.8% $3,317
All markets 100.0% $3,039
Table 9.4: Expenditure in NZ by international visitors from various markets(in the year to December, 2000) (TNZ, 2001).
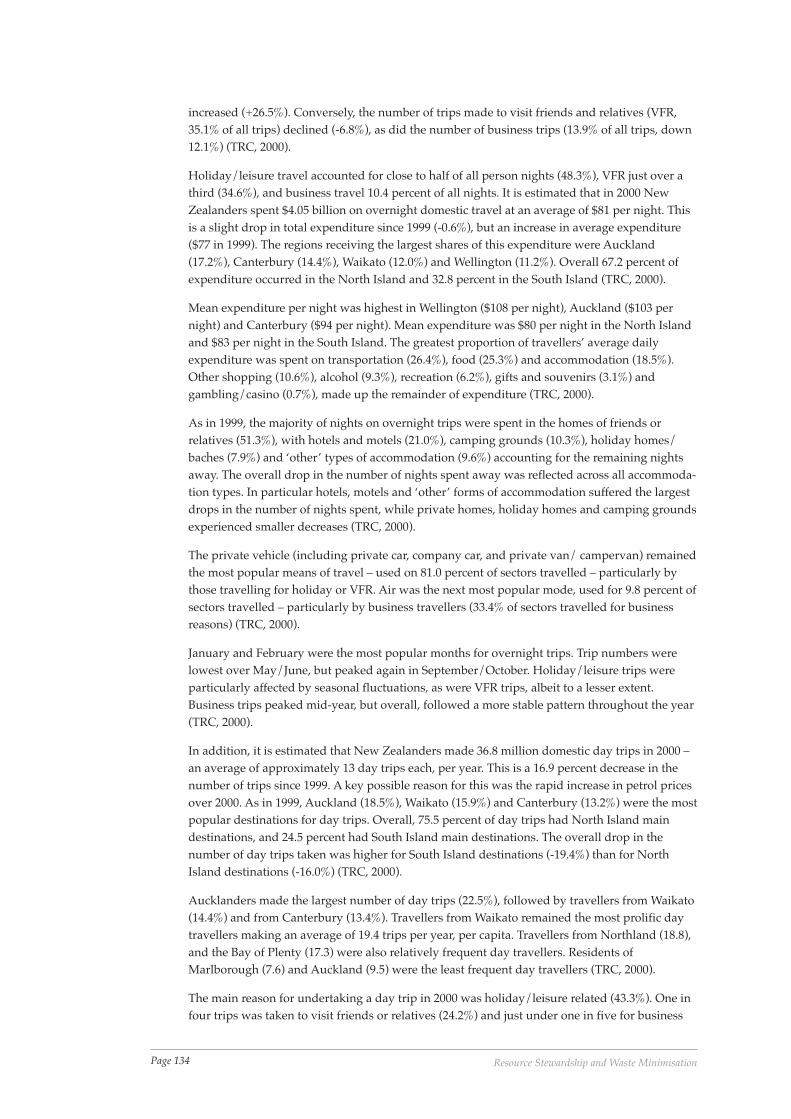
Page 134 Resource Stewardship and Waste Minimisation
increased (+26.5%). Conversely, the number of trips made to visit friends and relatives (VFR,35.1% of all trips) declined (-6.8%), as did the number of business trips (13.9% of all trips, down12.1%) (TRC, 2000).
Holiday/leisure travel accounted for close to half of all person nights (48.3%), VFR just over athird (34.6%), and business travel 10.4 percent of all nights. It is estimated that in 2000 NewZealanders spent $4.05 billion on overnight domestic travel at an average of $81 per night. Thisis a slight drop in total expenditure since 1999 (-0.6%), but an increase in average expenditure($77 in 1999). The regions receiving the largest shares of this expenditure were Auckland(17.2%), Canterbury (14.4%), Waikato (12.0%) and Wellington (11.2%). Overall 67.2 percent ofexpenditure occurred in the North Island and 32.8 percent in the South Island (TRC, 2000).
Mean expenditure per night was highest in Wellington ($108 per night), Auckland ($103 pernight) and Canterbury ($94 per night). Mean expenditure was $80 per night in the North Islandand $83 per night in the South Island. The greatest proportion of travellers’ average dailyexpenditure was spent on transportation (26.4%), food (25.3%) and accommodation (18.5%).Other shopping (10.6%), alcohol (9.3%), recreation (6.2%), gifts and souvenirs (3.1%) andgambling/casino (0.7%), made up the remainder of expenditure (TRC, 2000).
As in 1999, the majority of nights on overnight trips were spent in the homes of friends orrelatives (51.3%), with hotels and motels (21.0%), camping grounds (10.3%), holiday homes/baches (7.9%) and ‘other’ types of accommodation (9.6%) accounting for the remaining nightsaway. The overall drop in the number of nights spent away was reflected across all accommoda-tion types. In particular hotels, motels and ‘other’ forms of accommodation suffered the largestdrops in the number of nights spent, while private homes, holiday homes and camping groundsexperienced smaller decreases (TRC, 2000).
The private vehicle (including private car, company car, and private van/ campervan) remainedthe most popular means of travel – used on 81.0 percent of sectors travelled – particularly bythose travelling for holiday or VFR. Air was the next most popular mode, used for 9.8 percent ofsectors travelled – particularly by business travellers (33.4% of sectors travelled for businessreasons) (TRC, 2000).
January and February were the most popular months for overnight trips. Trip numbers werelowest over May/June, but peaked again in September/October. Holiday/leisure trips wereparticularly affected by seasonal fluctuations, as were VFR trips, albeit to a lesser extent.Business trips peaked mid-year, but overall, followed a more stable pattern throughout the year(TRC, 2000).
In addition, it is estimated that New Zealanders made 36.8 million domestic day trips in 2000 –an average of approximately 13 day trips each, per year. This is a 16.9 percent decrease in thenumber of trips since 1999. A key possible reason for this was the rapid increase in petrol pricesover 2000. As in 1999, Auckland (18.5%), Waikato (15.9%) and Canterbury (13.2%) were the mostpopular destinations for day trips. Overall, 75.5 percent of day trips had North Island maindestinations, and 24.5 percent had South Island main destinations. The overall drop in thenumber of day trips taken was higher for South Island destinations (-19.4%) than for NorthIsland destinations (-16.0%) (TRC, 2000).
Aucklanders made the largest number of day trips (22.5%), followed by travellers from Waikato(14.4%) and from Canterbury (13.4%). Travellers from Waikato remained the most prolific daytravellers making an average of 19.4 trips per year, per capita. Travellers from Northland (18.8),and the Bay of Plenty (17.3) were also relatively frequent day travellers. Residents ofMarlborough (7.6) and Auckland (9.5) were the least frequent day travellers (TRC, 2000).
The main reason for undertaking a day trip in 2000 was holiday/leisure related (43.3%). One infour trips was taken to visit friends or relatives (24.2%) and just under one in five for business
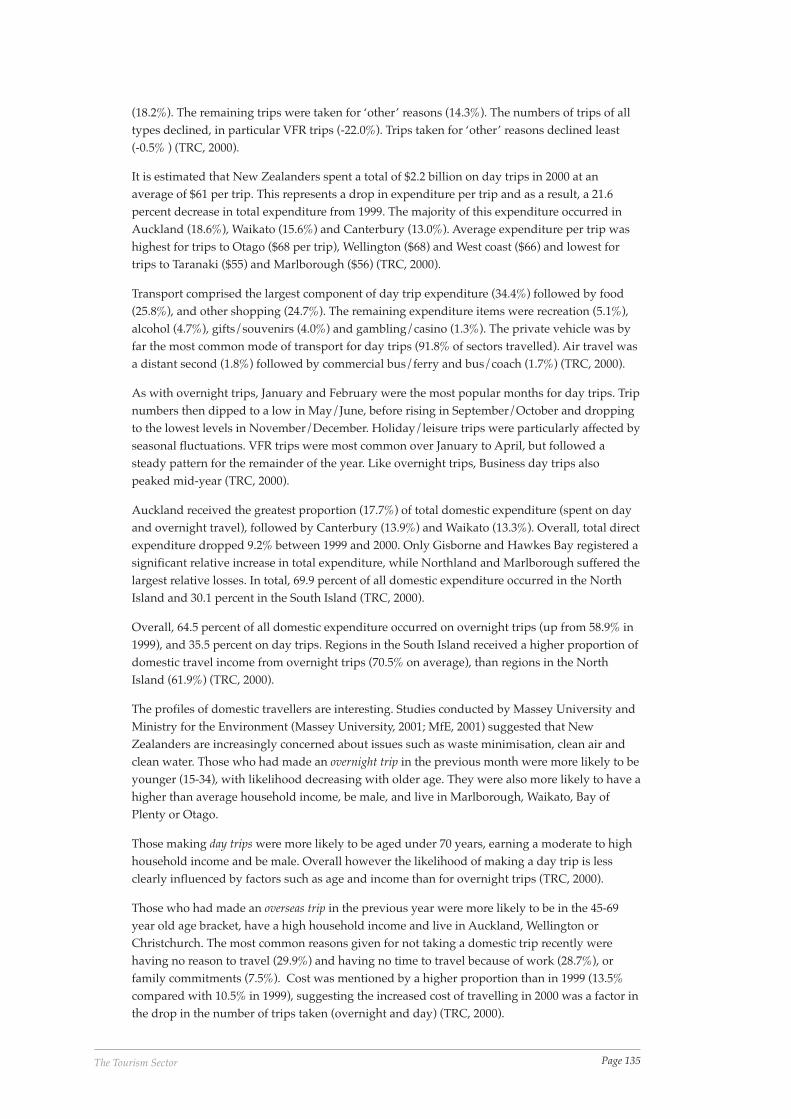
Page 135The Tourism Sector
(18.2%). The remaining trips were taken for ‘other’ reasons (14.3%). The numbers of trips of alltypes declined, in particular VFR trips (-22.0%). Trips taken for ‘other’ reasons declined least(-0.5% ) (TRC, 2000).
It is estimated that New Zealanders spent a total of $2.2 billion on day trips in 2000 at anaverage of $61 per trip. This represents a drop in expenditure per trip and as a result, a 21.6percent decrease in total expenditure from 1999. The majority of this expenditure occurred inAuckland (18.6%), Waikato (15.6%) and Canterbury (13.0%). Average expenditure per trip washighest for trips to Otago ($68 per trip), Wellington ($68) and West coast ($66) and lowest fortrips to Taranaki ($55) and Marlborough ($56) (TRC, 2000).
Transport comprised the largest component of day trip expenditure (34.4%) followed by food(25.8%), and other shopping (24.7%). The remaining expenditure items were recreation (5.1%),alcohol (4.7%), gifts/souvenirs (4.0%) and gambling/casino (1.3%). The private vehicle was byfar the most common mode of transport for day trips (91.8% of sectors travelled). Air travel wasa distant second (1.8%) followed by commercial bus/ferry and bus/coach (1.7%) (TRC, 2000).
As with overnight trips, January and February were the most popular months for day trips. Tripnumbers then dipped to a low in May/June, before rising in September/October and droppingto the lowest levels in November/December. Holiday/leisure trips were particularly affected byseasonal fluctuations. VFR trips were most common over January to April, but followed asteady pattern for the remainder of the year. Like overnight trips, Business day trips alsopeaked mid-year (TRC, 2000).
Auckland received the greatest proportion (17.7%) of total domestic expenditure (spent on dayand overnight travel), followed by Canterbury (13.9%) and Waikato (13.3%). Overall, total directexpenditure dropped 9.2% between 1999 and 2000. Only Gisborne and Hawkes Bay registered asignificant relative increase in total expenditure, while Northland and Marlborough suffered thelargest relative losses. In total, 69.9 percent of all domestic expenditure occurred in the NorthIsland and 30.1 percent in the South Island (TRC, 2000).
Overall, 64.5 percent of all domestic expenditure occurred on overnight trips (up from 58.9% in1999), and 35.5 percent on day trips. Regions in the South Island received a higher proportion ofdomestic travel income from overnight trips (70.5% on average), than regions in the NorthIsland (61.9%) (TRC, 2000).
The profiles of domestic travellers are interesting. Studies conducted by Massey University andMinistry for the Environment (Massey University, 2001; MfE, 2001) suggested that NewZealanders are increasingly concerned about issues such as waste minimisation, clean air andclean water. Those who had made an overnight trip in the previous month were more likely to beyounger (15-34), with likelihood decreasing with older age. They were also more likely to have ahigher than average household income, be male, and live in Marlborough, Waikato, Bay ofPlenty or Otago.
Those making day trips were more likely to be aged under 70 years, earning a moderate to highhousehold income and be male. Overall however the likelihood of making a day trip is lessclearly influenced by factors such as age and income than for overnight trips (TRC, 2000).
Those who had made an overseas trip in the previous year were more likely to be in the 45-69year old age bracket, have a high household income and live in Auckland, Wellington orChristchurch. The most common reasons given for not taking a domestic trip recently werehaving no reason to travel (29.9%) and having no time to travel because of work (28.7%), orfamily commitments (7.5%). Cost was mentioned by a higher proportion than in 1999 (13.5%compared with 10.5% in 1999), suggesting the increased cost of travelling in 2000 was a factor inthe drop in the number of trips taken (overnight and day) (TRC, 2000).
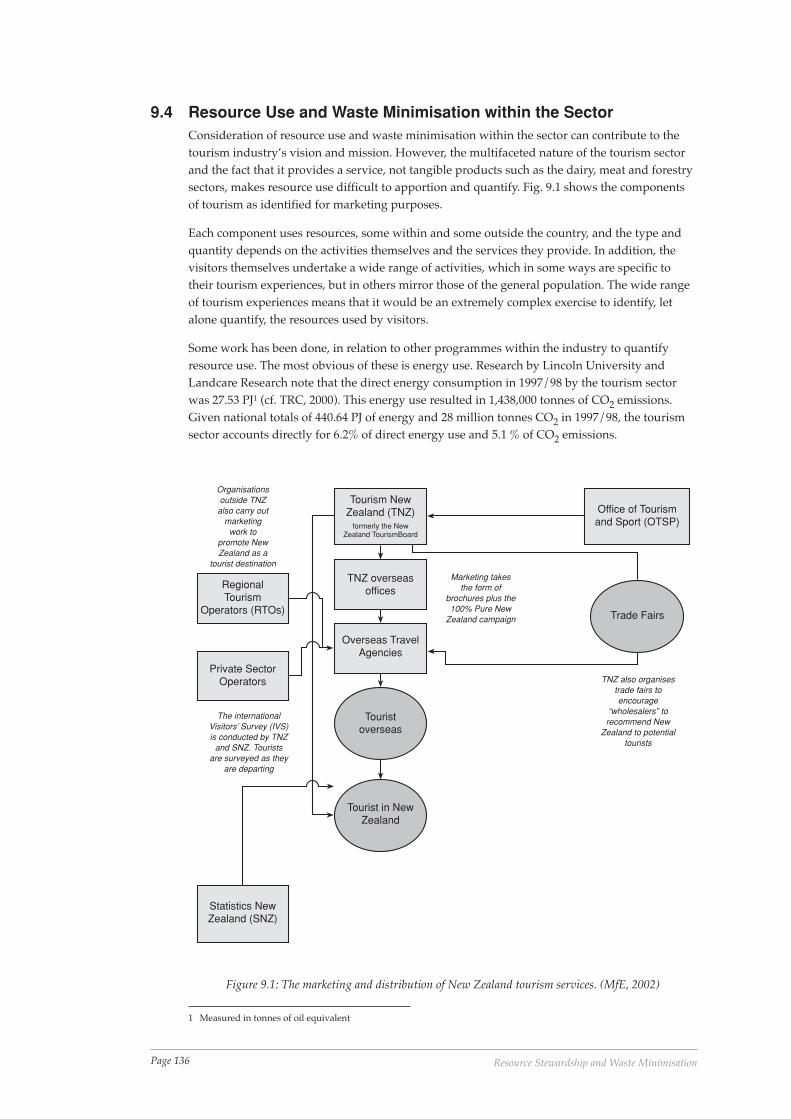
Page 136 Resource Stewardship and Waste Minimisation
9.4 Resource Use and Waste Minimisation within the SectorConsideration of resource use and waste minimisation within the sector can contribute to thetourism industry’s vision and mission. However, the multifaceted nature of the tourism sectorand the fact that it provides a service, not tangible products such as the dairy, meat and forestrysectors, makes resource use difficult to apportion and quantify. Fig. 9.1 shows the componentsof tourism as identified for marketing purposes.
Each component uses resources, some within and some outside the country, and the type andquantity depends on the activities themselves and the services they provide. In addition, thevisitors themselves undertake a wide range of activities, which in some ways are specific totheir tourism experiences, but in others mirror those of the general population. The wide rangeof tourism experiences means that it would be an extremely complex exercise to identify, letalone quantify, the resources used by visitors.
Some work has been done, in relation to other programmes within the industry to quantifyresource use. The most obvious of these is energy use. Research by Lincoln University andLandcare Research note that the direct energy consumption in 1997/98 by the tourism sectorwas 27.53 PJ1 (cf. TRC, 2000). This energy use resulted in 1,438,000 tonnes of CO2 emissions.Given national totals of 440.64 PJ of energy and 28 million tonnes CO2 in 1997/98, the tourismsector accounts directly for 6.2% of direct energy use and 5.1 % of CO2 emissions.
RegionalTourism
Operators (RTOs)
Private SectorOperators
Statistics NewZealand (SNZ)
Office of Tourismand Sport (OTSP)
Tourist in NewZealand
Touristoverseas
Overseas TravelAgencies
TNZ overseasoffices
Tourism NewZealand (TNZ)
formerly the NewZealand TourismBoard
Trade Fairs
Organisationsoutside TNZ
also carry outmarketing
work topromote NewZealand as a
tourist destination
The internationalVisitors’ Survey (IVS)is conducted by TNZ
and SNZ. Touristsare surveyed as they
are departing
Marketing takesthe form of
brochures plus the100% Pure New
Zealand campaign
TNZ also organisestrade fairs toencourage
“wholesalers” torecommend New
Zealand to potentialtourists
Figure 9.1: The marketing and distribution of New Zealand tourism services. (MfE, 2002)
1 Measured in tonnes of oil equivalent
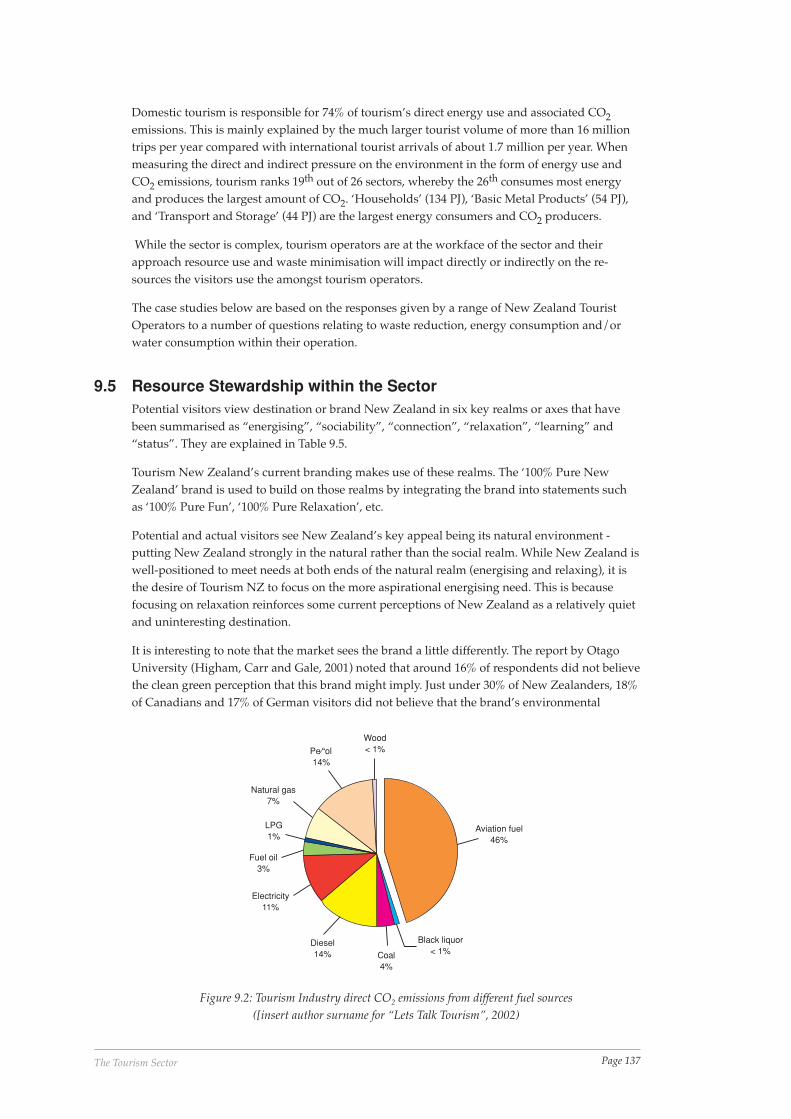
Page 137The Tourism Sector
Domestic tourism is responsible for 74% of tourism’s direct energy use and associated CO2emissions. This is mainly explained by the much larger tourist volume of more than 16 milliontrips per year compared with international tourist arrivals of about 1.7 million per year. Whenmeasuring the direct and indirect pressure on the environment in the form of energy use andCO2 emissions, tourism ranks 19th out of 26 sectors, whereby the 26th consumes most energyand produces the largest amount of CO2. ‘Households’ (134 PJ), ‘Basic Metal Products’ (54 PJ),and ‘Transport and Storage’ (44 PJ) are the largest energy consumers and CO2 producers.
While the sector is complex, tourism operators are at the workface of the sector and theirapproach resource use and waste minimisation will impact directly or indirectly on the re-sources the visitors use the amongst tourism operators.
The case studies below are based on the responses given by a range of New Zealand TouristOperators to a number of questions relating to waste reduction, energy consumption and/orwater consumption within their operation.
9.5 Resource Stewardship within the SectorPotential visitors view destination or brand New Zealand in six key realms or axes that havebeen summarised as “energising”, “sociability”, “connection”, “relaxation”, “learning” and“status”. They are explained in Table 9.5.
Tourism New Zealand’s current branding makes use of these realms. The ‘100% Pure NewZealand’ brand is used to build on those realms by integrating the brand into statements suchas ‘100% Pure Fun’, ‘100% Pure Relaxation’, etc.
Potential and actual visitors see New Zealand’s key appeal being its natural environment -putting New Zealand strongly in the natural rather than the social realm. While New Zealand iswell-positioned to meet needs at both ends of the natural realm (energising and relaxing), it isthe desire of Tourism NZ to focus on the more aspirational energising need. This is becausefocusing on relaxation reinforces some current perceptions of New Zealand as a relatively quietand uninteresting destination.
It is interesting to note that the market sees the brand a little differently. The report by OtagoUniversity (Higham, Carr and Gale, 2001) noted that around 16% of respondents did not believethe clean green perception that this brand might imply. Just under 30% of New Zealanders, 18%of Canadians and 17% of German visitors did not believe that the brand’s environmental
Aviation fuel46%
Black liquor< 1%Coal
4%
Diesel14%
Electricity11%
Fuel oil3%
LPG1%
Natural gas7%
Pe⁄“ol14%
Wood< 1%
Figure 9.2: Tourism Industry direct CO2 emissions from different fuel sources([insert author surname for “Lets Talk Tourism”, 2002)
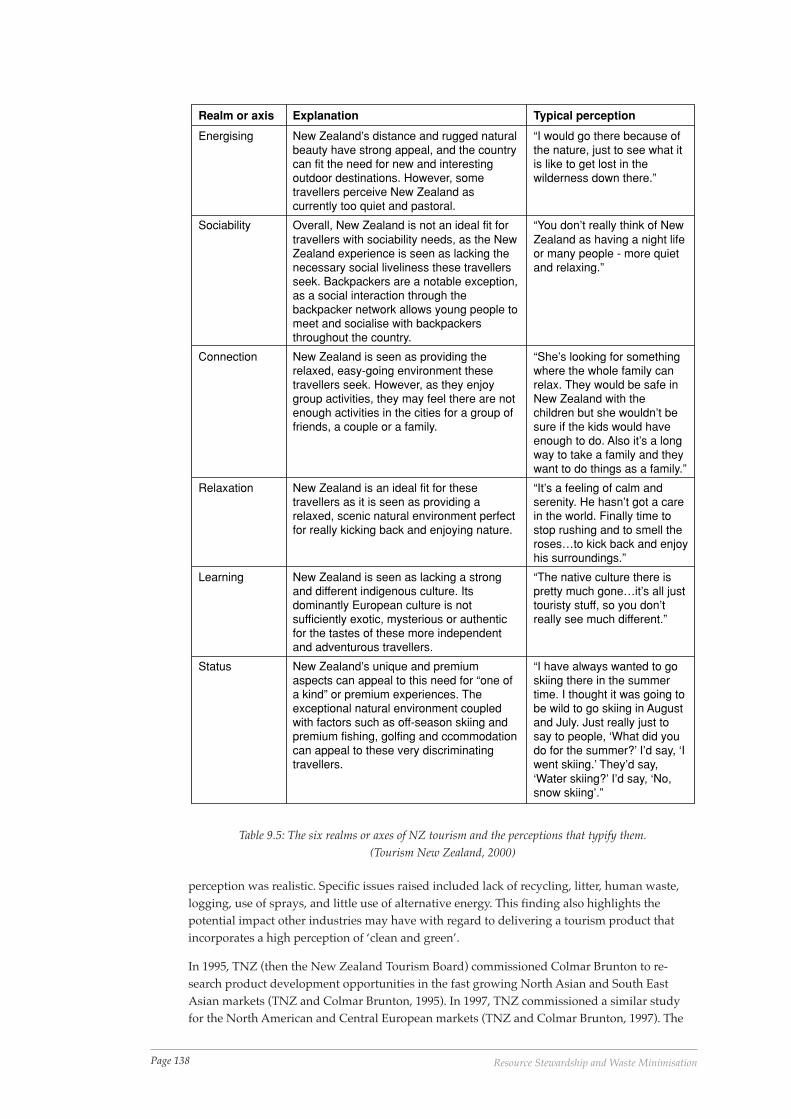
Page 138 Resource Stewardship and Waste Minimisation
perception was realistic. Specific issues raised included lack of recycling, litter, human waste,logging, use of sprays, and little use of alternative energy. This finding also highlights thepotential impact other industries may have with regard to delivering a tourism product thatincorporates a high perception of ‘clean and green’.
In 1995, TNZ (then the New Zealand Tourism Board) commissioned Colmar Brunton to re-search product development opportunities in the fast growing North Asian and South EastAsian markets (TNZ and Colmar Brunton, 1995). In 1997, TNZ commissioned a similar studyfor the North American and Central European markets (TNZ and Colmar Brunton, 1997). The
Realm or axis Explanation Typical perception
Energising New Zealand’s distance and rugged naturalbeauty have strong appeal, and the countrycan fit the need for new and interestingoutdoor destinations. However, sometravellers perceive New Zealand ascurrently too quiet and pastoral.
“I would go there because ofthe nature, just to see what itis like to get lost in thewilderness down there.”
Sociability Overall, New Zealand is not an ideal fit fortravellers with sociability needs, as the NewZealand experience is seen as lacking thenecessary social liveliness these travellersseek. Backpackers are a notable exception,as a social interaction through thebackpacker network allows young people tomeet and socialise with backpackersthroughout the country.
“You don’t really think of NewZealand as having a night lifeor many people - more quietand relaxing.”
Connection New Zealand is seen as providing therelaxed, easy-going environment thesetravellers seek. However, as they enjoygroup activities, they may feel there are notenough activities in the cities for a group offriends, a couple or a family.
“She’s looking for somethingwhere the whole family canrelax. They would be safe inNew Zealand with thechildren but she wouldn’t besure if the kids would haveenough to do. Also it’s a longway to take a family and theywant to do things as a family.”
Relaxation New Zealand is an ideal fit for thesetravellers as it is seen as providing arelaxed, scenic natural environment perfectfor really kicking back and enjoying nature.
“It’s a feeling of calm andserenity. He hasn’t got a carein the world. Finally time tostop rushing and to smell theroses…to kick back and enjoyhis surroundings.”
Learning New Zealand is seen as lacking a strongand different indigenous culture. Itsdominantly European culture is notsufficiently exotic, mysterious or authenticfor the tastes of these more independentand adventurous travellers.
“The native culture there ispretty much gone…it’s all justtouristy stuff, so you don’treally see much different.”
Status New Zealand’s unique and premiumaspects can appeal to this need for “one ofa kind” or premium experiences. Theexceptional natural environment coupledwith factors such as off-season skiing andpremium fishing, golfing and ccommodationcan appeal to these very discriminatingtravellers.
“I have always wanted to goskiing there in the summertime. I thought it was going tobe wild to go skiing in Augustand July. Just really just tosay to people, ‘What did youdo for the summer?’ I’d say, ‘Iwent skiing.’ They’d say,‘Water skiing?’ I’d say, ‘No,snow skiing’.”
Table 9.5: The six realms or axes of NZ tourism and the perceptions that typify them.(Tourism New Zealand, 2000)
Page 139The Tourism Sector
Case Study 9.1: The Kaikoura Winery, KaikouraThe Kaikoura Winery is situated on State Highway 1, just south of the Kaikoura township. Ithas been in operation for approximately three years and is currently working through GreenGlobe 21 Benchmarking. The winery offers wine tasting in the bar, has a high-quality DeliBar, an extensive gift/souvenir area and guided tours through the underground winecellars. The winery currently grows the grapes in Marlborough, but does have youngplantations on the winery grounds. Kaikoura Winery is a Green Globe 21 Benchmarkedoperation.
Solid WasteThe Kaikoura Winery manager and staff find the only problem with solid waste reduction/minimisation is time and space. Otherwise they find waste reduction very manageable andare conscious of resource stewardship. The winery is currently working towards becoming alocal flagship ‘zero waste company’. The largest current solid waste is glass bottles, followedby cardboard, office paper then plastic. All bottles go to the local recycling centre where theyare crushed and used for field drains. The cardboard and recyclable plastic are baled by therecycling centre for the Christchurch recycled materials markets and most office paper isshredded and used for mulch. All organic food scraps go to a pig farm. The remaining solidwaste is landfilled as were the above materials prior to the establishment of the recyclingcentre. Recycling practices have been improved since installing separate recycling bins bothinside and out and there is regular staff training on waste reduction.
An obvious economic as well as environmental improvement of waste reduction is the costsavings (both on the bottom line as well as the environment) by simply not landfilling. Thestaff enjoys talking to the customers and takes pride in the fact that as an operation they arebeing as ‘green’ as they can be at this stage. Future improvements include all corks beinggiven away or sold for cork boards or to be used as props for the Kaikoura Recycled ArtsShow. The Deli Bar’s use of plastic cutlery will be replaced with stainless steel reusablecutlery. Giftware stock made from New Zealand recyclable materials is purchased andminimal packaging from stockists encouraged.
For the winery, the main lesson to be learnt from this process is that as an operation we cando a lot more in terms of waste reduction without putting too much effort in, once thesystems are in place, and it’s not nearly as hard as you would think. It’s a case of changinghabits and rather than relying on recycling, the winery is learning to think about what ispurchased first, e.g packaging around gifts, recycled toilet paper and tissues.
Fresh Water ResourcesThe same questions were applied to the management of fresh water resources. The mainproblem in Kaikoura is the water shortage during the summer months and theconsequential water restrictions enforced. To overcome water restrictions and to helpencourage water conservation the winery has a number of initiatives in place, including:
• rain water caught for vineyard/winery use;
• toilet flush levels set on economy;
• taps regularly checked for leaks;
• water recycled for plant watering;
• utilising winery solid wastes for mulch; and
• use of biodegradable and phosphate free cleaning materials.
The winery also only irrigates vine plants minimally by using a trickle feed irrigation
Page 140 Resource Stewardship and Waste Minimisation
purpose of this research was to understand expectations of tourists in these target markets, andstrategies to increase their numbers. The findings of the research pertinent to this paper aresummarised below.
• Asian tourists were mainly attracted to New Zealand for the “real nature experience” itprovides. The research indicated that they were attracted to an experience that was bothtranquil and relaxing as well as “stunning and expansive”. For older people, especiallycouples, the emphasis appeared to be on tranquillity and relaxation, whereas with youngervisitors the emphasis was more on personal challenges and “extending boundaries”. Theresearch also found that Asian tourists were very keen on experiencing a “real Kiwilifestyle” that could be best expressed through a pastoral theme.
• For European and North American tourists the total image of New Zealand as a holidaydestination and expectations of their experience motivate them to travel here.
• North Americans tend to travel here to take “a vacation and a time out”. They have veryhigh expectations of the scenery and landscape. While Canadians seek “a colourful, con-trasting world” and a “fresh experience”, visitors from the USA tend to seek “a unique andspectacular experience”.
• Tourists from the Netherlands and Germany tend to be environmental enthusiasts. WhileDutch tourists are enthusiastic about nature they are not precious about it. Their emphasis ison “understanding and appreciating the nature as well as the people”. Visitors from Ger-many, however, are very staunch with regards to their expectations of the scenery andlandscape that has been promised to them. They perceive the environment in Germany to be“damaged” and feel that New Zealanders should respect and appreciate the environmentthey have. Nature and landscape is the primary motivation for travelling in this case.
• Visitors from the UK are motivated by a sense of cultural familiarity as well as the percep-tion of New Zealand as a “Garden of Eden”, with a relaxed lifestyle, lush and flourishingforests and fresh fruits and vegetables, which are often not available in the UK. Theirexpectations are that of an “untouched paradise that is refreshing and abundant” (TNZ andColmar Brunton, 1995, 1997).
From 1999 through to 2000, market perceptions were tracked by CM Research New Zealand(TNZ and CM Research, 1999). Markets in North Asia, South East Asia, USA, UK and CentralEurope were examined. One of the purposes of this research was to monitor New Zealand’simage in the target markets and assess how perceptions change over time. The research showedthat in all these markets, New Zealand was strongly associated with beautiful scenery, beingrefreshing and revitalising, an outdoor lifestyle, adventure, and time ‘away from it all’.
Part of the new vision of the strategy is that NZ environmental and culture be preserved andsustained in the spirit of kaitiakitanga and guardianship. The new mission includes protectingour environment and the new objectives involve securing and preserving a long term future.
In developing the New Zealand Tourism Strategy to 2010, input was sought from a wide crosssection of the tourism sector through one-on-one interviews, individual and group submissions,facilitated workshops, cluster-based focus groups, and strategy sessions at the Tourism IndustryAssociation’s ‘Tourism @ Work 2001 Roadshows’.
system. Only native plants are grown in landscaping to avoid additional watering.
The end results include savings to the winery on water usage charges, higher staffawareness on water management, resulting in increased staff morale as an organisationworking together to protect and sustain the environment. This element is vital to thewinery’s operation.
Kaikoura Wine Company, State Highway 1, KaikouraManager Neroli Gold, 03 319 7966.
Page 141The Tourism Sector
Case Study 9.2: Adventure South, ChristchurchAdventure South is a Christchurch-based operation specialising in nation-wide guidedcycling, hiking and ‘mid-life adventure’ active tours of New Zealand. Adventure South is aGreen Globe 21 Benchmarked operation.
Solid WasteThe Director of Adventure South has delivered the clear message relating to the importanceof solid waste reduction, reuse and recycling very effectively resulting in absolute buy-in byall staff and guides. A comprehensive recycling process is in place, and on all trips plastics,cans, paper, glass bottles and a large proportion of compostable materials are either droppedoff at various recycling centres around the trips, or if this not possible are brought back tothe main office depot for recycling.
Items remaining that are often difficult to recycle during the trips include yoghurtcontainers, plastic food containers, tin foil, tissues and general food wrappings. These itemsare then landfilled. However, as an organisation Adventure South is diligent in itspurchasing of such items prior to trips.
In the past year, Adventure South have taken some significant steps (as listed below) toensure a waste minimisation scheme is firmly in place. These include establishing anEnvironmental policy incorporating the waste minimisation policies from Green Globe.Involved in this are the setting of objectives and action plans, and putting these in place.
• Both depot and office waste during the past season has been regularly audited involvingguides and staff.
• Shopping bags made up to reduce plastic bag usage
• Compost bin set up at depot – the remaining waste going to staff member’s chickens.
• Also compost bin set up at Queenstown base.
• Recycling bins set up for regular sorting and dispatching. All trips also have these bins.
• Communication with suppliers to assist in providing drop off points for waste along thetrip route as well as understanding their initiatives and contributions in theircommunities.
• Regular communication with staff.
Adventure South is committed to improving and learning about its environmentalresponsibility, to understand its impact and to find ways to improve the negative andacknowledge the posititive. Adventure South disseminates this message to its suppliers,staff and other operators in the tourism industry.
Water and EnergyMinimal water is used on trips and tours, with all water usage recorded. Buses carry a 25litre container, which when filled up on a trip stopover is then recorded. Adventure Southendevear to waste as little water as possible, and educated their clients to think and act thesame way.
Bus cleaning is the biggest problem faced in water consumption. However again, minimialwater is used, and often recorded and measured to improve upon e.g by investigating theuseage of high pressure spray cleaning.
The biggest form of energy consumption is office power e.g the use of computers, lights,heaters, radios, etc. Energy consumption has been measured, and strategies are being
Page 142 Resource Stewardship and Waste Minimisation
This input identified a range of challenges that the sector must meet to remain competitive inthe global marketplace and to ensure that tourism remains sustainable. There is a high degree ofconsensus about the challenges presented. The challenges identified include:
• ensuring that tourism does not deplete the natural resource on which it depends;
• making the most of our branding and marketing, recognising and championing our positivepoints of difference;
• understanding better what visitors will be seeking from New Zealand and what motivatesthem to travel;
• making New Zealand tourism product more distinctive and aligned to visitors’ needs andwants;
• taking a more strategic approach to pricing and positioning to support increased yield andbetter returns for operators and investors;
• finding ways for all parts of the tourism sector to be more efficient and to work moreeffectively together;
• capturing the opportunities offered by technology; and
• developing the quality of New Zealand product and becoming internationally known forthis.
To address the identified challenges and ‘future proof’ the sector, the New Zealand TourismStrategy focused on: continued sustainable growth; integrating marketing and destinationmanagement; managing and increasing yield; increased participation and partnerships, andaligning and rationalising structures (Office of Tourism and sport, 2001) The long-term future ofthe sector is linked to growing tourism in a way that protects our natural, cultural, built andsocial heritages. Closer links will be established between these heritages and growth, in order tosafeguard the sustainability of growth.
A coherent and balanced approach will be taken to yield optimisation. Increasing visitornumbers is important, but this must be linked to effective pricing, yield and destination man-agement strategies. There will be more effective partnerships established between: public andprivate sectors; central and regional/local government agencies; regional tourism operators(RTOs) and other agencies/operators, including Maori tourism organisations, and the industryand Maori in general. There will be more participation of Maori, local communities and indi-vidual New Zealanders in shaping and delivering tourism. Current structures will be alignedwith and support the future development of tourism in New Zealand. This will involve some‘rationalisation’ of current participants as the sector is over serviced and under served by thecurrent multiplicity of organisations.
Sustainability is critical to ensure the benefits accruing from the sector’s growth are not short-lived. To achieve sustainable growth a unified vision and mission and a set of supportingobjectives have been developed to guide the sector over the next ten years. The following is theVision for Tourism in New Zealand that has been developed to provide a picture of the desiredfuture:
“In 2010: Visitors and their host communities understand and embrace the spirit of
investigated to reduce their energy consumption. Fuel consumption also is significant.However whilst investigating further methods of improving fuel consumption (busescurrently regularly serviced to ensure maximum efficiency), Adventure South are membersof the Landcare Research EBEX21 project.
Adventure South LtdPO Box 33 153, Christchurch, [email protected]
Page 143The Tourism Sector
manaakitanga (hospitality) while, New Zealanders’ environment and culture is conserved andsustained in the spirit of kaitiakitanga (guardianship) and, tourism is a vibrant and significantcontributor to the economic development of New Zealand.”
(New Zealand Tourism Strategy 2010).
The vision reflects the future for tourism in New Zealand and consists of:
• the people involved in the sector, including those who visit and travel within New Zealand;
• those who are employed in the sector, and the communities that host visitors;
• the place in terms of promoting destination New Zealand and its regions in a way that
• ensures the effective management of destination elements and sustainability issues;
• the prosperity of both the sector and its individual businesses based on informed;
• investment, business profitability and the economic and social well-being of communities;and
• New Zealand as a whole.
The Vision informs the Mission, which is to:
• welcome visitors;
• protect our environment; and
• celebrate our culture.
(New Zealand Tourism Strategy 2010).
This mission statement was developed for participants in the tourism sector and aims to guideand inspire the actions of the tourism sector. Participants should be confident that by aligning
Case Study 9.3: Waimangu Volcanic Valley Ltd, RotoruaWaimangu Volcanic Valley, was the winner of the 2001 NZ Ecotourism Award and Service tothe Environment Award 2001
A recycling unit was introduced in 2001. Whilst only a limited number of materials inRotorua can be recycled, Waimangu Volcanic Valley manage to recycle an estimated 80% ofwaste generated onsite. A number of steps have been taken to ensure this figure isconstantly achieved and improved upon if possible. These include:
• reduced waste coming onto site, e.g. packaging;
• one person appointed to take responsibility for waste management on site;
• tried to install reuse/recycling ethos into staff;
• try to purchase souvenir stocks with easily recyclable purchase; and
• constantly reviewing on-site processes to make resources use efficient, including time,labour and materials.
The staff enjoy educating and influencing not just clients about their waste minimisationfocus, but also other local tourist operators. It has been increasingly noticed that clients willfrequently pick up rubbish and deposit into the recycling bins provided. These practiceshave further encouraged staff team building and improved staff morale.
Harvey James, Waimangu Volcanic Valley, RotoruaEmail: [email protected]
Page 144 Resource Stewardship and Waste Minimisation
their policies or business strategies to the mission they will benefit from the mission’s promises.This will in turn build prosperity as outlined in the vision for the sector.
9.6 Governance of the SectorThe Tourism Industry in New Zealand is governed by a mix of public and private sectorstakeholders. The Tourism Industry Association New Zealand (TIA) is a membership-based andfunded organisation representing the interests of over 3,500 businesses from throughout thetourism industry. TIA has four main areas of activity:
• industry advocacy, including government relations and media and industry relationsupdates;
• business networking, providing forums for business and professional development (e.g.Conference and TRENZ) and vehicles to identify issues that impact on business and indus-try performance (e.g. Reference Groups);
Case Study 9.4: Dolphin Encounter, West End, KaikouraDolphin Encounter is a well-established locally owned business with a commitment to astrategy of environmental sustainability and improving operator efficiency. They arecurrently at the Green Globe 21 Benchmarking stage.
Dolphin EncounterReducing, reusing and recycling waste for Dolphin Encounter is an important and integralpart of its environmental sustainability commitment. Dolphin Encounter is fortunate that toa certain extent this is made relatively easy, in the Zero Waste District it operates from, andthe excellent recycling service offered by Innovative Waste, Kaikoura.
The whole organisation is very focused on reuse and recycling and tries hard to reduce thevolume of waste to landfill. This is their single and most effective plan of action in managingtheir waste.
They are looking at reduction in packaging by choosing bulk products in preference tosmaller amounts of the same products.
Dolphin Encounter believes that this is a very important aspect of Green Globe 21 and willbe the outcome that many businesses will find motivating and inspiring. Economic effect ofinclude paying less dumping fees by recycling and buying in bulk, which saves money andreduces packaging. Environmental benefits include extending the life of the landfill, and anincreased awareness of what waste does to our environment in a negative sense.
Social benefits include acknowledging that a small change in habits can have a significantimpact on the negative environmental impacts, that each of us can make a difference, andinstilling in everyone (staff, customers, community) that taking responsibility is the key tomaking that happen.
Problem faced with waste reduction/minimisationDolphin Encounter believe that as you look in depth at each of the benchmarking criteria(Green Globe 21) specific to your business it brings an understanding of the impact onresources that your business activity creates. It makes you take on a sense of ownership.
Dolphin Encounter58 West End, Kaikoura,03 319 6777
Page 145The Tourism Sector
• industry development programmes that involve developing, coordinating or sourcingprogrammes for the industry that can contribute to improvements in business performance/results; and
• membership services, including membership deals, newsletters and issues.
Membership bodies also exist for other specific sectors within the tourism industry, e.g. the Busand Coach Association, and the Motel Association. Most of these groups are affiliated to TIA.
Tourism New Zealand is a Crown entity and is responsible for the international marketing ofDestination New Zealand. This is done through developing, implementing and promotingstrategies to market New Zealand’s tourism industry. Tourism New Zealand was established inNovember 1991 and has recently promoted the following mission: “To motivate the world tocome now, do more and come back.” The organisation’s vision is to make New Zealand theultimate destination and ensure the world knows it. The board receives and annual appropria-tion from Government of $55 million to fund its operations.
The Ministry of Tourism commenced operation on April 1st 2002, taking responsibility for thepolicy functions previously performed by the Office of Tourism and Sport within the Ministryof Commerce and the sports policy functions previously performed by the Policy Group in theDepartment of Internal Affairs. The Ministry is focused on advancing the cause of tourism andrelated issues within Government. The following are the primary roles of the Ministry inrelation to tourism:
• Provide policy advice on tourism and related issues.
• Promote understanding of tourism issues within Government.
• Identify and seek to provide for the information needs of the tourism sector.
• Administer the various relevant Acts for which the Ministry is responsible (New ZealandTourism Strategy 2010) [ditto].
The Office is responsible to the Secretary of Internal Affairs on State Sector Act and PublicFinance Act issues and to Vote Ministers (Tourism) for the delivery of the outputs specified inthe Purchase Agreement. The 2000/02 appropriation for policy advice was $2.5 million (Minis-try of Tourism website, www.tourism.govt.nz)
Local government are represented in the governance section of tourism in a variety of formsand models. In general there are two main groupings: Regional Tourism Organisations (RTOs)and District Tourism Organisations (DTOs). There are currently 25 RTOs. All of these operateunder different structures (e.g. Trust, work within a Territorial Local Authority, stand alonecompany). Primary sources of funding for RTO’s totalled around $25 million in 2000 with 57%of this coming from local government. The remaining amounts were largely generated by salesfrom Visitor Centres and joint initiatives with industry. The key roles of RTO’s are based aroundDestination Marketing, providing business advice, economic development initiatives andmaintaining conventions bureaus. There are at least 30 DTOs. Little research has been com-pleted on this grouping but the majority are assumed to be funded by local government. Theirkey roles are Destination Marketing and providing business advice (NZ Tourism Strategy 2010).
One of the key issues in tourism is the governance of who or what environmental managementprocess is most applicable to the tourism industry. There are a plethora of environmentalmanagement processes or philosophies in the marketplace. They include: Triple Bottom Line,The Natural Step, Business for Social Responsibility, Enviromark, ISO 14000.
When these are added to the 110 (November 2000) international environmental schemes withsome tourism bias, there is a clear governance issue in terms of a process and approach that bestmeets the needs of tourism businesses. While businesses are free to choose whichever process ismost appropriate, there is, at least within tourism a link between the strategy and the industry-
Page 146 Resource Stewardship and Waste Minimisation
preferred process, e.g. Green Globe 21.
9.7 Drivers for Change within the SectorSustainable tourism development demands strategies that embrace many environmental andeconomic, as well as social aspects. This section discusses the drivers for change on the environ-mental aspects of sustainability as it relates to tourism in NZ.
Four goals have been identified in the NZ Tourism Strategy process within this area.
• To recognise the value of the natural environment and actively protect, support and promoteits sustainability.
• To ensure Maori participate and are partners in the tourism sector and that the Maori andculture and identity is protected.
• To proactively foster the recognition, understanding and appreciation of New Zealand’sbuilt, historic, cultural and Maori heritage.
• To have New Zealanders and their communities understand and actively support tourism(New Zealand Tourism Strategy 2010).
The natural environment is clearly fundamental to the New Zealand brand and many tourismproducts. New Zealand promotes a clean, green brand image and visitors assume that NewZealand is vigilant at environmental management. This is not always the case, as illustrated bya 1997 OECD survey that ranked New Zealand last when it came to the number of companiesproducing environmental reports. In addition, New Zealand may struggle to meet the 1997Kyoto protocol, which requires developed nations to reduce carbon dioxide emissions by 5.2%of their 1990 levels between 2008 and 2012 (Ministry for the Environment, 1999).
In other instances New Zealand demonstrates a much greater commitment to environmentalmanagement. These include Green Globe 21, the Seoul Declaration and the APEC/PATA Code.Green Globe 21 is an international environmental accreditation programme for travel andtourism companies, and New Zealand leads the world in implementing it. The activities carriedout in the case studies were conducted as part of the Green Globe 21 programme. The SeoulDeclaration resulted from the APEC Tourism Working Group meeting in Seoul in 2000. One ofits outcomes is a ‘Tourism Charter’, which sets out four policy goals, one of which is “tosustainably manage tourism outcomes and impacts”. New Zealand chaired the working groupthat developed this recommendation (Tourism Industry Association, 2000).
At the Pacific Asia Travel Association (PATA) meeting in April 2001, PATA and APEC adoptedthe Code for Sustainable Tourism. The code, which New Zealand developed with PATA,encourages APEC member economies to:
• conserve the natural environment, ecosystems and biodiversity;
• respect and support local traditions, cultures and communities;
• maintain environmental management systems;
• conserve energy and reduce waste and pollutants;
• encourage a tourism commitment to environment and culture;
• educate and inform others about local environment and culture; and
• co-operate with others to sustain environments and cultures (Ministry of Tourism, 2000).
Environmental conservation is not currently seen as the responsibility of all those that operatein the sector. The sector must improve the management of environmental elements if thebenefits of growing visitor numbers are to continue to outweigh the costs that this growthimposes on accessibility and use of these environments.
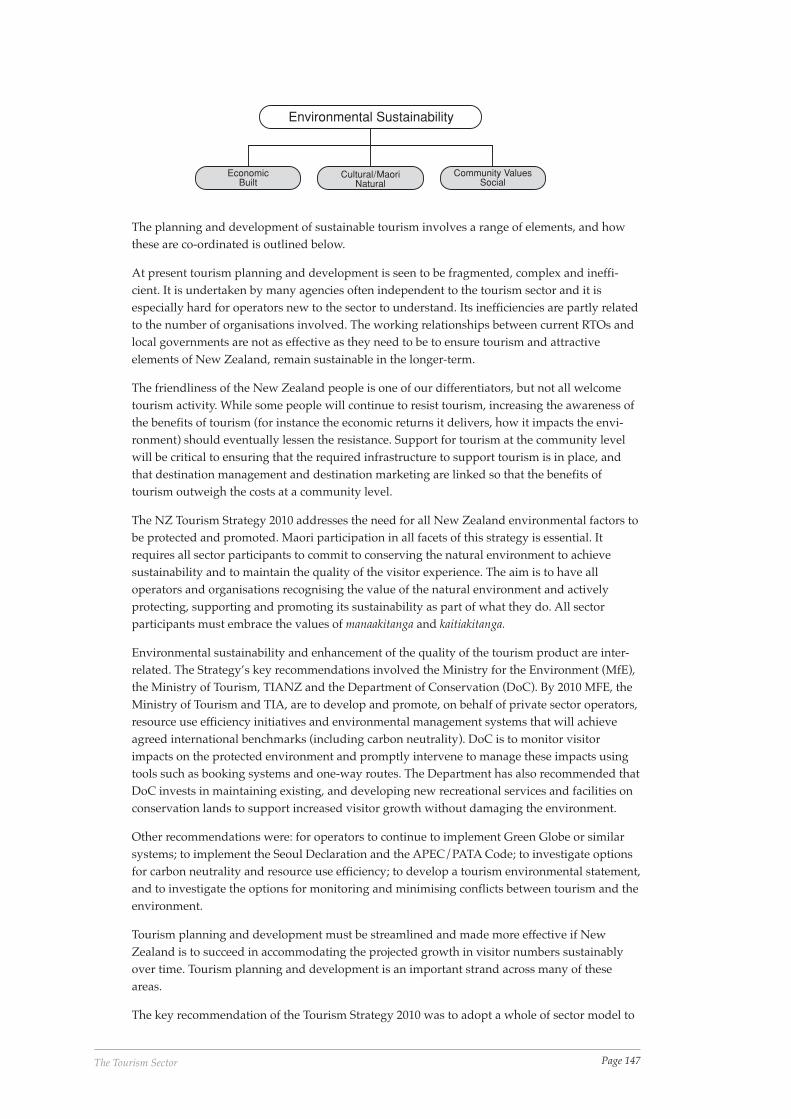
Page 147The Tourism Sector
The planning and development of sustainable tourism involves a range of elements, and howthese are co-ordinated is outlined below.
At present tourism planning and development is seen to be fragmented, complex and ineffi-cient. It is undertaken by many agencies often independent to the tourism sector and it isespecially hard for operators new to the sector to understand. Its inefficiencies are partly relatedto the number of organisations involved. The working relationships between current RTOs andlocal governments are not as effective as they need to be to ensure tourism and attractiveelements of New Zealand, remain sustainable in the longer-term.
The friendliness of the New Zealand people is one of our differentiators, but not all welcometourism activity. While some people will continue to resist tourism, increasing the awareness ofthe benefits of tourism (for instance the economic returns it delivers, how it impacts the envi-ronment) should eventually lessen the resistance. Support for tourism at the community levelwill be critical to ensuring that the required infrastructure to support tourism is in place, andthat destination management and destination marketing are linked so that the benefits oftourism outweigh the costs at a community level.
The NZ Tourism Strategy 2010 addresses the need for all New Zealand environmental factors tobe protected and promoted. Maori participation in all facets of this strategy is essential. Itrequires all sector participants to commit to conserving the natural environment to achievesustainability and to maintain the quality of the visitor experience. The aim is to have alloperators and organisations recognising the value of the natural environment and activelyprotecting, supporting and promoting its sustainability as part of what they do. All sectorparticipants must embrace the values of manaakitanga and kaitiakitanga.
Environmental sustainability and enhancement of the quality of the tourism product are inter-related. The Strategy’s key recommendations involved the Ministry for the Environment (MfE),the Ministry of Tourism, TIANZ and the Department of Conservation (DoC). By 2010 MFE, theMinistry of Tourism and TIA, are to develop and promote, on behalf of private sector operators,resource use efficiency initiatives and environmental management systems that will achieveagreed international benchmarks (including carbon neutrality). DoC is to monitor visitorimpacts on the protected environment and promptly intervene to manage these impacts usingtools such as booking systems and one-way routes. The Department has also recommended thatDoC invests in maintaining existing, and developing new recreational services and facilities onconservation lands to support increased visitor growth without damaging the environment.
Other recommendations were: for operators to continue to implement Green Globe or similarsystems; to implement the Seoul Declaration and the APEC/PATA Code; to investigate optionsfor carbon neutrality and resource use efficiency; to develop a tourism environmental statement,and to investigate the options for monitoring and minimising conflicts between tourism and theenvironment.
Tourism planning and development must be streamlined and made more effective if NewZealand is to succeed in accommodating the projected growth in visitor numbers sustainablyover time. Tourism planning and development is an important strand across many of theseareas.
The key recommendation of the Tourism Strategy 2010 was to adopt a whole of sector model to
Environmental Sustainability
EconomicBuilt
Cultural/MaoriNatural
Community ValuesSocial
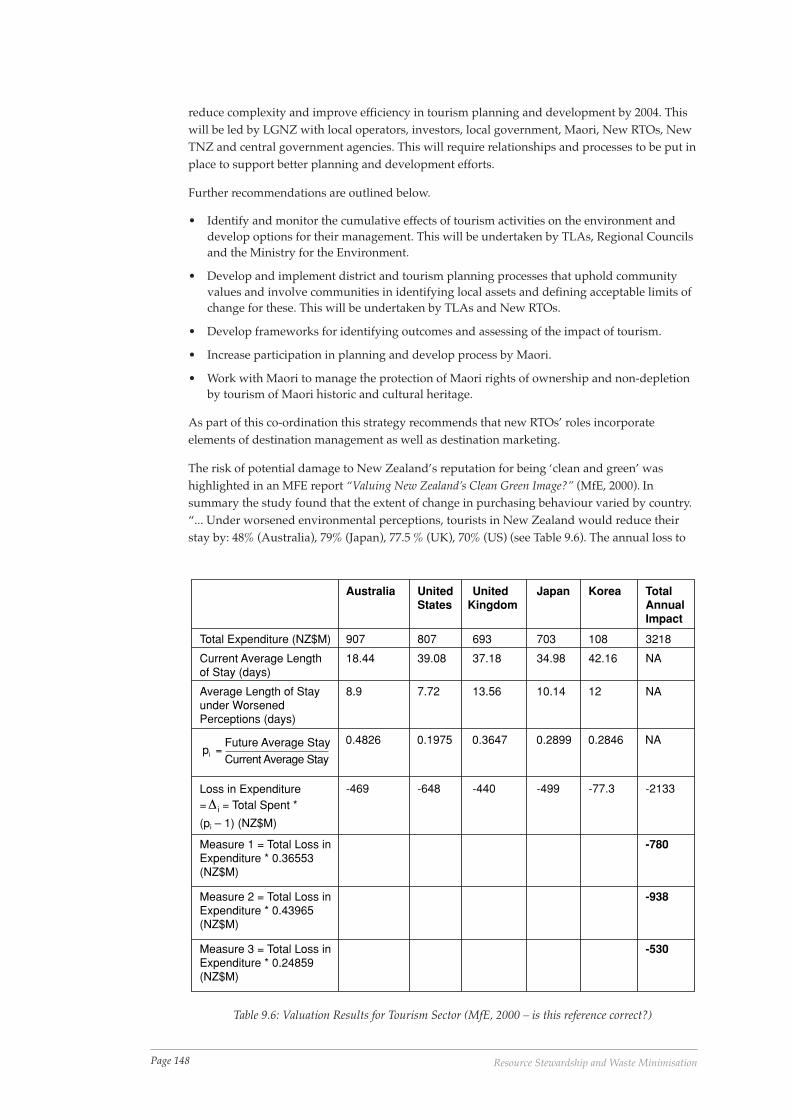
Page 148 Resource Stewardship and Waste Minimisation
reduce complexity and improve efficiency in tourism planning and development by 2004. Thiswill be led by LGNZ with local operators, investors, local government, Maori, New RTOs, NewTNZ and central government agencies. This will require relationships and processes to be put inplace to support better planning and development efforts.
Further recommendations are outlined below.
• Identify and monitor the cumulative effects of tourism activities on the environment anddevelop options for their management. This will be undertaken by TLAs, Regional Councilsand the Ministry for the Environment.
• Develop and implement district and tourism planning processes that uphold communityvalues and involve communities in identifying local assets and defining acceptable limits ofchange for these. This will be undertaken by TLAs and New RTOs.
• Develop frameworks for identifying outcomes and assessing of the impact of tourism.
• Increase participation in planning and develop process by Maori.
• Work with Maori to manage the protection of Maori rights of ownership and non-depletionby tourism of Maori historic and cultural heritage.
As part of this co-ordination this strategy recommends that new RTOs’ roles incorporateelements of destination management as well as destination marketing.
The risk of potential damage to New Zealand’s reputation for being ‘clean and green’ washighlighted in an MFE report “Valuing New Zealand’s Clean Green Image?” (MfE, 2000). Insummary the study found that the extent of change in purchasing behaviour varied by country.“... Under worsened environmental perceptions, tourists in New Zealand would reduce theirstay by: 48% (Australia), 79% (Japan), 77.5 % (UK), 70% (US) (see Table 9.6). The annual loss to
Australia UnitedStates
UnitedKingdom
Japan Korea TotalAnnualImpact
Total Expenditure (NZ$M) 907 807 693 703 108 3218
Current Average Lengthof Stay (days)
18.44 39.08 37.18 34.98 42.16 NA
Average Length of Stayunder WorsenedPerceptions (days)
8.9 7.72 13.56 10.14 12 NA
Measure 1 = Total Loss inExpenditure * 0.36553(NZ$M)
-780
Measure 2 = Total Loss inExpenditure * 0.43965(NZ$M)
-938
Measure 3 = Total Loss inExpenditure * 0.24859(NZ$M)
-530
Current Average Stay
Future Average Stay=ip
0.4826 0.1975 0.3647 0.2899 0.2846 NA
Loss in Expenditure= i∆ = Total Spent *
(pi – 1) (NZ$M)
-469 -648 -440 -499 -77.3 -2133
Table 9.6: Valuation Results for Tourism Sector (MfE, 2000 – is this reference correct?)
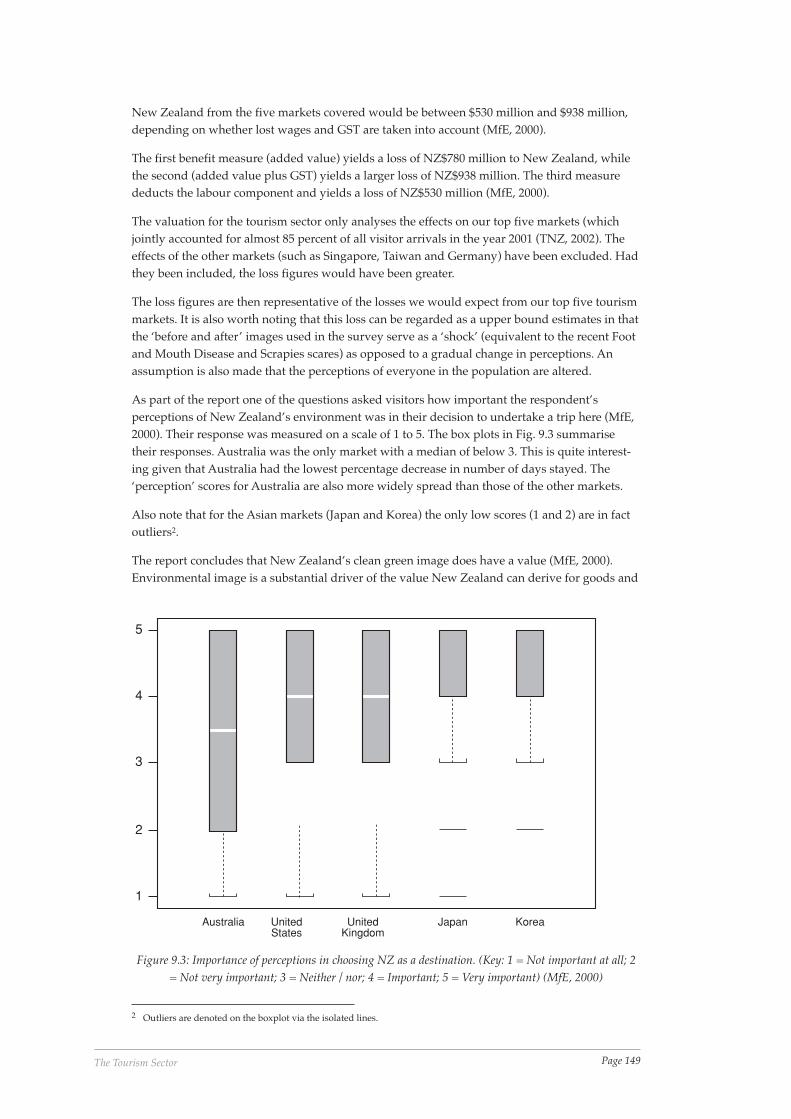
Page 149The Tourism Sector
New Zealand from the five markets covered would be between $530 million and $938 million,depending on whether lost wages and GST are taken into account (MfE, 2000).
The first benefit measure (added value) yields a loss of NZ$780 million to New Zealand, whilethe second (added value plus GST) yields a larger loss of NZ$938 million. The third measurededucts the labour component and yields a loss of NZ$530 million (MfE, 2000).
The valuation for the tourism sector only analyses the effects on our top five markets (whichjointly accounted for almost 85 percent of all visitor arrivals in the year 2001 (TNZ, 2002). Theeffects of the other markets (such as Singapore, Taiwan and Germany) have been excluded. Hadthey been included, the loss figures would have been greater.
The loss figures are then representative of the losses we would expect from our top five tourismmarkets. It is also worth noting that this loss can be regarded as a upper bound estimates in thatthe ‘before and after’ images used in the survey serve as a ‘shock’ (equivalent to the recent Footand Mouth Disease and Scrapies scares) as opposed to a gradual change in perceptions. Anassumption is also made that the perceptions of everyone in the population are altered.
As part of the report one of the questions asked visitors how important the respondent’sperceptions of New Zealand’s environment was in their decision to undertake a trip here (MfE,2000). Their response was measured on a scale of 1 to 5. The box plots in Fig. 9.3 summarisetheir responses. Australia was the only market with a median of below 3. This is quite interest-ing given that Australia had the lowest percentage decrease in number of days stayed. The‘perception’ scores for Australia are also more widely spread than those of the other markets.
Also note that for the Asian markets (Japan and Korea) the only low scores (1 and 2) are in factoutliers2.
The report concludes that New Zealand’s clean green image does have a value (MfE, 2000).Environmental image is a substantial driver of the value New Zealand can derive for goods and
5
4
3
2
1
Australia UnitedStates
UnitedKingdom
Japan Korea
Figure 9.3: Importance of perceptions in choosing NZ as a destination. (Key: 1 = Not important at all; 2= Not very important; 3 = Neither / nor; 4 = Important; 5 = Very important) (MfE, 2000)
2 Outliers are denoted on the boxplot via the isolated lines.
Page 150 Resource Stewardship and Waste Minimisation
services in the international market place. New Zealand is relatively clean and green. This ismainly attributable to our low population density resulting in relatively benign environmentalpressures. However, there are environmental problems that are sufficient to raise questionsabout the sustainability of the value of New Zealand’s exports attributable to its environmentalimage. There is a risk that New Zealand will lose the value created by the current environmen-tal reputation if we are not vigilant in dealing with the problems that could threaten the image.
9.8 Conclusions and RecommendationsNew Zealand cannot afford to move down a path where tourism, or other industries, areimpacting on our clean green image as evidenced in the following model. If New Zealandtourism, and in fact the wider Destination New Zealand, is to avoid the possibility of environ-mental issues driving a downturn in tourism arrivals and expenditure then further work, asoutlined below, needs to occur.
If the sector is to achieve the goals set out in this strategy, it will need to change significantlyover the next 10 years. It is envisaged that by 2010 the majority of our visitors will be holidayingor visiting friends and relatives. Increasingly they will be free and independent travellers whoare technology savvy and seek to use technology enabled distribution channels. The sector willhave developed effective CRM strategies and through targeted marketing will grow our marketshare.
Maori will participate fully in all facets of tourism and will play a key role in differentiating theNew Zealand tourism experience. Product authenticity will be protected and all operators willembrace the values of manaakitanga and kaitiakitanga. The New Zealand experience (‘the way wemake you feel’) will stand out as a unique global offering. ‘Destination New Zealand’ will beseen as a leading global tourism destination. Tourism destinations and products will have beendeveloped in a way that protects our environment, culture and built heritage. All sector partici-pants will work towards securing and conserving our long-term future. New Zealand will haveachieved its carbon neutrality targets and will lead the world in Green Globe and other environ-mental management strategies. A strong global brand will be established and will be marketedinternationally through both physical and virtual distribution channels. Marketing strategieswill be developed and implemented jointly with private sector tourism operators and agencies(e.g. Trade NZ, Dairy Board) that market New Zealand off-shore. Our destination marketingand destination management will be closely aligned to ensure that we deliver on our promise tovisitors. High spending visitor markets will be targeted. Products will be developed to improveyield, reduce seasonality issues and increase regional spread. Growth in visitor numbers fromkey volume markets like Australia, USA, the United Kingdom and Japan will be a priority.
The organisations servicing the sector will have reduced in number and will more closely meetthe needs of operators and our customers. In addition, the sector will have invested signifi-cantly in technology and band-width issues for remote communities will have been addressed.The sector will be viewed internationally as leading the way in terms of embracing technologyto improve business practices and decision making amongst the many SMEs operating in thesector, meet the needs of visitors, and redefine how distribution channels work within thetourism sector. Improved research and development will underpin decision-making and will berelevant to, and widely used by, operators and policy makers.
The profitability of the sector will have improved through a combination of factors including:increased visitor numbers; improved management of seasonality, and application of pricing andyield management strategies. Communities will understand the benefits of tourism and will bewelcoming hosts. Projections are that there will be at least another 100,000 new jobs created inthe economy as a consequence of increased visitor expenditure. Tourism will be seen as anexciting and dynamic sector to participate in and will be a highly desirable career choice.
Page 151The Tourism Sector
Based on the issues raised in this report, the recommendations and action plans resulting fromthe New Zealand Tourism Strategy, and the knowledge gained from the introduction of GreenGlobe 21 into New Zealand, the following recommendations are made:
• The tourism sector should continue to implement Green Globe 21 as an international, bench-marked process, based on continuous performance and independent accreditation, as theultimate environmental standard for businesses to aspire to.
• The tourism sector should integrate the Green Globe 21 process into the national tourismaccreditation scheme (Qualmark). All tourism businesses as a key component of theiraccreditation should at least have and implement an Environmental Plan based on the GreenGlobe 21 framework.
• The tourism sector should focus not only on Green Globe 21 companies, but also the devel-opment of Green Globe 21 communities as a further way of integrating resource steward-ship across communities and of positioning tourism as a positive contributor to environ-mental change.
• The tourism sector should continue to develop ‘toolkits’ and processes that enable tourismoperators to efficiently and economically aspire to reach the above recommendations.
• The tourism sector should continue to work with regulatory and non-regulatory authoritiesin order to develop further drivers which will integrate current process with the GreenGlobe 21 process.
9.9 References
WebsitesMinistry of Tourism, 2000. Domestic Travel Survey 2000, www.tourism.govt.nz
Statistics new Zealand, 1997. Tourism Satellite Account 1998 – 2000, www.stats.govt.nz
TNZ, 2002. Tourism New Zealand Trade Research and Media website,www.tourisminfo.govt.nz
WTO, 2002. World Tourism Organisation website, www.worldtourism.org
Ministry for the Environment, 2002. Valuing New Zealand’s Clean and Green Image,www.mfe.govt.nz
ArticlesMassey University, 2001. New Zealanders’ Perception of our Environment, Massey University,Palmerston North, New Zealand.
MfE, 1999. Key Opportunities and Risks to New Zealand’s Export Trade from Green Market Signals,Ministry for the Environment, Wellington.
MfE, 2000. Valuing New Zealand’s Clean Green Image, Ministry for the Environment, Wellington.
Landcare Research, 2002. How Clean and Green is New Zealand Tourism? Landcare Research andMassey University.
Office of Tourism and Sport, 2001. New Zealand Tourism Strategy 2010, Office of Tourism andSport, Wellington.
TNZ, 2001. Market Guides, Tourism NZ, Wellington.
TNZ and CM Research, 1999. Market Tracking Research, Tourism NZ, Wellington.
TNZ and Colmar Brunton, 1995. Product Development Opportunities for Asian Markets, Tourism
Page 152 Resource Stewardship and Waste Minimisation
New Zealand, Wellington.
TNZ and Colmar Brunton, 1997. Product Development Opportunities for European and NorthAmerican Markets, Wellington.
Tourism Industry, June 20002, “Kyoto - What does it mean for tourism?”, Tourism IndustryAssociation Newsletter.
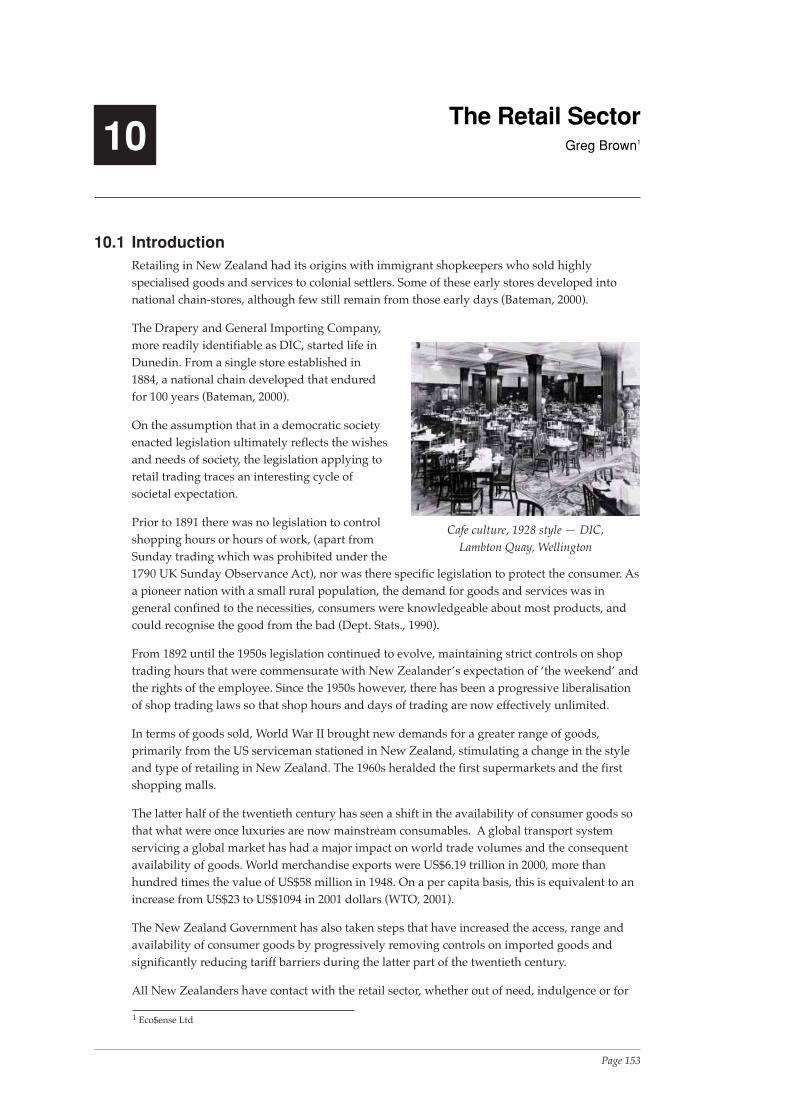
Page 153The Retail Sector
The Retail SectorGreg Brown1
10.1 IntroductionRetailing in New Zealand had its origins with immigrant shopkeepers who sold highlyspecialised goods and services to colonial settlers. Some of these early stores developed intonational chain-stores, although few still remain from those early days (Bateman, 2000).
The Drapery and General Importing Company,more readily identifiable as DIC, started life inDunedin. From a single store established in1884, a national chain developed that enduredfor 100 years (Bateman, 2000).
On the assumption that in a democratic societyenacted legislation ultimately reflects the wishesand needs of society, the legislation applying toretail trading traces an interesting cycle ofsocietal expectation.
Prior to 1891 there was no legislation to controlshopping hours or hours of work, (apart fromSunday trading which was prohibited under the1790 UK Sunday Observance Act), nor was there specific legislation to protect the consumer. Asa pioneer nation with a small rural population, the demand for goods and services was ingeneral confined to the necessities, consumers were knowledgeable about most products, andcould recognise the good from the bad (Dept. Stats., 1990).
From 1892 until the 1950s legislation continued to evolve, maintaining strict controls on shoptrading hours that were commensurate with New Zealander’s expectation of ‘the weekend’ andthe rights of the employee. Since the 1950s however, there has been a progressive liberalisationof shop trading laws so that shop hours and days of trading are now effectively unlimited.
In terms of goods sold, World War II brought new demands for a greater range of goods,primarily from the US serviceman stationed in New Zealand, stimulating a change in the styleand type of retailing in New Zealand. The 1960s heralded the first supermarkets and the firstshopping malls.
The latter half of the twentieth century has seen a shift in the availability of consumer goods sothat what were once luxuries are now mainstream consumables. A global transport systemservicing a global market has had a major impact on world trade volumes and the consequentavailability of goods. World merchandise exports were US$6.19 trillion in 2000, more thanhundred times the value of US$58 million in 1948. On a per capita basis, this is equivalent to anincrease from US$23 to US$1094 in 2001 dollars (WTO, 2001).
The New Zealand Government has also taken steps that have increased the access, range andavailability of consumer goods by progressively removing controls on imported goods andsignificantly reducing tariff barriers during the latter part of the twentieth century.
All New Zealanders have contact with the retail sector, whether out of need, indulgence or for
Cafe culture, 1928 style — DIC,Lambton Quay, Wellington
1 Eco$ense Ltd
10
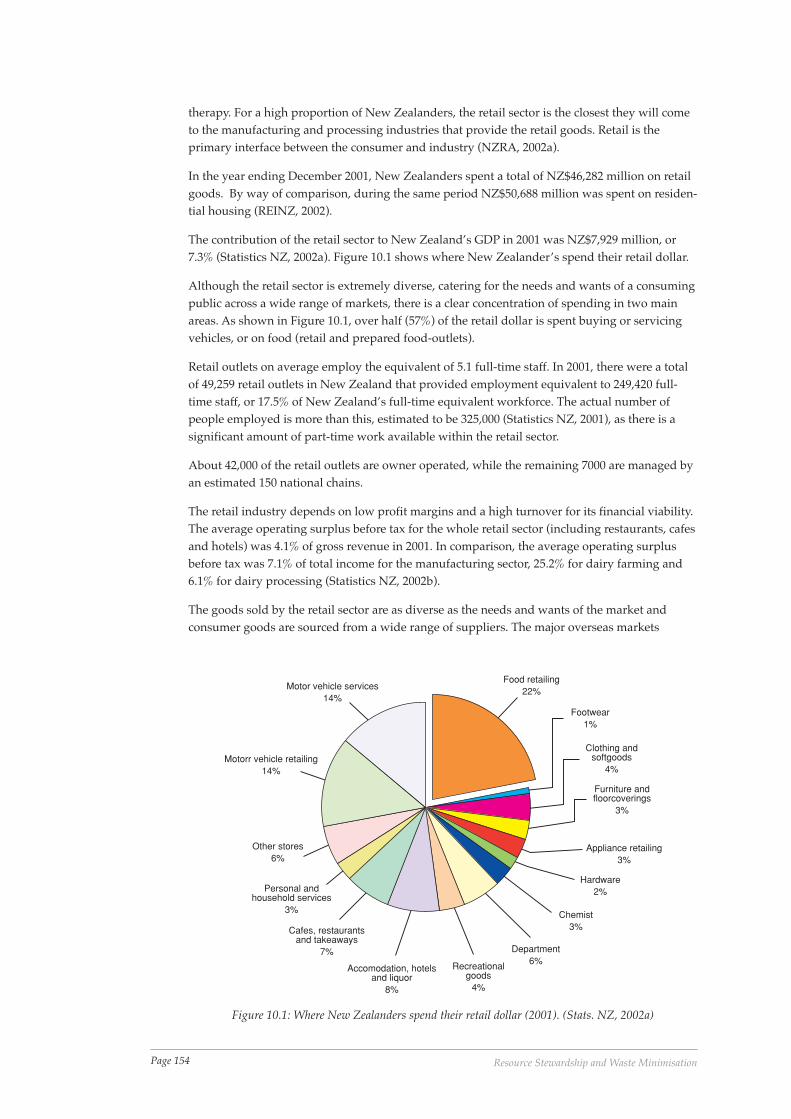
Page 154 Resource Stewardship and Waste Minimisation
therapy. For a high proportion of New Zealanders, the retail sector is the closest they will cometo the manufacturing and processing industries that provide the retail goods. Retail is theprimary interface between the consumer and industry (NZRA, 2002a).
In the year ending December 2001, New Zealanders spent a total of NZ$46,282 million on retailgoods. By way of comparison, during the same period NZ$50,688 million was spent on residen-tial housing (REINZ, 2002).
The contribution of the retail sector to New Zealand’s GDP in 2001 was NZ$7,929 million, or7.3% (Statistics NZ, 2002a). Figure 10.1 shows where New Zealander’s spend their retail dollar.
Although the retail sector is extremely diverse, catering for the needs and wants of a consumingpublic across a wide range of markets, there is a clear concentration of spending in two mainareas. As shown in Figure 10.1, over half (57%) of the retail dollar is spent buying or servicingvehicles, or on food (retail and prepared food-outlets).
Retail outlets on average employ the equivalent of 5.1 full-time staff. In 2001, there were a totalof 49,259 retail outlets in New Zealand that provided employment equivalent to 249,420 full-time staff, or 17.5% of New Zealand’s full-time equivalent workforce. The actual number ofpeople employed is more than this, estimated to be 325,000 (Statistics NZ, 2001), as there is asignificant amount of part-time work available within the retail sector.
About 42,000 of the retail outlets are owner operated, while the remaining 7000 are managed byan estimated 150 national chains.
The retail industry depends on low profit margins and a high turnover for its financial viability.The average operating surplus before tax for the whole retail sector (including restaurants, cafesand hotels) was 4.1% of gross revenue in 2001. In comparison, the average operating surplusbefore tax was 7.1% of total income for the manufacturing sector, 25.2% for dairy farming and6.1% for dairy processing (Statistics NZ, 2002b).
The goods sold by the retail sector are as diverse as the needs and wants of the market andconsumer goods are sourced from a wide range of suppliers. The major overseas markets
Food retailing22%
Footwear1%
Clothing andsoftgoods
4%
Furniture andfloorcoverings
3%
Appliance retailing3%
Hardware2%
Chemist3%
Department6%Recreational
goods4%
Accomodation, hotelsand liquor
8%
Cafes, restaurantsand takeaways
7%
Personal andhousehold services
3%
Other stores6%
Motorr vehicle retailing14%
Motor vehicle services14%
Figure 10.1: Where New Zealanders spend their retail dollar (2001). (Stats. NZ, 2002a)
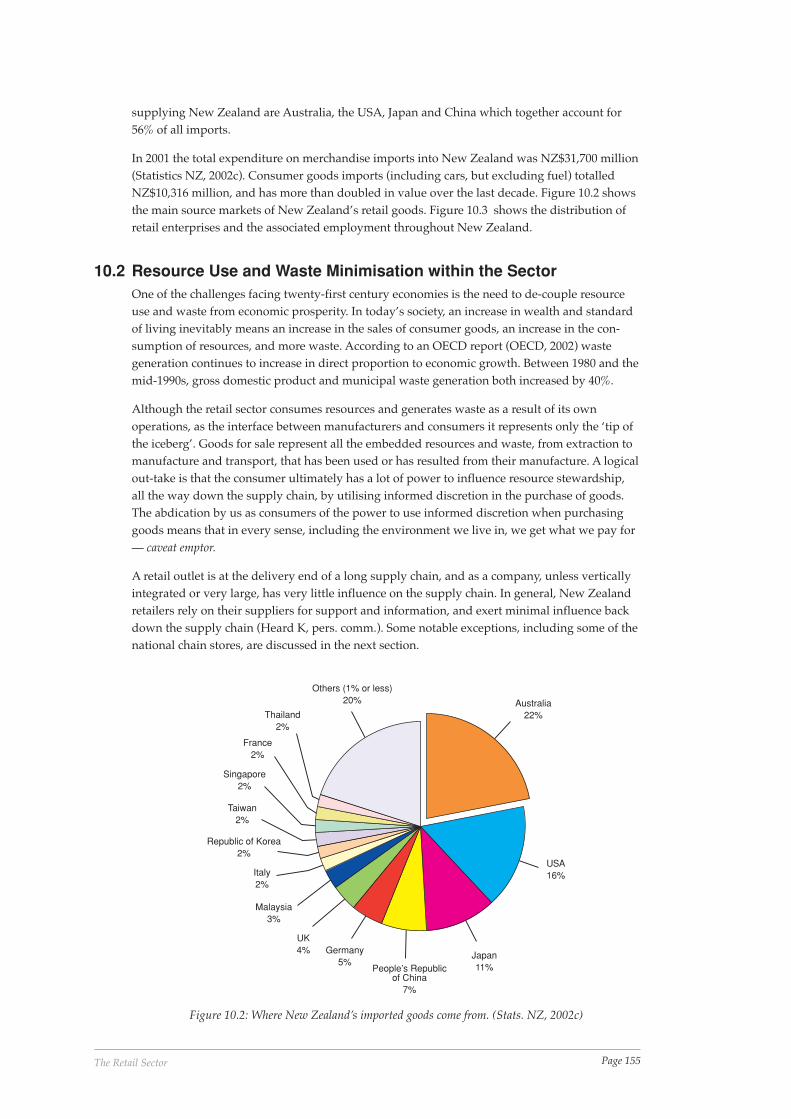
Page 155The Retail Sector
supplying New Zealand are Australia, the USA, Japan and China which together account for56% of all imports.
In 2001 the total expenditure on merchandise imports into New Zealand was NZ$31,700 million(Statistics NZ, 2002c). Consumer goods imports (including cars, but excluding fuel) totalledNZ$10,316 million, and has more than doubled in value over the last decade. Figure 10.2 showsthe main source markets of New Zealand’s retail goods. Figure 10.3 shows the distribution ofretail enterprises and the associated employment throughout New Zealand.
10.2 Resource Use and Waste Minimisation within the SectorOne of the challenges facing twenty-first century economies is the need to de-couple resourceuse and waste from economic prosperity. In today’s society, an increase in wealth and standardof living inevitably means an increase in the sales of consumer goods, an increase in the con-sumption of resources, and more waste. According to an OECD report (OECD, 2002) wastegeneration continues to increase in direct proportion to economic growth. Between 1980 and themid-1990s, gross domestic product and municipal waste generation both increased by 40%.
Although the retail sector consumes resources and generates waste as a result of its ownoperations, as the interface between manufacturers and consumers it represents only the ‘tip ofthe iceberg’. Goods for sale represent all the embedded resources and waste, from extraction tomanufacture and transport, that has been used or has resulted from their manufacture. A logicalout-take is that the consumer ultimately has a lot of power to influence resource stewardship,all the way down the supply chain, by utilising informed discretion in the purchase of goods.The abdication by us as consumers of the power to use informed discretion when purchasinggoods means that in every sense, including the environment we live in, we get what we pay for— caveat emptor.
A retail outlet is at the delivery end of a long supply chain, and as a company, unless verticallyintegrated or very large, has very little influence on the supply chain. In general, New Zealandretailers rely on their suppliers for support and information, and exert minimal influence backdown the supply chain (Heard K, pers. comm.). Some notable exceptions, including some of thenational chain stores, are discussed in the next section.
Australia22%
USA16%
Japan11%People’s Republic
of China7%
Germany5%
UK4%
Malaysia3%
Italy2%
Republic of Korea2%
Taiwan2%
Singapore2%
France2%
Thailand2%
Others (1% or less)20%
Figure 10.2: Where New Zealand’s imported goods come from. (Stats. NZ, 2002c)
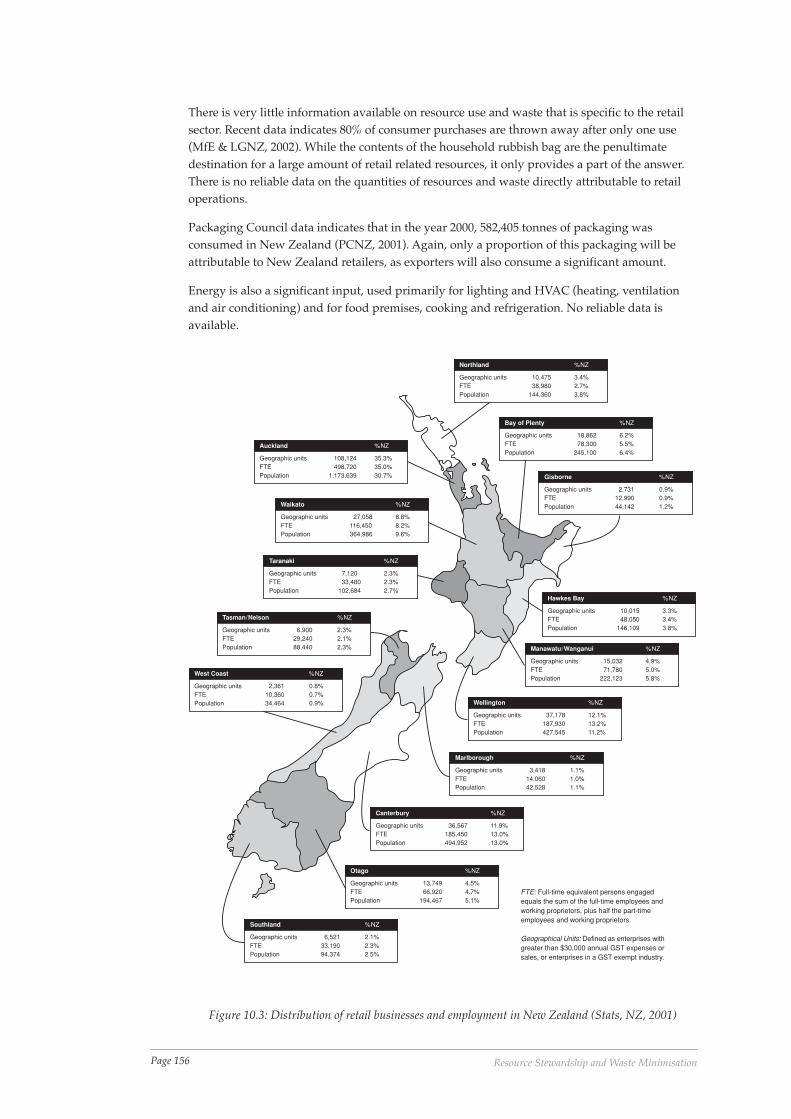
Page 156 Resource Stewardship and Waste Minimisation
There is very little information available on resource use and waste that is specific to the retailsector. Recent data indicates 80% of consumer purchases are thrown away after only one use(MfE & LGNZ, 2002). While the contents of the household rubbish bag are the penultimatedestination for a large amount of retail related resources, it only provides a part of the answer.There is no reliable data on the quantities of resources and waste directly attributable to retailoperations.
Packaging Council data indicates that in the year 2000, 582,405 tonnes of packaging wasconsumed in New Zealand (PCNZ, 2001). Again, only a proportion of this packaging will beattributable to New Zealand retailers, as exporters will also consume a significant amount.
Energy is also a significant input, used primarily for lighting and HVAC (heating, ventilationand air conditioning) and for food premises, cooking and refrigeration. No reliable data isavailable.
Geographic units 18,862 6.2%FTE 78,300 5.5%Population 245,100 6.4%
Bay of Plenty %NZ
Geographic units 10,475 3.4%FTE 38,980 2.7%Population 144,360 3.8%
Northland %NZ
Geographic units 2,731 0.9%FTE 12,990 0.9%Population 44,142 1.2%
Gisborne %NZ
Geographic units 108,124 35.3%FTE 498,720 35.0%Population 1,173,639 30.7%
Auckland %NZ
Geographic units 27,058 8.8%FTE 116,450 8.2%Population 364,986 9.6%
Waikato %NZ
Geographic units 7,120 2.3%FTE 33,480 2.3%Population 102,684 2.7%
Taranaki %NZ
Geographic units 6,900 2.3%FTE 29,240 2.1%Population 88,440 2.3%
Tasman/Nelson %NZ
Geographic units 2,361 0.8%FTE 10,360 0.7%Population 34,464 0.9%
West Coast %NZ
Geographic units 10,015 3.3%FTE 48,050 3.4%Population 146,109 3.8%
Hawkes Bay %NZ
Geographic units 15,032 4.9%FTE 71,780 5.0%Population 222,123 5.8%
Manawatu/Wanganui %NZ
Geographic units 6,521 2.1%FTE 33,190 2.3%Population 94,374 2.5%
Southland %NZ
Geographic units 13,749 4.5%FTE 66,920 4.7%Population 194,467 5.1%
Otago %NZ
Geographic units 36,567 11.9%FTE 185,450 13.0%Population 494,952 13.0%
Canterbury %NZ
Geographic units 3,418 1.1%FTE 14,060 1.0%Population 42,528 1.1%
Marlborough %NZ
Geographic units 37,178 12.1%FTE 187,930 13.2%Population 427,545 11.2%
Wellington %NZ
FTE: Full-time equivalent persons engagedequals the sum of the full-time employees andworking proprietors, plus half the part-timeemployees and working proprietors.
Geographical Units: Defined as enterprises withgreater than $30,000 annual GST expenses orsales, or enterprises in a GST exempt industry.
Figure 10.3: Distribution of retail businesses and employment in New Zealand (Stats, NZ, 2001)
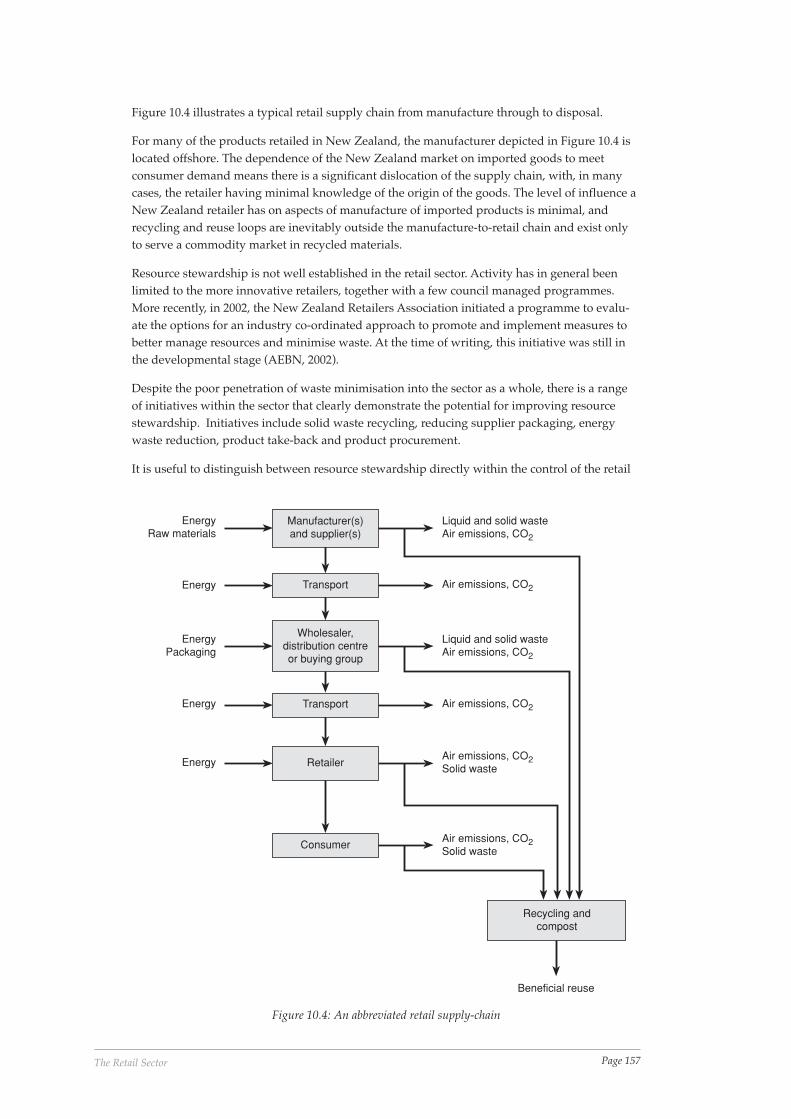
Page 157The Retail Sector
Figure 10.4 illustrates a typical retail supply chain from manufacture through to disposal.
For many of the products retailed in New Zealand, the manufacturer depicted in Figure 10.4 islocated offshore. The dependence of the New Zealand market on imported goods to meetconsumer demand means there is a significant dislocation of the supply chain, with, in manycases, the retailer having minimal knowledge of the origin of the goods. The level of influence aNew Zealand retailer has on aspects of manufacture of imported products is minimal, andrecycling and reuse loops are inevitably outside the manufacture-to-retail chain and exist onlyto serve a commodity market in recycled materials.
Resource stewardship is not well established in the retail sector. Activity has in general beenlimited to the more innovative retailers, together with a few council managed programmes.More recently, in 2002, the New Zealand Retailers Association initiated a programme to evalu-ate the options for an industry co-ordinated approach to promote and implement measures tobetter manage resources and minimise waste. At the time of writing, this initiative was still inthe developmental stage (AEBN, 2002).
Despite the poor penetration of waste minimisation into the sector as a whole, there is a rangeof initiatives within the sector that clearly demonstrate the potential for improving resourcestewardship. Initiatives include solid waste recycling, reducing supplier packaging, energywaste reduction, product take-back and product procurement.
It is useful to distinguish between resource stewardship directly within the control of the retail
Manufacturer(s)and supplier(s)
Transport
Transport
Retailer
Wholesaler,distribution centreor buying group
Consumer
Recycling andcompost
EnergyRaw materials
Energy
EnergyPackaging
Energy
Energy
Liquid and solid wasteAir emissions, CO2
Air emissions, CO2
Liquid and solid wasteAir emissions, CO2
Air emissions, CO2
Air emissions, CO2Solid waste
Air emissions, CO2Solid waste
Beneficial reuse
Figure 10.4: An abbreviated retail supply-chain
Page 158 Resource Stewardship and Waste Minimisation
sector and resource stewardship that the sector can only influence:
• the retail sector has direct control over resources used in the course of retail operations, thatis primarily energy and packaging and organic waste disposal; but
• indirectly the retail industry sells goods that represent a much larger proportion of resourcesin terms of embedded extraction, manufacture and transport.
The following sections look at how resource efficiency can be applied to retail operations interms of local transport, packaging and energy and also to the goods themselves.
The Retail GoodsThere are a number of small owner-operated retail outlets in New Zealand that have a strongenvironmental focus, retailing goods ranging from natural-ingredient-based household clean-ers, skin and health care products, organic food and non-hybrid seeds, to recycled computersand renewable energy technology. Although ‘green’ retail businesses represent only a smallportion of the New Zealand retail sector, they occupy a well-supported and established niche inthe market. Examples of commitment to resource stewardship with respect to the nature andsource of the products sold is not, however, widespread within the sector.
Attention to resource stewardship in relation to the types of goods sold results from a strongpersonal commitment or belief by executive management and a sense of corporate responsibil-ity, or legislation.
The Body Shop was started in 1976 by Anita Roddick, selling about 25 home-made beauty careproducts from a small shop in Brighton, England. The Body Shop brand is well-establishedglobally and is readily associated with environmental and social responsibility. The Body Shoppursues sustainable business in terms of the nature, manufacture and disposal (packaging take-back) of its products (The Body Shop, 2002).
Nationally, the awareness that tropical hardwood harvesting can have serious long-termenvironmental impacts has resulted in several New Zealand retailers reviewing their timber, ortimber furniture, procurement policies. Many retailers selling hardwood furniture, although notnecessarily able to produce certified verification, will assure customers that the wood source issustainable. Alternatively, some retailers deal exclusively in furniture manufactured fromrecycled timber.
By 2004 The Warehouse intends to source all outdoor furniture from manufacturers who aremembers of the Tropical Forest Trust (TWL, 2003). Membership of the Tropical Forest Trustindicates manufacturers are actively working toward Forest Stewardship Council certification(FSC, 2001, TFT, 2003).
Carters, one of New Zealand’s large building product suppliers, have developed a specificpolicy with regard to timber procurement (see Case Study 10.1). The policy signals a clearwillingness by Carters to source timber from sustainable sources, but equally clearly acknowl-edges the role of the consumer with regard to the implementation of the policy. Carter’s timberprocurement policy will be implemented voluntarily at a rate not dependent on any legislativerequirement, but rather dependent on consumer pressure.
In contrast, the Energy Efficiency and Conservation Act is one of the first examples of NewZealand legislation designed to reduce waste associated with consumer goods. The EnergyEfficiency and Conservation Act 2001, through the Energy Efficiency Regulations (2002), hasintroduced minimum energy performance standards and labelling for specified goods.
Energy labelling requires an accredited star rating and an annual energy consumption to beclearly visible on selected consumer products:
• refrigerators and freezers;
Page 159The Retail Sector
• dishwashers;
• clothes dryers;
• clothes washers; and
• household-sized air conditioners.
The Minimum Energy Performance Standards (MEPS) regime establishes minimum energyperformance criteria that must be met if a product is to be sold in New Zealand. The objective ofthe MEPS scheme is to exclude products that do not meet the minimum standard from the NewZealand market. The MEPS scheme applies to the following products:
• domestic refrigerators and freezers (from July 2002);
• three-phase cage induction motors (from July 2002);
• packaged air conditioners (from July 2002);
• fluorescent lamps (from July 2002);
• fluorescent lamp ballasts (from Feb 2003); and
• domestic electric storage water heaters (from Feb 2003).
The Retail ProcessExamples of the retail supply chain that are in the direct control of the retail merchant aretransport, packaging and energy.
Transport
The comments of managers within two large supermarket chains both indicated that they workto maximise the utilisation of their respective transport fleets by back loading wherever practi-cable.
“When we send a truck out to a store, it could go out full and come back empty — so there is aresource that is being consumed without any return ... so what we are doing is we are telling thesuppliers whom we deal with who might be in the area [of our store delivery] that we will comeand pick our product up. Well, they normally send it to us anyway, they are just using [a freightcompany], so there is a commercial advantage for us to [pick the goods up] as well as them.”
“It’s in the early stages, because we’ve needed a lot of time to encourage our suppliers to see thebenefits, but today we are back loading the trucks wherever we can so that we are minimising theamount of fuel that is used.”
Both of these supermarket chains are implementing policies to improve the utilisation of theirtransport fleet to reduce cost and fuel use per item. The level of logistical planning and schedul-
Case Study 10.1: Carters Timber Procurement Policy“It is the objective of Carters to purchase only timber and timber products that have been lawfullyobtained and come from forests and plantations that are sustainably managed.
Should timber or timber products not be available in the species concerned, we will identifyalternative sustainably-managed species which are available and which meet the need.
We supply native and exotic timbers in response to customer demand and we will work with ourcustomers and the community to progressively define and supply sustainable building products.”
Courtesy Kerry Heard, Carters National Officee-mail: [email protected]
Page 160 Resource Stewardship and Waste Minimisation
ing required is likely to limit this degree of co-ordination to bigger chain stores, most particu-larly those with some form of distribution centre.
Packaging
Discarded packaging is the waste most readily associated with the retail sector, although notnecessarily the most costly in financial terms for the sector. Many retailers have the opportunityto recycle waste packaging through either council or commercially-operated collection schemes.Similarly, an increasing amount of post-consumer waste can be recycled through kerbsiderecycling schemes. It is estimated that more than 60% of New Zealand’s population have accessto recycling (PCNZ, 2001).
A national packaging mass balance undertaken in 2000 indicated 49% of all packaging materialsare recycled (PCNZ, 2001).
Some of the larger retailers, by virtue of their size, have the opportunity of working with theirsuppliers to reduce unnecessary packaging. The strategic business manager of one supermarketchain comments:
“We believe where we are able to have a reasonable amount of influence is on packaging. How wecan influence our suppliers [is specifying] the types of packaging the product comes in. And weare starting to have some wins from time to time. We get [some] product that is merchandised bythe pallet. Now it is coming in a form whereby we can split the pallet down on the floor, cut theplastic wrap that it comes in, it is pretty heavy wrap, and we don’t have any card board to recycle[and] we don’t have any cardboard to cut to display the stuff.
And it is continually looking with all the people we deal with. I guess asking the question ‘Howcan we work smarter?’ And then in order to understand how we can work smarter we have toknow the components of that supply chain, which is why we have to process map and why wehave to understand all the components the cost of each step.
One of the big pip-fruit suppliers [supply us] with their returnable containers and their retailready bins that the product comes in. So there are a number of things like those initiatives that aregoing on around the place.”
The Warehouse chain has also implemented a number of initiatives to reduce packaging waste.Although the initial focus was on recycling as the primary method of diverting waste fromlandfill, the Warehouse has looked at how waste can be eliminated by suppliers.
The Warehouse chose to begin their ‘journey toward sustainability’ by focusing on a zero wasteto landfill programme that relied principally on recycling. Although providing a useful point ofdeparture, Richard Morley-Hall2 believes the recycling focus may have inhibited their rate ofprogress. “We should have introduced the waste minimisation concept into other areas of the business alot sooner than we did. A focus on recycling alone has resulted in a lot of our staff thinking that wasteminimisation is only about zero waste to landfill. In fact, it is a lot, lot bigger than that!”
Examples of initiatives by The Warehouse that have started to broaden the scope from solidwaste minimisation to a wider consideration of resource stewardship include (TWL, 2001):
• developing a packaging guide to facilitate working with suppliers to minimise packaging;.
• commitment to supplying furniture made from sustainable timber certified by the ForestStewardship Council (or similar);
• commitment to supporting New Zealand suppliers attaining certification to the internet-based Enviro-Mark NZ environmental management system standard; and
2 Richard Morley-Hall was Environmental Manager for The Warehouse at the time of writing, but left The Warehouse inSeptember 2003 to take up a position with the Christchurch branch of the Sustainable Business Network.
Page 161The Retail Sector
• evaluating options for reducing greenhouse gas emissions through energy effi-ciency.
Energy
In common with other sectors, energy savings offer the retail sector significantly moreattractive financial opportunities than solid waste. This is principally due to therelatively low cost of solid waste disposal in New Zealand, and the revision of electric-ity contracts that have for many companies resulted in price increases of 60%.
The strategic manager of one supermarket chain commented that “The biggest costreduction that we have through waste management is actually in energy — electricity.”
The retail sectors primary use of energy is for lighting and space heating, and refrig-eration in food retailing. Case study 10.3 describes energy saving initiatives imple-mented by a small independent retailer as a part of a showroom fit-out.
Case Study 10.2: Reducing and recyclingThe Warehouse Group has 75 red sheds and 32 Warehouse Stationery stores in NewZealand. As a major retailer of consumer products, packaging dominates its waste volume.
By July 2002, all Warehouse Stores had recycling in place. Now that the recycling scheme iswell established, The Warehouse is increasing the focus on reducing waste at source.
The Warehouse has already had some success reducing waste at source.
• Shoes imported from China come packed with stiffening and tissue paper inside theshoes. These two items of packaging accounted for 30% of The Warehouse’s paperwaste. There was a perception amongst some Warehouse staff that suppliers would notbe interested in making any changes for a relatively small player like the Warehouse,and there was a six-month delay before one of the buyers agreed to at least ask one ofthe suppliers.
The response was immediate and very positive. By talking to the Chinese supplier, theshoe stiffening and tissue packaging was eliminated and was not imported into NewZealand. Although the reduction in waste was important, the main financial savingresulted from eliminating the staff time required for unwrapping and disposing of theexcess packaging. The Warehouse is now working with all their shoe suppliers toeliminate the in-shoe packaging.
• Another initiative that required working with the supplier was the substitution of thepolystyrene chips with paper. CDs distributed from an Auckland supplier were packedwith polystyrene chips that had a considerable nuisance value for Warehouse staff; thechips stuck to clothing, spilled over the floor and when put in the skip, blew around theyard. The distributor was more than happy to change to paper packaging, which wascost neutral for him and provided both environmental benefits and reduced hassle forall concerned.
• Apparel packaging use in the store has been reduced by hanging clothing on reusablehangers. Reducing shipment packaging provided another challenge. Between thewinter seasons of 2003 and 2003, plastic outer carton strapping was reduced by 88.4%and garment wrapper bags by 77%. In addition, requesting suppliers to change the typeof plastic packaging improved the recyclability from 35% to 92.3% over the same period.Between them these initiatives eliminated the need for 14.25 tonnes of plastic that wouldotherwise have been disposed of in a landfill.
For more information, contact: Trevor Johnston, The Warehouse,Phone 09 489 8900, email: [email protected]
Page 162 Resource Stewardship and Waste Minimisation
The Green Retail M2M (measure-to-manage) project that involved the Edward Gibbon storewas part of a programme managed by the Christchurch City Council that was based on theprinciple that ‘if you don’t measure it, you can’t manage it’. The Green Retail programme wasaimed at smaller retail premises and focused on regularly measuring electrical energy usage,allowing comparisons to be made between stores as well as recommendations for improvingenergy efficiency.
Where resources permit, more detailed monitoring and reporting systems can result in signifi-cant energy savings. Case Study 10.4 describes how implementing an energy monitoring systemhas helped The Warehouse halve its average energy use.
Integrating Resource StewardshipWith the improved access to recycling operations, a significant number of retailers are in 2002sending a smaller proportion of their solid waste to the landfill than they were a decade ago.But for many retailers, that is where waste minimisation begins and ends.
One of the major supermarket chains has, over a period of years, integrated waste minimisationinto work planning and operations. One of the key tools they use is process mapping (see CaseStudy 10.5).
Case Study 10.3: Efficient lighting and timingEdward Gibbon Plumbing Plus in Christchurch retails bathroom supplies. Just prior tocommencing a showroom refit, the manager was made aware of more efficient lightingoptions than those already specified for the refit.
The manager had originally requested metal halide lamps because he had been impressedwith their effect in another showroom. The lighting designer had complied with themanager’s request and designed the lighting scheme accordingly.
The shops concurrent participation in a Christchurch City Council sponsored ‘Green Retail’programme during the design period provided an opportunity for the lighting scheme to bereviewed. Liaison by council Target Zero staff with the lighting designer and the storemanager resulted in the lighting design being redesigned to include more energy efficientlighting options.
As a result they have installed energy efficient lights with electronic controls or ballast in theshowroom. By installing T5 fluorescent lamp technology they have saved $2,000 per annumwith a payback of 2 years, compared to the metal halide down lights that were originallydesignated.
The light output is better even though the wattage of each lamp is much lower than themetal halide lamps. The new T5 lamps have resulted in a reduction in operating costs, lowermaintenance and reduced environmental pollution. The T5 lamps are made from less glassand mercury and last longer than ordinary tubes. The other bonus is the electronic ballastused reduces heat loss from the lamps, reducing the air-conditioning load.
One of the key factors that contributed to the success of the project was timing. The projectwould have been unlikely to proceed without the involvement of the Target Zero team withthe site during the refit process. The lighting designer, although aware of more energyefficient options, had not made their client aware of the options, but had rather respondedaccording to the client’s request.
For more information, contact: Target Zero, Christchurch City CouncilPhone 03 941 8830, e-mail: [email protected]
Page 163The Retail Sector
Examples of where waste minimisation has been integrated into work practices within thesupermarket’s operation were:
• implementing a seven-bag policy where checkout operators put a minimum of 7 items perplastic bag, has reduced plastic bag consumption by about 18%; and
• store lighting reduces automatically by 50% when the doors close for trading and the nightcrews begin work.
Another factor that has a major influence on how progressive a company is with respect toresource stewardship is the company’s core values. For one supermarket chain these are:
• ‘Have a passion for winning’;
• ‘Demonstrate respect for others’;
Case Study 10.4: Warehouse EnergySince the mid-nineties the average power consumption at Warehouse stores has been halvedfrom 200 kWh/m2 to 100 kWh/m2. This has resulted primarily from the appointment of anenergy management team and much improved monitoring and control of the store energysystems.
A centralised computer system manages the energy use at all stores, controlling bothlighting and HVAC (heating, ventilation and air conditioning) remotely. The stores forexample have no light switches, but instead lighting is controlled remotely according to thetime of day and the ambient light levels.
The energy management system also enables regular reporting of energy use to storemanagers so that can see how they are performing against historical data and against otherstores in the chain. If there are variations in energy cost or use against budget, correctiveaction can be taken promptly to minimise energy waste.
For more information, contact: Wayne Inger, The Warehouse,Phone 09 489 8900, e-mail: [email protected]
Case Study 10.5: Process mapping“The big picture of waste minimisation is very broad and wide sweeping and we have addressed thefact by building a number of programmes into our process mapping that we do on an ongoing basis.We are very heavily into process mapping.
We do process mapping with everything, and that goes right through even to understanding thevalue chain with activity-based costing aimed at getting products to market through the supply chainand so forth, so that we understand the costs that are involved in steps of the process as well as theprocess itself. The reason for needing to do that is that the food retail industry is to some degree atransient industry with a lot of people passing through it.
For that reason we have to be highly process driven and understand how each of the processes worksand all the costs involved in those processes. From the minimisation of waste from energyperspective, the recycling of energy from our refrigeration outputs to each store and that type of thingis crucial; the way that the electrical systems work with lighting to minimise electricity usage inlights and so forth. The big refrigerants that were in use long before the latest legislation was passed,in terms of what it required and environmentally friendly refrigerants, we had already changed ourrefrigeration to that some years before.”
Strategic Business Development & Marketing Manager, Supermarket chain
Page 164 Resource Stewardship and Waste Minimisation
• ‘Be fair, honest and consistent’;
• ‘Embrace creativity and innovation’;
• ‘Celebrate life and achievement’; and
• ‘Learn from everything we do’.
Interestingly, although there was no specific reference to ‘the environment’ in the supermarketchain’s value statements, the strategic business manager commented that the values wereintegrated into the staff work ethos to the extent that looking after the environment was anaccepted and integral part of business.
10.3 Using Waste Minimisation to bring about Resource StewardshipResource stewardship is not well established within the New Zealand retail sector. Althoughsolid waste recycling is now much more accessible in 2002 than it was 10 years ago, only a smallfraction of the 49,000 plus outlets have ventured beyond recycling to investigate more substan-tive issues.
The economic well-being of the retail sector is dependent on the spending power of the consum-ing public, and is in good health when consumer spending is high. The inherent contradiction,from the perspective of resource stewardship, is the presiding view that economic prosperity inthe retail sector will only increase as a result of selling more goods.
The retailer is the final link in the supply chain to the consumer. New Zealand retail businessesare comparatively small, and with the exception of some of the larger chain stores, have limitedability to influence the supply chain.
With fewer than 38,000 of a total 49,259 (Statistics NZ, 2001a) outlets (including accommodationand food outlets) employing less than 5 people, the resources available to implement wasteminimisation is limited when maintaining a business in a sector where the average before taxprofit is only 4.4% of turnover.
The Christchurch City and Waitakere City councils have both run programmes to assist retailersminimise waste, and in each case have worked with groups of retailers as well as with indi-vidual businesses.
Observations drawn from their collective experience help identify the issues of implementingwaste minimisation within the retail sector. The issues identified included a lack of time andresources, the low value of solid waste of savings, a high staff turnover, a lack of consumerpressure and a reluctance to do more than recycling.
“Retailers are very busy, time is of the essence and capital is in short supply.”
“The potential savings, particularly from solid waste reduction, are small.”
“There is a high staff turnover, including store managers, particularly in chain stores.”
“There is no consumer pressure in New Zealand — we are not asking the questions.”
“It is very difficult to move retailers beyond the easy fixes, like recycling, to the more importantissues like what they are selling and why.”
Shopping malls provide a unique opportunity to work with a cluster of retailers, but notwithout potentially serious pitfalls. The two most serious barriers encountered were the level ofcommitment from mall management, and how service charges were allocated.
Regarding management commitment, a cleaner production advisor working at Waitakere CityCouncil (Bielby, B, pers. comm) commented that:

Page 165The Retail Sector
“Although we started the programme in partnership and with the full support of the mall manage-ment to develop environmental initiatives, a change in ownership and subsequently managementpersonnel meant that, with the exception of some recycling, a lot of the initiatives ceased or werenot followed through. The new management had no idea of the previous environmental pro-grammes and it essentially became a case of having to start from scratch again.”
A report summarising a Christchurch City Council programme (Speidel, 1999) highlighted anissue with service charging that provided no financial incentive to reduce waste:
“The retailers are charged for fresh water, liquid waste and solid waste (but not energy) in relationto the shop area. Large shops pay more, regardless of their water usage or their generation ofliquid and solid waste. Therefore, there is hardly any financial incentive for the retailers tominimise water consumption or waste. Mall Management does not intend to change this system,[as they believe] a change would affect retailers with high waste production negatively, and theymight break away from the mall.”
The Christchurch programme (Speidel, 1999) also had an issue with long term commitment.
“When the mall management realised that waste minimisation is a long-term issue that can betime consuming and complex, the idea of marketing the project [to promote the mall as an Eco-mall] was given up and [their] commitment to the project declined substantially.”
On a more positive note, a mall in West Auckland is revamping its environmental programmedue to pressure from many of the large retailers located in the mall. Previously the programmehad been abandoned, after being initiated by management, due to a lack of interest from manyof the retailers. (Bielby, B, pers. comm.).
There are potential advantages for an intervention programme operated in the context of a mall.Experience to date has also highlighted potential pitfalls. The pros and cons are summarised inTable 10.1.
There are occasions where waste minimisation options are constrained by ‘competing’ de-mands. Case Study 10.6 highlights the pre-eminence of food hygiene in food retailing anddescribes how one company developed a solution to minimise waste and satisfy food hygienerequirements. Unfortunately it also highlights the fragility of New Zealand’s small recyclingmarket where the initiative ultimately failed because the recycler went out of business.
10.4 Governance of the SectorAlthough there are close to 40 separate items of legislation that affect the retail sector, there arenone, with the exception of the recently enacted Energy Efficiency Regulations and the ResourceManagement Act, that have any direct impact on resource stewardship. The New ZealandRetailers Association has recently reviewed the legislation applicable to the retail sector with theobjective of encouraging government to reduce compliance costs and improve ease of use(NZRA, 2002b). A discussion of a selection of applicable legislation follows.
Cons
Bundled water, trade and solid wastecharges allocated per m2 provides noincentive to minimise waste
Lack of mall management commitment amajor barrier
Pros
Convenient cluster of retailers
Potential for central co-ordination by mallmanagement
Common resource, waste and utilitymanagement
Opportunity to build on existing relationshipsbetween retailers and mall management
Table 10.1: Promoting resource stewardship in retail malls — pros and cons
Page 166 Resource Stewardship and Waste Minimisation
Legislation can be grouped into four main categories: consumer rights, taxation, employmentand environmental issues.
Consumer rightsLegislation addressing consumer rights includes the Commerce Act, the Fair Trading Act, theConsumer Guarantees Act, the Lay-by Sales Act, the Sales of Goods Act, the Second HandDealers Act, the Pawnbrokers Act and the Auctioneers Act.
Although there is no conscious intent to encourage resource stewardship within the consumerrights legislation, the Consumer Guarantees Act does provide safeguards that can have animpact on resource use. The requirement that goods sold be ‘fit for purpose’ and of ‘acceptablequality’ provides an incentive for both the retailers and suppliers to provide goods that avoidproduct returns. The efficacy of the legislation however relies on consumer knowledge of theirrights and willingness to complain.
The Commerce Act, via the Commerce Commission, can also impact resource stewardship byensuring there is a competitive market in circumstances where a lack of competition results ininefficient practices. The existence of a competitive market does not guarantee resource stew-ardship as highlighted in 2002 by the ‘leaky building syndrome’, where cost cutting also cutquality.
TaxationLegislation addressing taxation includes the Goods and Services Act and General Taxationlegislation. The existing taxation legislation currently has no impact on resource stewardship,although the proposed carbon tax and landfill levy could in the future.
EmploymentLegislation addressing employment includes the Employment Relations Act, Minimum WagesAct, Wages Protection Act, Holidays Act, ANZAC Day Act, Waitangi Day Act, Health andSafety in Employment Act, Smoke-free Environment Act and the Shop Trading Hours Repeal Act.
Case Study 10.6: Bags to bucketsPackaging groceries in plastic bags is a standard option in all New Zealand supermarkets.Plastic bags are an attractive packaging option because of their strength and low bulk.Options for reducing plastic bag consumption include reusing (at the next visit) orrecycling into another product.
For one supermarket chain, encouraging the reuse of their plastic bags was not an optionbecause of food hygiene concerns. For example, packing fresh items in a plastic bag thathad previously been used to carry a leaking fresh chicken portion could have serious healthimplications. Allowing the reuse of plastic bags means the supermarket no longer has anycontrol of the quality or condition of the packaging, which was considered an unacceptablerisk both for the public and for the company.
Although reuse would ordinarily be considered ahead of recycling in the wasteminimisation hierarchy, in this case food hygiene regulations and practical concernsprecluded the reuse option.
An alternative option was to provide a facility for customers to recycle their used plasticbags. The returned bags were recycled into plastic buckets that were used as containers forfruit and vegetable produce and provided at no charge to the customer. The schemeoperated at a net cost to the company. Unfortunately, the recycling option had to be publiclywithdrawn when the recycling company ceased trading.
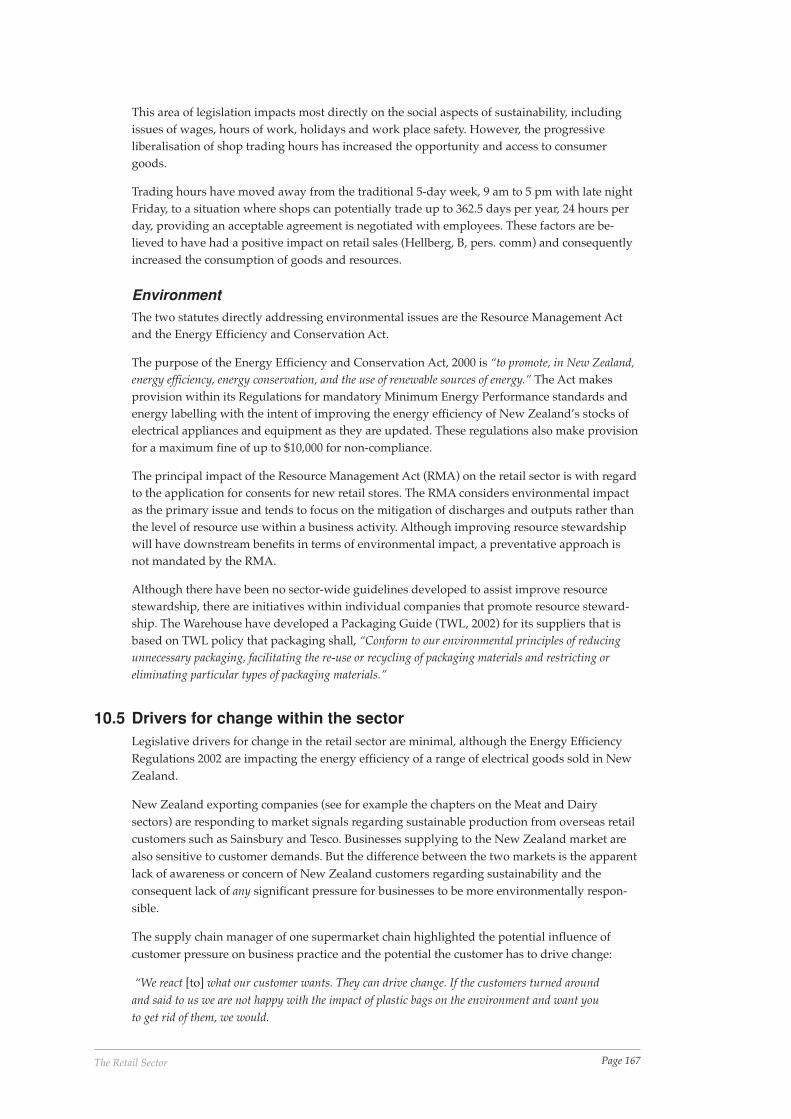
Page 167The Retail Sector
This area of legislation impacts most directly on the social aspects of sustainability, includingissues of wages, hours of work, holidays and work place safety. However, the progressiveliberalisation of shop trading hours has increased the opportunity and access to consumergoods.
Trading hours have moved away from the traditional 5-day week, 9 am to 5 pm with late nightFriday, to a situation where shops can potentially trade up to 362.5 days per year, 24 hours perday, providing an acceptable agreement is negotiated with employees. These factors are be-lieved to have had a positive impact on retail sales (Hellberg, B, pers. comm) and consequentlyincreased the consumption of goods and resources.
EnvironmentThe two statutes directly addressing environmental issues are the Resource Management Actand the Energy Efficiency and Conservation Act.
The purpose of the Energy Efficiency and Conservation Act, 2000 is “to promote, in New Zealand,energy efficiency, energy conservation, and the use of renewable sources of energy.” The Act makesprovision within its Regulations for mandatory Minimum Energy Performance standards andenergy labelling with the intent of improving the energy efficiency of New Zealand’s stocks ofelectrical appliances and equipment as they are updated. These regulations also make provisionfor a maximum fine of up to $10,000 for non-compliance.
The principal impact of the Resource Management Act (RMA) on the retail sector is with regardto the application for consents for new retail stores. The RMA considers environmental impactas the primary issue and tends to focus on the mitigation of discharges and outputs rather thanthe level of resource use within a business activity. Although improving resource stewardshipwill have downstream benefits in terms of environmental impact, a preventative approach isnot mandated by the RMA.
Although there have been no sector-wide guidelines developed to assist improve resourcestewardship, there are initiatives within individual companies that promote resource steward-ship. The Warehouse have developed a Packaging Guide (TWL, 2002) for its suppliers that isbased on TWL policy that packaging shall, “Conform to our environmental principles of reducingunnecessary packaging, facilitating the re-use or recycling of packaging materials and restricting oreliminating particular types of packaging materials.”
10.5 Drivers for change within the sectorLegislative drivers for change in the retail sector are minimal, although the Energy EfficiencyRegulations 2002 are impacting the energy efficiency of a range of electrical goods sold in NewZealand.
New Zealand exporting companies (see for example the chapters on the Meat and Dairysectors) are responding to market signals regarding sustainable production from overseas retailcustomers such as Sainsbury and Tesco. Businesses supplying to the New Zealand market arealso sensitive to customer demands. But the difference between the two markets is the apparentlack of awareness or concern of New Zealand customers regarding sustainability and theconsequent lack of any significant pressure for businesses to be more environmentally respon-sible.
The supply chain manager of one supermarket chain highlighted the potential influence ofcustomer pressure on business practice and the potential the customer has to drive change:
“We react [to] what our customer wants. They can drive change. If the customers turned aroundand said to us we are not happy with the impact of plastic bags on the environment and want youto get rid of them, we would.
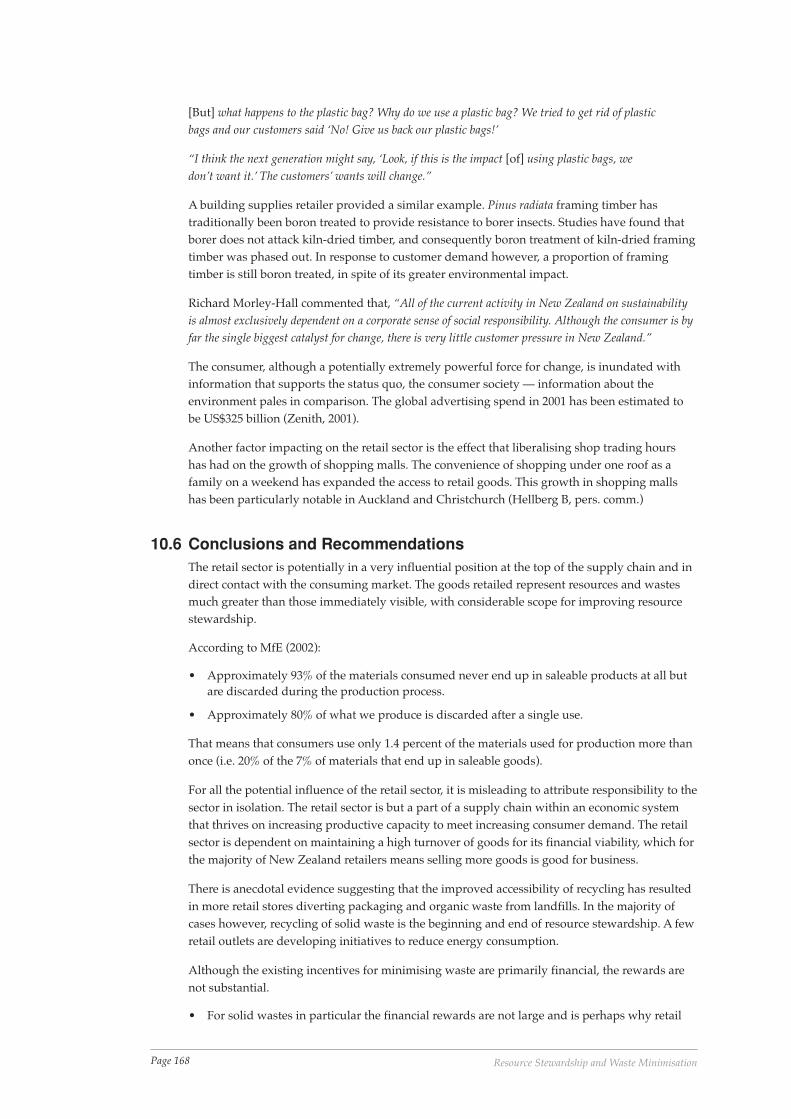
Page 168 Resource Stewardship and Waste Minimisation
[But] what happens to the plastic bag? Why do we use a plastic bag? We tried to get rid of plasticbags and our customers said ‘No! Give us back our plastic bags!’
“I think the next generation might say, ‘Look, if this is the impact [of] using plastic bags, wedon’t want it.’ The customers’ wants will change.”
A building supplies retailer provided a similar example. Pinus radiata framing timber hastraditionally been boron treated to provide resistance to borer insects. Studies have found thatborer does not attack kiln-dried timber, and consequently boron treatment of kiln-dried framingtimber was phased out. In response to customer demand however, a proportion of framingtimber is still boron treated, in spite of its greater environmental impact.
Richard Morley-Hall commented that, “All of the current activity in New Zealand on sustainabilityis almost exclusively dependent on a corporate sense of social responsibility. Although the consumer is byfar the single biggest catalyst for change, there is very little customer pressure in New Zealand.”
The consumer, although a potentially extremely powerful force for change, is inundated withinformation that supports the status quo, the consumer society — information about theenvironment pales in comparison. The global advertising spend in 2001 has been estimated tobe US$325 billion (Zenith, 2001).
Another factor impacting on the retail sector is the effect that liberalising shop trading hourshas had on the growth of shopping malls. The convenience of shopping under one roof as afamily on a weekend has expanded the access to retail goods. This growth in shopping mallshas been particularly notable in Auckland and Christchurch (Hellberg B, pers. comm.)
10.6 Conclusions and RecommendationsThe retail sector is potentially in a very influential position at the top of the supply chain and indirect contact with the consuming market. The goods retailed represent resources and wastesmuch greater than those immediately visible, with considerable scope for improving resourcestewardship.
According to MfE (2002):
• Approximately 93% of the materials consumed never end up in saleable products at all butare discarded during the production process.
• Approximately 80% of what we produce is discarded after a single use.
That means that consumers use only 1.4 percent of the materials used for production more thanonce (i.e. 20% of the 7% of materials that end up in saleable goods).
For all the potential influence of the retail sector, it is misleading to attribute responsibility to thesector in isolation. The retail sector is but a part of a supply chain within an economic systemthat thrives on increasing productive capacity to meet increasing consumer demand. The retailsector is dependent on maintaining a high turnover of goods for its financial viability, which forthe majority of New Zealand retailers means selling more goods is good for business.
There is anecdotal evidence suggesting that the improved accessibility of recycling has resultedin more retail stores diverting packaging and organic waste from landfills. In the majority ofcases however, recycling of solid waste is the beginning and end of resource stewardship. A fewretail outlets are developing initiatives to reduce energy consumption.
Although the existing incentives for minimising waste are primarily financial, the rewards arenot substantial.
• For solid wastes in particular the financial rewards are not large and is perhaps why retail
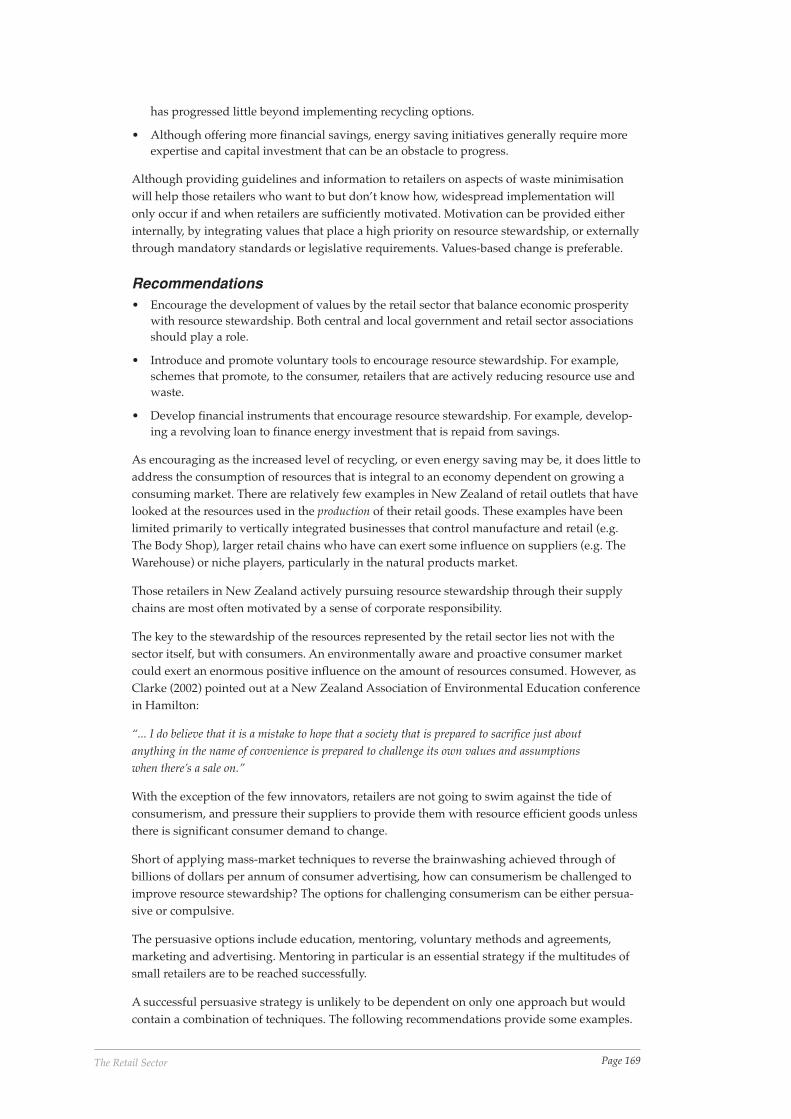
Page 169The Retail Sector
has progressed little beyond implementing recycling options.
• Although offering more financial savings, energy saving initiatives generally require moreexpertise and capital investment that can be an obstacle to progress.
Although providing guidelines and information to retailers on aspects of waste minimisationwill help those retailers who want to but don’t know how, widespread implementation willonly occur if and when retailers are sufficiently motivated. Motivation can be provided eitherinternally, by integrating values that place a high priority on resource stewardship, or externallythrough mandatory standards or legislative requirements. Values-based change is preferable.
Recommendations• Encourage the development of values by the retail sector that balance economic prosperity
with resource stewardship. Both central and local government and retail sector associationsshould play a role.
• Introduce and promote voluntary tools to encourage resource stewardship. For example,schemes that promote, to the consumer, retailers that are actively reducing resource use andwaste.
• Develop financial instruments that encourage resource stewardship. For example, develop-ing a revolving loan to finance energy investment that is repaid from savings.
As encouraging as the increased level of recycling, or even energy saving may be, it does little toaddress the consumption of resources that is integral to an economy dependent on growing aconsuming market. There are relatively few examples in New Zealand of retail outlets that havelooked at the resources used in the production of their retail goods. These examples have beenlimited primarily to vertically integrated businesses that control manufacture and retail (e.g.The Body Shop), larger retail chains who have can exert some influence on suppliers (e.g. TheWarehouse) or niche players, particularly in the natural products market.
Those retailers in New Zealand actively pursuing resource stewardship through their supplychains are most often motivated by a sense of corporate responsibility.
The key to the stewardship of the resources represented by the retail sector lies not with thesector itself, but with consumers. An environmentally aware and proactive consumer marketcould exert an enormous positive influence on the amount of resources consumed. However, asClarke (2002) pointed out at a New Zealand Association of Environmental Education conferencein Hamilton:
“... I do believe that it is a mistake to hope that a society that is prepared to sacrifice just aboutanything in the name of convenience is prepared to challenge its own values and assumptionswhen there’s a sale on.”
With the exception of the few innovators, retailers are not going to swim against the tide ofconsumerism, and pressure their suppliers to provide them with resource efficient goods unlessthere is significant consumer demand to change.
Short of applying mass-market techniques to reverse the brainwashing achieved through ofbillions of dollars per annum of consumer advertising, how can consumerism be challenged toimprove resource stewardship? The options for challenging consumerism can be either persua-sive or compulsive.
The persuasive options include education, mentoring, voluntary methods and agreements,marketing and advertising. Mentoring in particular is an essential strategy if the multitudes ofsmall retailers are to be reached successfully.
A successful persuasive strategy is unlikely to be dependent on only one approach but wouldcontain a combination of techniques. The following recommendations provide some examples.
Page 170 Resource Stewardship and Waste Minimisation
Recommendations• Expand central government support and promotion of environmental labelling schemes.
• Identify and form a working group of innovative retailers to help develop a strategy todisseminate resource stewardship amongst New Zealand retailers.
• Encourage innovative retailers to participate as anchor companies in shopping precinct ormall-focused resource stewardship promotion and implementation programmes.
• Encourage the innovators to mentor other retailers.
• Develop projects with larger retailers to drive resource stewardship down the supply chain.
Compulsive, or legislative, options should ideally only be supporting what is already beingdone voluntarily by, for example, ‘levelling the playing field’. An existing example is theminimum energy performance standards and the energy-labelling scheme introduced withinthe Energy Efficiency Regulations, and restrictions on imported Japanese cars.
Recommendations• Progressively introduce mandatory labelling of consumer goods to support voluntary
initiatives such as Environmental Choice and similar.
• Extend minimum performance standards (on goods for sale in New Zealand) to otherconsumer goods, to discourage the importing of resource intensive goods.
A strategy to improve resource stewardship in the retail sector needs to address two keyobjectives:
• Changing business values to incorporate resource stewardship
• Raising consumer awareness of the environmental and social impacts of buying patterns todevelop a more discerning consumer market.
10.7 ReferencesAEBN, 2002. Sustainable Retail Programme Action Plan 2002 to 2004, Auckland Environmental
Business Network, Auckland.
Bateman, 2000. New Zealand Encyclopaedia (5th edn), David Bateman Ltd, Auckland.
Clarke J, 2002. “Secrets from the dark side”, paper presented at NZAEE Conference, Hamilton.
Department of Statistics, 1990. New Zealand Official Yearbook, 1990, Department of Statistics,Wellington.
FSC, 2001. Forest Stewardship Council, www.fscoax.org
MAF, 2001. Sheep and Beef Monitoring Report July 2001, Ministry of Agriculture and Forestry,Wellington.
MfE & LGNZ, 2002. The New Zealand Waste Strategy, Ministry for the Environment, Wellington
NZRA, 2002a. The Retail Market in New Zealand, New Zealand Retailers Association, Wellington.
NZRA, 2002b. New Zealand Retail Association Legislative Review, New Zealand Retailers Associa-tion, Wellington.
OECD, 2002. Strategic Waste Prevention, Organisation for Economic Co-operation and Develop-ment, Paris.
PCNZ, 2002. “Packaging information”, Packaging Council of New Zealand, Auckland,www.packaging.org.nz/packaging_index.html
Page 171The Retail Sector
REINZ, 2002. Public Housing Statistics, Real Estate Institute of NZ, Auckland, www.reinz.org.nz/
Speidel, S, 1999. Green Retail Evaluation, Christchurch City Council, Christchurch.
Statistics New Zealand, 2001a. Business Demographic Survey, Statistics New Zealand, Wellington.
Statistics New Zealand, 2002a. Retail Trade Survey, Statistics New Zealand, Wellington
Statistics New Zealand, 2002b. Annual Enterprise Survey, Statistics New Zealand, Wellington
Statistics New Zealand, 2002c. Overseas Merchandise Trade (Imports), Statistics New Zealand,Wellington
The Body Shop, 2002. www.the-body-shop.com, United Kingdom.
TWL, 2001. The Warehouse Triple Bottom Line Report 2001, The Warehouse Limited, Auckland.
TWL, 2002. The Warehouse Limited Packaging Guide, The Warehouse Limited, Auckland.
TWL, 2003. The Warehouse Triple Bottom Line Report 2003, The Warehouse Limited, Auckland.
TFT, 2003. Tropical Forest Trust, Switzerland, www.tropicalforesttrust.com.
WTO, 2001. Statistics on Globalisation, World Trade Organisation, Geneva.
Zenith, 2001. Looking for the Upturn, Zenith Optimedia Group, London.
10.8 AcknowledgementsGrateful thanks to Barry Hellberg of the NZRA, the cleaner production staff at Waitakere CityCouncil, the Resource Efficiency staff at Christchurch City Council, the AEBN and the retailrepresentatives who contributed comment and case studies.

Page 172 Resource Stewardship and Waste Minimisation
Page 173The Plastics Sector
11The Plastics Sector
Carolyn Cox1
11.1 IntroductionThere are over 400 plastic product manufacturers and raw material suppliers in New Zealand,who collectively employ some 8,000 employees (Statistics NZ, 2002). They produce products fora wide range of applications, including packaging, construction, agriculture, and houseware.Industry revenues now exceed $1.8 billion per year and directly contribute over 1.7% to NewZealand’s GDP (Statistics NZ, 2002).
Direct export of finished plastic products is a particularly vibrant part of the sector, withrevenue increasing from $80m in 1990, to approximately $347m at present (Statistics NZ, 2002).In addition, it has been estimated that up to half as much again is exported ‘indirectly’, i.e. aspackaging or components for other export industries, in particular for meat, dairy and horticul-tural produce (PNZ, 2002).
Some 236,755 tonnes of plastic were used by the New Zealand plastics industry in 2001, 75% ofthis being consumed locally (PNZ, 2002). Increasing volumes of raw material imports areprojected, as consumers both here and overseas demand better product protection, longer shelflife, recyclable packaging, lightweight materials and increased functionality and utility. By theyear 2030 over 300,000 tonnes of raw plastic material will be imported if current trends continue(PNZ, 2002).
Plastic is increasingly the most efficient and effective material choice for many products. Recentstudies in Western Europe, for example, demonstrate that while plastic packaging accounts foronly 17% of all materials used in packaging, it packs almost 50% of products (APME, 2002).Plastic continues to substitute for items previously made from paper, cardboard, tin, wood andsteel. In New Zealand, the packaging sector of the plastics industry faces mounting pressure tomake reductions in raw material usage, while at the same time their customers and consumersincreasingly specify or choose their products. There are many drivers for these choices, mostbased on consumer preference. To date the two strongest for the industry have been cost andsource reduction. Source reduction satisfies the first requirement of waste minimisation and thedrive by businesses to reduce production costs. In an increasingly competitive market, plasticcompanies have been very focused on increasing their operational efficiency and have activelyadopted practices that reflect eco-efficiency as a result.
The New Zealand plastics industry faces mounting pressure as plastics are increasingly substi-tuted as the material of choice, the volume of production increases, and international pressureto reduce waste and recycle grows. Plastic, which often uses less raw material than othermaterials, is a victim of its own achievement. By successfully displacing other materials in awide range of products and packaging, plastic has also replaced these in the waste stream.
Plastic is something that people feel very strongly about and it often tends to be examined in avery emotive non-factual manner. The connotations of cheap, nasty plastic are still commonlyheld by the public. But these same people often act differently in the supermarket, demandingthe benefits of product protection, and shelf life, responding to branding and the clear messagesand information that the packaging provides. Consequently, environmental issues related toplastic waste tend to be examined in an uninformed manner. Public policy makers need torespond to calls for less-plastic-in-our-landfills and more recycling with a strong fact-based ap-proach to ensure that the waste minimisation measures being proposed, are sustainable.
1 Environmental Affairs Manager, Plastics New Zealand

Page 174 Resource Stewardship and Waste Minimisation
Making products with less material is the most effective and responsible action a manufacturercan take to minimise impacts on the environment. The wide success of plastics, however, masksthe benefits being derived from source reduction. Source reduction is not easily measured. It iscommon for public policy makers to accept this and move on to other waste minimisationpriorities lower down the hierarchy. The Ministry for the Environment, for example, tracksplastic packaging usage against recycling volumes as a measure of the sector’s environmentalperformance. For the plastics sector this a limited view that could result in political rather thansustainable decision-making criteria. Central and local government risk promoting wasteminimisation solutions that may undercut benefits that could be achieved by aggressive sourcereduction and sustainable product design.
Unfortunately the durability of plastic waste increases its visibility and results in the scale ofplastic waste being overestimated. Due to the negative image of plastic the plastics industry hasoften been forced into a defensive role — feeling the need to promote, protect and defend itscurrent position and its future growth as a sector. The plastics sector has seen environmentalinitiatives and legislation as a threat to economic growth that continues to increase compliancecosts and affect profitability. This has led to environmental initiatives by the plastics sector tominimise that risk.
Increasing emphasis is now being placed on Extended Producer Responsibility at an interna-tional level by governments and environmental pressure groups. This challenges industry tolook beyond the areas of internal operational efficiency that have been the focus over the lastdecade. Environmental challenges now facing the industry increasingly focus on the full life-cycle of the products and services offered. Public concern is typically with the waste resultingfrom the use of plastic products, not from the waste generated during manufacture. This placesan increased importance on stakeholder consultation and the transparent adoption of sustain-able design principles by manufacturers.
These trends are a reflection of four distinct phases reported in the progression of sustainablebusiness (Gehrke, 2000):
• Compliance phase — 1970s regulatory standards.
• Anticipatory phase —1980s companies.
• Eco-efficiency phase — 1990s industry sought to reduce input and waste costs.
• Sustainable Development phase — 2000s integration with sustainable product design.
Many industry participants remain skeptical of public policy initiatives and are unlikely toparticipate fully in waste minimisation initiatives until a fresh approach to managing plasticwaste has begun. This requires an understanding at the national policy level that there is nosingle answer. Given current technology and economics, 100% recycling of plastic products inNew Zealand is not technically viable or financially achievable. It needs to be recognised thatproducts made from plastics have benefits to society that must be taken into account whileassessing waste minimisation issues. It must also be recognised that while some plastics can andshould be recycled, others should not.
A survey on Small Business Environmental Information Sources conducted in America foundthat small businesses prefer to receive information about the environment and environmentalregulations from vendors, associates, and industry associations (PPRC, 2003). The surveymeasured business type, areas of needed assistance, opinion of current information received,and actual versus preferred information sources. Overall, it found small businesses tend toavoid information sources that are associated with regulatory agencies or outside their sphere ofclose personal associates.
Plastics New Zealand and the plastics sector have recognised the need to take a leadership rolein resource stewardship but are unable to make effective progress without the support and
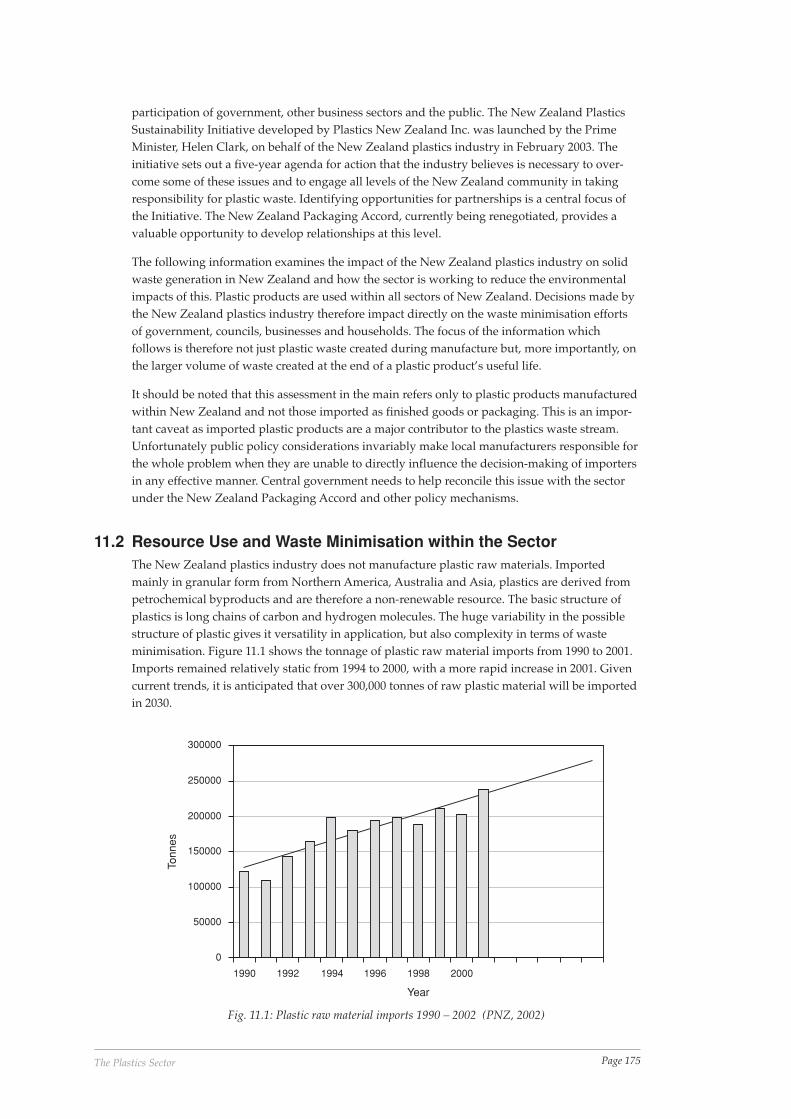
Page 175The Plastics Sector
participation of government, other business sectors and the public. The New Zealand PlasticsSustainability Initiative developed by Plastics New Zealand Inc. was launched by the PrimeMinister, Helen Clark, on behalf of the New Zealand plastics industry in February 2003. Theinitiative sets out a five-year agenda for action that the industry believes is necessary to over-come some of these issues and to engage all levels of the New Zealand community in takingresponsibility for plastic waste. Identifying opportunities for partnerships is a central focus ofthe Initiative. The New Zealand Packaging Accord, currently being renegotiated, provides avaluable opportunity to develop relationships at this level.
The following information examines the impact of the New Zealand plastics industry on solidwaste generation in New Zealand and how the sector is working to reduce the environmentalimpacts of this. Plastic products are used within all sectors of New Zealand. Decisions made bythe New Zealand plastics industry therefore impact directly on the waste minimisation effortsof government, councils, businesses and households. The focus of the information whichfollows is therefore not just plastic waste created during manufacture but, more importantly, onthe larger volume of waste created at the end of a plastic product’s useful life.
It should be noted that this assessment in the main refers only to plastic products manufacturedwithin New Zealand and not those imported as finished goods or packaging. This is an impor-tant caveat as imported plastic products are a major contributor to the plastics waste stream.Unfortunately public policy considerations invariably make local manufacturers responsible forthe whole problem when they are unable to directly influence the decision-making of importersin any effective manner. Central government needs to help reconcile this issue with the sectorunder the New Zealand Packaging Accord and other policy mechanisms.
11.2 Resource Use and Waste Minimisation within the SectorThe New Zealand plastics industry does not manufacture plastic raw materials. Importedmainly in granular form from Northern America, Australia and Asia, plastics are derived frompetrochemical byproducts and are therefore a non-renewable resource. The basic structure ofplastics is long chains of carbon and hydrogen molecules. The huge variability in the possiblestructure of plastic gives it versatility in application, but also complexity in terms of wasteminimisation. Figure 11.1 shows the tonnage of plastic raw material imports from 1990 to 2001.Imports remained relatively static from 1994 to 2000, with a more rapid increase in 2001. Givencurrent trends, it is anticipated that over 300,000 tonnes of raw plastic material will be importedin 2030.
300000
250000
200000
150000
100000
50000
0
1990 1992 1994 1996 1998 2000
Year
Tonn
es
Fig. 11.1: Plastic raw material imports 1990 – 2002 (PNZ, 2002)
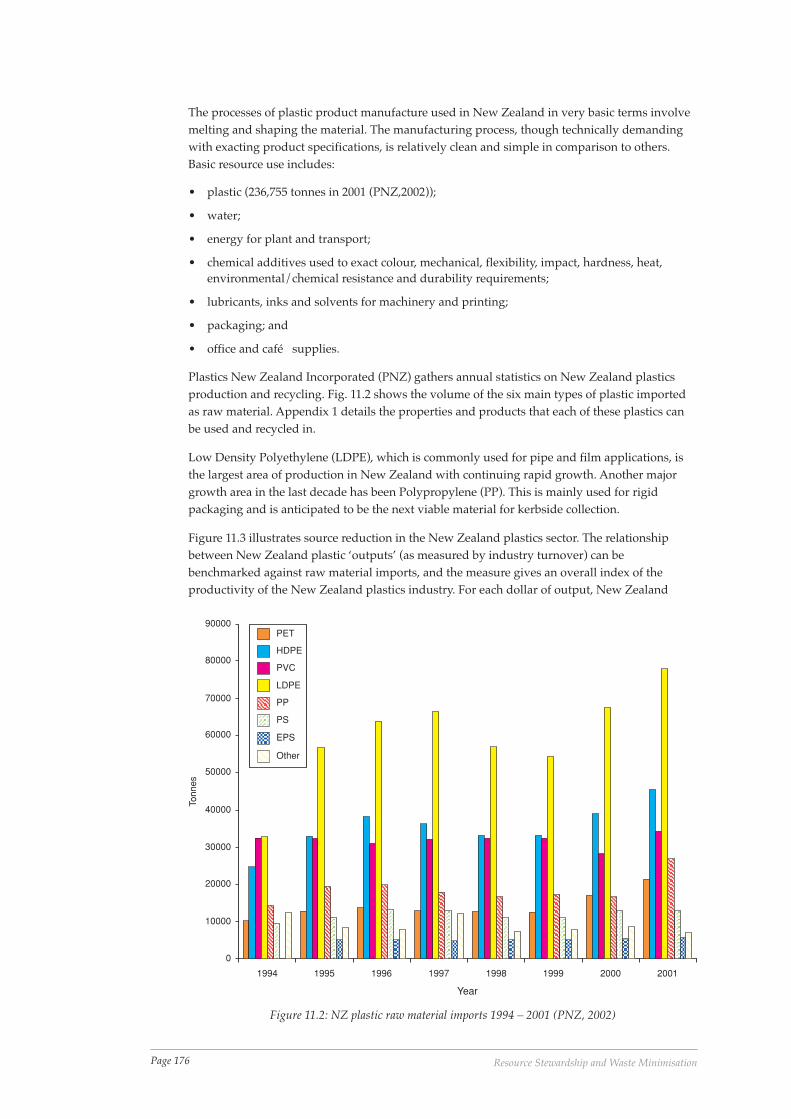
Page 176 Resource Stewardship and Waste Minimisation
The processes of plastic product manufacture used in New Zealand in very basic terms involvemelting and shaping the material. The manufacturing process, though technically demandingwith exacting product specifications, is relatively clean and simple in comparison to others.Basic resource use includes:
• plastic (236,755 tonnes in 2001 (PNZ,2002));
• water;
• energy for plant and transport;
• chemical additives used to exact colour, mechanical, flexibility, impact, hardness, heat,environmental/chemical resistance and durability requirements;
• lubricants, inks and solvents for machinery and printing;
• packaging; and
• office and café supplies.
Plastics New Zealand Incorporated (PNZ) gathers annual statistics on New Zealand plasticsproduction and recycling. Fig. 11.2 shows the volume of the six main types of plastic importedas raw material. Appendix 1 details the properties and products that each of these plastics canbe used and recycled in.
Low Density Polyethylene (LDPE), which is commonly used for pipe and film applications, isthe largest area of production in New Zealand with continuing rapid growth. Another majorgrowth area in the last decade has been Polypropylene (PP). This is mainly used for rigidpackaging and is anticipated to be the next viable material for kerbside collection.
Figure 11.3 illustrates source reduction in the New Zealand plastics sector. The relationshipbetween New Zealand plastic ‘outputs’ (as measured by industry turnover) can bebenchmarked against raw material imports, and the measure gives an overall index of theproductivity of the New Zealand plastics industry. For each dollar of output, New Zealand
90000
80000
70000
60000
50000
40000
30000
20000
10000
0
1994 1995 1996 1997 1998 1999 2000 2001
Year
Tonn
es
PET
HDPE
PVC
LDPE
PP
PS
EPS
Other
Figure 11.2: NZ plastic raw material imports 1994 – 2001 (PNZ, 2002)
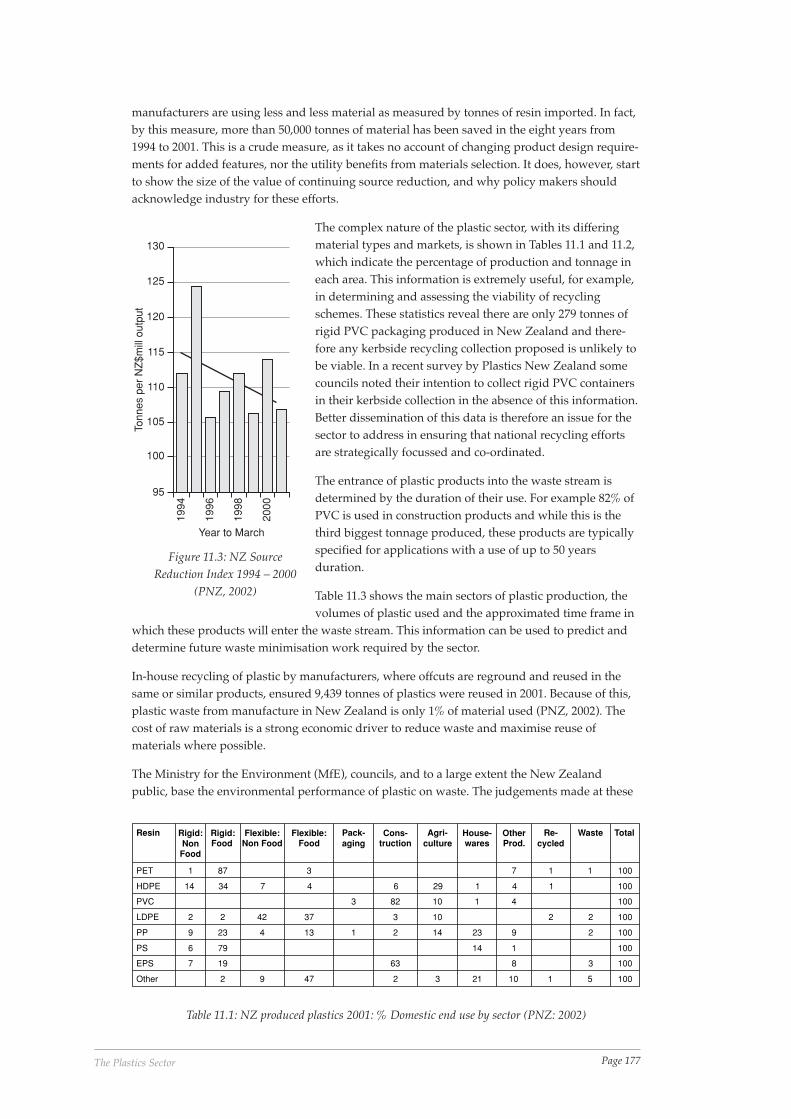
Page 177The Plastics Sector
manufacturers are using less and less material as measured by tonnes of resin imported. In fact,by this measure, more than 50,000 tonnes of material has been saved in the eight years from1994 to 2001. This is a crude measure, as it takes no account of changing product design require-ments for added features, nor the utility benefits from materials selection. It does, however, startto show the size of the value of continuing source reduction, and why policy makers shouldacknowledge industry for these efforts.
The complex nature of the plastic sector, with its differingmaterial types and markets, is shown in Tables 11.1 and 11.2,which indicate the percentage of production and tonnage ineach area. This information is extremely useful, for example,in determining and assessing the viability of recyclingschemes. These statistics reveal there are only 279 tonnes ofrigid PVC packaging produced in New Zealand and there-fore any kerbside recycling collection proposed is unlikely tobe viable. In a recent survey by Plastics New Zealand somecouncils noted their intention to collect rigid PVC containersin their kerbside collection in the absence of this information.Better dissemination of this data is therefore an issue for thesector to address in ensuring that national recycling effortsare strategically focussed and co-ordinated.
The entrance of plastic products into the waste stream isdetermined by the duration of their use. For example 82% ofPVC is used in construction products and while this is thethird biggest tonnage produced, these products are typicallyspecified for applications with a use of up to 50 yearsduration.
Table 11.3 shows the main sectors of plastic production, thevolumes of plastic used and the approximated time frame in
which these products will enter the waste stream. This information can be used to predict anddetermine future waste minimisation work required by the sector.
In-house recycling of plastic by manufacturers, where offcuts are reground and reused in thesame or similar products, ensured 9,439 tonnes of plastics were reused in 2001. Because of this,plastic waste from manufacture in New Zealand is only 1% of material used (PNZ, 2002). Thecost of raw materials is a strong economic driver to reduce waste and maximise reuse ofmaterials where possible.
The Ministry for the Environment (MfE), councils, and to a large extent the New Zealandpublic, base the environmental performance of plastic on waste. The judgements made at these
Resin Rigid:NonFood
Rigid:Food
Flexible:Non Food
Flexible:Food
Pack-aging
Cons-truction
Agri-culture
House-wares
OtherProd.
Re-cycled
Waste Total
PET 1 87 3 7 1 1 100
HDPE 14 34 7 4 6 29 1 4 1 100
PVC 3 82 10 1 4 100
LDPE 2 2 42 37 3 10 2 2 100
PP 9 23 4 13 1 2 14 23 9 2 100
PS 6 79 14 1 100
EPS 7 19 63 8 3 100
Other 2 9 47 2 3 21 10 1 5 100
Table 11.1: NZ produced plastics 2001: % Domestic end use by sector (PNZ: 2002)
Figure 11.3: NZ SourceReduction Index 1994 – 2000
(PNZ, 2002)
130
125
120
115
110
105
100
95
1994
1996
1998
2000
Year to March
Tonn
es p
er N
Z$m
ill o
utpu
t
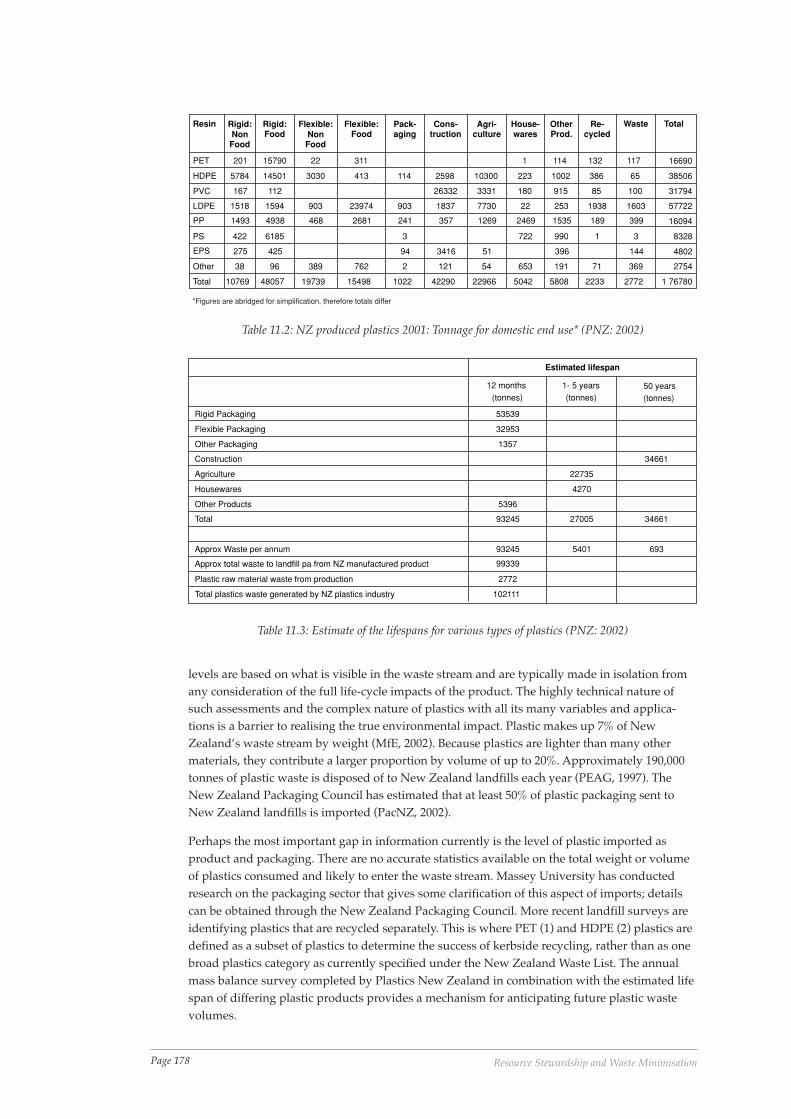
Page 178 Resource Stewardship and Waste Minimisation
levels are based on what is visible in the waste stream and are typically made in isolation fromany consideration of the full life-cycle impacts of the product. The highly technical nature ofsuch assessments and the complex nature of plastics with all its many variables and applica-tions is a barrier to realising the true environmental impact. Plastic makes up 7% of NewZealand’s waste stream by weight (MfE, 2002). Because plastics are lighter than many othermaterials, they contribute a larger proportion by volume of up to 20%. Approximately 190,000tonnes of plastic waste is disposed of to New Zealand landfills each year (PEAG, 1997). TheNew Zealand Packaging Council has estimated that at least 50% of plastic packaging sent toNew Zealand landfills is imported (PacNZ, 2002).
Perhaps the most important gap in information currently is the level of plastic imported asproduct and packaging. There are no accurate statistics available on the total weight or volumeof plastics consumed and likely to enter the waste stream. Massey University has conductedresearch on the packaging sector that gives some clarification of this aspect of imports; detailscan be obtained through the New Zealand Packaging Council. More recent landfill surveys areidentifying plastics that are recycled separately. This is where PET (1) and HDPE (2) plastics aredefined as a subset of plastics to determine the success of kerbside recycling, rather than as onebroad plastics category as currently specified under the New Zealand Waste List. The annualmass balance survey completed by Plastics New Zealand in combination with the estimated lifespan of differing plastic products provides a mechanism for anticipating future plastic wastevolumes.
*Figures are abridged for simplification, therefore totals differ
Resin Rigid:NonFood
Rigid:Food
Flexible:NonFood
Flexible:Food
Pack-aging
Cons-truction
Agri-culture
House-wares
OtherProd.
Re-cycled
Waste Total
201 15790 22 311 — — — 1 114 132 117 16690
HDPE 5784 14501 3030 413 114 2598 10300 223 1002 386 65 38506
167 112 — — — 26332 3331 180 915 85 100 31794
LDPE 1518 1594 903 23974 903 1837 7730 22 253 1938 1603 57722
1493 4938 468 2681 241 357 1269 2469 1535 189 399 16094
PS 422 6185 — — 3 — — 722 990 1 3 8328
275 425 — — 94 3416 51 — 396 — 144 4802
Other 38 96 389 762 2 121 54 653 191 71 369 2754
Total 10769 48057 19739 15498 1022 42290 22966 5042 5808 2233 2772 1 76780
PVC
PP
EPS
PET
Table 11.2: NZ produced plastics 2001: Tonnage for domestic end use* (PNZ: 2002)
Estimated lifespan
12 months(tonnes)
1- 5 years(tonnes)
50 years(tonnes)
Rigid Packaging 53539
Flexible Packaging 32953
Other Packaging 1357
Construction 34661
Agriculture 22735
Housewares 4270
Other Products 5396
Total 93245 27005 34661
Approx Waste per annum 93245 5401 693
Plastic raw material waste from production 2772
Total plastics waste generated by NZ plastics industry 102111
Approx total waste to landfill pa from NZ manufactured product 99339
Table 11.3: Estimate of the lifespans for various types of plastics (PNZ: 2002)
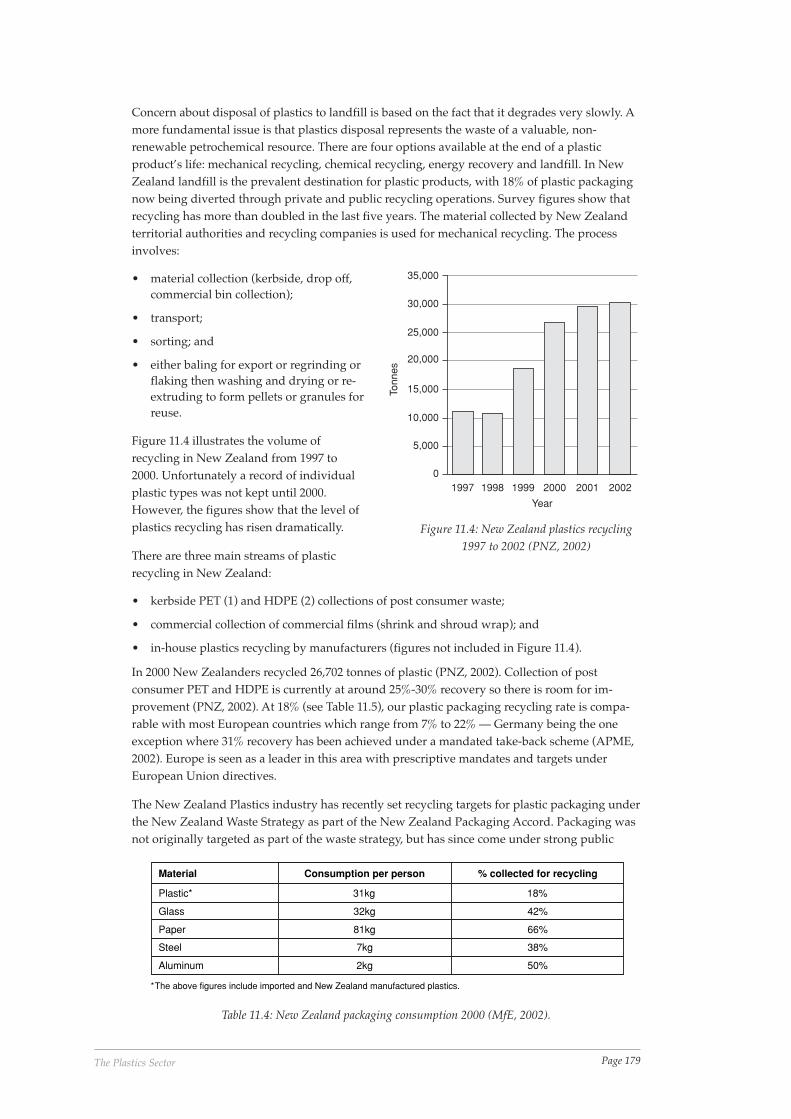
Page 179The Plastics Sector
Concern about disposal of plastics to landfill is based on the fact that it degrades very slowly. Amore fundamental issue is that plastics disposal represents the waste of a valuable, non-renewable petrochemical resource. There are four options available at the end of a plasticproduct’s life: mechanical recycling, chemical recycling, energy recovery and landfill. In NewZealand landfill is the prevalent destination for plastic products, with 18% of plastic packagingnow being diverted through private and public recycling operations. Survey figures show thatrecycling has more than doubled in the last five years. The material collected by New Zealandterritorial authorities and recycling companies is used for mechanical recycling. The processinvolves:
• material collection (kerbside, drop off,commercial bin collection);
• transport;
• sorting; and
• either baling for export or regrinding orflaking then washing and drying or re-extruding to form pellets or granules forreuse.
Figure 11.4 illustrates the volume ofrecycling in New Zealand from 1997 to2000. Unfortunately a record of individualplastic types was not kept until 2000.However, the figures show that the level ofplastics recycling has risen dramatically.
There are three main streams of plasticrecycling in New Zealand:
• kerbside PET (1) and HDPE (2) collections of post consumer waste;
• commercial collection of commercial films (shrink and shroud wrap); and
• in-house plastics recycling by manufacturers (figures not included in Figure 11.4).
In 2000 New Zealanders recycled 26,702 tonnes of plastic (PNZ, 2002). Collection of postconsumer PET and HDPE is currently at around 25%-30% recovery so there is room for im-provement (PNZ, 2002). At 18% (see Table 11.5), our plastic packaging recycling rate is compa-rable with most European countries which range from 7% to 22% — Germany being the oneexception where 31% recovery has been achieved under a mandated take-back scheme (APME,2002). Europe is seen as a leader in this area with prescriptive mandates and targets underEuropean Union directives.
The New Zealand Plastics industry has recently set recycling targets for plastic packaging underthe New Zealand Waste Strategy as part of the New Zealand Packaging Accord. Packaging wasnot originally targeted as part of the waste strategy, but has since come under strong public
Figure 11.4: New Zealand plastics recycling1997 to 2002 (PNZ, 2002)
*The above figures include imported and New Zealand manufactured plastics.
Material Consumption per person % collected for recycling
Plastic* 31kg 18%
Glass 32kg 42%
Paper 81kg 66%
Steel 7kg 38%
Aluminum 2kg 50%
Table 11.4: New Zealand packaging consumption 2000 (MfE, 2002).
35,000
30,000
25,000
20,000
15,000
10,000
5,000
01997 1998 1999 2000 2001 2002
Tonn
es
Year
Page 180 Resource Stewardship and Waste Minimisation
pressure. As a result MfE have now grouped packaging, under the special waste target of thestrategy, as one of eight sectors to introduce extended producer responsibility pilot programmesfor the collection and reuse, recycling, or appropriate treatment and disposal of at least eightcategories of special wastes.
As part of the formulation of the sector’s Sustainability Initiative, recycling targets were consid-ered, but it was eventually decided that there was not enough information on what materialwas available and what capacity the recycling sector had to cope with this increased volume.Mass balance figures do not provide a full breakdown of end products as many are composites,co-extruded, laminated or welded, which impacts the ability to recycle. A goal was thereforeestablished to determine what the sustainable level of plastic recycling is for New Zealand. Thiswill require further research and assessment.
Table 11.4 shows a comparison of packaging consumption and recovery in New Zealand for thedifferent mediums as reported on by the Ministry for the Environment. Unfortunately, asdiscussed above, this method of analysis portrays the industry in a narrow way and it is easy todraw a negative conclusion about the plastics sector from the comparison of these figures. Thisis due to a huge number of factors including the number of differing plastics, its source reduc-tion capability, the value of raw materials and the number of collectors, recyclers and manufac-turers.
The New Zealand plastics industry is committed to the diversion of plastics waste from landfillbut emphasises that all waste management solutions should provide the optimum balance ofenvironmental impact and economic cost, from raw material extraction, through to disposal offinal residual waste. On this basis, it is important to establish the reasons for plastic recycling:
• energy conservation;
• resource efficiency;
• lack of landfill space; and
• possible leachate from plastic additives in landfill.
These criteria should provide the basis for considering the feasibility of a recycling scheme andin identifying the types of plastic recycled from an environmental perspective. It is well ac-cepted that plastic recycling is a marginal industry economically. A critical measurement of allsuch proposals needs to be examination of the cost and energy consumed through recyclingprocess and energy saved in reuse of material versus energy wasted in landfill and cost oflandfill.
A recent Association of Plastics Manufacturers in Europe (APME) report concluded that toogreat an emphasis on recycling as a recovery option for plastics packaging waste could driveEurope to ever increasing waste management costs with limited environmental gain (2002). Thestudy illustrates that increasing recycling above approximately 15%, in combination withmunicipal solid waste incineration, has no major impact in terms of eco-efficiency. By exploringa number of different waste management scenarios, the study demonstrates that there is a cut-off point above which increasing plastics packaging recycling does not provide further environ-mental gain. One important factor is the impact that increased recycling rates have on the totalenergy balance — the extra energy required to separate plastics packaging waste for recycling isnot offset by the saving in resources from substitution of new materials.
There is no hierarchy of recovery techniques that can be applied universally when makingwaste management decisions about plastic. Instead the focus for waste management should beon diverting plastics from landfill via a range of recovery options, dependent on specific localconditions. Key insights from the European research conducted for APME were:
• 100% landfill has the highest environmental impact, but currently represents the lowest cost
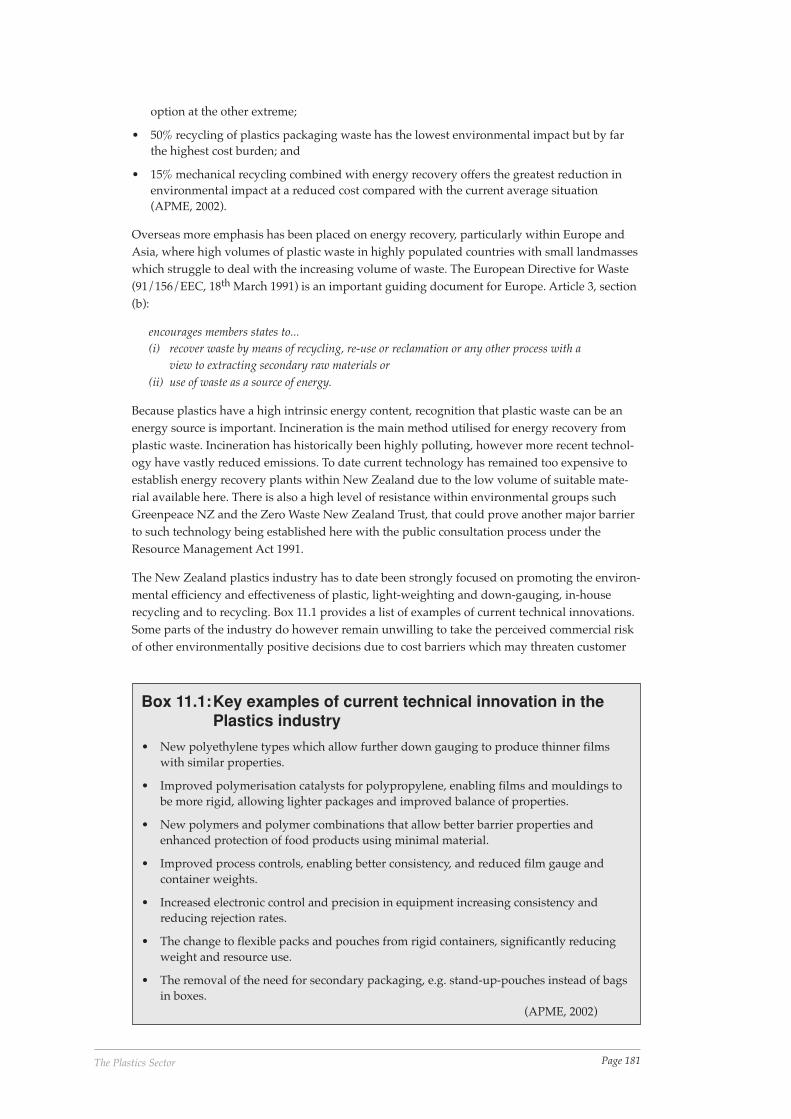
Page 181The Plastics Sector
option at the other extreme;
• 50% recycling of plastics packaging waste has the lowest environmental impact but by farthe highest cost burden; and
• 15% mechanical recycling combined with energy recovery offers the greatest reduction inenvironmental impact at a reduced cost compared with the current average situation(APME, 2002).
Overseas more emphasis has been placed on energy recovery, particularly within Europe andAsia, where high volumes of plastic waste in highly populated countries with small landmasseswhich struggle to deal with the increasing volume of waste. The European Directive for Waste(91/156/EEC, 18th March 1991) is an important guiding document for Europe. Article 3, section(b):
encourages members states to...(i) recover waste by means of recycling, re-use or reclamation or any other process with a
view to extracting secondary raw materials or(ii) use of waste as a source of energy.
Because plastics have a high intrinsic energy content, recognition that plastic waste can be anenergy source is important. Incineration is the main method utilised for energy recovery fromplastic waste. Incineration has historically been highly polluting, however more recent technol-ogy have vastly reduced emissions. To date current technology has remained too expensive toestablish energy recovery plants within New Zealand due to the low volume of suitable mate-rial available here. There is also a high level of resistance within environmental groups suchGreenpeace NZ and the Zero Waste New Zealand Trust, that could prove another major barrierto such technology being established here with the public consultation process under theResource Management Act 1991.
The New Zealand plastics industry has to date been strongly focused on promoting the environ-mental efficiency and effectiveness of plastic, light-weighting and down-gauging, in-houserecycling and to recycling. Box 11.1 provides a list of examples of current technical innovations.Some parts of the industry do however remain unwilling to take the perceived commercial riskof other environmentally positive decisions due to cost barriers which may threaten customer
Box 11.1:Key examples of current technical innovation in thePlastics industry
• New polyethylene types which allow further down gauging to produce thinner filmswith similar properties.
• Improved polymerisation catalysts for polypropylene, enabling films and mouldings tobe more rigid, allowing lighter packages and improved balance of properties.
• New polymers and polymer combinations that allow better barrier properties andenhanced protection of food products using minimal material.
• Improved process controls, enabling better consistency, and reduced film gauge andcontainer weights.
• Increased electronic control and precision in equipment increasing consistency andreducing rejection rates.
• The change to flexible packs and pouches from rigid containers, significantly reducingweight and resource use.
• The removal of the need for secondary packaging, e.g. stand-up-pouches instead of bagsin boxes.
(APME, 2002)
Page 182 Resource Stewardship and Waste Minimisation
loyalty or because of the level of capital investment required..
Current environmental pressures and trends indicate that these measures are no longer suffi-cient and call for increased plastic recycling volumes. There is an increasing level of frustrationapparent within local authorities as they attempt to reach Zero Waste targets and wish to startor expand community recycling for plastic products. Councils consistently report difficulty inidentifying markets for plastic material and in determining the appropriate sort of plastic tocollect.
The differing focuses of manufacturers, councils and recyclers and the resulting disseminationof information and education provided between them, has been identified by the industry as amajor weakness in facilitating waste minimisation for the sector. The need to set mutuallybeneficial targets and goals as part of a cooperative strategy between manufacturers, customers,councils and recyclers has been identified as a major opportunity for the future of the sector.
The following sections outline the work being done on issues affecting solid plastics waste at acompany, organisational and governmental level.
11.3 Resource Stewardship within the Sector
“The best way to reduce any environmental impact is not to recycle more,but to produce and dispose of less”
William Rathje
There are many barriers to reducing waste from plastics products. First amongst these is thegrowth of the sector. The success of the industry ultimately means more waste. From an envi-ronmental perspective, the key benefits of plastic are its lightness and durability. These samecharacteristics are the biggest hurdles to overcome when establishing recycling schemes,reducing litter and minimising waste to landfill.
Plastic manufacturing companies working to reduce their own waste are gaining an increasedlevel of resource stewardship awareness. There are growing numbers of examples of new andexisting products being redesigned in response to difficulties manufacturers have in recyclingtheir own production waste. Once a product has been established successfully on the retailmarket it is extraordinarily difficult to change or remove it given the overriding focus ofbusiness to succeed financially. Without strong customer support for the changes required theseare unlikely to progress. To avoid these situations, environmentally informed decision-makingis required at the product design stage. Outlined below are the key issues and opportunitiesinvolved in enhancing waste minimisation and resource stewardship for the sector.
New Zealand Plastics Sustainability InitiativeHistorically the focus of Plastics New Zealand Inc. (PNZ) has been the protection and promo-tion of the plastics industry. Recent feedback from territorial authorities and environmentalgroups shows that the information presented on plastics on this basis is not helping them solvethe issues they face. Some have perceived the information provided as whitewash or as a publicrelations exercise and are very skeptical of the intent of the industry. A survey of councils andother research, carried out by PNZ in 2002, indicates that there is a major lack of informationand cooperation between stakeholders involved in plastic production and recycling. Commentis frequently made that recyclers, councils, NGO’s, retailers, the public and industry are notworking together. Uncertainty, lack of information and strategic direction amongst these groupshas resulted in uninformed decisions being made. PVC label contamination, stockpiled plasticswastes, recyclers exporting and manufacturers importing recovered material are all symptomsof this problem.
Plastics New Zealand facilitated a full day workshop on 10 September 2002, with twenty
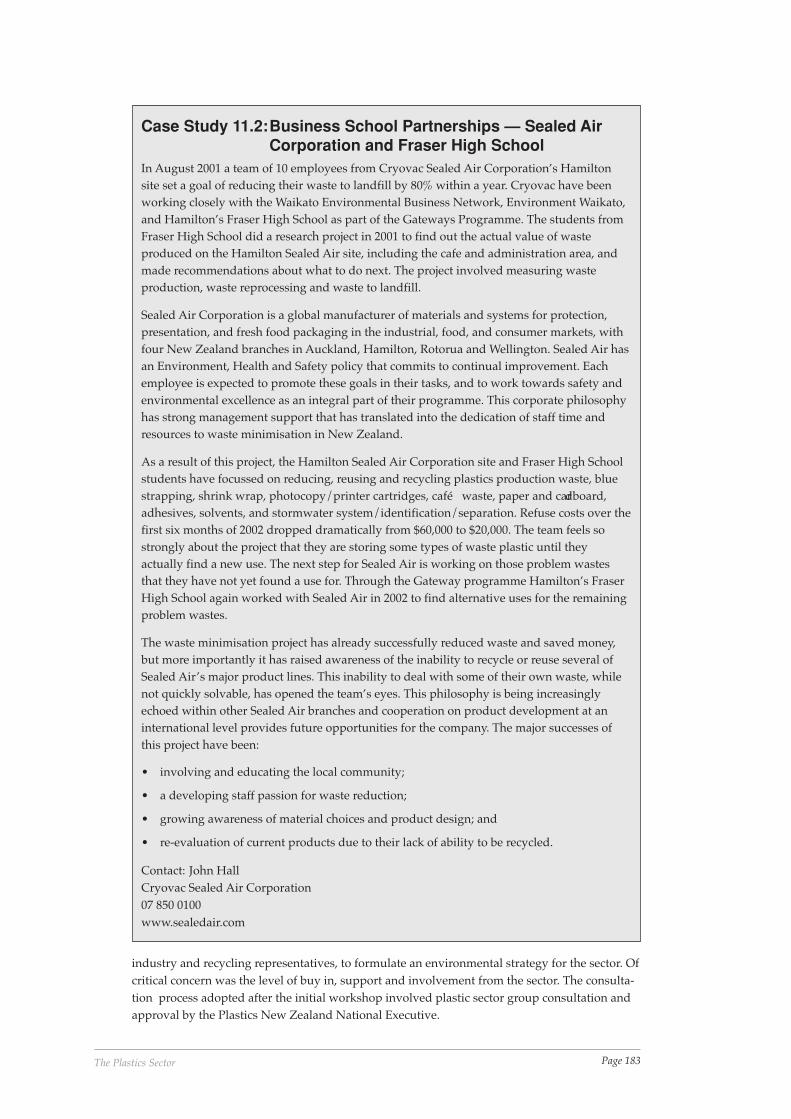
Page 183The Plastics Sector
industry and recycling representatives, to formulate an environmental strategy for the sector. Ofcritical concern was the level of buy in, support and involvement from the sector. The consulta-tion process adopted after the initial workshop involved plastic sector group consultation andapproval by the Plastics New Zealand National Executive.
Case Study 11.2:Business School Partnerships — Sealed AirCorporation and Fraser High School
In August 2001 a team of 10 employees from Cryovac Sealed Air Corporation’s Hamiltonsite set a goal of reducing their waste to landfill by 80% within a year. Cryovac have beenworking closely with the Waikato Environmental Business Network, Environment Waikato,and Hamilton’s Fraser High School as part of the Gateways Programme. The students fromFraser High School did a research project in 2001 to find out the actual value of wasteproduced on the Hamilton Sealed Air site, including the cafe and administration area, andmade recommendations about what to do next. The project involved measuring wasteproduction, waste reprocessing and waste to landfill.
Sealed Air Corporation is a global manufacturer of materials and systems for protection,presentation, and fresh food packaging in the industrial, food, and consumer markets, withfour New Zealand branches in Auckland, Hamilton, Rotorua and Wellington. Sealed Air hasan Environment, Health and Safety policy that commits to continual improvement. Eachemployee is expected to promote these goals in their tasks, and to work towards safety andenvironmental excellence as an integral part of their programme. This corporate philosophyhas strong management support that has translated into the dedication of staff time andresources to waste minimisation in New Zealand.
As a result of this project, the Hamilton Sealed Air Corporation site and Fraser High Schoolstudents have focussed on reducing, reusing and recycling plastics production waste, bluestrapping, shrink wrap, photocopy/printer cartridges, café waste, paper and cardboard,adhesives, solvents, and stormwater system/identification/separation. Refuse costs over thefirst six months of 2002 dropped dramatically from $60,000 to $20,000. The team feels sostrongly about the project that they are storing some types of waste plastic until theyactually find a new use. The next step for Sealed Air is working on those problem wastesthat they have not yet found a use for. Through the Gateway programme Hamilton’s FraserHigh School again worked with Sealed Air in 2002 to find alternative uses for the remainingproblem wastes.
The waste minimisation project has already successfully reduced waste and saved money,but more importantly it has raised awareness of the inability to recycle or reuse several ofSealed Air’s major product lines. This inability to deal with some of their own waste, whilenot quickly solvable, has opened the team’s eyes. This philosophy is being increasinglyechoed within other Sealed Air branches and cooperation on product development at aninternational level provides future opportunities for the company. The major successes ofthis project have been:
• involving and educating the local community;
• a developing staff passion for waste reduction;
• growing awareness of material choices and product design; and
• re-evaluation of current products due to their lack of ability to be recycled.
Contact: John HallCryovac Sealed Air Corporation07 850 0100www.sealedair.com
Page 184 Resource Stewardship and Waste Minimisation
Case Study 11.3: PVC Plastic SleevesIn 2001 Recycling Operators of New Zealand (RONZ) members raised concerns about theimpacts and issues associated with a noticeable increase in the use of PVC plastic sleevelabels. The sleeves are shrink wrapped on to bottles to provide label over the entire productsurface and are predominantly made from PVC. PVC is a well-known contaminant in thePET and HDPE recycling streams. In New Zealand sleeved products are mainly used forflavored dairy milk drink bottles normally in the 300 to 500 ml serving sizes, but these areincreasingly entering the energy drink and juice markets. A formal complaint was laid withthe New Zealand Packaging Council.
Most bottle labeling is imported to New Zealand. PVC labels form the bulk of the sleevemarket and are the cheapest. Alternatives are not considered as technically effective withdiffering temperatures, shrink performance and colouration impacts. Stopping the use ofPVC labels would have ramifications in terms of costs, time and equipment. The sleeves alsoare affecting the Australian PET recycling market and have been raised as an issue therewith the Australian Council of Recyclers (ACOR).
ACOR emphasised the importance of getting everyone on-side before going ahead withresearch to come up with an economic alternative. ‘Buy in’ from label makers and marketshare for any initiative being necessary. With all major bottle manufacturers involved therecan be sufficient market push to get solutions actioned. ACOR stated it would be at least 12-18 months before an acceptable alternative was defined.
Dissemination of information to the relevant industries about the issue was seen as criticaland media was identified as the best way of doing this through newsletters and articles intrade publications. The Australian Packaging Covenant has funded the Recycling Guide forBeverage and Food Manufacturers Marketing in PET Containers. A copy of this has beendistributed to all New Zealand PET manufacturersas well as a similar guide for HDPEproducts.
The New Zealand Code of Practice for Packaging of Goods provided a formal avenuethrough which a complaint could be made and followed up on. In this case, as aninternational issue involving multi-national companies a resolution is being sought at thatlevel. A resolution is highly dependent on the commitment of the parties involved. In thiscase, a major multi-national company using the recovered material is directly affected by thecontamination and therefore has a strong interest in reaching a solution. As a voluntary codeof practice the complaint process lacks enforceability and a timeframe for resolution.
Given the information being provided by territorial authorities in New Zealand wherekerbside collections are available, a member of the public would assume that, as one of thesesleeved bottles is either PET(1) or HDPE (2), the bottle is able to be recycled. The generalpublic is not typically aware at this stage that there is a problem with recycling this type ofbottle. This means the process is not fully transparent and that manufacturers and fillers arenot being held fully accountable for their decisions.
The complaints process does however give manufacturers the opportunity to resolve theissue without jeopardising or confusing the public on the message of recycling 1 and 2plastics, and is being taken extremely seriously by the companies involved. Information onPVC sleeves is available from Plastics New Zealand, RONZ, or the Packaging Council.
Contact: John Webber, Packaging Council of New Zealand09 262 [email protected]
Page 185The Plastics Sector
The Plastics New Zealand Sustainability Initiative focuses on design, labelling, communication,education, and partnerships as the mechanisms to improve environmental performance,minimise waste and increase recycling. Vital to its success will be expansion of the initiative toinvolve other sectors with the support of those directly involved in purchasing decisions,educating the public and recycling. The New Zealand Packaging Accord presents a valuableopportunity to initiate this in relation to packaging, via the major New Zealand brandownersand retailers. Other opportunities for construction, agricultural and homeware streams alsoneed to be developed and fostered by the industry.
Efficiency – Waste Tracking/CostingThe ever-present drive to improve efficiency has dramatically improved levels of industryresource stewardship. Total Quality Management and similar systems insitutionalised withinNew Zealand industry over the 1980s and 1990s have resulted in the establishment of systemsand measures that have improved resource efficiency dramatically. These management systemsinstigated some time ago within most company structures are still in place with staff working toreduce error rates and faults. Effective operational managers are constantly measuring andreviewing these issues. There is a noticeable trend emerging within the industry to quantita-tively measure and cost production waste as a performance indicator. Marley New Zealand,Fisher & Paykel Healthcare, Huhtamaki Ltd and Chequer Packaging Ltd are among some of thelarger plastic companies instigating this practice.
Financial incentives to reduce material use are strong. Improving technologies and tightmarkets continue to push manufacturers to light weight, reducing the amount of raw materialrequired per product. This has also resulted in continued efforts to recycle as much plasticswaste as possible. ‘In-house recycling’ is now standard practice in the plastics industry with9,439 tonnes of plastics material being reused in 2001. The production of a milk bottle, forexample, produces flaps of surplus plastic at the base and top that account for 40% of theoverall material use in production. Recycling of this material back into the product results inhuge energy and resource savings. Many machines are now equipped to gather and returnproduction off-cuts straight to a grinder to be chipped for reuse. This area of recycling is notshown in plastic recycling statistics but demonstrates a significant contribution by the industrytowards waste minimisation.
Mixed or contaminated plastic waste proves more difficult to deal with and represents most ofthe residual 1% of plastics production waste achieved by the sector. An effort has been maderecently by Plastics New Zealand to promote the recycling of the purge material used to cleanmachine barrels between differing batches. An industry challenge was also issued by PlasticsNew Zealand for companies to reduce their waste by 50% by May 2003 at the 2002 Plastics NewZealand conference. Two companies exceeded this target, and there is a strong commitmentwithin the industry to reduce waste even further. The impending rise in landfill charges underthe New Zealand Waste Strategy has been used to further raise this commitment. Given thecontinued efforts of plastic manufacturers in this area towards best practice the main wasteminimisation challenge now facing the plastics industry in New Zealand is the reduction ofwaste at the end of their products’ useful lives.
Industry Education and Environmentally Sustainable DesignA lack of knowledge of what constitutes the best environmental solution provides a barrier toresource stewardship. Councils and environmental groups have both noted the lack of respon-siveness and understanding to questions and concerns about plastic identification codes andrecycling by plastic manufacturers. This lack of knowledge reflects poorly on the industry andreflects a lack of capacity to consider environmental issues in the design process where theparties are not sufficiently informed to make decisions or offer clear justification for designdecisions from this perspective. While environmental factors in terms of durability, performance
Page 186 Resource Stewardship and Waste Minimisation
Case Study 11.4: Farm Plastic WasteThe Ministry for the Environment released a consultation document entitled the DioxinAction Plan in 2001. This document proposed several policy measures aimed at reducing theemission of dioxins to air. Among the proposed measures was the introduction of a NationalEnvironmental Standard that would result in a ban on uncontrolled outdoor burning ofplastic materials. The document pinpoints farm plastic waste as a source of dioxinemissions. Particular sources identified are agri-chemical containers and silage wrap.However as both of these are typically polyethylene, this would be dependent on chlorinebeing present in the contents of the containers.
In reaction to this document the rural sector asked the Ministry for the Environment whatalternatives were going to be provided if they were now going to be unable to burn theirwaste. A resulting workshop on farm plastic waste held on 12 February 2002 identified that,even in regions where burning had already been banned by regional councils, this practicewas still commonplace. Most regional councils current rules permit on-farm land filling,including triple-rinsed agrichemical containers where waste has been produced on theproperty.
Education and provision of alternative methods of disposal were identified as the obvioussolutions to these problems. Key issues for plastic recyclers in examining options for farmplastic waste included: small volume/low weight; cost of collection; collection system;return to buyer; no regional council funding; adaptable overseas programmes; reuse -refilling of containers; triple-rinsed water returned to spray tank; agrichemical containersneed to be clean (some of the acid herbicides may be an issue); and size of container forreuse.
The 1997 landfill census conducted by MfE did not look at rural sector waste, but estimatedit at 10% of waste. In rural New Zealand there are 77,000 land-based businesses, and 45,000rural residential properties. Some of these have access to municipal waste streams. Feedbackfrom rural sector groups at the workshop could be summarised as a feeling of frustrationover the lack of options for plastic wastes other than burning or burying.
A willingness from growers to pay levies on their agrichemical containers to fund acollection and recycling scheme was also raised. Both Canada and Australia have systems inplace. Pressure is being placed on New Zealand growers to document and audit bestpractice of waste management measures. As silage and agrichemical plastic have the samebasic logistics of collection, it was concluded both needed to be looked at.
The need to take an integrated approach to the issues of agrichemicals, farm plastics andother associated on-farm plastics was central to the formulation of the SustainableManagement Fund (SMF) grant application. Another major objective of the working partyformed is that the results of the project could be integrated into existing projects andprocesses.
The key outcomes of this workshop were the creation of a working group and theamalgamation of two existing applications for funding from the SMF. Information on theproject’s current status can be obtained from the Ministry for the Environment or NZAET.
While the final outcome of the project is uncertain the project has been positive as it hasraised awareness and provided an opportunity for sharing perspectives from a broad arrayof sector groups from manufacturers, suppliers, customers and councils.
Contact: Sandy Scarrow07 578 9857
Page 187The Plastics Sector
and appearance are usually considered, it is equally possible that additives used to achievethese ends may negate any environmental benefits achieved by the comparative longevity of theitem. While design decisions are being based on resource efficiency from the point of view ofcost savings, this element of the design decision-making process needs to be expanded toexamine other factors critical to waste minimisation and sustainability.
The Health and Safety Manager at a large plastics converter, which has a comparatively youngengineering design team, says that the basic ability to design products for environmentalsustainability or recyclability is lacking. Theoretical training in universities is not providingengineering and design graduates with the practical knowledge and skills needed to makeenvironmentally-informed design decisions. Assessment of plastic industry unit standards andfeedback on the environmental performance of the industry demonstrates that there is a gapbetween university and industry training. Course conveners from Massey and AucklandUniversities have commented that:
• they are not able to lecture at the level of specific technical detail required for this due to thebroad scope of their courses; and
• the field of sustainable design is so new that what makes a product ‘sustainable’ is not yetable to be clearly defined.
Feedback from the Plastics and Material Processing Industry Training Organisation (PAMPITO)has been that this is also not the appropriate level for delivering sustainable product designtraining. Plastics industry unit standards are currently focused at the operator or supervisorylevel and do not access those directly responsible for making design decisions. A commitmenthas however been given to incorporate more environmental information within existing unitstandards as these are reviewed over the next two to three years.
Research by Plastics New Zealand shows that few companies have environmental orrecyclability considerations built into their company procedures for product development ordesign. These aspects need to influence the selection of plastic materials, how they are puttogether, and how they are labeled. Management and design staff need to be aware, informedand able to undertake research where information is not immediately available. The PackagingCouncil Environmental Awards are one positive example of creating incentives for the industryto adopt sustainable design practices. Plastics companies Coca Cola Amatil and Vertex PacificLtd won the Supreme Award in 2001 and 2003 respectively.
Entries in these awards and surveys conducted by Plastics New Zealand with member compa-nies make it evident that many of the larger plastic companies are adopting sustainable designpractices with resulting increases in resource stewardship. This is often a result of stronginternational environmental policies or more informally as a result of market differentiation orspecialisation. These practices are still however very fragmented when looking at the industryas a whole, especially within smaller companies. This reflects overseas research which hasfound small- and medium-sized enterprises to have lower environmental performance andinitiative in comparison to their larger counterparts (New Business, 2003).
At a time when recyclers are competing for more material and green groups are demandingbetter access to recycling some plastic manufacturers and fillers are compromising this byplacing unrecyclable products on the market. This is a contradiction that needs to be alleviatedthrough better tertiary education and communication between environmental, educational andindustry sectors.
The New Zealand Waste Management Strategy released in March 2002 adopts the principle ofExtended Producer Responsibility. This is defined as putting “the onus on business to look for, andcapitalize on, opportunities for resource conservation and pollution prevention throughout a product’slife-cycle, including disposal and the life-cycle principle where products and substances should be
Page 188 Resource Stewardship and Waste Minimisation
designed so all environmental effects are accounted for and minimized during generation, use, recoveryand disposal” (MfE, 2002). Based on the feedback received from the tertiary sector, industry nowneeds to establish advice and resources to achieve these objectives.
Responsibility for Decision-makingInterviews with plastic manufacturers indicate awareness of waste minimisation is starting toaffect decisions made, but that this responsibility is frequently being deferred to their custom-ers. The concern here is that these customers are often uninformed about the possible resourceimpacts of the decisions they make. The PVC sleeve contamination issue is a good example ofmarket innovations succeeding where they are in direct conflict with accepted design criteria forrecycling. Deferring decisions to other sectors that are less informed is a real concern and raisesthe importance of co-operating in the education and provision of environmental/sustainabledesign resources and information to the industries that the plastics sector serves. The broadscope of related industries and the ability to disseminate the correct information within these isanother strong barrier to improving the design of plastic products.
Supply ChainPlastic raw material supply companies commonly have strong formal environmental policies.Unfortunately these same companies do not always fully inform or advise clients on the correctlabeling or recyclability of materials sold. These, often multi-national companies, have animplied social and environmental responsibility to provide technical advice and support to theirclients and the communities where these products are eventually sold, used and disposed of.There appears to be a consistent theme developing where companies are now monitoring theirown environmental performance within the company, but this is often done in isolation fromthe full life-cycle effects of the products and services they provide. A good example of this is thefrequent queries from plastics manufacturers over the past year about what can they do withempty raw material bags which are not recyclable. As a result, a number of major New Zealandsuppliers have changed to recyclable LDPE(4) material bags. As an industry group part of ourwaste minimisation strategy must be to examine supply level relationships and the possibilityof formulating service level agreements.
Risk managementThe manufacturing sector continues to see environmental initiatives and legislation as a threatto economic growth that will continue to increase future compliance costs and reduce profitabil-ity. Environmental initiatives have therefore frequently been made by the plastics companies tominimise risk, as opposed to maximising market opportunity. Actions now being taken by theplastics industry indicate that this mindset is shifting, with environmental philosophies emerg-ing strongly among many of our leading plastic businesses.
Sector developmentThere is a strong opportunity for strategic projects to be forged between sector groups. Consul-tation and co-ordination is needed to ensure:
• economies of scale;
• buying power;
• certainty and reduced commercial risk; and
• greater transparency.
Plastics recycling has had a chequered history in New Zealand. Recyclers are often referred toas ‘cowboys’ by both manufacturers and other recyclers. The plastic recycling industry has oftenbeen typified by people who are passionate about recycling but who are unfortunately notalways good business managers. Tight recycling markets and fluctuating prices have seen many
Page 189The Plastics Sector
of these companies close. One positive result of this has been growing an increased level ofprofessionalism among the operators that have sustained their businesses. Overcoming existingperceptions and increasing cooperation between the two groups has been a focus for bothPlastics New Zealand and the Recycling Operators of New Zealand.
Comments from manufacturers not able to source enough recycled material contrast withrecyclers who are exporting materials. This reveals a real lack of co-ordination between the twogroups. There is a lack of capacity within New Zealand to reprocess material for reuse here,with only one commercial plastics washline in operation and technical limitations on the type ofmaterial able to be reprocessed without this facility.
From an environmental perspective reuse of these materials within local markets is a directenvironmental gain, given the loss of energy involved in shipping materials overseas to Chinaand Asia. It is also probable that the environmental performance of manufacturers within NewZealand is higher than those being achieved overseas. Most collectors bale material which isunable to be used directly by manufacturers. The lack of access to New Zealand re-processorsfor recovered material will be an issue that needs to be readdressed as collection volumescontinue to increase.
Ideas for plastic recycling abound but linking these with a reliable source of material in suffi-cient volumes, and with adequate business acumen and entrepreneurial skill, is proving moredifficult. The Recovered Material Foundation, which manages the Christchurch City kerbsidecollection, has as part of its brief the creation of additional employment. The focus of theorganisation to date has been to investigate start-up opportunities. There are, however, suffi-cient plastics companies already successfully operating locally which have the capacity to useall the HDPE (2) material collected by the council. Facilitating and initiating contact betweenthese two groups to establish possible markets is something that Plastics New Zealand andRMF have undertaken to investigate.
The marginal nature of recovered plastic material means that sales of material are very marketdriven. Consideration by councils of their aims for recycling and what defines an acceptablemarket for materials should form an important part of their contracts. Alan Goddard, Chair ofWasteMINZ, has commented that councils are placing too much reliance on contractors’ adviceand judgement on markets, their criteria for an acceptable market is economically driven andmay not reflect accurately what the community is setting out to achieve by recycling. Furthercooperative work is required by the Recycling Operators of New Zealand, Plastics NewZealand, Local Government New Zealand and WasteMINZ to provide better advice andinformation to Territorial Authorities to enable informed and sustainable decisions on plasticrecycling.
NGO’s and Government DepartmentsThe lack of co-ordination and resources among business/environmental groups within NewZealand is a further barrier to improved business waste minimisation practice. There are aplethora of such groups in New Zealand. While these groups are highly enthusiastic and aresucceeding in the promotion of change, they seldom have any strong governmental mandateand are typically small and under resourced. Groups such as the Zero Waste Trust, SustainableRetail, AEBN, BSR, NZBCSD, The Natural Step, WasteMINZ, RONZ, the New Zealand Packag-ing Council, BusinessCare, Landcare, the Ministry for the Environment, and cleaner productionstaff within councils where they exist, should consider further amalgamation, or at least betterco-ordination of projects and pooling of resources.
As a national organisation Plastics New Zealand struggles to find local resources and supportpeople for leading waste minimisation projects with individual companies. There is a widebreadth of support available through the groups referred to above, but very little depth. Forexample, the plastics sector has its biggest pool of industry within Manukau City. Unfortunately
Page 190 Resource Stewardship and Waste Minimisation
Manukau City does not have any cleaner production staff and therefore no cleaner productioncoordinator under BusinessCare. The establishment of a central agency to co-ordinate the workof all these groups and to refer and answer business enquiries would be hugely beneficial forthe business community. Business owners and managers look at environmental work assomething to do where time and money permits. Having easy access to the right resources andsupport people in their local communities is therefore critical to ensuring ongoing commitmentto waste minimisation work. Also critical is a better alignment of New Zealand Trade andEnterprise with the Ministry for the Environment. Technology and engineering innovations willbe critical to development and redesigning of plastics products for better waste minimisation.Industry development, research support and coordination is needed at this level.
Economic barriersInvestment in capital, product research and development is essential to ongoing reductions inmaterial usage and energy consumption. A lack of market incentives to carry out these develop-ments is a barrier. Adjustments to depreciation and taxation may provide opportunities toimprove the rate of plant replacement that would have a very positive impact on energyconsumption by the sector. The industry is typical of most in New Zealand where engineers andtechnicians are skilled at keeping the older, simpler, but less efficient, machinery operating atlower cost than purchasing replacements.
One barrier referred to in reference to further reducing bottle weights was the ability for fillersto cope with these innovations. Some beverage companies, for instance, continue to operatewith equipment designed to fill heavy glass bottles that will not cope with the lightest weightplastic bottles now technically possible. Waste minimisation in terms of energy consumption isalso a critical issue. A number of plastics companies did extensive work on energy efficiency inthe late 1990s; as a result the easy wins have already been made. Further efficiency gains requirelarge capital investment. Economic incentives to speed this shift need to be examined bygovernment.
11.4 Governance of the SectorThe plastics industry has the relative luxury of having no industry-specific legislation. It ishowever subject to the normal raft of standards, regulations and acts which dramatically impacton business compliance costs here in New Zealand. Like other sectors further legislation ofwaste minimisation based controls is seen as a further compliance cost that the sector wishes toavoid. The threat of legislation is therefore a driver for action. The following section outlines thecurrent governance of the sector and some future implications of this.
LegislationThere is no specific legislation for plastics or packaging within New Zealand. Manufacturersand recyclers operate under national and international standards, Resource Management,Health and Safety, and Hazardous Substances legislation and regulations. Statistics NewZealand figures show $739 million worth of plastic goods, excluding packaging, are nowimported per year (Statistics NZ, 2002). The New Zealand economy has been deregulated andthere are few or no controls on imported plastic products or packaging. Consumers buy for costsavings, brands, looks and convenience. Short product life-cycles and fast-changing consumerchoices typify our consumer society.
Environmental legislation in New Zealand is framed to minimise the impact of industry. Forexample, the purpose of the Resource Management Act 1991 under section 5 requires the:“... avoiding, remedying, or mitigating any adverse effects of activities on the environment”. Thepurpose of the Hazardous Substances and New Organisms Act 1996 under section 4 is:“... preventing or managing the adverse effects of hazardous substances and new organisms.
Page 191The Plastics Sector
The hierarchy of action for waste minimisation focuses first on source reduction. The focus ofgovernment under our current political climate, as evidenced by these pieces of legislation, ishowever not on decisions made in design and product development, but on managing theeffects of these decisions. With no environmental focus on product design and development,councils are left to solve the waste issues of our communities in isolation. Problems are, as aresult, discovered after the fact. A good example of this is PVC sleeving case study (see CaseStudy 11.2). PVC sleeves, a relatively new innovation, gathered rapid market growth andacceptance both here and overseas in spite of being a well-known contaminant of the PET andHDPE recycling streams. The current government focus on compliance is not representative ofbest waste minimisation practice. Any incentive to improve beyond compliance is on a purelyvoluntary basis. While this is a scenario preferred by industry there needs to be a provision ofcorresponding government leadership and resources that focus on leading and enablingindustry to improve beyond compliance levels.
The Packaging Accord and the New Zealand Packaging Code of PracticeThe 1996 Packaging Accord sought to minimise the environmental effects of packaging waste.Innovations such as light weighting have slowed the growth in this waste, however the totalquantity of packaging waste has continued to increase. The Packaging Council of New Zealandrepresents the broader packaging sector groups of glass, paper, tin, aluminum and plastic. ThePackaging Accord provides a general direction to minimise packaging waste.
The Packaging Council of New Zealand also produced a self-regulatory Code of Practice for thepackaging of consumer goods. The key objectives of the code are:
• to ensure that new packaging materials or new forms of packaging are evaluated for theirenvironmental impact prior to their introduction and if possible, modified to ensure mini-mal environmental impact;
• to allow companies to evaluate the environmental impact of existing packaging and ifnecessary, make alterations to any package to make it more environmentally appropriate;and
• to reflect the following waste management options: Reduction; Reuse, Recycling, Recoveryand Disposal (Packaging Council, 2002).
The Code is self-regulating and does not have any enforceable mandate under which thePackaging Council administering can act. The Code provides a complaint procedure underwhich formal complaints may be made about plastic packaging where the code is breached. TheCode was reviewed in consultation with the Ministry for the Environment in 2002.
The New Zealand Packaging Accord is currently being renegotiated. As part of a renewedagreement, action plans are required from all packaging sectors, including retailers and brandowners, recyclers, central and local government. Increased emphasis has been placed onretailers and brand owners for their influence on the supply chain and potential to impactchanges through combined purchasing power. Also included for the first time are requirementsfor the sectors to monitor and report on environmental performance at a level broader thanrecycling. These requirements reflect an increasing awareness within the Ministry for theEnvironment of the need for a more holistic approach to assessing the environmental impact ofindustry.
Standards and guidelinesThere are various technical guidelines on plastics, including product design and materialcompatibility. Full resources on standards and guidelines are available at www.plastics.org.nz.
The websites www.apme.org and www.4spe.com are two other excellent sources for bestEuropean and American plastic technologies and technical life-cycle assessments. The following

Page 192 Resource Stewardship and Waste Minimisation
is an abbreviated list of current standards that impact on product design and labelling:
ACOR (2001), Recycling Guide for Beverage and Food Manufacturers Marketing in PET Containers,Australian Council of Recyclers.
ACOR (2003), Recycling Guide for Beverage and Food Manufacturers Marketing in HDPE Containers,Australian Council of Recyclers.
AS/NZS 14021, Environmental Labels and Declarations.
AS 2070, Plastic Materials for Food Contact Use.
NZS 5825, Reclosable Packages: Child Resistant packaging.
ISO/FDIS 17422:2002, Plastics – Environmental aspects – General guidelines for their inclusion instandards.
ISO 1043-1:2001, Plastics – Symbols and abbreviated terms – Part 1: Basic polymers and their specialcharacteristics.
ISO 11469:2000, Plastics – Generic identification and marking of plastics products
11.5 Drivers for Change within the SectorAs with all business sectors there are various pressures pushing and pulling the decisions andactions of plastic business owners and mangers. The plastics industry is one that enjoys theunfortunate privilege of being a sector people love to hate when talking about environmentalissues. In any discussion on waste minimisation plastics invariably comes up as a major con-cern, although it only contributes 7% of the waste stream by weight.
Unfortunately, concern about plastic waste does not often translate into behaviour changes likepurchasing decisions. For this reason the industry faces both strong and weak drivers forchange. The following section outlines and discusses the main drivers.
MarketsCustomer feedback to the plastics manufacturing sector is vital to the redesign of plasticproducts. Manufacturers base most of their decisions on the demands of the customer. Ifdemands to ensure recyclability and reuse of recovered material are not supported by custom-ers these will not succeed. A prime example of this is the purchasing practice of councils.Manufacturers cite several councils demanding coloured rubbish bags that prevent the use ofrecycled material. A black rubbish bag can be made from 100% recycled content and yet somecouncils will not purchase these. Provision of infrastructure by councils and government usingrecycled plastic is a major opportunity to ensure that materials are reused locally.
There are good examples of industry innovation being used to overcome market barriers.Several products have been developed where a layer of virgin material over recycled material isused to meet customer specifications. HDPE, for example, is commonly used in pipes. MarleyNew Zealand Ltd recently developed a pipe with a co-extruded coloured outer that meansblack recycled material can be used inside while the coloured outer layer of virgin materialenables easy identification of the underground service provided.
Unfortunately market experience has also shown the failure of environmentally sound plasticproducts. The sad reality is that some of these failures have made manufacturers wary of tryingnew environmental product initiatives — therefore support through purchasing policies will bevital to ensure that manufacturers are giving these considerations weight in the decision-making process.
Page 193The Plastics Sector
For example, the heaviest plastic component and most expensive part of roll-on deodorantbottles is the roller ball. The balls are typically made of a different material, are not removableand are therefore unable to be recycled. The ‘Mum’ deodorant refill produced by PremierPlastics alleviated this problem, reducing costs, material usage and enabling recycling, butproved unsuccessful on supermarket shelves (PNZ, 2002). Lack of market support for resourcesmart products creates a disincentive to taking innovative action.
Clients are basing their product and packaging decisions on price and this typically becomes thekey determining factor in material selection for manufacturers. Raw material prices can result inplastics being selected that are not recycled being chosen ahead of those that are. For example,ABS and PS are frequently used for dairy products, instead of HDPE which is recycled throughkerbside collections. Our manufacturers have expressed a willingness to change if their clientsgave some form of guarantee that they would not defect to a cheaper competitor’s product inthe original non-recyclable material. Currently there is no financial incentive for either party totake this action.
The need for customer support is an issue that is common to all sectors. A survey of the retailsector revealed the following comments and opinions (AEBN, 2002):
• Retailers are highly customer driven and would quickly respond to what ever their custom-ers demanded;
• They stressed the importance of looking back up the supply chain to work with suppliers toaddress sustainability issues at source;
• As major companies with large buying power, they felt that NZ suppliers would listen tothem and take action in response to retailer concerns; and
• One retailer stated that responding to issues as a sector meant they would have biggerimpacts on the major suppliers.
As discussed above, the action plans now being required under the Packaging Accord willprovide an opportunity to ensure the retail sector acts on the above comments. Sealed AirAuckland cite a case of a customer requesting that a plastic coated paper product being changedto one plastic material (LDPE) so that it could be recycled (PNZ, 2002). This product change,which was driven by the customer, not only enabled recycling but reduced raw material costs,and therefore provided both environmental and economic benefits to the manufacturer. Betterpromotion and awareness of waste minimisation issues within our industry and with ourcustomers will increase the incidence of this sort of scenario. The need for better education andco-operation are elements that will be focused on under the industry’s Sustainability Initiative.
Plastics New ZealandPlastics New Zealand Incorporated (PNZ) represents over 165 plastic product manufacturersand raw material suppliers with a membership base covering over 75% of the total industry.Plastics New Zealand is based on a representative committee structure and employs threefull-time staff. The purpose of PNZ is to maximise the growth and success of plastics-basedtechnology in New Zealand in an economically, socially and environmentally responsiblemanner. A list of initiatives that PNZ has initiated in the past couple of years is provided in Box11.2. PNZ has employed a full time environmental affairs manager since 1993. The principalpurpose of this role is to assist and encourage members to operate their businesses in anenvironmentally responsible manner by promoting relevant standards, by-laws, legislation andbest practice relating to environmental issues. The principle role of the environmental affairsmanager is to implement the industry Sustainability Initiative.
Zero WasteThe aim of Zero Waste New Zealand Trust is to eliminate rather than ‘manage’ waste. The
Page 194 Resource Stewardship and Waste Minimisation
Trust’s website states that advocacy and policy development are major functions. This isactioned by promoting the vision of a ‘zero waste’ society where all materials are valued asresources. Zero Waste New Zealand Ltd list their function as:
• industrial designers designing products that can be reused, disassembled or recycled at theend of their lives;
• manufacturers creating products with minimal waste and reducing packaging to a mini-mum;
• retailers stocking products that are recyclable and repairable;
• secondary materials handlers providing a high-quality service that out-competes wastedisposal services;
• local authorities providing the incentives and support infrastructure for recycling andresource recovery;
• central government creating policy that favours waste minimisation and recycling overdisposal to landfill; and
• consumers making responsible buying decisions, buying products with minimal packagingand made from recycled materials and recycling at home and work (Zero Waste, 2002).
The Trust has placed strong emphasis on, and been highly successful in, gaining support forwaste minimisation through zero waste. The successful uptake of the ‘zero waste’ philosophyby at least 50% of the territorial authorities in New Zealand is evidence of this (Zero Waste,2002). This has created a situation where considerable pressure is placed on recovering andrecycling plastics from the waste stream. While the Trust has not focused on industrial designand retail purchasing decisions it has definitely created pressure to influence these. The cam-paign by the Trust against plastic shopping bags is one recent example of this.
A key benefit of this movement has been in the increased level of community recycling andmoves to examine future plastic recycling streams. Unfortunately these decisions are typicallymade in isolation from the producers of these products, feedback to manufacturers has beensporadic and largely based on public debate. Both Plastics New Zealand and Zero Waste havebeen working to find better ways to cooperate, even where it is not possible to reach agreementon specific issues.
As councils attempt to find solutions for plastics waste, pressure will continue to develop formanufacturers and importers to reconsider their material or design choices. Moves by the Trustto provide educational infrastructure for the New Zealand waste industry may also providefurther opportunity to promote best practice in plastics waste management.
PublicThere is public pressure to offer plastic recycling services through kerb side collections. Recy-cling is seen as the environmental solution to what the public perceive as a mountain of plasticswaste. Queries from the public often reveal that they perceive the proportion of plastic waste asmuch higher than the reality of 7%. The general public does not often consider nor are theyaware of the environmental life-cycles of the packaging or products, which they purchase, use,and dispose of. Paper or cardboard is seen as preferable due to the ease of recyclability and theperceived ‘naturalness’ of the material. The international plastics industry had invested signifi-cant money to research the lifecycle of plastics and the comparative energy use in the produc-tion of plastic materials and products. Provision of information and educational resources isseen by the plastics industry as a way of better informing the public and ensuring that debateon the environmental impacts of plastic is an informed one.
MediaThe media have published a variety of reports on plastics and plastic recycling. Members of the
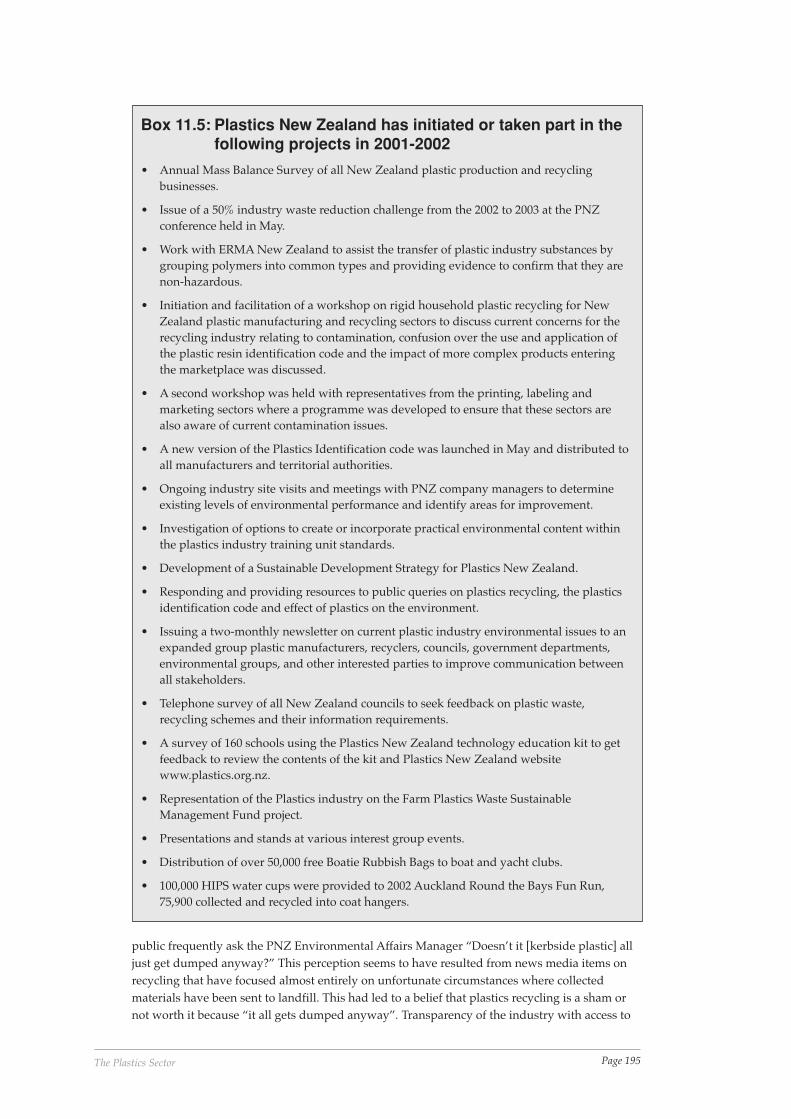
Page 195The Plastics Sector
public frequently ask the PNZ Environmental Affairs Manager “Doesn’t it [kerbside plastic] alljust get dumped anyway?” This perception seems to have resulted from news media items onrecycling that have focused almost entirely on unfortunate circumstances where collectedmaterials have been sent to landfill. This had led to a belief that plastics recycling is a sham ornot worth it because “it all gets dumped anyway”. Transparency of the industry with access to
Box 11.5: Plastics New Zealand has initiated or taken part in thefollowing projects in 2001-2002
• Annual Mass Balance Survey of all New Zealand plastic production and recyclingbusinesses.
• Issue of a 50% industry waste reduction challenge from the 2002 to 2003 at the PNZconference held in May.
• Work with ERMA New Zealand to assist the transfer of plastic industry substances bygrouping polymers into common types and providing evidence to confirm that they arenon-hazardous.
• Initiation and facilitation of a workshop on rigid household plastic recycling for NewZealand plastic manufacturing and recycling sectors to discuss current concerns for therecycling industry relating to contamination, confusion over the use and application ofthe plastic resin identification code and the impact of more complex products enteringthe marketplace was discussed.
• A second workshop was held with representatives from the printing, labeling andmarketing sectors where a programme was developed to ensure that these sectors arealso aware of current contamination issues.
• A new version of the Plastics Identification code was launched in May and distributed toall manufacturers and territorial authorities.
• Ongoing industry site visits and meetings with PNZ company managers to determineexisting levels of environmental performance and identify areas for improvement.
• Investigation of options to create or incorporate practical environmental content withinthe plastics industry training unit standards.
• Development of a Sustainable Development Strategy for Plastics New Zealand.
• Responding and providing resources to public queries on plastics recycling, the plasticsidentification code and effect of plastics on the environment.
• Issuing a two-monthly newsletter on current plastic industry environmental issues to anexpanded group plastic manufacturers, recyclers, councils, government departments,environmental groups, and other interested parties to improve communication betweenall stakeholders.
• Telephone survey of all New Zealand councils to seek feedback on plastic waste,recycling schemes and their information requirements.
• A survey of 160 schools using the Plastics New Zealand technology education kit to getfeedback to review the contents of the kit and Plastics New Zealand websitewww.plastics.org.nz.
• Representation of the Plastics industry on the Farm Plastics Waste SustainableManagement Fund project.
• Presentations and stands at various interest group events.
• Distribution of over 50,000 free Boatie Rubbish Bags to boat and yacht clubs.
• 100,000 HIPS water cups were provided to 2002 Auckland Round the Bays Fun Run,75,900 collected and recycled into coat hangers.
Page 196 Resource Stewardship and Waste Minimisation
accurate information on plastics and recycling for those educating and informing the public istherefore vital to any future increase in recycling levels.
PNZ has produced a series of informational brochures, and has redeveloped its websitewww.plastics.org.nz in response to this need. It has also produced a free education kit forsecondary school students studying under the technology curriculum. Over 300 schools haveused this kit over the last five years. The material provided has been aimed at providing teenswith better information about plastic as a material for use in technology applications and toraise a better public awareness of the energy efficiency and the positive environmental benefitsof plastic over its entire life-cycle.
Local GovernmentCouncils must prepare an assessment of effects on the environment that examines alternativesunder the Resource Management Act — this cost-benefit analysis is not often made whenrecycling contracts are being assessed. Waste contract decisions are typically made on a financialbasis through the annual plan and tender processes employed by councils. Concern has beenexpressed that councils are accepting recommendations on plastics recycling from contractorswithout any thorough verification or assessment. Contractors are basing their tenders on plasticmarkets usually from a purely financial perspective that may not fully reflect the broaderenvironmental and social intentions of a council. The occurrence of disparate advice beingreceived by councils about the existence, or not, of markets for types of plastic from contractors,with a vested interest, needs to be alleviated by the provision of some neutral industry informa-tion. Plastics New Zealand, the Recycling Operators of New Zealand, Waste MINZ and LocalGovernment New Zealand have an opportunity to help fulfil this need. The role and responsi-bilities of local government for recycling will be broadened under the New Zealand WasteStrategy with tendering and maintaining recycling contracts, promotion and education ofrecycling schemes, and monitoring of contract performance all needing to address this issue.The incidence of questions from local authorities to Plastics New Zealand has definitely in-creased of late and this reflects a growing awareness of the often complex issues surroundingplastics recycling which is really positive.
McDonough and Braungart state that “blindly adopting superficial environmental approacheswithout fully understanding their effects can be no better – and perhaps even worse – thandoing nothing” (McDonough and Braungart, 2002). Considerable energy and resources areconsumed by the recycling of plastics. Take for example PET, considered one of the successstories of the New Zealand plastics industry from an environmental perspective. This materialis collected and transported from as far away as Dunedin to China and other Asian countrieswhere it is reprocessed for fibre. The international anti-plastics lobby has attacked the plasticsindustry for ‘dumping’ plastics in third world countries where there is no guarantee of environ-mental performance or employment conditions. There is no record of an environmental life-cycle analysis in the New Zealand context that would take into account these factors. Councilscontinue to make the decision to recycle plastics based on partial information. The determina-tion of end markets is usually left to contractors and traders who are focussed solely on costrecovery. An anomaly in the market means it is cheaper to ship New Zealand’s plastics waste toChina than to Australia where reprocessing facilities are available. RONZ has recently initiateda study to gain better technical information on these PET markets.
HDPE, the other major post-consumer recycling stream, is a comparative success story with themajority of these materials being reused within New Zealand with minimal levels of reprocess-ing.
The lack of information and the complex technical nature of assessing the true costs and benefitsof plastics recycling is a barrier to making best practice waste management decisions in NewZealand. Plastics New Zealand has undertaken to meet with recyclers, councils and waste
Page 197The Plastics Sector
companies to define common strategic goals for plastics recycling in New Zealand in an attemptto provide councils with clear guidance.
RecognitionBoth Plastics New Zealand and the New Zealand Packaging Council hold high profile biennialawards that have strong environmental criteria and continue to raise the profile of incorporatingenvironmental factors into the design process. Vertex New Zealand won the 2002 PlasticsIndustry Environmental Award for their jerry can that contains 64% less plastic than a normaljerry can of equivalent capacity.
International trendsTwenty-five percent of New Zealand plastic production is exported (PNZ, 2002). Overseastrends towards waste minimisation therefore have a direct impact on our products as manufac-turers here design to specifications. These same trends are closely monitored and reported on byenvironmental groups, by government assessing and determining policy, and by Plastics NewZealand to ensure that its members are informed. Europe typically has the strongest formalpolicies with current trends toward legislating Extended Producer Responsibility (EPR), forcontrol on material use, identification and responsibility to take back products at the end oftheir lives.
Overseas models for ‘extended producer responsibility’ (EPR) in packaging include:
• packaging industry covenants (Netherlands, Australia);
• mandated beverage container deposits (some USA states, South Australia, Germany,Netherlands, Norway, UK);
• mandated take-back responsibility (Germany, Austria, France); and
• mandated recycled content (some USA states) (MfE, 2002).
The sector has established the need to further investigate extended producer responsibility, withPlastics New Zealand actively promoting this with companies on a business-to-business basis.Opportunities for Extended Producer Responsibility schemes at a macro level will be animportant consideration in the assessment and further workshops are proposed under thesectors Sustainability Initiative targets.
New Zealand Waste StrategyThe New Zealand Waste Strategy released in March 2002 sets voluntary targets for access torecycling but does not specify the type of material that should be collected. There are no specifictargets that relate to plastics. The Strategy does however pave the way for imposing true costpricing on landfills. The low cost of landfill in New Zealand has long been a financial disincen-tive for recycling — particularly plastic recycling which has comparatively low financialreturns.
Relevant waste minimisation and special waste targets for the sector to work towards are (MfE,2002):
• by December 2005, at least 10 major businesses will be participating alongside central andlocal government in developing and promoting waste minimisation programmes withintheir sector;
• regional councils will ensure that industrial resource consent holders will have in place arecognised waste minimisation and management programme; and
• by 2005 businesses in at least eight different sectors will have introduced EPR pilot pro-grammes for the collection and reuse, recycling, or appropriate treatment and disposal of atleast eight categories of ‘special’ wastes. e.g. [packaging] waste oil, tyres, end-of-life vehicles,
Page 198 Resource Stewardship and Waste Minimisation
packaging, computers, batteries.
Threat of future legislation, waste levies and increased compliancecosts.A key concern of the plastics industry is that of product substitution. Government initiativessuch as the removal of trade barriers, climate change policy and further measures designed tointernalise environmental costs have left the plastics industry exposed and vulnerable toimports from countries that can employ cheap labour and poor environmental performance.Any New Zealand initiative to design plastic products for waste minimisation must therefore beon a cost competitive basis with these cheaper imports and presents the industry with a doublechallenge — first selling these initiatives to their customers, and secondly ensuring that they arenot displaced by imports.
11.6 Conclusions and RecommendationsBased on the above assessment the key barriers for the plastics sector in establishing the bestavailable waste minimisation practices for the full life-cycle of products and services are:
• lack of incentives for business to achieve best waste minimisation practice;
• lack of market purchase support for sustainable product design;
• lack of practical sustainable engineering and technology design education at a tertiary andindustry level;
• lack of government leadership and technical resources to support sustainable productdesign;
• too much focus on waste solutions, e.g. recycling;
• lack of inter-sector co-ordination and leadership at a national level on business sustainabilityissues; and
• lack of co-ordination between government departments, academia, and business sectorprojects and research.
The New Zealand plastics industry has developed its Sustainability Initiative as a tool towardsovercoming these barriers. Most goals within the Initiative relate directly to resource steward-ship and waste minimisation. Under the principle of Extended Producer Responsibility majorchallenges face the plastics sector with the large number of materials, sectors, participants andcompanies involved in the life-cycles of a vast array of products.
The plastics industry does have the opportunity to lead by example and to raise awareness.Trail blazing is however often frustrating, expensive and time consuming, as evidenced by theearlier failure of some of our products designed for waste minimisation. Plastics companies arein business to make money — waste minimisation solutions and resource stewardship mustultimately meet these ends. There is a reluctance within the industry to take an environmentalleadership role because of existing negative perceptions about plastic, and the perceived riskthat companies will be ‘cut down if they hold their heads up’.
This re-emphasises the need for stronger government leadership on waste minimisation andresource stewardship, from a holistic industry perspective encompassing the full productlife-cycle from design to waste solutions. There has been much political reference to decouplingeconomic growth from growing waste volumes. Government input into supporting sustainabledesign solutions is now needed through political, technical and purchasing support. Recyclingis an excellent mechanism for hooking into peoples’ emotions, and raising community enthusi-asm, and involvement which the sector and government will continue to maximise.
The often singular focus of central and local government, environmental groups and the public
Page 199The Plastics Sector
on plastic waste and recycling in their policies, programmes and actions is of real concern to theplastics industry. There needs to be more tangible support given by these groups to enablepositive product and service designs by raising the awareness of the impact of purchasingdecisions and more formally through supply programmes and purchasing policies.
The need to share information and co-operate between sectors, organisations, businesses andconsumers both nationally and internationally is critical to the success of the Plastics NewZealand’s Sustainability Initiative. Lack of formal consultation and communication networksbetween non-governmental and governmental agencies means communication is fragmentedand often haphazard. Sectors within the business community are at differing levels of under-standing and capability in terms of waste minimisation. Approaches to the retail sector forexample revealed that they are just starting in some cases to examine energy efficiency andwaste reduction for their shops and few currently consider it their responsibility to definesupply or purchasing policies on an environmental basis.
Also critical will be the improvement of engineering design-based waste minimisation educa-tion within the sector. Technology and engineering design courses are currently lacking thespecific content required to ensure that environmental issues are weighted into the decision-making process. It is likely that this problem is common to most other manufacturing sectorsand there is an opportunity to create a model that can be transferred to other sectors.
Fortunately the adoption of the Plastics Sustainability Initiative has coincided with many otherpositive changes. These include the creation of a Sustainable Industry group within the Ministryfor the Environment, the renegotiation of the Packaging Accord, the creation of the SustainableBusiness Network, provision of resources and facilitator working groups by Business Care,WasteMINZ, Zero Waste and RONZ, and a growing sense of co-operation between the manygroups working in this arena.
PNZ in its role as the industry representative will continue to assist and encourage members tooperate their businesses in an environmentally responsible manner by promoting relevantstandards, by-laws, legislation and best practice relating to environmental issues under theframework of the industry Sustainability Initiative and the Packaging Accord.
11.7 ReferencesAEBN, 2002. Sustainable Retail Programme Report and Action Plan 2002 to 2004, 26 July, 2nd ed.
APME, 2002. Plastics Moving Towards a Sustainable Future: 2001 Annual Report, Association ofPlastics Manufacturers in Europe.
Gehrke T, 2000. Towards the Implementation of Sustainable Business Practices in New ZealandOrganisations – a Review of Current Activities and New Trends such as The Natural Step frame-work, The Open Polytechnic of New Zealand, Working Paper, May 2000.
McDonough W and Braungart M, 2002. Cradle to Cradle, North Point Press, New York.
MfE, 2002. The New Zealand Waste Strategy: Towards Zero Waste & a Sustainable New Zealand,Ministry for the Environment, Wellington, New Zealand.
Ministry for the Environment, 2002. Facts about Solid Waste and Landfills, www.mfe.govt.nz/issues/waste, December 2002.
New Business Magazine, 2003. “Green survey highlights lack of action among SMEs”,www.newbusiness.co.uk/cgi-bin/showArticle.pl?id=1251, August 2003.
Packaging Council of New Zealand (Inc), 2002. Code of Practice: for the Packaging of ConsumerGoods a Self Regulatory Code of Practice, Auckland, New Zealand.
PEAG, 1996. Minimising Packaging Waste: A National Strategy for Minimising the Volume of Packag-
Page 200 Resource Stewardship and Waste Minimisation
ing Waste in New Zealand, Packaging Environmental Advisory Group, New Zealand.
Plastics New Zealand Inc, 2002. Plastics Mass Balance Survey Results 2001, Plastics New Zealandreport.
Plastics New Zealand Inc, 2002. News and Information Update, August: Issue 43.
Plastics New Zealand Inc, 2002 unpublished notes. Informal interviews with manufacturers,recyclers, and councils.
Pacific Pollution Prevention Resource Center, 2003. “Pollution Prevention Research ProjectsDatabase”, www.pprc.org/pprc/rpd/statefnd/iowa_wrc/smallbus.html , August 2003.
Statistics New Zealand, 2002. www.stats.govt.nz
UNEP/CHW/TWG/19/6, 12 December 2001. Draft Technical Guidelines for the Identification andEnvironmentally Sound Management of Plastic Wastes and for their Disposal, Revision 7.
Zero Waste New Zealand Trust, 2002. www.zerowaste.co.nz/
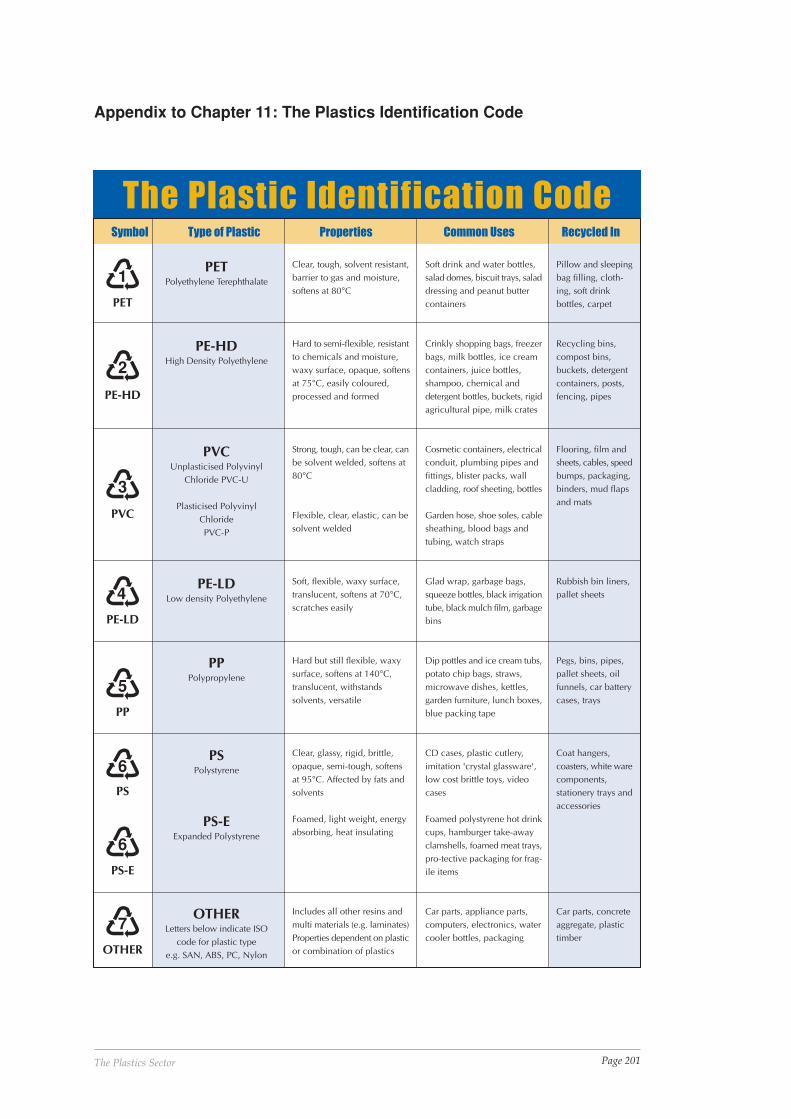
Page 201The Plastics Sector
����������� ���������� �
PET
PE-HD
PVC
PE-LD
PP
PS
PS-E
OTHER
Clear, tough, solvent resistant,barrier to gas and moisture,softens at 80°C
Hard to semi-flexible, resistantto chemicals and moisture,waxy surface, opaque, softens
at 75°C, easily coloured,processed and formed
Strong, tough, can be clear, canbe solvent welded, softens at80°C
Flexible, clear, elastic, can besolvent welded
Soft, flexible, waxy surface,translucent, softens at 70°C,scratches easily
Hard but still flexible, waxysurface, softens at 140°C,translucent, withstandssolvents, versatile
Clear, glassy, rigid, brittle,opaque, semi-tough, softens at 95°C. Affected by fats andsolvents
Foamed, light weight, energyabsorbing, heat insulating
Includes all other resins andmulti materials (e.g. laminates)Properties dependent on plasticor combination of plastics
Soft drink and water bottles,salad domes, biscuit trays, saladdressing and peanut buttercontainers
Crinkly shopping bags, freezerbags, milk bottles, ice creamcontainers, juice bottles,shampoo, chemical anddetergent bottles, buckets, rigidagricultural pipe, milk crates
Cosmetic containers, electricalconduit, plumbing pipes andfittings, blister packs, wallcladding, roof sheeting, bottles
Garden hose, shoe soles, cablesheathing, blood bags andtubing, watch straps
Glad wrap, garbage bags,squeeze bottles, black irrigationtube, black mulch film, garbagebins
Dip pottles and ice cream tubs,potato chip bags, straws,microwave dishes, kettles,garden furniture, lunch boxes,blue packing tape
CD cases, plastic cutlery,imitation 'crystal glassware',low cost brittle toys, videocases
Foamed polystyrene hot drinkcups, hamburger take-awayclamshells, foamed meat trays,pro-tective packaging for frag-ile items
Car parts, appliance parts,computers, electronics, watercooler bottles, packaging
Pillow and sleepingbag filling, cloth-ing, soft drinkbottles, carpet
Recycling bins,compost bins,buckets, detergentcontainers, posts,fencing, pipes
Flooring, film andsheets, cables, speedbumps, packaging,binders, mud flapsand mats
Rubbish bin liners,pallet sheets
Pegs, bins, pipes,pallet sheets, oilfunnels, car batterycases, trays
Coat hangers,coasters, white warecomponents,stationery trays andaccessories
Car parts, concreteaggregate, plastictimber
PETPolyethylene Terephthalate
PE-HDHigh Density Polyethylene
PVCUnplasticised Polyvinyl
Chloride PVC-U
Plasticised PolyvinylChloridePVC-P
PE-LDLow density Polyethylene
PPPolypropylene
PSPolystyrene
PS-EExpanded Polystyrene
OTHERLetters below indicate ISO
code for plastic typee.g. SAN, ABS, PC, Nylon
������ ������������� �������� ����������� ������� ���
1
2
3
4
5
6
6
7
Appendix to Chapter 11: The Plastics Identification Code
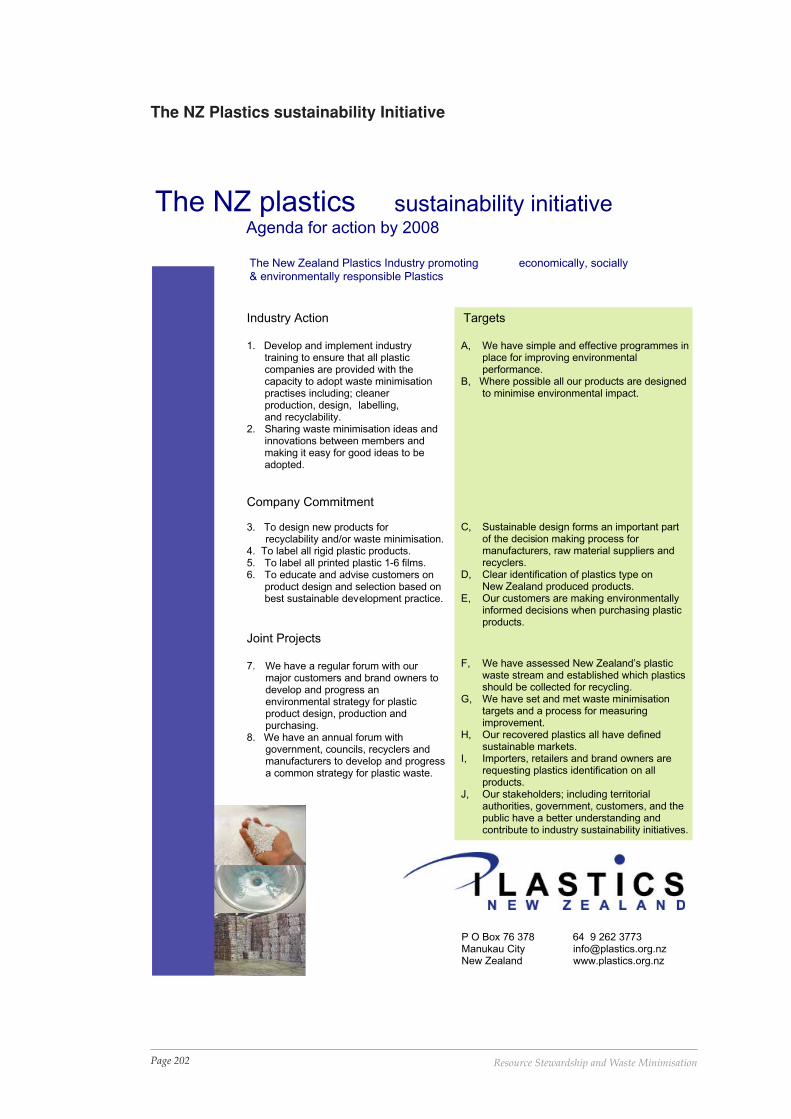
Page 202 Resource Stewardship and Waste Minimisation
The NZ plastics sustainability initiative Agenda for action by 2008
The New Zealand Plastics Industry promoting economically, socially & environmentally responsible Plastics
Industry Action 1. Develop and implement industry training to ensure that all plastic companies are provided with the capacity to adopt waste minimisation
practises including; cleaner production, design, labelling, and recyclability. 2. Sharing waste minimisation ideas and
innovations between members and making it easy for good ideas to be adopted.
Company Commitment 3. To design new products for recyclability and/or waste minimisation. 4. To label all rigid plastic products. 5. To label all printed plastic 1-6 films. 6. To educate and advise customers on
product design and selection based on best sustainable development practice.
Joint Projects 7. We have a regular forum with our major customers and brand owners to develop and progress an environmental strategy for plastic product design, production and purchasing. 8. We have an annual forum with government, councils, recyclers and manufacturers to develop and progress a common strategy for plastic waste.
P O Box 76 378 64 9 262 3773 Manukau City [email protected] New Zealand www.plastics.org.nz
Targets A, We have simple and effective programmes in
place for improving environmental performance. B, Where possible all our products are designed
to minimise environmental impact.
C, Sustainable design forms an important part
of the decision making process for manufacturers, raw material suppliers and
recyclers. D, Clear identification of plastics type on New Zealand produced products. E, Our customers are making environmentally informed decisions when purchasing plastic
products. F, We have assessed New Zealand’s plastic
waste stream and established which plastics should be collected for recycling.
G, We have set and met waste minimisation targets and a process for measuring improvement. H, Our recovered plastics all have defined sustainable markets. I, Importers, retailers and brand owners are requesting plastics identification on all products. J, Our stakeholders; including territorial authorities, government, customers, and the
public have a better understanding and contribute to industry sustainability initiatives.
The NZ Plastics sustainability Initiative
Part 3:
Resource Stewardship:
Improving the contribution
of Waste Minimisation

Page 205Revisiting the Context
1Revisiting the Context
Lesley Stone112
The purpose of Part Three is, firstly, to examine the outcomes from the industry task groupwork reported in Part Two within the context described in Part One. The important issues hereare whether or not industry is making any serious attempts to reduce the production of waste,and how the efforts that are being made impact on the future of resource stewardship in NewZealand. Secondly, in a more general sense, the questions that have been raised during thecourse of the CAE RS:WM project need to be considered in light of the changes that are requiredfor progress towards resource stewardship to happen. Part Three concludes with a number ofrecommendations for improving the contribution waste minimisation makes towards resourcestewardship and, hence, sustainability.
Part One discussed the political environment within which waste minimisation, and its role inresource stewardship, are practiced in New Zealand, and how it has changed during the pastdecade. The WasteMINZ Lifeafterwaste programme, the New Zealand Waste Strategy and theNational Energy Efficiency and Conservation (NEEC) Strategy are notable amongst a raft ofinitiatives and provide evidence of a more strategic approach to the problems posed by wastes.They also signal new levels of consensus and co-operation within the diverse waste manage-ment industry, between central and local government, and within central government. How-ever, questions remain regarding the level of integration among these initiatives, and the extentto which the New Zealand Waste Strategy will be adopted, given that it is not underpinned bylegislation (unlike the NEEC Strategy).
Nevertheless, the Local Government Amendment Act (No. 4) 1996, the Energy Efficiency andConservation Act 2000 (EEC Act) and the Local Government Act 2002 have, each in their ownway, paved the way for a greater range of instruments including further regulations, economicincentives and disincentives, and the strategies themselves. Part One identified the need forcareful selection, application and integration of these instruments in ways that are appropriatewithin the New Zealand context. An important question is whether or not the programmes thatarise as a result of these different regulatory instruments need to be integrated, and if so, how.
Issues regarding the poor level of integration were also raised in Part One on the role played byNGOs. Over twenty NGOs were identified during the CAE RS:WM project that work in variousways with businesses and communities to promote a range of relevant concepts and ap-proaches. Common benefits were the provision of resources, establishment of networks, sharedlearning, local mentors, the ability to respond to individual needs, and independence. Whilethese benefits were identified for a wide range of NGOs, limitations appeared to be differenti-ated along the lines of group membership. NGOs that are representative of a particular sector,and strongly member-driven and funded, appeared to be limited in the services they are able toprovide, while those that are not so clearly membership-driven and funded appear to be limitedmainly in terms of resource availability. Two obvious questions that arise are whether so manyNGOs are desirable and whether or not their work needs to become more integrated, or evenrationalised. Related to this is the matter of whether or not there is some level at which resourcesharing, co-ordination and integration may be useful.
Another noteworthy conclusion was that the majority of NGOs, particularly those that workwith businesses, appear to be conciliatory in nature. Questions that can be asked are whether
1 University of Auckland
Page 206 Resource Stewardship and Waste Minimisation
this is necessarily a good thing, and whether the absence of strong pressure groups is perhapsresulting in complacency amongst non-participating businesses. More importantly, while NGOsvary in terms of focus, geographic spread, membership and the services they offer, they aresimilar in that they tend not to focus on resource stewardship as an outcome.
In revisiting Part One it is apparent that several important conclusions can be drawn from thediscussion on experience and learning.
• Waste minimisation activities could be improved in terms of programme development, theirsupport mechanisms, and their contribution towards the goal of sustainability.
• Programme goals need to be integrated, success needs to be clearly defined and monitored,and targets need to be carefully considered and set.
• Monitoring programmes need to be carefully designed and their results need to be used tocontinually improve outcomes.
• Support mechanisms need to be included that will maintain and enhance commitment,motivation and enthusiasm of those involved, particularly champions.
• Important relationships and competencies need be nurtured, developed and enhanced.
• Costs and benefits need to be evaluated in economic, environmental and social terms, andeconomic viability needs to be de-coupled from success.
It is important to recognise that not all programmes need to include the full range of activitiesthat are necessary to achieve sustainability. Programmes need to be valued according to theirmerits and the core competencies and passions of staff and/or volunteers. However, they stillneed to be evaluated in terms of the specific contributions they make to achieving resourcestewardship. One very relevant question that arose in Part One was how the non-technicalcompetencies required to undertake these improvements will be developed. A further impor-tant question is how to integrate programmes within the de-regulated context under whichNew Zealand operates without a central authority or some sort of integrating agency to assist.
The main conclusion from the business programme evaluation was that such programmes maybe limited in their ability to develop or enhance commitment and, therefore, on-going improve-ment. Contributing factors appear to be inadequacies in bringing about leadership, support,communication and widespread involvement within individual businesses. Another conclusionwas that programmes that are customised according to the activities, needs and culture ofindividual businesses appear to have greater potential for increasing commitment and on-goingimprovement. A question that arises is how to balance the need to customise programmes withthe need to maximise what can be done with a limited amount of resources.
Page 207Sector Group Responses
1Sector Group Responses
Lesley Stone113
13.1 IntroductionPart Two provided insights into the current status of waste minimisation and resource steward-ship within seven industry sectors: dairy (Chapter 5), meat (Chapter 6), forestry (Chapter 7),built environment (Chapter 8), tourism (Chapter 9), retail (Chapter 10) and plastics (Chapter 11).The chapters were written by sector group representatives with input from each particularsector. Their purpose was to provide a snapshot of achievements to date in the sector, and to usethem, together with key issues that have been raised, to make recommendations for improvingthe contribution of waste minimisation activities to resource stewardship.
13.2 Characteristics of the SectorsThe introduction to each sector chapter provided a profile of the sector within New Zealand,including: international and national significance; size; contributions to economy; geographicdistribution, and any other important characteristics that help to define the sector. The maincharacteristics for each sector are summarised in Table 13.1. From Table 13.1 it can be seen thatthe sectors covered account for nearly half of New Zealand’s GDP, almost two thirds of itsexport earnings and well over a third of its fulltime employment. It’s interesting to note thatwhile primary producers such as dairy, meat and forestry often receive a high profile in NewZealand because of their high export earnings, tourism, the built environment and retailtogether contribute more than 25% of New Zealand’s GDP. In addition to holding its own withregard to GDP, tourism is also a high ‘export’ earner due to the revenue generated from interna-tional visitors2. When added to the income generated by local tourists (who outnumber interna-tional visitors by 10:1), it is possible to see that, of all the sectors studied, tourism makes thegreatest contribution to GDP, followed by built environment. Retail is by far the largest em-ployer followed by built environment and tourism.
This information is important for resource stewardship. On the surface, the dairy and meatsectors may appear to be very different to the tourism sector. However, they are inextricablylinked in that they all derive benefit from trading on New Zealand’s ‘clean-green’ image. Thisimage has been identified by the tourism industry as a critical component of the attraction thatNew Zealand holds for international and local visitors alike. The dairy and meat sectors relyheavily on New Zealand’s image to attract customers in international markets. Because bothsectors are competing in markets with strong local production (only 7.2% of sheep meat and 2%of milk production world-wide is traded internationally), both sectors have recognised theimportance of quality in maintaining and developing these international markets and NewZealand’s image provides a strong visual metaphor for quality. However, an important differ-ence between these two primary producers and the tourism sector is that their markets will notnecessarily ever visit New Zealand, while all of the country’s tourists will. Consumers of NewZealand beef, lamb and milk products are likely to rely heavily on the sectors’ own marketingmaterial as a basis for verifying claims. However, international tourists will all be in a positionto evaluate the situation themselves once they arrive here. Given that 70% of internationalvisitors are repeat visitors, it is essential for the future health of the sector for their expectationsregarding New Zealand’s image to be met.
1 University of Auckland2 Note that the ‘export’ revenue for tourism as presented in Table 13.1 excludes international air travel, which is usually
paid for in the country of origin.
Page 208 Resource Stewardship and Waste Minimisation
Since dairy and meat producing farms, and forestry, cover over half of New Zealand’s landmass, they contribute directly to a major part of the image New Zealand projects to its visitors.It would be interesting to know what proportion of the international consumers of NewZealand dairy and meat products buy New Zealand produce because they have visited thecountry (and indeed, what proportion of those who have visited the country choose not to doso, and why). Equally, the experiences international visitors have in the hands of the tourismsector may well reflect on the choices they make with regard to New Zealand products upontheir return home. It seems reasonable, therefore, to emphasise the inextricable links betweenthe tourism sector and the dairy, meat and forestry sectors.
There are strong links too between the tourism and retail sectors, although these are likely to bemore important for international, rather than local tourists. Visitors with high expectations ofNew Zealand’s environmental quality (e.g. from Germany and The Netherlands) may respondnegatively to the relatively low levels of environmentally compatible goods available in retailstores, for example. And this perception may, in the absence of obvious evidence to the contrary,be exacerbated by the burgeoning plastics sector and the perceptions that members of the publichave regarding this sector’s contribution to solid waste. While these connections may not seemto be as direct as those that exist between tourism and the primary sectors, it is possible that anegative association thus experienced could also damage New Zealand’s reputation andnegatively impact not only upon tourism, but also upon New Zealand product choice afterreturning home. Negative visitor experiences of the built environment (e.g. unsightly urbansprawl, combined with inadequate public transport and traffic congestion), may also have thepotential to affect international visitors’ perceptions regarding New Zealand’s clean, greenstatus and, eventually decisions to buy New Zealand products available on the internationalmarket.
What is important here (in the absence of any quantitative information on these linkages), is notso much the specific nature of these relationships and their relative worth, but rather theinterconnectedness of New Zealand’s sectors. The relevance of this interconnectedness forresource stewardship will become more apparent in the following sections.
13.3 Sector Resource Use and Waste MinimisationThe section on resource use and waste minimisation within each sector chapter in Part Twoincluded an overview of the main types of resources that are used within the sector, a descrip-tion of the specific types of activities (or processes) undertaken within the sector, the main typesof products and wastes that are generated, and their quantities. These are summarised in Table13.2. One of the most striking features of Table 13.2 is what is not in it, rather than what is. Themajority of sector chapters include relatively little information on the quantities of resourcesused and the products and wastes generated. While this is perhaps not surprising for thetourism sector (given the non-material nature of the services it provides, and the relativelyrecent attempts to reduce its wastes), it is surprising for sectors such as dairy, meat and forestry,where waste minimisation initiatives have supposedly been in place for many years. Wherefigures are available, they tend to be limited to the resources that contribute most directly to theproducts themselves (e.g. milk and milk products, cattle and meat, trees and wood products,plastic granules and products), as well as their direct derivatives (e.g. whey, wood residues).
One of the basic tenets of waste minimisation is that ‘you can’t manage what you don’t measure’.The almost complete absence of quantities for water and energy use and wastage, as well asdischarges to air, suggests that the focus in these industries is still very much on increasingproduct yield, rather than on resource stewardship across a wider range of resources. A note-worthy exception is the quantification of CO2 emissions for some sectors. The specific nature ofthis inclusion suggests that this is in response to New Zealand’s ratification of the KyotoProtocol and the prospect of economic instruments, such as a carbon tax, to encourage the
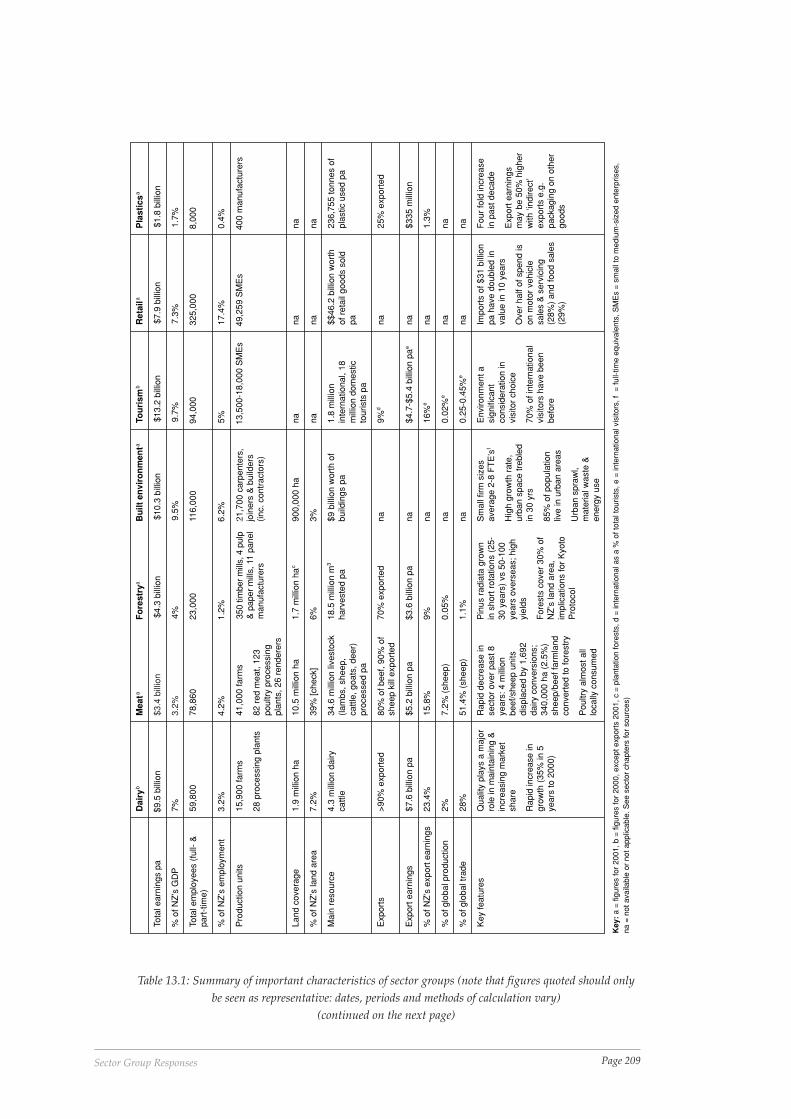
Page 209Sector Group Responses
Table 13.1: Summary of important characteristics of sector groups (note that figures quoted should onlybe seen as representative: dates, periods and methods of calculation vary)
(continued on the next page)
350
timbe
r mill
s, 4
pul
p&
pap
er m
ills,
11
pane
lm
anuf
actu
rers
21,7
00 c
arpe
nter
s,jo
iner
s &
bui
lder
s(in
c. c
ontr
acto
rs)
Dai
ryb
Mea
taF
ore
stry
aB
uilt
en
viro
nm
enta
Tou
rism
bR
etai
laP
last
ics
a
Tota
l ear
ning
s pa
$9.5
bill
ion
$3.4
bill
iont
$
4.3
billi
on
$10
.3 b
illio
n
$
13.2
bill
ion
$7.9
bill
ion
$1.8
bill
ion
% o
f NZ
’s G
DP
7%3.
2%t
4%9.
5%9.
7%7.
3%1.
7%
Tota
l em
ploy
ees
(ful
l- &
part
-tim
e)59
,800
78,8
6023
,000
116,
000
94,0
0032
5,00
08,
000
% o
f NZ
’s e
mpl
oym
ent
3.2%
4.2%
1.2%
6.2%
5%17
.4%
0.4%
Pro
duct
ion
units
15,9
00 fa
rms
28 p
roce
ssin
g pl
ants
41,0
00 fa
rms
82 r
ed m
eat,
123
poul
try
proc
essi
ngpl
ants
, 26
rend
erer
s
i
1
3,50
0-18
,000
SM
Es
49,2
59 S
ME
s40
0 m
anuf
actu
rers
Land
cov
erag
e1.
9 m
illio
n ha
10.5
mill
ion
ha1.
7 m
illio
n ha
c90
0,00
0 ha
nana
na
% o
f NZ
’s la
nd a
rea
7.2%
39%
[che
ck]
6%3%
nana
na
Mai
n re
sour
ce4.
3 m
illio
n da
iryca
ttle
34.6
mill
ion
lives
tock
(lam
bs, s
heep
,ca
ttle,
goa
ts, d
eer)
proc
esse
d pa
18.5
mill
ion
m3
harv
este
d pa
$9 b
illio
n w
orth
of
build
ings
pa
1.8
mill
ion
inte
rnat
iona
l, 18
mill
ion
dom
estic
tour
ists
pa
$$46
.2 b
illio
n w
orth
of r
etai
l goo
ds s
old
pa
236,
755
tonn
es o
fpl
astic
use
d pa
Exp
orts
>90
% e
xpor
ted
80%
of b
eef,
90%
of
shee
p ki
ll ex
port
ed70
% e
xpor
ted
na9%
dna
25%
exp
orte
d
Exp
ort e
arni
ngs
$7.6
bill
ion
pa$5
.2 b
illio
n pa
$3.6
bill
ion
pana
$4.7
-$5.
4 bi
llion
pae
na$3
35 m
illio
n
% o
f NZ
’s e
xpor
t ear
ning
s23
.4%
15.8
%9%
]na
16%
e]
na1.
3%
% o
f glo
bal p
rodu
ctio
n2%
7.2%
(sh
eep)
0.05
%na
0.02
%e
nana
% o
f glo
bal t
rade
28%
51.4
% (
shee
p)1.
1%na
0.25
-0.4
5%e
nana
Key
feat
ures
Qua
lity
play
s a
maj
orro
le in
mai
ntai
ning
&in
crea
sing
mar
ket
shar
e
Rap
id in
crea
se in
grow
th (
35%
in 5
year
s to
200
0)
Rap
id d
ecre
ase
inse
ctor
ove
r pa
st 8
year
s: 4
mill
ion
beef
/she
ep u
nits
disp
lace
d by
1,6
92da
iry c
onve
rsio
ns;
340,
000
ha (
2.5%
)sh
eep/
beef
farm
land
conv
erte
d to
fore
stry
Pou
ltry
alm
ost a
lllo
cally
con
sum
ed
Pin
us r
adia
ta g
row
nin
sho
rt r
otat
ions
(25
-30
yea
rs)
vs 5
0-10
0ye
ars
over
seas
; hig
hyi
elds
For
ests
cov
er 3
0% o
fN
Z’s
land
are
a,im
plic
atio
ns fo
r K
yoto
Pro
toco
l
Sm
all f
irm s
izes
aver
age
2-8
FT
E’s
f
Hig
h gr
owth
rat
e,ur
ban
spac
e tr
eble
din
30
yrs
85%
of p
opul
atio
nliv
e in
urb
an a
reas
Urb
an s
praw
l,m
ater
ial w
aste
&en
ergy
use
Env
ironm
ent a
sign
ifica
ntco
nsid
erat
ion
invi
sito
r ch
oice
70%
of i
nter
natio
nal
visi
tors
hav
e be
enbe
fore
Impo
rts
of $
31 b
illio
npa
hav
e do
uble
d in
valu
e in
10
year
s
Ove
r ha
lf of
spe
nd is
on m
otor
veh
icle
sale
s &
ser
vici
ng(2
8%)
and
food
sal
es(2
9%)
Fou
r fo
ld in
crea
sein
pas
t dec
ade
Exp
ort e
arni
ngs
may
be
50%
hig
her
with
‘ind
irect
’ex
port
s e.
g.pa
ckag
ing
on o
ther
good
s
Key
: a
= fi
gure
s fo
r 20
01, b
= fi
gure
s fo
r 20
00, e
xcep
t exp
orts
200
1, c
= p
lant
atio
n fo
rest
s, d
= in
tern
atio
nal a
s a
% o
f tot
al to
uris
ts, e
= in
tern
atio
nal v
isito
rs, f
= fu
ll-tim
e eq
uiva
lent
s, S
ME
s =
sm
all t
o m
ediu
m-s
ized
ent
erpr
ises
,na
= n
ot a
vaila
ble
or n
ot a
pplic
able
. See
sec
tor
chap
ters
for
sour
ces)
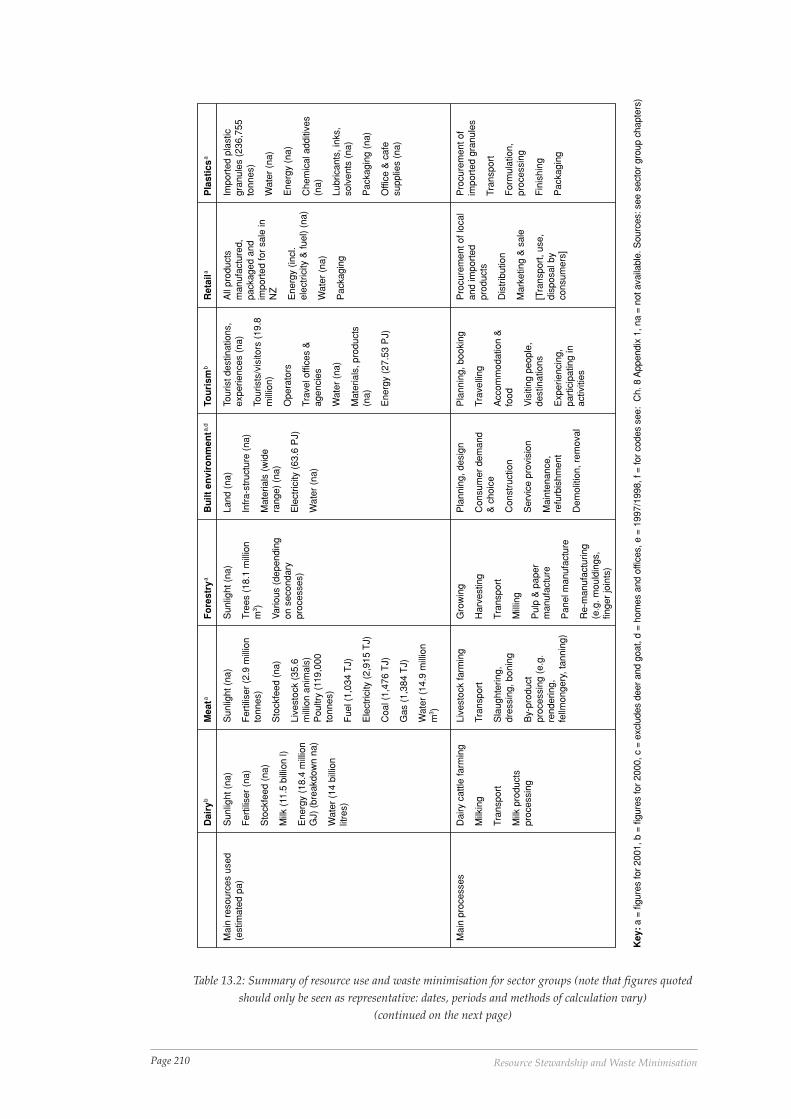
Page 210 Resource Stewardship and Waste Minimisation
Table 13.2: Summary of resource use and waste minimisation for sector groups (note that figures quotedshould only be seen as representative: dates, periods and methods of calculation vary)
(continued on the next page)
Key
: a =
figu
res
for
2001
, b =
figu
res
for
2000
, c =
exc
lude
s de
er a
nd g
oat,
d =
hom
es a
nd o
ffice
s, e
= 1
997/
1998
, f =
for
code
s se
e: C
h. 8
App
endi
x 1,
na
= no
t ava
ilabl
e. S
ourc
es: s
ee s
ecto
r gr
oup
chap
ters
)
Dai
ryb
Mea
taF
ore
stry
aB
uilt
en
viro
nm
enta,
dTo
uri
smb
Ret
aila
Pla
stic
sa
Mai
n re
sour
ces
used
(est
imat
ed p
a)S
unlig
ht (
na)
Fer
tilis
er (
na)
Sto
ckfe
ed (
na)
Milk
(11
.5 b
illio
n l)
Ene
rgy
(18.
4m
illio
nG
J) (
brea
kdow
n na
)
Wat
er (
14 b
illio
nlit
res)
Sun
light
(na
)
Fer
tilis
er (
2.9
mill
ion
tonn
es)
Sto
ckfe
ed (
na)
Live
stoc
k (3
5.6
mill
ion
anim
als)
Pou
ltry
(119
,000
tonn
es)
Fue
l (1,
034
TJ)
Ele
ctric
ity (
2,91
5 T
J)
Coa
l (1,
476
TJ)
Gas
(1,
384
TJ)
Wat
er (
14.9
mill
ion
m3 )
Sun
light
(na
)
Tree
s (1
8.1
mill
ion
m3 )
Var
ious
(de
pend
ing
on s
econ
dary
proc
esse
s)
Land
(na
)
Infr
a-st
ruct
ure
(na)
Mat
eria
ls (
wid
era
nge)
(na
)
Ele
ctric
ity (
63.6
PJ)
Wat
er (
na)
Tour
ist d
estin
atio
ns,
expe
rienc
es (
na)
Tour
ists
/vis
itors
(19
.8m
illio
n)
Ope
rato
rs
Trav
el o
ffice
s &
agen
cies
Wat
er (
na)
Mat
eria
ls, p
rodu
cts
(na)
Ene
rgy
(27.
53 P
J)
All
prod
ucts
man
ufac
ture
d,pa
ckag
ed a
ndim
port
ed fo
r sa
le in
NZ
Ene
rgy
(incl
.el
ectr
icity
& fu
el)
(na)
Wat
er (
na)
Pac
kagi
ng
Impo
rted
pla
stic
gran
ules
(23
6,75
5to
nnes
)
Wat
er (
na)
Ene
rgy
(na)
Che
mic
al a
dditi
ves
(na)
Lubr
ican
ts, i
nks,
solv
ents
(na
)
Pac
kagi
ng (
na)
Offi
ce &
caf
esu
pplie
s (n
a)
Mai
n pr
oces
ses
Dai
ry c
attle
farm
ing
Milk
ing
Tran
spor
t
Milk
pro
duct
spr
oces
sing
Live
stoc
k fa
rmin
g
Tran
spor
t
Sla
ught
erin
g,dr
essi
ng, b
onin
g
By-
prod
uct
proc
essi
ng (
e.g.
rend
erin
g,fe
llmon
gery
, tan
ning
)
Gro
win
g
Har
vest
ing
Tran
spor
t
Mill
ing
Pul
p &
pap
erm
anuf
actu
re
Pan
el m
anuf
actu
re
Re-
man
ufac
turin
g(e
.g. m
ould
ings
,fin
ger
join
ts)
Pla
nnin
g, d
esig
n
Con
sum
er d
eman
d&
cho
ice
Con
stru
ctio
n
Ser
vice
pro
visi
on
Mai
nten
ance
,re
furb
ishm
ent
Dem
oliti
on, r
emov
al
Pla
nnin
g, b
ooki
ng
Trav
ellin
g
Acc
omm
odat
ion
&fo
od
Vis
iting
peo
ple,
dest
inat
ions
Exp
erie
ncin
g,pa
rtic
ipat
ing
inac
tiviti
es
Pro
cure
men
t of l
ocal
and
impo
rted
prod
ucts
Dis
trib
utio
n
Mar
ketin
g &
sal
e
[Tra
nspo
rt, u
se,
disp
osal
by
cons
umer
s]
Pro
cure
men
t of
impo
rted
gra
nule
s
Tran
spor
t
For
mul
atio
n,pr
oces
sing
Fin
ishi
ng
Pac
kagi
ng
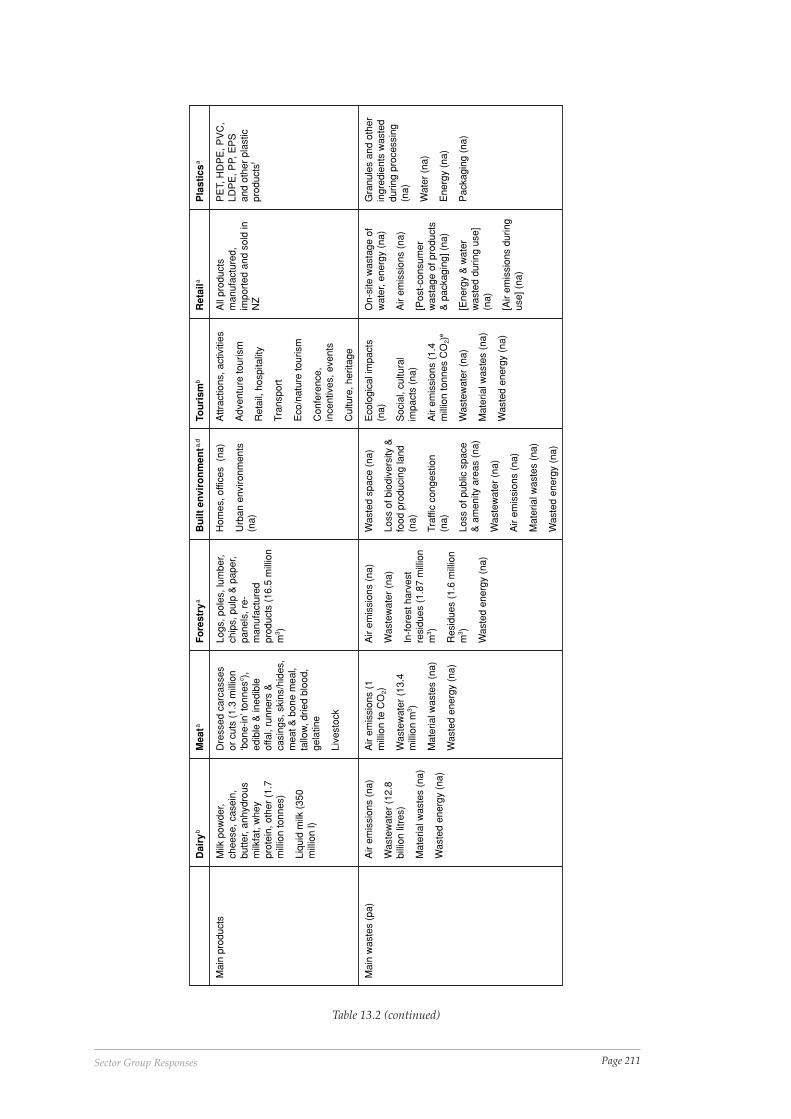
Page 211Sector Group Responses
Table 13.2 (continued)
Dai
ryb
Mea
taF
ore
stry
aB
uilt
en
viro
nm
enta,
dTo
uri
smb
Ret
aila
Pla
stic
sa
Mai
n pr
oduc
tsM
ilk p
owde
r,ch
eese
, cas
ein,
butte
r, an
hydr
ous
milk
fat,
whe
ypr
otei
n, o
ther
(1.
7m
illio
n to
nnes
)
Liqu
id m
ilk (
350
mill
ion
l)
Dre
ssed
car
cass
esor
cut
s (1
.3 m
illio
n‘b
one-
in’ t
onne
sc ),ed
ible
& in
edib
leof
fal,
runn
ers
&ca
sing
s, s
kins
/hid
es,
mea
t & b
one
mea
l,ta
llow
, drie
d bl
ood,
gela
tine
Live
stoc
k
Logs
, pol
es, l
umbe
r,ch
ips,
pul
p &
pap
er,
pane
ls, r
e-m
anuf
actu
red
prod
ucts
(16
.5 m
illio
nm
3 )
Hom
es, o
ffice
s (
na)
Urb
an e
nviro
nmen
ts(n
a)
Attr
actio
ns, a
ctiv
ities
Adv
entu
re to
uris
m
Ret
ail,
hosp
italit
y
Tran
spor
t
Eco
/nat
ure
tour
ism
Con
fere
nce,
ince
ntiv
es, e
vent
s
Cul
ture
, her
itage
All
prod
ucts
man
ufac
ture
d,im
port
ed a
nd s
old
inN
Z
PE
T, H
DP
E, P
VC
,LD
PE
, PP,
EP
San
d ot
her
plas
ticpr
oduc
tsf
Mai
n w
aste
s (p
a)A
ir em
issi
ons
(na)
Was
tew
ater
(12
.8bi
llion
litr
es)
Mat
eria
l was
tes
(na)
Was
ted
ener
gy (
na)
Air
emis
sion
s (1
mill
ion
te C
O2)
Was
tew
ater
(13
.4m
illio
n m
3 )
Mat
eria
l was
tes
(na)
Was
ted
ener
gy (
na)
Air
emis
sion
s (n
a)
Was
tew
ater
(na
)
In-f
ores
t har
vest
resi
dues
(1.
87 m
illio
nm
3 )
Res
idue
s (1
.6 m
illio
nm
3 )
Was
ted
ener
gy (
na)
Was
ted
spac
e (n
a)
Loss
of b
iodi
vers
ity &
food
pro
duci
ng la
nd(n
a)
Traf
fic c
onge
stio
n(n
a)
Loss
of p
ublic
spa
ce&
am
enity
are
as (
na)
Was
tew
ater
(na
)
Air
emis
sion
s (n
a)
Mat
eria
l was
tes
(na)
Was
ted
ener
gy (
na)
Eco
logi
cal i
mpa
cts
(na)
Soc
ial,
cultu
ral
impa
cts
(na)
Air
emis
sion
s (1
.4m
illio
n to
nnes
CO
2)e
Was
tew
ater
(na
)
Mat
eria
l was
tes
(na)
Was
ted
ener
gy (
na)
On-
site
was
tage
of
wat
er, e
nerg
y (n
a)
Air
emis
sion
s (n
a)
[Pos
t-co
nsum
erw
asta
ge o
f pro
duct
s&
pac
kagi
ng] (
na)
[Ene
rgy
& w
ater
was
ted
durin
g us
e](n
a)
[Air
emis
sion
s du
ring
use]
(na
)
Gra
nule
s an
d ot
her
ingr
edie
nts
was
ted
durin
g pr
oces
sing
(na)
Wat
er (
na)
Ene
rgy
(na)
Pac
kagi
ng (
na)
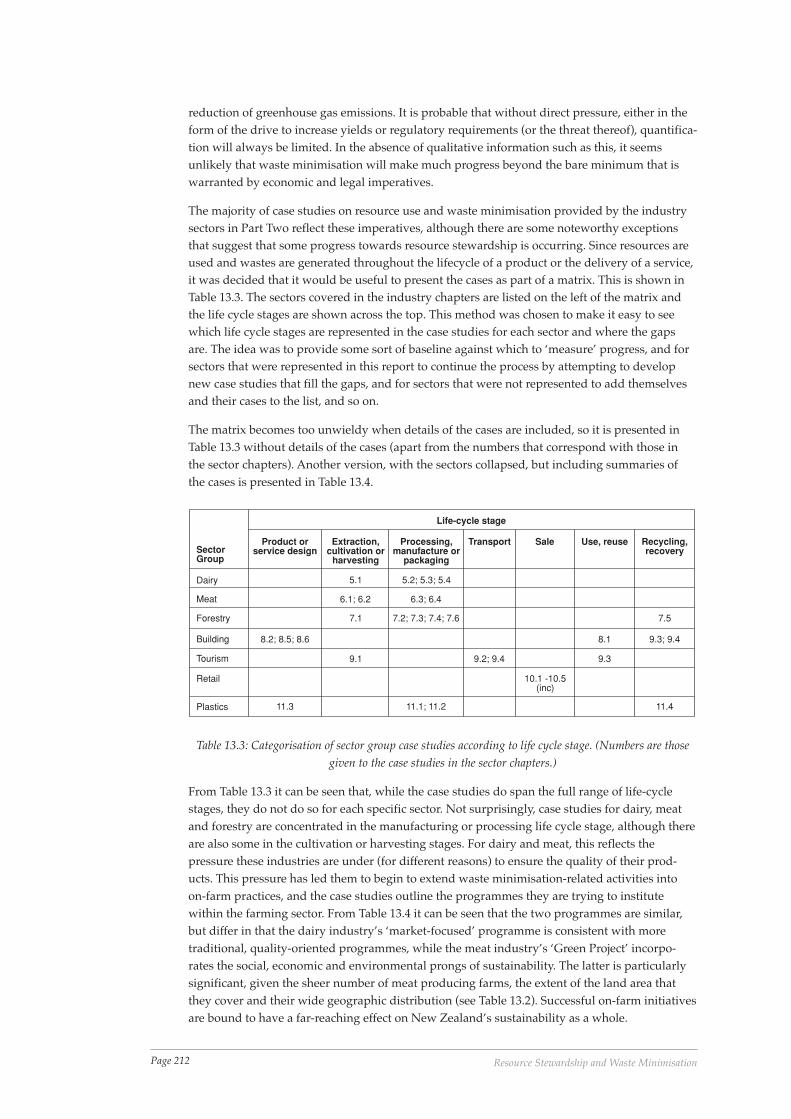
Page 212 Resource Stewardship and Waste Minimisation
reduction of greenhouse gas emissions. It is probable that without direct pressure, either in theform of the drive to increase yields or regulatory requirements (or the threat thereof), quantifica-tion will always be limited. In the absence of qualitative information such as this, it seemsunlikely that waste minimisation will make much progress beyond the bare minimum that iswarranted by economic and legal imperatives.
The majority of case studies on resource use and waste minimisation provided by the industrysectors in Part Two reflect these imperatives, although there are some noteworthy exceptionsthat suggest that some progress towards resource stewardship is occurring. Since resources areused and wastes are generated throughout the lifecycle of a product or the delivery of a service,it was decided that it would be useful to present the cases as part of a matrix. This is shown inTable 13.3. The sectors covered in the industry chapters are listed on the left of the matrix andthe life cycle stages are shown across the top. This method was chosen to make it easy to seewhich life cycle stages are represented in the case studies for each sector and where the gapsare. The idea was to provide some sort of baseline against which to ‘measure’ progress, and forsectors that were represented in this report to continue the process by attempting to developnew case studies that fill the gaps, and for sectors that were not represented to add themselvesand their cases to the list, and so on.
The matrix becomes too unwieldy when details of the cases are included, so it is presented inTable 13.3 without details of the cases (apart from the numbers that correspond with those inthe sector chapters). Another version, with the sectors collapsed, but including summaries ofthe cases is presented in Table 13.4.
SectorGroup
Dairy
Meat
Forestry
Building
Tourism
Retail
Plastics
Product orservice design
Extraction,cultivation or
harvesting
Processing,manufacture or
packaging
Transport Sale Use, reuse Recycling,recovery
Life-cycle stage
8.2; 8.5; 8.6
11.3
5.1
6.1; 6.2
7.1
9.1
5.2; 5.3; 5.4
6.3; 6.4
7.2; 7.3; 7.4; 7.6
11.1; 11.2
9.2; 9.4
10.1 -10.5(inc)
8.1
9.3
9.3; 9.4
7.5
11.4
Table 13.3: Categorisation of sector group case studies according to life cycle stage. (Numbers are thosegiven to the case studies in the sector chapters.)
From Table 13.3 it can be seen that, while the case studies do span the full range of life-cyclestages, they do not do so for each specific sector. Not surprisingly, case studies for dairy, meatand forestry are concentrated in the manufacturing or processing life cycle stage, although thereare also some in the cultivation or harvesting stages. For dairy and meat, this reflects thepressure these industries are under (for different reasons) to ensure the quality of their prod-ucts. This pressure has led them to begin to extend waste minimisation-related activities intoon-farm practices, and the case studies outline the programmes they are trying to institutewithin the farming sector. From Table 13.4 it can be seen that the two programmes are similar,but differ in that the dairy industry’s ‘market-focused’ programme is consistent with moretraditional, quality-oriented programmes, while the meat industry’s ‘Green Project’ incorpo-rates the social, economic and environmental prongs of sustainability. The latter is particularlysignificant, given the sheer number of meat producing farms, the extent of the land area thatthey cover and their wide geographic distribution (see Table 13.2). Successful on-farm initiativesare bound to have a far-reaching effect on New Zealand’s sustainability as a whole.
Page 213Sector Group Responses
The similarities (and differences) between the two programmes raise the issue of integrationand co-ordination. Since they both deal with on-farm issues and are trying to extend responsi-bility down the supply chain, it seems logical to suggest that perhaps they should be combinedinto one specification for all farms. It is important when considering this to remember theresults of previous research, which strongly suggest that programmes are likely to be moreeffective if they are customised according to the activities, needs and culture of the particularorganisation or group they are targeting. While it may be useful to integrate the two pro-grammes, it is important to ensure that they resonate with their target audiences. .
Like dairy, in-forest programmes in the forestry industry appear to be driven more by the desireto enhance yield than by sustainability imperatives (see Table 13.5). However, their value interms of extending responsibility for resources along the supply chain cannot be under-esti-mated.
The case studies presented in the built environment chapter (Chapter 8) that showcase urbanand building design provide further examples of how responsibility can be extended. Tradition-ally, case studies in this sector have focused on the wastes that are generated in the constructionand generation phases. While these are included, the cases also show how urban design canreduce the use of land as a resource, and how building design can reduce the use of not onlyenergy, but also other resources.
The case studies presented in the tourism sector chapter (Chapter 9) also extend across abroader range of life cycle stages including cultivation and harvesting, and transport. They arecharacterised by a high level of resource recovery-types of activities, although the vineyardexample does include the principles of sustainable land management, and the tour operatorincludes optimised fuel consumption.
The cases for the retail sector (Chapter 10), while significant in that they exist at all, are the leastextensive. This is not really surprising, given that initiatives to encourage waste minimisation inthis sector are relatively recent. There appears within this sector to be a strong focus on on-siteresource efficiency (energy) and off-site recovery (separation of materials for recycling). How-ever, the cases also show how supply chain management can be used to reduce the level ofwaste that is generated not only in the supply for sale, but also to enhance the potential for post-consumer recovery and recycling. This sector is a real lynchpin in the battle to make productionand consumption sustainable. This is because it operates at the interface between producers andconsumers, and therefore has the potential to greatly influence both. The cases suggest that,while some effort is being put into supply chain management, the imperatives are largelylimited to the sites themselves. Without customer pressure and demands for more environmen-tally sustainable products, the sector as a whole seems a long way from making a meaningfulcontribution to resource stewardship.
While one of the plastics case studies (Chapter 11) focuses on on-site recovery, the other twosuggest that the industry is having to come to grips with the difficult issues that arise from theneed to re-think and re-design products. While the industry puts much effort into trying toconvince the public that pressure on it is unwarranted, it could be argued that this pressure isprobably responsible for the results that the industry has already had (e.g. in product re-design)and what now appears to be developing into a genuine interest in becoming more sustainable.Of course, the real challenge for the sector lies in the non-renewable nature of its feedstock andit is this aspect that needs to become the focus of design efforts.
13.4 Resource Stewardship within the Industry SectorsThe extent to which resource stewardship is (or isn’t) occurring, and the obstacles to, andopportunities for, enhancing the contribution of waste minimisation are summarised in Table13.5. From Table 13.5, it can be seen that yield improvement is still a major area of focus for the

Page 214 Resource Stewardship and Waste Minimisation
Table 13.4: Summaries of case studies for each life-cycle stage (case studies are identified bythe numbers used in the sector chapters)
Pro
du
ct o
r se
rvic
ed
esig
nE
xtra
ctio
n,
cult
i-va
tio
n o
rh
arve
stin
g
Pro
cess
ing
, man
ufa
ctu
re o
r p
acka
gin
Tran
spo
rtS
ale
Use
, re-
use
Rec
yclin
g,
reco
very
Bui
ldin
g 5.
2M
arae
re-d
evel
opm
ent f
orm
ixed
, com
mun
ity-
focu
sed
activ
ities
with
pas
sive
sol
arde
sign
, ren
ewab
leen
ergy
, rai
nwat
erco
llect
ion,
re-
used
&re
cycl
ed m
ater
ials
Bui
ldin
g 5.
5In
tegr
atio
n of
ener
gy e
ffici
ency
into
bui
ldin
g de
sign
redu
ces
ener
gy u
sein
hea
ting,
vent
ilatio
n &
ligh
ting
Bui
ldin
g 5.
6 E
nerg
yef
ficie
ncy
com
bine
dw
ith e
nviro
nmen
tal
desi
gnco
nsid
erat
ions
for
mat
eria
l & w
ater
reso
urce
use
, air
qual
ity, h
ealth
&ec
onom
ics
for
a an
‘eco
-frie
ndly
’ hom
e
Pla
stic
s 8.
3S
take
hold
er w
orki
ngpa
rty
form
ed to
deve
lop
alte
rnat
ive
solu
tions
to fa
rmpl
astic
was
te;
appl
icat
ions
for
fund
ing
for
stud
y to
assi
st; r
aise
daw
aren
ess
ofst
ewar
dshi
p is
sues
Dai
ry 2
.1M
arke
t-fo
cuse
d on
-far
men
viro
nmen
tal a
ndan
imal
wel
fare
man
agem
ent
syst
em fo
r da
iryfa
rms
Mea
t 3.1
Gre
enpr
ojec
tsu
stai
nabi
lity
spec
ifica
tion
for
shee
p, b
eef,
deer
and
goat
farm
s
Mea
t 3.2
Far
mE
nviro
nmen
t Aw
ard
enco
urag
es a
ndde
mon
stra
tes
sust
aina
ble
prac
tices
For
estr
y 4.
1R
ecov
ery
of in
-for
est
harv
estin
g re
sidu
es,
proc
essi
ng fo
r by
-pr
oduc
t man
ufac
ture
enha
nces
fore
styi
eld
Tour
ism
6.1
Mat
eria
ls s
epar
ated
for
recy
clin
g;re
duce
d w
ater
use
&re
cove
r fo
r re
-use
;tr
ickl
e fe
ed ir
rigat
ion
& m
ulch
ing
Dai
ry 2
.2 M
ilk p
owde
r re
cove
ry r
educ
es a
irem
issi
ons,
ena
bles
feed
stoc
k pr
oduc
tion
Dai
ry 2
.3 M
inim
isin
g w
ater
use
; pro
cess
wat
erre
cove
ry &
reu
se, r
educ
es w
ater
use
and
was
tew
ater
in p
roce
ssin
g pl
ants
Dai
ry 2
.4 W
hey
com
pone
nt is
olat
ion
& e
xtra
ctio
nre
duce
s to
alm
ost z
ero
whe
y di
scha
rges
to w
ater
,pr
oduc
es h
igh
valu
e &
qua
lity
prod
ucts
Mea
t 3.3
Sup
er h
eate
d st
eam
dry
er r
educ
esen
ergy
use
and
wat
er lo
sses
in b
one
& m
eal
dryi
ng
Mea
t 3.4
Tea
m in
volv
emen
t in
rend
erin
g pr
oces
sim
prov
emen
ts, i
ncre
ases
yie
ld, r
educ
es e
fflue
nt,
impr
oves
mor
ale
For
estr
y 4.
2 S
aw s
ubst
itutio
n, s
ettin
g sy
stem
for
optim
isin
g cu
ts, m
axim
ises
vol
ume
of w
ood
reco
vere
d fr
om lo
g, r
educ
es s
awdu
st a
nd w
ood
was
te
For
estr
y 4.
3 C
ontin
uous
impr
ovem
ent o
f res
ourc
em
anag
emen
t, &
fibr
e re
cove
ry &
ret
urn
to p
rodu
cts
min
imis
es w
asta
ge. S
ludg
e re
cove
ry fr
omtr
eatm
ent p
lant
for
boile
r re
duce
s fu
el u
se
For
estr
y 4.
4 E
nviro
nmen
tal p
olic
y-dr
iven
com
mitm
ent t
o co
ntin
uous
impr
ovem
ent;
reso
urce
effic
ienc
y- a
nd w
aste
min
imis
atio
n pr
inci
ples
,tr
aini
ng &
eva
luat
ion
For
estr
y 4.
6 S
awm
ill r
esid
ues
used
as
fuel
for
co-
gene
ratio
n fa
cilit
y pr
oduc
ing
elec
tric
ity a
nd h
eat f
orki
ln d
ryin
g
Pla
stic
s 8.
1 S
choo
l stu
dent
s he
lp to
mea
sure
&id
entif
y w
aste
red
uctio
n, r
euse
rec
yclin
gop
port
uniti
es; c
omm
itmen
t & e
mpl
oyee
invo
lvem
ent m
axim
ise
succ
ess;
des
ign
solu
tions
bein
g so
ught
Pla
stic
s 8.
2 V
olun
tary
agr
eem
ent w
ith in
dust
ryid
entif
ied
prob
lem
pac
kagi
ng; s
olut
ions
sou
ght i
nco
njun
ctio
n w
ith in
dust
ry
Tour
ism
6.2
Mat
eria
ls s
epar
ated
for
recy
clin
g; w
ater
& e
nerg
y us
em
easu
red;
bus
esse
rvic
ed to
opt
imis
efu
el c
onsu
mpt
ion
Tour
ism
6.4
Bul
kbu
ying
to r
educ
epa
ckag
ing;
com
pany
-wid
e fo
cus
on r
educ
ing,
reu
se &
recy
clin
g;ac
cept
ance
of
resp
onsi
bilit
y
Ret
ail 7
.1P
rocu
rem
ent p
olic
yto
sup
ply
for
sale
only
sus
tain
able
fore
st p
rodu
cts
Ret
ail 7
.2 L
iais
onw
ith s
uppl
iers
tore
duce
pac
king
,pa
ckag
ing
in r
etai
lgo
ods;
sta
ffin
volv
emen
t in
sepa
ratio
n fo
rre
cycl
ing
of in
-sto
rew
aste
s
Ret
ail 7
.3 R
efit
switc
h to
ene
rgy
effic
ient
ligh
ting
Ret
ail 7
.4 E
nerg
ym
anag
emen
t tea
m;
impr
oved
mon
itorin
g&
con
trol
; red
uced
ener
gy c
onsu
mpt
ion
in h
eatin
g,ve
ntila
tion
& li
ghtin
g
Ret
ail 7
.5 P
roce
ssm
appi
ng; e
nerg
yre
cove
ry a
nd r
euse
in r
efrig
erat
ion;
use
of ‘e
nviro
nmen
tally
frie
ndly
’ ref
riger
ants
Bui
ldin
g 5.
1 M
ediu
mde
nsity
, mix
ed u
sede
velo
pmen
t on
urba
n he
ritag
e si
tem
axim
ises
urb
ansp
ace
re-u
tilis
atio
n,re
duce
s ur
ban
spra
wl
Tour
ism
6.3
Pro
duct
choi
ces
redu
cepa
ckag
ing
was
teco
min
g on
to s
ite;
reus
e, r
ecyc
ling
ethi
c en
cour
aged
;st
aff m
embe
r m
ade
resp
onsi
ble
was
tem
inim
isat
ion
For
estr
y 4.
5S
awdu
st r
ecov
ery
&us
e fo
r pr
oduc
ing
com
pres
sed
fuel
sour
ce fo
r do
mes
tiche
atin
g re
duce
ssa
wdu
st w
aste
and
reco
vers
ene
rgy
Bui
ldin
g 5.
3 B
uild
ing
deco
nstr
uctio
n by
hand
for
reco
very
and
reus
e of
tim
ber,
bric
ks, r
ubbl
e &
iron
roof
ing
Bui
ldin
g 5.
4S
epar
atio
n fo
rre
cove
ry o
f was
tem
ater
ials
dur
ing
cons
truc
tion
dairy, meat and forestry sectors. However, this focus has led to significant advances in both thedairy and forestry sectors in terms of the reduction of wastes at source, and it is important torecognise the positive effect that these have had on the environmental performance of theseindustries. In the dairy sector, it is likely that strict adherence to comprehensive loss monitoringand loss avoidance programmes (assisted by the unitary nature of the sector and the drive for
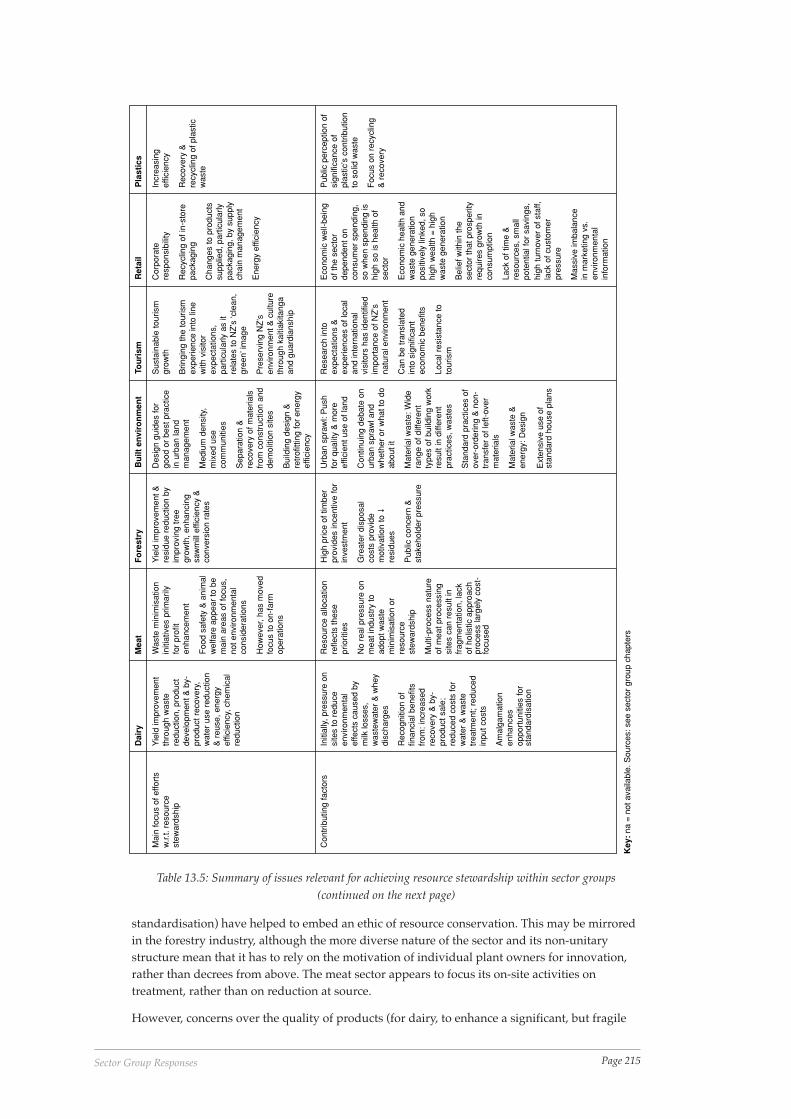
Page 215Sector Group Responses
Table 13.5: Summary of issues relevant for achieving resource stewardship within sector groups(continued on the next page)
Dai
ryM
eat
Fo
rest
ryB
uilt
en
viro
nm
ent
Tou
rism
Ret
ail
Pla
stic
s
Mai
n fo
cus
of e
ffort
sw
.r.t.
reso
urce
stew
ards
hip
Yie
ld im
prov
emen
tth
roug
h w
aste
redu
ctio
n, p
rodu
ctde
velo
pmen
t & b
y-pr
oduc
t rec
over
y,w
ater
use
red
uctio
n&
reu
se, e
nerg
yef
ficie
ncy,
che
mic
alre
duct
ion
Was
te m
inim
isat
ion
initi
ativ
es p
rimar
ilyfo
r pr
ofit
enha
ncem
ent
Foo
d sa
fety
& a
nim
alw
elfa
re a
ppea
r to
be
mai
n ar
eas
of fo
cus,
not e
nviro
nmen
tal
cons
ider
atio
ns
How
ever
, has
mov
edfo
cus
to o
n-fa
rmop
erat
ions
Yie
ld im
prov
emen
t &re
sidu
e re
duct
ion
byim
prov
ing
tree
grow
th, e
nhan
cing
saw
mill
effi
cien
cy &
conv
ersi
on r
ates
Des
ign
guid
es fo
rgo
od o
r be
st p
ract
ice
in u
rban
land
man
agem
ent
Med
ium
den
sity
,m
ixed
use
com
mun
ities
Sep
arat
ion
&re
cove
ry o
f mat
eria
lsfr
om c
onst
ruct
ion
and
dem
oliti
on s
ites
Bui
ldin
g de
sign
&re
trof
ittin
g fo
r en
ergy
effic
ienc
y
Sus
tain
able
tour
ism
grow
th
Brin
ging
the
tour
ism
expe
rienc
e in
to li
new
ith v
isito
rex
pect
atio
ns,
part
icul
arly
as
itre
late
s to
NZ
’s ‘c
lean
,gr
een’
imag
e
Pre
serv
ing
NZ
’sen
viro
nmen
t & c
ultu
reth
roug
hka
itiak
itang
aan
d gu
ardi
ansh
ip
Cor
pora
tere
spon
sibi
lity
Rec
yclin
g of
in-s
tore
pack
agin
g
Cha
nges
to p
rodu
cts
supp
lied,
par
ticul
arly
pack
agin
g, b
y su
pply
chai
n m
anag
emen
t
Ene
rgy
effic
ienc
y
Incr
easi
ngef
ficie
ncy
Rec
over
y &
recy
clin
g of
pla
stic
was
te
Con
trib
utin
g fa
ctor
sIn
itial
ly, p
ress
ure
onsi
tes
to r
educ
een
viro
nmen
tal
effe
cts
caus
ed b
ym
ilk lo
sses
,w
aste
wat
er &
whe
ydi
scha
rges
Rec
ogni
tion
offin
anci
al b
enef
itsfr
om: i
ncre
ased
reco
very
& b
y-pr
oduc
t sal
e;re
duce
d co
sts
for
wat
er &
was
tetr
eatm
ent;
redu
ced
inpu
t cos
ts
Am
alga
mat
ion
enha
nces
oppo
rtun
ities
for
stan
dard
isat
ion
Res
ourc
e al
loca
tion
refle
cts
thes
epr
iorit
ies
No
real
pre
ssur
e on
mea
t ind
ustr
y to
adop
t was
tem
inim
isat
ion
orre
sour
cest
ewar
dshi
p
Mul
ti-pr
oces
s na
ture
of m
eat p
roce
ssin
gsi
tes
can
resu
lt in
frag
men
tatio
n, la
ckof
hol
istic
app
roac
hpr
oces
s la
rgel
y co
st-
focu
sed
Hig
h pr
ice
of ti
mbe
rpr
ovid
es in
cent
ive
for
inve
stm
ent
Gre
ater
dis
posa
lco
sts
prov
ide
mot
ivat
ion
to�
resi
dues
Pub
lic c
once
rn &
stak
ehol
der
pres
sure
Urb
an s
praw
l: P
ush
for
qual
ity &
mor
eef
ficie
nt u
se o
f lan
d
Con
tinui
ng d
ebat
e on
urba
n sp
raw
l and
whe
ther
or
wha
t to
doab
out i
t
Mat
eria
l was
te: W
ide
rang
e of
diff
eren
tty
pes
of b
uild
ing
wor
kre
sult
in d
iffer
ent
prac
tices
, was
tes
Sta
ndar
d pr
actic
es o
fov
er-o
rder
ing
& n
on-
tran
sfer
of l
eft-
over
mat
eria
ls
Mat
eria
l was
te &
ener
gy: D
esig
n
Res
earc
h in
toex
pect
atio
ns &
expe
rienc
es o
f loc
alan
d in
tern
atio
nal
visi
tors
has
iden
tifie
dim
port
ance
of N
Z’s
natu
ral e
nviro
nmen
t
Can
be
tran
slat
edin
to s
igni
fican
tec
onom
ic b
enef
its
Loca
l res
ista
nce
toto
uris
m
Eco
nom
ic w
ell-b
eing
of th
e se
ctor
depe
nden
t on
cons
umer
spe
ndin
g,so
whe
n sp
endi
ng is
high
so
is h
ealth
of
sect
or
Eco
nom
ic h
ealth
and
was
te g
ener
atio
npo
sitiv
ely
linke
d, s
ohi
gh w
ealth
= h
igh
was
te g
ener
atio
n
Bel
ief w
ithin
the
sect
or th
at p
rosp
erity
requ
ires
grow
th in
cons
umpt
ion
Lack
of t
ime
&re
sour
ces,
sm
all
pote
ntia
l for
sav
ings
,
Pub
lic p
erce
ptio
n of
sign
ifica
nce
ofpl
astic
’s c
ontr
ibut
ion
to s
olid
was
te
Foc
us o
n re
cycl
ing
& r
ecov
ery
Key
: na
= n
ot a
vaila
ble.
Sou
rces
: see
sec
tor
grou
p ch
apte
rs
Ext
ensi
ve u
se o
fst
anda
rd h
ouse
pla
ns
info
rmat
ion
high
turn
over
of s
taff,
lack
of c
usto
mer
pres
sure
Mas
sive
imba
lanc
ein
mar
ketin
g vs
.en
viro
nmen
tal
standardisation) have helped to embed an ethic of resource conservation. This may be mirroredin the forestry industry, although the more diverse nature of the sector and its non-unitarystructure mean that it has to rely on the motivation of individual plant owners for innovation,rather than decrees from above. The meat sector appears to focus its on-site activities ontreatment, rather than on reduction at source.
However, concerns over the quality of products (for dairy, to enhance a significant, but fragile
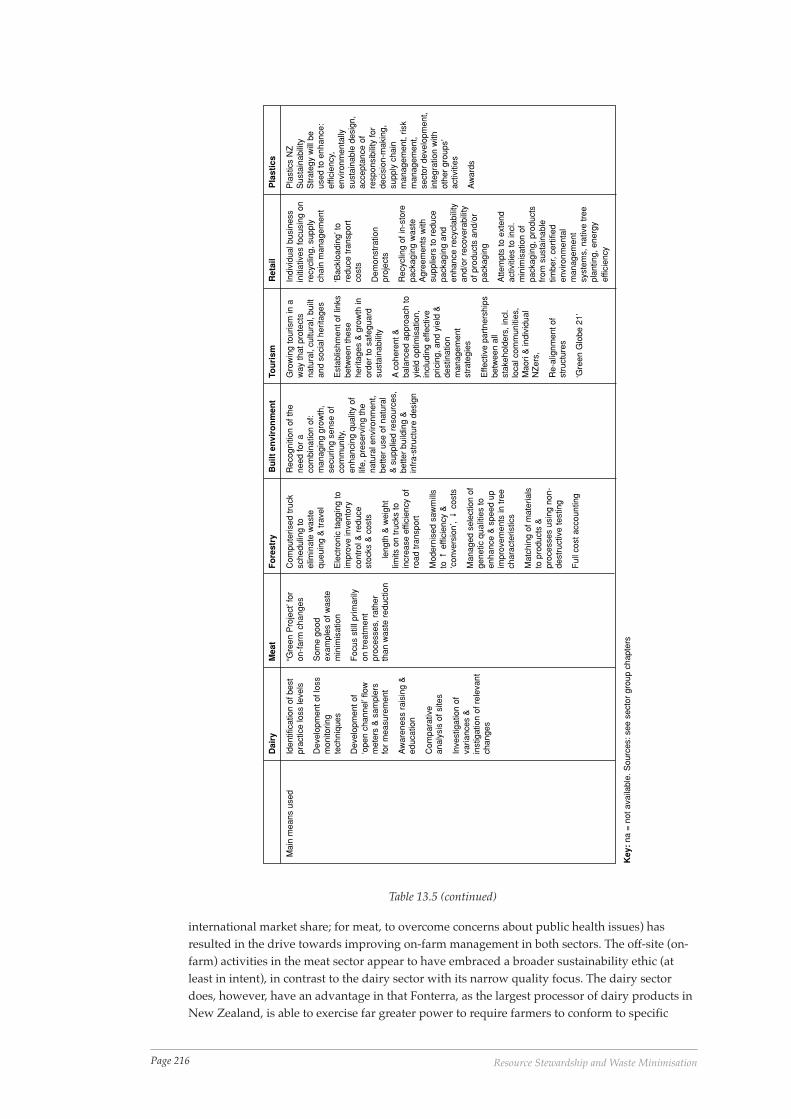
Page 216 Resource Stewardship and Waste Minimisation
Table 13.5 (continued)
Dai
ryM
eat
Fo
rest
ryB
uilt
en
viro
nm
ent
Tou
rism
Ret
ail
Pla
stic
s
Key
: na
= n
ot a
vaila
ble.
Sou
rces
: see
sec
tor
grou
p ch
apte
rs
effic
ienc
y
Mai
n m
eans
use
dId
entif
icat
ion
of b
est
prac
tice
loss
leve
ls
Dev
elop
men
t of l
oss
mon
itorin
gte
chni
ques
Dev
elop
men
t of
‘ope
n ch
anne
l’ flo
wm
eter
s &
sam
pler
sfo
r m
easu
rem
ent
Aw
aren
ess
rais
ing
&ed
ucat
ion
Com
para
tive
anal
ysis
of s
ites
Inve
stig
atio
n of
varia
nces
&in
stig
atio
n of
rel
evan
tch
ange
s
“Gre
en P
roje
ct’ f
oron
-far
m c
hang
es
Som
e go
odex
ampl
es o
f was
tem
inim
isat
ion
Foc
us s
till p
rimar
ilyon
trea
tmen
tpr
oces
ses,
rat
her
than
was
te r
educ
tion
Com
pute
rised
truc
ksc
hedu
ling
toel
imin
ate
was
tequ
euin
g &
trav
el
Ele
ctro
nic
tagg
ing
toim
prov
e in
vent
ory
cont
rol &
red
uce
stoc
ks &
cos
ts
leng
th &
wei
ght
limits
on
truc
ks to
incr
ease
effi
cien
cy o
fro
ad tr
ansp
ort
Mod
erni
sed
saw
mill
sto
� e
ffici
ency
&‘c
onve
rsio
n’,�
cos
ts
Man
aged
sel
ectio
n of
gene
tic q
ualit
ies
toen
hanc
e &
spe
ed u
pim
prov
emen
ts in
tree
char
acte
ristic
s
Mat
chin
g of
mat
eria
lsto
pro
duct
s &
proc
esse
s us
ing
non-
dest
ruct
ive
test
ing
Ful
l cos
t acc
ount
ing
Rec
ogni
tion
of th
ene
ed fo
r a
com
bina
tion
of:
man
agin
g gr
owth
,se
curin
g se
nse
ofco
mm
unity
,en
hanc
ing
qual
ity o
flif
e, p
rese
rvin
g th
ena
tura
l env
ironm
ent,
bette
r us
e of
nat
ural
& s
uppl
ied
reso
urce
s,be
tter
build
ing
&in
fra-
stru
ctur
e de
sign
Gro
win
g to
uris
m in
aw
ay th
at p
rote
cts
natu
ral,
cultu
ral,
built
and
soci
al h
erita
ges
Est
ablis
hmen
t of l
inks
betw
een
thes
ehe
ritag
es &
gro
wth
inor
der
to s
afeg
uard
sust
aina
bilit
y
A c
oher
ent &
bala
nced
app
roac
h to
yiel
d op
timis
atio
n,in
clud
ing
effe
ctiv
epr
icin
g, a
nd y
ield
&de
stin
atio
nm
anag
emen
tst
rate
gies
Effe
ctiv
e pa
rtne
rshi
psbe
twee
n al
lst
akeh
olde
rs, i
ncl.
loca
l com
mun
ities
,M
aori
& in
divi
dual
NZ
ers,
Re-
alig
nmen
t of
stru
ctur
es
‘Gre
en G
lobe
21’
Indi
vidu
al b
usin
ess
initi
ativ
es fo
cusi
ng o
nre
cycl
ing,
sup
ply
chai
n m
anag
emen
t
‘Bac
kloa
ding
’ to
redu
ce tr
ansp
ort
cost
s
Dem
onst
ratio
npr
ojec
ts
Rec
yclin
g of
in-s
tore
pack
agin
g w
aste
Agr
eem
ents
with
supp
liers
to r
educ
epa
ckag
ing
and
enha
nce
recy
clab
ility
and/
or r
ecov
erab
ility
of p
rodu
cts
and/
orpa
ckag
ing
Atte
mpt
s to
ext
end
activ
ities
to in
cl.
min
imis
atio
n of
pack
agin
g, p
rodu
cts
from
sus
tain
able
timbe
r, ce
rtifi
eden
viro
nmen
tal
man
agem
ent
syst
ems,
nat
ive
tree
plan
ting,
ene
rgy
Pla
stic
s N
ZS
usta
inab
ility
Str
ateg
y w
ill b
eus
ed to
enh
ance
:ef
ficie
ncy,
envi
ronm
enta
llysu
stai
nabl
e de
sign
,ac
cept
ance
of
resp
onsi
bilit
y fo
rde
cisi
on-m
akin
g,su
pply
cha
inm
anag
emen
t, ris
km
anag
emen
t,se
ctor
dev
elop
men
t,in
tegr
atio
n w
ithot
her
grou
ps’
activ
ities
Aw
ards
international market share; for meat, to overcome concerns about public health issues) hasresulted in the drive towards improving on-farm management in both sectors. The off-site (on-farm) activities in the meat sector appear to have embraced a broader sustainability ethic (atleast in intent), in contrast to the dairy sector with its narrow quality focus. The dairy sectordoes, however, have an advantage in that Fonterra, as the largest processor of dairy products inNew Zealand, is able to exercise far greater power to require farmers to conform to specific
Page 217Sector Group Responses
environmental standards. Because meat processing plants, on the other hand, are owned by anumber of companies, farmers could (at least in theory) switch processing companies if they feltunduly pressured. The meat sector would have to rely more on voluntary farmer action andgoodwill to extend an ethic of stewardship to on-farm activities.
For forestry, the high value of timber, together with rising waste disposal costs, public concernand stakeholder pressure, has provided an incentive for improving in-forest management andinvesting in sophisticated yield-improving technologies.
The cases for the built environment sector provide perhaps the best examples of resourcestewardship extended beyond just traditional areas of focus. These include urban design,building design and retrofitting, material recovery during construction and dismantling, ratherthan demolishing buildings. However, the authors do point out that these examples by nomeans reflect mainstream practice. There is still much debate on urban sprawl: whether it needsto be curbed and what to do about it. In construction, entrenched practices of over-ordering andnon-transfer of leftover materials hinder progress. In terms of energy efficiency, the buildingdesign process is still largely cost-focused and difficulties are exacerbated by the extensive useof standard house plans. Progress on all these fronts remains hindered by the complex andfragmented nature of the sector.
The tourism sector appears to have a far-reaching vision of sustainability that has the potentialto change the face of the industry in New Zealand. This vision is largely because of the well-documented importance of New Zealand’s environment as an attraction and the need tocounter risks such as local resistance to tourism. The cases presented do not really reflect the fullpotential for the sector, but this may be because the vision and strategy are relatively new, andwork has only recently begun in earnest. The diverse nature of the sector may make it difficultto implement the vision across the board.
The plastics sector, too, has a vision for sustainability that is driven by the public’s perception ofits significance as a source of waste. While the sector appears to be keen to focus on rethinkingand redesigning its products (and presents annual awards to this end), pursuit of a moredesign-oriented approach is believed to be hampered by local government’s predilection forrecycling and recovery programmes.
Initiatives in the retail sector have tended to focus mostly on on-site separation of recycling andsometimes energy efficiency, although there is some consideration of broader issues and thereare attempts to extend activities to include the procurement of more environmentally consider-ate products. These initiatives appear to be few and far between and occurring not in responseto public pressure, but rather in spite of little or no public pressure. They appear to rely almostsolely on a sense of corporate responsibility among a few retailers. It could be argued that thelack of pressure on retailers to provide more environmentally sustainable products has more todo with the massive imbalance in marketing vs. environmental information. Businesses oftenargue that they only supply what consumers want. However, they actively encourage consum-ers to buy products, whether they need them or not. At best, this contradicts an ethic of resourcestewardship and at worst it actively promotes the opposite. Because of its position at the nexusbetween producers and consumers, the retail sector needs to explore, come to grips with andrespond to its role in terms of resource stewardship. For this sector though, probably more thanany other, the close relationship between economic performance and consumption presents amajor difficulty.
13.5 Governance Mechanisms and Drivers for ChangeThe sector chapters in Part Two included sections on governance and drivers for change. Thesection on governance described relevant standards, guidelines and codes of practice that applyto the sector, and the extent to which they contribute to resource use and stewardship. The
Page 218 Resource Stewardship and Waste Minimisation
section on drivers for change provided a summary of other influences on the sector, includingsocial, economic and environmental influences, the key relationships within the sector and howsector or producer/provider responsibility is exercised. Because of the inter-related nature ofgovernance mechanisms and drivers for change, the results are summarised together in thissection and presented in Table 13.6.
In this context, it is important to realise that the Resource Management Act 1991 (RMA), theHealth and Safety in Employment Act 1992 (HSEA), the Local Government Act 1974 (LGA) andthe Hazardous Substances and New Organisms Act 1996 (HSNO) will have affected all sectorsin some way. However, they (and other instruments) have been included in Table 13.6 onlywhen they were specifically identified by chapter authors as directly relevant to waste minimi-sation and resource stewardship in the particular sector. The fact that they may have beenomitted for some sectors does not imply that they are necessarily irrelevant to the sector as awhole, but rather that they have less relevance with regard to the topic in this case.
From Table 13.6 it can be seen that most sector chapter authors identify the RMA as having hadan important influence on the sector. While the RMA does not, in itself, require waste minimisa-tion to be undertaken, the local regulations (plans, etc.) that have resulted from it are likely tohave had a more direct influence. This influence is likely to be greater in sectors that directlydischarge large quantities of wastes and those that require resource consents for existingdischarges, new plants or upgrades. However, it is obvious from the differences in focus for thedairy and meat sectors (reduction at source for dairy and treatment for meat) that the RMA doesnot require waste minimisation in preference to treatment. Only the effects have to be avoided,remedied or mitigated, and applicants are usually free to choose whichever method they preferfor achieving this.
The extent to which the broader ethic of stewardship that is inherent in the RMA has filteredthrough to society and informs the choices sectors make is unknown. The effort that is requiredand the costs that are incurred as a result of the RMA and related instruments (particularly forresource consent applications for large development projects) suggest that the most commonresponse to the RMA in the majority of sectors is more likely to be annoyance than adoption ofan ethic of stewardship.
From Table 13.6 it can be seen that the sectors all have a unique combination of instruments thatinfluence them. Some of the instruments listed are specific to the activities and characteristics ofthe sectors themselves (e.g., the Dairy Industry Environmental and Animal Health Policies, theAnimal Products Act 1999, the Code of Practice for the Safe Use of Timber Preservatives andAntisapstain Chemicals, the New Zealand Building Code, the New Zealand Tourism Strategy,the Consumer Guarantees Act, and The New Zealand Packaging Code of Practice). There is alsoa range of instruments that influence (or have the potential to influence) more than one sector(e.g. the ISO 14000 series of standards, the Kyoto Protocol). Some of these are included in aspeculative sense (i.e. it is presumed they will have some influence the sector – e.g., the NewZealand Waste Strategy, the National Energy Efficiency and Conservation Strategy), whileothers already do so (e.g. the New Zealand Forest Code of Practice, the A/NZ and ISO stan-dards on plastic packaging labelling).
It is necessary to point out here that, without a formal evaluation of the extent of their influence,it is not really possible to say how effective these instruments really are in bringing aboutprogress towards an ethic of resource stewardship. Their influence is also likely to depend onthe way in which they integrate with other instruments, sources of influence and drivers forchange.
Drivers for change tend to fall into four main categories3.
3 Note that these categories are consistent with commonly identified drivers for change in organisations (e.g., seeGoodman, 1995; Johnson and Scholes, 1999; Senior, 2002)
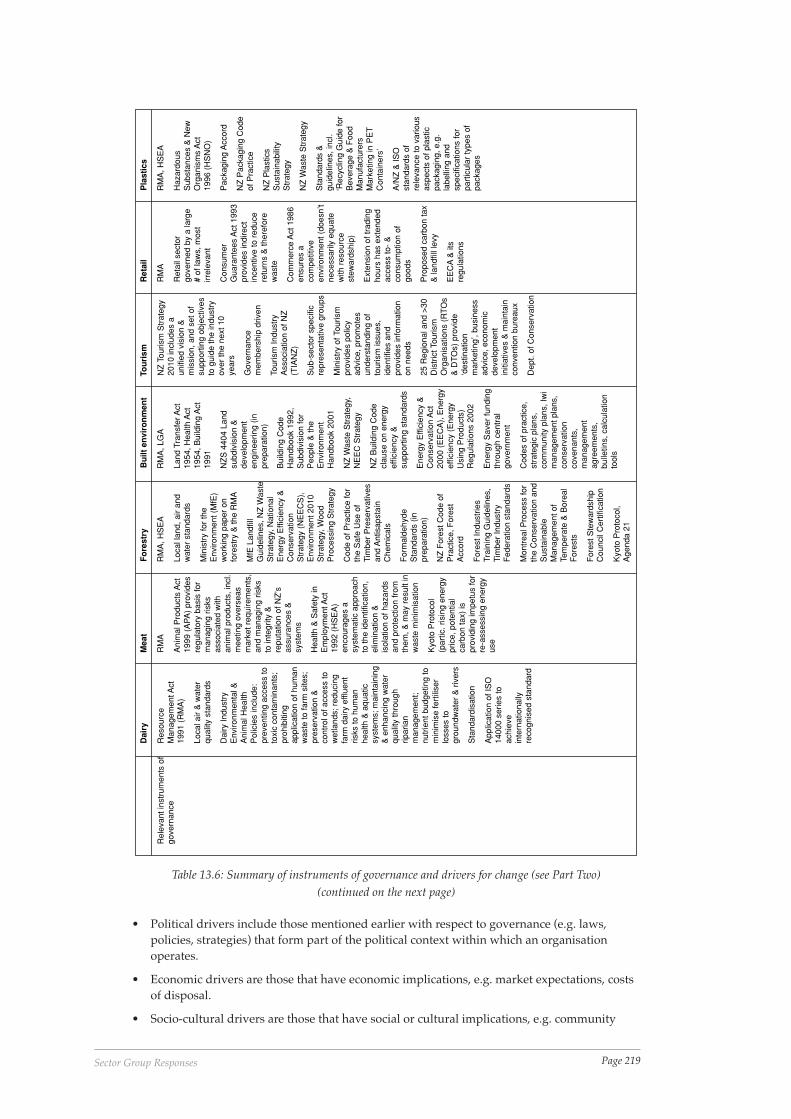
Page 219Sector Group Responses
Table 13.6: Summary of instruments of governance and drivers for change (see Part Two)(continued on the next page)
Dai
ryM
eat
Fo
rest
ryB
uilt
en
viro
nm
ent
Tou
rism
Ret
ail
Pla
stic
s
Rel
evan
t ins
trum
ents
of
gove
rnan
ceR
esou
rce
Man
agem
ent A
ct19
91 (
RM
A)
Loca
l air
& w
ater
qual
ity s
tand
ards
Dai
ry In
dust
ryE
nviro
nmen
tal &
Ani
mal
Hea
lthP
olic
ies
incl
ude:
prev
entin
g ac
cess
toto
xic
cont
amin
ants
;pr
ohib
iting
appl
icat
ion
of h
uman
was
te to
farm
site
s;pr
eser
vatio
n &
cont
rol o
f acc
ess
tow
etla
nds;
red
ucin
gfa
rm d
airy
effl
uent
risks
to h
uman
heal
th &
aqu
atic
syst
ems;
mai
ntai
ning
& e
nhan
cing
wat
erqu
ality
thro
ugh
ripar
ian
man
agem
ent;
nutr
ient
bud
getin
g to
min
imis
e fe
rtili
ser
loss
es to
grou
ndw
ater
& r
iver
s
Sta
ndar
disa
tion
App
licat
ion
of IS
O14
000
serie
s to
achi
eve
inte
rnat
iona
llyre
cogn
ised
sta
ndar
d
RM
A
Ani
mal
Pro
duct
s A
ct19
99 (
AP
A)
prov
ides
regu
lato
ry b
asis
for
man
agin
g ris
ksas
soci
ated
with
anim
al p
rodu
cts,
incl
.m
eetin
g ov
erse
asm
arke
t req
uire
men
ts,
and
man
agin
g ris
ksto
inte
grity
&re
puta
tion
of N
Z’s
assu
ranc
es &
syst
ems
Hea
lth &
Saf
ety
inE
mpl
oym
ent A
ct19
92 (
HS
EA
)en
cour
ages
asy
stem
atic
app
roac
hto
the
iden
tific
atio
n,el
imin
atio
n &
isol
atio
n of
haz
ards
and
prot
ectio
n fr
omth
em, &
may
res
ult i
nw
aste
min
imis
atio
n
Kyo
to P
roto
col
(par
tic. r
isin
g en
ergy
pric
e, p
oten
tial
carb
on ta
x) is
prov
idin
g im
petu
s fo
rre
-ass
essi
ng e
nerg
yus
e
RM
A, H
SE
A
Loca
l lan
d, a
ir an
dw
ater
sta
ndar
ds
Min
istr
y fo
r th
eE
nviro
nmen
t (M
fE)
wor
king
pap
er o
nfo
rest
ry &
the
RM
A
MfE
Lan
dfill
Gui
delin
es, N
Z W
aste
Str
ateg
y, N
atio
nal
Ene
rgy
Effi
cien
cy &
Con
serv
atio
nS
trat
egy
(NE
EC
S),
Env
ironm
ent 2
010
Str
ateg
y, W
ood
Pro
cess
ing
Str
ateg
y
Cod
e of
Pra
ctic
e fo
rth
e S
afe
Use
of
Tim
ber
Pre
serv
ativ
esan
d A
ntis
apst
ain
Che
mic
als
For
mal
dehy
deS
tand
ards
(in
prep
arat
ion)
NZ
For
est C
ode
ofP
ract
ice,
For
est
Acc
ord
For
est I
ndus
trie
sTr
aini
ng G
uide
lines
,Ti
mbe
r In
dust
ryF
eder
atio
n st
anda
rds
Mon
trea
l Pro
cess
for
the
Con
serv
atio
n an
dS
usta
inab
leM
anag
emen
t of
Tem
pera
te &
Bor
eal
For
ests
For
est S
tew
ards
hip
Cou
ncil
Cer
tific
atio
n
Kyo
to P
roto
col,
Age
nda
21
RM
A, L
GA
Land
Tra
nsfe
r Act
1954
, Hea
lth A
ct19
54, B
uild
ing
Act
1991
NZ
S 4
404
Land
subd
ivis
ion
&de
velo
pmen
ten
gine
erin
g (in
prep
arat
ion)
Bui
ldin
g C
ode
Han
dboo
k 19
92,
Sub
divi
sion
for
Peo
ple
& th
eE
nviro
nmen
tH
andb
ook
2001
NZ
Was
te S
trat
egy,
NE
EC
Str
ateg
y
NZ
Bui
ldin
g C
ode
clau
se o
n en
ergy
effic
ienc
y &
supp
ortin
g st
anda
rds
Ene
rgy
Effi
cien
cy &
Con
serv
atio
n A
ct20
00 (
EE
CA
), E
nerg
yef
ficie
ncy
(Ene
rgy
Usi
ng P
rodu
cts)
Reg
ulat
ions
200
2
Ene
rgy
Sav
er fu
ndin
gth
roug
h ce
ntra
lgo
vern
men
t
Cod
es o
f pra
ctic
e,st
rate
gic
plan
s,co
mm
unity
pla
ns,I
wi
man
agem
ent p
lans
,co
nser
vatio
nco
vena
nts,
man
agem
ent
agre
emen
ts,
bulle
tins,
cal
cula
tion
tool
s
NZ
Tou
rism
Str
ateg
y20
10 in
clud
es a
unifi
ed v
isio
n &
mis
sion
, and
set
of
supp
ortin
g ob
ject
ives
to g
uide
the
indu
stry
over
the
next
10
year
s
Gov
erna
nce
mem
bers
hip
driv
en
Tour
ism
Indu
stry
Ass
ocia
tion
of N
Z(T
IAN
Z)
Sub
-sec
tor
spec
ific
repr
esen
tativ
e gr
oups
Min
istr
y of
Tou
rism
prov
ides
pol
icy
advi
ce, p
rom
otes
unde
rsta
ndin
g of
tour
ism
issu
es,
iden
tifie
s an
dpr
ovid
es in
form
atio
non
nee
ds
25 R
egio
nal a
nd >
30D
istr
ict T
ouris
mO
rgan
isat
ions
(R
TO
s&
DT
Os)
pro
vide
‘des
tinat
ion
mar
ketin
g’, b
usin
ess
advi
ce, e
cono
mic
deve
lopm
ent
initi
ativ
es &
mai
ntai
nco
nven
tion
bure
aux
Dep
t. of
Con
serv
atio
n
RM
A
Ret
ail s
ecto
rgo
vern
ed b
y a
larg
e#
of la
ws,
mos
tirr
elev
ant
Con
sum
erG
uara
ntee
s A
ct 1
993
prov
ides
indi
rect
ince
ntiv
e to
red
uce
retu
rns
& th
eref
ore
was
te
Com
mer
ce A
ct 1
986
ensu
res
aco
mpe
titiv
een
viro
nmen
t (do
esn’
tne
cess
arily
equ
ate
with
res
ourc
est
ewar
dshi
p)
Ext
ensi
on o
f tra
ding
hour
s ha
s ex
tend
edac
cess
to-
&co
nsum
ptio
n of
good
s
Pro
pose
d ca
rbon
tax
& la
ndfil
l lev
y
EE
CA
& it
sre
gula
tions
RM
A, H
SE
A
Haz
ardo
usS
ubst
ance
s &
New
Org
anis
ms
Act
1996
(H
SN
O)
Pac
kagi
ng A
ccor
d
NZ
Pac
kagi
ng C
ode
of P
ract
ice
NZ
Pla
stic
sS
usta
inab
ility
Str
ateg
y
NZ
Was
te S
trat
egy
Sta
ndar
ds &
guid
elin
es, i
ncl.
‘Rec
yclin
g G
uide
for
Bev
erag
e &
Foo
dM
anuf
actu
rers
Mar
ketin
g in
PE
TC
onta
iner
s’
A/N
Z &
ISO
stan
dard
s of
rele
vanc
e to
var
ious
aspe
cts
of p
last
icpa
ckag
ing,
e.g
.la
belli
ng a
ndsp
ecifi
catio
ns fo
rpa
rtic
ular
type
s of
pack
ages
• Political drivers include those mentioned earlier with respect to governance (e.g. laws,policies, strategies) that form part of the political context within which an organisationoperates.
• Economic drivers are those that have economic implications, e.g. market expectations, costsof disposal.
• Socio-cultural drivers are those that have social or cultural implications, e.g. community
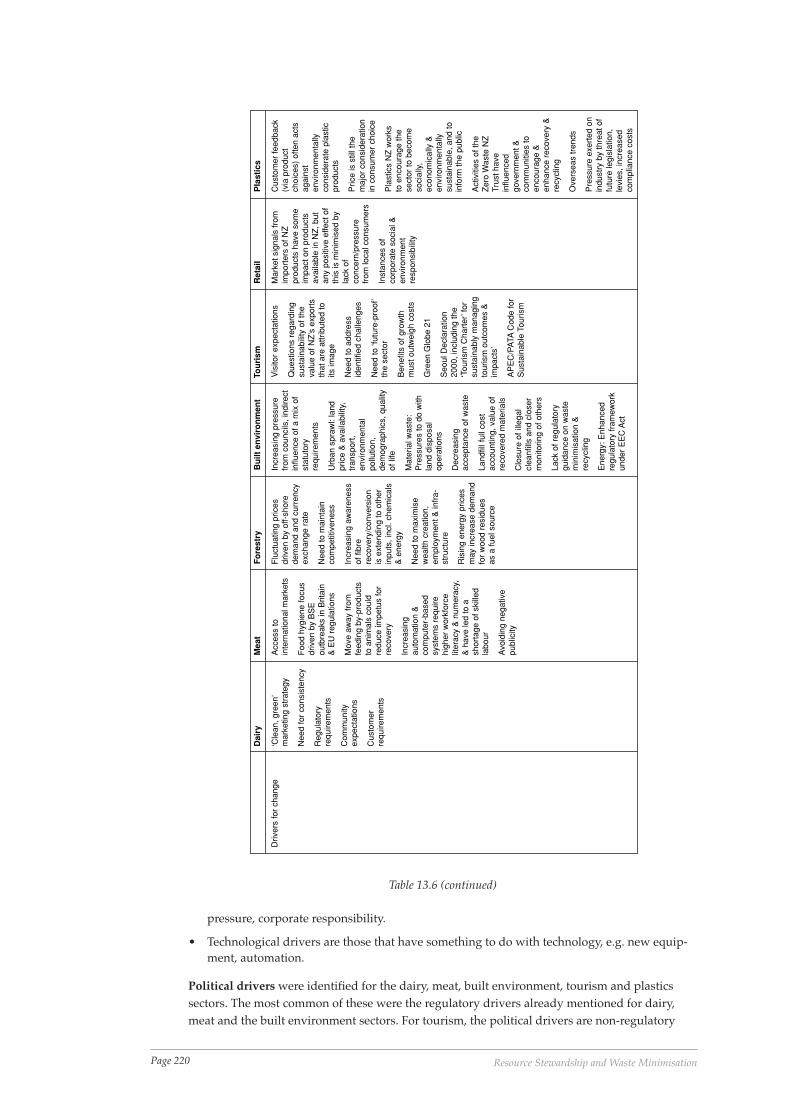
Page 220 Resource Stewardship and Waste Minimisation
Table 13.6 (continued)
Driv
ers
for
chan
ge‘C
lean
, gre
en’
mar
ketin
g st
rate
gy
Nee
d fo
r co
nsis
tenc
y
Reg
ulat
ory
requ
irem
ents
Com
mun
ityex
pect
atio
ns
Cus
tom
erre
quire
men
ts
Acc
ess
toin
tern
atio
nal m
arke
ts
Foo
d hy
gien
e fo
cus
driv
en b
y B
SE
outb
reak
s in
Brit
ain
& E
U r
egul
atio
ns
Mov
e aw
ay fr
omfe
edin
g by
-pro
duct
sto
ani
mal
s co
uld
redu
ce im
petu
s fo
rre
cove
ry
Incr
easi
ngau
tom
atio
n &
com
pute
r-ba
sed
syst
ems
requ
irehi
gher
wor
kfor
celit
erac
y &
num
erac
y,&
hav
e le
d to
ash
orta
ge o
f ski
lled
labo
ur
Avo
idin
g ne
gativ
epu
blic
ity
Flu
ctua
ting
pric
esdr
iven
by
off-
shor
ede
man
d an
d cu
rren
cyex
chan
ge r
ate
Nee
d to
mai
ntai
nco
mpe
titiv
enes
s
Incr
easi
ng a
war
enes
sof
fibr
ere
cove
ry/c
onve
rsio
nis
ext
endi
ng to
oth
erin
puts
, inc
l. ch
emic
als
& e
nerg
y
Nee
d to
max
imis
ew
ealth
cre
atio
n,em
ploy
men
t & in
fra-
stru
ctur
e
Ris
ing
ener
gy p
rices
may
incr
ease
dem
and
for
woo
d re
sidu
esas
a fu
el s
ourc
e
Incr
easi
ng p
ress
ure
from
cou
ncils
, ind
irect
influ
ence
of a
mix
of
stat
utor
yre
quire
men
ts
Urb
an s
praw
l: la
ndpr
ice
& a
vaila
bilit
y,tr
ansp
ort,
envi
ronm
enta
lpo
llutio
n,de
mog
raph
ics,
qua
lity
of li
fe
Mat
eria
l was
te:
Pre
ssur
es to
do
with
land
dis
posa
lop
erat
ions
Dec
reas
ing
acce
ptan
ce o
f was
te
Land
fill f
ull c
ost
acco
untin
g, v
alue
of
reco
vere
d m
ater
ials
Clo
sure
of i
llega
lcl
eanf
ills
and
clos
erm
onito
ring
of o
ther
s
Lack
of r
egul
ator
ygu
idan
ce o
n w
aste
min
imis
atio
n &
recy
clin
g
Ene
rgy:
Enh
ance
dre
gula
tory
fram
ewor
kun
der
EE
C A
ct
Vis
itor
expe
ctat
ions
Que
stio
ns r
egar
ding
sust
aina
bilit
y of
the
valu
e of
NZ
’s e
xpor
tsth
at a
re a
ttrib
uted
toits
imag
e
Nee
d to
add
ress
iden
tifie
d ch
alle
nges
Nee
d to
‘fut
ure-
proo
f’th
e se
ctor
Ben
efits
of g
row
thm
ust o
utw
eigh
cos
ts
Gre
en G
lobe
21
Seo
ul D
ecla
ratio
n20
00, i
nclu
ding
the
‘Tou
rism
Cha
rter
’ for
sust
aina
bly
man
agin
gto
uris
m o
utco
mes
&im
pact
s’
AP
EC
/PA
TA C
ode
for
Sus
tain
able
Tou
rism
Mar
ket s
igna
ls fr
omim
port
ers
of N
Zpr
oduc
ts h
ave
som
eim
pact
on
prod
ucts
avai
labl
e in
NZ
, but
any
posi
tive
effe
ct o
fth
is is
min
imis
ed b
yla
ck o
fco
ncer
n/pr
essu
refr
om lo
cal c
onsu
mer
s
Inst
ance
s of
corp
orat
e so
cial
&en
viro
nmen
tre
spon
sibi
lity
Cus
tom
er fe
edba
ck(v
ia p
rodu
ctch
oice
s) o
ften
acts
agai
nst
envi
ronm
enta
llyco
nsid
erat
e pl
astic
prod
ucts
Pric
e is
stil
l the
maj
or c
onsi
dera
tion
in c
onsu
mer
cho
ice
Pla
stic
s N
Z w
orks
to e
ncou
rage
the
sect
or to
bec
ome
soci
ally
,ec
onom
ical
ly &
envi
ronm
enta
llysu
stai
nabl
e, a
nd to
info
rm th
e pu
blic
Act
iviti
es o
f the
Zer
o W
aste
NZ
Trus
t hav
ein
fluen
ced
gove
rnm
ent &
com
mun
ities
toen
cour
age
&en
hanc
e re
cove
ry &
recy
clin
g
Ove
rsea
s tr
ends
Pre
ssur
e ex
erte
d on
indu
stry
by
thre
at o
ffu
ture
legi
slat
ion,
levi
es, i
ncre
ased
com
plia
nce
cost
s
Dai
ryM
eat
Fo
rest
ryB
uilt
en
viro
nm
ent
Tou
rism
Ret
ail
Pla
stic
s
pressure, corporate responsibility.
• Technological drivers are those that have something to do with technology, e.g. new equip-ment, automation.
Political drivers were identified for the dairy, meat, built environment, tourism and plasticssectors. The most common of these were the regulatory drivers already mentioned for dairy,meat and the built environment sectors. For tourism, the political drivers are non-regulatory
Page 221Sector Group Responses
(i.e. the Seoul Declaration and the APEC/PATA Code for Sustainable Tourism), while forplastics, the threat of legislation was identified as a driver.
Economic drivers were by far the most commonly identified. These include:
• market pressures and customer expectations or requirements (all sectors);
• fluctuating prices or currency (forestry);
• disposal or compliance costs (built environment); and
• socio-economic well-being (forestry, built environment).
Socio-cultural drivers that were identified include:
• community expectations (dairy, meat, built environment, tourism, plastics);
• increased awareness of possibilities (forestry);
• the need to address challenges (tourism, plastics); and
• isolated instances of corporate social responsibility (retail).
The only technological drivers that were identified were for forestry, i.e. increasing automationand a corresponding shortage of skilled labour.
While all of the above-mentioned drivers were believed to contribute positively to progresstowards resource stewardship, a few drivers were believed to have a negative effect. Theseincluded:
• the BSE-related move away from the use of animal by-products for stockfeed (thought toreduce the impetus for recovery in the meat sector);
• lack of regulatory guidance on waste minimisation and recycling (built environment); and
• lack of concern/pressure from local consumers, and in some cases outright rejection ofenvironmentally more considerate products (retail, plastics).
One driver that could have negative or positive effects, depending on different perspectives isthe increasing price of energy. This driver was identified as having the potential to increase theuse of wood residues as a fuel source (forestry). Its influence could be perceived as beingpositive if wood residues are seen as a renewable energy source, or negative if they are seen as agreenhouse gas contributor, or as reducing the impetus for waste prevention.
As mentioned earlier, it is important to note that these drivers are not working in isolation, butthat they work together to form part of the complex environment within which organisationsoperate. Important questions that arise included:
• what is their relative significance within the organisational environment;
• how do they interact with other drivers and sources of influence; and
• how can they be harnessed to bring about real progress towards resource stewardship?
13.6 Industry Sector AssessmentsEach of the industry sector groups were asked to assess the way in which waste minimisationand resource stewardship occur within their particular sector, and to make recommendationsfor improving the sector’s contribution to resource stewardship in New Zealand. Key conclu-sions and recommendations for each of the sectors are summarised in Table 13.7. The conclu-sions are presented as indicative successes and constraints.
From Table 13.7 it can be seen that, in the majority of cases, traditional indicators were used todraw conclusions on the success of waste minimisation. These traditional indicators included:
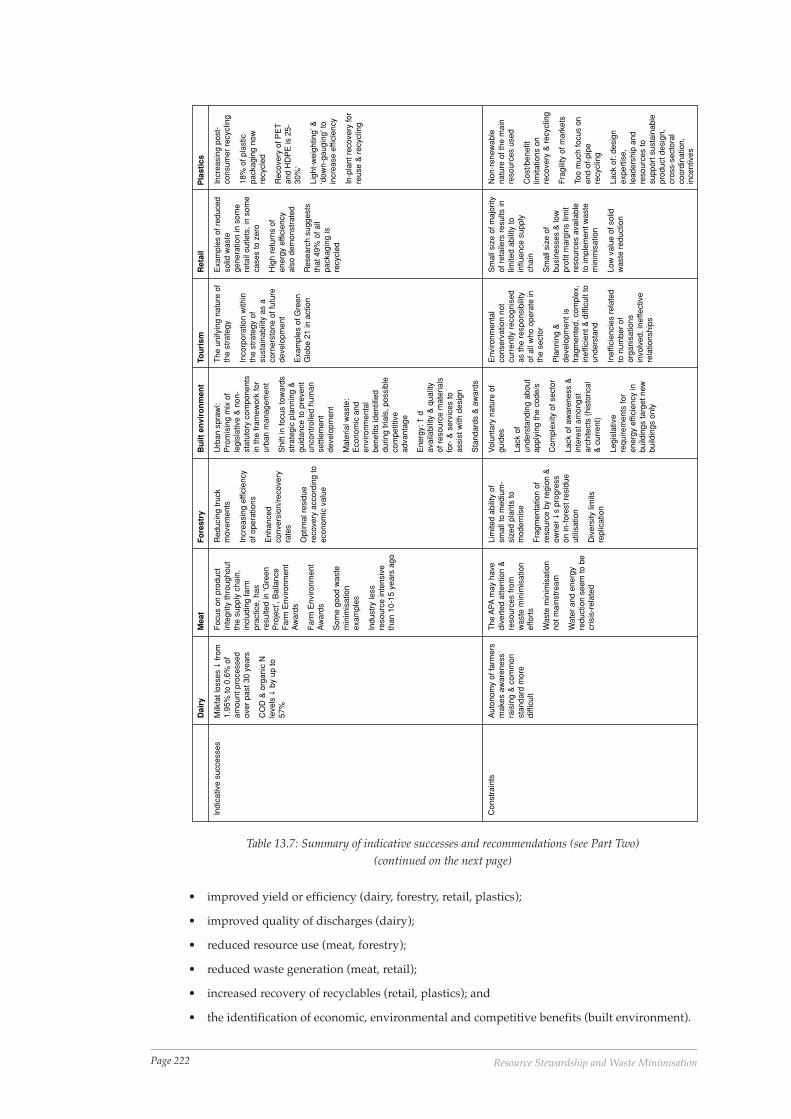
Page 222 Resource Stewardship and Waste Minimisation
Table 13.7: Summary of indicative successes and recommendations (see Part Two)(continued on the next page)
Dai
ryM
eat
Fo
rest
ry
Bu
ilt e
nvi
ron
men
t To
uri
sm
Ret
ail
Pla
stic
s
Indi
cativ
e su
cces
ses
Milk
fat l
osse
s�
from
1.95
% to
0.6
% o
fam
ount
pro
cess
edov
er p
ast 3
0 ye
ars
CO
D &
org
anic
Nle
vels�
by
up to
57%
Foc
us o
n pr
oduc
tin
tegr
ity th
roug
hout
the
supp
ly c
hain
,in
clud
ing
farm
prac
tice,
has
resu
lted
in ‘G
reen
Pro
ject
’, B
alla
nce
Far
m E
nviro
nmen
tA
war
ds
Far
m E
nviro
nmen
tA
war
ds
Som
e go
od w
aste
min
imis
atio
nex
ampl
es
Indu
stry
less
reso
urce
inte
nsiv
eth
an 1
0-15
yea
rs a
go
Red
ucin
g tr
uck
mov
emen
ts
Incr
easi
ng e
ffici
ency
of o
pera
tions
Enh
ance
dco
nver
sion
/rec
over
yra
tes
Opt
imal
res
idue
reco
very
acc
ordi
ng to
econ
omic
val
ue
Urb
an s
praw
l:P
rom
isin
g m
ix o
fle
gisl
ativ
e &
non
-st
atut
ory
com
pone
nts
in th
e fr
amew
ork
for
urba
n m
anag
emen
t
Shi
ft in
focu
s to
war
dsst
rate
gic
plan
ning
&gu
idan
ce to
pre
vent
unco
ntro
lled
hum
anse
ttlem
ent
deve
lopm
ent
Mat
eria
l was
te:
Eco
nom
ic a
nden
viro
nmen
tal
bene
fits
iden
tifie
ddu
ring
tria
ls, p
ossi
ble
com
petit
ive
adva
ntag
e
Ene
rgy:�
dav
aila
bilit
y &
qua
lity
of r
esou
rce
mat
eria
lsfo
r- &
ser
vice
s to
assi
st w
ith d
esig
n
Sta
ndar
ds &
aw
ards
The
uni
fyin
g na
ture
of
the
stra
tegy
Inco
rpor
atio
n w
ithin
the
stra
tegy
of
sust
aina
bilit
y as
aco
rner
ston
e of
futu
rede
velo
pmen
t
Exa
mpl
es o
f Gre
enG
lobe
21
in a
ctio
n
Exa
mpl
es o
f red
uced
solid
was
tege
nera
tion
in s
ome
reta
il ou
tlets
, in
som
eca
ses
to z
ero
Hig
h re
turn
s of
ener
gy e
ffici
ency
also
dem
onst
rate
d
Res
earc
h su
gges
tsth
at 4
9% o
f all
pack
agin
g is
recy
cled
Incr
easi
ng p
ost-
cons
umer
rec
yclin
g
18%
of p
last
icpa
ckag
ing
now
recy
cled
Rec
over
y of
PE
Tan
d H
DP
E is
25-
30%
‘
Ligh
t-w
eigh
ting’
&‘d
own-
gaug
ing’
toin
crea
se e
ffici
ency
In-p
lant
rec
over
y fo
rre
use
& r
ecyc
ling
Con
stra
ints
Aut
onom
y of
farm
ers
mak
es a
war
enes
sra
isin
g &
com
mon
stan
dard
mor
edi
fficu
lt
The
AP
A m
ay h
ave
dive
rted
atte
ntio
n &
reso
urce
s fr
omw
aste
min
imis
atio
nef
fort
s
Was
te m
inim
isat
ion
not m
ains
trea
m
Wat
er a
nd e
nerg
yre
duct
ion
seem
to b
ecr
isis
-rel
ated
Lim
ited
abili
ty o
fsm
all t
o m
ediu
m-
size
d pl
ants
tom
oder
nise
Fra
gmen
tatio
n of
reso
urce
by
regi
on &
owne
r�
s pr
ogre
sson
in-f
ores
t res
idue
utili
satio
n
Div
ersi
ty li
mits
repl
icat
ion
Vol
unta
ry n
atur
e of
guid
es
Lack
of
unde
rsta
ndin
g ab
out
appl
ying
the
code
/s
Com
plex
ity o
f sec
tor
Lack
of a
war
enes
s &
inte
rest
am
ongs
tar
chite
cts
(his
toric
al&
cur
rent
)
Legi
slat
ive
requ
irem
ents
for
ener
gy e
ffici
ency
inbu
ildin
gs ta
rget
new
build
ings
onl
y
Env
ironm
enta
lco
nser
vatio
n no
tcu
rren
tly r
ecog
nise
das
the
resp
onsi
bilit
yof
all
who
ope
rate
inth
e se
ctor
Pla
nnin
g &
deve
lopm
ent i
sfr
agm
ente
d, c
ompl
ex,
inef
ficie
nt &
diff
icul
t to
unde
rsta
nd
Inef
ficie
ncie
s re
late
dto
num
ber
ofor
gani
satio
nsin
volv
ed, i
neffe
ctiv
ere
latio
nshi
ps
Sm
all s
ize
of m
ajor
ityof
ret
aile
rs r
esul
ts in
limite
d ab
ility
toin
fluen
ce s
uppl
ych
ain
Sm
all s
ize
ofbu
sine
sses
& lo
wpr
ofit
mar
gins
lim
itre
sour
ces
avai
labl
eto
impl
emen
t was
tem
inim
isat
ion
Low
val
ue o
f sol
idw
aste
red
uctio
n
Non
-ren
ewab
lena
ture
of t
he m
ain
reso
urce
s us
ed
Cos
t/ben
efit
limita
tions
on
reco
very
& r
ecyc
ling
Fra
gilit
y of
mar
kets
Too
muc
h fo
cus
onen
d-of
-pip
ere
cycl
ing
Lack
of:
desi
gnex
pert
ise,
lead
ersh
ip a
ndre
sour
ces
tosu
ppor
t sus
tain
able
prod
uct d
esig
n,cr
oss-
sect
oral
coor
dina
tion,
ince
ntiv
es
• improved yield or efficiency (dairy, forestry, retail, plastics);
• improved quality of discharges (dairy);
• reduced resource use (meat, forestry);
• reduced waste generation (meat, retail);
• increased recovery of recyclables (retail, plastics); and
• the identification of economic, environmental and competitive benefits (built environment).
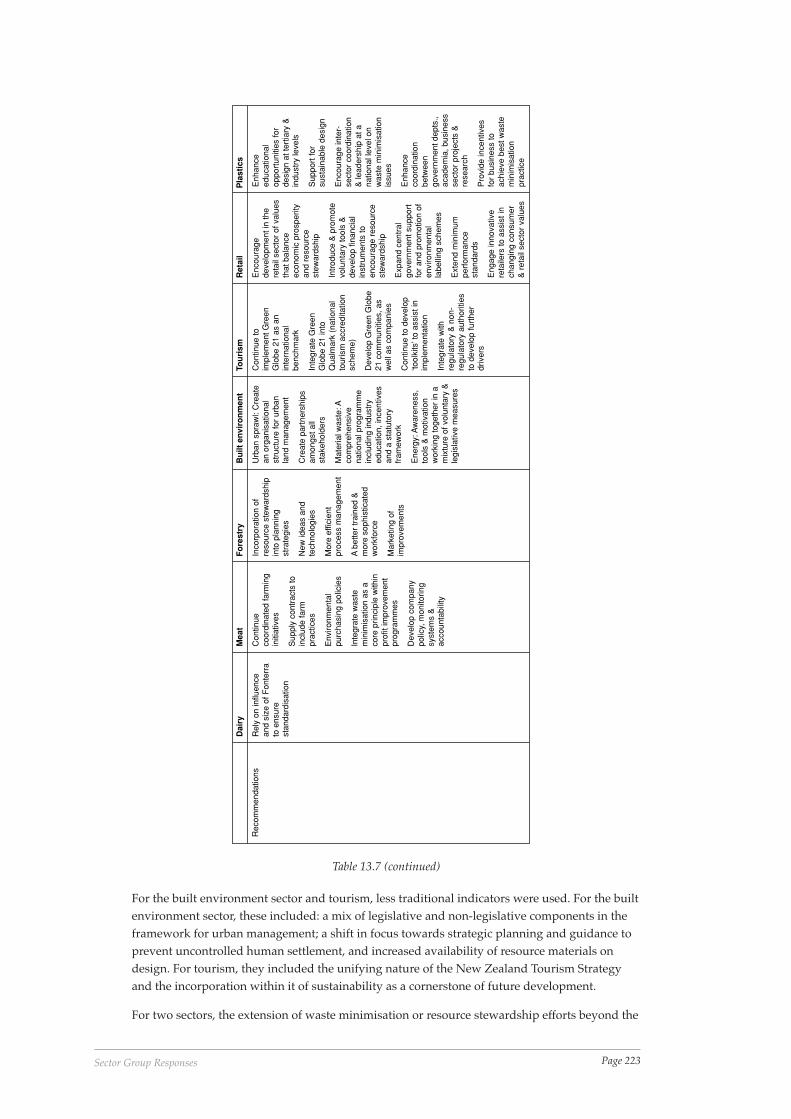
Page 223Sector Group Responses
Rec
omm
enda
tions
Rel
y on
influ
ence
and
size
of F
onte
rra
to e
nsur
est
anda
rdis
atio
n
Con
tinue
coor
dina
ted
farm
ing
initi
ativ
es
Sup
ply
cont
ract
s to
incl
ude
farm
prac
tices
Env
ironm
enta
lpu
rcha
sing
pol
icie
s
Inte
grat
e w
aste
min
imis
atio
n as
aco
re p
rinci
ple
with
inpr
ofit
impr
ovem
ent
prog
ram
mes
Dev
elop
com
pany
polic
y, m
onito
ring
syst
ems
&ac
coun
tabi
lity
Inco
rpor
atio
n of
reso
urce
ste
war
dshi
pin
to p
lann
ing
stra
tegi
es
New
idea
s an
dte
chno
logi
es
Mor
e ef
ficie
ntpr
oces
s m
anag
emen
t
A b
ette
r tr
aine
d &
mor
e so
phis
ticat
edw
orkf
orce
Mar
ketin
g of
impr
ovem
ents
Urb
an s
praw
l: C
reat
ean
org
anis
atio
nal
stru
ctur
e fo
r ur
ban
land
man
agem
ent
Cre
ate
part
ners
hips
amon
gst a
llst
akeh
olde
rs
Mat
eria
l was
te: A
com
preh
ensi
vena
tiona
l pro
gram
me
incl
udin
g in
dust
ryed
ucat
ion,
ince
ntiv
esan
d a
stat
utor
yfr
amew
ork
Ene
rgy:
Aw
aren
ess,
tool
s &
mot
ivat
ion
wor
king
toge
ther
in a
mix
ture
of v
olun
tary
&le
gisl
ativ
e m
easu
res
Con
tinue
toim
plem
ent G
reen
Glo
be 2
1 as
an
inte
rnat
iona
lbe
nchm
ark
Inte
grat
e G
reen
Glo
be 2
1 in
toQ
ualm
ark
(nat
iona
lto
uris
m a
ccre
dita
tion
sche
me)
Dev
elop
Gre
en G
lobe
21 c
omm
uniti
es, a
sw
ell a
s co
mpa
nies
Con
tinue
to d
evel
op‘to
olki
ts’ t
o as
sist
inim
plem
enta
tion
Inte
grat
e w
ithre
gula
tory
& n
on-
regu
lato
ry a
utho
ritie
sto
dev
elop
furt
her
driv
ers
Enc
oura
gede
velo
pmen
t in
the
reta
il se
ctor
of v
alue
sth
at b
alan
ceec
onom
ic p
rosp
erity
and
reso
urce
stew
ards
hip
Intr
oduc
e &
pro
mot
evo
lunt
ary
tool
s &
deve
lop
finan
cial
inst
rum
ents
toen
cour
age
reso
urce
stew
ards
hip
Exp
and
cent
ral
gove
rnm
ent s
uppo
rtfo
r an
d pr
omot
ion
ofen
viro
nmen
tal
labe
lling
sch
emes
Ext
end
min
imum
perf
orm
ance
stan
dard
s
Eng
age
inno
vativ
ere
taile
rs to
ass
ist i
nch
angi
ng c
onsu
mer
& r
etai
l sec
tor
valu
es
Enh
ance
educ
atio
nal
oppo
rtun
ities
for
desi
gn a
t ter
tiary
&in
dust
ry le
vels
Sup
port
for
sust
aina
ble
desi
gn
Enc
oura
ge in
ter-
sect
or c
oord
inat
ion
& le
ader
ship
at a
natio
nal l
evel
on
was
te m
inim
isat
ion
issu
es
Enh
ance
coor
dina
tion
betw
een
gove
rnm
ent d
epts
.,ac
adem
ia, b
usin
ess
sect
or p
roje
cts
&re
sear
ch
Pro
vide
ince
ntiv
esfo
r bu
sine
ss to
achi
eve
best
was
tem
inim
isat
ion
prac
tice
Dai
ryM
eat
Fo
rest
ry
Bu
ilt e
nvi
ron
men
t To
uri
sm
Ret
ail
Pla
stic
s
Table 13.7 (continued)
For the built environment sector and tourism, less traditional indicators were used. For the builtenvironment sector, these included: a mix of legislative and non-legislative components in theframework for urban management; a shift in focus towards strategic planning and guidance toprevent uncontrolled human settlement, and increased availability of resource materials ondesign. For tourism, they included the unifying nature of the New Zealand Tourism Strategyand the incorporation within it of sustainability as a cornerstone of future development.
For two sectors, the extension of waste minimisation or resource stewardship efforts beyond the
Page 224 Resource Stewardship and Waste Minimisation
factory floor were used as an indicator of success: for meat, the inclusion of on-farm improve-ments and farm awards, and for forestry, the reduction in truck movements to and from themills.
A number of constraints were also identified. These included:
• lack of understanding, expertise or interest (meat, built environment, tourism, plastics);structure, complexity or fragmentation of the sector (dairy, forestry, built environment,tourism);
• limited availability of funds (forestry, retail, plastics);
• poor cost/benefit ratio, particularly for recovery/recycling (retail, plastics);
• competing agendas (meat);
• legislative limitations; and
• the voluntary nature of guides (built environment).
A noteworthy characteristic of the recommendations is that, while a small number of generalcategories can be identified within which they all fit, the sectors differ quite markedly from eachother in terms of specifics. The recommendations can be loosely grouped into four categories.
• Internal integration, which refers to integration within individual businesses or organisa-tions. Recommendations in this regard included: integration of waste minimisation andresource stewardship into planning strategies (forestry), and profit improvement pro-grammes (meat), as well as the development of internal policy, monitoring and accountabil-ity systems (meat).
• External integration, which refers to integration outside the business or organisation.Recommendations in this regard included intra-sectoral integration (i.e. across the supplychain) (dairy, meat, built environment); inter-sectoral integration (plastics, retail and tour-ism), and the development and integration of a mix of instruments to encourage resourcestewardship (built environment, tourism, retail, plastics) and a change in values (retail). Itwas also recommended that programmes be extended to include whole communities, ratherthan simply just businesses (tourism).
• Capacity building, where the recommendations were for more practical education/training(forestry, built environment, plastics), and the development of innovative technologies(forestry) and ‘toolkits’ (tourism).
• Standardisation was the fourth category. Here the recommendations included sector groupscalling for enhanced labelling systems (retail), integrated performance standards (tourism),and benchmarking (tourism).
These results are used in the final chapter (Chapter 14) as the basis for conclusions andrecommendations for New Zealand as a whole.
Page 225Towards Resource Stewardship
1Towards Resource Stewardship
Lesley Stone114
14.1 The challenge that lies aheadThe first chapter in Part Three (Chapter 12) discussed the way forward and identified some ofthe challenges that lie ahead in encouraging people, whether as individuals or as part of anysector group or organisation within society, to think of waste minimisation in terms of resourcestewardship. The contextual environment in which these challenges must be faced has beendescribed in Part One, and the conclusions and recommendations produced by the industrysector groups in Part Two, and also discussed in the previous chapter (Chapter 13), are indica-tors of the way forward.
As a final step it is useful to revisit some of the observations that were made in Part One inconsidering how waste minimisation activities can contribute to resource stewardship and,ultimately, sustainability.
Fig. 14.1 provides a graphic representation of how such a contribution could work. It is basedon Fig. 1.2 from Chapter 1, but differs in two ways. Firstly, the contributions that remediation,treatment and re-directed disposal make towards resource stewardship are shown as dottedlines. This is because they are not the focus of this report. Secondly, the terms ‘resource conser-vation’ and ‘resource recovery’ have replaced ‘reduction [of wastes] at source’, and ‘external re-use, recycling and recovery [of wastes]’. This has been done to emphasise the resource-, ratherthan waste-related intent of the activities that have traditionally taken place under the wasteminimisation banner, and to make very clear their connection to resource stewardship. It issuggested that these more specifically resource-oriented terms be used in preference to the term‘waste minimisation’. The term ‘waste minimisation’ was coined in the early 1990s and hassince become less relevant as it tends to be now mainly used in reference to solid waste incountries with a long history of these types of activities. This is because it is ambiguous and hasbeen subject to capture, e.g., its use by incinerator operators on the basis that their operationstoo were minimising wastes, in this case, to landfill. More importantly, perhaps, it encourages awaste rather than a resource focus.
This may seem like semantics, but it reflects a key feature of the New Zealand Waste Strategy,and, indeed, sustainability: wastes need to be recognised for what they really are – oftenvaluable resources that need to be recovered, conserved and stewarded so that they are able toassist people to meet not only their own needs, but those of future generations.
This is a massive challenge. Wastes are materials – solid, liquid, gaseous – or energy, that societyhas traditionally thrown away, disposed of, given to someone else to deal with, or simply justignored. Research and experience suggest that this is because deeply ingrained within ourculture is the underlying assumption that wastes have nothing to do with us: they are simplynot our responsibility.
14.2 Changing ValuesDonald Schein, a world renown expert on culture and learning, provides a model that may helpto explain the difficulties encountered when trying to promote resource stewardship. Scheindefines culture as a set of underlying assumptions (or core values) that people have, as a group,‘invented, discovered or developed’ and learned to help cope with the problems that occur as
1 University of Auckland
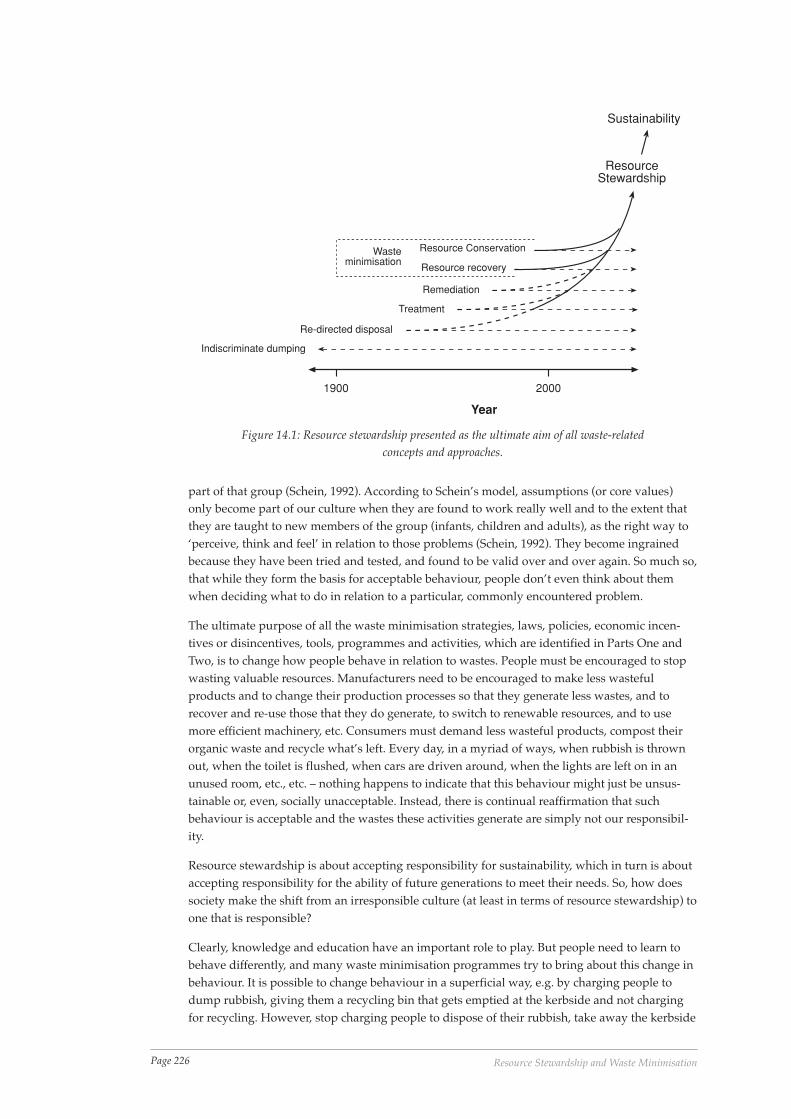
Page 226 Resource Stewardship and Waste Minimisation
part of that group (Schein, 1992). According to Schein’s model, assumptions (or core values)only become part of our culture when they are found to work really well and to the extent thatthey are taught to new members of the group (infants, children and adults), as the right way to‘perceive, think and feel’ in relation to those problems (Schein, 1992). They become ingrainedbecause they have been tried and tested, and found to be valid over and over again. So much so,that while they form the basis for acceptable behaviour, people don’t even think about themwhen deciding what to do in relation to a particular, commonly encountered problem.
The ultimate purpose of all the waste minimisation strategies, laws, policies, economic incen-tives or disincentives, tools, programmes and activities, which are identified in Parts One andTwo, is to change how people behave in relation to wastes. People must be encouraged to stopwasting valuable resources. Manufacturers need to be encouraged to make less wastefulproducts and to change their production processes so that they generate less wastes, and torecover and re-use those that they do generate, to switch to renewable resources, and to usemore efficient machinery, etc. Consumers must demand less wasteful products, compost theirorganic waste and recycle what’s left. Every day, in a myriad of ways, when rubbish is thrownout, when the toilet is flushed, when cars are driven around, when the lights are left on in anunused room, etc., etc. – nothing happens to indicate that this behaviour might just be unsus-tainable or, even, socially unacceptable. Instead, there is continual reaffirmation that suchbehaviour is acceptable and the wastes these activities generate are simply not our responsibil-ity.
Resource stewardship is about accepting responsibility for sustainability, which in turn is aboutaccepting responsibility for the ability of future generations to meet their needs. So, how doessociety make the shift from an irresponsible culture (at least in terms of resource stewardship) toone that is responsible?
Clearly, knowledge and education have an important role to play. But people need to learn tobehave differently, and many waste minimisation programmes try to bring about this change inbehaviour. It is possible to change behaviour in a superficial way, e.g. by charging people todump rubbish, giving them a recycling bin that gets emptied at the kerbside and not chargingfor recycling. However, stop charging people to dispose of their rubbish, take away the kerbside
1900 2000
Year
Indiscriminate dumping
Re-directed disposal
Treatment
Remediation
Resource recovery
Resource Conservation
ResourceStewardship
Sustainability
Wasteminimisation
Figure 14.1: Resource stewardship presented as the ultimate aim of all waste-relatedconcepts and approaches.
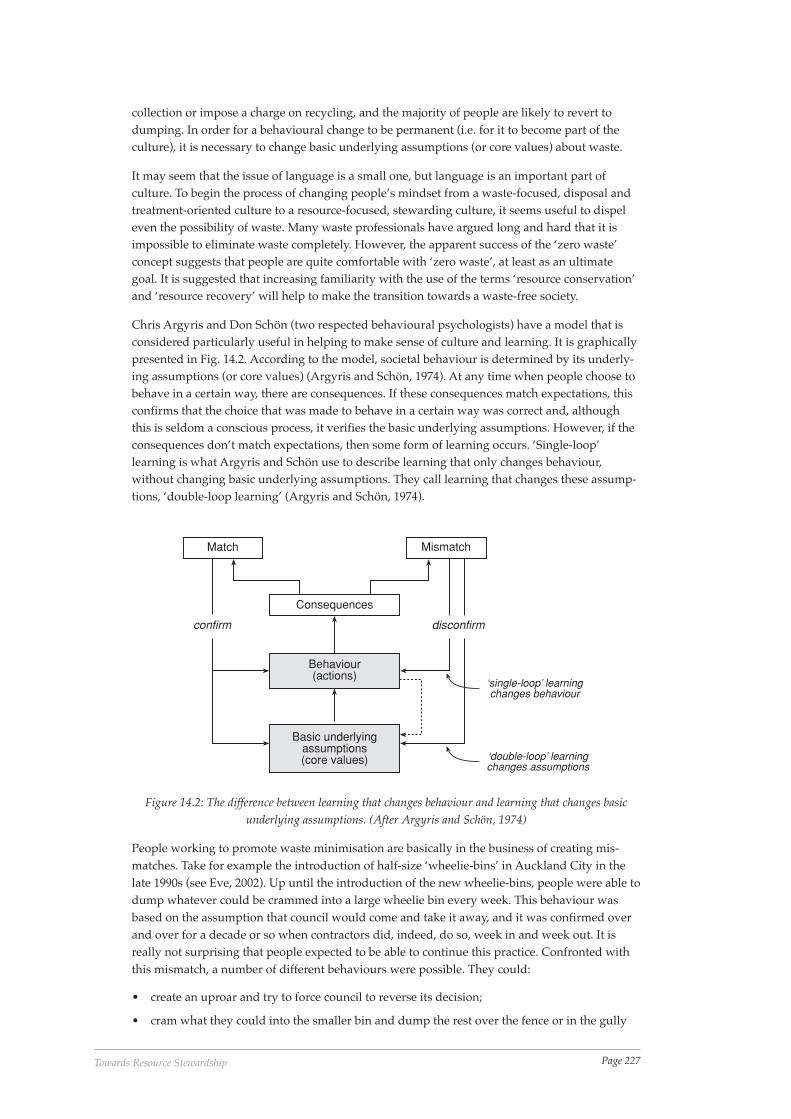
Page 227Towards Resource Stewardship
collection or impose a charge on recycling, and the majority of people are likely to revert todumping. In order for a behavioural change to be permanent (i.e. for it to become part of theculture), it is necessary to change basic underlying assumptions (or core values) about waste.
It may seem that the issue of language is a small one, but language is an important part ofculture. To begin the process of changing people’s mindset from a waste-focused, disposal andtreatment-oriented culture to a resource-focused, stewarding culture, it seems useful to dispeleven the possibility of waste. Many waste professionals have argued long and hard that it isimpossible to eliminate waste completely. However, the apparent success of the ‘zero waste’concept suggests that people are quite comfortable with ‘zero waste’, at least as an ultimategoal. It is suggested that increasing familiarity with the use of the terms ‘resource conservation’and ‘resource recovery’ will help to make the transition towards a waste-free society.
Chris Argyris and Don Schön (two respected behavioural psychologists) have a model that isconsidered particularly useful in helping to make sense of culture and learning. It is graphicallypresented in Fig. 14.2. According to the model, societal behaviour is determined by its underly-ing assumptions (or core values) (Argyris and Schön, 1974). At any time when people choose tobehave in a certain way, there are consequences. If these consequences match expectations, thisconfirms that the choice that was made to behave in a certain way was correct and, althoughthis is seldom a conscious process, it verifies the basic underlying assumptions. However, if theconsequences don’t match expectations, then some form of learning occurs. ‘Single-loop’learning is what Argyris and Schön use to describe learning that only changes behaviour,without changing basic underlying assumptions. They call learning that changes these assump-tions, ‘double-loop learning’ (Argyris and Schön, 1974).
Match Mismatch
Consequences
Behaviour(actions)
Basic underlyingassumptions(core values)
confirm disconfirm
‘single-loop’ learningchanges behaviour
‘double-loop’ learningchanges assumptions
Figure 14.2: The difference between learning that changes behaviour and learning that changes basicunderlying assumptions. (After Argyris and Schön, 1974)
People working to promote waste minimisation are basically in the business of creating mis-matches. Take for example the introduction of half-size ‘wheelie-bins’ in Auckland City in thelate 1990s (see Eve, 2002). Up until the introduction of the new wheelie-bins, people were able todump whatever could be crammed into a large wheelie bin every week. This behaviour wasbased on the assumption that council would come and take it away, and it was confirmed overand over for a decade or so when contractors did, indeed, do so, week in and week out. It isreally not surprising that people expected to be able to continue this practice. Confronted withthis mismatch, a number of different behaviours were possible. They could:
• create an uproar and try to force council to reverse its decision;
• cram what they could into the smaller bin and dump the rest over the fence or in the gully
Page 228 Resource Stewardship and Waste Minimisation
down the road;
• burn what’s left in their incinerator (probably at night when no one can see the smoke);
• pay a contractor to come and take it all away;
• move to another city;
• recycle;
• compost; or
• buy less wasteful products.
All of these behaviours occurred of course, but the council, through careful marketing (includ-ing the use of case studies to show how reductions and recycling could be achieved), managedto still the outcry and encourage the majority of people to reduce the wastes sent to landfill(Eve, 2002). So, the inevitable question is whether or not this is enough. The answer is yes, if theobject is to get people to recycle and compost. Not necessarily, however, if the greater goal is toget them to become better resource stewards. In order to do the latter, it is necessary to getpeople to accept responsibility for wastes, i.e., to change the mindset that wastes are someoneelse’s problem. Argyris and Schön (1974) argue that in order to do this, it is necessary to getpeople to critically reflect on their underlying assumptions, and to help them to invent, test andconfirm the validity of new ones.
To some extent this is what Auckland City Council’s campaign did. It communicated to peoplethat they no longer had the right to dump a large wheelie bin’s worth of solid waste each week.It asked people to accept some level of responsibility for the recyclable and putrescible parts oftheir waste: the former, by separating them and putting them in the recycling bin, and the latter,by composting them or taking them to the transfer station for composting. Now, for somepeople this may have remained only a behavioural change – they would more or less have donewhat they were told so that they could still get rid of their wastes, albeit split between half-sizedwheelie bins and recycling bins. It is quite likely, however, that some people may have begun tothink of some wastes as resources, and of their responsibility for helping them to be recovered,recycled and composted. This is the kind of critical reflection that could lead them to changetheir assumptions about waste. However, it is important to note that a key feature of bothArgyris and Schön, and Schein’s models, is that new assumptions will only become ingrained ifthey are found, through an iterative cycle of learning to work well. This means that the conse-quences that result from the new behaviour must be confirmed enough times for the newassumptions to be accepted as valid.
Consider now what would have happened if the council’s contractors had not picked up therecyclables the week after the new wheelie bins were put into use. Or if upon arriving at thetransfer station with their putrescibles, they were told they wouldn’t be accepted, or that therewas a charge. Or if the neighbour’s dog had over-turned the recycling bins, the council hadignored the waste in the street and the householders had to go and pick it all up. Or if, a fewweeks later, a large article had appeared in the local newspaper expressing outrage at thegrowing pile of recyclables at the transfer station that couldn’t be sold because there were nomarkets. Any of these events may have shed doubt on the validity of the new behaviour (andany new assumption) upon which it was based, and reduced its chances of becoming acceptedas the new way to behave, think and feel in relation to wastes.
During a recent visit to Sweden, the author encountered a good example of what it means tohave these types of assumptions ingrained within a culture. The town in which she was livingappeared to have a strong recycling ethic. The majority of the local residents appeared to washand separate their solid wastes into a wide range of categories, and then carry them to thenearest depot to drop them individually into 10 or more different bins. She asked some of thepeople she encountered what was done to get what seemed like the majority of the population
Page 229Towards Resource Stewardship
to do this. The people she asked (waste management professionals and lay people alike) simplydidn’t understand what she meant by the question. She concluded that this extraordinary levelof personal responsibility is because the underlying assumptions that Swedish people haveabout waste, and their responsibility for it, are clearly very different to those in New Zealand.They appear to simply have accepted responsibility for recovering their wastes and they can’tconceive of not doing so. Through a process of iterative learning, responsibility for the recoveryof a wide range of wastes appears to have become part of Swedish culture.
In Fig. 14.2, it can be seen that the diagram includes a dotted return arrow between behaviourand underlying assumptions. This is to show that, while some programmes may initially onlybring about changes to behaviour, if the validity of those behaviours are confirmed enoughtimes, they tend to become part of the culture. The line is shown dotted because this may notnecessarily always occur. Also, it is important to note that the underlying assumptions that arecreated in this way (i.e. though repetitive behaviour change), will not necessarily be those thatshould be encouraged. Recycling, for example, may simply become “what we have to doaround here to get rid of all our wastes”, rather than be translated into an ethic of stewardship.
14.3 Making it workWith a little help, resource stewardship can, perhaps, be made to occur. The potential for successwill be enhanced by the choice of available instruments and tools, as well as the strategic way inwhich they are used. Stern et. al.’s model (1995) (see Fig. 14.3), was developed specifically toshow the relationship between social institutions (e.g. legal, economic and other social systems),values and environmental behaviour. While it echoes some of the key ideas contained in themodels of Argyris and Schön, and Schein, it adds to them by providing some detail on interme-diary factors that may influence the translation of underlying assumptions into action. Under-standing of these factors can help in the choice of instruments and tools. The model also showsthe relationship between institutional structure, values and behaviour.
Recycling, again, provides an example of how the model would work. The privatisation oflandfills in the Auckland region and the resulting competition amongst them, has driven downthe prices charged for their use. This has the potential to make recycling programmes lesseconomically appealing. The tenuous nature of recycling is exacerbated by New Zealand’s smallpopulation size and hence small market. This means that the majority of recyclables are ex-ported. Since New Zealand has no control of international markets, it is easy for unanticipatedmarket fluctuations to completely erode already tight margins. If these translate into stockpilesof recyclable material and negative publicity about recycling, they can reduce or even eliminatethe public’s confidence in the validity of any new assumptions they are testing.
The small dotted arrows in Fig. 14.3 indicate that influences can also occur in the oppositedirection (as suggested in Fig. 14.2 and mentioned earlier). Commitment, for example, can beinfluenced by behaviour. An example is when someone tries something tentatively, and be-comes committed only when they find repeatedly that it works. Equally, this can work in anegative way, e.g. when someone makes a commitment to buy more environmentally consider-ate products, but then finds that they are much more expensive or are not as effective or reliable.This will influence their commitment and may work itself back down the line where it may ormay not ultimately affect their underlying assumptions.
Similarly, as the dotted line on the left of the figure suggests, people can, through their behav-iour affect institutions. An example of this is the pressure that members of the public have beenknown to exert on councils to introduce recycling schemes. Submissions on policies, plans,resource consents, etc. are all examples of types of behaviour that influence social institutions.Fig. 14.3 also provides an indication of how instruments and tools can be used to assist in thetransition from underlying assumptions to behaviour can be affected by the availability of tools.Step-by-step guides such as those included in the NZBCSD’s “Industry Guide to Zero Waste”
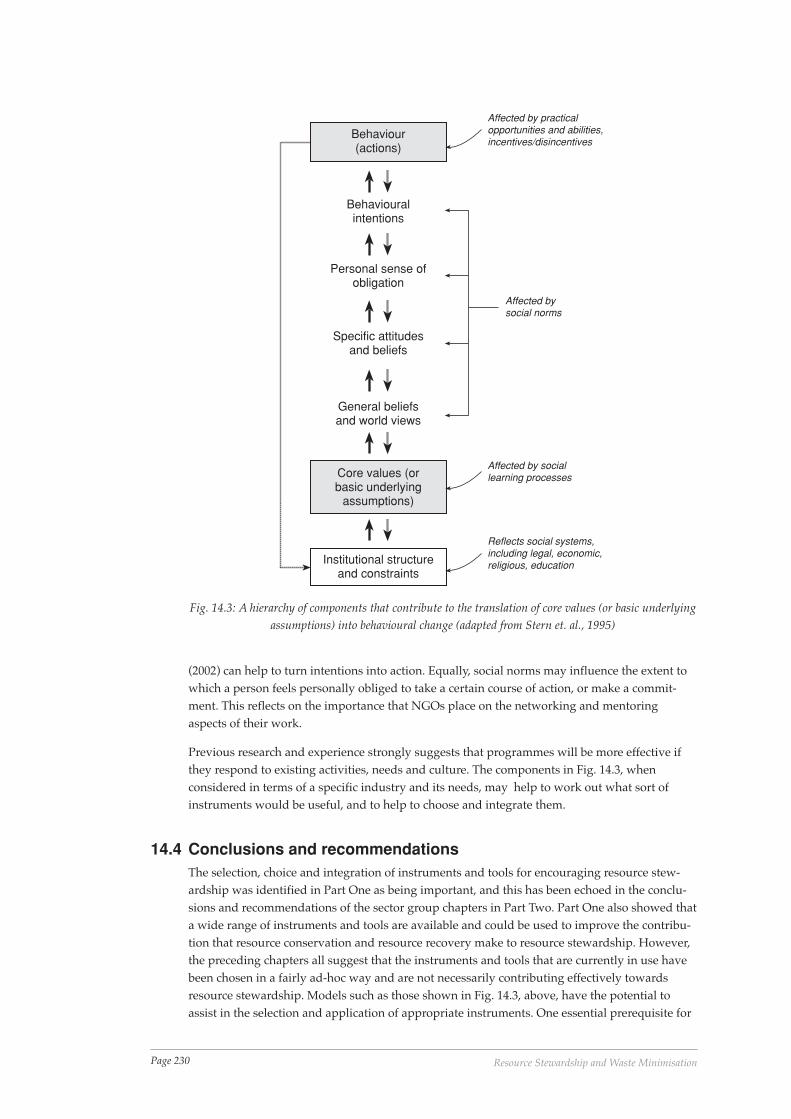
Page 230 Resource Stewardship and Waste Minimisation
(2002) can help to turn intentions into action. Equally, social norms may influence the extent towhich a person feels personally obliged to take a certain course of action, or make a commit-ment. This reflects on the importance that NGOs place on the networking and mentoringaspects of their work.
Previous research and experience strongly suggests that programmes will be more effective ifthey respond to existing activities, needs and culture. The components in Fig. 14.3, whenconsidered in terms of a specific industry and its needs, may help to work out what sort ofinstruments would be useful, and to help to choose and integrate them.
14.4 Conclusions and recommendationsThe selection, choice and integration of instruments and tools for encouraging resource stew-ardship was identified in Part One as being important, and this has been echoed in the conclu-sions and recommendations of the sector group chapters in Part Two. Part One also showed thata wide range of instruments and tools are available and could be used to improve the contribu-tion that resource conservation and resource recovery make to resource stewardship. However,the preceding chapters all suggest that the instruments and tools that are currently in use havebeen chosen in a fairly ad-hoc way and are not necessarily contributing effectively towardsresource stewardship. Models such as those shown in Fig. 14.3, above, have the potential toassist in the selection and application of appropriate instruments. One essential prerequisite for
Behaviour(actions)
Core values (orbasic underlying
assumptions)
Institutional structureand constraints
Behaviouralintentions
Personal sense ofobligation
Specific attitudesand beliefs
General beliefsand world views
Affected by practicalopportunities and abilities,incentives/disincentives
Affected bysocial norms
Affected by sociallearning processes
Reflects social systems,including legal, economic,religious, education
Fig. 14.3: A hierarchy of components that contribute to the translation of core values (or basic underlyingassumptions) into behavioural change (adapted from Stern et. al., 1995)
Page 231Towards Resource Stewardship
this, however, is that people look critically at what has been done in the past, and committhemselves to learning and improvement. Issues raised in Parts One and Two suggest that thisclimate of learning is not yet in place.
Examples abound. During the latter part of the 1990s, many people were involved in the ‘TargetZero’ project. The project was the largest of its kind, funded by the Ministry for theEnvironment’s Sustainable Management Fund and involved 23 companies, five councils, and anumber of consultants. It used internationally-recognised best practice, developed over morethan a decade of experience in a number of countries (the US, Sweden, Netherlands, UK andothers), to take businesses through a programme that would enable them to identify andquantify their resources and wastes, and find ways to prevent, reduce and minimise them. Outof that project came a set of recommendations for improving the effectiveness of sustainabilityprogrammes for business. The results were widely disseminated, in publications, in presenta-tions to WasteMINZ annual conferences and workshops, and in a series of seminars that werewell-attended by businesses and council representatives in the major centres in New Zealand.The results were enthusiastically received by experts working on business sustainability inother countries (Australia, Europe and the US).
Since the results were made available, many sustainability tools (particularly step-by-step typesof guides) have been developed in New Zealand. Despite this, only one of those, an educationalprogramme developed by the BusinessCare National Trust, has incorporated the learning thathas resulted. The rest are just as mechanistic, and hence ineffective as sources of culture change,as the first guides that were developed in the late eighties and early nineties. They have simplynot taken into account any of the learning that has occurred since then.
Why is this? The conclusions drawn from the CAE RS:WM project provide some valuableinsights into what needs to happen in New Zealand for real progress to be made towards anethic of resource stewardship. More than twenty NGOs whose work with businesses is in someway relevant to resource stewardship have been identified. Add to this the 35 or so localcouncils that are currently identified as ‘Zero Waste’ councils, all those other councils who aredoing work in this area despite not having signed up to a ‘Zero Waste’ goal, the Ministry for theEnvironment, the Ministry of Energy, Local Government NZ, the Energy Efficiency and Conser-vation Authority, and all the research institutes or sector representative organisations thatcontributed to this report. The small funding base and the competitive climate that it hasengendered are simply more conducive to rivalry than they are to learning. Perhaps this is whythe learning from the Target Zero project has been largely ignored.
Questions were also raised in Part One about the need for integration, while the industry sectorgroup chapters in Part Two concluded that integration does need to occur for real progresstowards resource stewardship to be achieved. In 1992, the waste minimisation section of theoriginal CAE book “Our Waste: Our Responsibility”, recommended the establishment of anational foundation that would help to integrate waste minimisation (or, more specifically,cleaner production) initiatives. A steering committee was established and preliminary workproceeded, only to be abandoned, because of inter-sector rivalry and the inability to gainsupport from a range of interest groups. This rivalry is still occurring and it is still hinderingprogress. In 1999, the BusinessCare National Trust was established with MfE/SMF funding. Itsbrief was in many ways quite similar to the terms of reference for the foundation that wasproposed in 1992, and it included an integrating and co-ordinating role. MfE chose to fund theTrust to undertake this role, because the Trust did not intend to align itself with any particularconcept or dogma and undertook to act as a clearing house for all. The Trust has had greatdifficulty acting in this capacity, largely due to jealousies that were aroused when it was estab-lished and that continue to this day. The establishment in 2002 of another group that virtuallyduplicates what BusinessCare set out to achieve provides the most recent evidence of this.
It is, perhaps, easy to blame MfE for not having foreseen this situation and some fault may lie
Page 232 Resource Stewardship and Waste Minimisation
with BusinessCare itself, for some mistakes that were made in the first flush of activity. How-ever, it is time to recognise that this situation, while not really surprising given the shortage offunds for this type of work and the challenges involved, is simply not conducive to progressingresource stewardship in New Zealand.
The CAE RS:WM project reconfirms very clearly that integration is necessary if New Zealandersare to build on the considerable gains that have been made during the past 10 years and meetthe remaining challenges that lie ahead. The most obvious solution to the problem of integrationwould be a national organisation that has the full backing of government. A useful aim wouldbe to ensure that the most is gained from the limited funds available, and that there is realsociety-wide progress towards resource stewardship, and a sustainable New Zealand.
It is interesting to note that when this suggestion was put to a workshop at the 2003WasteMINZ Conference in Nelson, there was broad consensus on the need for integration, butrejection of a new organisation to undertake it. Participants felt that any one of a number ofexisting organisations could or should play this role. Suggestions included the ParliamentaryCommissioner for the Environment (PCE), the Ministry for the Environment (MfE), and theMinistry for Economic Development (MED). However, it was also felt that it would be impor-tant for the integrating body to be independent of the government and for it to be enabled bylegislation. Therefore neither the MfE nor the MED would appear suitable. The PCE’s officecould potentially undertake the role, but perhaps this would divert it from what is already animportant environmental ombudsman audit-type role.
While WasteMINZ was suggested by a few workshop participants, and other organisationsvolunteered their services after the workshop, the BusinessCare experience suggests that givingany one NGO prominence over the others is unlikely to gain broad support.
The following recommendations are offered in order to facilitate the integration so clearlyidentified in this report as being essential for further progress.
Information, measuring and monitoring:
• Identify the specific roles played by the wide range of NGOs and other groups working inrelated areas (including the Energy Efficiency and Conservation Authority).
• Use the results of the CAE RS:WM project to develop a set of key performance indicators(KPIs) and a system for measuring and monitoring progress towards resource stewardship.
• Use the system to determine the strengths and weaknesses of the groups currently involvedand to help to identify gaps that need to be filled.
• Use the results to adjust the institutional structure and the mix of instruments being used topromote progress towards resource stewardship.
Institutional development:
• Develop an institutional structure and a set of mechanisms (including legal, economic andvoluntary funding and support mechanisms) that will ensure that the gaps are filled, thatduplication is minimised, that groups learn from each other and that maximises resourceefficiency.
• Develop, and have enacted, legislation that will give the body the capacity to act in aregulatory capacity, and to carry out its role without having to compete unnecessarily forfunding.
• Develop mechanisms to ensure that, where necessary, inter-sectoral integration occurs, andthat industry sectors and communities are included in programmes.
• Develop mechanisms to ensure that, where necessary, intra-sectoral integration occurs,including supply chain management and the producer/retailer/consumer interface.
• Select, develop and integrate these mechanisms strategically and in consideration of the
Page 233Towards Resource Stewardship
social aspects of learning and change, so that they actually achieve the desired resourcestewardship outcomes.
• Review and integrate the existing New Zealand Waste Strategy and the National EnergyEfficiency Strategy.
Capacity building:
• Assist groups to develop programmes that reflect up-to-date knowledge on effectivenessand that will, as a result, have a greater potential for achieving the underlying changesnecessary to bring about progress towards resource stewardship.
• Assist groups to develop and apply appropriate methods for monitoring outcomes, and torespond appropriately to the results.
• Develop mechanisms that will enhance the capacity of the tertiary education sector tocontribute towards resource stewardship across all areas, but particularly in the areas ofdesign, technology and innovation.
• Contribute to the development of an appropriate set of toolkits that reflect specific activities,needs and cultures of the different sectors, and monitor their effectiveness and use.
• Work in conjunction with the relevant industry representative bodies and research institu-tions to develop an appropriate set of standards, that reflect the needs of each sector, but thatcan also be used in an integrated way to reflect best practice in New Zealand as a whole.
It is difficult to see how many of these recommendations could be achieved without a nationalbody of some sort.
The Energy Efficiency and Conservation Authority (EECA) may provide a model for this type oforganisation. However, EECA is focused purely on energy and its role would need to beconsiderably expanded. As mentioned earlier, one of the key results to come out of research intothe effectiveness of waste minimisation initiatives is that they appear to work best whencustomised according to the activities, needs and culture of the particular organisation . In somecases it may be strategically useful to get a company to work on energy efficiency and conserva-tion, while in other cases another area of focus may be more valuable as a means to get thelearning process happening. The strategic value and effectiveness of a new body, as recom-mended above, would be limited if energy were excluded from its ambit and covered separatelyby EECA. Since one of the key recommendations in this report concerns integration, it may befar more valuable to disestablish EECA and pass its function over to a new, all encompassingResource Efficiency and Conservation Authority, underpinned by the existing, and appropri-ately amended Energy Efficiency and Conservation Act 2000, as well as a new Resource Effi-ciency and Conservation Act.
We already have two national strategies of which we can be proud. What we need now is aninstitutional structure that can integrate these strategies and bring the values they represent tofruition. It is a challenging task, but one we can certainly aspire to if we build on what we havealready achieved, learn from our experiences, and work together in pursuit of a truly sustain-able New Zealand.
14.5 ReferencesArgyris, C and Schön, D A, 1974. Theory in Practice: Increasing Professional Effectiveness, Jossey-Bass, San Francisco.
Eve, L, 2002. “The big little wheelie bin roll-out”, In: Proceedings of the 14th Annual Conference,Waste Management Institute of NZ, Rotorua, 6-8 Nov.
Goodman, M, 1995. Creative Management, Prentice Hall, Hemel Hempstead.
Johnson, G and Scholes, K, 1999. Exploring Corporate Strategy: Text and Cases, 5th ed., Prentice

Page 234 Resource Stewardship and Waste Minimisation
Hall, Hemel Hempstead.
Schein. E H, 1992. Organisational Culture and Leadership, 2nd ed., Jossey-Bass, San Francisco.
Senior, B, 2002. Organisational Change, 2nd ed., Prentice Hall, Harlow.
Stern, P C, Dietz, T and Guagnano, G A,. 1995. “The new ecological paradigm in social psycho-logical context”, Environmental Behaviour 27: 723-743.

Appendices
Instruments, Tools and
Change Agents

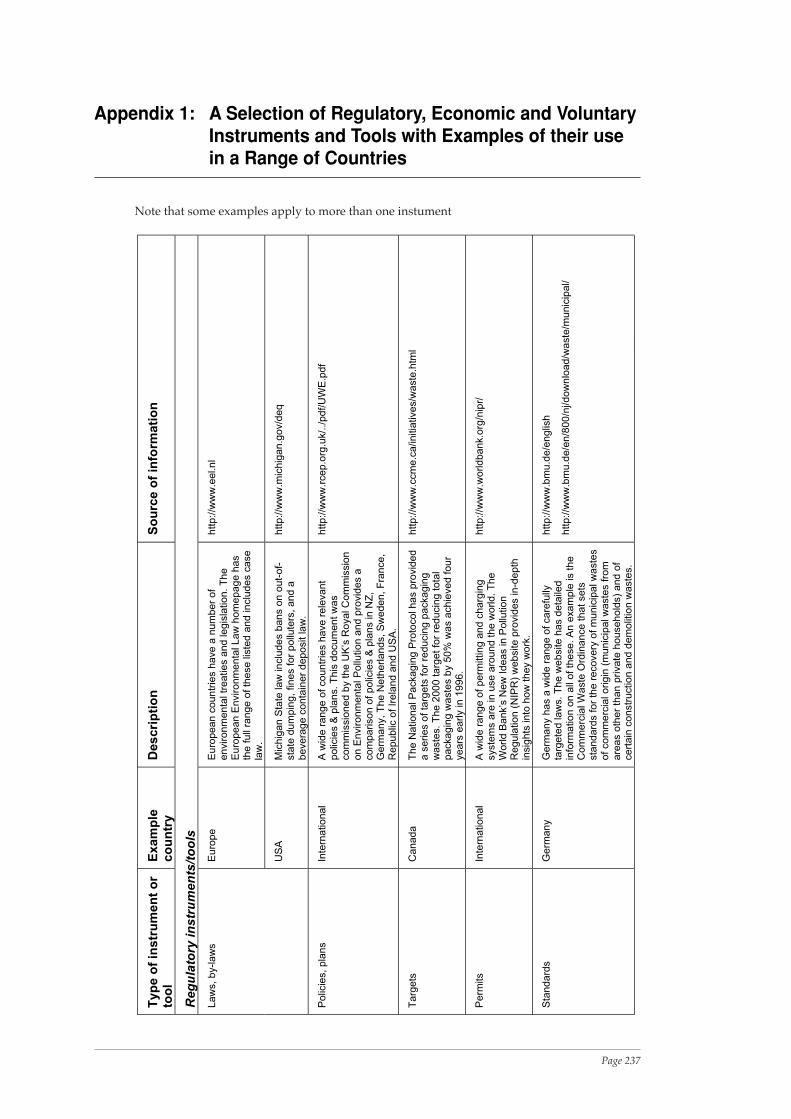
Page 237Appendices
Appendix 1: A Selection of Regulatory, Economic and VoluntaryInstruments and Tools with Examples of their usein a Range of Countries
Typ
e o
f in
str
um
en
t o
rto
ol
Exam
ple
co
un
try
Descri
pti
on
So
urc
e o
f in
form
ati
on
Reg
ula
tory
in
str
um
en
ts/t
oo
ls
Euro
pe
Euro
pean c
ountr
ies h
ave a
num
ber
of
environm
enta
l tr
eaties a
nd legis
lation. T
he
Euro
pean E
nvironm
enta
l Law
hom
epage h
as
the full
range o
f th
ese lis
ted a
nd inclu
des c
ase
law
.
http://w
ww
.eel.nl
Law
s, by-law
s
US
AM
ichig
an S
tate
law
inclu
des b
ans o
n o
ut-
of-
sta
te d
um
pin
g, fines for
pollu
ters
, and a
bevera
ge c
onta
iner
deposit law
.
http://w
ww
.mic
hig
an.g
ov/d
eq
Polic
ies, pla
ns
Inte
rnational
A w
ide r
ange o
f countr
ies h
ave r
ele
vant
polic
ies &
pla
ns. T
his
docum
ent w
as
com
mis
sio
ned b
y the U
K’s
Royal C
om
mis
sio
non E
nvironm
enta
l P
ollu
tion a
nd p
rovid
es a
com
parison o
f polic
ies &
pla
ns in N
Z,
Germ
any, T
he N
eth
erlands, S
weden, F
rance,
Republic
of Ir
ela
nd a
nd U
SA
.
http://w
ww
.rcep.o
rg.u
k/../pdf/U
WE
Targ
ets
Canada
The N
ational P
ackagin
g P
roto
col has p
rovid
ed
a s
eries o
f ta
rgets
for
reducin
g p
ackagin
gw
aste
s. T
he 2
000 targ
et fo
r re
ducin
g tota
lpackagin
g w
aste
s b
y 5
0%
was a
chie
ved four
years
early in 1
996.
http://w
ww
.ccm
e.c
a/initia
tives/w
aste
.htm
l
Perm
its
Inte
rnational
A w
ide r
ange o
f perm
itting a
nd c
harg
ing
syste
ms a
re in u
se a
round the w
orld. T
he
World B
ank’s
New
Ideas in P
ollu
tion
Regula
tion (
NIP
R)
website p
rovid
es in-d
epth
insig
hts
into
how
they w
ork
.
http://w
ww
.worldbank.o
rg/n
ipr/
Sta
ndard
sG
erm
any
Germ
any h
as a
wid
e r
ange o
f care
fully
targ
ete
d law
s. T
he w
ebsite h
as d
eta
iled
info
rmation o
n a
ll of th
ese. A
n e
xam
ple
is the
Com
merc
ial W
aste
Ord
inance that sets
sta
ndard
s for
the r
ecovery
of m
unic
ipal w
aste
sof com
merc
ial origin
(m
unic
ipal w
aste
s fro
mare
as o
ther
than p
rivate
household
s)
and o
fcert
ain
constr
uction a
nd d
em
olit
ion w
aste
s.
http://w
ww
.bm
u.d
e/e
nglis
h
http://w
ww
.bm
u.d
e/e
n/8
00/n
j/dow
nlo
ad/w
aste
/munic
ipal/
Note that some examples apply to more than one instument
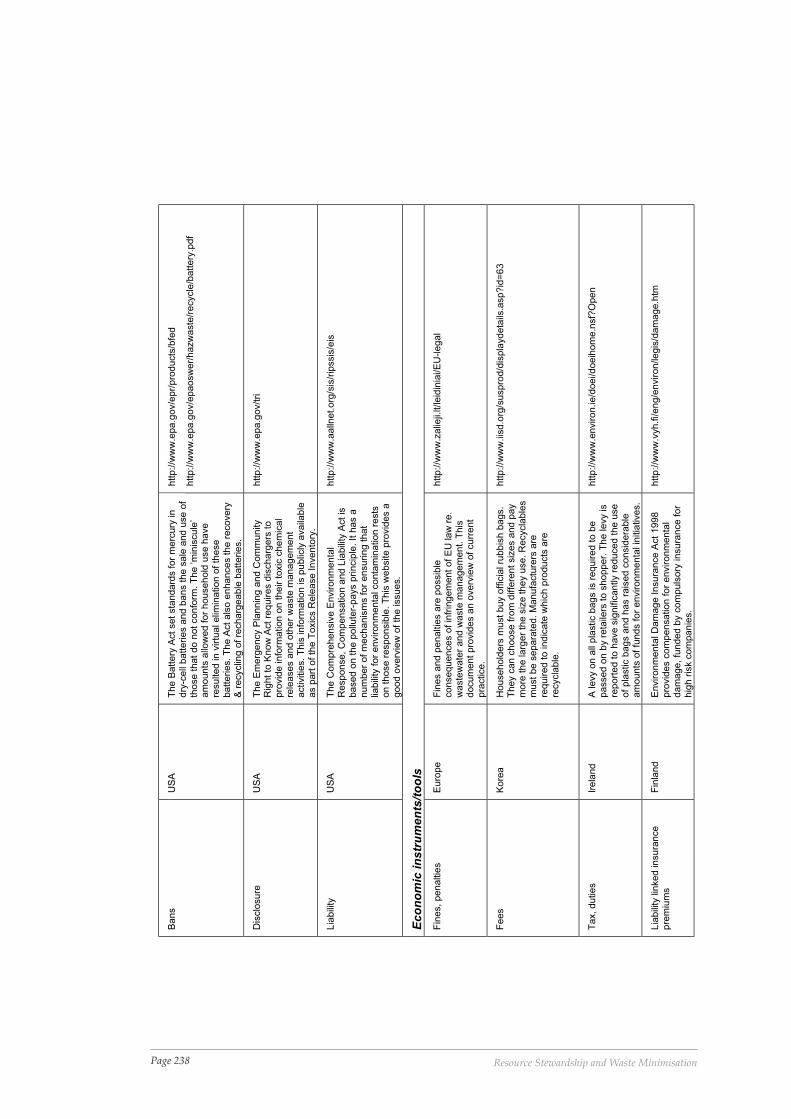
Page 238 Resource Stewardship and Waste Minimisation
Bans
US
AT
he B
attery
Act set sta
ndard
s for
merc
ury
in
dry
-cell
batteries a
nd b
ans the s
ale
and u
se o
fth
ose that do n
ot confo
rm. T
he ‘m
inis
cule
’am
ounts
allo
wed for
household
use h
ave
resulted in v
irtu
al elim
ination o
f th
ese
batteries. T
he A
ct als
o e
nhances the r
ecovery
& r
ecyclin
g o
f re
charg
eable
batteries.
http://w
ww
.epa.g
ov/e
pr/
pro
ducts
/bfe
d
http://w
ww
.epa.g
ov/e
paosw
er/
hazw
aste
/recycle
/battery
Dis
clo
sure
US
AT
he E
merg
ency P
lannin
g a
nd C
om
munity
Rig
ht to
Know
Act re
quires d
ischarg
ers
to
pro
vid
e info
rmation o
n their toxic
chem
ical
rele
ases a
nd o
ther
waste
managem
ent
activitie
s. T
his
info
rmation is p
ublic
ly a
vaila
ble
as p
art
of th
e T
oxic
s R
ele
ase Invento
ry.
http://w
ww
.epa.g
ov/tri
Lia
bili
tyU
SA
The C
om
pre
hensiv
e E
nvironm
enta
lR
esponse, C
om
pensation a
nd L
iabili
ty A
ct is
based o
n the p
ollu
ter-
pays p
rincip
le. It h
as a
num
ber
of m
echanis
ms for
ensuring that
liabili
ty for
environm
enta
l conta
min
ation r
ests
on those r
esponsib
le. T
his
website p
rovid
es a
good o
verv
iew
of th
e issues.
http://w
ww
.aalln
et.org
/sis
/rip
ssis
/eis
Eco
no
mic
in
str
um
en
ts/t
oo
ls
Fin
es, penaltie
sE
uro
pe
Fin
es a
nd p
enaltie
s a
re p
ossib
leconsequences o
f in
frin
gem
ent of E
U law
re.
waste
wate
r and w
aste
managem
ent. T
his
docum
ent pro
vid
es a
n o
verv
iew
of curr
ent
pra
ctice.
http://w
ww
.zalie
ji.lt/leid
inia
i/E
U-legal
Fees
Kore
aH
ousehold
ers
must buy o
ffic
ial ru
bbis
h b
ags.
They c
an c
hoose fro
m d
iffe
rent siz
es a
nd p
ay
more
the larg
er
the s
ize they u
se. R
ecycla
ble
sm
ust be s
epara
ted. M
anufa
ctu
rers
are
required to indic
ate
whic
h p
roducts
are
recycla
ble
.
http://w
ww
.iis
d.o
rg/s
uspro
d/d
ispla
ydeta
ils.a
sp?id
=63
Tax, duties
Irela
nd
A levy o
n a
ll pla
stic b
ags is r
equired to b
epassed o
n b
y r
eta
ilers
to s
hopper.
The levy is
report
ed to h
ave s
ignific
antly r
educed the u
se
of pla
stic b
ags a
nd h
as r
ais
ed c
onsid
era
ble
am
ounts
of fu
nds for
environm
enta
l in
itia
tives.
http://w
ww
.environ.ie/d
oei/doeih
om
e.n
sf?
Open
Lia
bili
ty lin
ked insura
nce
pre
miu
ms
Fin
land
Environm
enta
l D
am
age Insura
nce A
ct 1998
pro
vid
es c
om
pensation for
environm
enta
ldam
age, fu
nded b
y c
om
puls
ory
insura
nce for
hig
h r
isk c
om
panie
s.
http://w
ww
.vyh.fi/eng/e
nviron/legis
/dam
age.h
tm
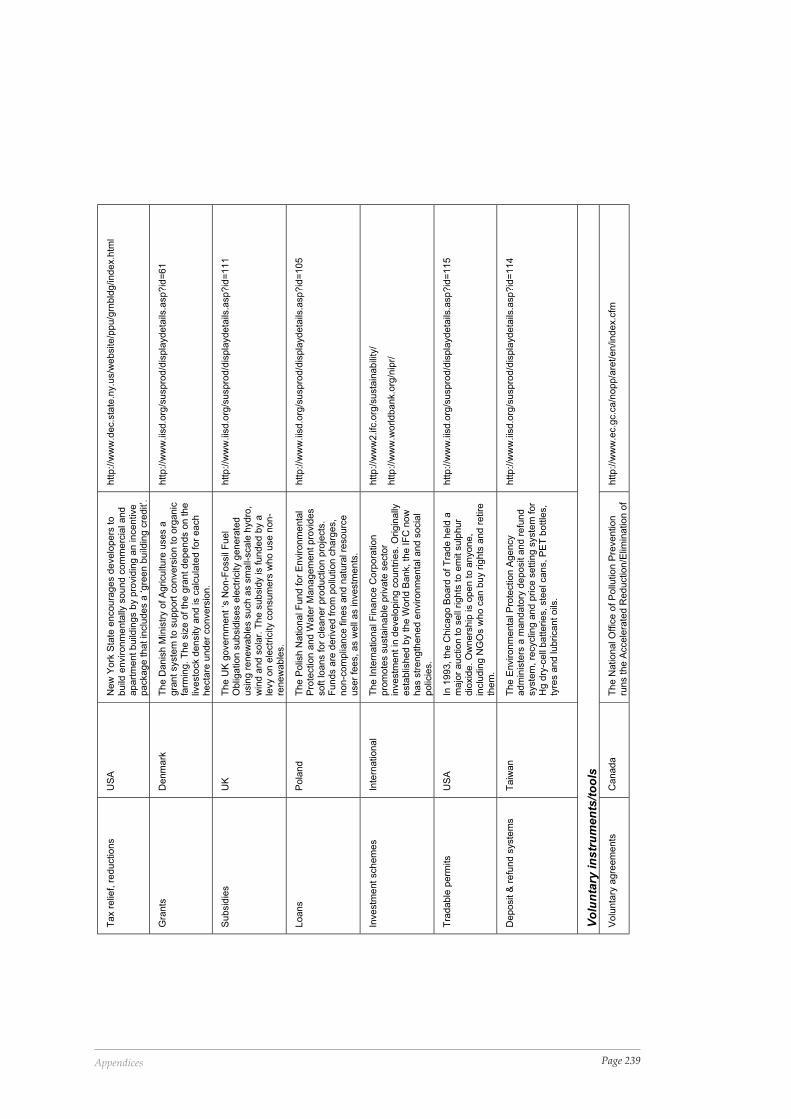
Page 239Appendices
Tax r
elie
f, r
eductions
US
AN
ew
York
Sta
te e
ncoura
ges d
evelo
pers
to
build
environm
enta
lly s
ound c
om
merc
ial and
apart
ment build
ings b
y p
rovid
ing a
n incentive
package that in
clu
des a
‘gre
en b
uild
ing c
redit’.
http://w
ww
.dec.s
tate
.ny.u
s/w
ebsite/p
pu/g
rnbld
g/index.h
tml
Gra
nts
Denm
ark
The D
anis
h M
inis
try o
f A
griculture
uses a
gra
nt syste
m to s
upport
convers
ion to o
rganic
farm
ing. T
he s
ize o
f th
e g
rant depends o
n the
livesto
ck d
ensity a
nd is c
alc
ula
ted for
each
hecta
re u
nder
convers
ion.
http://w
ww
.iis
d.o
rg/s
uspro
d/d
ispla
ydeta
ils.a
sp?id
=61
Subsid
ies
UK
The U
K g
overn
ment ‘s
Non-F
ossil
Fuel
Oblig
ation s
ubsid
ises e
lectr
icity g
enera
ted
usin
g r
enew
able
s s
uch a
s s
mall-
scale
hydro
,w
ind a
nd s
ola
r. T
he s
ubsid
y is funded b
y a
levy o
n e
lectr
icity c
onsum
ers
who u
se n
on-
renew
able
s.
http://w
ww
.iis
d.o
rg/s
uspro
d/d
ispla
ydeta
ils.a
sp?id
=111
Loans
Pola
nd
The P
olis
h N
ational F
und for
Environm
enta
lP
rote
ction a
nd W
ate
r M
anagem
ent pro
vid
es
soft loans for
cle
aner
pro
duction p
roje
cts
.F
unds a
re d
erived fro
m p
ollu
tion c
harg
es,
non-c
om
plia
nce fin
es a
nd n
atu
ral re
sourc
euser
fees, as w
ell
as investm
ents
.
http://w
ww
.iis
d.o
rg/s
uspro
d/d
ispla
ydeta
ils.a
sp?id
=105
Investm
ent schem
es
Inte
rnational
The Inte
rnational F
inance C
orp
ora
tion
pro
mote
s s
usta
inable
private
secto
rin
vestm
ent in
develo
pin
g c
ountr
ies. O
rigin
ally
esta
blis
hed b
y the W
orld B
ank, th
e IF
C n
ow
has s
trength
ened e
nvironm
enta
l and s
ocia
lpolic
ies.
http://w
ww
2.ifc
.org
/susta
inabili
ty/
http://w
ww
.worldbank.o
rg/n
ipr/
Tra
dable
perm
its
US
AIn
1993, th
e C
hic
ago B
oard
of T
rade h
eld
am
ajo
r auction to s
ell
rights
to e
mit s
ulp
hur
dio
xid
e. O
wners
hip
is o
pen to a
nyone,
inclu
din
g N
GO
s w
ho c
an b
uy r
ights
and r
etire
them
.
http://w
ww
.iis
d.o
rg/s
uspro
d/d
ispla
ydeta
ils.a
sp?id
=115
Deposit &
refu
nd s
yste
ms
Taiw
an
The E
nvironm
enta
l P
rote
ction A
gency
adm
inis
ters
a m
andato
ry d
eposit a
nd r
efu
nd
syste
m, re
cyclin
g a
nd p
rice s
ettin
g s
yste
m for
Hg d
ry-c
ell
batteries, ste
el cans, P
ET
bottle
s,
tyre
s a
nd lubricant oils
.
http://w
ww
.iis
d.o
rg/s
uspro
d/d
ispla
ydeta
ils.a
sp?id
=114
Vo
lun
tary
in
str
um
en
ts/t
oo
ls
Volu
nta
ry a
gre
em
ents
Canada
The N
ational O
ffic
e o
f P
ollu
tion P
revention
runs the A
ccele
rate
d R
eduction/E
limin
ation o
fhttp://w
ww
.ec.g
c.c
a/n
opp/a
ret/en/index.c
fm
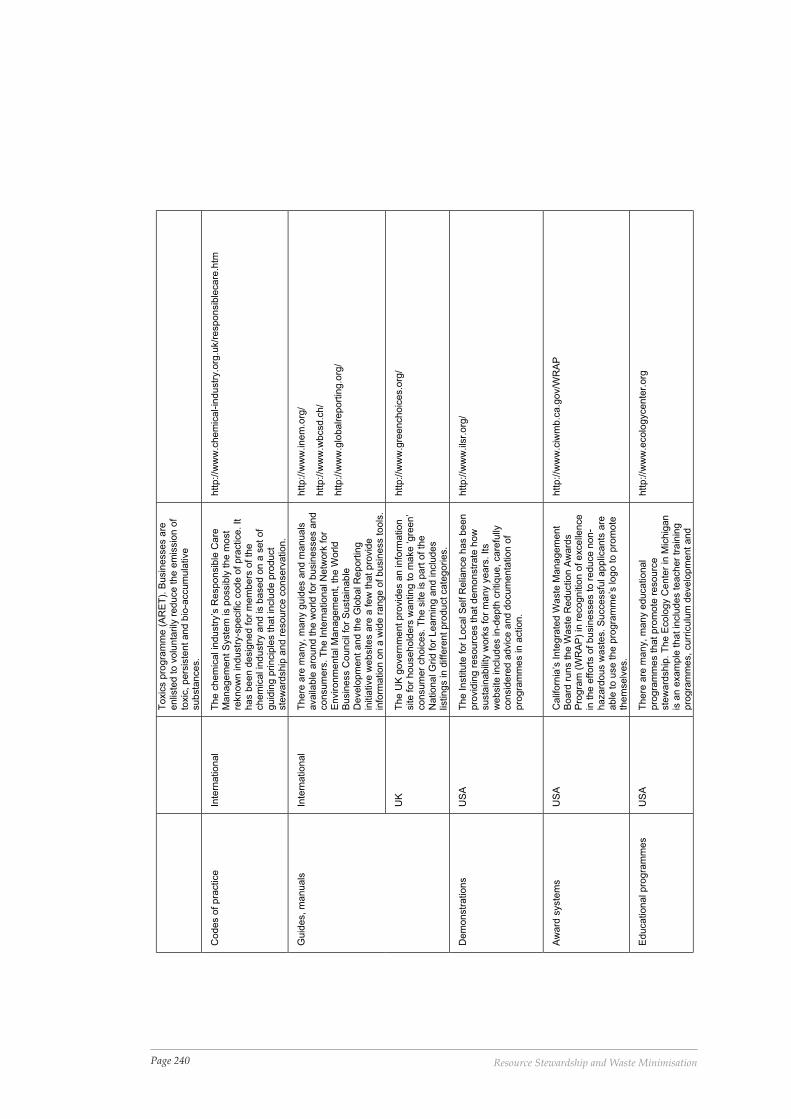
Page 240 Resource Stewardship and Waste Minimisation
Toxic
s p
rogra
mm
e (
AR
ET
). B
usin
esses a
reenlis
ted to v
olu
nta
rily
reduce the e
mis
sio
n o
fto
xic
, pers
iste
nt and b
io-a
ccum
ula
tive
substa
nces.
Codes o
f pra
ctice
Inte
rnational
The c
hem
ical in
dustr
y’s
Responsib
le C
are
Managem
ent S
yste
m is p
ossib
ly the m
ost
reknow
n industr
y-s
pecific
code o
f pra
ctice. It
has b
een d
esig
ned for
mem
bers
of th
echem
ical in
dustr
y a
nd is b
ased o
n a
set of
guid
ing p
rincip
les that in
clu
de p
roduct
ste
ward
ship
and r
esourc
e c
onserv
ation.
http://w
ww
.chem
ical-in
dustr
y.o
rg.u
k/r
esponsib
lecare
.htm
Inte
rnational
There
are
many, m
any g
uid
es a
nd m
anuals
availa
ble
aro
und the w
orld for
busin
esses a
nd
consum
ers
. T
he Inte
rnational N
etw
ork
for
Environm
enta
l M
anagem
ent, the W
orld
Busin
ess C
ouncil
for
Susta
inable
Develo
pm
ent and the G
lobal R
eport
ing
initia
tive w
ebsites a
re a
few
that pro
vid
ein
form
ation o
n a
wid
e r
ange o
f busin
ess tools
.
http://w
ww
.inem
.org
/
http://w
ww
.wbcsd.c
h/
http://w
ww
.glo
balreport
ing.o
rg/
Guid
es, m
anuals
UK
The U
K g
overn
ment pro
vid
es a
n info
rmation
site for
household
ers
wanting to m
ake ‘gre
en’
consum
er
choic
es. T
he s
ite is p
art
of th
eN
ational G
rid for
Learn
ing a
nd inclu
des
listings in d
iffe
rent pro
duct cate
gories.
http://w
ww
.gre
enchoic
es.o
rg/
Dem
onstr
ations
US
AT
he Institu
te for
Local S
elf R
elia
nce h
as b
een
pro
vid
ing r
esourc
es that dem
onstr
ate
how
susta
inabili
ty w
ork
s for
many y
ears
. Its
website inclu
des in-d
epth
critique, care
fully
consid
ere
d a
dvic
e a
nd d
ocum
enta
tion o
fpro
gra
mm
es in a
ction.
http://w
ww
.ils
r.org
/
Aw
ard
syste
ms
US
AC
alif
orn
ia’s
Inte
gra
ted W
aste
Managem
ent
Board
runs the W
aste
Reduction A
ward
sP
rogra
m (
WR
AP
) in
recognitio
n o
f excelle
nce
in the e
ffort
s o
f busin
esses to r
educe n
on-
hazard
ous w
aste
s. S
uccessfu
l applic
ants
are
able
to u
se the p
rogra
mm
e’s
logo to p
rom
ote
them
selv
es.
http://w
ww
.ciw
mb.c
a.g
ov/W
RA
P
Educational pro
gra
mm
es
US
AT
here
are
many, m
any e
ducational
pro
gra
mm
es that pro
mote
resourc
este
ward
ship
. T
he E
colo
gy C
ente
r in
Mic
hig
an
is a
n e
xam
ple
that in
clu
des teacher
train
ing
pro
gra
mm
es, curr
iculu
m d
evelo
pm
ent and
http://w
ww
.ecolo
gycente
r.org

Page 241Appendices
critiq
ue
.
Ce
ntr
es o
f e
xp
ert
ise
De
nm
ark
Th
e W
aste
Ce
ntr
e D
en
ma
rk is a
n e
xce
llen
te
xa
mp
le o
f a
co
un
try s
pe
cific
re
so
urc
ed
esig
ne
d t
o a
ssis
t in
th
e im
ple
me
nta
tio
n o
fw
aste
pre
ve
ntio
n a
nd
ma
na
ge
me
nt.
It
co
nta
ins in
form
atio
n o
n lite
ratu
re,
loca
la
uth
oritie
s a
nd
co
nta
cts
. (T
he
En
glis
h v
ers
ion
pro
vid
es o
nly
a s
um
ma
ry.)
htt
p:/
/ww
w.w
aste
info
.dk
Inte
rna
tio
na
lT
he
Un
ite
d N
atio
ns D
eve
lop
me
nt
Pro
gra
mm
eh
as a
Su
sta
ina
ble
De
ve
lop
me
nt
Ne
two
rkin
gP
rog
ram
me
th
at
co
nta
ins t
oo
ls t
o h
elp
pe
op
lein
de
ve
lop
ing
co
un
trie
s s
ha
re in
form
atio
n a
nd
exp
ert
ise
.
htt
p:/
/ww
w.s
dn
p.u
nd
p.o
rgN
etw
ork
s,
ne
wsle
tte
rs
Eu
rop
eT
he
Eu
rop
ea
n U
nio
n’s
Eu
rop
ea
n E
nviro
nm
en
tA
ge
ncy p
rovid
es v
alu
ab
le in
form
atio
n o
nre
so
urc
e-r
ela
ted
activitie
s in
th
e U
nio
n,
an
dp
rovid
es lin
ks t
o a
ra
ng
e o
f n
etw
ork
s.
htt
p:/
/ww
w.e
ea
.eu
.in
t/
Pa
rtn
ers
hip
sIn
tern
atio
na
lT
he
Un
ite
d N
atio
ns s
po
nso
red
Wo
rld
Su
mm
ito
n S
usta
ina
ble
De
ve
lop
me
nt
inJo
ha
nn
esb
urg
, 2
00
2,
resu
lte
d in
a p
art
ne
rsh
ipin
itia
tive
th
at
is o
n-g
oin
g.
Th
e w
eb
site
acts
as
a g
ate
wa
y t
o in
-de
pth
in
form
atio
n o
n c
ha
ng
ep
rog
ram
me
s a
nd
pro
ce
sse
s in
a w
ide
r ra
ng
eo
f to
pic
s a
nd
co
un
trie
s.
htt
p:/
/ww
w.u
n.o
rg/e
sa
/su
std
ev/p
art
ne
rsh
ips/lis
t_p
art
ne
rsh
ips.h
tm
Da
tab
ase
sC
hile
Th
e R
Ro
jas D
ata
ba
nk is p
rod
uce
d b
y a
n N
GO
in C
hile
an
d in
clu
de
s a
sig
nific
an
t co
llectio
n o
fu
p-t
o-d
ate
aca
de
mic
writin
g o
n s
usta
ina
ble
de
ve
lop
me
nt.
htt
p:/
/ww
w.r
roja
sd
ata
ba
nk.o
rg/d
ev1
00
0.h
tm
Bo
oks,
art
icle
s,
vid
eo
sT
he
re a
re m
an
y w
eb
site
s t
ha
t p
rovid
e lis
ts o
fb
oo
ks,
art
icle
s,
vid
eo
s a
nd
oth
er
reso
urc
es.
Th
is e
xa
mp
le is f
rom
th
e U
niv
ers
ity o
fM
ich
iga
n’s
Ce
ntr
e f
or
Su
sta
ina
ble
Syste
ms.
htt
p:/
/css.s
nre
.um
ich
.ed
u/
htt
p:/
/ww
w.u
mic
h.e
du
/~n
pp
cp
ub
/re
so
urc
es/
R &
D p
rog
ram
me
sN
eth
erla
nd
sT
he
Urb
an
Wa
ste
Exp
ert
ise
Pro
gra
m is a
Du
tch
in
itia
tive
th
at
inclu
de
s r
ese
arc
h &
pilo
tp
rog
ram
me
s,
as w
ell
as p
art
ne
rsh
ips b
etw
ee
ng
ove
rnm
en
t a
nd
co
mm
erc
e,
an
d f
ocu
se
s o
nsm
all-
sca
le t
ech
no
log
ies f
or
inte
gra
ted
su
sta
ina
ble
wa
ste
ma
na
ge
me
nt.
htt
p:/
/ww
w.w
aste
.nl/in
de
x.h
tml

Page 242 Resource Stewardship and Waste Minimisation
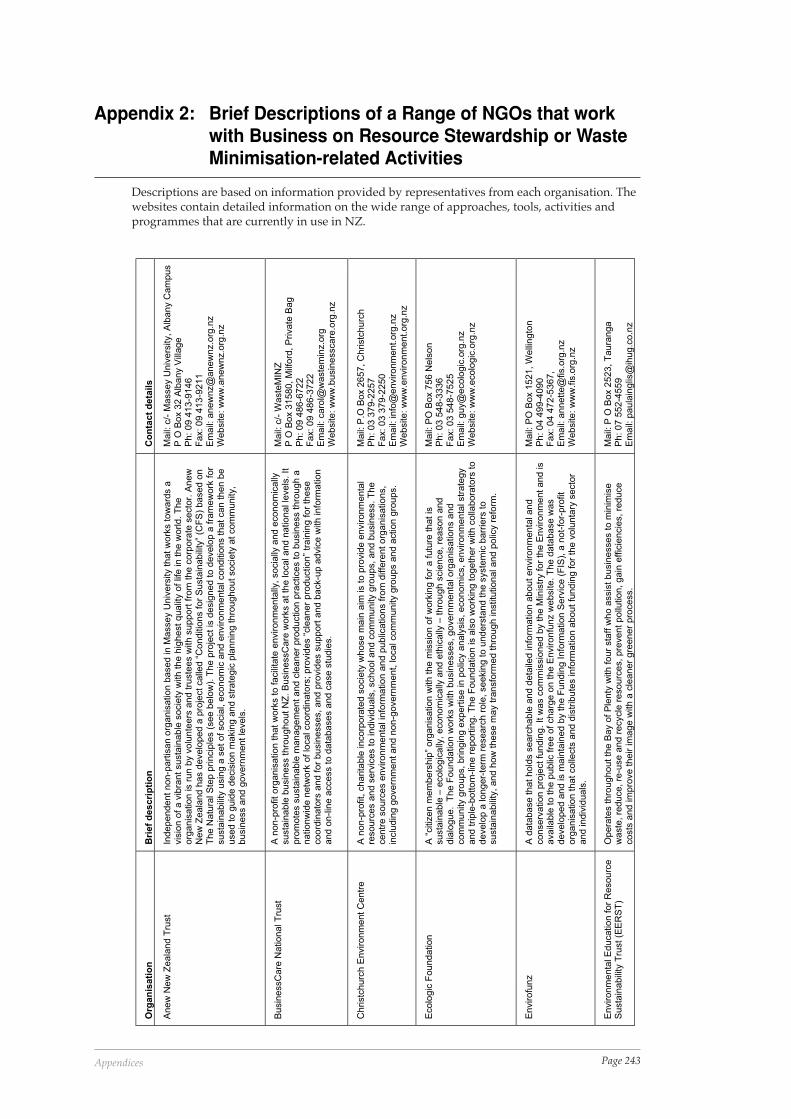
Page 243Appendices
Org
an
isa
tio
nB
rie
f d
es
cri
pti
on
Co
nta
ct
de
tail
s
An
ew
Ne
w Z
ea
lan
d T
rust
Ind
ep
en
de
nt
no
n-p
art
isa
n o
rga
nis
atio
n b
ase
d in
Ma
sse
y U
niv
ers
ity t
ha
t w
ork
s t
ow
ard
s a
vis
ion
of
a v
ibra
nt
su
sta
ina
ble
so
cie
ty w
ith
th
e h
igh
est
qu
alit
y o
f lif
e in
th
e w
orld
. T
he
org
an
isa
tio
n is r
un
by v
olu
nte
ers
an
d t
ruste
es w
ith
su
pp
ort
fro
m t
he
co
rpo
rate
se
cto
r. A
ne
wN
ew
Ze
ala
nd
ha
s d
eve
lop
ed
a p
roje
ct
ca
lled
“C
on
ditio
ns f
or
Su
sta
ina
bili
ty”
(CF
S)
ba
se
d o
nT
he
Na
tura
l S
tep
prin
cip
les (
se
e b
elo
w).
Th
e p
roje
ct
is d
esig
ne
d t
o d
eve
lop
a f
ram
ew
ork
fo
rsu
sta
ina
bili
ty u
sin
g a
se
t o
f so
cia
l, e
co
no
mic
an
d e
nviro
nm
en
tal co
nd
itio
ns t
ha
t ca
n t
he
n b
eu
se
d t
o g
uid
e d
ecis
ion
ma
kin
g a
nd
str
ate
gic
pla
nn
ing
th
rou
gh
ou
t so
cie
ty a
t co
mm
un
ity,
bu
sin
ess a
nd
go
ve
rnm
en
t le
ve
ls.
Ma
il: c
/- M
asse
y U
niv
ers
ity,
Alb
an
y C
am
pu
sP
O B
ox 3
2 A
lba
ny V
illa
ge
Ph
: 0
9 4
13
-91
46
Fa
x:
09
41
3-9
21
1E
ma
il: a
ne
wn
z@
an
ew
nz.o
rg.n
zW
eb
site
: w
ww
.an
ew
nz.o
rg.n
z
Bu
sin
essC
are
Na
tio
na
l T
rust
A n
on
-pro
fit
org
an
isa
tio
n t
ha
t w
ork
s t
o f
acili
tate
en
viro
nm
en
tally
, so
cia
lly a
nd
eco
no
mic
ally
su
sta
ina
ble
bu
sin
ess t
hro
ug
ho
ut
NZ
. B
usin
essC
are
wo
rks a
t th
e lo
ca
l a
nd
na
tio
na
l le
ve
ls.
Itp
rom
ote
s s
usta
ina
ble
ma
na
ge
me
nt
an
d c
lea
ne
r p
rod
uctio
n p
ractice
s t
o b
usin
ess t
hro
ug
h a
na
tio
nw
ide
ne
two
rk o
f lo
ca
l co
ord
ina
tors
; p
rovid
es “
cle
an
er
pro
du
ctio
n”
tra
inin
g f
or
the
se
co
ord
ina
tors
an
d f
or
bu
sin
esse
s,
an
d p
rovid
es s
up
po
rt a
nd
ba
ck-u
p a
dvic
e w
ith
in
form
atio
na
nd
on
-lin
e a
cce
ss t
o d
ata
ba
se
s a
nd
ca
se
stu
die
s.
Ma
il: c
/- W
aste
MIN
ZP
O B
ox 3
15
80
, M
ilfo
rd,
Priva
te B
ag
Ph
: 0
9 4
86
-67
22
Fa
x:
09
48
6-3
72
2E
ma
il: c
aro
l@w
aste
min
z.o
rgW
eb
site
: w
ww
.bu
sin
essca
re.o
rg.n
z
Ch
ristc
hu
rch
En
viro
nm
en
t C
en
tre
A n
on
-pro
fit,
ch
arita
ble
in
co
rpo
rate
d s
ocie
ty w
ho
se
ma
in a
im is t
o p
rovid
e e
nviro
nm
en
tal
reso
urc
es a
nd
se
rvic
es t
o in
div
idu
als
, sch
oo
l a
nd
co
mm
un
ity g
rou
ps,
an
d b
usin
ess.
Th
ece
ntr
e s
ou
rce
s e
nviro
nm
en
tal in
form
atio
n a
nd
pu
blic
atio
ns f
rom
diffe
ren
t o
rga
nis
atio
ns,
inclu
din
g g
ove
rnm
en
t a
nd
no
n-g
ove
rnm
en
t, lo
ca
l co
mm
un
ity g
rou
ps a
nd
actio
n g
rou
ps.
Ma
il: P
.O B
ox 2
65
7,
Ch
ristc
hu
rch
Ph
: 0
3 3
79
-22
57
Fa
x:
03
37
9-2
25
0E
ma
il: in
fo@
en
viro
nm
en
t.o
rg.n
zW
eb
site
: w
ww
.en
viro
nm
en
t.o
rg.n
z
Eco
log
ic F
ou
nd
atio
nA
“citiz
en
me
mb
ers
hip
” o
rga
nis
atio
n w
ith
th
e m
issio
n o
f w
ork
ing
fo
r a
fu
ture
th
at
issu
sta
ina
ble
– e
co
log
ica
lly,
eco
no
mic
ally
an
d e
thic
ally
– t
hro
ug
h s
cie
nce
, re
aso
n a
nd
dia
log
ue
. T
he
Fo
un
da
tio
n w
ork
s w
ith
bu
sin
esse
s,
go
ve
rnm
en
tal o
rga
nis
atio
ns a
nd
co
mm
un
ity g
rou
ps,
brin
gin
g e
xp
ert
ise
in
po
licy a
na
lysis
, e
co
no
mic
s,
en
viro
nm
en
tal str
ate
gy
an
d t
rip
le-b
ott
om
-lin
e r
ep
ort
ing
. T
he
Fo
un
da
tio
n is a
lso
wo
rkin
g t
og
eth
er
with
co
llab
ora
tors
to
de
ve
lop
a lo
ng
er-
term
re
se
arc
h r
ole
, se
ekin
g t
o u
nd
ers
tan
d t
he
syste
mic
ba
rrie
rs t
osu
sta
ina
bili
ty,
an
d h
ow
th
ese
ma
y t
ran
sfo
rme
d t
hro
ug
h in
stitu
tio
na
l a
nd
po
licy r
efo
rm.
Ma
il: P
O B
ox 7
56
Ne
lso
nP
h:
03
54
8-3
33
6F
ax:
03
54
8-7
52
5E
ma
il: g
uy@
eco
log
ic.o
rg.n
zW
eb
site
: w
ww
.eco
log
ic.o
rg.n
z
En
viro
fun
zA
da
tab
ase
th
at
ho
lds s
ea
rch
ab
le a
nd
de
taile
d in
form
atio
n a
bo
ut
en
viro
nm
en
tal a
nd
co
nse
rva
tio
n p
roje
ct
fun
din
g.
It w
as c
om
mis
sio
ne
d b
y t
he
Min
istr
y f
or
the
En
viro
nm
en
t a
nd
is
ava
ilab
le t
o t
he
pu
blic
fre
e o
f ch
arg
e o
n t
he
En
viro
nfu
nz w
eb
site
. T
he
da
tab
ase
wa
sd
eve
lop
ed
an
d is m
ain
tain
ed
by t
he
Fu
nd
ing
In
form
atio
n S
erv
ice
(F
IS),
a n
ot-
for-
pro
fit
org
an
isa
tio
n t
ha
t co
llects
an
d d
istr
ibu
tes in
form
atio
n a
bo
ut
fun
din
g f
or
the
vo
lun
tary
se
cto
ra
nd
in
div
idu
als
.
Ma
il: P
O B
ox 1
52
1,
We
llin
gto
nP
h:
04
49
9-4
09
0F
ax:
04
47
2-5
36
7,
Em
ail:
an
ne
tte
@fis.o
rg.n
zW
eb
site
: w
ww
.fis
.org
.nz
En
viro
nm
en
tal E
du
ca
tio
n f
or
Re
so
urc
eS
usta
ina
bili
ty T
rust
(EE
RS
T)
Op
era
tes t
hro
ug
ho
ut
the
Ba
y o
f P
len
ty w
ith
fo
ur
sta
ff w
ho
assis
t b
usin
esse
s t
o m
inim
ise
wa
ste
, re
du
ce
, re
-use
an
d r
ecycle
re
so
urc
es,
pre
ve
nt
po
llutio
n,
ga
in e
ffic
ien
cie
s,
red
uce
co
sts
an
d im
pro
ve
th
eir im
ag
e w
ith
a c
lea
ne
r g
ree
ne
r p
roce
ss.
Ma
il: P
O B
ox 2
52
3,
Ta
ura
ng
aP
h:
07
55
2-4
55
9E
ma
il: p
au
lain
glis
@ih
ug
.co
.nz
Appendix 2: Brief Descriptions of a Range of NGOs that workwith Business on Resource Stewardship or WasteMinimisation-related Activities
Descriptions are based on information provided by representatives from each organisation. Thewebsites contain detailed information on the wide range of approaches, tools, activities andprogrammes that are currently in use in NZ.
Page 244 Resource Stewardship and Waste Minimisation
Environm
enta
l D
efe
nce S
ocie
ty (
ED
S)
An e
nvironm
enta
l advocacy o
rganis
ation b
ased in N
ew
Zeala
nd. Its m
em
bers
are
pro
fessio
nals
who p
art
icip
ate
volu
nta
rily
to a
dvocate
for
better
environm
enta
l outc
om
es.
There
is a
lso a
com
munity o
f people
who s
upport
the s
ocie
ty fin
ancia
lly thro
ugh their
mem
bers
hip
s. E
DS
identifies issues to p
urs
ue b
ased o
n their n
ational im
pact, o
r pote
ntial to
set pre
cedents
or
polic
y. It focuses m
ain
ly in the a
reas o
f la
ndscape, bio
div
ers
ity a
nd
pollu
tion. Its a
ctivitie
s inclu
de: pro
motion o
f polic
y d
evelo
pm
ent; a
dvocacy; in
volv
em
ent in
pla
nnin
g c
ases; lit
igation, and the p
rovis
ion o
f advic
e a
nd s
upport
for
oth
er
gro
ups a
nd
indiv
iduals
when they a
re c
onsis
tent w
ith E
DS
’s s
trate
gic
obje
ctives. E
DS
’s w
ebsite o
ffers
a“B
usin
ess G
ood E
nvironm
enta
l P
ractice G
uid
e”.
Mail:
P O
Box 9
5 1
52, S
wanson, A
uckla
nd
1008, N
ew
Zeala
nd
Ph: 09 8
10-9
594
Fax: 09 8
10-9
120
Em
ail:
manager@
eds.o
rg.n
zW
ebsite: w
ww
.eds.o
rg.n
z
Nels
on E
nvironm
ent C
entr
e (
NE
C)
Work
s w
ithin
the N
els
on r
egio
n to p
rom
ote
environm
enta
l aw
are
ness a
nd facili
tate
environm
enta
lly s
usta
inable
initia
tives. N
EC
opera
tes the R
ecyclin
g C
entr
e a
t P
ascoe S
t, a
nd
is c
urr
ently w
ork
ing w
ith the K
ahura
ngi T
rust, a
s w
ell
as N
els
on C
ity a
nd T
asm
an D
istr
ict
Councils
, to
re-e
sta
blis
h k
erb
sid
e r
ecyclin
g in u
rban a
reas. In
additio
n: th
e C
entr
e e
mplo
ys
two p
art
-tim
e e
nvironm
enta
l educato
rs; has a
cara
van that opera
tes a
s a
mobile
environm
ent
centr
e, and h
as a
website for
new
s, events
cale
ndar,
new
sle
tter,
dis
cussio
n lis
ts a
nd
info
rmation a
bout th
e r
ecyclin
g c
entr
e.
Mail:
3 H
alif
ax S
treet (K
ahura
ngi C
entr
e),
Nels
on
Ph/fax: 03 5
45 9
176
Em
ail:
nec@
tasm
an.n
et
Website: w
ww
.nec.o
rg.n
z
New
Zeala
nd B
usin
ess C
ouncil
for
Susta
inable
Develo
pm
ent (N
ZB
CS
D)
An in
corp
ora
ted socie
ty com
prised of
appro
xim
ate
ly 40 busin
ess m
em
bers
. T
his
socie
tyfo
cuses o
n s
usta
inable
develo
pm
ent, p
rom
oting “
eco-e
ffic
iency”,
innovation a
nd r
esponsib
leentr
epre
neurs
hip
. N
ZB
CS
D p
rovid
es b
usin
ess leaders
hip
, dem
onstr
ating b
est pra
ctice, polic
ydevelo
pm
ent and g
lobal outr
each.
Mail:
P O
Box 1
665, S
hort
land S
treet,
Auckla
nd
Ph: 09 4
88-7
404
Fax: 09 4
88-7
405
Em
ail:
offic
e@
nzbcsd.o
rg.n
zW
ebsite: w
ww
.nzbcsd.o
rg.n
z
New
Zeala
nd E
cola
belli
ng T
rust
The o
ffic
ial environm
enta
l la
belli
ng p
rogra
mm
e for
New
Zeala
nd, and is a
mem
ber
of th
eG
lobal E
co-labelli
ng N
etw
ork
(G
EN
). W
hile
the o
rganis
ation o
pera
tes independently fro
m the
govern
ment, the “
Environm
enta
l C
hoic
e”
tradem
ark
is g
overn
ment ow
ned a
nd e
ndors
ed.
Environm
enta
l C
hoic
e r
eceiv
es d
irect and indirect fu
ndin
g fro
m the g
overn
ment.
Mail:
PO
Box 5
6 5
33, D
om
inio
n R
oad, M
tE
den, A
uckla
nd, 1003
Ph: 09 8
45-3
330
Fax: 09 8
45-3
331
Em
ail:
info
@enviro-c
hoic
e.o
rg.n
zW
ebsite: w
ww
.enviro-c
hoic
e.o
rg.n
z
New
Zeala
nd L
andcare
Tru
st
An independent body o
vers
een b
y s
even tru
ste
e o
rganis
ations. T
hese a
re: F
edera
ted
Farm
ers
, R
ura
l W
om
en N
Z, F
ish &
Gam
e, F
edera
tion o
f M
aori A
uth
orities, E
colo
gic
Foundation, R
oyal N
Z F
ore
st &
Bird, and F
edera
ted M
ounta
in C
lubs o
f N
Z. T
he T
rust w
ork
sw
ith c
om
munity g
roups to e
ncoura
ge s
usta
inable
land m
anagem
ent and b
iodiv
ers
ity, and its
mis
sio
n is to a
chie
ve s
usta
inable
land m
anagem
ent th
rough c
om
munity involv
em
ent.
Focused m
ain
ly o
n the r
ura
l secto
r and p
rim
ary
industr
y, th
e T
rust’s c
oord
inato
rs facili
tate
“landcare
” gro
ups, and h
elp
them
set th
e a
genda, esta
blis
h a
ction p
lans, and s
ourc
e fundin
gand r
esourc
es. T
he T
rust als
o p
rovid
es tra
inin
g, re
searc
h, in
form
ation a
nd fundin
g for
specific
pro
jects
thro
ugh the T
ranspow
er
Landcare
Tru
st G
rants
Pro
gra
mm
e.
Mail:
PO
Box 1
6-2
69, C
hristc
hurc
hP
h: 03 3
49-2
630
Fax: 03 3
49-2
640
Em
ail:
info
@la
ndcare
.org
.nz
Website: w
ww
.landcare
.org
.nz
Page 245Appendices
Ne
w Z
ea
lan
d R
eco
ve
red
Ma
teria
lsE
nte
rprise
Tru
st
(RM
ET
)A
ch
arita
ble
tru
st
tha
t h
as b
ee
n e
sta
blis
he
d t
o p
rovid
e f
ina
ncia
l a
nd
te
ch
nic
al su
pp
ort
to
bu
sin
esse
s t
ha
t re
du
ce
wa
ste
to
la
nd
fill.
Th
e p
rim
ary
ve
hic
le o
f R
ME
T is t
he
Re
cycL
oa
ns
Fu
nd
, e
sta
blis
he
d t
o p
rovid
e f
ina
ncin
g a
lte
rna
tive
s f
or
fle
dg
ling
bu
sin
ess in
itia
tive
s w
ith
ob
jective
s c
on
sis
ten
t w
ith
th
e T
rust’s p
rim
ary
go
al.
Ma
il: P
O B
ox 3
3 1
69
5,
Ta
ka
pu
na
, A
uckla
nd
Ph
: 0
9 4
86
-40
66
Fa
x:
09
48
8-9
41
0E
ma
il: r
ecyclo
an
s@
pl.n
et
Pa
cka
gin
g C
ou
ncil
of
Ne
w Z
ea
lan
dIn
co
rpo
rate
d (
PC
NZ
)A
ims t
o e
nsu
re t
ha
t is
su
es r
ela
ted
to
pa
cka
gin
g u
sa
ge
an
d w
aste
are
ad
dre
sse
d v
olu
nta
rily
by in
du
str
y.
PC
NZ
re
pre
se
nts
va
rio
us s
ecto
rs o
f th
e p
acka
ge
d g
oo
ds in
du
str
y in
clu
din
gm
an
ufa
ctu
rers
, fille
rs,
reta
ilers
an
d c
on
su
me
rs.
It a
lso
wo
rks w
ith
go
ve
rnm
en
t, in
du
str
y a
nd
the
co
mm
un
ity.
Th
e C
ou
ncil’
s E
nviro
nm
en
tal P
acka
gin
g A
wa
rds r
eco
gn
ise
an
d r
ew
ard
th
ose
wh
o c
on
trib
ute
to
im
pro
ve
th
e e
nviro
nm
en
tal p
erf
orm
an
ce
of
pa
cka
gin
g,
pa
cka
gin
g s
yste
ms
or
the
op
era
tio
n o
f th
eir m
an
ufa
ctu
rin
g f
acili
tie
s.
Th
e C
ou
ncil
als
o o
ffe
rs a
n e
du
ca
tio
na
lre
so
urc
e c
alle
d ‘P
AC
-IT
’, t
ha
t is
aim
ed
prim
arily
at
sch
oo
ls (
ye
ars
1-1
0),
bu
t is
co
nsid
ere
dsu
ita
ble
fo
r w
ide
r e
du
ca
tio
n in
bo
th t
he
te
rtia
ry a
nd
in
du
str
y s
ecto
rs.
Ma
il: P
O B
ox 5
88
99
, G
ree
nm
ou
nt
Ph
: 0
9 2
62
-40
44
Fa
x:
09
26
2-4
11
1E
ma
il: p
ac.n
z@
pa
cka
gin
g.o
rg.n
zW
eb
site
: w
ww
.pa
cka
gin
g.o
rg.n
z
Pla
stics N
ew
Ze
ala
nd
In
co
rpo
rate
d(P
NZ
)O
ffe
rs a
dvic
e a
nd
in
form
atio
n o
n p
lastics a
nd
th
e e
nviro
nm
en
t in
a n
um
be
r o
f a
rea
sin
clu
din
g:
pla
stics r
ecyclin
g,
en
erg
y c
on
se
rva
tio
n,
ed
uca
tio
n r
eso
urc
es,
sta
nd
ard
s,
go
ve
rnm
en
t/g
ove
rna
nce
, la
be
llin
g a
nd
ma
na
ge
me
nt.
Ma
il: P
O B
ox 7
6 3
78
, M
an
uka
u C
ity
Ph
: 0
9 2
62
-37
73
ext
10
4F
ax:
09
26
2-3
85
0W
eb
site
: w
ww
.pla
stics.o
rg.n
z
Re
cyclin
g O
pe
rato
rs o
f N
ew
Ze
ala
nd
(RO
NZ
)A
n o
rga
nis
atio
n t
ha
t re
pre
se
nts
re
cyclin
g s
erv
ice
pro
vid
ers
, o
pe
rato
rs a
nd
ed
uca
tors
in
th
ere
co
ve
red
ma
teria
ls a
nd
re
cyclin
g in
du
str
y.
It lo
bb
ies a
nd
pro
mo
tes r
ecyclin
g,
reso
urc
ee
ffic
ien
cy a
nd
wa
ste
min
imis
atio
n in
Ne
w Z
ea
lan
d.
Its m
em
be
rs in
clu
de
bu
sin
esse
s,
org
an
isa
tio
ns,
loca
l a
nd
re
gio
na
l co
un
cils
, e
du
ca
tors
an
d in
div
idu
als
. S
om
e o
f th
e s
erv
ice
s it
off
ers
to
me
mb
ers
in
clu
de
: a
dvo
ca
cy a
nd
lo
bb
yin
g o
f g
ove
rnm
en
t a
nd
in
du
str
y,
ed
uca
tio
na
nd
in
form
atio
n t
hro
ug
h a
we
bsite
an
d a
ne
wsle
tte
r, w
ork
sh
op
s,
ne
two
rkin
g a
nd
pro
mo
tio
n,
an
d r
ese
arc
h a
nd
de
ve
lop
me
nt.
Ma
il: P
O B
ox 3
3 1
83
, T
aka
pu
na
, A
uckla
nd
Ph
: 0
9 4
88
-94
49
Fa
x:
09
48
8-9
41
0E
ma
il: k
aru
na
@ro
nz.o
rg.n
zW
eb
site
: w
ww
.ro
nz.o
rg.n
z
Re
de
sig
nin
g R
eso
urc
es (
RR
)A
bu
sin
ess le
ad
ers
hip
pro
gra
mm
e,
be
gu
n w
ith
th
e in
au
gu
ral “R
ed
esig
nin
g R
eso
urc
es”
co
nfe
ren
ce
in
Ju
ne
20
00
. P
art
icip
atin
g o
rga
nis
atio
ns a
re r
ed
esig
nin
g t
he
ir b
usin
ess m
od
els
an
d p
ractice
ba
se
d o
n t
he
prin
cip
les o
f H
aw
ke
n’s
“N
atu
ral C
ap
ita
lism
” (1
99
1).
“T
he
Re
de
sig
nin
g R
eso
urc
es S
tory
– 8
Co
mp
an
ies C
rea
tin
g N
ew
Va
lue
” is
ava
ilab
le t
hro
ug
h M
fE,
the
org
an
isa
tio
n o
r its w
eb
site
. R
R in
clu
de
s a
bi-a
nn
ua
l N
atio
na
l A
rt A
wa
rd in
se
co
nd
ary
ma
teria
ls.
Ma
il: P
O B
ox 5
78
, C
hristc
hu
rch
Ph
: 0
21
43
44
00
Em
ail:
ma
rk@
tip
pin
gp
oin
t.co
.nz
We
bsite
: w
ww
.re
de
sig
nin
gre
so
urc
es.o
rg
Su
sta
ina
ble
Bu
sin
ess N
etw
ork
Th
e r
esu
lt o
f a
me
rge
r b
etw
ee
n t
he
Au
ckla
nd
En
viro
nm
en
tal B
usin
ess N
etw
ork
(A
EB
Nfo
rme
d in
19
94
) a
nd
NZ
Bu
sin
esse
s f
or
So
cia
l R
esp
on
sib
ility
(fo
rme
d in
19
98
), t
ha
t to
ok
pla
ce
in
Octo
be
r 2
00
2.
Th
e S
usta
ina
ble
Bu
sin
ess N
etw
ork
is a
me
mb
ers
hip
org
an
isa
tio
n w
ith
reg
ion
al o
ffic
es in
fiv
e c
en
tre
s a
cro
ss N
ew
Ze
ala
nd
an
d a
na
tio
na
l o
ffic
e b
ase
d in
Au
ckla
nd
.
Ma
il: P
O B
ox 1
47
26
3,
Po
nso
nb
y,
Au
ckla
nd
Ph
: 9
20
24
00
Fa
x:
36
0-7
10
2E
ma
il: o
ffic
e@
su
sta
ina
ble
.org
.nz
Page 246 Resource Stewardship and Waste Minimisation
The n
etw
ork
has taken o
n the c
halle
nge o
f m
akin
g s
usta
inable
pra
ctice m
ain
str
eam
; to
see
busin
ess flo
urish thro
ugh s
usta
inable
pra
ctice a
nd; to
desig
n its
serv
ices, re
sourc
es a
nd
activitie
s to s
uit the n
eeds o
f sm
all
and m
ediu
m s
ized b
usin
esses.
website: w
ww
.susta
inable
.org
.nz
The N
atu
ral S
tep E
nvironm
ent
Foundation A
ote
aro
a N
ew
Zeala
nd
(TN
S)
A n
ational bra
nch o
f an inte
rnational non-p
rofit susta
inabili
ty o
rganis
ation, T
he N
atu
ral S
tep,
based in S
weden. T
NS
work
s p
redom
inantly w
ith b
usin
esses a
nd g
overn
ment help
ing
inte
gra
te s
usta
inabili
ty into
core
str
ate
gy a
nd o
pera
tions. O
ne o
f th
e k
ey c
hara
cte
ristics o
fT
NS
is the d
evelo
pm
ent of to
ols
to a
ssess s
usta
inabili
ty s
uch a
s ‘T
he N
atu
ral S
tep
Fra
mew
ork
’. T
NS
utilis
es a
‘syste
ms a
ppro
ach’, r
ecognis
ing the inte
rconnecte
dness b
etw
een
diffe
rent part
s o
f th
e s
yste
m a
nd that th
ey a
ffect one a
noth
er.
It advocate
s the u
se o
f‘b
ackcasting’1
fro
m p
rincip
les for
a s
usta
inable
futu
re. T
NS
pro
vid
es tra
inin
g a
nd c
onsultancy
with r
espect to
the T
NS
Fra
mew
ork
and its
im
ple
menta
tion. T
NS
has thre
e m
ain
curr
ent
pro
jects
, th
e ‘P
ath
finder
Pro
gra
mm
e’ w
hic
h c
onsis
ts o
f 8 larg
e -
mediu
m b
usin
esses a
pply
ing
TN
S F
ram
ew
ork
, a s
mall
busin
ess p
rogra
mm
e w
ork
ing w
ith 9
com
panie
s, and, an e
ducation
cours
e, ru
n b
y T
he O
pen P
oly
technic
.
Mail:
P O
Box 6
9, Lin
coln
8152
Ph: 03 3
25-6
711
Fax: 03 3
25-2
418
Em
ail:
nats
tep@
natu
rals
tep.o
rg.n
zW
ebsite: w
ww
.natu
rals
tep.o
rg.n
z
The W
aste
Exchange
A w
eb-b
ased d
ata
base that gath
ers
info
rmation a
bout re
sourc
es o
ffere
d a
nd w
ante
d b
ydiffe
rent busin
esses a
nd indiv
iduals
. T
his
data
base p
rovid
es s
earc
h tools
to s
eek for
mate
rials
by type a
nd r
egio
n. B
usin
esses c
an r
egis
ter
for
free a
s u
sers
to a
ccess d
eta
iled
info
rmation.
Ph: 0
800 N
O T
HR
OW
(0800 6
68 4
769)
Em
ail:
pip
pa@
noth
row
.co.n
zW
ebsite: w
ww
.noth
row
.co.n
z
Waste
Managem
ent In
stitu
te o
f N
ew
Zeala
nd Incorp
ora
ted (
Waste
MIN
Z)
A n
on-p
rofit org
anis
ation that pro
mote
s s
usta
inable
waste
managem
ent pra
ctices. Its m
ain
role
is to p
rovid
e a
foru
m for
pre
senta
tion a
nd d
issem
ination o
f in
form
ation a
nd to a
ct as a
facili
tato
r fo
r th
e w
aste
managem
ent in
dustr
y in N
Z (
Waste
MIN
Z, 2002).
Waste
MIN
Zpro
vid
es a
n a
nnual confe
rence, conducts
work
shops a
nd s
em
inars
, publis
hes the “
Waste
Aw
are
ness”
new
sle
tter
and a
lso o
ffers
gra
nts
for
its m
em
bers
. T
he o
rganis
ation h
as 3
00
mem
bers
who r
epre
sent th
e p
ublic
, private
and n
on-p
rofit secto
rs. In
2001, W
aste
MIN
Zdevelo
ped “
lifeafterw
aste
”, a
n initia
tive that aim
s to e
ncoura
ge a
cyclic
al appro
ach to w
aste
.Lifeafterw
aste
aim
s a
t clo
sin
g the loop o
n w
aste
and p
roposes a
shift fr
om
waste
managem
ent to
waste
avoid
ance.
Mail:
PO
Box 3
1 5
80, M
ilford
, A
uckla
nd,
New
Zeala
nd
Phone 0
9 4
86-6
722
Fax 0
9 4
86-3
722
Em
ail:
caro
le@
waste
min
z.o
rg.n
zw
aste
min
z@
xtr
a.c
o.n
z,
Website: w
ww
.waste
min
z.o
rg.n
z
Waste
Not A
uckla
nd C
harita
ble
Tru
st
Opera
tes the W
aste
No
t consultancy. W
aste
Not specia
lises in w
aste
and r
esourc
eeffic
iency, and o
ffers
waste
min
imis
ation s
erv
ices to its
clie
nts
. S
om
e o
f th
e p
roje
cts
in w
hic
hM
ail:
PO
Box 3
3 1
410, T
akapuna, A
uckla
nd
Ph: 09 4
86-3
635
1 B
ackcasting is the term
TN
S u
ses to d
escribe “
the p
rocess o
f pla
nnin
g fro
m a
futu
re v
isio
n u
sin
g [T
NS
] princip
les” .
Page 247Appendices
Wa
ste
No
t h
as p
art
icip
ate
d in
clu
de
: a
stu
dy o
n t
he
im
pa
cts
of
recyclin
g b
usin
esse
s in
a lo
ca
le
co
no
my;
an
au
dit o
f h
osp
ita
l clin
ica
l w
aste
; d
eve
lop
me
nt
of
an
org
an
ic w
aste
re
co
ve
rystr
ate
gy f
or
a lo
ca
l co
un
cil;
in
ve
stig
atio
n w
ork
on
co
nta
min
ate
d s
ite
s,
an
d t
he
de
ve
lop
me
nt
of
ed
uca
tio
n a
nd
tra
inin
g m
ate
ria
l.
Fa
x:
09
48
6-5
76
4E
ma
il: w
aste
no
t@xtr
a.c
o.n
zW
eb
site
: w
ww
.wa
ste
no
t.co
.nz
Wa
ste
Bu
ste
rs T
rust
De
live
rs a
“B
usin
ess W
aste
Min
imis
atio
n &
Wa
ste
Exch
an
ge
Pro
gra
mm
e”
in t
he
Ash
bu
rto
na
nd
Se
lwyn
Dis
tric
ts u
nd
er
co
ntr
act
to E
nviro
nm
en
t C
an
terb
ury
. T
his
is a
hu
ma
n r
eso
urc
es
pro
gra
mm
e w
he
reb
y t
rain
ed
sta
ff v
isit lo
ca
l b
usin
esse
s t
o h
elp
th
em
to
re
du
ce
wa
ste
an
d t
ofin
d m
ark
ets
fo
r m
ate
ria
ls t
ha
t a
re c
urr
en
tly la
nd
fille
d o
r b
urn
t. T
he
pro
gra
mm
e is b
ase
d o
nth
e “
po
llutio
n p
reve
ntio
n”
ap
pro
ach
, a
nd
em
ph
asis
es r
ed
uctio
n,
re-u
se
an
d r
ecyclin
g a
sp
rio
ritie
s o
ve
r d
isp
osa
l. I
t a
lso
ho
lds a
nn
ua
l “C
lea
n G
ree
n B
usin
ess A
wa
rds”
to r
eco
gn
ise
an
dre
wa
rd b
usin
esse
s t
ha
t a
re r
ed
ucin
g w
aste
by u
sin
g m
ate
ria
ls m
ore
eff
icie
ntly,
red
ucin
ge
ne
rgy c
on
su
mp
tio
n a
nd
usin
g le
ss w
ate
r.
Ma
il: P
O B
ox 3
23
, A
sh
bu
rto
n,
Ph
: 0
3 3
08
-99
98
Fa
x:
03
30
8-9
98
9E
ma
il: m
cw
aste
bu
ste
rs@
cle
ar.
ne
t.n
zW
eb
site
: h
ttp
://w
aste
bu
ste
rs.o
rco
n.n
et.
nz
Ze
ro W
aste
Ne
w Z
ea
lan
d T
rust
(Ze
roW
aste
)A
n o
rga
nis
atio
n d
ed
ica
ted
to
th
e p
rom
otio
n o
f “z
ero
wa
ste
prin
cip
les”
am
on
g a
ll se
cto
rs o
f N
Zso
cie
ty,
with
sp
ecific
fo
cu
s o
n s
olid
wa
ste
. T
akin
g a
“w
ho
le s
yste
m”
ap
pro
ach
, Z
ero
Wa
ste
pro
po
se
s a
re
de
sig
n o
f th
e in
du
str
ial syste
m a
llow
ing
fo
r p
rod
ucts
to
be
re
-use
d,
rep
aire
d a
nd
recycle
d b
ack in
to n
atu
re o
r th
e m
ark
et
pla
ce
. T
he
org
an
isa
tio
n’s
ma
in g
oa
l is
to
ach
ieve
“ze
ro w
aste
” a
t a
na
tio
na
l le
ve
l. T
his
go
al is
pu
rsu
ed
by s
up
po
rtin
g t
he
Ze
ro W
aste
Ne
two
rk(in
clu
din
g “
Ze
ro W
aste
Co
un
cils
”, c
om
mu
nity o
rga
nis
atio
ns,
bu
sin
esse
s,
ed
uca
tio
na
l fa
cili
tie
sa
nd
re
cycle
rs).
Su
pp
ort
ta
ke
s t
he
fo
rm o
f: a
dvo
ca
cy a
nd
po
licy d
eve
lop
me
nt;
ne
two
rkin
g a
nd
tech
no
log
y t
ran
sfe
r, a
nd
fu
nd
ing
. Z
ero
Wa
ste
dis
trib
ute
s in
form
atio
n t
o t
he
Ze
ro W
aste
Ne
two
rk v
ia a
mo
nth
ly n
ew
sle
tte
r a
nd
its
we
bsite
.
Ma
il: P
O B
ox 3
3 1
69
5,
Ta
ka
pu
na
,A
uckla
nd
, N
ew
Ze
ala
nd
Ph
: 0
9 4
86
07
34
Fa
x:
09
48
9 3
23
2E
ma
il: m
ailb
ox@
ze
row
aste
.co
.nz
We
bsite
: w
ww
.ze
row
aste
.co
.nz

Page 248 Resource Stewardship and Waste Minimisation
Page 249Index
Index
‘100% Pure New Zealand’ 137
Aaccess to wetlands 47
Action Plan for Buildings and Appliances 110
Adventure South 141
Agenda 21 91
air quality 56
AMF see anhydrous milkfat
Anew New Zealand Trust 18
anhydrous milkfat production 38
Animal Product Regulations (2000) 69
Animal Products Act (1999) 69, 70, 218
animal welfare 72
animal welfare management package 36
annual harvest, forestry 75
annual mass balance 195
APEC Tourism Working Group 146
APEC/PATA Code 146, 147
Asian tourists 140
Association of Plastics Manufacturers inEurope 180
Auckland City Council 228
Auckland Regional Council 17, 109
Auctioneers Act 166
Australian Council of Recyclers 184
Australian Packaging Covenant 184
AUT Sports & Recreation Centre 114
Bbaghouses 40
Beaumont Quarter 112
beef meats 51, 52
behavioural change 13
Better Building Code 109
bio-energy 79
Bio-energy Association of New Zealand 93
biomass boilers 80
Blows Building 113
BRANZ 105, 109
BSE 70
Building Code see New Zealand Building Code
building consent values 99
Business Council for Sustainable Developmentsee New Zealand Business Council forSustainable Development
BusinessCare National Trust 17, 18, 190, 199,231
butter manufacturing 37
butter production 37
buttermilk 37
CCAE RS:WM project see Resource Stewardship:
Waste Minimisation project
CAE see Centre for Advanced Engineering
Canterbury Environment Centre 18
capacity building 224
carbon tax 14, 71
Carters 158
casein manufacture 41
caseinate manufacture 41
caseinates 42
Centre for Advanced Engineering(CAE) 3, 23, 25
changeactions 9principle 9
cheese manufacture 39chemical
pulp 79scorecard 14
chemicals, reuse and recycling 94
chlorine 79
Christchurch City Council 17, 109, 122, 164
cleaner production 25
Cleaner Production Guidelines 16
Cleanfill Guidelines 121
clean-green marketing strategy 48
closing the loop 7
CO2 emissions 137, 208
coastline 100
Code for Sustainable Tourism 146
Code of Good Practice for Energy Efficiency ofHouses 110
Code of Practice for the Safe Use of timberPreservatives and Antisapstain Chemicals91, 218
coloured rubbish bags 192
Commerce Act 166
community expectations 48
Conservation and Sustainable Management ofTemperate and Boreal Forests 92
construction energy 101
consumer goods, availability 153
consumer rights 166
Page 250 Resource Stewardship and Waste Minimisation
consumerism responses 169
Consumers Guarantees Act 166, 218
contaminated sites 14
customer requirements 48
Ddairy
exports, value of 35farming 33products 35
Dairy Industry Environmental and AnimalWelfare Policies 47, 218
Dairy Industry Waste Minimisation project 46
demographic profile 105
demolition industry 103
demolition waste 106
Department of Conservation 147
Design Briefs for Energy Efficient CommercialBuildings 110
Design for the Sun 122
Designing Comfortable Homes 110
Destination New Zealand 137, 150
Developers’ Design Guide 108
diafiltration 43
Dioxin Action Plan 186
discharge consents 80
dispersed air flotation 85
District Tourism Organisations 145
Dolphin Encounter 144
domestic buildings 103domestic tourism 133, 137
day trips 134expenditure 135
Douglas Fir 75
drivers for change 29
dropped meat programme 65
dust emissions 93
Dutch tourists 140
Eeconomic drivers 219, 221
EECA see Energy Efficiency and ConservationAuthority
effluent 79
effluent treatment, forestry 85
Electricity Corporation of New Zealand 25
Emergency Planning and CommunityRight-to-Know Act (1986) 13
employmentforest industry 76meat processing 54
energy audits 62
Energy Efficiency and Conservation Act (2001)10, 16, 93, 110, 118, 158, 167, 205
Energy Efficiency and Conservation Authority10, 231
Energy Efficiency and Conservation AuthorityAct (2000) 4
Energy Efficiency and Conservation Strategy7, 10, 11, 13, 93
Energy Efficiency Regulations 118, 158, 165
energylabelling 158recovery 181use, farming 35use, built environment 100, 101, 103, 110,115, 121
engineered landfills 3
Enviro-Mark NZ 160
Environment 2010 Strategy 91
Environment Bay of Plenty 91
Environment Waikato 183
environmental and animal welfareguidelines 35
Environmental Defense Society 18
Environmental Farm Awards 71
environmental image 149
environmental management systems 47, 91
Environmental Performance Indicator 88
environmental purchasing policies 72
ERMA New Zealand 195
estuaries 100
Eucalyptus 75
European Directive for Waste 181
European tourists 140
export earnings, meat industry 51
exports, forestry 75
Extended Producer Responsibility 8, 174, 187
external integration 224
FFair Trading Act 166
farmdairy effluent 47distribution 55quality assurance programmes 66sector 34meat 54
Farm Environmental Award scheme 57, 58, 72
fat recovery systems 37, 38
fertiliser usage 47
fibre recovery, forestry 85, 90
fibre, reuse and recycling 94
fibreboard 78
Page 251Index
financial instruments 169
Fletcher Challenge 105
floodplains 100
fluid bed dryers 42
Fonterra Research Centre 46, 47
food retailing 165
Forest Industries Training 92
Forest Research 89, 105
Forest Stewardship Council 92, 160
forestry industry 75, 76
Fraser High School 183
Friends of the Earth New Zealand 18
fugitive emissions 93
full-cost pricing 8
Ggaseous emissions 80
GDP, retail sector contribution 154
German tourists 140
Good Solutions Guide 108
Green Globe 21 benchmarking 139, 141, 144,146, 147, 150, 151
Green Project farm management system 57, 72
‘green’ retail businesses 158
Green Retail project 162
greenhouse gas emissions 212
Greenpeace New Zealand 18, 20, 181
HHamilton City Council 109
Hamilton Sealed Air site 183
harvesting, forestry 77, 80
Hazardous Substances and New Organisms Act(1996) 190, 218
hazardous waste 3
Health Act (1956) 118, 129
Health and Safety in Employment Act (1992)69, 91, 218
Heat Loss Reduction in Houses 110
holiday/leisure travel 134
human waste 47
Iimported goods 155, 157
Industry Guide to Zero Waste 16
in-forest resdiues 79
instruments and tools 4
internal integration 224
international visitors 132
international visitor spending 132
ISO 14000 47
ISO 14001 68, 72
ISO 9001 68
KKaikoura Winery 139
Kaitia Community Business and EnvironmentCentre 18
kaitiaki 4, 5
kaitiakitanga 4, 5, 8, 140, 143, 147, 150
kerb-side recycling 66
Kraft pulp and paper machine 84
Kraft Recovery process 83
Kyoto Protocol 4, 14, 15, 62, 71, 76, 91, 119, 122,146, 208, 218
Llactose 45
lactose powder 43
laminated veneer lumber 77
landfills 79disposal, forestry 80leachate 80waste 100
Landfill Full Cost Accounting Guide 121
Landfill Guidelines 3
land-use competition 53
Lay-by-Sales Act 166
legislation, retail sector 153
lifeafterwaste programme 7, 9, 13, 205
life-cycle assessments 75
life-cycle principle 8
lifestyle blocks 53
livestock distribution 55
Local Government Act (1974) 15, 104, 117, 118,129, 218
Local Government Act (2002) 205
Local Government Amendment Act (1996) 15,205
Local Government New Zealand 7, 189, 196,231
logs 77production 75transport 87
low density polyethylene 176
lumber 77
Mmaintenance energy 101
manaakitanga 147, 150
Management of Hazardous Waste 3
marginal agricultural land 75
market focused 36
Maruia Society 18
Page 252 Resource Stewardship and Waste Minimisation
Massey University 178
material waste 100, 103, 109, 113, 118, 120, 123
MDF 78
MDF production 83
Meat Act 69
meatexports 51, 65industry treatment systems 65packaging technology 64production 51, 52, 53sector governance 69
meat processingoperations 60, 61plants 52plant distribution 55waste minimisation 66, 67water use 63
mechanical pulp 78
mechanical vapour recompression 39
merchandise imports 155
milk powder manufacture 38
milk products 33
Minimum Energy Performance Standards 159
Minister of Energy 10
Ministry for the Environment (MfE) 3, 7, 25, 91,120, 121, 124, 147, 174, 177, 180, 186, 190,191, 199, 231, 232
Ministry for the Environment LandfillGuidelines 91
Ministry of Energy 7, 231
Ministry of Tourism 145, 147
Montreal Process 92
multiple-effect evaporation 39
Nnano-filtration 44
National Energy Efficiency and ConservationStrategy 110, 119, 205, 218, 233
natural emissions 35
Natural Step Environment Foundation 18
Nelson Environment Centre 18
new dwellings 99
New ZealandBuilding Act (1991) 118, 121, 129Building Code 90, 106, 121, 218Business Council for SustainableDevelopment 16, 18Code of Practice for Packaging of Goods184, 191Dairy Research Institute 47economy 34Forest Accord 92Forest Code of Practice 92, 218
Packaging Accord 175, 179, 185, 191Packaging Code of Practice 218Packaging Council 18, 178, 184, 191, 197Packaging Council Environmental Awards187Plastics Sustainability Initiative 17Recovered Materials Enterprise Trust 18Retailers Association 157, 165Tourism Board 138Tourism Strategy 140, 142, 143, 146, 147, 218Trade and Enterprise 190Waste Strategy 3, 7, 8, 9, 13, 15, 91, 92, 118,120, 124, 179, 185, 187, 197, 205, 218, 225, 233
noise issues 93
non-destructive testing 91
non-residential dwellings 99
North American tourists 140
OOccupational Safety and Health 91
on-farm environmental management system 36
on-farm quality assurance 36
operational energy 101
Our Waste: Our Responsibility 3, 4, 17, 20
Ppackaging 156, 160
Packaging Council of New Zealand see NewZealand Packaging Council
panel manufacture 77
paper 79
Parliamentary Commissioner for theEnvironment 232
particleboard 78
Passive Solar Design in New Zealand Homes 122
pastoral-based agriculture 56
Pawnbrokers Act 166
People, Places, Spaces: a Design Guide for UrbanNew Zealand 108, 122
permeate processing 43
Pine Manufacturers Association 92
Pinus Radiata 75
plant efficiency, meat 62
plantation forest area 76
plantation forests 75
Plastics New Zealand 18, 173 - 178, 182, 185,187, 189, 193, 194, 196, 197
Plastics New Zealand Sustainability Initiative199
plywood 77
political drivers 219, 220
pollution prevention 25
Pollution Prevention Act (1990) 13
Page 253Index
polypropylene 176
poultry meat producers 52
precautionary principle 8
primary screening 65
primary treatment 65
process mapping 162, 163
processing sector 34
processing, meat 54
profit improvement programme 66, 72
public relations 71
pulp 78
pulp and paper 83
pulp mill effluent 80
RREBRI 109
reconstituted panel products 78
Recovered Materials Foundation 189
recycled paper 79
recycled timber 158
recycling 169
Recycling Operators of New Zealand (RONZ)184, 189, 196, 199
Redesigning Resources 18
refrigeration heat recovery systems 64
Regional Tourism Organisations 145
regulatory requirements 48
remanufacturing 79, 84
rennet casein production 42
Residential Design Guide 108
residue production, forestry 80
residue recovery 94
residues 47, 81, 83
resource inputs, meat processing 54
Resource Management Act (1991) 4, 14, 64, 69,70, 91, 104, 117, 118, 129, 165, 167, 181, 190,196, 218
Resource Stewardship: Waste Minimisationproject 17, 23, 28, 205, 231
resource use, retail sector 155
retailbusiness distribution 156employment distribution 156goods 158sector employment 154sector governance 165sector energy savings 161sector legislative drivers for change 167sector transport 159spending 154supply chain 155, 157
reverse osmosis 39, 40, 43, 44
RMA see Resource Management Act (1991)
Road Transport Association 87
Rotorua District Council 91
Royal New Zealand Forest and Bird 18
RS:WM project see Resource Stewardship:Waste Minimisation project
SSales of Goods Act 166
sawmilling industry 89
sawmills 77, 83
Sealed Air Corporation 183
Second Hand Dealers Act 166
secondary treatment 65
sector challenges 10
Seoul Declaration 146, 147
separator desludges 37
sheep meats 51, 52
shop trading laws 153
Silver Beech 92
single use 168
socio-cultural drivers 219, 221
soil quality 56
solid waste 80
stack emissions 93
standardisation 224
Statistics New Zealand 190
steam, reuse and recycling 94
stock 58
Subdivision for People and the Environment 108
superheated steam dryer 62
Sustainable Business Network 18, 199
sustainable farming 66, 72
sustainable farming practices 557
Sustainable Home Guidelines 109
sustainable land management practices 57
sustainable land use 56
Sustainable Management Fund 3, 185, 231
Sustainable New Zealand 3
sustainable tourism development 146
TTapu Te Ranga Marae 112
Target Zero 16, 25, 231
technological drivers 220, 221
texturisers 45
The Body Shop 158
The Warehouse 158, 160, 167
The Waste Exchange 18
The Way Forward: Forestry and the RMA 91
thermal recompression 39
Page 254 Resource Stewardship and Waste Minimisation
timber 75
Timber Industry Federation 92
toolbox 13
total quality management 185
tourismdirect energy consumption 136employment 132expenditure 131market perceptions 140market share 131resource use 136sector governance 144travel means 134waste minimisation 136
Tourism New Zealand 131, 137, 138, 145
Tourism Satellite Account 131
Tourist Industry Association New Zealand 144,147
tourist, products and services 132
Toxics Release Inventory 13
transport, meat 54, 60
Treaty of Waitangi 7, 8
tree growth 75
triboard 78
tropical hardwood 158
UUK tourists 140
ultrafiltration 43
Unison Institute 14
University of Canterbury 115
urban sprawl 100, 101, 102, 104, 108, 111, 117,118, 119, 122
US Environmental Protection Agency 13
VValuing New Zealand’s Clean Green Image 148
veneer 77
Vertex New Zealand 197
visitor perceptions 137, 138
voluntary tools 169
WWaikato Environmental Business Network 183
Waimangu Volcanic Valley Ltd 143
Waitakere City Council 109, 164
Waitakere’s eco-friendly home 116
wastegeneration in retail sector 155in manufacturing 168management hierarchy 6minimisation in retail sector 157, 162, 163,164minimisation in forestry 79
Waste Management Institute of New Zealand 9
Waste Minimisation Opportunity AssessmentManual 16
Waste Not Auckland Charitable Trust 18
waste strategy see New Zealand Waste Strategy
WasteBusters Trust 18
WasteMINZ 189, 196, 199, 231, 232
wastewater 37, 40, 41, 46
wastewater treatment systems 37
waterquality 47, 56use in forestry 84use in meat processing 63
West Coast 92
wheypowder 43processing 43utilisation 45
woodforest industry 82hierarchy 94processing 75processing residues 79production in forestry sector 84
Wood Processing Strategy 93
Working Group on Waste Minimisation andManagement 7
World Commission on Environment andDevelopment 19
world milk production 34
World Tourism Organisation 131
WPC processing 43
ZZero Waste New Zealand Trust 18, 80, 181, 189,
193, 199