Resource Planning Advisory Group Workshop - FortisBC · RPAG Wor kshop Feb 2013 RPAG Wor kshop Jan...
51
Resource Planning Advisory Group Workshop February 9 th , 2012
Transcript of Resource Planning Advisory Group Workshop - FortisBC · RPAG Wor kshop Feb 2013 RPAG Wor kshop Jan...

Resource Planning Advisory Group
Workshop
February 9th, 2012
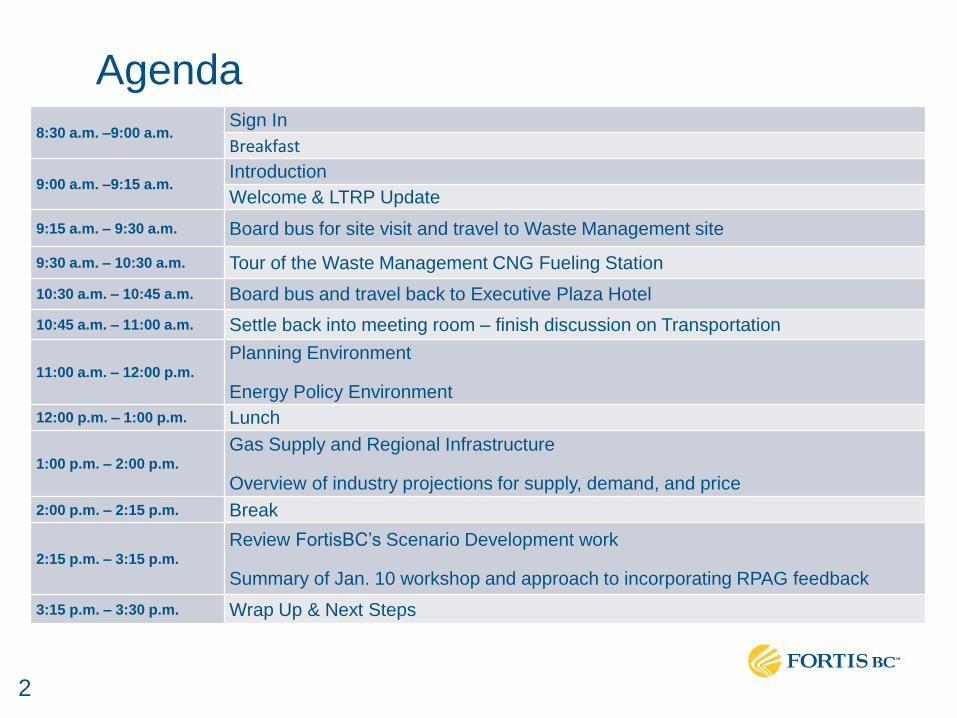
Agenda
8:30 a.m. –9:00 a.m. Sign In
Breakfast
9:00 a.m. –9:15 a.m. Introduction
Welcome & LTRP Update
9:15 a.m. – 9:30 a.m. Board bus for site visit and travel to Waste Management site
9:30 a.m. – 10:30 a.m. Tour of the Waste Management CNG Fueling Station
10:30 a.m. – 10:45 a.m. Board bus and travel back to Executive Plaza Hotel
10:45 a.m. – 11:00 a.m. Settle back into meeting room – finish discussion on Transportation
11:00 a.m. – 12:00 p.m. Planning Environment
Energy Policy Environment
12:00 p.m. – 1:00 p.m. Lunch
1:00 p.m. – 2:00 p.m. Gas Supply and Regional Infrastructure
Overview of industry projections for supply, demand, and price
2:00 p.m. – 2:15 p.m. Break
2:15 p.m. – 3:15 p.m. Review FortisBC’s Scenario Development work
Summary of Jan. 10 workshop and approach to incorporating RPAG feedback
3:15 p.m. – 3:30 p.m. Wrap Up & Next Steps
2

Natural Gas for Transportation
Jason Wolfe, Manager, Market Development
February 9th, 2012

Natural Gas for Transportation Largest opportunity for natural gas load growth
and GHG emissions reductions
• Challenges: • Up-front vehicle cost differential
• Awareness of technological improvements in NGV
• Lack of fuelling infrastructure for return-to-base fleets
• EEC incentives in flux
• Key elements: • “Anchor-tenant” fueling model
• ‘User-pay’ vs. public refueling
• Monthly ‘take-or-pay’ volumes
• Cost recovery over term of contract
• Mitigation of stranded assets
4

BC’s GHG Emissions by Sector
Source: LiveSmart BC website
5
Transportation sector is
BC’s largest GHG
source
5

NG is less carbon intensive than conventional fuels
Source: LCFRR Intentions Paper
•Conventional CNG has a net carbon intensity value that is 38% lower than
reformulated gasoline and 28% lower than ultra-low sulphur diesel.
• Conventional LNG has comparable reductions in net carbon intensity
6

Historical Diesel Pricing vs. NG (DLE)
Prices shown for NGT (DLE) are current market retail
prices in BC; contract prices would be lower
0.00
0.20
0.40
0.60
0.80
1.00
1.20
1.40
1.60
1.80
Av
g V
an
co
uv
er
Reta
il P
rices
CA
D $
.00 P
er
Lit
re
Calendar Years
NGT & Diesel Vancouver Pump Prices
Diesel
NGT DLE
7

Waste Management Project – 20 NG Trucks
• Will displace 468,000 litres per year of diesel
• GHGs reduced by 213 tonnes per year
• Equivalent to taking 41 passenger cars off the road
• Fuel savings ~50%
• Plan to ramp up to 100 vehicles
8

Vedder Transport Project – 50 NG Trucks
• Will displace 3.6 million litres per year of diesel
• GHGs reduced by 3,754 tonnes per year
• Equivalent to taking 722 passenger cars off the road
• Fuel savings ~50%
9

Purpose of Today’s Workshop:
Discuss and Developing a Better Understanding of
FortisBC’s Current Planning Environment

2013 LTRP Timeline
Jan 2012 Mar 2013
Feb Mar Apr May Jun Jul Aug Sep Oct Nov Dec Jan Feb Mar
2013
LTRP Submission
Oct 2012
RPAG WorkshopFeb 2013
RPAG Workshop
Jan
Resource Plan Stakeholder Forum
· Forecast Update
· Asset Management
· Technology Discussion
· Forecast Results
· Resource Analysis
· Draft Outcomes
· LTRP Outcomes & Summary
· Action Plan
Jan 2012
RPAG Scenario Workshop
Feb 2012
RPAG Workshop
· Planning Environment· Energy Policy Environment· Gas Supply and Regional
Infrastructure
Sep - Nov
Resource PlanCommunity Consultation
Mar - Apr
Resource PlanCommunity Consultation
May 2012
RPAG Workshop

Objectives and Topics
• Familiarize RPAG members with aspects of the energy
planning environment.
• Discuss recent energy policy shifts
• Explain and discuss the Demand Side Management
Regulation amendments
• Describe and discuss current natural gas supply issues
• Discuss energy prices and competitiveness
• Provide an update on the Scenario Development work

Energy Policy Environment
Ken Ross, Integrated Resource Planning Manager
February 9th, 2012

• Abundant sources of energy (electricity and natural gas)
• Low electricity rates compared to other jurisdictions (Heritage Rates)
• GHG emissions output profile is different
• Transportation
• Fossil fuel production
• Little emission from electricity
• Energy policy until now promoting energy efficiency and use of electricity
and other green energy alternatives
• British Columbia’s Energy Objectives
• New Natural Gas Strategy
• Different type of new building stock being developed
BC’s Energy Environment Unique from other jurisdictions in Canada
14

Population Growth
0
1,000,000
2,000,000
3,000,000
4,000,000
5,000,000
6,000,000
7,000,0001
98
6
19
89
19
92
19
95
19
98
20
01
20
04
20
07
20
10
20
13
20
16
20
19
20
22
20
25
20
28
20
31
20
34
Northeast
Nechako
North Coast
Cariboo
Kootenay
Thompson-Okanagan
Vancouver Island / Coast
Mainland / Southwest
Historic Projected
source: BC Stats
Sept. 2011
BC projected average annual growth = 1.4%

Current Regulation and Policies Environmental Focus
• BC Energy Plan
• Greenhouse Gas Reductions Targets Act
• 6% below 2007 levels by 2012
• 16% below the 2007 levels by 2016
• 33% below 2007 level by 2020
• 80% below 2007 level by 2050
• BC Climate Action Charter
• Carbon neutrality by 2012
• Offset Emissions Regulation
• Carbon Tax Act
• $30 per tonne as of July 1, 2012
• Clean Energy Act
• Amendments to the Utilities Commission Act
• Amendments to DSM Regulation
• New Natural Gas Strategy
2007
2012
16

Signals of Changing Energy Policy:
Review of BC Hydro June, 2011 (Report)
• Forecasted electricity rate increases over the next 10 years for BC Hydro give
rise to reevaluating energy policy
• “We recommend that BC Hydro and the province:
• Evaluate alternative definitions and timelines for government’s self-sufficiency policy that meet the
needs of the province and ratepayers in a way that is sustainable for the long term.
• Burrard Thermal Generation Station continue to be used as a source of back-up energy as well as
for voltage stabilization”
• Natural gas usage in BC currently not considered under the Clean Energy Act.
• BC Hydro - limited ability to leverage this resource beyond 7% of total
generation.
• Market analysis - natural gas price will continue to be low over at least the
medium term, - potentially a desirable and inexpensive generation choice
17

Natural Gas Supply Abundance
18

BC’s Natural Gas Strategy - Feb 3, 2012
• Natural Gas recognized by the provincial government as a
“Climate Solution”:
• Develop a revised Energy Efficient Buildings
Strategy in 2013.
Using natural gas efficiently in BC not only
reduces emissions; it also reduces the cost
of doing business, increases productivity and
improves the standard of living that British
Columbians have come to expect.
• Encourage biomethane opportunities
• Offering consumers low-carbon natural gas
19

BC’s Natural Gas Strategy (continued)
• Promote use of high efficiency natural gas electricity
generation in export markets, and in specific markets in
BC to meet the demand for capacity
• New and expanded uses of natural gas in BC, in the
transportation sector
• BC will work to introduce new regulation under CEA to advance
natural gas vehicle program
• framework for a planned five-year,
$62 million program to reduce
transportation emissions
20

Changing Situation
GHG Emissions
Reduction Targets
Cost Pressures
Energy Diversification
Socio-economic Issues
Regional Implications
21

• Revenue Requirement Application Decision Pending
• Amalgamation/Rate Design
• Suspended pending resubmission in March
• Biomethane
• Program up and running to residential and commercial customers
• Two supply contracts approved (Catalyst and Columbia Shuswap Regional District)
• Natural Gas for Transportation Fuelling
• Expenditures and contract approval for first CNG project (Waste Management)
• General Terms & Conditions for future projects (expecting endorsement)
• Thermal Energy Services
• First project offered under FEI – Delta School District - currently under regulatory
review
• Energy Efficiency and Conservation
• Sought approval of increased EEC expenditures in the 2012-2013 RRA, currently
awaiting Commission Decision
• AES Inquiry
• Role of utilities in new product and service offerings in a regulated environment
Regulatory Update
22

Demand Side Management Regulation
Amendments
Sarah Smith, Manager, Energy Efficiency &
Conservation
February 9th, 2012

Amended Demand Side Management
Regulation
• DSM Benefit/cost analysis
• Low gas cost environment
• Some worthwhile programs challenged by previous
iteration of DSM Regulation
• Especially residential and low-income
• Introduction of Modified Total Resource Cost Test
• Avoided cost based on Zero Emission Energy Alternative
• 15% adder for Non-Energy Benefits
• 33% portfolio impact cap
• Utilities Cost Test
• Specified DSM
• Standards Attribution
24

Natural Gas Supply
Mike Hopkins, Manager, Commodity and Price Risk
February 9th, 2012

The “Shale Gale” Has Taken Over
Technology and cost improvements have increased supply
certainty 26

Gas Prices Disconnected from Other Fuels
• NYMEX gas prices remain disconnected from other competing fuels
• NYMEX gas prices are lowest levels in almost 10 years 27
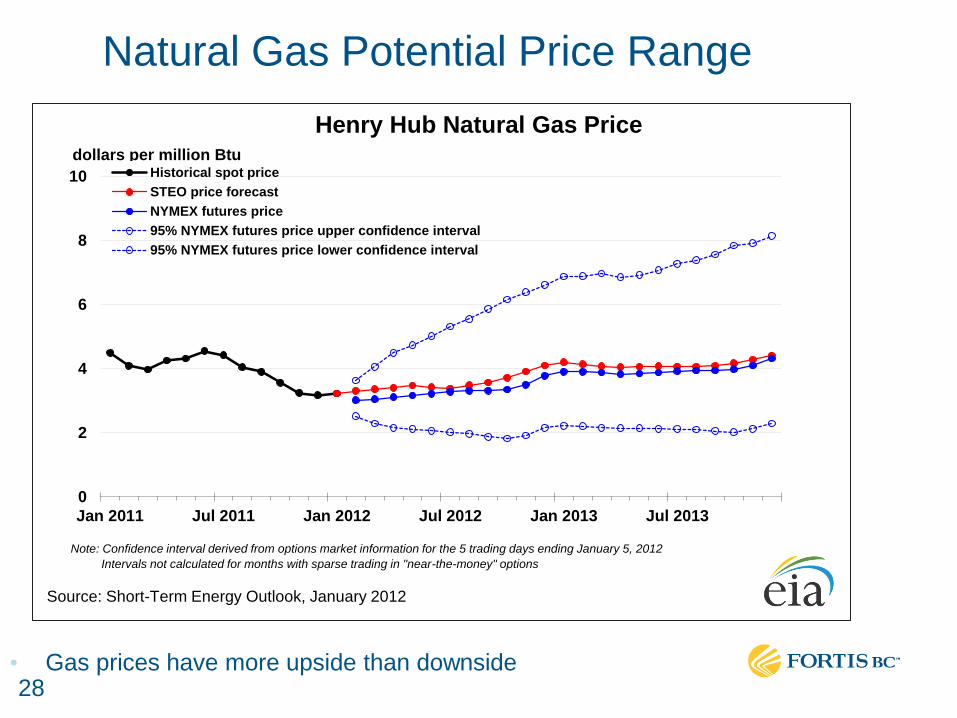
Natural Gas Potential Price Range
• Gas prices have more upside than downside
0
2
4
6
8
10
Jan 2011 Jul 2011 Jan 2012 Jul 2012 Jan 2013 Jul 2013
Henry Hub Natural Gas Price
Historical spot price
STEO price forecast
NYMEX futures price
95% NYMEX futures price upper confidence interval
95% NYMEX futures price lower confidence interval
Note: Confidence interval derived from options market information for the 5 trading days ending January 5, 2012
Intervals not calculated for months with sparse trading in "near-the-money" options
dollars per million Btu
Source: Short-Term Energy Outlook, January 2012
28

Why higher gas prices in the future ?
• Producers cutting back on gas drilling
• Increased demand for power generation
• Increased industrial demand
• Growth in natural gas vehicles (NGV’s)
• LNG exports
29

Coal Plant Retirements Increasing Gas Demand
30

Proposed LNG Export Facilities
• Multiple LNG export terminals proposed in the US
• Several facilities proposed for northern BC 31

Global LNG Spot Prices ($US/MMBtu)
• North America benefitting from abundant shale gas and depressed demand
32

FortisBC Regional Gas Market
British
Alberta
Columbia
Fort
Nelson
Niska
McMahon
Pine
River
TCPL
Northwest Pipeline
NWP
PNG
Rocky
Mountain
Basin
Western Canada
Sedimentary Basin British
Alberta
Columbia
Fort
Aitken
Creek
AECO
Jackson
Prairie
McMahon
Pine
River
Station 2
Northwest Pipeline
Kingsgate Sumas
NWP
PNG
Mist
Rocky
Mountain
Basin
Western Canada
Sedimentary Basin
SCP FEVI
WA
OR
Market Supply
Market
Storage
LNG
Storage
Mt.Hayes
Tilbury
33

Regional Peak Day Demand vs. Capacity
Mt. Hayes
LNG Storage
Winter
peak day
capacity is
constrained
in the I-5
region over
the long
term
34

BC Supply offsetting Alberta declines
35

Northeast BC Developments - TransCanada
TCPL Pipeline
expansions
into northeast
BC
36

Northeast BC Developments - Spectra
Spectra
pipeline and
plant
developments
37

Spectra T-South Enhanced Service
• Spectra utilizing part of FEI’s
Southern Crossing Pipeline
• Shippers have option to flow to
Huntingdon or Kingsgate
• 87 MMcf/d available in total
• May 1, 2010 - Oct 31, 2014
• $20 million to FEI Core customers
over contract period
38

Kingsvale-Oliver Reinforcement Project (KORP)
• Expansion of T-South Enhanced
Service
• 161 km of 24 inch looping from
Kingsvale-Oliver in BC
• Bi-directional using Southern
Crossing Pipeline
• Expected in-service 2015
• Optimizes existing infrastructure
in an integrated system with
Spectra T-South
KORP
39

Other Regional Developments
Cross Cascades
Ruby Pipeline
KORP
I-5 region
peak day
constraint
zone
40

Summary
• Low gas prices for now – due to strong supply and weak
demand
• BC supply growth - helping offset declines in Alberta
• Demand expected to increase in the future
• Pacific Northwest - expansion required now in the region to
meet future demand growth
• FortisBC - opportunities to encourage BC supply to our region
41

Electricity Prices
Ron Zeilstra, Resource Development Manager
February 9th, 2012

Price Forecasts Wholesale Market Curve vs. New Resources Market Curve for Energy
and Capacity
43

Scenario Update
Incorporating RPAG Feedback
Ken Ross, Integrated Resource Planning Manager
February 9th, 2012

A. Define
• Define the question and parameters
• Define a starting point or status quo
B. Explore
•Identify trends and forces •Identify uncertainties and importance •Rank uncertainties and importance •Select scenario themes
C. Build
• Flesh out scenario future worlds
• Write scenario stories
• Test the model
D. Use
• Develop and assess strategies
• Ongoing monitoring and assessment of scenarios and strategies
Steps in Scenario Planning - Background
Integrated Resource Planning
Stakeholder
Engagement Progress
45

Critical Uncertainties 1
46

Critical Uncertainties 2
47

RPAG Scenarios -
Visions of Future A. Define B. Explore C. Build D. Use
Decentralized Energy
Markets (Self Generation)
Centralized Energy
Markets (Grids)
Positive Perception of
Natural Gas Negative Perceptions
of Natural Gas
48
• High demand for
natural gas
• High demand for
renewables
• High fuel switching
capability
• Lowest natural gas
demand
• Highest demand for
renewables
• Policy driving
incentives for
alternatives &
energy efficiency
• Low natural gas
demand
• High natural gas
demand
• High industrial
demand for natural
gas
• Moderate gas price

Scenarios -
Visions of Future
Pricing Carbon
Doing More with Less
Demand Renaissance
Limited Choices
A. Define B. Explore C. Build D. Use
Rapid Technological
Advancement
Slow Technological
Advancement
Constricted Supply Abundant Supply
49

Incorporating RPAG Feedback
• List and note RPAG Critical Uncertainties and relative
placement on matrix
• Incorporate the critical uncertainties and issues identified
by the RPAG into FortisBC scenarios and analysis, and
report back to the RPAG as to how this was done.
• Examine each of the 48 factors identified by the RPAG,
addressing the long term directional impacts on
supply/demand, and outline how each factor fits into the
FortisBC scenarios, or how it will be considered in the
analysis
50

Next Steps
51
Jan 2012 Mar 2013
Feb Mar Apr May Jun Jul Aug Sep Oct Nov Dec Jan Feb Mar
2013
LTRP Submission
Oct 2012
RPAG WorkshopFeb 2013
RPAG Workshop
Jan
Resource Plan Stakeholder Forum
· Forecast Update
· Asset Management
· Technology Discussion
· Forecast Results
· Resource Analysis
· Draft Outcomes
· LTRP Outcomes & Summary
· Action Plan
Jan 2012
RPAG Scenario Workshop
Feb 2012
RPAG Workshop
· Planning Environment· Energy Policy Environment· Gas Supply and Regional
Infrastructure
Sep - Nov
Resource PlanCommunity Consultation
Mar - Apr
Resource PlanCommunity Consultation
May 2012
RPAG Workshop
Other Discussion Topics?