RESOURCE OPTIMISATION THROUGH CONSTRAINT …
56
i RESOURCE OPTIMISATION THROUGH CONSTRAINT MANAGEMENT AT MALAS DRIVESTYLE CENTRE by FIRDOUS TAYOB A project submitted in partial fulfilment of the requirements for the degree BACHELORS IN INDUSTRIAL ENGINEERING at the FACULTY OF ENGINEERING, BUILT ENVIRONMENT, AND INFORMATION TECHNOLOGY UNIVERSITY OF PRETORIA SUPERVISOR: Dr Olufemi Adetunji November 2014
Transcript of RESOURCE OPTIMISATION THROUGH CONSTRAINT …

i
RESOURCE OPTIMISATION THROUGH CONSTRAINT
MANAGEMENT AT MALAS DRIVESTYLE CENTRE
by
FIRDOUS TAYOB
A project submitted in partial fulfilment of the requirements for the degree
BACHELORS IN INDUSTRIAL ENGINEERING
at the
FACULTY OF ENGINEERING, BUILT ENVIRONMENT, AND
INFORMATION TECHNOLOGY
UNIVERSITY OF PRETORIA
SUPERVISOR: Dr Olufemi Adetunji
November 2014

ii
Executive Summary
Malas (Pty) Ltd, a retail and distribution company, has been engaged in the tyre industry for over three
decades specializing in the supply of wheels and tyre products together with related services to the
South African market. Due to the increase in export and domestic sales of automobiles, the South
African tyre market is expected to witness phenomenal growth over the next couple of years.
The service centre, the Malas Drivestyle Centre houses a large and sophisticated workshop where its
services are rendered. Currently it seems as if it is operating at full capacity, however, there is a great
concern regarding the number of vehicles serviced per day. Management is of the opinion that
maintaining current methods is hindering the company's ability to be able to satisfy the additional
demand in order to remain competitive within the industry.
The entire service system is constrained by the activities of the Workshop thus, this project focuses on a
capacity analysis of the Workshop. The analysis will identify and aim to remove bottlenecks present in
the system as well as provide an efficient manner of re-allocating resources to ensure system
performance and the throughput rate is improved.
After an investigation of Industrial Engineering tools, techniques and skills to solve capacity constrained
systems was conducted, Simulation Modelling was selected as it is the best tool to accurately represent
a real life complex system. The current As-Is model was modelled by the simulation, thus activities and
resources were required to be analyzed in detail to construct the model as well as data analysis of real
system data from the companies WMS system.
Scenarios were generated using OptQuest with the primary objective to maximize profit. Profit is a
surrogate measure for the throughput rate. OptQuest automatically generates optimal scenarios with
alternative resource configurations. Using the SMORE plots in Simio, the best performing alternatives
which are statistically significantly similar to each other were identified.
These alternatives were recommended to Malas as a manner of planning and re-allocating their
resources. By implementing this, not only is profits maximized but utilization of resources is inherently
improved by the model. As a result the inefficiencies such as long queues and delays will be improved
which results in increased customer satisfaction.
The project aims to deliver a model to the firm to act as a decision support system to aid in strategic
future plans. Thus it is highly recommended to implement this solution to ensure the long term
objectives of Malas are achieved.

iii
TABLE OF CONTENTS
Executive Summary…………………………………………………………………………………………………………………………….ii
List of Figures……………………………………………………………………………………………………………………………..……...v
List of Tables…………………………….………………………………………………………………………………………………………..vi
Chapter 1: Introduction
1.1 Background ....................................................................................................................................... 1
1.2 Products & Services .......................................................................................................................... 2
1.3 The Workshop ................................................................................................................................... 3
1.4 Problem Statement ........................................................................................................................... 3
1.5 Project Aim ........................................................................................................................................ 4
1.6 Project Approach, Scope & Deliverables .......................................................................................... 5
Chapter 2: Literature Review
2.1 Introduction ...................................................................................................................................... 6
2.2 Capacity Management ...................................................................................................................... 6
2.3 Theory of Constraints ........................................................................................................................ 8
2.4 The Queuing Theory .......................................................................................................................... 9
2.5 Mathematical Modeling .................................................................................................................... 9
2.6 Simulation Modeling ....................................................................................................................... 10
2.7 Literature Review Conclusion ......................................................................................................... 12
Chapter 3: Conceptual Design
3.1 Simulation Model Development ..................................................................................................... 14
3.2 Simio................................................................................................................................................ 16
3.3 As-Is Process Analysis ...................................................................................................................... 16
3.3.1 High Level Process Flow Diagram............................................................................................ 17
3.3.2 Low-Level Process Flow Diagrams .......................................................................................... 18
3.3.2.1 Tyre & Wheel Fitment and Balancing Process .................................................................... 18
3.3.2.2 Undercarriage Service Process ............................................................................................ 19
3.3.2.3 Alignment Service Process .................................................................................................. 20
3.4 Translation to Simio ........................................................................................................................ 21
Chapter 4: Data Analysis
4.1 Data Collection ............................................................................................................................... 22

iv
4.2 Resource Capacities ........................................................................................................................ 22
4.3 Entity Arrival.................................................................................................................................... 23
4.4 Process and Delay Times ................................................................................................................. 24
4.5 Input Probabilities ................................................................................................................................. 25
4.6 Financial Data ........................................................................................................................................ 26
Chapter 5: Simulation Model
5.1 As-Is Model Construction ................................................................................................................ 28
5.1.1 HIGH-LEVEL PROCESS ..................................................................................................................... 28
5.1.2 LOW-LEVEL PROCESSES ........................................................................................................... 28
5.1.3 MODEL ENTITY ........................................................................................................................ 28
5.1.4 Simulation Parameters ............................................................................................................ 29
5.2 Verification & Validation ................................................................................................................. 29
5.3 Experimental Design ....................................................................................................................... 30
5.3.1 OptQuest ........................................................................................................................................ 30
Chapter 6: Simulation Results & Analysis
6.1 As-Is Results .................................................................................................................................... 32
6.2 Experimental Results & Analysis ........................................................................................................... 33
6.2.1 Output Analysis ....................................................................................................................... 33
6.2.2 Analysis of Alternatives .................................................................................................................. 36
6.3 Conclusion & Recommendations .................................................................................................... 39
References………………………………………………………………………………………………………..………………………………40
Appendices
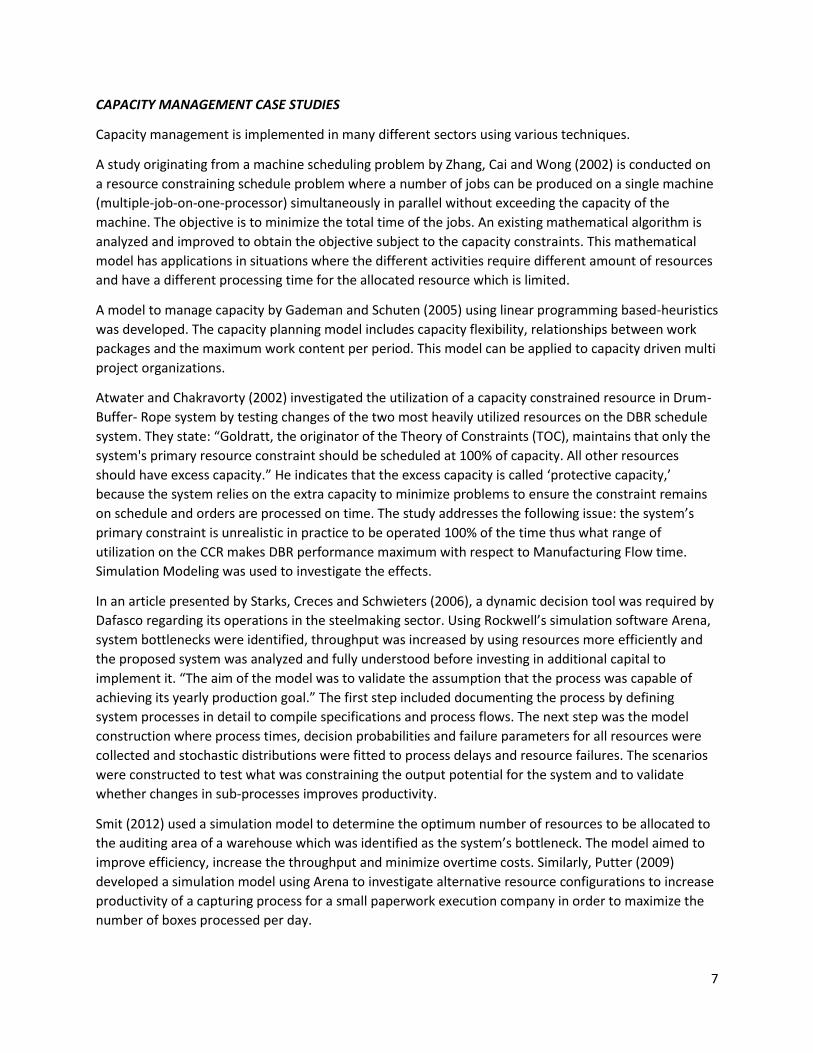
2 Appendix A: Industry Sponsorship Forms ........................................................................................... 43
3 Appendix B: Analysis of Data .............................................................................................................. 44
4 Appendix C: Model Construction ........................................................................................................ 47
5 Appendix D: OptQuest Results ............................................................................................................ 49

v
LIST OF FIGURES
Figure 1: Malas Drivestyle Centre Facility ..................................................................................................... 1
Figure 2: The Workshop ................................................................................................................................ 3
Figure 3: Project Approach ........................................................................................................................... 5
Figure 4: Simulation Study Diagram ............................................................................................................ 10
Figure 5: Simulation Methadology .............................................................................................................. 14
Figure 6: High Level Process Flow Diagram ................................................................................................ 18
Figure 7: Tyre Fitment/Balancing Process Flow Diagram ........................................................................... 19
Figure 8: Undercarriage Process Flow Diagram .......................................................................................... 20
Figure 9: Alignment Process Flow Diagram ................................................................................................ 20
Figure 10: Vehicle Arrival Input Analyzer .................................................................................................... 24
Figure 11: Three Dimensional Model Facility View..................................................................................... 30
Figure 12: As-Is Model Results .................................................................................................................... 32
Figure 13: As-Is Experiment Results ............................................................................................................ 32
Figure 14: Simio SMORE Plot ...................................................................................................................... 33
Figure 15: SMORE Plot Results .................................................................................................................... 34
Figure 16: SMORE Plot Results 2 ................................................................................................................. 35
Figure 17: Tyre Bay and Technician Capacity Comparison ......................................................................... 37
Figure 18: Alignment Bay and Technician Capacity Comparison ................................................................ 38
Figure 19: Screenshot of Data ..................................................................................................................... 45
Figure 20: Takeaway Arrival Times Input Analyzer ................................................................................... 456
Figure 21: Alignment Process Input Analyzer ............................................................................................. 45
Figure 22: Service Probabilities Computation ........................................................................................... 467
Figure 23: Model Facility View .................................................................................................................. 478
Figure 24: Alignment, Dispatch & Job Assign Add-On Processes ............................................................. 478
Figure 25: Tyre Fitment & Balancing Add-On Process .............................................................................. 489
Figure 26: Undercarriage Add-On Process ................................................................................................ 489

vi
LIST OF TABLES
Table 1: Simio Standard Object Library....................................................................................................... 16
Table 2: Process Flow Symbols ................................................................................................................... 16
Table 3: Resource Capacities ...................................................................................................................... 23
Table 4: Entity Inter-Arrival Times .............................................................................................................. 23
Table 5: Process and Delay Times ............................................................................................................... 25
Table 6: Input Probabilities ......................................................................................................................... 26
Table 7: Revenue Inputs.............................................................................................................................. 27
Table 8: Resource Unit Costs ...................................................................................................................... 27
Table 9: Resource Electricity Costs ............................................................................................................. 27
Table 10: Potential Solutions ...................................................................................................................... 36

1
Chapter 1: Introduction
1.1 BACKGROUND
Malas (Pty) Ltd, a retail and distribution company, has been engaged in the tyre industry for over three
decades specializing in the supply of wheel and tyre products together with related services to the South
African market. Due to the increase in export and domestic sales of automobiles, the South African tyre
market and consequently, the tyre replacement market is expected to witness phenomenal growth over
the next couple of years.
The Pretoria based facility, Malas Drivestyle Centre, is a multi-brand, multi-product automotive
specialized fitment centre. It encompasses a modern showroom, convenient cashier points, a gourmet
café, over 200 parking bays, a spacious office block, a large and sophisticated workshop (equipped with
the latest equipment where the services are rendered) and a centralized warehouse facility equipped
with conveyor systems and goods hoists linked to the receiving and dispatching areas.
Figure 1: Malas Drivestyle Centre Facility

2
1.2 PRODUCTS & SERVICES
The products supplied covers an extensive range of tyres and wheels for motor vehicle applications as
well as components such as brakes and shocks. Services include expert advice, tyre fitment, wheel
balancing, wheel alignment and specialized fitment of the various component types. The service
products can be grouped into the following categories: Wheel & Tyre Fitment and Balancing, Wheel
Alignment, Undercarriage Services & Diagnostic Services.
WHEEL & TYRE FITMENT & BALANCING
Wheels and tyres are the main line of business at Malas. A customer may opt to purchase new tyres or
wheels in which case the old tyre is stripped off of the wheel on the fitment machine, and then the new
tyre is fit back onto the wheel using the same machine. Thereafter, the new wheel/tyre is balanced on
the balancing machine and fit back onto the vehicle. If the customer chooses to simply balance his old
tyres, the technician balances the old tyre/wheel using the balancing machine and fits it back onto the
vehicle.
ALIGNMENT SERVICES
Alignment is purely a service and thus no products are involved. The bay is equipped with a
computerized machine which the technician uses to render the service. Using the readings off
the sensor placed under the tyres and the readings on the computer, the technician is able to
do the alignment according to the vehicles specifications.
UNDERCARRIAGE SERVICES
This service includes the fitment of brake and shocks. The customer may choose to purchase
new brakes or shocks or both in pairs only (for the front or back of the vehicle). The technician
inspects the vehicle, removes the old parts and replaces it with the new parts.
TAKEOUT SERVICE
This applies to customers who opt to purchase products such as tyres or other parts but do not
require them to be fit onto their vehicles. In this case, the customer places the order at the
cashier and picks it up at the takeaway section of the Dispatch area, which is inside of the
workshop.
DIAGNOSTIC SERVICES
Includes an inspection of the vehicle to identify the problems and provide expert advice as to
what services are required. Initially, this was conducted inside of the workshop where six bays
were allocated. However, it is now conducted outside of the workshop in the parking bay. Thus
there are six extra bays available in the workshop, which are currently used as parking bays for
small queues which form inside of the actual workshop.

3
1.3 THE WORKSHOP
The state-of-the-art facility houses over 50 bays and utilizes the latest and best technology and
machinery available. The bays in the workshop are arranged and grouped together according to the
categories above, comprising of Wheel/Tyre Fitment and Balancing bays, Wheel Alignment bays and
Undercarriage bays. Each bay is equipped with the necessary tooling to conduct the services.
The workshop is manned by a workshop management team of a Workshop Manager, Gate Controller,
Job Assigners and Quality Controllers. There is one technician allocated to a specific bay to render the
services. The workshop is supported by a dispatch team consisting of a Dispatch Manager and
Dispatchers for product management activities.
A centralized Operations Room exists in the workshop where installation and balancing activities are
conducted It is equipped with tyre fitting/stripping machines and wheel balancing machines.
The Dispatch Area acts as a link between the warehouse and the workshop, when an order is processed
the goods are picked and sent down to the dispatch area where the technician receives it. The
‘takeaway section’ is also located here for takeaway customers to pick up their orders.
Figure 2: The Workshop
1.4 PROBLEM STATEMENT
The major problems and delays experienced within the system can be attributed to the workshop
processes. Even though the workshop is currently operating at full capacity, management are
concerned that maintaining the current methods is hindering the company’s ability to satisfy a bigger
demand for its services. The major area of concern directly relates to the low throughput rate currently
experienced, i.e. the number of vehicles being serviced per day.

4
It is noted that the system is constrained by the activities of the workshop to achieve its goals to expand
and deliver more. The problem is therefore viewed as a constrained system problem. The possible
factors relating to these constraints within the workshop are:
1. Long queues at the workshop entrance (especially during peak hours)
2. Scheduling (including sequencing and job loading) of jobs to bays/technicians
3. Job flow completion rate within the workshop
4. Technician & machine utilization
Resources are shared between the different processes for the various types of services rendered in the
workshop. Thus, these resources could be overloaded at times whilst others could remain idle. The
bottlenecks in the system are the cause for limiting throughput and therefore must be identified and
improved.
CAPACITY CONSTRAINED SYSTEM
Malas offers a wide range of different services to remain competitive and due to this, managing the
problem becomes complex. Customers may opt to choose one or more different types of services.
Complexities arise as the length of time for each service is stochastic depending on the (1) type of
service, (2) type of products required, (3) the number of tyres/parts being serviced and (4) unavailability
of products in the warehouse. Thus technicians are not immediately available, causing delays. Some
services and activities are dependent on others which adds to the problem and further, if a problem is
identified by the technician an extra service might be required.
As described by Siha (1999), an unpredictable environment is created due to the interaction of
stochastic service times, dependent service activities, probabilistic service packages, frequently
occurring bottlenecks and consequently, scheduling becomes difficult.
The problems attributed to the workshop system can be classified as a capacity constrained system.
Managing capacity and constrained resources must be further investigated as to how they are solved in
practice.
1.5 PROJECT AIM
The aim of this project is to identify and manage the constraints present within the workshop system in
order to improve the workflow rates, to ensure the workshop capacity is optimized and utilized to its
fully possible extent. This will be done with the intention of achieving the firm’s main objective, to
increase the throughput rate i.e. the number of vehicles serviced per day.
A model representing the real life system will be developed through the use of Industrial Engineering
techniques such as mathematical or simulation modeling. The most efficient way of re-allocating
resources will be identified in order to maximize utilization whilst reducing inefficiencies currently
present in the system. This will be done by evaluating alternative configurations of resources and
comparing each scenario to the base case model.

5
Recommendations will be made as to how the resources of the workshop are to be planned and
scheduled in order for the firm to achieve its objectives and maximize their profits.
1.6 PROJECT APPROACH, SCOPE & DELIVERABLES
The project approach to achieve the desired outcomes is broken down into six phases as illustrated
below.
Figure 3: Project Approach
PROJECT SCOPE
The project will be conducted at the Malas Drivestyle Centre, based in Pretoria. The scope will be limited
to the service operations of the Workshop only and thus exclude the customer sales and payment
process. Since Diagnostic Inspections are now conducted outside of the actual workshop, it is excluded
from the scope of this project. In order to manage the constraining system, problems may arise within
the supply chain system as well as the operations of the warehouse, which will be excluded from the
scope of this project.
DELIVERABLES
The project intends to deliver a Workshop Solution which includes the following:
1. a model representing the real life As-Is process;
2. identification of bottlenecks and capacity constrained resources;
3. the design and Evaluation of various scenarios;
4. a recommendation of how to plan and reschedule resources
5. a final detailed project report; and
6. a final project presentation.
Phase One: Identify & Formulate
the Problem
Phase Two: Investigate
the Problem
Phase Three: Data
Preparation
Phase Four: Develop a Model for the As-Is Process
Phase Five: Design & Evaluate various
Scenarios
Phase Six: Provide
Recommendations

6
Chapter 2: Literature Review
2.1 INTRODUCTION
Research is conducted to investigate the most appropriate IE techniques available to solve problems and
achieve the objectives of the workshop. Literature is reviewed to fully understand the nature of the
problem and case studies pertaining to how other companies with similar scenarios have approached
the situation are studied. The outcomes of these techniques used in practice are analyzed to be able to
select the most appropriate alternative.
2.2 CAPACITY MANAGEMENT
Capacity Management can be defined as managing the limitations of a company’s resources to ensure
operations run smoothly. Wanliss (2009) indicates that Thacker (2009) stated capacity planning includes
the creation of “sufficient, flexible, capable capacity and a valid, best ‘do-able’ resilient plan to
accommodate demand.” Gademan and Schuten (2005) state: “Many multi-project organizations are
capacity driven, which means that their operations are constrained by various scarce resources.” They
advance that capacity planning can be described as aiming to balance demand and availability for
resources for the medium term. Armistead and Clark (1994) mentioned: “There is an interaction
between capacity management, quality management, and resource productivity or efficiency
management which is at the heart of the planning and control process for operations management.”
If the capacity of a service is increased, queues and waiting times will decrease however this might lead
to servers becoming idle at times, thus the problem is to manage the tradeoff between idle capacity and
delays. As Beasley (2009) discusses issues related to assessing performance of a system are:
How long is the expected waiting time in a queue for a customer before he is served and how
long does it take to complete the service?
What is the utilization of the server and the expected time period that he is not idle?
Problems which management should address are:
Is it worth investing in additional resources to reduce the service time?
What is the number of servers required?
Should priorities for some customers be implemented?
There are two approaches to manage the issues highlighted above:
1. Analytical Methods (Mathematical Programming & Heuristics) or the Queuing Theory which are
formula related; and
2. Simulation Modeling which is computer based.
The first approach is ideal for simple queues and systems whilst simulation is used widely for complex
systems.
7
CAPACITY MANAGEMENT CASE STUDIES
Capacity management is implemented in many different sectors using various techniques.
A study originating from a machine scheduling problem by Zhang, Cai and Wong (2002) is conducted on
a resource constraining schedule problem where a number of jobs can be produced on a single machine
(multiple-job-on-one-processor) simultaneously in parallel without exceeding the capacity of the
machine. The objective is to minimize the total time of the jobs. An existing mathematical algorithm is
analyzed and improved to obtain the objective subject to the capacity constraints. This mathematical
model has applications in situations where the different activities require different amount of resources
and have a different processing time for the allocated resource which is limited.
A model to manage capacity by Gademan and Schuten (2005) using linear programming based-heuristics
was developed. The capacity planning model includes capacity flexibility, relationships between work
packages and the maximum work content per period. This model can be applied to capacity driven multi
project organizations.
Atwater and Chakravorty (2002) investigated the utilization of a capacity constrained resource in Drum-
Buffer- Rope system by testing changes of the two most heavily utilized resources on the DBR schedule
system. They state: “Goldratt, the originator of the Theory of Constraints (TOC), maintains that only the
system's primary resource constraint should be scheduled at 100% of capacity. All other resources
should have excess capacity.” He indicates that the excess capacity is called ‘protective capacity,’
because the system relies on the extra capacity to minimize problems to ensure the constraint remains
on schedule and orders are processed on time. The study addresses the following issue: the system’s
primary constraint is unrealistic in practice to be operated 100% of the time thus what range of
utilization on the CCR makes DBR performance maximum with respect to Manufacturing Flow time.
Simulation Modeling was used to investigate the effects.
In an article presented by Starks, Creces and Schwieters (2006), a dynamic decision tool was required by
Dafasco regarding its operations in the steelmaking sector. Using Rockwell’s simulation software Arena,
system bottlenecks were identified, throughput was increased by using resources more efficiently and
the proposed system was analyzed and fully understood before investing in additional capital to
implement it. “The aim of the model was to validate the assumption that the process was capable of
achieving its yearly production goal.” The first step included documenting the process by defining
system processes in detail to compile specifications and process flows. The next step was the model
construction where process times, decision probabilities and failure parameters for all resources were
collected and stochastic distributions were fitted to process delays and resource failures. The scenarios
were constructed to test what was constraining the output potential for the system and to validate
whether changes in sub-processes improves productivity.
Smit (2012) used a simulation model to determine the optimum number of resources to be allocated to
the auditing area of a warehouse which was identified as the system’s bottleneck. The model aimed to
improve efficiency, increase the throughput and minimize overtime costs. Similarly, Putter (2009)
developed a simulation model using Arena to investigate alternative resource configurations to increase
productivity of a capturing process for a small paperwork execution company in order to maximize the
number of boxes processed per day.

8
The above mentioned case studies provides insight into what capacity management is and the various
techniques used to implement it. Capacity management originated and is widely used within the
manufacturing sector. However, the service sector is distinct from the manufacturing sector as a service
cannot be produced in advance and held in inventory and thus certain techniques must be altered to
make it appropriate for a service organization. Since Malas operates within the service sector, literature
specific to this sector must be studied to understand what techniques are used to manage capacity
constrained systems in a service environment.
CAPACITY MANAGEMENT IN THE SERVICE SECTOR
“Capacity management in services to match supply and demand has a direct influence on the ability of
the service delivery system to achieve service quality and resource productivity targets.” (Armistead &
Clark, 1991)
Armistead and Clark indicate that capacity in a service environment is defined as “the ability to work off
an existing demand.” It has a time dimension and is linked to an output quantity. They highlight the idea
that due to the wide range and mix of services offered, variation occurs which indicates the capacity of
the system will change if the balance of resources are altered.
2.3 THEORY OF CONSTRAINTS
The Theory of Constraints, developed by E.M Goldratt, is a management philosophy which states “a
system's constraint is anything that limits a system from achieving higher performance versus its goal.”
Siha (1999) says: “System constraint is the heart of Theory of Constraints.” Goldratt says that TOC aims
to ensure daily operation’s performance is maximized through driving the system’s
constraints/bottlenecks and long term performance is continuously improved.
According to Siha, TOC can be applied to daily operations as well as continuous improvement. Daily
logistics operations can be managed through performance measurements and the scheduling process.
Three performance indicators are mentioned by Goldratt and Cox (1992) namely: throughput (T),
inventory (I) & operating expense (OE). The aim is to increase T whilst reducing I and OE. Scheduling
includes the Drum, Buffer Rope approach which aims to ensure constraints are operating at its highest
capacity to obtain maximum performance. She goes on to explain that the drum represents the rate at
which the constraint resource processes, the buffer is measured in time to ensure the flow of the
process is prioritized whereas the rope is a link to the drum to ensure the right amount of work is always
maintained.
Continuous improvement can be done using The Five Steps Focusing process:
1. Identify the System's Constraints
2. Decide How to Exploit the System's Constraints
3. Subordinate Everything Else to the Above Decision
4. Elevate the System's Constraints
5. If in the Previous Steps a Constraint Has Been Broken, Go Back to Step 1 but do not allow inertia
to cause a system constraint

9
Badri and Aryanezhad (2010) mentions: The goal of theory of constraints (TOC) is to maximize output,
which is achieved by identifying and managing the critically constrained resources.” Step Four in
particular of the 5FS is used. They describes step four as: if constraints are critical, improvement of them
will improve the system performance and the potential of non-constraints is known. ”Eventually the
system will encounter a new constraint.” Goldratt presented an algorithm to solve product mix
problems to maximize profit however it was not able to provide an optimal solution for multi
constrained resource problems. Thus TOC together with a heuristic mathematic algorithm was
developed and the objective function for the optimization problem is to maximize the CCR output.
2.4 THE QUEUING THEORY
Zhao, Hou and Gilbert (2014) indicate that waiting lines and delays have become common in the service
sector and thus managing waiting times efficiently to ensure services are delivered on time enhance the
customer experience which can be used as a competitive strategy.
Winston (2004) describes the queuing theory, developed by Erlang, as an Operations Research
technique to manage waiting lines/queues by providing insight into the queue and waiting times.
Beasley (2009) mentions that a queue can be described by an arrival process as to whether customers
arrive single or in bulk, the inter-arrival time distributions and whether there is a finite population of
customers or infinite. It is also described by the server mechanism (independent of the number of
customers present) which is a description for the resources required to complete the service, the
process time and the number of servers available. To fully describe a queuing system would be to
describe how the customer joins the queue, the queue discipline. The rule used by Malas is the FCFS
discipline where customers are served in the order they arrive in.
Vohra, Dutta and Ghosh (2006) have developed a queuing model to efficiently manage the capacity of
Intensive Care Units in a multi-specialty hospital where alternative ICUs are utilized if the standard ICUs
are full due to the heavy patient overload. It includes utilizing resources such as doctors, nurses,
equipment and beds optimally. Each ICU is represented as a service station and each bed a server. The
project goals were to obtain steady state queuing models and to obtain expected number of patients in
the system. The input data included average arrival rate per day, arrival patterns, service time (length of
stay) and distribution of the service times. The objective of the queuing model was to maximize the
number of patients served in the system. The results of the model indicate that utilization increased up
to 28% and admitting patients into alternative ICUs was recommended. However, the model includes
19800 steady state equations which are solved through an optimization solver software. This model can
be even more complex when many type of server stations and servers are involved.
2.5 MATHEMATICAL MODELING
Operations research includes analytical methods to manage systems and typically is involved with the
planning and allocation of scarce or constrained resources. The system is represented by an algebraic
model which is solved through mathematical methodologies to provide optimal solutions. Linear
programming provides an objective function which may be maximized or minimized and is limited by

10
certain constraints present. In the Workshop problem, the objective function would be to maximize the
throughput rate.
In a case study by Ahmadi (1996), capacity problems of the rides at a theme park, Six Flags Magic
Mountain is studied in terms of daily operations with the aim of finding an optimal solution for the ride’s
nominal capacity. Poor management leads to undesirable customer waiting or under-utilization of the
resource capacities Similar to the Malas Workshop, the service packages is non-homogenous, customer
preference is not uniform and attendance level fluctuates according to the day or season. Capacity can
be changed by increase or decrease of the number of operating units for each ride. The Capacity
Management Model used visitor arrival pattern to the ride, transition patterns in the park, and the rides’
observed capacity to determine the most optimal nominal capacity level for the rides at different times.
The objective is to maximize park service level (throughput rate). The constraints limit the objective and
they include operating budget, customer threshold value for number of rides and maximum allowable
length at the rides. The CMM model is a mixed integer linear problem.
2.6 SIMULATION MODELING
Chase et al. (2004) discusses that simulation is defined as the technique that imitates the operation of a
real-world system as it evolves over time. It is used for capacity planning, resource requirements,
analysis of waiting lines and schedule of operations in the service sector. It is appropriate for situations
of great complexity where analytical or optimizing tools are difficult. He says: “Often when a
mathematical technique fails we turn to simulation.”
A schematic diagram of a simulation study is illustrated in Figure 4 below. (Maria, 1997)
Figure 4: Simulation Study Diagram

11
SIMULATION MODELING CASE STUDIES IN THE SERVICE SECTOR
Kuhl et al. (2005) suggest that discrete event simulation is a tool used to evaluate process flows and
bottlenecks, throughputs and delays as well as capacities. They advance, it is used widely in the service
sector such as call centres or hospitals and also for theme parks, health sector, ambulance systems,
parking management and evacuation systems. They suggest the idea of SimOr which is a combination of
Simulation for evaluation purposes and OR for its optimization.
Geng and Cassandras (2011) use Integer Programing and Simulation for a dynamic resource allocation
approach for a “smart parking” system. An objective function includes parking cost and distance
proximity, whilst ensuring capacity utilization is maximized for the system to optimally reserve a parking
space called the resource for a driver.
Lin (2013) conducted a study to increase patient flow and capacity for an eye outpatient department in
Hong Kong using computer simulation to serve as a decision support. The model aims to identify
bottlenecks with regards to layout changes, patient scheduling and the resource allocation plan. Further,
to determine congestion in terms of performance measurement for the multi-phase queuing system
serving different classes of patients with different sequences. Lastly, to test scenarios to increase
throughput, service capacity of patient per quota and to ensure hospital management understand and
identify the room for improvement. The ‘decision support simulator’ can be used as an evaluation and
planning tool to measure performance for future changes.
De Wet (2010) focuses on capacity analysis of the Lanseria International Airport’s land and airside due to
the increase in passenger demand. It includes investigating what the optimal number of aircraft
operations is during peak times subject to minimizing delays and congestion in the airport terminal. An
Arena simulation model representing the complex system was constructed and scenarios were tested to
address and eliminate bottlenecks. The objective was to determine what the maximum capacity is in
terms of the number of passengers that may be processed and the number of aircraft operations that
may be conducted and these solutions may serve as a decision tool for strategic planning. (De Wet,
2010)
ADVANTAGES AND DISADVANTAGES
Chase and Jacobs (2011) discuss the following:
Advantages of simulation include a better understanding of the real system through a model,
compression of time (years can be expressed in seconds), provides a realistic representation of the real
system and can be custom built to replicate the real system, may analyze transient conditions unlike
mathematical models and may answer ‘what-if’ questions.
Disadvantages include a lack of standardized approach to construct models, constructing a complex
model may take very long, in some cases there is no guarantee that a simulation model will provide
accurate answers due to it being based on random variables unlike a mathematical model.

12
SIMULATION SOFTWARE
Arena
Rockwell’s Software, Arena allows one to easily account for the stochastic (variable and random) nature
of processes. True system behavior may be emulated by utilizing statistical distributions that the
processes and systems have shown to mimic through distribution curve fitting. The simulation can then
randomly sample those distributions to create events into the system (e.g., customer arrival, failure
events, etc.) or the duration of an individual event (e.g., process time, failure downtime, etc.). These
events are then “scheduled,” allowing the user to watch how the system performs over time. The power
of simulation lets one account for these event interactions and evaluate what effect these events and
interaction of events have on the true performance of the system.
Arena models are built using a flowchart style, process orientation approach to build and run simulation
models where building blocks are used to build the process flow. Elements must be defined to
determine the state of the system and entities must be created which move from block to the next over
time.
Simio
“Simio is a tool for building and executing dynamic models of systems so that one can see how they
perform.” (Pegden, 2012)
He goes on to describe that Simio is much easier to use than other software due to its object-based
approach where objects represent real components of the system and a 3D animation may be viewed. A
wide range of systems from health care to mining, to supply chain may be modeled. The idea is to have
model entities such as trucks, patients or customers move through the system which is constrained by
resources such as machines, doctors or pathways. The flow of the entities through the system is
modeled.
In terms of analysis of results, experiments can be created where specific inputs are altered to examine
changes in performance. Simio provides an easy way of setting up and running experiments through the
use of add-ons such as OptQuest.
2.7 LITERATURE REVIEW CONCLUSION
Various Industrial techniques were identified from case studies pertaining to capacity constrained
systems, particularly within the service sector.
The Queuing Theory case study was similar to the Malas Workshop scenario however there was a large
number of steady-state equations and when many different types of servers are involved for a variety of
services offered, this model becomes even more complex. And further this method may prove not to be
appropriate as the Workshop system may not be in a steady state condition. Lastly, as mentioned by
Kelton (2007) problems associated with the queuing theory are that the natural or inherent variability of
a system are not included in the formulas and the arrival & service rates are not an exact estimate.
Chase et al. (2006) mentioned: "Mathematical analysis, when appropriate to a specific problem tends to
be fast and inexpensive, but the only real question is whether the system is accurately represented.”.

13
This can be a problem due to the fact that the workshop includes many different types of resources
where capacity needs to be planned and the activities to carry out the service share these resources.
Thus, this system may be too complex to be model accurately and mathematical modeling may not be
the best option to solve -the workshop problem.
“Even though mathematical models are faster and less expensive, simulation has no boundaries and
expanding computer power and memory have exceed the limits of what can be simulated. The
continuous development of simulation languages, such as SIMAN or SLAM and specialized software such
as SIMFACTORY or Optima! have made the entire process of simulation models much easier.” (Chase et
al.)
From the literature review, simulation modelling proves to be the best alternative from the selection of
techniques to manage the capacity constrained system present at the Malas Workshop. Due to the
complex system of the workshop, the wide variety of services offered and the large number of resources
which are shared by processes, simulation will be the best tool to accurately represent the real life
system.

14
Chapter 3: Conceptual Design
3.1 SIMULATION MODEL DEVELOPMENT
The project approach will follow a simulation methodology as discussed by Maria (1997), which includes
the following steps.
Figure 5: Simulation Methodology
1. Identify the problem: Identify problems in the workshop system and identify requirements for
the proposed system.
2. Formulate the problem: Select the problem scope, objectives and performance measures.
Investigate the techniques used to solve the defined problem in practice.
Phase 1• Identify the Problem
Phase 2•Formulate the Problem
Phase 3•Collect and Process Real System Data
Phase 4
•Formulate and Develop a Model
•Validate the Model
•Document for Future Use
Phase 5
•Select Appropriate Experimental Design
•Establish Experimental Conditions for Runs
•Perform Simulation Run
Phase 6
•Interpret and Present Results
•Recommend Further Course of Action

15
3. Collect and process real system data: Input variables, performance of the system and other
necessary data must be collected from data available on the company’s database. Probabilistic
distributions must be fit to stochastic input variables.
4. Formulate and develop a model: Flow diagrams for the high and low-level processes and
schematics are drawn up in the conceptual design to be translated to a form suitable for the
simulation software. Verification must be conducted which includes using a range of input
values to test the outputs by using constants instead of random values to manually verify the
result to ensure errors do not exist.
5. Validate the model: Validation means to run the model and compare the performance and
results to the real system to ensure assumptions in the model are valid and consistent.
6. Document for future use: Goals, objectives, assumptions and variables must be recorded.
7. Select appropriate experimental design: Experiments involve making changes to input variables
specifically the workshop resources, to determine how the performance is altered. Performance
measures and specific inputs are selected as well as the levels for each one. These scenarios are
designed to test the effect of different resource allocations on the performance and throughput
rate of the system.
8. Establish experimental conditions for runs: The aim is to obtain accurate and the most
information from one run, understand if the system changes over time(non-stationary) or not
(stationary), should the run be terminating or non-terminating, allocate the run length, select
the starting conditions and warm up period if necessary and the number of independent runs.
9. Perform simulation run: Run the model according to the conditions in the previous step.
10. Interpret and present results: Most software include statistics on certain measures such as
waiting time, queue length or utilization etc. Hypotheses can be tested regarding the
performance, animation of the outputs may be illustrated and results must be documented. The
results are analyzed to determine how to re-allocate the resources to its best possible extent to
ensure the throughput is increased.
11. Recommend further course of action: Provide suggestions and recommendations as to how to
solve the problem to Malas and possibly more experiments to reduce bias, other performance
measures or modifications for future plans and improvement.

16
3.2 SIMIO
Using the simulation software package, Simio, the simulation model is constructed to represent the As-Is
processes of the workshop. A standard object library is provided by Simio, which are the ‘building
blocks’ for model construction. These objects can be used to: process, create, transport or destroy
entities that mimic real world processes. (Simio, 2010)
Name Description
Source Creates entities that arrive to the system
Sink Destroys entities and records statistics
Server Models a multi- channel service process with input/output queues
Combiner Combines entities in batches
Separator Separates entities from batches
Work Station Models a 3-phase workstation with setup, processing and teardown
Resource Models a resource that can be used by other objects
Vehicle Carries entities between fixed objects
Basic Node A simple intersection of links
Transfer Node An intersection where entities set destination and wait on transporters
Connector A zero-time connection between two nodes
Path A pathway between two nodes where entities travel based on speed
Time Path A pathway with a specified time travel
Conveyer An accumulating/non-accumulating conveyer device Table 1: Simio Standard Object Library
3.3 AS-IS PROCESS ANALYSIS
Before building a model to represent the real life system, the processes which are conducted in the
workshop to render services need to be studied and thoroughly understood. Thus, process flow
diagrams are constructed to identify the flow of objects and information within the workshop. The
processes will be directly translated and modeled in Simio.
The process is constructed by individual activities and delays. The table depicts the symbols used in the
process flow charts.
Type Symbol
Start
Activity
Delay
Decision
Terminate
Table 2: Process Flow Symbols

17
Activities include seizing one or more resources to complete the activity and then releasing it when it is
done. This is done using the unique capability in Simio called Add-On processes in which the objects can
be customized to suit the system. Delays are also modeled with the use of Add On processes.
Both activities and delays, require a time inputs to be built into the model which is obtained from the
company’s database. The Input Analyzer from Rockwell’s software Arena, will be used to fit statistical
distributions to the data.
The Decision box implies that different options are available and this may be due to a probability chance
or by a condition, which is also modeled in Simio by using add-on processes.
3.3.1 HIGH LEVEL PROCESS FLOW DIAGRAM
Arrival of Vehicles
After a customer makes a payment for his order, an invoice is processed. A job card is provided to the
customer, and a picking slip is automatically sent to the warehouse for the items to be picked.
Thereafter, the customer drives his vehicle to the workshop where he joins a single queue at the
entrance, irrespective of the service type required. Once he is allowed access by the Gate Keeper, the
Job Assigner assigns him to a bay.
Job Scheduling
Jobs are assigned to the first available bay on a First Come First Serve basis. If there are more than one
services required for a vehicle, the service which is the first to have a vacant bay will be completed first.
Once the first service is complete, the Job Assigner re-assigns the vehicle to the next vacant bay for the
next service to be complete. As a result, smaller queues may form within the actual workshop itself. The
following rules for job scheduling are pointed out:
A vehicle already present in the workshop has preference to a vehicle in the queue outside of
the workshop.
If Tyre Fitment is required, Wheel balancing becomes obligatory.
Wheel Balancing must always be conducted directly after the Tyre Fitment Process
If an Undercarriage service is conducted, Wheel Alignment is obligatory.
Alignment must always be done after the Undercarriage service. However, other services may
be rendered in between them.
It is noted that when the Job Assigner assigns a vehicle to a bay, a technician is automatically assigned to
the vehicle as well. One technician is required to complete one job.

18
3.3.2 LOW-LEVEL PROCESS FLOW DIAGRAMS
3.3.2.1 Tyre & Wheel Fitment and Balancing Process
For Tyre Fitment & Wheel balancing, customer may choose to service between one and four
tyres/wheels. New tyres, new wheels or both may be purchased. Further, the customer may not require
new products at all and simply requires the old wheels to be balanced.
Once the vehicle is assigned to a bay, the technician directs and lifts the vehicle onto the bay. After
inspection, the tyres are removed and moved to the Ops Room. Using one of the Fitting Machines, the
tyres are stripped off the wheels. The technician proceeds to the Dispatch Area where he provides a job
card to the dispatcher to receive the goods. After obtaining approval by the manager, the goods are
released. The technician moves the new wheels/tyres back to the Ops rooms where he fits them on
using the same fitment machine. Thereafter, he proceeds to the balancing machine to balance the new
wheels. Lastly, the new wheels/tyres are fit back onto the vehicle.
If Wheel Balancing only is required, the fitment machine sub-process as well as the dispatch sub-process
are excluded since there is no new goods purchased. The technician simply balances the old wheels
using the balancing machine and the rest is the same as described above.
Figure 6: High Level Process Flow Diagram

19
After approval from the Quality Controller, the job is complete and the vehicle may exit the bay. If it is
not approved, the technician must rework and fix the errors. A quality check must be conducted again
and if approved, the job is complete and the technician and bay is available for a new job.
3.3.2.2 Undercarriage Service Process
Customer may opt to service their vehicle’s shocks, brake pads or both. The parts may be purchased in
pairs only, which is for the front and the back of the vehicle.
Similar to the Tyre Fitment/Balancing process, once a job is assigned, the technician directs and lifts the
vehicle onto the bay. After an inspection, the parts required are removed. The technician proceeds to
the Dispatch area to receive the goods. Parts are not stored in the actual warehouse due to the wide
variety required for various vehicles, space constraints and the fact that only a small percentage of
customers require this service. Parts are ordered multiple times on a daily basis when required and thus
this process can be quite lengthy due to delays in waiting for the part to arrive at the dispatch. The
dispatch sub-process is conducted in the same manner as the tyre process. These deliveries are carried
out daily, and thus there are long delays associate with this service. However, only a small percentage of
vehicles require undercarriage services.
Figure 7: Tyre Fitment/Balancing Process Flow Diagram

20
Once the goods are released to him, he fits the parts onto the vehicle and the quality checks are
conducted. After approval, the job is complete and the vehicle may exit the bay.
Figure 8: Undercarriage Process Flow Diagram
3.3.2.3 Alignment Service Process
The alignment process is purely a service and thus no dispatch activities are involved. Similarly, once the
job is assigned, the technician directs and lifts the vehicle onto the bay. The bay is equipped with a built
in machine to render the alignment. Using readings from a computer and sensors placed underneath the
vehicle, the technician may accurately align the wheels according to the vehicle specifications.
The quality checks are completed and after approval, the job is complete.
Figure 9: Alignment Process Flow Diagram

21
3.3.2.4 Takeaway Service
Lastly, the takeaway customer process must also be included as it shares the same dispatch
area as that of the workshop. When a customer purchases wheels, tyres or parts, an invoice is
generated and a picking slip is sent to the warehouse. The customer proceeds to the takeaway
section of the Dispatch Area where the dispatchers obtain the order. After approval from the
manger, the order is released to the customer who then exits the system.
3.4 TRANSLATION TO SIMIO
The high and low level processes are directly translated into Simio to construct the model. A source
object is used to generate the vehicle and takeaway customer entities. The vehicle entities are assigned
with attributes to determine which services it requires. Each service process described above are
modeled using the server object in Simio which acts as a process as well as a resource. Once the entities
have specific attributes, routing logic enables the entity to move through all the required servers once.
Thereafter, they move to a sink object which destroys entities and records statistics such as the
throughput rate.
Technicians, Dispatchers, Quality Controllers, the Job Assigner and Dispatch Manager are modeled as
worker objects. The Fitment and Balancing Machines are modeled as resource objects. Their respective
capacities are allocated to represent the real life system.
Each server namely; Tyre Process, Undercarriage Process and Alignment Process will be given a capacity
to allocate the number of bays there is available for each. Add-on processes will be used to explicitly
model the individual processes described above. Seize and Release objects are used to seize the
resources and release them once their activity is complete. Delay objects are used to model each
individual activity in the processes and thus the total processing time is a sum of the individual delays.
The Alignment process is an exception to this since there is only one individual process involved.
The workshop will be modeled as described above to represent the individual components which make
up the system. The model construction will be discussed in further detail in Chapter 5.
The next step is to obtain input variables to be built into the model. Inputs include entity arrival times,
process and delay times, service type probabilities, resources capacities as well as cost/revenue factors.
This is discussed in the following section, Chapter 4.

22
Chapter 4: Data Analysis
4.1 DATA COLLECTION
Input data modeling is a critical component of a successful simulation application. Input variables such
as resource capacities, arrival rates, process and delay times as well as cost/revenue factors must be
built into the model during construction, to accurately represent the real life system. Thus, real system
data must be collected and processed.
The company uses a system called the Workshop Management System which is a custom developed,
web-based system designed to manage the job allocations in the workshop. Once an invoice is
generated in the ERP system, it is integrated into the WMS database. Further, it collects information
such as customer name, registration number, time vehicle entered, time job is started, time job is
complete, service type, number of products etc. The data field are mapped into the respective columns
in the WMS database where it is stored.
The data, for a few months in 2014 was extracted from the WMS was into Microsoft Excel, where it was
sorted and organized. In the case where an expression for the distribution of the data was required, the
Input Analyzer was used to fit statistical distributions to the data. For other purposes such as obtaining
probabilities, Microsoft Excel was used. A screenshot of the Excel Spreadsheet is made available in
Appendix B.
For the processes which are modeled explicitly as individual activities or delays, data is not available
from the database and therefore interviews with the workshop manager were conducted to obtain the
information required. Statistical distributions which were most applicable to the nature of the specific
input were used to obtain very close estimates.
4.2 RESOURCE CAPACITIES
In Simio, a resource is a generic object such as workers or machines which is seized and then released by
other objects. From an interview with the workshop manager, the types of resources in the system, the
capacity for each type of resource and the number of each type of resource to be seized to complete
one job were obtained.

23
Resource Type Resource Capacity No. seized per Job
Workshop Management Team
Gatekeeper 1 1
Job Assigner 1 1
Tyre/Wheel Quality Controller
1 1
Undercarriage Quality Controller
1 1
Alignment Quality Controller
3 1
Dispatch Team Dispatch Manager 1 1
Dispatchers 3 1
Technicians Tyre Technicians 32 1
Undercarriage Technicians
5 1
Alignment Technicians 7 1
Bays Tyre Bays 32 1
Undercarriage Bays 5 1
Alignment Bays 7 1
Operations Room Fitting Machine 16 1
Stripping Machine 16 1 Table 3: Resource Capacities
4.3 ENTITY ARRIVAL
Two entities exist in the system, the primary entity being the vehicles which enter the workshop. The
vehicle inter-arrival time was obtained from the database where the WMS records the time a vehicle
enters or is assigned to a bay. The inter-arrival time of takeout customers were obtained from the time a
takeout invoice was produced. Using Arena’s Input Analyzer, statistical distributions were fit to the data.
The expressions for inter-arrival times are tabulated below.
Entity Inter Arrival Time (Minutes)
Vehicle EXPO(2.77)
Takeaway Customer EXPO(42.2) Table 4: Entity Inter-Arrival Times
Figure 10 below is depicts the data distribution for the vehicle inter-arrival time with a distribution
summary from the Input Analyzer. The takeaway customer data distribution can be viewed in Appendix
B.

24
Figure 10: Vehicle Arrival Input Analyzer
4.4 PROCESS AND DELAY TIMES
JOB ASSIGNMENT
This is modeled as a delay and the approximated time, as obtained from the interview, was allocated
using an exponential distribution.
ALIGNMENT
Since the alignment process is only a single activity, the processing time was obtained using the total
alignment processing time from the database and fitting a distribution to it. The quality check and
rework times were estimated and fit with Uniform Distributions as it usually as a minimum and
maximum value. The alignment data distribution can be viewed in Appendix B.
UNDERCARRIAGE
Since the undercarriage process is greater in complexity, simply using the total processing time is not
applicable and thus the estimated individual delay times were given by the workshop manager. A shock
or brake may be fitted only as a pair, and thus the estimated time for removal/fitment indicated is for a
pair of parts. There is a great deal of variability in this process due to different types and sizes of parts
available for different car models and lengthy delays associated with waiting for the parts to be
delivered. Thus a minimum and maximum time was given for each input and a triangular distribution
was used to accommodate this variability. Quality checks have a minimum and maximum time. Rework
times vary for undercarriage and is thus fit with a Random Distribution.
Tyre/Wheel Services
The tyre fitment and balancing process is even more complex and simply using the total processing time
from the database will not be applicable to the model. Therefore, close estimates for each individual
activity and delays were obtained by the dispatch manager. The time indicated is for removal, stripping,
balancing and fitting is for one tyre/wheel only. For the case where more tyres are serviced, the activity
time will simply be expression given one tyre, added two, three or four times. The dispatch time is
considerably less than that of the undercarriage process as tyres are available majority of the time in the
warehouse which is directly linked to the dispatch. Similar to the previous two processes, an estimate

25
for quality check is fit with a Random distribution as it mostly involves checking that bolts/nuts are not
loose. The rework time usually takes between two to two and a half minutes and thus is estimated it be
fit with a uniform distribution.
The table below summarizes the random distributions for the activities described above.
Category Input Variable Expression (Minutes)
Job Assignment Job Assignment Delay EXPO(1)
Alignment Process Alignment Process Time -0.001 + EXPO(11.5)
Quality Control Time UNIF(1,2)
Alignment Rework Time UNIF(0.5,1)
Undercarriage Process Part Removal Brakes TRIA (3, 4, 8)
Part Removal Shocks TRIA(10, 20, 22)
Walk to Dispatch Delay UNIF (0.5, 1)
Dispatch Activity TRIA (2, 15, 30)
Dispatch Authorization EXPO (1)
Part Fitment Brakes TRIA (3, 4, 8)
Part Fitment Shocks TRIA(10, 20, 22)
Quality Control Time UNIF(2, 2.5)
Rework Time EXPO(10)
Tyre Process Tyre Removal TRIA (0.5, 1, 2)
Walk to Ops Room Delay UNIF (0.5, 1)
Tyre Stripping Time UNIF (1, 2)
Walk from Ops to Dispatch Delay
UNIF (0.3, 0.5)
Dispatch Activity EXPO(2)
Dispatch Authorization EXPO(1)
Tyre Fitting Time TRIA( 1, 2, 2,5)
Tyre Balancing Time TRIA(0.5, 1, 2)
Tyre Fitment TRIA (0.5, 1, 2)
Quality Check EXPO(3)
Rework Time UNIF(2, 2.5) Table 5: Process and Delay Times
4.5 INPUT PROBABILITIES
Customers opt to have one or a combination of services done. The system is modeled such that when a
vehicle entity is created, attributes as to which type of service or services are given to every entity.
Information as to the number of invoices processed per day as well as what service was conducted for
each vehicle is available from the database. With the use of Pivot Tables in Microsoft Excel, the sum of
each service type conducted was computed and divided by the number of invoices processed. In this
manner, the probabilities of vehicles that do tyre fitment, balancing or undercarriage were obtained.
The Microsoft Excel computations can be viewed in Appendix B.
In addition to service types for each transaction indicated in the data, the product type and quantity are
also available. In this manner, the probabilities for shocks or brakes together with the probability of one

26
or two pairs were acquired. Further from this information, the probability as to the amount of tyres:
between one and four, is estimated. The probability as to what percentage of customers who require a
tyre/wheel service do fitment and balancing or simply balancing only is also obtained from the data. The
rework probabilities were given as an estimate from the workshop manager. Jobs pass the quality check
majority of the time and thus the chance for a rework is extremely small for all services. The input
probabilities are summarized in the table below.
Category Input Variable Probability (%)
Service Type Probability Tyre Fitment and Balancing 82.38
Undercarriage 8.55
Alignment 39.81
Alignment Alignment Rework 5
Undercarriage Shocks Only 71.53
Brakes Only 26.64
Shocks and Brakes 1.82
One Pair Shocks 23.71
Two Pair Shocks 76.29
One Pair Brakes 98.82
Two Pair Brakes 1.18
UC Rework Probability 5
Tyre Balancing Only 73.44
One Tyre/Wheel 29.17
Two Tyres/Wheels 34.90
Three Tyres/Wheels 2.08
Rework Probability 33.85 Table 6: Input Probabilities
4.6 FINANCIAL DATA
The aim of the project is to maximize the throughput rate of the workshop. The profit generated is
directly linked to the number of vehicles per day and thus profit may be used as a surrogate measure for
the throughput rate. The relevant revenues and costs associated with the workshop was obtained from
an interview with the workshop manager.
REVENUE
The revenue is expressed per job for each service type. The values are linked to the revenue earned
from purely conducting the service in the workshop and thus the sales from tyres, wheels and parts are
not included. For wheels/tyres, the revenue is expressed in unit cost in terms of one individual tyre
(multiplied with the number of tyres, between one and four). For undercarriage, the revenue is
expressed in terms of a pair of parts for either brakes or shocks (multiplied with two for two pairs).
Lastly, for alignment the revenue is an average value earned from an alignment service as it differs with
regards to the vehicle model.

27
Service Type Description Revenue (R/Job)
Balancing Only One Wheel 26
Fitment and Balancing One Wheel/Tyre 50
Shocks One Pair 120
Brakes One Pair 85
Alignment Average 160 Table 7: Revenue Inputs
COST
Labour costs are expressed in terms of cost per 196 hours per employee. The table below summarizes
the cost per employee per day. The total labour cost will be computed at the end of a simulation run
and subtracted from the total revenue generated per job to determine the profit. The total cost is the
sum of the unit costs multiplied by the number of each type of resource and therefore as the resource
configuration varies, the total cost will change for each scenario.
Employee Cost per month (R/196 hours) Cost per Day (R/ 8 hour day)
Job Assigner 7000 285.71
Tyre Technician 5110 208.57
Undercarriage Technician
5750 234,69
Alignment Technician 6850 279.59
Dispatchers 4750 193,87
Quality Controller 10 000 408.16 Table 8: Resource Unit Costs
Electricity costs to run machines and bays apply only to the Fitment Machines, Balancing Machines and
Alignment Bays. The tyre fitment bays and undercarriage bays do not require electricity as they use
hydraulics to lift the vehicles. The electricity cost is computed per job and thus when it is modeled in
Simio, the cost per job will be subtracted from the total revenue each time an entity moves through one
of the machines or the alignment bay. The table below summarizes the power required per resource
and the cost for each job. The rate used is R1.60 per kilowatt.
Resource Kilowatt used per Job Cost (R/Job)
Fitment Machine (one tyre) 3 4.80
Balancing Machine (one wheel) 2 3.20
Alignment Bay 3 4.80 Table 9: Resource Electricity Costs

28
Chapter 5: Simulation Model
5.1 AS-IS MODEL CONSTRUCTION
5.1.1 HIGH-LEVEL PROCESS The As-Is model representing the workshop was constructed using the Standard Object Library in Simio.
The inputs obtained from the data analysis in Chapter 4 were built into the model. The components of
the high-level process of the workshop was constructed as discussed in section 3.4: Translation to Simio.
5.1.2 LOW-LEVEL PROCESSES The individual low-level processes for each sub process namely: Tyre Fitment/Balancing, Alignment,
Undercarriage, Takeaway, Job Assignment were modeled using the add-on processes which are
available is Appendix C.
The Job Assignment and Dispatch sub-processes simply involve seizing the Job Assigner and Dispatcher
respectively, delaying the time to conduct the activity and thereafter releasing the worker.
The Alignment add-on process seizes the technician before processing. The Alignment processing time
obtained from the data analysis is built into the Alignment server. Once the process is complete, the
quality controller is seized and delayed to complete the check and then released. A decision by chance is
used to determine if a rework is required, if it is not the technician is released and the job is complete.
Else, a delay is added on for a rework and the quality control must conducted again.
The Tyre/Wheel fitment and balancing add on process is greater in complexity. After the technician is
seized, a decide object by probability is used to determine how many tyres are required. Thereafter,
another decide object is used to determine whether it is fitment and balancing or balancing only. For
fitment, the fitment machine is seized and delayed. Thereafter the dispatchers and dispatch manager
are seized, delayed and released. Once the fitment machine is released, the balancing machine is seized
and delayed and released. Lastly, there is delay to fit the tyres back onto the vehicle. The quality check is
conducted in the same manner as above. It is noted that the process time in the server is set to 0 as the
total process time will be a sum of all the delays.
The Undercarriage add-on process is modeled in a similar manner to the Tyre Fitment add-on process.
5.1.3 MODEL ENTITY SERVICE ATTRIBUTE
Once vehicle entities are created, attributes need be assigned to each vehicle as to what service or
services it requires. Three states are created in the model entity: ‘Do_Tyre’, ‘Do_UC’ &’Do_Alignment’.
An add-on process is created at the source object to assign these attributes to the vehicles randomly
using discrete distributions. For example, if a vehicle enters 17,62% of the time the variable ‘Do_Tyre’
will return a value of 0, whilst the rest of the time it will have a value of 1 meaning the entity will do a
tyre service approximately 83% of the time.

29
ROUTING LOGIC
In the case of tyres only and undercarriage only, the vehicle is routed to the sink model as the job is
complete. However for service combinations, once a vehicle exits a process it must determine where to
be routed to next. But first, in order to ensure a vehicle does not return to the service again, state
variables are created in the model entity namely: ‘Tyre_Done’, ‘UC_Done’ and ‘Alignment_Done’.
Initially, these states are set to 0. When a vehicle exits a bay, an assignment is made to set the
respective variable to 1. Thus, if a vehicle has all its required attributes equal to 1, it will be routed to the
sink object. Else, it will be routed to the bay where the attribute is still 0 to ensure that service is
completed. In this manner, the model will ensure the vehicle goes through all its required services once.
Once a vehicle is assigned with attributes, the routing logic is determined. It must first be determined
what services are required, either Tyres only; Tyres & Alignment; Alignment & Undercarriage; Tyres,
Undercarriage and Alignment or Alignment only. These combinations are routed to separate nodes
using their state variables, for example: ‘Do_Tyres’ = 1 & ‘Do_Alignment’ = 1 & ‘Do_UC’ = 0 means the
vehicle requires tyre and alignment services. Once it gets to the node, the vehicle must decide which
service must be completed first. The rule follows whichever service bay has the shortest queue. The
expression used to determine the queue length is indicated below. All the service categories are routed
in this manner.
TOTAL REVENUE
A state is created in the model entity called ‘TotalRevenue’ which is set to 0. An assignment is made for
each service type to increment the revenue by the specific values obtained from the data analysis for
each service the entity is assigned to. Further assignments are made in order to decrement the revenue
with regards to the electricity costs per job associated to the fitment, balancing and alignment
machines. A tally is created at the sink called ‘RevenueTally’ to obtain the total revenue for the run.
5.1.4 SIMULATION PARAMETERS The workshop operates between 8:00 AM to 5:00 PM with a break of one hour in between. Thus the
simulation run is set to eight hours to represent the workshop operations for one day.
5.2 VERIFICATION & VALIDATION
The process of model verification entails ensuring the model performs the way it was intended to. A
thorough investigation of the input parameters and model logic is required to ensure errors do not exist.
Debugging is done if any errors exist in order that the simulation runs fully to completion. Further, a
vehicle can be physically seen moving through the system through the use of animation. This verifies
that entities are moving correctly through the system.
The validation of a simulation model includes comparing and ensuring that the model performance is a
true representation of the real system performance. This is done by comparing the model outputs such
as throughput rate after a simulation is run to the real life system.
The vehicle throughput rate, takeaway customer throughput rate and total revenue per day were
compared to the real life values. Although the model will not be exactly the same as the real life system

30
due to assumptions made, it was found that the model outputs are consistent and very similar to the
real system data.
Further, the statistical time distributions seem to be consistent with the estimates provided by the
workshop manager. In this manner the model is validated and proves to be a sufficient representation of
the workshop system.
A three dimensional view of the model whilst it is running is shown in the figure below.
Figure 11: Three Dimensional Model Facility View
5.3 EXPERIMENTAL DESIGN
The aim of the simulation study is to identify and improve capacity constrained resources and
bottlenecks. An experiment includes generating various scenarios in order to test alternative resource
capacities to obtain the best balance, with the aim of maximizing the throughput. However, the scenario
which generates the highest throughput rate is not necessarily the best option if it incurs a high cost due
to an increased number of resources. This must be considered in the experimental design.
5.3.1 OPTQUEST The add-on for experimentation in Simio called OptQuest, is used. OptQuest evaluates many possible
solutions to find optimal results. By describing the simulation experiment, OptQuest automatically
searches for input controls to either maximize or minimize the objective.

31
CONTROLS
Workshop resource capacities will serve as controls to the experiment which include the capacities of
service bays, technicians and quality controllers for all services. Also included in the controls are the
capacities of job assigners, dispatchers, balancing and fitment machines.
RESPONSES
The main objective is to maximize the throughput rate. Since the profit is directly dependent on the
number of vehicles serviced per day, profit is used as a surrogate measure of the throughput rate. Thus
the objective of the experiment is to maximize the primary response, which is the profit generated per
day. Profit is defined by the Total Revenue earned per day less the total cost.
The expression for total revenue is the sum of the revenue obtained from each job and is computed in
Simio as:
The expression for total cost is expressed as the sum of each resource unit cost multiplied with the
number of each type of resource and is computed in Simio as:
OptQuest generates the possible optimal solutions in terms of alternative resource configurations. By
maximizing profit, the revenue will be maximized. At the same time the total cost will be minimized and
consequently the number of resources required will be reduced. In this manner, resource idle time is
addressed and improved, ensuring resources are utilized more efficiently.
The resource parameters which are not included in the expression for cost which are Fitment Machine
Capacity, Balancing Machine Capacity and Alignment Machine Capacity are used as responses. The
objective for each one is to be minimized to ensure optimal results achieved. The resources capacities
included in the cost expression will be inherently decreased in order to minimize cost.
The results from the OptQuest Experiment can be viewed in Appendix D.
RevenueTally.Average x RevenueTally.NumberOfOccurrences
(208.57 x TyeTechnicianCapacity) + (234.69 x UCTechnicianCapacity) + (279.59 x
AlignmentTechnician) + (193.87 x DispatchersCapacity) + (408.16 x TyreQCCapacity)
+ (408.16 x UCQCCapacity) + (408.16 x AlignmentQCCapacity) + (285.71 x
JobAssignerCapacity)

32
Chapter 6: Simulation Results & Analysis
6.1 AS-IS RESULTS
Once the model is run to completion, Simio generates results in the form of a pivot grid and a report to
summarize the outputs of the simulation run. For the purpose of this model, the most important output
concerned would be the throughput rate of the vehicle entity in order to meet the objectives of this
project. The results relating to the outputs of the model entities is provided below.
The results indicate the number of entities in the system, the time the entity spends in the system and
the number of entities destroyed which is the throughput per day. For the vehicle entity it is shown that
the throughput rate totaled a number of 165 vehicles for the simulation run. The maximum time spent
in the system by an entity is just over 2 and a half hours, the minimum time is approximately 3 minutes
and average of 33 minutes. This validates the model as it represents the real life situation. Lastly it
indicates that the average number in the system is 11 vehicles.
Figure 12: As-Is Model Results
An As-Is scenario was generated to obtain the profit generated in a day for the base case model. The
simulation run generated a revenue of R25 339.80 and a profit of R12 443,20 per day.
Figure 13: As-Is Experiment Results

33
6.2 EXPERIMENTAL RESULTS & ANALYSIS
The results from the OptQuest experiment is available in Appendix D. The scenarios which produce the
best outputs is compared to the base model and analysed to provide recommendations to Malas.
6.2.1 OUTPUT ANALYSIS SMORE plots (Simio Measure of Risk & Error) is a graphical tool for the analysis and comparison of
scenarios. It is useful in making decisions as to which scenarios are the best alternatives.
Figure 14: Simio SMORE Plot
The scenario which generates the highest profit is considered the best alternative. However, since the
simulation model generates random variables, the values may change each time the model is run.
Further, it is best to provide more than one recommendation to management in order to enable them
to choose the most applicable solution, in line with the company’s policies.
Thus, a range of the best performing alternatives must be analysed. The SMORE plots for the profit
response are used to identify potential solutions. The plots provide a graphical representation of the
results and thus alternatives may be compared with ease. Since the goal is to maximize profit, the
alternatives which fall within the range of greater than R20 000 are considered. However, alternatives
which appear within this range with low minimum values are not considered.
The plots which overlap each other, in terms of mean confidence interval, within this range are
statistically significantly similar to each other and will produce similar results. Thus, they serve as
potential solutions, and are compared with each other.

34
Figure 15: SMORE Plot Results

35
Figure 16: SMORE Plot Results 2

36
6.2.2 ANALYSIS OF ALTERNATIVES
As discussed above, potential solutions were selected based on the alternatives with the highest profits
and those which are statistically significantly similar to them.
The 14 most feasible alternatives selected based on the SMORE plots are identified and tabulated
below. Their combinations of resource configurations are included as well as their outputs generated
per day, profit and throughput.
Sce
nar
io
Bal
anci
ng
Mac
hin
e
Fitm
en
t M
ach
ine
Job
Ass
ign
ers
Tyre
Bay
UC
Bay
Alig
nm
en
t B
ay
Dis
pat
che
rs
Tyre
Te
chn
icia
n
UC
Te
chn
icia
n
Alig
nm
en
t
Tech
nic
ian
Tyre
QC
UC
QC
Al Q
C
Pro
fit
(R/D
ay)
Thro
ugh
pu
t
(Ve
hic
les/
Da
y)
Base Model
16 16 1 32 5 7 3 32 5 7 1 1 1 13443.20 165
36 2 3 2 16 1 7 2 11 1 2 2 2 2 22127.40 186
44 2 3 2 15 1 7 2 11 1 2 2 2 2 22127.40 186
52 2 4 2 16 2 7 2 11 1 3 2 2 2 22621.80 190
55 2 4 2 15 2 6 2 11 1 3 2 2 2 22621.80 190
56 2 4 2 17 2 8 2 11 1 3 2 2 2 22621.80 190
59 2 4 2 12 2 5 2 10 1 4 2 2 2 23225.10 190
67 2 4 2 12 2 6 2 10 1 4 2 2 2 23225.10 190
68 1 4 2 11 2 5 2 10 1 4 2 2 2 23225.10 190
70 2 4 2 17 2 7 2 11 1 3 2 2 2 22621.80 190
74 2 4 2 13 2 5 2 10 1 4 2 2 2 23225.10 190
75 2 4 2 13 2 6 2 10 1 4 2 2 2 23225.10 190
76 2 4 2 15 2 8 2 11 1 3 2 2 2 22621.80 190
79 2 4 2 13 2 7 2 10 1 4 2 2 2 23225.10 190
80 2 4 2 13 2 12 2 10 1 4 2 2 2 23225.10 190
Table 10: Potential Solutions
It is clear from the results that in order to improve profits, the number of resources must be decreased
substantially. This is done to ensure the total cost is decreased as well as to remove resources which are
under-utilized. By doing so the profits have increased significantly in comparison to the base model
which generated a profit of R13 443 and a throughput rate of 165 vehicles per day. For this simulation
run, the maximum profit achieved per day is R23 225 and in terms of throughput rate, 190 vehicles per
day.

37
From the best resource configurations provided it is indicated that majority of the time, the following
resources capacities will always be most optimal when there are:
2 balancing machines ;
4 fitment machines;
2 job assigners;
2 of each type of quality controller;
1 undercarriage technician;
2 undercarriage bays;
The various capacities for tyre bays, alignment bays, tyre technicians and alignment technician are
illustrated in the graphs below.
Figure 17: Tyre Bay and Technician Capacity Comparison
It is illustrated that the number of tyre bays and technicians required are much less than the current
scenario. Further, it is better to have a lower number of tyre technicians than bays in order to decrease
inefficiencies and improve the technician utilization. The proposed solutions for the tyre bays range
between 13 and 17 bays whilst the tyre technicians are either 10 or 11.
05
101520253035
Cap
acit
y
Scenario
Proposed Solutions for Tyre Bay Capacity and Tyre Technician Capacity
Tyre Bay Capacity Tyre Technician Capacity

38
Figure 18: Alignment Bay and Technician Capacity Comparison
The graph indicates that it is more feasible in some scenarios to improve the number of alignment bays
whilst others indicate it should be decreased. The proposed solutions for alignment bay capacities range
between 5 and 12. It is noticed that it is better to have less technicians than bays in order to maximize
utilization. The optimal configurations of alignment technicians range between 2 and 4.
However, implementation of each of these optimal solutions entails retrenching approximately half of
the workforce and selling majority of the machinery, which is not a good solution for Malas. A better
approach would be to retrain and deploy idle technicians to more useful areas such as job assigners and
quality controllers, which are the constraints of the system. By increasing the resource capacities at
these constrained areas, the system will require more technicians and machinery. Further
experimentation was conducted on Simio to test for a better solution.
The following scenario produced the best result and maximised the throughput to 200 vehicles:
3 Job Assigners
3 Dispatchers
24 Tyre Technicians
5 Undercarriage Technicians
7 Alignment Technicians
17 Tyre Bays
3 Undercarriage Bays
4 Alignment Bays
11 Fitment Machines
11 Balancing Machines
3 Tyre Quality Controllers
3 Undercarriage Quality Controllers
3 Alignment Quality Controllers
0
2
4
6
8
10
12
Cp
acit
y
Scenario
Proposed Solutions for Alignment Bay and Alignment Technician Capacities
Alignment Bay Alignment Technician

39
6.3 CONCLUSION & RECOMMENDATIONS
The workshop at Malas Drivestyle Centre was found to be constrained by its operations in order to
expand and deliver more. Management were concerned regarding the low throughput rate currently
experienced as it hinders the company’s ability to satisfy the additional demand which is expected to
witness a phenomenal growth over the next couple of years.
The workshop inefficiencies resulted in long queues, low job flow completion rates and decreased
machine & technician utilization. Thus, the aim of the project was to identify bottlenecks and
constrained resources and improve them to ensure the throughput rate is maximized.
From the OptQuest simulation results, it is evident that by decreasing the number of resources, the
throughput rate and profit is significantly increased. This indicates that a large number of resources
were under-utilized.
The objective was to maximize the profit, which is a surrogate measure for throughput, feasible possible
solution were developed. OptQuest developed an optimal set of solutions by maximizing the revenue
whilst decreasing the number of resources required. In this manner, idle resources were removed
inherently in the experiment.
From the 100 scenarios developed, all the alternatives which produced the highest profits were
considered. From these, using the SMORE plot charts, the alternatives which are statistically similar
were selected as they will produce similar results to each other every time the simulation is run.
The optimal resource configurations for Malas is tabulated in Table 10 above. However, implementation
of these optimal solutions entails retrenching approximately half of the workforce and selling majority
of the machinery. A better approach is to retrain idle technicians and deploy them to more useful areas.
Further experimentation was conducted considering this and a proposed solution was made to Malas to
increase the number of Job Assigner and Quality Controllers to a capacity of 3 for each type (as they are
constraints of the system), keep the dispatchers capacity at the same level and reduce the various other
resources to the capacities indicated above.
By re-allocating and implementing one of these solutions, the throughput and consequently the profits
will be improved which meets the objective of this project. Further, resources will be used more
efficiently and issues in the workshop such as long queues and waiting times will be improved leading to
increased customer satisfaction.
A suggestion for future improvements and expansion to satisfy an additional demand would be to build
an extra control into the model to determine how the resources should be re-allocated as the demand
(inter-arrival time of entities) is increased.
To conclude, the project aims to deliver a model to the firm to act as a decision support system to aid in
strategic future plans. It is highly recommended to implement this solution to ensure the strategic
objectives of Malas may be achieved.

40
References
1. Ahmadi, R.H. (1997) Managing Capacity and Flow at Theme Parks. Informs. [Online] 45(1). p. 1-
13. Available from: http://www.jstor.org/stable/171921 [Accessed: 5 May 2014]
2. Arena Simulation Software by Rockwell Automation. (2011) How is Simulation different from
Modeling Processes in a Spreadsheet? [Online] Available from:
http://www.arenasimulation.com/Arena_Home.aspx
3. Armistead, C. & Clark, G. (1991) Capacity Management in Services and the influence on Quality
and Productivity Performance. SWP. [Online] 56(91). Available from:
https://dspace.lib.cranfield.ac.uk/bitstream/1826/333/2/SWP5691.pdf
4. Atwater, J.B. & Chakravorty, S.S (2002) A Study of the Utilization of Capacity Constrained
Resources in Drum-Buffer-Rope Systems. Production and Operations Management. [Online]
11(2). p. 259-273. Available from: http://0-
www.scopus.com.innopac.up.ac.za/source/sourceInfo.url?sourceId=22405&origin=recordpage
5. Badri, S.A. & Aryanezhad, M.B. (2010) A Mathematical Model for Managing the System
Constraint. International Journal of Engineering. [Online] 24(1). p. 37-47. Available from:
http://www.sid.ir/en/VEWSSID/J_pdf/856201101A04.pdf
6. Beasley, J.E. (2009) Queuing Theory. [Online] Available from:
http://www.staffs.ac.uk/assets/harvard_referencing_examples_tcm44-39847.pdf
7. Chase, R.B., Jacobs, F.R., & Aquilano, N.J. (2011) Operations Management for Competitive
Advantage. Thirteenth Edition. McGraw-Hill/Irwin: New York.
8. Cornell University: School of Operations Research and Information Engineering. (2014) What is
Operations Research? [Online] Available from: http://www.orie.cornell.edu/about/whatis.cfm
9. DeWet, K. (2010) Airport Analysis and Configuration, A Dissertation Submitted in partial
fulfillment of the Requirements for the Degree of Bachelors of Industrial Engineering in the
Faculty of Engineering, Built Environment and Information Technology. University of Pretoria.
10. Dijk, N., Ven der Sluis, E., Haijema, R., Ibrahim, A. & Van der Wal, J. (2005) Simulation and OR in
combination for Practical Optimization. Proceedings of the 2005 Winter Simulation Conference.
Orlando Fl, 4 –7 December, 2005. Orlando: Winter Simulation Conference.
11. Gademann, N. & Schutten M. (2005) Linear Programming Heuristics for Project Capacity
Planning. IIE Transactions [Online] 37(2). p.153-165. Available at: http://0-
www.scopus.com.innopac.up.ac.za/source/sourceInfo.url?sourceId=19125&origin=recordpage

41
12. Goldratt, E.M. (1990) What is this thing called the Theory of Constraints and how should it be
Implemented? North River Press: Indiana.
13. Geng, Y. & Cassandras, C.G (2011) Dynamic Resource Allocation in Urban Settings: A “Smart
Parking” Approach. Computer –Aided Control System Design. Denver, CO, 28-30 September,
2011. Denver: IEEE
14. Lin, C.K.Y (2013) A Decision-Support Simulator for Improving Patient Flow and Increasing
Capacity at an Eye Outpatient Department. Computational Intelligence in Healthcare and e-
health (CICARE). Singapore, 16-19 April, 2013. Singapore: IEEE
15. Maria, A. (1997) Introduction to Modelling and Simulation. [Online]. Available:
http://www.inf.utfsm.cl/~hallende/download/Simul-2-
2002/Introduction_to_Modeling_and_Simulation.pdf
16. Mersha, T. (1990) Enhancing the Customer Contact Model. Journal of Operations Management.
[Online] 9(3). p. 391-405. Available from:
http://www.ida.liu.se/~steho/und/htdd01/sdarticle15.pdf
17. Pegden C.D (2012) An Introduction to Simio for Arena Users. [Online] Available from:
http://www.simio.com/resources/white-papers/For-Arena-Users/An-Introduction-to-Simio-For-
Arena-Users.htm
18. Pegden C.D (2012) Introduction to Simio for Beginners. [Online] Available from:
http://www.simio.com/resources/white-papers/Introduction-to-Simio/introduction-to-simio-
for-beginners-page-2.htm
19. Putter, J.M. (2009) Improved Productivity through the Simulation of different Configurations of
Resource Allocation, A Dissertation Submitted in partial fulfillment of the Requirements for the
Degree of Bachelors of Industrial Engineering in the Faculty of Engineering, Built Environment
and Information Technology. University of Pretoria
20. Siha, S. (1999) A Classified Model for applying the Theory of Constraints to Service
Organisations. MCB University Press. [Online] 9(4). p 255-264. Available from:
http://www.emeraldinsight.com/journals.htm?articleid=842656
21. Smit, J.P.J. (2012) Resource Optimisation of a Warehouse Process through Simulation Modeling -
Agrinet, A Dissertation Submitted in partial fulfillment of the Requirements for the Degree of
Bachelors of Industrial Engineering in the Faculty of Engineering, Built Environment and
Information Technology. University of Pretoria.

42
22. Starks, D.W., Schwieters, R.S. & Creces, D. (2006) A Decision Support Tool for Dofasco’s Primary
Steelmaking Operations. WSC ‘06 Proceedings of the 38th Conference on Winter Simulation.
Monterey CA, 3 March 2006. Monterey: Winter Simulation Conference. p. 1985-1988.
23. Vohra, S., Dutta, G. & Ghosh, D.K. (2006) Capacity management of Intensive Care Units in a
multi-specialty hospital in India. IIMA Working Papers. [Online] Number WP2006-07-04.
Available from: http://ideas.rep ec.org/p/iim/iimawp/wp01967.html#biblio
24. Wanliss, K. (2009) Managing Capacity in a Service Environment, A Dissertation Submitted in
partial fulfillment of the Requirements for the Degree of Bachelors of Industrial Engineering in
the Faculty of Engineering, Built Environment and Information Technology. University of
Pretoria.
25. Winston, W.L. (2004) Introduction to Probability Models. 4th Edition. Brooks/Cole: Belmont, CA.
26. Zhang, G., Cai, X. & Wong, C.K. (2002) Some Results on Resource Constrained Scheduling. IIE
Transactions. [Online] 36(1). Available from:
http://www.tandfonline.com/doi/abs/10.1080/07408170490257862?journalCode=uiie20#.U3p
vrPmSyPs
27. Zhao, X., Hou, J. & Gilbert, K. (2014) Measuring the Variance of Customer Waiting Time in
Service Operations. Management Decisions. [Online] 52(2). p. 296- 312. Available from:
http://www.emeraldinsight.com/journals.htm?issn=0025-1747
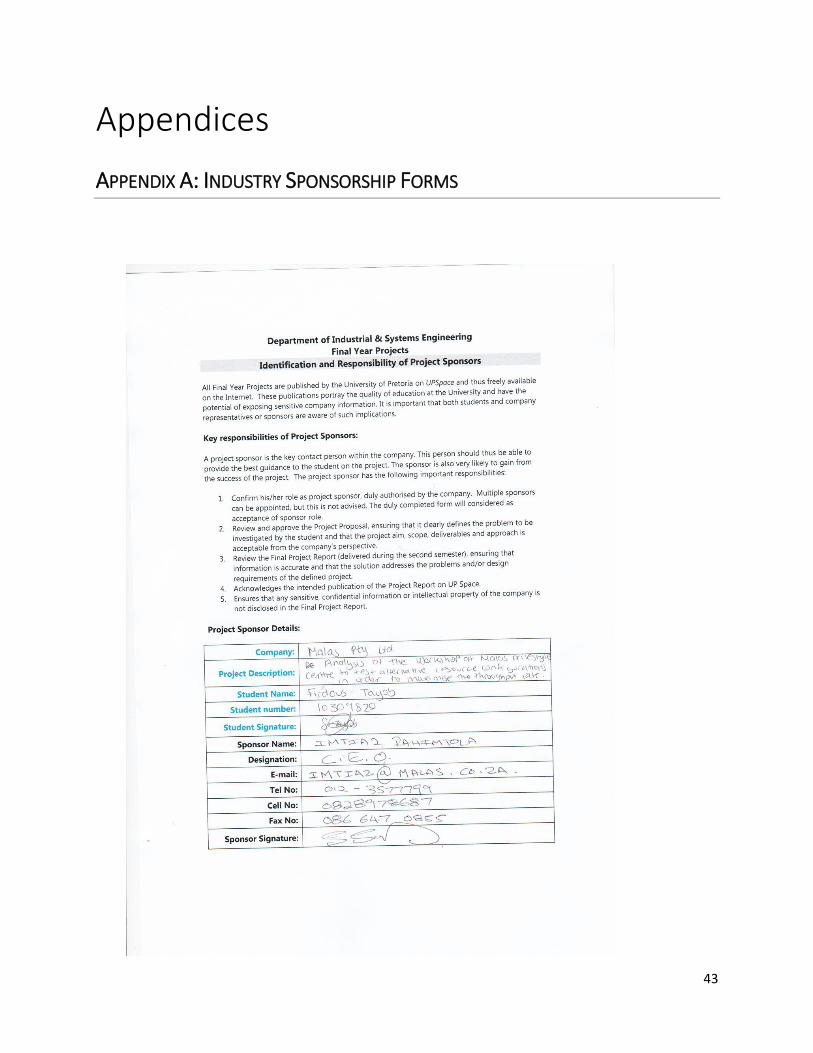
43
Appendices
APPENDIX A: INDUSTRY SPONSORSHIP FORMS

44
APPENDIX B: ANALYSIS OF DATA
Figure 19: Screenshot of Data

45
Figure 20: Takeaway Arrival Times Input Analyzer
Figure 21: Alignment Process Input Analyzer

46
Figure 22: Service Probabilities Computation

47
APPENDIX C: MODEL CONSTRUCTION
Figure 23: Model Facility View
Figure 24: Alignment, Dispatch & Job Assign Add-On Processes

48
Figure 25: Tyre Fitment & Balancing Add-On Process
Figure 26: Undercarriage Add-On Process

49
APPENDIX D: OPTQUEST RESULTS
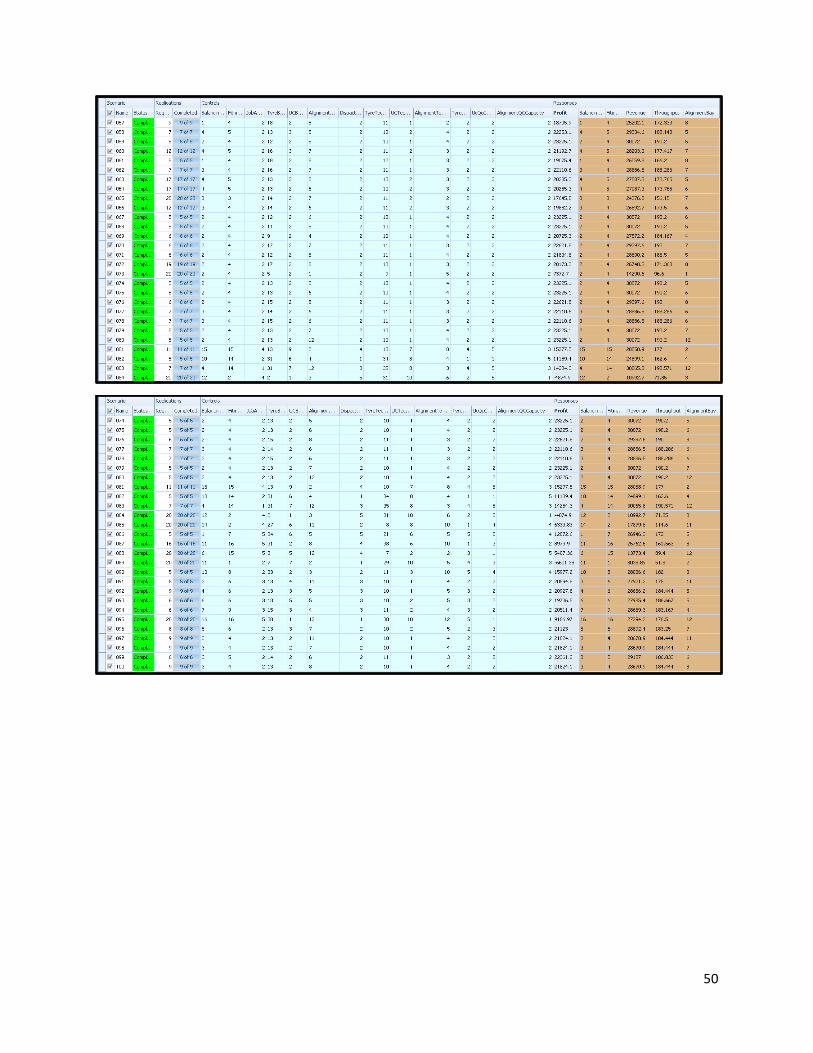
50