RCED-89-128 Pesticides: Export of Unregistered Pesticides ...
Resource Futures
Pesticides user habits survey 2010: public purchasing, use, storage and disposal of pesticides

Resource Futures
Pesticides user habits survey 2010: public purchasing, use, storage and disposal of pesticides
Prepared for the Chemicals Regulation Directorate
Project no: PS2804
RF project No: 1291
September 2010
Resource Futures
Royal House, 28 Sovereign Street, Leeds, LS1 4BJ
0113 243 8777
0113 200 3977
www.resourcefutures.co.uk

Document details/quality control sheet RF project 1291
Report prepared for:
Karen Trott Policy Development Team, Chemicals Regulation Directorate, Health and Safety Executive, Room 214 Mallard House, Kings Pool, 3 Peasholme Green, York YO1 7PX Tel.: 01904 455750 Fax: 01904 455763 Email: [email protected]
Report prepared by:
Kerrie Warburton Resource Futures Royal House, 28 Sovereign Street, Leeds, LS1 4BJ Tel: 0113 200 3960 E-mail: [email protected]
Report checked by:
Emma Kerrigan Senior Consultant Signed:
File name: RF1291_Pesticides user habits survey 2010_AMENDS Version: Final Status: Confidential Date: 1 September 2010

Contents
Executive Summary ................................................................................................................................................... 1
1. Introduction ................................................................................................................................................... 2
2. Background ................................................................................................................................................... 2
3. Methods ........................................................................................................................................................ 2 3.1 Survey locations ............................................................................................................................................ 2 3.2 Survey implementation ................................................................................................................................. 3
4. Summary of 2007 survey results .................................................................................................................. 3
5. 2010 survey results ....................................................................................................................................... 5 5.1 Respondent characteristics ........................................................................................................................... 5 5.1.1 Gardener type ............................................................................................................................................... 5 5.1.2 Home and allotment gardening ..................................................................................................................... 7 5.1.3 Age bracket ................................................................................................................................................... 7 5.2 Purchasing habits ......................................................................................................................................... 8 5.2.1 Types of product ........................................................................................................................................... 8 5.2.2 Quantities of products purchased ................................................................................................................. 9 5.2.3 Purchase locations ...................................................................................................................................... 10 5.3 Use of products ........................................................................................................................................... 11 5.3.1 Product instructions .................................................................................................................................... 11 5.3.2 Other sources of information ....................................................................................................................... 14 5.3.3 Ready-to-use and concentrated products ................................................................................................... 16 5.4 Storage ........................................................................................................................................................ 20 5.5 Disposal ...................................................................................................................................................... 22
6. Cross-tabulation .......................................................................................................................................... 25 6.1 Location ....................................................................................................................................................... 25 6.2 Age bracket ................................................................................................................................................. 32 6.3 Attitudes to gardening ................................................................................................................................. 36 6.4 Product disposal ......................................................................................................................................... 43
7. Summary and discussion ............................................................................................................................ 45 7.1 Respondent profile ...................................................................................................................................... 45 7.2 Purchasing habits ....................................................................................................................................... 45 7.3 Product usage ............................................................................................................................................. 46 7.4 Storage ........................................................................................................................................................ 46 7.5 Disposal ...................................................................................................................................................... 46 7.6 Comparison of significant findings .............................................................................................................. 47
Appendix 1: Questionnaire ...................................................................................................................................... 51
Appendix 2: Briefing sheet for User Habits Questionnaire ...................................................................................... 57

Pesticides user habits survey (PS2804 and RF1291) September 2010
1
Executive Summary
A pesticides user habits survey was carried out in six different locations across the UK in May 2010. The survey, a repeat of the same work carried out in 2007, was designed to determine gardener user habits in relation to purchase, usage, storage and disposal of pesticides. Responses were received from gardeners in all age categories and all gardener „types‟ as defined by this report, although the majority of the survey respondents were keen and regular gardeners, and 80% were aged 45 and above.
The most popular products purchased by respondents UK-wide were weedkillers, slug pellets and lawn treatments. There were some differences in purchasing habits across different locations, for example with weedkillers being more popular in Glasgow, and slug pellets being less popular here. In general, respondents purchased an average of one to two products per year, although again there were some differences across the survey locations. „Less keen‟ gardeners tend to purchase more products on average per year than the „keen and regular‟ gardeners, and 80% usually purchase their products in a garden centre.
In terms of product usage, 64% of respondents stated that they would usually read the instructions on the product before purchasing it, and 92% of respondents said that they follow the product instructions. Websites have increased in popularity as a source of further information since 2007; in particular Google and the RHS website appear to be useful sources of information. More than half of all respondents stated that they only use ready-to-use products, and would not purchase products that require dilution before usage. Of those that do use concentrated products, 91% use some form of measuring device to dilute the product, and 20% would store products after they have been mixed up. Older age groups were found to be slightly more likely to store products than younger ones. After use, 68% rinse out empty containers, and 52% of respondents said that they would pour the rinsings down the drain.
The most popular storage location according to the 2010 survey is the garden shed, followed by the garage. Only 4% of all respondents specified some form of safety precaution for storing pesticides – such as a locked cupboard or high shelf. Just over a third of respondents store pesticides for under a year and a further 44% store pesticides for 1 to 2 years.
Finally, the survey addressed disposal of pesticides. 44% of respondents dispose of empty pesticide containers in their recycling container; this has increased since 2007 when the residual bin was the most popular disposal location. Disposal methods varied between locations, with recycling collections being favoured in some but the residual waste bin in others. In terms of unused pesticides themselves, just 11% of respondents said that they dispose of these. Of these, 38% took the pesticides to their local household waste recycling centre for disposal, but 20% pour them down the drain and 24% put them in their residual waste bin. Disposal routes also varied somewhat by location, with HWRCs being widely used in Ipswich but hardly used at all in Glasgow.
This report sets out the findings from the 2010 survey in detail, and also compares these to the 2007 survey findings. Although many responses to the questions were similar for both years, there are a number of differences and these have been set out in the main body of the report. In particular, the types of products purchased, sources of further information on products, and disposal routes have changed to some extent since 2007.
The original survey, with all questions and the choice of answers offered to respondents can be found appended to this report.

Pesticides user habits survey (PS2804 and RF1291) September 2010
2
1. Introduction
The Chemicals Regulation Directorate (CRD) approached Resource Futures to repeat a survey conducted in 2007 to identify the habits of amateur pesticide users. The purpose of this research is to provide robust information on user habits regarding purchasing, use, storage and disposal of pesticides. The project supports the ongoing work of the Amateur Use Action Plan Implementation Group (AUAPIG), which involves CRD and other stakeholders encouraging best practice in use, storage, and safe disposal of unused products and empty containers.
2. Background
Pesticides include weedkillers (herbicides), slug pellets (molluscicides), fungicide sprays, animal repellents, hormone rooting powders, insecticides, plant growth regulators and lawn sand treatments and they are widely used by amateur gardeners. Around 6-7 million people use products to protect plants in their gardens, which represents only a small amount of total UK pesticides use. Agricultural and horticultural uses account for 85% of the value of sales and 80% of the amount used, whilst garden, household, forestry and amenity uses account for the remainder
1.
Products licensed for domestic use are much lower risk than professional products. However, as they are used by untrained householders, there are potential health and safety and environmental concerns (pesticides continue to reach rivers and streams in the UK at levels over the prescribed standards).
The European Commission has published a Directive for the Sustainable Use of Pesticides, including a range of measures designed to reduce the risk pesticides can pose both to the public and environment, e.g. ensuring that the public only have access to products specifically authorized for non-professional use; requiring distributors to give advice promoting sustainable use (hazard, risk, safe storage, handling, application and disposal); special measures to avoid dangerous handling of pesticides. The CRD is the competent authority in the UK to implement these European Directives, further information can be found on their website.
3. Methods
The same questionnaire that was used in 2007 was used for this research (with no amendments). It is included in Appendix 1. A briefing note was updated and provided to the market research company, this is provided in Appendix 2. The survey work was conducted by a market research company, PH Research, with whom Resource Futures has worked successfully on other projects. They also undertook this task during the 2007 project.
3.1 Survey locations
Resource Futures liaised with the Horticultural Trades Association (HTA)2 to confirm the garden centres
where the survey work could be conducted. With the exception of Chepstow, all the garden centres used were also used in 2007 (Hurrans in Newport was used in 2007). The table below lists the six garden centres where market research was carried out.
1 http://www.pesticides.gov.uk/uploadedfiles/Web_Assets/PSD/Updated_National_Strategy.pdf
2 The HTA also provided a number of garden centre gift vouchers that were offered to survey participants that chose to enter the free
prize draw associated with completing the survey. Winners were chosen at random from the respondent database held by PH Research.
Pesticides user habits survey (PS2804 and RF1291) September 2010
3
Table 3.1: Survey locations
Name of garden centre Location Region
Dobbies Garden World Preston North West
Dobbies Garden World Milngavie, Glasgow Scotland
Chepstow Garden Centre Chepstow Wales
Notcutts Oxfordshire South East
Notcutts Tunbridge Wells, Kent South East
Notcutts Suffolk East
3.2 Survey implementation
The survey was carried out at all garden centres from Wednesday 12 May to Sunday 16 May3, with one
member of staff in place Wednesday to Friday and two members of staff in place at the weekend in order to take advantage of the periods with the highest footfall. The survey was carried out in six-hour shifts at all locations between 10am and 4pm, with modification of working hours on Sunday as required to fit in with store opening hours. This is the same as in 2007 when the survey was conducted between 16 and 20 May.
Questionnaires were only undertaken with garden centre shoppers who confirmed that they used pesticides in their gardens. Respondents were prompted with examples of relevant products if required (see Appendix 1 for the questionnaire). A total of 1,050 responses were obtained, 175 from each location.
Data was inputted by PH Research staff and subject to minimum 10% validation.
4. Summary of 2007 survey results
The bullet points below are the key survey findings as reported in 2007:
As might be expected, a majority of the respondents (53%) defined themselves as „keen and regular gardeners‟.
The sample had a bias to older age groups, with only 0.9% of respondents in the 16-24 age group, and more than 80% over 45.
The most frequently purchased products were slug pellets (67% of respondents), weed-killers (50%) and lawn treatments (45%).
The majority of respondents purchased either one (32%) or two (27%) products each year. Around one in ten people purchased an average of less than one product per year, while a total of 16.3% of respondents purchased 4 or more products each year.
There was considerable variation between locations regarding types and numbers of products bought. For example, the proportions of gardeners buying four or more products each year ranged from 8% in Tunbridge Wells to 23% in Preston. This may be related to some extent to different climatic conditions across survey locations.
There was also some variation regarding numbers of product purchased between different categories of gardener; numbers of respondents buying one product or fewer each year ranged from 39% for the „keen and regular gardener‟ group to 59% for the „gardening is a chore‟ group.
3 With the exception of Milngavie which conducted the interviews between Thursday 13 and Monday 17 May, due to exceptional
circumstances.
Pesticides user habits survey (PS2804 and RF1291) September 2010
4
Only small minorities of respondents stated that they rarely or never read product instructions (6%); regarded instructions as unclear (2.5%, with a further 4% unsure); or stated that they did not (2%) or only sometimes (6%) follow instructions.
Differences between categories of gardener regarding attitude to instructions were marginal. However, as might be expected, the „gardening is a chore‟ group included the highest proportions of people rarely/never reading instructions (10%); finding instructions unclear or answering unsure (12% combined); or not / only sometimes following instructions (14% combined).
In addition to product instructions, garden centre staff, magazines, TV programmes and websites were the most frequently cited sources, with the BBC (Gardeners‟ World) and RHS being the most popular among these.
Nearly half of respondents (47%) only used „ready-to-use‟ products, and are therefore not at risk of disposing of products that need diluting (and thus carry the greatest environmental risk) in an inappropriate fashion. Respondents from the 25-44 age group were considerably more likely to use ready-to-use products only, with nearly 60%, compared to 45% and 42% respectively for the 45-64 and 65 and over groups.
Among respondents using products that require diluting before use:
10% estimate or guess amount of product to be used, with a slightly lower likelihood of doing so with ascending age;
24% save products that they have already mixed, with more than twice as many of the 65 and over group (27%) as the 25-44 group (13%) storing products;
60% rinse empty containers, with those in the 65 and over group (66%) the most likely to do so;
„Keen and regular‟ gardeners were more likely than other categories to rinse pesticide containers before disposal (67%).
More than half of respondents rinsing containers put the rinsings down the drain, with small numbers also using the sink (7%) or the toilet (0.9%).
The shed was the most frequent location for storage of pesticides (59%), followed by the garage (31%). Only 4% of people stored pesticides in the home. Just over one in ten respondents specified safety precautions such as keeping pesticides on a high shelf or in a locked cupboard or other container.
Regarding storage duration, most respondents used products in one season (34%), or stored for between 1 to 2 years (50%). However, one in ten stored products for 2 to 3 years and around 6% for 3 years or more. This indicates that there is some hoarding of products in lieu of disposal, but that this is only carried out by a minority.
Nearly half of gardeners disposed of empty pesticide containers in the dustbin, while more than a third were recycling them. Nearly one in five were disposing of containers at their local household waste recycling centre (HWRC), while a small number (1%) burned containers.
More than one in eight respondents (14%) stated that they disposed of pesticides. This implies that the majority of respondents were using up products for their intended purpose. It also implies that the sample size of respondents disposing of pesticides is relatively small (145), so findings relating to this group of respondents should be treated with some caution, e.g. disposal routes.
The proportions of gardeners disposing of unused or unwanted pesticides ranged from 6% in Newport (10 respondents) to 23% in Oxford (39 respondents). No compelling explanation can be suggested for this variation.
The methods used for disposal of unused or unwanted pesticides varied, but the survey made it clear that products are being disposed of by some gardeners in an inappropriate fashion. The most frequently cited disposal route was to take products to the local HWRC (32% of those disposing of pesticides). A small proportion (3%) used a local authority collection service. However, the second most frequent disposal method stated was the bin (28%). One in five respondents disposing of pesticides – 29 respondents – did so by putting them down the drain, while small numbers also

Pesticides user habits survey (PS2804 and RF1291) September 2010
5
used the sink or the toilet. As a proportion of the total sample, 4% of respondents were disposing of pesticides via the bin and 3% were putting them down the drain.
Some variation between locations was observed with reference to disposal methods. However, findings should be treated with caution because of small sample sizes that differed between locations. It can be speculated, however, that areas with suitably publicised household hazardous waste collection services (either at HWRCs or from households) may attract more disposal via appropriate methods.
With specific reference to respondents disposing of pesticides:
A substantial majority (62%) of respondents fell into the 45-64 age group, which made up 50% of the overall sample. In the 45-64 age group, 17% of respondents said that they disposed of pesticides; this was more than double the proportion of 25-44 year olds.
A majority of respondents (53% or 77 respondents) disposing of pesticides classed themselves as keen and regular gardeners. The greatest proportion disposing of pesticides within any category was 19%, for the “enjoy gardening – don‟t have time” group. Only 1 respondent (2%) from the “gardening is a chore” group disposed of pesticides.
The most frequently cited disposal route was to take products to the local HWRC (32%). The second most frequent disposal method stated was the bin (28%). Significant numbers of respondents (20%) disposed of pesticides by putting them down the drain, while small numbers also used the sink or the toilet.
Many of those disposing of pesticides using inappropriate methods are disposing of products that need diluting before use. Thus, while 47% of the total survey sample used “ready-to-use” products only, this was true of only 17% of respondents who disposed of pesticides down the drain, and 29% of those who put them in the bin. In other words, users of concentrated products appear to be over-represented among those disposing of products in an inappropriate fashion.
There appeared to be no relationship between perceptions of and use of instructions and inappropriate disposal methods; of those disposing of pesticides to the drain, 93% claimed to follow product instructions and 97% claimed that they found instructions clear.
The latter finding may indicate that respondents have claimed that they read and follow instructions when this is not the case. It also indicates that it is unlikely that people disposing of pesticides in inappropriate ways are aware that they may be causing environmental damage. On this basis, it could be argued that messages regarding appropriate disposal of pesticide products need to be marked more prominently on products.
5. 2010 survey results
5.1 Respondent characteristics
5.1.1 Gardener type
Respondents were asked “Which one of these descriptions best describes how you feel about gardening?”, and asked to select the most appropriate options from those listed below in Table 5.2. These descriptions were developed for the 2007 survey in consultation with the HTA and are based on the categories used by the association in its Garden Industry Monitor reports.
However, the thinking and definitions underlying these categories has been used in developing the attitude statements in Table 5.2, which can be seen as corresponding roughly to the HTA categories shown in Table 5.1 as follows:
The „keen and regular gardener‟ statement corresponds to the HTA‟s „very keen‟ and „quite keen‟ gardener categories.
The „enjoy gardening but don't always have the time‟ statement corresponds approximately to the HTA‟s „marginal gardener‟ category.

Pesticides user habits survey (PS2804 and RF1291) September 2010
6
The „like to keep the garden tidy, but not a hobby‟ statement can be seen as straddling the HTA‟s „marginal gardener‟ and the “not keen” categories.
The „gardening is a chore‟ statement corresponds to the HTA‟s „not keen‟ category.
The HTA‟s „definitely hostile‟ and „unavailable‟ categories were considered unlikely to account for significant levels of pesticide use and, as in 2007, have not been addressed in this survey.
Table 5.1: HTA Garden Industry Monitor categories
Category of
Gardener
Description Proportion of the
Great British
population (%)
Very keen
gardeners
Those who positively enjoy gardening are interested and knowledgeable and spend time
pursuing what is really an established hobby.
18
Quite keen
gardeners
Those who claim to be quite interested and who make a positive claim about enjoyment.
Although they actively work in their own gardens, they do not express a desire to increase
the amount of gardening that they currently do.
16
Marginal
gardeners
Those who do some gardening, are not hostile to gardening and express a willingness to
do more.
30
Not keen
gardeners
Those who do some gardening, but do not wish to do more, coupled with negative
attitudinal responses indicating that the gardening undertaken is not because it interests
them. Largely those who see gardening as a chore.
21
Definitely
hostile
Those with a place to grow outdoor plants who do very little or no gardening and who have
totally negative attitudes to, or interest and enjoyment in gardening, with low knowledge
and absolutely no wish to do more.
14
Unavailable This group does not lack interest in gardening nor do they lack knowledge. However, they
do little or no gardening, possibly due to insurmountable obstacles such as health or
domestic responsibilities.
2
Source: Horticultural Trades Association
Table 5.2: Attitudes to gardening
Response Frequency %
I am a keen and regular gardener - gardening is an enjoyable hobby
528 50
I enjoy gardening but don‟t always have time for it 298 28
I like to keep the garden tidy, but wouldn‟t call it a hobby
180 17
Gardening is a chore 44 4 Number of respondents (N) = 1050
Half of all survey respondents identified themselves as „keen and regular gardeners‟ as can be seen in Table 5.2 above and Figure 5.1 below. The number of people who enjoy gardening has increased by approximately 7%. This is higher than in the 2007 survey which could indicate that behaviour has changed or it could simply be due to the survey being undertaken at garden centres and therefore this category is well represented in the survey. The 2010 survey was completed by more respondents who „enjoy gardening but don‟t always have time for it‟ (28%, up from 21.5% in 2007) but by fewer of those who „like to keep the garden tidy but wouldn‟t call it a hobby‟ (17%, down from 20% in 2007). The number of respondents who see gardening as „a chore‟ remains the similar at 4% in 2010 and 5% in 2007.

Pesticides user habits survey (PS2804 and RF1291) September 2010
7
Figure 5.1: Attitudes to gardening
5.1.2 Home and allotment gardening
Respondents were asked where they carry out their gardening. 99%, or 1041 out of the 1050 people questioned, replied that they garden at home. 37 (4%) had an allotment, and 2% carry out their gardening at a friend or relatives house or other location. Respondents could answer „yes‟ to more than one gardening location, therefore the percentages are higher than 100%.
Table 5.3: Home and allotment gardening
Response Frequency %
Garden at home 1041 99
Allotment 37 4
Other (including friend or relative home) 17 2
Not answered 1 0 Note: Multiple answers. N = 1050, total responses = 1096
5.1.3 Age bracket
The age profile of the respondents was recorded. As might be expected, the 16-24 age bracket is extremely underrepresented in the survey, with just 8 respondents (1%) falling into that age bracket. 80% of respondents were over the age of 45, and 34% were over the age of 65.
Table 5.4: Age bracket of respondents
Response Frequency %
16-24 8 1
25-44 205 20
45-64 480 46
65 and over 357 34 N = 1050
0
10
20
30
40
50
60
I am a keen and regular gardener - gardening is
an enjoyable hobby
I enjoy gardening but don’t always have time
for it
I like to keep the garden tidy, but
wouldn’t call it a hobby
Gardening is a chore
% o
f re
spo
nd
en
ts
2010
2007

Pesticides user habits survey (PS2804 and RF1291) September 2010
8
Figure 5.2: Age bracket
5.2 Purchasing habits
5.2.1 Types of product
The survey respondents were asked about the types of products that they use. As can be seen from Table 5.5, the most frequently purchased products were weedkillers, slug pellets and lawn treatments, with weedkillers replacing slug pellets as the most purchased product when compared to the 2007 results. Figure 5.3 compares the types of products purchased in 2007 and 2010; the trends are similar, but noticeable differences are a decrease in insecticide and slug pellet usage, and an increase in weedkiller usage which could be attributed to a wetter 2007 and a drier 2010. The “other” category includes fence treatments and wood preservatives that were cited by some respondents.
Table 5.5: Product types used
Response Frequency %
Weedkillers 662 63
Slug pellets 638 61
Lawn treatments 492 47
Fly sprays and ant powder* 358 34
Insecticides 190 18
Patio cleaners 188 18
Rooting powder/gel/hormone 150 14
Fungicide sprays 138 13
Rat and mouse killers 99 9
Animal repellents, e.g. cat / dog 73 7
Products for algae and snail control in ponds 34 3
Other 41 4
Note: Multiple answers. N = 1050, total responses = 3063 * We acknowledge that these products are biocides but as they were frequently used, and included in the 2007 survey, they have been included in this table also.
1%
20%
46%
34%
16-24
25-44
45-64
65 and over

Pesticides user habits survey (PS2804 and RF1291) September 2010
9
Figure 5.3: Product types used in 2007 and 2010
5.2.2 Quantities of products purchased
Respondents were asked on average how many pesticide products they purchase per year. Table 5.6 shows that the majority of people buy one or two products per year. The figures for 2010 match those for 2007 fairly closely; with the biggest difference being an increase of 4% in the number of people buying two products per year. 8% of the survey respondents buy less than one pesticide per year, and just 15% buy four or more.
Table 5.6: Number of products purchased per year
Response Frequency %
Less than one 85 8
One 314 30
Two 326 31
Three 162 15
Four 76 7
Five 24 2
Six or more 63 6
N = 1050
0
10
20
30
40
50
60
70
80
% o
f re
spo
nd
en
ts
2010
2007

Pesticides user habits survey (PS2804 and RF1291) September 2010
10
Figure 5.4: Average number of products purchased per year in 2010 and 2007
5.2.3 Purchase locations
Respondents were asked where they normally buy pesticides from, with the option of giving more than one response for this question. As would be expected given where the surveys were conducted, the majority of respondents stated that they usually buy their products from a garden centre. However, respondents were able to give more than one response to the question, and a large number stated other locations. Over a third said they would usually go to a DIY store and almost a quarter named supermarkets as their preferred place of purchase. Only small numbers of respondents said that they purchase their pesticides from gardening clubs, discount stores or wholesalers. In general, the figures are similar to 2007 figures, when 81% of people stated garden centres and 39% stated DIY stores, although it is worth stating that it appears that purchase from supermarkets has increased (from 17% in 2007 to 24% in 2010) possibly related to the fact that more supermarkets stock these types of seasonal products. In table 5.7 below, the „other‟ category includes discount stores, which eight respondents said that they bought products from and wholesalers (3 responses).
Table 5.7: Main purchase locations
Response Frequency %
Garden centre 839 80
DIY store 364 35
Supermarket 257 24
Gardening club or allotment society 8 1
Other 56 5
Note: Multiple answers. N = 1050, total responses = 1524.
0
5
10
15
20
25
30
35
Less than one
One Two Three Four Five Six or more
% o
f re
spo
nd
en
ts
Number of products purchased per year
2010
2007

Pesticides user habits survey (PS2804 and RF1291) September 2010
11
Figure 5.5: Main purchase locations
5.3 Use of products
5.3.1 Product instructions
Respondents asked about how they use the instructions on the products and whether they felt that they are clear. Specifically, they were asked:
When do you read the instructions for use on pesticides?
Do you generally find that instructions for use on pesticides are clear?
Do you follow the instructions for use on pesticides?
As some gardeners may, for example, read the instructions before purchase and again before use, respondents were allowed to give multiple answers to the first question. Overall, 64% of respondents claim to read the instructions before use, and 29% read them before they use the product for the first time. As can be seen in Figure 5.6, this is a slight drop compared to 2007, when 70% of respondents claimed to read the instructions on the product before purchase, although the number of people reading instructions before use has increased slightly from 27% in 2007 to 29% in 2010. The overall proportion of people rarely or never reading instructions has also fallen, from 6% in 2007 down to 4% in 2010.
Table 5.8: Reading of product instructions
Response Frequency %
Before buying 671 64
Before using for first time 305 29
Before using every time 138 13
Occasionally as a reminder 120 11
Rarely/ never 46 4
Note: multiple answers. N = 1050, total responses = 1951
0%
10%
20%
30%
40%
50%
60%
70%
80%
90%
Garden centre DIY store Supermarket Gardening club or allotment society
Other
% r
esp
on
de
nts
Purchase location
2010
2007

Pesticides user habits survey (PS2804 and RF1291) September 2010
12
Figure 5.6: Reading of product instructions
In terms of the clarity of instructions, 90% of respondents stated that they generally find instructions for use on pesticides are clear, with 5% finding them unclear and 5% being unsure. This is a drop from 94% finding the instructions clear in 2007, as shown in Figure 5.7 below.
Table 5.9: Perceptions of instruction clarity
Response Frequency %
Yes 946 90
No 50 5
Not sure 53 5
Not answered 1 0
N = 1050
0
10
20
30
40
50
60
70
80
Before buying Before using for first time
Before using every time
Occasionally as a reminder
Rarely/ never
% o
f re
spo
nd
en
ts
Response
2010
2007

Pesticides user habits survey (PS2804 and RF1291) September 2010
13
Figure 5.7: Perceptions of instruction clarity
92% of respondents also stated that they do follow the instructions on products, with small numbers saying that they only sometimes follow instructions (5%) or don‟t follow instructions (3%). This is very similar to the figures for 2007, when again 92% stated that they follow the instructions, 2% stated that they do not, and 6% only sometimes follow instructions.
Table 5.10: Following product instructions
Response Frequency %
Yes 961 92
No 34 3
Sometimes 55 5
N = 1050
0
10
20
30
40
50
60
70
80
90
100
Yes No Not sure
% r
esp
on
de
nts
Response
2010
2007

Pesticides user habits survey (PS2804 and RF1291) September 2010
14
Figure 5.8: Following product instructions
5.3.2 Other sources of information
Respondents were asked which other sources they look to when trying to find information on safe pesticide usage. Table 5.11 shows the responses for the 2010 survey; websites are the most popular means of finding further information on pesticides. Google was cited most frequently amongst respondents, followed by the RHS website, other gardening websites, and garden centre websites. Of the magazines, the second most popular category, Gardeners‟ World was the most popular choice. These responses are provided in more detail below in Table 5.12. There is quite a variation between these results and 2007 results, as shown in Figure 5.9 below. Websites have doubled in popularity, from approximately 7% to 14%, whilst all other sources have decreased in popularity to various extents. This is not surprising given the widespread use of home computers and internet use. „Other‟ sources of information specified were newspapers (1%) and gardening clubs (less than 1%).
Table 5.11: Other sources of information
Response Frequency %
Websites 151 14
Magazines 81 8
TV 52 5
Garden centre staff 49 5
Other gardeners 40 4
Books 38 4
Radio 16 2
Leaflets 13 1
Product company helpline 3 0
Gardening advice helpline 2 0
Other 24 2
None 620 59
Note: Multiple answers. N = 1050, total responses = 1089
Yes No Sometimes
0
10
20
30
40
50
60
70
80
90
100
Response
% r
esp
on
de
nts
2010
2007

Pesticides user habits survey (PS2804 and RF1291) September 2010
15
Figure 5.9: Other sources of information in 2010 and 2007
Table 5.12: Specific source of information
Category Total in category
Specific responses Number of responses
Websites 151 Google RHS Gardening sites Suttons Notcutts Varied sites
56 7 19 2 2 17
Magazines 81 Gardeners World Gardening RHS The Garden BBC Gardens Which
21 12 8 4 7
TV 52 Gardeners World Gardening programme
12 14
Radio 16 Gardeners Question Time Gardeners World
8 4
Other gardeners
40 Friends / family Neighbours
14 2
Garden centre staff
49 Notcutts Chepstow
2 14
Other 24 Newspaper Gardening club
8 3
N = 413
0
2
4
6
8
10
12
14
16
% o
f re
spo
nd
en
ts
Source of information
2010
2007

Pesticides user habits survey (PS2804 and RF1291) September 2010
16
5.3.3 Ready-to-use and concentrated products
Respondents were asked whether they tended to use ready-to-use products or products that require dilution, or both. 53% stated that they only use ready-to-use products, 16% only use products that require dilution, and 31% use both. There is an increase in the proportion of respondents using ready-to-use products and a fall in dilution products since 2007, when 47% used the former and 20% the latter. There was also a link between age groups, with younger respondents more likely to use ready-to-use products and older gardeners more likely to buy products for dilution (which mirrors findings from 2007).
Table 5.13: Ready-to-use and concentrated products
Response Frequency %
Ready-to-use only 553 53
Need diluting only 171 16
Both 325 31
Not answered 1 0
N = 1050
Figure 5.10: Ready-to-use and concentrated products
The 496 people who replied that they use products that require diluting were then asked a series of questions about their use of these products. Firstly, they were asked whether they use measuring devices or if they estimate / guess the amount of product to use when diluting. 91% of respondents stated that they use a measuring device or cap provided with the product; the same as was found in 2007. However, it is good to see that the percentage of respondents guessing the amount of product to use has fallen by 2% since 2007.
Table 5.14: Measurement methods
Response Frequency %
Measuring device / cap provided with product
452 91
Estimate of guess 42 8
Other 7 1
Note: Multiple answers. N = 496, total responses = 511
Ready-to-use only Need diluting only Both
0
10
20
30
40
50
60
Response
% r
esp
on
de
nts
2010
2007

Pesticides user habits survey (PS2804 and RF1291) September 2010
17
Figure 5.11: Measurement methods
These respondents were then asked if they ever save any product that they have mixed up. Figure 5.12 shows the results, with 20% of respondents saving mixed products. This is a decrease of 4% since 2007. Table 5.15: Storage of products after dilution
Response Frequency %
Yes 100 20
No 396 80
N = 496
0
10
20
30
40
50
60
70
80
90
100
Measuring device / cap provided with product
Estimate or guess Other
% r
esp
on
de
nts
Measurement method
2010
2007

Pesticides user habits survey (PS2804 and RF1291) September 2010
18
Figure 5.12: Storage of products after dilution
Finally, these respondents were asked whether they rinse out pesticide containers before disposal, and if so, what they do with the rinsings. Figure 5.13 shows that 68% of respondents rinse their empty containers before disposing of them; this is quite a significant increase of 8% from 2007 when 60% of respondents said that they rinse empty containers.
Table 5.16: Rinsing of empty containers
Response Frequency %
Yes 332 68
No 157 32
Not answered 7 1
N = 496
0
10
20
30
40
50
60
70
80
90
Yes No
% r
esp
on
de
nts
Response
2010
2007

Pesticides user habits survey (PS2804 and RF1291) September 2010
19
Figure 5.13: Rinsing of empty containers
Table 5.17 and Figure 5.14 show that the majority (52%) of respondents dispose of their container rinsings down the drain. 24% of respondents pour the rinsings onto waste ground, and just 5% add the rinsings to their dilute product. These figures are similar to the 2007 findings, as can be seen in Figure 5.14. It is worth noting that fewer respondents use the rinsings for their intended use than in 2007.
Table 5.17: Disposal of rinsings
Response Frequency %
Drain 174 52
Put onto waste ground 80 24
Sink 32 10
Add to dilute product 16 5
Put on plants/garden 8 2
Toilet 4 1
Other 17 5
Not answered 1 0 N = 332
0
10
20
30
40
50
60
70
80
Yes No Not answered
% r
esp
on
de
nts
Response
2010
2007

Pesticides user habits survey (PS2804 and RF1291) September 2010
20
Figure 5.14: Disposal of rinsings in 2010 and 2007
5.4 Storage
All survey respondents were asked where they store their pesticides, with multiple responses being allowed. 60% of respondents store their pesticides in the shed (very similar to 59% in 2007), with a further 33% storing the products in their garage (again, similar to 31% in 2007). Just 4% of respondents stated a safety precaution such as a locked cupboard or high shelf. This is a drop from 2007 when approximately 11% specified a safety precaution. A comparison of answers between the two surveys can be seen in Figure 5.15 below. Table 5.18: Storage locations
Response Frequency %
Shed 627 60
Garage 349 33
Greenhouse 57 5
In the house 50 5
Locked cupboard/ container 20 2
High shelf 20 2
Other 17 2
Not answered 9 1
Note: Multiple answers. N = 1050, total responses = 1149
0
10
20
30
40
50
60
% o
f re
spo
nd
en
ts
2010
2007

Pesticides user habits survey (PS2804 and RF1291) September 2010
21
Figure 5.15: Storage locations in 2010 and 2007
Respondents were then asked how long they store pesticides for before disposing of them. As shown in Table 5.19 and Figure 5.16, the most common length of time to store pesticides for was 1 to 2 years, with 44% of respondents citing this answer, and a further 10% store pesticides for 2 to 3 years. Over a third of respondents store pesticides for under a year. These results are very similar to 2007, when 34% stated that they store pesticides for less than 1 year, 50% store them for 1 to 2 years, and 10% for 2 to 3 years. The 2010 survey found slightly higher proportions storing pesticides for over 3 years, with 9% reporting this compared to 6% in 2007. Table 5.19: Length of storage
Response Frequency %
Less than 1 year 368 35
1 to 2 years 458 44
2 to 3 years 108 10
3 to 5 years 52 5
More than 5 years 45 4
Not answered 19 2 N = 1050
0
10
20
30
40
50
60
70
Shed Garage Greenhouse High shelf Locked cupboard/ container
In the house Other
% o
f re
spo
nd
en
ts
Storage location
2010
2007

Pesticides user habits survey (PS2804 and RF1291) September 2010
22
Figure 5.16: Length of storage in 2010 and 2007
5.5 Disposal
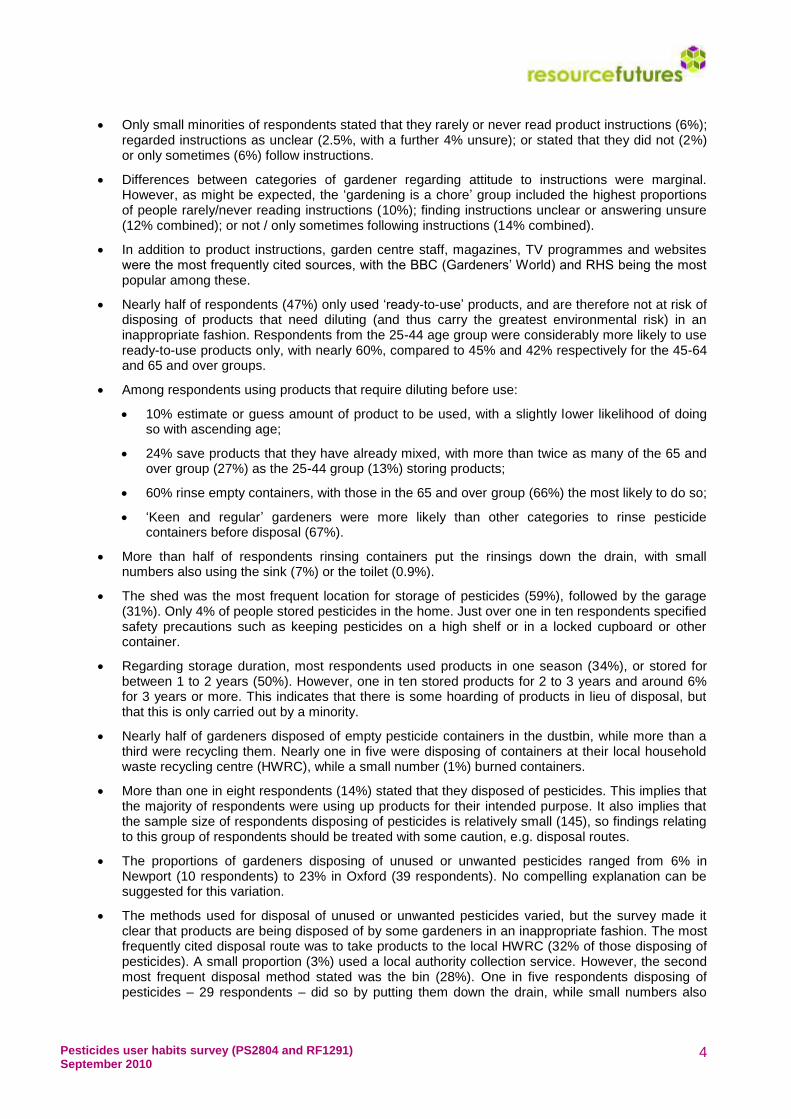
Finally, respondents were asked about how they dispose of their pesticide products, both in terms of the empty containers and where relevant, the pesticides themselves. Table 5.20 shows that the largest proportion of respondents dispose of their empty containers with their recycling, with the household residual waste bin the second most popular disposal route. Most of the remaining respondents take their containers to their local household waste recycling centre. Figure 5.17 compares these figures with the 2007 responses. It is interesting to see that using the recycling container has become the most popular disposal route and has overtaken the residual waste bin, which was the most popular route in 2007. Also, no respondents specifically cited „burning‟ as their method of disposal, which 14 respondents did in 2007, although this could come under the „other‟ category. Table 5.20: Disposal of pesticide containers
Response Frequency %
Bin 404 38
Recycling box/bin/bag 464 44
Household waste and recycling centre/ tip/ civic amenity site
220 21
Other 19 2
Not answered 2 0
Note: Multiple answers. N = 1050, total responses = 1109
0
10
20
30
40
50
60
Less than 1 year 1 to 2 years 2 to 3 years 3 to 5 years More than 5 years
% r
esp
on
de
nts
Length of storage
2010
2007
Pesticides user habits survey (PS2804 and RF1291) September 2010
23
Figure 5.17: Disposal of pesticide containers in 2010 and 2007
When asked, 11% of respondents said that they do dispose of unused or unwanted pesticides; this was 117 individuals in total, who then provided 125 responses on disposal routes. It is positive to see that there has been a reduction of 3% in the number of respondents disposing of unused or unwanted pesticides since 2007. Of these, 38% dispose of their pesticides responsibly by taking the products to their household waste recycling centre, and a further 8% use a local authority collection service. However, it should be noted that not all HWRCs may have appropriate facilities for disposing of pesticides and so these products could still end up in the residual waste stream. Also, there are not many local authorities that provide a household hazardous waste collection service therefore this option would not be available to all. There are still large numbers who do not dispose of their pesticides appropriately, with 24% putting the products in their bin, and 20% pouring them down the drain. It is positive to see that the number of people using HWRCs has increased from 32% in 2007 to 38% in 2010.
Table 5.21: Disposal of unused or unwanted pesticides
Response Frequency %
Yes 117 11
No 929 88
Not answered 4 0
N = 1050
0
10
20
30
40
50
60
Bin Recycling box/bin/bag Household waste and recycling centre/ tip/
civic amenity site
Other
% o
f re
spo
nd
en
ts
Disposal option
2010
2007

Pesticides user habits survey (PS2804 and RF1291) September 2010
24
Figure 5.18: Disposal of unused or unwanted pesticides
Table 5.22: Disposal methods for unused or unwanted pesticides
Response Frequency %
Household waste and recycling centre/ tip/ civic amenity site 45 38
Bin 28 24
Drain 23 20
Local authority collection service 9 8
Spray onto waste ground 6 5
Sink 4 3
Toilet 3 3
Other 5 4
Not answered 2 2 N = 125
0
10
20
30
40
50
60
70
80
90
100
Yes No
% r
esp
on
de
nts
Response
2010
2007

Pesticides user habits survey (PS2804 and RF1291) September 2010
25
Figure 5.19: Disposal methods for unused or unwanted pesticides in 2010 and 2007
6. Cross-tabulation
This section summarises the results from cross-tabulation of key variables: location, age bracket and attitude towards gardening. There is also further analysis into the characteristics of respondents disposing of pesticides.
6.1 Location
Firstly, the type of products purchased has been compared across locations. Figure 6.1 below shows these results. There are a number of variations between different locations, including:
Increase in use of weedkillers across all locations since 2007
Greater use of weedkillers and lawn treatments in Glasgow than in any other location.
Use of rat and mouse killers is highest in Oxford and Chepstow.
Use of slug pellets is lowest in Glasgow, and highest in Chepstow, closely followed by Tunbridge Wells.
Fungicide spray usage ranged from 7% in Glasgow to 19% in Ipswich.
Use of patio cleaners was higher in Preston, Chepstow and Tunbridge Wells than in the other three locations, with the overall range extending from 14% to 22%
Use of rooting powder / gel / hormone was highest in Chepstow (18%) and lowest in Glasgow and Tunbridge Wells (10%).
0
5
10
15
20
25
30
35
40
Household waste and recycling
centre
Bin Drain Local authority collection
service
Spray onto waste
ground
Sink Toilet Other
% o
f re
spo
nd
en
ts
Disposal method
2010
2007

Pesticides user habits survey (PS2804 and RF1291) September 2010
26
Table 6.1: Product types used by location
Glasgow Ipswich Oxford Preston Tunbridge
Wells Chepstow
Weedkillers 74% 58% 61% 63% 55% 68%
Slug pellets 43% 50% 57% 62% 74% 79%
Lawn treatments 61% 49% 36% 50% 45% 41%
Fly sprays and ant powder 19% 39% 38% 42% 30% 36%
Insecticides 11% 15% 27% 22% 19% 14%
Patio cleaners 14% 15% 17% 22% 20% 21%
Rooting powder/gel/hormone 10% 17% 14% 15% 10% 18%
Fungicide sprays 7% 19% 17% 11% 13% 11%
Rat and mouse killers 1% 10% 14% 9% 8% 14%
Animal repellents, e.g. cat/ dog 5% 6% 7% 7% 9% 9%
Products for algae and snail control in ponds 3% 5% 2% 3% 3% 3%
Other 1% 0% 1% 19% 1% 1% Note: Multiple answers. N = 1050, total responses = 3063
It is worth noting that the other category in Table 6.1 includes wood preservatives and fence treatments, which only respondents in Preston cited as purchasing during this survey. As Appendix 1 shows, this was not a product type listed in the survey therefore it is unclear why so many Preston residents mentioned purchase of these products.

Pesticides user habits survey (PS2804 and RF1291) September 2010
27
Figure 6.1: Product types used by location
The number of products purchased also varies by location. Table 6.2 and Figure 6.2 show these differences, whilst Figure 6.3 shows the number of people purchasing 4 or more products.
Table 6.2: Number of products purchased by location
Response Total Glasgow Ipswich Oxford Preston Tunbridge
Wells Chepstow
Less than one 8% 2% 8% 9% 5% 14% 10%
One 30% 34% 39% 27% 26% 28% 25%
Two 31% 33% 34% 31% 30% 31% 27%
Three 15% 16% 10% 18% 18% 13% 18%
Four 7% 8% 4% 7% 10% 6% 9%
Five 2% 1% 3% 1% 3% 2% 3%
Six or more 6% 6% 2% 7% 7% 6% 8% N = 1050
0%
10%
20%
30%
40%
50%
60%
70%
80%
90%
100%
Glasgow Ipswich Oxford Preston Tunbridge Wells Chepstow
% o
f re
spo
nd
en
ts
Area
Weedkillers Slug pelletsLawn treatments Fly sprays and ant powderInsecticides Patio cleanersRooting powder/gel/hormone Fungicide spraysRat and mouse killers Animal repellents, eg cat/ dogProducts for algae and snail control in ponds Other

Pesticides user habits survey (PS2804 and RF1291) September 2010
28
Figure 6.2: Number of products purchased per year
Ipswich and Tunbridge Wells both have the smaller proportion of gardeners buying 4 or more products per year, and accordingly have the highest proportion of gardeners buying 1 or less per year. Preston and Chepstow have the highest proportion of people buying 4 or more products per year, and Preston has the lowest proportion of gardeners buying 1 product or less per year.
Figure 6.3: Respondents buying 4 or more products per year
0%
5%
10%
15%
20%
25%
30%
35%
40%
45%
Total Glasgow Ipswich Oxford Preston Tunbridge Wells
Chepstow
% o
f re
spo
nd
en
ts
Location
Less than one
One
Two
Three
Four
Five
Six or more
0%
5%
10%
15%
20%
25%
Glasgow Ipswich Oxford Preston Tunbridge Wells
Chepstow (2010) / Newport
(2007)
% o
f re
spo
nd
en
ts
Location
2010
2007

Pesticides user habits survey (PS2804 and RF1291) September 2010
29
In terms of the disposal of pesticides, Table 6.3 and Figure 6.4 show that the proportions of gardeners in each region disposing of unused or unwanted pesticides range from 7% in Chepstow to 18% in Preston. In Glasgow, Ipswich, Oxford and Tunbridge Wells the number of respondents disposing of pesticides has decreased.
Table 6.3: Disposal of unused or unwanted pesticides by location
Response Total Glasgow Ipswich Oxford Preston Tunbridge
Wells Chepstow
Yes 117 22 15 20 31 17 12
11% 13% 9% 11% 18% 10% 7%
No 929 153 159 155 144 158 160
88% 87% 91% 89% 82% 90% 91%
Not answered 4 0 1 0 0 0 3
0% 0% 1% 0% 0% 0% 2%
N = 1050
Figure 6.4: Disposal of unused or unwanted pesticides by location
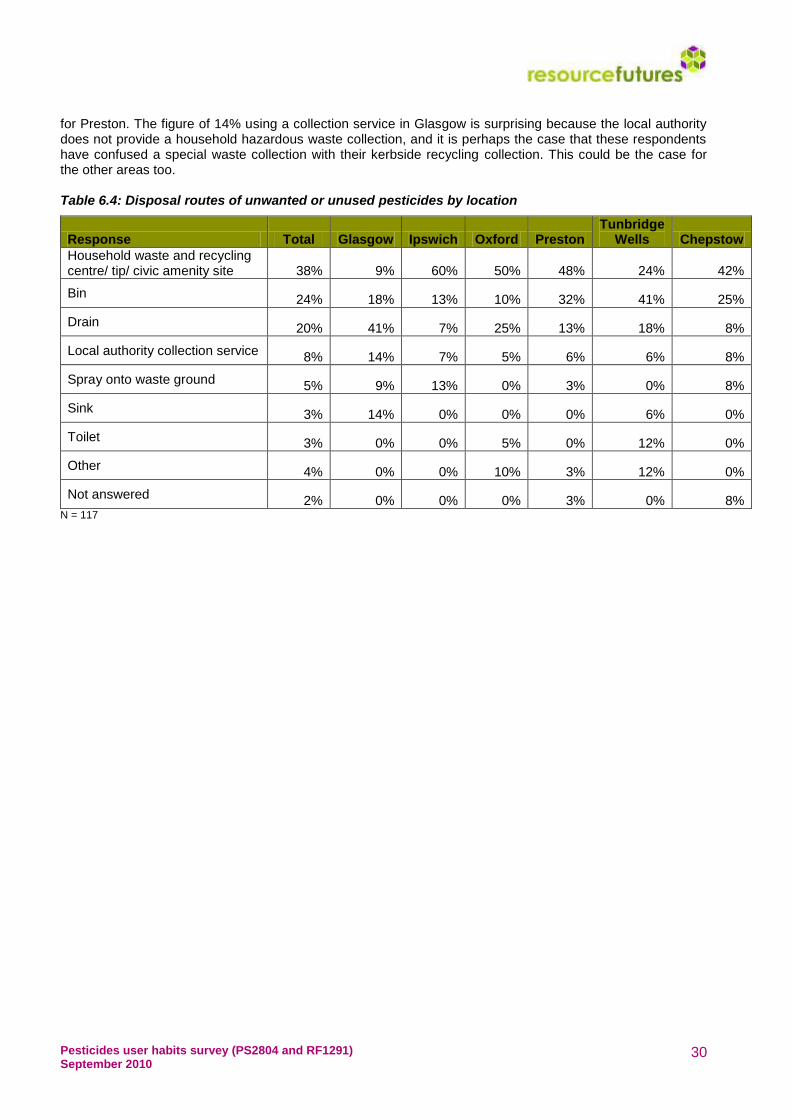
Table 6.4 and Figure 6.5 summarise proportions of respondents in each location using different disposal methods for their pesticides. Only 9% of respondents in Glasgow use an HWRC, compared with 60% in Ipswich and 50% in Oxford. The number of respondents using HWRCs has also increased in Preston from 29% to 48%, and in Chepstow (Newport in 2007) from 20% to 42%. In Glasgow, inappropriate disposal has increased dramatically, with 41% of respondents pouring pesticides down the drain; a figure that has more than doubled since 2007. Inappropriate disposal down the drain has also increased in Oxford from 15% to 25%. In Tunbridge Wells, a relatively high proportion, 41% dispose of their pesticides in the bin. It is worth noting however, that the numbers of respondents answering this question were relatively small, so figures should be treated with some caution. In terms of the local authority collection service, according to the local authority websites for the areas in which each garden centre is based, only Ipswich Borough Council offers a hazardous waste collection service which includes pesticides. Monmouthshire County Borough Council and Oxfordshire County Council both specify on their website that pesticides should be taken to HWRCs, as does Ipswich, which goes some way to explaining the higher figures for use of HWRCs in these areas, although not
0%
2%
4%
6%
8%
10%
12%
14%
16%
18%
20%
Glasgow Ipswich Oxford Preston Tunbridge Wells
Chepstow / Newport
% r
esp
on
de
nts
Location
2010
2007
Pesticides user habits survey (PS2804 and RF1291) September 2010
30
for Preston. The figure of 14% using a collection service in Glasgow is surprising because the local authority does not provide a household hazardous waste collection, and it is perhaps the case that these respondents have confused a special waste collection with their kerbside recycling collection. This could be the case for the other areas too. Table 6.4: Disposal routes of unwanted or unused pesticides by location
Response Total Glasgow Ipswich Oxford Preston Tunbridge
Wells Chepstow
Household waste and recycling centre/ tip/ civic amenity site 38% 9% 60% 50% 48% 24% 42%
Bin 24% 18% 13% 10% 32% 41% 25%
Drain 20% 41% 7% 25% 13% 18% 8%
Local authority collection service 8% 14% 7% 5% 6% 6% 8%
Spray onto waste ground 5% 9% 13% 0% 3% 0% 8%
Sink 3% 14% 0% 0% 0% 6% 0%
Toilet 3% 0% 0% 5% 0% 12% 0%
Other 4% 0% 0% 10% 3% 12% 0%
Not answered 2% 0% 0% 0% 3% 0% 8%
N = 117
Pesticides user habits survey (PS2804 and RF1291) September 2010
31
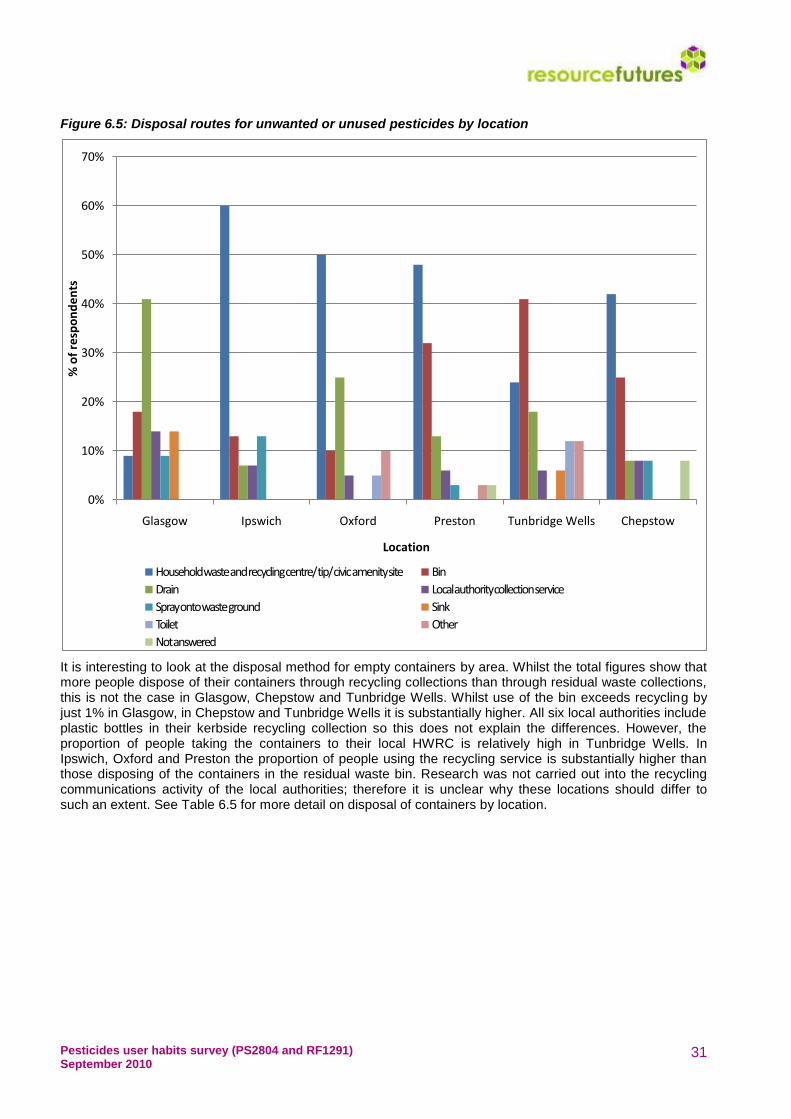
Figure 6.5: Disposal routes for unwanted or unused pesticides by location
It is interesting to look at the disposal method for empty containers by area. Whilst the total figures show that more people dispose of their containers through recycling collections than through residual waste collections, this is not the case in Glasgow, Chepstow and Tunbridge Wells. Whilst use of the bin exceeds recycling by just 1% in Glasgow, in Chepstow and Tunbridge Wells it is substantially higher. All six local authorities include plastic bottles in their kerbside recycling collection so this does not explain the differences. However, the proportion of people taking the containers to their local HWRC is relatively high in Tunbridge Wells. In Ipswich, Oxford and Preston the proportion of people using the recycling service is substantially higher than those disposing of the containers in the residual waste bin. Research was not carried out into the recycling communications activity of the local authorities; therefore it is unclear why these locations should differ to such an extent. See Table 6.5 for more detail on disposal of containers by location.
0%
10%
20%
30%
40%
50%
60%
70%
Glasgow Ipswich Oxford Preston Tunbridge Wells Chepstow
% o
f re
spo
nd
en
ts
Location
Household waste and recycling centre/ tip/ civic amenity site Bin
Drain Local authority collection service
Spray onto waste ground Sink
Toilet Other
Not answered

Pesticides user habits survey (PS2804 and RF1291) September 2010
32
Table 6.5: Disposal of containers by location
Response Total Glasgow Ipswich Oxford Preston Tunbridge
Wells Chepstow
Bin 38% 41% 25% 31% 37% 45% 52%
Recycling box/bin/bag 44% 40% 43% 54% 50% 34% 43%
Household waste and recycling centre/ tip/ civic amenity site 21% 21% 30% 19% 18% 28% 10%
Other 2% 1% 4% 1% 0% 5% 1%
Not answered *% 0% 1% 0% 0% 1% 0% N = 1050
6.2 Age bracket
The 16-24 age bracket was underrepresented in this survey, with just 1% of respondents falling into this category. The largest proportion (46%) was in the 45-64 age bracket, with 34% falling into 65 and over. The remaining 20% account for the 25-44 age group. Because only 8 of the 1050 respondents fell into the 16-24 age bracket, results for this group should be treated with some caution. They have, however, still been included in the analyses below. The 45 and over age brackets were the most likely to use concentrated products; no respondents in the 16-24 age group said that they use these. This can be seen in Table 6.6 and Figure 6.6.
Table 6.6: Ready-to-use and concentrated products use by age bracket
Response 16-24 25-44 45-64 65 and over
Ready-to-use only
Count 8 120 247 178
Percentage 100% 59% 51% 50%
Need diluting only
Count 0 28 87 56
Percentage 0% 14% 18% 16%
Both
Count 0 57 146 122
Percentage 0% 28% 30% 34% N = 1050

Pesticides user habits survey (PS2804 and RF1291) September 2010
33
Figure 6.6: Ready-to-use and concentrated products use by age bracket in 2010
As shown in Table 6.7, there is some correlation between the age bracket of the respondent and whether they use a measuring device or estimate the quantities for dilution. The 65 and over age group has the highest proportion of respondents using a measuring device and the lowest proportion estimating quantities, whilst the youngest age group to respond has the lowest proportion using a measuring device and highest estimating quantities. Compared with 2007 figures, there has been a small increase of 2% of 65+ year olds and a slight decrease of 4% of 25-44 year olds using measuring devices. As no respondents in the 16-24 age group replied that they use products that require dilution this age bracket has not been included.
Table 6.7: Measurement methods by age bracket
Response 25-44 45-64 65 and
over
Measuring device/cap provided with product 86% 90% 95%
Estimate or guess 14% 9% 5%
Other 2% 2% 1% N = 496
0%
20%
40%
60%
80%
100%
120%
16-24 25-44 45-64 65 and over
% o
f re
spo
nd
en
ts
Age bracket
Ready-to-use only (2010) Need diluting only (2010) Both (2010)
Ready-to-use only (2007) Need diluting only (2007) Both (2007)

Pesticides user habits survey (PS2804 and RF1291) September 2010
34
There is also some correlation between age bracket and storage of products after dilution. The oldest age group 65 and over is the most likely to store products after dilution, with almost twice as many (25%) in this age group storing products than in the youngest responding age group (13%). There has been a slight improvement since 2007 in the number of 45-64 year olds not storing products after dilution, with „no‟ answers increasing from 74% to 81% in this age bracket.
Table 6.8: Storage of products after dilution by age bracket
Response 25-44 45-64 65 and over
Yes 13% 19% 25%
No 87% 81% 75%
N = 496
Similarly, those in the 65 and over age bracket are the most likely to rinse containers before disposing of them, with 74% of respondents saying that they do this, compared to just 48% in the youngest responding age bracket. The middle age bracket is just slightly less likely than the 65 and over bracket to rinse their empty containers before disposal.
Table 6.9: Rinsing of empty containers by age bracket
Response 25-44 45-64 65 and over
Yes 48% 68% 74%
No 49% 30% 25%
Not answered 2% 2% 1%
N = 496
No respondents in the 16-24 age bracket said that they dispose of unused or unwanted pesticides. Of the remaining categories, an average of 11% said that they do dispose of unused or unwanted pesticides, with little variation between age brackets, as shown in Table 6.10 and Figure 6.7.
Table 6.10: Disposal of unwanted or unused pesticides by age bracket
Response 16-24 25-44 45-64 65 and
over
Yes 0% 9% 13% 10%
No 100% 91% 87% 89%
Not answered 0% 0% 0% 1%
N = 1050

Pesticides user habits survey (PS2804 and RF1291) September 2010
35
Figure 6.7: Disposal of unwanted products by age bracket
Figure 6.8 below shows different methods of disposal by age bracket. The youngest responding age bracket, 25-44, is the most likely to dispose of unwanted pesticides in the bin with this being the most common response for that age group. For respondents over the age of 45, the most common disposal route is through a HWRC. However, these age groups are also more likely than the younger one to dispose of unwanted pesticide down the drain. A relatively low proportion of responses were received for each of the other disposal routes across all age categories.
0%
20%
40%
60%
80%
100%
120%
16-24 25-44 45-64 65 and over
Yes (2010)
No (2010)
Yes (2007)
No (2007)

Pesticides user habits survey (PS2804 and RF1291) September 2010
36
Figure 6.8: Disposal of unwanted or unused pesticides by age bracket
6.3 Attitudes to gardening
This section focuses on attitudes towards gardening, as different gardener types might have different habits when it comes to purchasing, using, storing and disposing of pesticide products. For many of the questions, responses were similar across all categories save for the „gardening is a chore‟ group. These findings are explored in more detail in this section. In general, product usage is fairly similar across gardener types. Table 6.11 and Figure 6.9 shows the different products used by gardener category. The data shows that:
Weedkillers, slug pellets and lawn treatments were the three most commonly used products across all categories.
Fly sprays / ant sprays are the fourth most popular product for all but the „gardening is a chore‟ category.
Keen gardeners use more insecticides and lawn treatments than the other three categories.
The „gardening is a chore‟ category uses more patio cleaners and weedkillers than the other categories.
0%
5%
10%
15%
20%
25%
30%
35%
40%
45%
50%
25-44 45-64 65 and over
Household waste and recycling centre/ tip/ civic amenity siteBinDrainLocal authority collection serviceSpray onto waste groundSinkToiletOther

Pesticides user habits survey (PS2804 and RF1291) September 2010
37
Table 6.11: Product type used by attitude to gardening
Response
Keen gardener
Enjoy gardening
Like garden tidy
Gardening a chore
Weedkillers
Count 321 184 121 36
Percentage 61% 62% 67% 82%
Slug pellets
Count 329 187 101 21
Percentage 62% 63% 56% 48%
Lawn treatments
Count 262 126 84 20
Percentage 50% 42% 47% 45%
Fly sprays and ant powder
Count 185 104 57 12
Percentage 35% 35% 32% 27%
Insecticides
Count 120 46 20 4
Percentage 23% 15% 11% 9%
Patio cleaners
Count 100 50 25 13
Percentage 19% 17% 14% 30%
Rooting powder/gel/hormone
Count 102 33 13 2
Percentage 19% 11% 7% 5%
Fungicide sprays
Count 96 28 12 2
Percentage 18% 9% 7% 5%
Rat and mouse killers
Count 60 22 13 4
Percentage 11% 7% 7% 9%
Animal repellents, e.g. cat/ dog
Count 44 16 12 1
Percentage 8% 5% 7% 2%
Products for algae and snail control in ponds
Count 23 8 2 1
Percentage 4% 3% 1% 2%
Other
Count 17 10 9 5
Percentage 3% 3% 5% 12% N = 3063

Pesticides user habits survey (PS2804 and RF1291) September 2010
38
Figure 6.9: Product types used by attitude to gardening
Comparing these results with those from 2007, it can be seen that in 2007 it was found that members of the „gardening is a chore‟ group in general purchased fewer products than the other groups. Results from the 2010 survey show that once again this category has the highest proportion of respondents purchasing less than one product per year, but interestingly, it also has the highest proportion of respondents purchasing four products per year or six or more products per year. This would perhaps suggest that there are two types of „not keen‟ gardeners – those who do very little to their garden (and so purchase less than one product on average per year), and those whose approach is to control their garden with a variety of pesticide products and so purchase a large number per year. Interestingly, it is both the „keen gardeners‟ and the „gardening is a chore‟ category that are the highest purchasers of 6 or more products per year. The use of weedkillers amongst the „gardening is a chore‟ category has doubled and the use of patio cleaners in this group has more than tripled since 2007. However, these numbers are still very small so again these results should be treated with some caution. Finally, the 2010 results show that the number of households buying just one product or less has decreased across all gardener categories since 2007.
0%
10%
20%
30%
40%
50%
60%
70%
80%
90%
Keen gardener Enjoy gardening Like garden tidy Gardening a chore
% o
f re
spo
nd
en
ts
Gardener category
Weedkillers Slug pellets
Lawn treatments Fly sprays and ant powder
Insecticides Patio cleaners
Rooting powder/gel/hormone Fungicide sprays
Rat and mouse killers Animal repellents, eg cat/ dog
Products for algae and snail control in ponds Other

Pesticides user habits survey (PS2804 and RF1291) September 2010
39
Table 6.12: Average number of products purchased per year by attitude to gardening
Response Keen gardener Enjoy
gardening Like garden tidy Gardening a chore
Less than one 6% 9% 10% 18%
One 29% 33% 31% 20%
Two 31% 29% 34% 27%
Three 15% 17% 13% 11%
Four 8% 6% 7% 11%
Five 3% 2% 0% 2%
Six or more 8% 3% 5% 9% N = 1050
In all categories, the highest proportion of respondents purchases one or two products per year.
Figure 6.10: Number of products purchased per year by attitude to gardening
0%
5%
10%
15%
20%
25%
30%
35%
40%
Keen gardener Enjoy gardening Like garden tidy Gardening a chore
% o
f re
spo
nd
en
ts
Gardener category
Less than one
One
Two
Three
Four
Five
Six or more

Pesticides user habits survey (PS2804 and RF1291) September 2010
40
Figure 6.11: Respondents purchasing one pesticide or fewer each year
Table 6.13 shows the habits of the different gardener types when it comes to reading the instructions. It can be seen that those least likely to read instructions before buying, and the highest proportion of those who rarely or never read the instructions are gardeners in the „chore‟ category. They are also least likely to follow product instructions. In terms of clarity of the instructions, the „gardening is a chore‟ category is more likely than all other categories to find instructions unclear. This could reflect the likelihood that these respondents spend less time on gardening and so are less familiar and less comfortable with using pesticide products.
Table 6.13: Use of instructions by attitude to gardening
Response
Keen gardener
Enjoy gardening
Like garden tidy
Gardening a chore
Total (count)
Rarely / never read instructions
% 4% 4% 3% 16% 46
Instructions clear
No 5% 4% 5% 11% 50
Not sure (%) 4% 6% 4% 14% 53
Follow instructions
No (%) 4% 2% 2% 9% 34
Sometimes (%) 4% 5% 8% 7% 55
Note: Multiple questions. Total responses = 238.
Table 6.14 below shows the use of different types of products (ready-to-use and concentrated) by gardener type. There is very little difference between categories, although the proportion of those in the „gardening is a chore‟ category using ready-to-use products is slightly lower than in other categories. This contrasts the results from 2007, when use of ready-to-use products in the „gardening is a chore‟ category was higher than in all others. In addition, the proportion of „keen‟ gardeners purchasing ready-to-use products has increased since 2007 from 44% to 50%.
0%
10%
20%
30%
40%
50%
60%
70%
Keen gardener Enjoy gardening Like garden tidy Gardening a chore
% r
esp
on
de
nts
Attitude to gardening
2010
2007

Pesticides user habits survey (PS2804 and RF1291) September 2010
41
Table 6.14: Use of ready-to-use and concentrated products by attitude to gardening
Response Total Keen
gardener Enjoy
gardening
Like garden
tidy
Gardening a chore
Ready-to-use only 53% 50% 57% 55% 48%
Need diluting only 16% 17% 13% 18% 18%
Both 31% 33% 30% 27% 34% N = 1050
The „gardening is a chore‟ category is also the least likely to rinse pesticide containers before disposal, with just 48% stating that they would rinse empty containers compared to 70% in the keen gardener category. The proportion of gardeners rinsing empty containers has increased across all categories since 2007 with the exception of the „chore‟ category, where it has decreased from 54% to 48%.
Table 6.15: Rinsing of empty containers by attitude to gardening
Response Total Keen
gardener Enjoy
gardening Like garden
tidy Gardening
a chore
Yes 67% 70% 64% 67% 48%
No 32% 30% 34% 30% 52% N = 496
Figure 6.12: Rinsing of empty containers by attitude to gardening
Finally, the „gardening is a chore‟ category is the least likely to dispose of unused or unwanted pesticides compared with all other categories.
0%
10%
20%
30%
40%
50%
60%
70%
80%
Keen gardener Enjoy gardening Like garden tidy Gardening a chore
% o
f re
spo
nd
en
ts
Attitude to gardening
Yes (2010)
No (2010)
Yes (2007)
No (2007)

Pesticides user habits survey (PS2804 and RF1291) September 2010
42
Table 6.16: Disposal of unused or unwanted pesticides by attitude to gardening
Response Total Keen
gardener Enjoy
gardening Like garden
tidy Gardening
a chore
Yes 11% 11% 11% 13% 7%
No 88% 88% 89% 87% 93%
Not answered 0% 1% 0% 1% 0%
N = 1050
In terms of the methods of disposal, there is much more variation in the way that pesticides are disposed of amongst the „keener‟ gardening categories; this could well be a reflection of the number of people using and therefore disposing of pesticides in the first place. For all categories, the most popular response was using a HWRC. Keen gardeners were the least likely to put pesticides in the bin, and of the groups that included the drain as a response, was the least likely to use this route.
Figure 6.13: Disposal of unwanted or unused pesticides by attitude to gardening
0%
10%
20%
30%
40%
50%
60%
70%
80%
Keen gardener Enjoy gardening Like garden tidy Gardening a chore
% o
f re
spo
nd
en
ts
Gardener category
Household waste and recycling centre/ tip/ civic amenity siteBinDrainLocal authority collection serviceSpray onto waste groundSinkToiletOther
Pesticides user habits survey (PS2804 and RF1291) September 2010
43
6.4 Product disposal
The number of respondents stating that they dispose of pesticides was 117, and a total of 125 answers were provided (i.e. some respondents use more than one disposal method). The differences in disposal habits across different age groups and gardener types have been addressed in the previous cross-tabulation sections. This section addresses any relationships between ready-to-use and concentrated products and disposal methods, and the clarity of product instructions and disposal methods. Whilst 53% of the survey sample use ready-to-use products only, this was true of just 13% (3 respondents) who dispose of products down the drain, but 61% (17 respondents) who dispose of them in the bin. In 2007, users of concentrated products that require dilution were over-represented among those who dispose of products down the drain; this is not so much the case in 2010. It can be seen from Table 6.17 that a large proportion of those disposing of pesticides inappropriately down the drain are users of products that require dilution before use. Disposal down the drain has decreased slightly in both cases since 2007, with 22% of respondents (5 individuals) who only use products that require dilution now disposing of them down the drain. Again, these figures should be treated with some caution due to the very low sample size. More respondents using ready-to-use products than those using products that require dilution dispose of their products by taking them to an HWRC. Table 6.17: Use of ready-to-use products and products requiring dilution by disposal method
Disposal Method
Types of product used
Ready-to-use only
Need diluting only Both Totals
Drain 3 5 15 23
13% 22% 65% 100%
Sink 0 3 1 4
0% 75% 25% 100%
Toilet 0 2 1 3
0% 67% 33% 100%
Bin 17 4 7 28
61% 14% 25% 100%
Spray onto waste ground 1 1 4 6
17% 17% 67% 100%
Local authority collection service 3 2 4 9
33% 22% 44% 100%
Household waste and recycling centre/ tip/ civic amenity site
23 5 17 45
51% 11% 38% 100%
Other 4 1 0 5
80% 20% 0% 100%
There does not appear to be a relationship between “following of product instructions” and use of inappropriate disposal methods. Of the 12 who do not or only sometimes follow product instructions, 7 cited the use of HWRCs or a local authority collection service as their disposal route, and 5 cited the bin, drain or „other‟ as their disposal route. Of those disposing of products down the drain, 96% said that they follow product instructions.
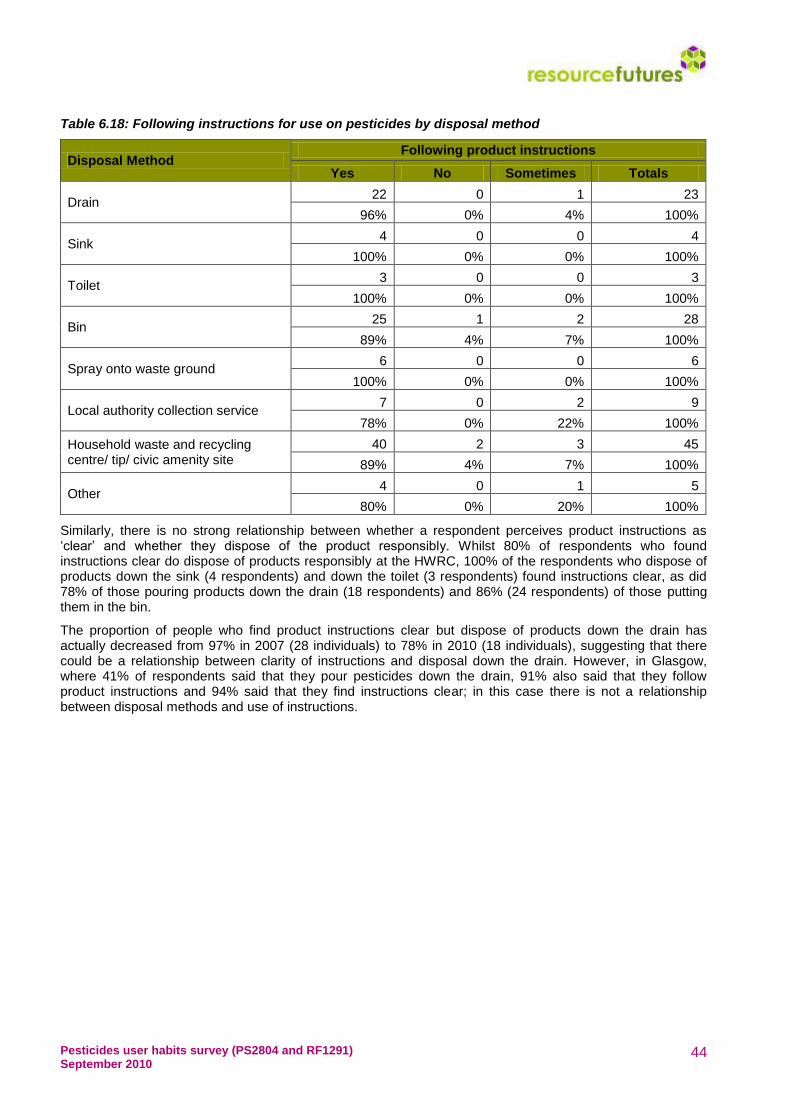
Pesticides user habits survey (PS2804 and RF1291) September 2010
44
Table 6.18: Following instructions for use on pesticides by disposal method
Disposal Method Following product instructions
Yes No Sometimes Totals
Drain 22 0 1 23
96% 0% 4% 100%
Sink 4 0 0 4
100% 0% 0% 100%
Toilet 3 0 0 3
100% 0% 0% 100%
Bin 25 1 2 28
89% 4% 7% 100%
Spray onto waste ground 6 0 0 6
100% 0% 0% 100%
Local authority collection service 7 0 2 9
78% 0% 22% 100%
Household waste and recycling centre/ tip/ civic amenity site
40 2 3 45
89% 4% 7% 100%
Other 4 0 1 5
80% 0% 20% 100%
Similarly, there is no strong relationship between whether a respondent perceives product instructions as „clear‟ and whether they dispose of the product responsibly. Whilst 80% of respondents who found instructions clear do dispose of products responsibly at the HWRC, 100% of the respondents who dispose of products down the sink (4 respondents) and down the toilet (3 respondents) found instructions clear, as did 78% of those pouring products down the drain (18 respondents) and 86% (24 respondents) of those putting them in the bin.
The proportion of people who find product instructions clear but dispose of products down the drain has actually decreased from 97% in 2007 (28 individuals) to 78% in 2010 (18 individuals), suggesting that there could be a relationship between clarity of instructions and disposal down the drain. However, in Glasgow, where 41% of respondents said that they pour pesticides down the drain, 91% also said that they follow product instructions and 94% said that they find instructions clear; in this case there is not a relationship between disposal methods and use of instructions.

Pesticides user habits survey (PS2804 and RF1291) September 2010
45
Table 6.19: Perceived clarity of product instructions by disposal method
Disposal method Perceived clarity of instructions
Yes (clear) No (unclear) Not sure Totals
Drain 18 3 2 23
78% 13% 9% 100%
Sink 4 0 0 4
100% 0% 0% 100%
Toilet 3 0 0 3
100% 0% 0% 100%
Bin 24 2 2 28
86% 7% 7% 100%
Spray onto waste ground 5 1 0 6
83% 17% 0% 100%
Local authority collection service 8 1 0 9
89% 11% 0% 100%
Household waste and recycling centre/ tip/ civic amenity site
36 4 5 45
80% 9% 11% 100%
Other 3 0 2 5
60% 0% 40% 100%
7. Summary and discussion
Key survey findings in 2010 can be summarised as follows:
7.1 Respondent profile
The majority (50%) of respondents identified themselves as „keen and regular gardeners‟, with a
further 28% stating that they „enjoy gardening but don‟t always have the time for it‟. Only 4% saw
gardening as a chore.
99% of all respondents carry out their gardening at home, with small numbers also / instead
gardening at an allotment.
The sample was biased towards older age groups, with 80% of respondents being over the age of 45
and just 1% being 16-24.
7.2 Purchasing habits
The most frequently purchased products were weedkillers, slug pellets and lawn treatments. There
were differences in purchasing habits between different locations, for example with use of weedkillers
being highest in Glasgow, where use of slug pellets was lowest, and use of rat and mouse killers
being highest in Oxford and Chepstow. This could be explained by differences in climatic conditions
causing different prevalence of certain pests. The level of deprivation and urbanity of the surrounding
area could also be a contributing factor, with some areas being more rural with a higher proportion of
farms and large gardens, and others being dominated by small gardens, yards and patio areas.
The majority of respondents purchase an average of one or two products per year. There were some
differences in the number of products purchased per year between different locations; Chepstow and
Tunbridge Wells have the highest proportion of respondents buying less than one product per year,
and Chepstow and Preston have the highest proportion of respondents buying four or more products
per year.

Pesticides user habits survey (PS2804 and RF1291) September 2010
46
There was also some variation in the number of products purchased between different gardener
categories, with 6% of „keen and regular gardeners‟ purchasing one or less products per year,
compared to 18% of the „gardening is a chore‟ category.
80% of respondents said that they usually purchase pesticide products in a garden centre, 35%
stated a DIY store and 24% stated a supermarket.
7.3 Product usage
64% of respondents said that they usually read product instructions prior to buying a product, and
29% said they would read them before first use. Only 4% said that they rarely or never read product
instructions.
Younger users are more likely to read instructions before buying (75% of 16-25 year olds, compared
to 67% of 25-44 year olds, 66% of 45-64 year olds and 59% of 65+), although the youngest category
also has the highest proportion of respondents who would rarely or never read product instructions.
The „gardening is a chore‟ category is the most likely to not read product instructions before use;
differences between other categories are marginal.
92% of respondents said that they follow product instructions.
The most popular source of additional information is websites (14%), with top answers for sites used
being Google, the RHS site, and other gardening sites. This is perhaps still surprisingly low, given
today‟s widespread use of the internet for research purposes. Magazines (8%) were the second most
popular source of information.
Over half of all respondents only use ready-to-use products (53%). No respondents from the 16-24
age group stated that they buy concentrated products for dilution.
Of those who purchase products that require dilution:
o 91% of respondents stated that they use some sort of measuring device, whilst 8% estimate
or guess quantities for dilution. Older age groups are marginally more likely to use a
measuring device than younger age groups.
o 20% store products once they have been mixed up. Older age groups are again slightly more
likely to store mixed up products than younger ones.
o 67% rinse out empty containers after use, with 52% pouring the rinsings down the drain.
„Keen and regular‟ gardeners are the most likely to rinse empty containers.
7.4 Storage
The shed was the most popular storage location amongst respondents, with 60% storing their
pesticides here. A further 33% store pesticides in the garage. Only 4% of respondents cited some
form of safety precaution such as a high shelf or locked cupboard.
The largest proportion of respondents store pesticides for 1 to 2 years (44%), with a further 35%
storing the products for under a year. There was evidence of some hoarding behaviour, with 9%
storing products for 3 years or more, but this is not happening to a huge extent.
7.5 Disposal
The largest proportion (44%) of respondents dispose of their empty containers in their recycling
container. 38% dispose of the containers in their residual waste bin, and 21% take the containers to
at their local HWRC. This varied between locations, with recycling being favoured in Oxford, Preston
and Ipswich, and the bin being the most popular in Glasgow, Tunbridge Wells and Chepstow.
Just 11% of respondents stated that they dispose of unwanted or unused pesticides, suggesting that
the majority of products are used for their intended purpose. 38% dispose of these in a responsible
way by taking the product to their local HWRC. However, large numbers are not disposing of
pesticides appropriately, with 24% using their bin and 20% pouring them down the drain. Small
numbers were also using the sink or toilet.
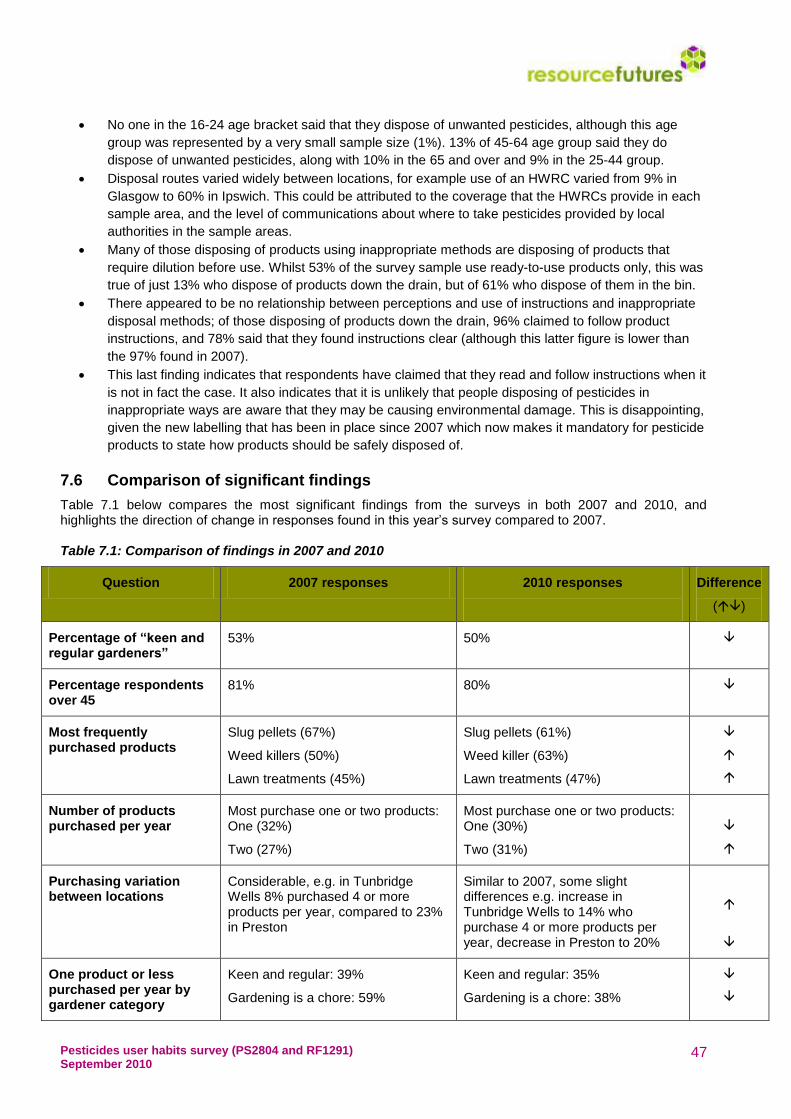
Pesticides user habits survey (PS2804 and RF1291) September 2010
47
No one in the 16-24 age bracket said that they dispose of unwanted pesticides, although this age
group was represented by a very small sample size (1%). 13% of 45-64 age group said they do
dispose of unwanted pesticides, along with 10% in the 65 and over and 9% in the 25-44 group.
Disposal routes varied widely between locations, for example use of an HWRC varied from 9% in
Glasgow to 60% in Ipswich. This could be attributed to the coverage that the HWRCs provide in each
sample area, and the level of communications about where to take pesticides provided by local
authorities in the sample areas.
Many of those disposing of products using inappropriate methods are disposing of products that
require dilution before use. Whilst 53% of the survey sample use ready-to-use products only, this was
true of just 13% who dispose of products down the drain, but of 61% who dispose of them in the bin.
There appeared to be no relationship between perceptions and use of instructions and inappropriate
disposal methods; of those disposing of products down the drain, 96% claimed to follow product
instructions, and 78% said that they found instructions clear (although this latter figure is lower than
the 97% found in 2007).
This last finding indicates that respondents have claimed that they read and follow instructions when it
is not in fact the case. It also indicates that it is unlikely that people disposing of pesticides in
inappropriate ways are aware that they may be causing environmental damage. This is disappointing,
given the new labelling that has been in place since 2007 which now makes it mandatory for pesticide
products to state how products should be safely disposed of.
7.6 Comparison of significant findings
Table 7.1 below compares the most significant findings from the surveys in both 2007 and 2010, and highlights the direction of change in responses found in this year‟s survey compared to 2007. Table 7.1: Comparison of findings in 2007 and 2010
Question 2007 responses 2010 responses
Difference
()
Percentage of “keen and regular gardeners”
53% 50%
Percentage respondents over 45
81% 80%
Most frequently purchased products
Slug pellets (67%)
Weed killers (50%)
Lawn treatments (45%)
Slug pellets (61%)
Weed killer (63%)
Lawn treatments (47%)
Number of products purchased per year
Most purchase one or two products: One (32%)
Two (27%)
Most purchase one or two products: One (30%)
Two (31%)
Purchasing variation between locations
Considerable, e.g. in Tunbridge Wells 8% purchased 4 or more products per year, compared to 23% in Preston
Similar to 2007, some slight differences e.g. increase in Tunbridge Wells to 14% who purchase 4 or more products per year, decrease in Preston to 20%
One product or less purchased per year by gardener category
Keen and regular: 39%
Gardening is a chore: 59%
Keen and regular: 35%
Gardening is a chore: 38%

Pesticides user habits survey (PS2804 and RF1291) September 2010
48
Question 2007 responses 2010 responses
Difference
()
Not reading / understanding instructions
Rarely or never read: 6%
Instructions are unclear: 3%
Do not follow: 2%
Only sometimes follow: 6%
Rarely or never read: 4%
Instructions are unclear: 5%
Do not follow: 3%
Only sometimes follow: 5%
Attitude to instructions between gardener type
Highest proportions of people rarely/never reading instructions: „chore‟ group 10%
Highest proportion saying instructions are not clear: „chore‟ group 4%
Highest proportions of people rarely/never reading instructions: „chore‟ group 16%
Highest proportion saying instructions are not clear: „chore‟ group 11%
Other sources of instructions
Garden centre staff: 14%
Magazines: 13%
Websites: 8%
TV: 8%
Garden centre staff: 5%
Magazines: 8%
Websites: 14%
TV: 5%
Proportion only using „ready-to-use‟ products
47%
Younger age groups more likely to use these
Keen and regular gardeners: 44%
53%
Younger groups more likely to use these
Keen and regular gardeners: 50%
Percentage estimating the amount of product to be diluted
10%
Likelihood becomes slightly lower with ascending age
8%
Likelihood becomes slightly lower with ascending age
Percentage saving products they have already mixed
24%
Likelihood much higher with ascending age
20%
Likelihood again much higher with ascending ages
Percentage that rinse empty containers
60%
Those in the 65+ age group and keen and regular gardener category are most likely to rinse empty containers: 66%
67%
Again, those in the 65+ age group and keen and regular gardener category are most likely to rinse empty containers: 74%
Where rinsings are poured
Down the drain: 50%
Waste ground: 24%
Sink: 7%
Toilet: 1%
Drain: 52%
Waste ground: 24%
Sink: 10%
Toilet: 1%
-
-
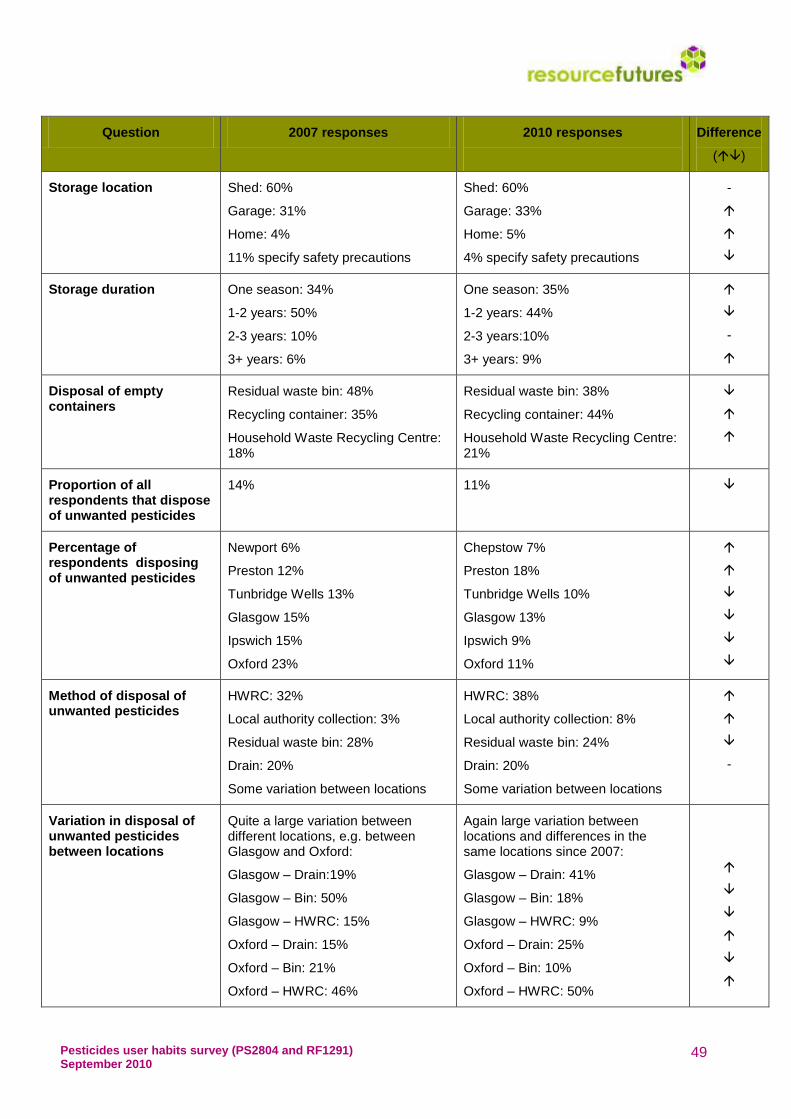
Pesticides user habits survey (PS2804 and RF1291) September 2010
49
Question 2007 responses 2010 responses
Difference
()
Storage location Shed: 60%
Garage: 31%
Home: 4%
11% specify safety precautions
Shed: 60%
Garage: 33%
Home: 5%
4% specify safety precautions
-
Storage duration One season: 34%
1-2 years: 50%
2-3 years: 10%
3+ years: 6%
One season: 35%
1-2 years: 44%
2-3 years:10%
3+ years: 9%
-
Disposal of empty containers
Residual waste bin: 48%
Recycling container: 35%
Household Waste Recycling Centre: 18%
Residual waste bin: 38%
Recycling container: 44%
Household Waste Recycling Centre: 21%
Proportion of all respondents that dispose of unwanted pesticides
14% 11%
Percentage of respondents disposing of unwanted pesticides
Newport 6%
Preston 12%
Tunbridge Wells 13%
Glasgow 15%
Ipswich 15%
Oxford 23%
Chepstow 7%
Preston 18%
Tunbridge Wells 10%
Glasgow 13%
Ipswich 9%
Oxford 11%
Method of disposal of unwanted pesticides
HWRC: 32%
Local authority collection: 3%
Residual waste bin: 28%
Drain: 20%
Some variation between locations
HWRC: 38%
Local authority collection: 8%
Residual waste bin: 24%
Drain: 20%
Some variation between locations
-
Variation in disposal of unwanted pesticides between locations
Quite a large variation between different locations, e.g. between Glasgow and Oxford:
Glasgow – Drain:19%
Glasgow – Bin: 50%
Glasgow – HWRC: 15%
Oxford – Drain: 15%
Oxford – Bin: 21%
Oxford – HWRC: 46%
Again large variation between locations and differences in the same locations since 2007:
Glasgow – Drain: 41%
Glasgow – Bin: 18%
Glasgow – HWRC: 9%
Oxford – Drain: 25%
Oxford – Bin: 10%
Oxford – HWRC: 50%

Pesticides user habits survey (PS2804 and RF1291) September 2010
50
Question 2007 responses 2010 responses
Difference
()
With specific reference to respondents disposing of unwanted pesticides
Age groups Highest number of respondents (17%) were in 45-64 age group
Highest number of respondents (13%) were in 45-64 age group
Gardener category Greatest proportion of any group disposing of pesticides was 19% in „enjoy gardening – don‟t have time‟
Greatest proportion of any group disposing of pesticides was 13% in „like garden tidy‟
Ready-to-use and concentrated products
17% of those disposing down the drain use ready-to-use only
29% of those putting products in the bin use ready-to-use only
38% of products disposed of down the drain are concentrated
13% of those disposing down the drain use ready-to-use only
61% of those putting products in the bin use ready-to-use only
22% of products disposed of down the drain are concentrated
Following product instructions
93% of those disposing of products down the drain follow product instructions
96% of those disposing of products down the drain follow product instructions
Clarity of product instructions
97% of those disposing of products down the drain find instructions clear
78% of those disposing of products down the drain find instructions clear

Pesticides user habits survey (PS2804 and RF1291) September 2010
51
Appendix 1: Questionnaire
Pesticide User Habits Survey, May 2010
INTRODUCTION
Good morning/ afternoon I‟m carrying out a survey on behalf of the Chemicals Regulation Directorate, a government body that works to ensure the safe use of pesticides. The survey will only take a few minutes, and there‟s a prize draw for garden centre vouchers which we can enter you for if you would like. Would you be interested in taking part?
Additional information if required:
Prize draw first prize £100, plus 5 x runner-up prizes of £25
The survey information will be used by the Chemicals Regulation Directorate, part of the Health and Safety Executive, to develop guidance for the public on safe use, storage and disposal of pesticides.
Length of survey depends on answers – 5 to 8 minutes
1. Do you use pesticides or garden chemicals in your garden? (prompt with examples if
required)
Yes 1
No 2
If YES, continue to Question 2
If NO, thank and close interview
Questions about you
2. Which of these descriptions best describes how you feel about gardening (single code):
I am a keen and regular gardener – gardening is an enjoyable hobby 1
I enjoy gardening but don‟t always have time for it 2
I like to keep the garden tidy, but wouldn‟t call it a hobby 3
Gardening is a chore 4
3. Where do you do your gardening?
Garden at home 1
Allotment 2
Other (please specify)
_________________
3

Pesticides user habits survey (PS2804 and RF1291) September 2010
52
4. Which of the following age brackets do you fall into?
16-24 1
25-44 2
45-64 3
65 and over 4
Purchasing
5. Which types of pesticides do you use? (multi code)
Animal repellents, eg cat/ dog 01 Fly sprays and ant powder 07
Patio cleaners 02 Fungicide sprays 08
Insecticides 03 Lawn treatments 09
Rooting powder/gel/hormone 04 Products for algae and snail control in ponds
10
Rat and mouse killers 05 Slug pellets 11
Weedkillers 06 Other (please specify)_________________________
12
6. How many pesticide products do you purchase each year on average? (single code)
Less than 1 1
1 2
2 3
3 4
4 5
5 6
6 or more 7
7. Where do you usually buy your garden chemicals from? (multi code)
Garden centre 1
DIY store 2
Supermarket 3
Gardening club or allotment society 4
Other (please specify)____________________________ 5

Pesticides user habits survey (PS2804 and RF1291) September 2010
53
Use
8. When do you read the instructions for use on pesticides? (multi code)
Before buying 1
Before using for first time 2
Before using every time 3
Occasionally as a reminder 4
Rarely/ never 5
9. Do you generally find that instructions for use on pesticides are clear?
Yes 1
No 2
Not sure 3
10. Do you follow the instructions for use on pesticides?
Yes 1
No 2
Sometimes 3
11. What other places do you get information on how to use pesticides? (please specify
which if possible)
Multicode Which?
Websites 01
Magazines 02
Leaflets 03
Books 04
TV 05
Radio 06
Gardening advice helpline 07
Product company helpline 08
Garden centre staff 09
Other gardeners 10
Other 11
12. Do you tend to use ready-to-use products or products that need diluting before use?
(single code)
Ready-to-use 1
Need diluting 2
Both 3
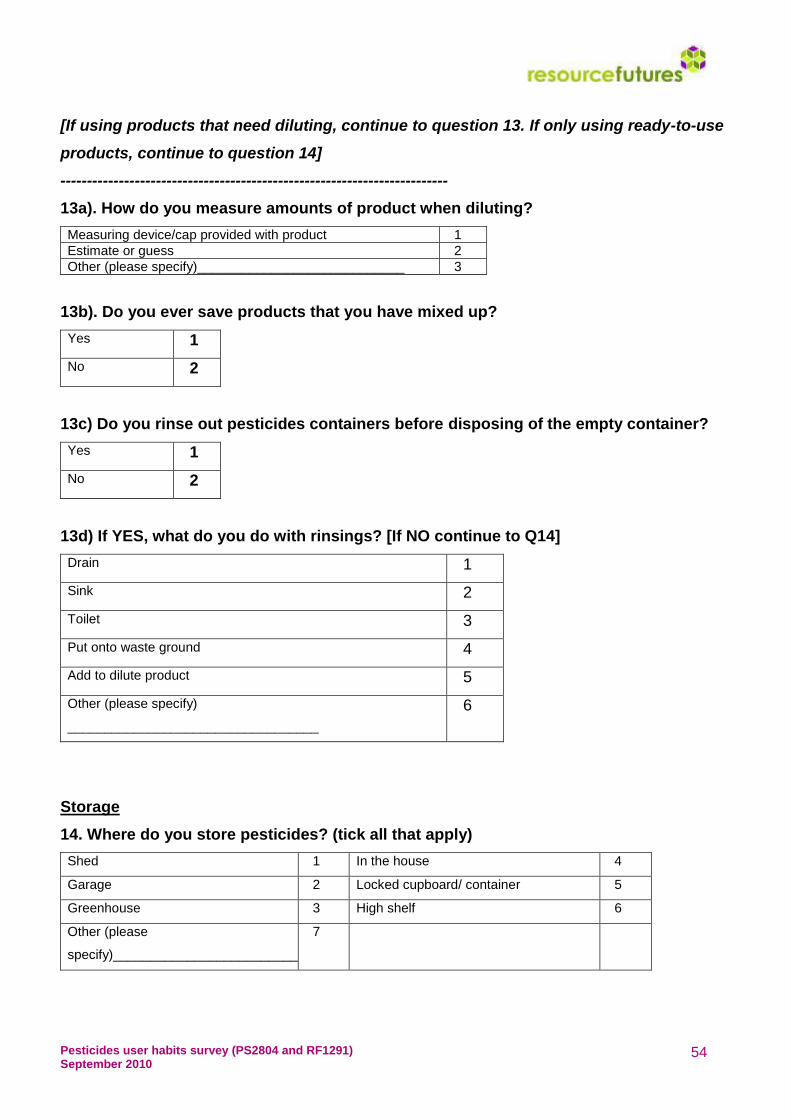
Pesticides user habits survey (PS2804 and RF1291) September 2010
54
[If using products that need diluting, continue to question 13. If only using ready-to-use
products, continue to question 14]
-------------------------------------------------------------------------
13a). How do you measure amounts of product when diluting?
Measuring device/cap provided with product 1
Estimate or guess 2
Other (please specify)____________________________ 3
13b). Do you ever save products that you have mixed up?
Yes 1
No 2
13c) Do you rinse out pesticides containers before disposing of the empty container?
Yes 1
No 2
13d) If YES, what do you do with rinsings? [If NO continue to Q14]
Drain 1
Sink 2
Toilet 3
Put onto waste ground 4
Add to dilute product 5
Other (please specify)
__________________________________
6
Storage
14. Where do you store pesticides? (tick all that apply)
Shed 1 In the house 4
Garage 2 Locked cupboard/ container 5
Greenhouse 3 High shelf 6
Other (please
specify)_________________________
7

Pesticides user habits survey (PS2804 and RF1291) September 2010
55
15. How long do you store pesticides for on average before using them up or disposing of
them?
Less than 1 year 1
1 to 2 years 2
2 to 3 years 3
3 to 5 years 4
More than 5 years 5
Disposal
16. How do you dispose of empty pesticide containers?
Bin 1
Recycling box/bin/bag 2
Household waste and recycling centre/ tip/ civic amenity site 3
Other (please specify)
__________________________________
4
17. Do you ever dispose of unused or unwanted pesticides?
Yes 1
No 2
If YES, continue to Question 18
If NO, thank and close interview

Pesticides user habits survey (PS2804 and RF1291) September 2010
56
18. How do you dispose of unused or unwanted pesticides (unprompted)? (multi code)
Drain 1
Sink 2
Toilet 3
Bin 4
Spray onto waste ground 5
Local authority collection service 6
Household waste and recycling centre/ tip/ civic amenity site 7
Other (please specify)
__________________________________
8
CLOSE:
Thank you very much.
If you would like to enter the prize draw (First prize £100 garden centre vouchers, five runner-up prizes of
£25), please provide us with your contact details.
NB: Your details will ONLY be used to enter you in the prize draw.
Name:
Address:
Telephone number:
I have carried out the interview according to the instructions and as per the MRS code of conduct. Interviewer Name:-------------------------------- Interviewer Signature:-------------------------------------- Date: -------------------------------------- Duration:------------------------------------

Pesticides user habits survey (PS2804 and RF1291) September 2010
57
Appendix 2: Briefing sheet for User Habits Questionnaire
What are Pesticides?
'Pesticide' is a broad term, covering a range of products that are used to control pests. Pesticides you may have heard of include:
ant powders
insect killers (insecticides)
mould and fungi killers (fungicides)
weedkillers (herbicides)
slug pellets (molluscicides)
plant growth regulators
bird and animal repellents, and
rat and mouse killers (rodenticides)
wood preservatives (e.g. for fence panels) Often people only think of pesticides as chemicals, but they include a huge range of different types of products. Some are natural (e.g. pyrethrums, obtained from chrysanthemums), while many are altered versions of natural chemicals (e.g. fatty acids). These „natural‟ versions may be considered suitable for use by organic gardeners. Organic gardening However, organic gardening involves a lot more that just avoiding the use of chemicals. Organic gardeners focus their energy into increasing the natural health of their soil, choosing appropriate plant varieties, and working with nature to produce a healthy and productive garden. Ready to use / concentrate products Liquid Ready-to-Use products are often sold in trigger spray bottles. Liquid concentrate products are usually in plastic bottles with child proof screw caps that then need measuring out and diluting. Granular products (e.g. some lawn treatments) are often ready to use as many can be bought in a container that will dispense the product at a particular rate. Although larger bags can also be bought which can be applied with a separate spreader. Should I save pesticides that I have diluted? No. You should try to avoid storing diluted pesticide by only mixing up or diluting the amount you need for a specific job. Should I rinse out pesticide containers before disposing of them? What should I do with the rinsings? It is good practice to rinse out pesticide containers that have held concentrated product (i.e. requiring dilution for use) before disposing of them. The container should be rinsed three times and the washings added to the final spray solution. Trigger bottles (Ready-to-Use products) and other containers do not need to be rinsed. Should I keep pesticides locked up? Garden pesticides do not need to be kept locked away, although they should be kept out of the reach of children and pets. After you have used the pesticide, make sure that the packaging is tightly closed or sealed. Take particular care to use and store slug pellets safely, so as to avoid accidentally poisoning any pets – particularly dogs.

Pesticides user habits survey (PS2804 and RF1291) September 2010
58
How long should I store pesticides for before using them?
If you store it carefully, any remaining pesticide will be effective for some years to come. Check whether you can still legally use it by visiting our Garden Pesticides Search (https://secure.pesticides.gov.uk/garden/prodsearch.asp). Garden sheds and greenhouses are not ideal for storing pesticides as they can get very hot in summer or cold in winter. Pesticide products are best stored at an even temperature. How should I dispose of empty pesticide containers? First of all, check the label for advice. Empty containers of Ready-to-Use products (e.g. trigger sprays) can be disposed of directly into your household waste. Empty bottles of concentrates (pesticides you dilute with water for use) need to be rinsed out three times first and the washings added to the spray solution. How should I dispose of unwanted pesticides? Unwanted pesticides should be disposed of safely through your local amenity waste disposal site that accepts hazardous household waste. All local councils should make arrangements for disposing of hazardous household waste, so you should contact them for the nearest suitable site. Alternatively some councils offer a collection service. Pesticides (and other chemicals) are securely separated from other waste and disposed of safely later, usually in special high temperature incinerators that destroy them completely.