Resource Complementarity and Value Capture in Firm...
41
Resource Complementarity and Value Capture in Firm Acquisitions: The Role of Intellectual Property Rights Christoph Grimpe and Katrin Hussinger Journal article (Post print version) This is the peer reviewed version of the following article:“Resource Complementarity and Value Capture in Firm Acquisitions : The Role of Intellectual Property Rights” / Grimpe, Christoph; Hussinger, Katrin. In Strategic Management Journal, Vol. 35, Nr. 12, 2014, s. 1762–1780., which has been published in final form at 10.1002/smj.2181. This article may be used for non-commercial purposes in accordance with Wiley Terms and Conditions for Self-Archiving. Uploaded to Research@CBS: March 2016
Transcript of Resource Complementarity and Value Capture in Firm...

Resource Complementarity and Value Capture in Firm
Acquisitions: The Role of Intellectual Property Rights Christoph Grimpe and Katrin Hussinger
Journal article (Post print version)
This is the peer reviewed version of the following article:“Resource Complementarity and Value Capture in Firm Acquisitions : The Role of Intellectual Property Rights” / Grimpe, Christoph;
Hussinger, Katrin. In Strategic Management Journal, Vol. 35, Nr. 12, 2014, s. 1762–1780., which has been published in final form at 10.1002/smj.2181.
This article may be used for non-commercial purposes in accordance with Wiley Terms and Conditions for Self-Archiving.
Uploaded to Research@CBS: March 2016

Resource Complementarity and Value Capture
RESOURCE COMPLEMENTARITY AND VALUE CAPTURE IN FIRM
ACQUISITIONS: THE ROLE OF INTELLECTUAL PROPERTY RIGHTS
Christoph Grimpe, Associate Professor, Copenhagen Business School, Department of Innovation
and Organizational Economics, Kilevej 14A, 2000 Frederiksberg, Denmark,
email: [email protected], phone: +45 38152530.
Katrin Hussinger, Associate Professor, University of Luxembourg, Faculty of Law, Economics
and Finance, Center for Research in Economics and Management, 162 A, Avenue de la
Faïencerie, 1511 Luxembourg, email: [email protected], phone: +352 46 66 44 6404.
Published in the Strategic Management Journal, Vol. 35, 1762-1780. The final version can be found at http://onlinelibrary.wiley.com/doi/10.1002/smj.2181/abstract
ABSTRACT
Extant literature holds that firm acquisitions create value through innovation if the knowledge
bases of the acquirer and the target complement each other. Little is known about the value that
patents associated with a target’s knowledge convey to the acquirer, i.e. their value in securing
market exclusion and freedom to operate in R&D. We argue that such property rights hold pre-
emptive power allowing firms to capture the value from combining complementary technologies
and to realize gains from trade in strategic factor markets. Our results for a sample of 1428
acquisitions indicate that – controlling for technological value – acquired pre-emptive power is
an important determinant of the acquisition price, particularly when the acquirer is technology
intensive and acquired patents are highly related to the acquirer’s knowledge base.
Keywords: Technology acquisitions, intellectual property rights, value creation, value capture,
resource complementarity

Resource Complementarity and Value Capture
INTRODUCTION
Firm acquisitions to gain access to technology, knowledge, and capabilities have become a
frequently observed corporate trend (Hitt et al., 1996; Ahuja and Katila, 2001; Graebner, 2004;
Makri, Hitt, and Lane, 2010). A key concern of prior literature has been to understand the
conditions under which these acquisitions increase innovation performance and hence create
value for the acquiring firms (Barney, 1988; Hitt, Harrison, and Ireland, 2001). One of the main
findings is that acquired knowledge and technology should be complementary to the acquirer’s
knowledge base (Cassiman et al., 2005), because such a combination leads to a “surplus” over
and above the value the acquirer’s and target’s resources could create independently (Conner,
1991). In other words, technology acquisition creates value when the technological knowledge is
sufficiently similar to provide opportunities for learning, but different enough to expose the
acquirer to new and diverse knowledge (Ahuja and Katila, 2001; Cloodt, Hagedoorn, and van
Kranenburg, 2006).
Anecdotal evidence suggests, however, that acquiring firms might not be primarily
interested in the opportunities to learn from a target’s knowledge and technology base, but
instead in the opportunity to acquire a contested patent portfolio that either threatens their own
research and development (R&D) activities in a particular field of technology or that could be
used to block third parties. A prominent example of an industry in which technology acquisitions
are meant not only to accelerate innovation in the merged entity but also to secure important
patents is the information and communications technology (ICT) industry. In August 2011,
David Drummond, Chief Legal Officer at Google, complained that Google’s success with mobile
devices triggered “a hostile, organized campaign against Android by Microsoft, Oracle, Apple
2

Resource Complementarity and Value Capture
and other companies, waged through bogus patents. […] Patents were meant to encourage
innovation, but lately they are being used as a weapon to stop it.”1 Only a few weeks later, Larry
Page, Google’s CEO, announced that Google was to acquire Motorola Mobility, a mobile phone
manufacturer that had come under financial pressure: “Our acquisition of Motorola will increase
competition by strengthening Google’s patent portfolio, which will enable us to better protect
Android from anti-competitive threats from Microsoft, Apple and other companies.” Page further
commented that “the combination of Google and Motorola will not only supercharge Android,
but will also enhance competition and offer consumers accelerating innovation, greater choice,
and wonderful user experiences.”2
Google’s acquisition of Motorola indicates that a firm’s patent portfolio not only
represents an independent and observable indicator of its technology base and research
capabilities (Henderson and Cockburn, 1994; Adegbesan and Higgins, 2010) but also holds pre-
emptive power that may be valuable to the acquiring firm. By their very definition, patents are
intellectual property rights (IPR) that grant a temporary monopoly to commercialize an invention
that would otherwise be free for others to use (Arrow, 1962). Besides protecting a specific
invention, patents defend a spot in technology space around the patented invention. Since follow-
up inventions need to involve a significant inventive step over the state of the art in order to
qualify for patent protection, granted patents influence competition in product markets
(Ceccagnoli, 2009). In this paper, we shed light on the pre-emptive power of a target firm’s
patent portfolio and argue that it may in fact be another source of value – besides the value that
1 http://googleblog.blogspot.com/2011/08/when-patents-attack-android.html 2 http://googleblog.blogspot.com/2011/08/supercharging-android-google-to-acquire.html
3

Resource Complementarity and Value Capture
can be created through combining complementary resources and technologies – because it allows
acquirers to secure market exclusion and their freedom to operate in R&D and hence to capture
value from innovation activities.
From a theoretical perspective, firm acquisitions on the market for corporate control have
frequently been characterized as resource acquisitions on strategic factor markets (SFM) (e.g.,
Barney, 1986, 1988; Lippman and Rumelt, 2003). Extant SFM theory suggests that, since firms’
endowment with resources varies, some firms exhibit superior complementarity to resources
available on SFM, i.e. they may create a greater surplus than other firms when acquiring
resources on SFM. While the distribution of the surplus is ex-ante indeterminate, firms with
superior complementarity may, as a consequence, be guaranteed a minimum level of value
appropriation (Adegbesan, 2009). This proposition of value appropriation, however, rests on the
implicit assumption that acquiring firms also hold the property rights required for capturing the
value. The acquisition of pre-emptive power from a target firm can therefore be understood as a
way to unlock complementarity effects that represent the gains from trade in SFM.
By clarifying an assumption of SFM theory, our research aims at understanding the value
of acquired patents’ pre-emptive power vis-à-vis the technological value of the target’s
knowledge base. Moreover, we are interested in the conditions under which acquiring firms can
expect to capture most value. We examine two conditions that affect the value of the target’s pre-
emptive power to the acquiring firm: the acquirer’s own technology intensity and the relatedness
between the acquirer’s and target’s technology portfolios. We expect the acquirer’s technology
intensity to have a positive moderating effect on the relationship between the target’s pre-
emptive power and the expected value capture since technology intensive firms have relatively
large sunk R&D investments that they seek to protect. Moreover, we suggest that a target’s pre-
4

Resource Complementarity and Value Capture
emptive power is most valuable when its patents are highly related to the acquirer’s patent
portfolio because highly related patents make it possible to appropriate value from “locked”
technology the acquirer could not commercialize due to competitor patents. Hence, while
acquiring firms can expect to create most value due to organizational learning and cross-
fertilization when combining patent portfolios with a moderate degree of relatedness, value
capture is fostered through the acquisition of a target firm’s highly related patents.
We investigate our research question in a sample of 1428 firm acquisitions in Europe
during the 14-year period from 1997 to 2010. Unlike prior studies in the field that use innovation
performance as the dependent variable (e.g., Ahuja and Katila, 2001; Cassiman et al., 2005), our
regressions explain the price paid by the acquiring firm for the target. Under the condition of
resource competition, the price is a proxy for an acquirer’s “willingness to pay” (Brandenburger
and Stuart, 1996) and reflects its expectations for future value creation and capture (Barney,
1988). Excluding managerial hubris, the price thus accounts for differences in the ability of firms
to realize gains from trade in SFM (Adegbesan, 2009).
Our study makes three contributions to the literature. First, by focusing on the pre-
emptive power of patents in technology acquisitions, we respond to the claim that the analysis of
value appropriation has remained a relatively understudied area in the resource-based view
(RBV) (Coff, 1999; Barney, 2001). While the acquisition of technology as a means to create
value has received considerable attention in the literature (e.g., Cassiman et al., 2005, Makri et
al., 2010), our research disentangles the effects of the technological value of a target’s
knowledge base from the pre-emptive power of the associated patent portfolio. Empirically, we
rely on newly developed indicators to measure the technological value of the knowledge base
and the associated pre-emptive power of patents that build on unique information available from
5

Resource Complementarity and Value Capture
the patent examination procedure at the European Patent Office (EPO) (Grimpe and Hussinger,
2008; Guellec, Martinez, and Zuniga, 2012). Second, we clarify an implicit, yet important
assumption of SFM theory regarding the appropriation of value in the presence of superior
resource complementarity. In its current state of development, SFM theory falls short of
accounting for the importance of property rights in capturing value. In other words, acquiring
firms that display superior complementarity to target resources can only be guaranteed a
minimum level of value appropriation if they hold the property rights necessary to exploit that
complementarity. Third, we adopt a contingency perspective and investigate the conditions under
which the acquisition of pre-emptive power becomes most valuable to the acquirer. In particular,
we argue that highly related or even overlapping patent portfolios can actually be highly valuable
if the pre-emptive aspect of patents is considered.
The remainder of the paper is organized as follows. The next section provides some
background on the pre-emptive power of patents before we outline our theoretical framework
and establish a set of hypotheses. Section 4 introduces our data, measures, and model. We test
our hypotheses in section 5 and subsequently discuss the results, outlining implications for
management practice and research. The last section concludes, provides a critical evaluation, and
points out potential areas for further research.
PATENTS AND VALUE CAPTURE
Prior research has used patents as observable indicators of the technological value of a firm’s
knowledge base (e.g., Ahuja and Katila, 2001; Adegbesan and Higgins, 2010). The larger a
firm’s patent portfolio, the greater its assumed research capabilities and inventive activity. Larry
Page’s remark on “bogus patents” suggests, however, that not all patents filed reflect advances in
6

Resource Complementarity and Value Capture
the firm’s knowledge base to the same extent. In fact, patent pre-emption, i.e. filing a patent for a
substitute of an existing technology before potential competitors to generate a property right,
seems to be a widespread strategy of firms to deter the entry of rivals and to capture value
(Blind, Cremers, and Müller, 2009; Ceccagnoli, 2009). In order to protect an important
invention, firms can “invent around” it by filing patents on close substitutes that do not
necessarily represent an improvement over the existing invention. A firm might have no
intention to commercialize these inventions but the substitute patents help to build a “patent
fence” that forecloses the ability of rivals to file a patent close to the original invention (Cohen,
Nelson, and Walsh, 2000; Ziedonis, 2004).
Several recent studies have contributed evidence on this topic. Based on results from the
Carnegie-Mellon survey for the United States and Japan, pre-emptive patenting is the most
pervasive motive to patent after the prevention of imitation (Cohen et al., 2002). Using survey
data from Germany, Blind, Cremers, and Müller (2009) show that more than 40 percent of
patenting firms apply for patents in order to block competitors. The authors find particularly
striking evidence of “defensive blocking” through patenting. They define this as a forward-
looking protection strategy directed at protecting the firm’s position in technology areas and
securing its own freedom to operate in R&D. Ziedonis (2004) analyzes the conditions under
which firms patent more aggressively to avoid being “fenced in” by rivals. Ceccagnoli (2009)
finds that pre-emptive patenting significantly increases the degree to which firms can appropriate
the returns from R&D. Investigating the market entry of software products, Cockburn and
MacGarvie (2011) conclude that patents may deter entry above and beyond the extent to which
they mirror the technological capabilities of the firm creating the patents. Although pre-emptive
patents may only protect marginal technological change (Guellec et al., 2012), they increase their
7

Resource Complementarity and Value Capture
owners’ market value significantly, suggesting that the pre-emptive power of a patent portfolio is
a significant value determinant (Grimpe and Hussinger, 2008; Czarnitzki, Hussinger, and Leten,
2011). It is less clear, however, under which conditions pre-emptive patents are most valuable
for an acquiring firm.
These findings hold two important insights for our research. First, pre-emptive patenting
is a significant determinant of the extent to which a firm can appropriate, or capture, the value
from its technological innovations and firms will therefore strive to generate or acquire these
property rights. Second, firms may differ not only in their technological capabilities but also in
their ability to protect important inventions by filing patents for substitutes (or “bogus patents”)
to deter R&D rivals. As a result, the patent portfolio associated with a firm’s knowledge base
serves as an indicator not only of a firm’s technological capabilities but also of its pre-emptive
power. Depending on the firm’s IPR strategy, patent portfolios of the same size may hence differ
in terms of their technological value and their pre-emptive power. Just as the combination of
technological capabilities in a merged firm is expected to create value, we argue in the following
that acquiring firms can expect to capture value when they get access to another firm’s pre-
emptive power and that this value also depends on the acquirer’s own patent portfolio.
THEORY AND HYPOTHESES
Target valuation with heterogeneous resource complementarity
One of the key tenets of the RBV is that superior firm performance originates from deploying
valuable resources that are rare, difficult to imitate, and non-substitutable (Barney, 1991; Peteraf,
1993). Despite the focus of the resource-based theory on the in-house development of complex
8

Resource Complementarity and Value Capture
resources that fulfill these criteria, firms actually make considerable efforts to acquire those
resources through mergers, acquisitions, alliances, and other activities, and to combine them with
internal resources (e.g., Lippman and Rumelt, 2003; Rothaermel and Boeker, 2008; Grimpe and
Kaiser, 2010). It is therefore important to ask at what cost firms can acquire valuable resources.
In his SFM theory, Barney (1986, 1988) suggests that, assuming an efficient market for
corporate control, the price of a target firm is likely to approximate the value it creates for the
bidding firm. The cost of the resources will only be lower than their economic value to the
acquirer if the acquirer (1) has superior information about their future value, (2) displays superior
complementarity to target resources, or (3) is plain lucky. If none of these conditions applies,
other bidding firms that see an opportunity for value creation would drive up the price.
Particularly the condition of superior complementarity to target resources has received
attention in subsequent contributions to SFM theory. Since firms are differently endowed with
resources, some combinations of acquirer and target resources will create more value than others.
A bidding firm can hence afford to pay a price over and above the value of the target resource in
isolation (Conner, 1991; Lippman and Rumelt, 2003). Applying a game-theoretical model,
Adegbesan (2009) shows that, as a consequence, some firms can outbid firms with less resource
complementarity, even if all potential bidding firms know ex-ante how much value can be
created. More formally, heterogeneous resource complementarity suggests that the combined
value of the acquiring firm’s resources v(A) and the target firm’s resources v(T) is v(A U T) =
v(A) + v(T) + SA,T, where SA,T > 0. The amount of the surplus SA,T depends on the level of
complementarity between both firms’ resources. Therefore, acquiring firms can realize gains
from trade in SFM even if they have to pay p(T) = v(T) for the target firm because p(T) ≤ v(T) +
SA,T. Since the surplus does not pertain to either the acquirer or the target but instead results from
9

Resource Complementarity and Value Capture
their combination, the exact distribution of the surplus is ex-ante indeterminate. However,
Adegbesan (2009) further shows that acquiring firms with superior resource complementarity
can be guaranteed a minimum level of value appropriation (SA,T > 0) relative to an acquirer that
displays least complementarity to a target firm’s resources (SA,T = 0). The split of the residual
surplus will be determined by a mixture of competition and bargaining ability.
This reasoning is intriguing, since it explains why firms trade technology on SFM even
though such resources might be homogeneous and not unique (Lippman and Rumelt, 2003). But
it rests on the assumption that the acquiring firm also gets access to the property rights, such as
the patents on technology, required to capture the value created. Property rights render the
acquired resources and the combination with existing resources unique and grant the right to
exclude third parties from using the protected resources. Moreover, some combinations of
existing and acquired property rights may be particularly suitable to protect resources. In other
words, property rights may be complementary in enabling value capture in resource acquisitions
on SFM. While extant SFM theory seems to overlook this problem, the notion of property rights
defining a resource owner’s ability to create and appropriate value from the resource is not new.
Building on insights from property rights economics (e.g., Alchian and Demsetz, 1973), Foss and
Foss (2005) stress that the protection of resource value goes beyond making resources difficult to
imitate and substitute by competitors (Teece, 1986). Although superior resource
complementarity may be difficult to imitate by competitors, those resources are not protected
from value erosion unless the resource owner owns the property rights required to commercially
exploit such complementarity. Value erosion in that sense refers to a decay in resource value
caused by rivals’ ability to interfere with the firm’s value capture (Foss and Foss, 2005).
10
Resource Complementarity and Value Capture
Acquiring the property rights to the attributes that define the resources, however, incurs
transaction costs that inevitably influence resource value (Foss and Foss, 2005). At the same
time, those property rights may be a second source of value – besides the value that stems from
complementarity – which has not been documented explicitly in the theoretical literature or at all
in the empirical literature on SFM. In that sense, a patent is valuable over and above the value of
the technological knowledge since it constitutes a property right that restricts a competitor’s
ability to interfere with the acquiring firm’s value appropriation and protects the resource from
value erosion. A firm will therefore choose to acquire the property right if the benefits from
owning it outweigh the transaction costs of the exchange. As a consequence, an acquiring firm’s
willingness to pay for a target depends on the potential not only to create but also to appropriate
the value at which owning the property rights on technological knowledge becomes crucial.
Patents and their pre-emptive power will thus extend the bargaining range upwards, which
relieves pressure on the price and may cause it to increase. Based on the above arguments, the
following hypotheses will elaborate on the mechanisms that explain the link between the pre-
emptive power of a target firm’s patents and the price paid by the acquirer for the target.
Hypotheses
The benefits of owning the property rights to technological knowledge and its synergistic
recombination depend directly on the competitive context, since the patent portfolio of
competitors influences the extent to which firms can commercialize their own inventions. Patents
with high pre-emptive power held by competitors can threaten a firm’s value capture for several
reasons. First, competitors can create significant barriers to entry into particular fields of
technology and block other firms from patenting a competing alternative technology. In this
regard, the freedom to operate in R&D becomes restricted by “patent fences” (Ziedonis, 2004).
11

Resource Complementarity and Value Capture
Second, the patents held by competitors can force firms into unfavorable licensing negotiations
and cross-licensing agreements in order to obtain the property rights required for
commercialization (Cohen et al., 2000).
As a result, firms might use an acquisition as a means not only to get access to valuable
knowledge and technology but also to access the pre-emptive power of the patent portfolio
associated with the target’s knowledge base (Grimpe and Hussinger, 2008). The price that the
acquirer is willing to pay for the target can be expected to increase with the pre-emptive power
of its patents for two reasons. On the one hand, owning the property rights to technological
resources ensures their inimitability on legal grounds. By their very definition, patents are
temporary monopoly rights that prevent the resource value from eroding (Arrow, 1962). The
higher the pre-emptive power of the patents, the lower the ability of competitors to imitate
valuable technologies and thus the higher the value the firm will be able to capture. On the other
hand, the acquired pre-emptive power facilitates value capture because acquiring firms might be
in a better bargaining position in cross-licensing negotiations. On the basis of the exchange of
licenses, the acquirer can therefore more easily commercialize inventions and appropriate the
returns from its R&D activities. As a consequence of both arguments, the acquirer will be willing
to pay a higher price for the target. Even if the acquired patents are not essential for the
acquirer’s commercialization activities, patents with high pre-emptive power allow the acquirer
to capture value since they may be sold or licensed-out after the transaction. As a result, our first
hypothesis reads:
Hypothesis 1: There is a positive relationship between the pre-emptive power of the target firm’s
patent portfolio and the price paid for the target by the acquiring firm.
12

Resource Complementarity and Value Capture
Besides the main effect of the pre-emptive power on the acquisition price, we suggest that two
factors may particularly influence the value of pre-emptive patents for an acquirer: the acquirer’s
own technology intensity and the relatedness between the acquirer’s and the target’s technology
portfolios. In that sense, we expect the technology intensity of the acquirer to have a positive
moderating effect on the relationship between the target’s pre-emptive power and the acquisition
price. The main reason for this expectation is that value creation in technology-intensive firms
relies on technological innovation. These firms are more dependent on their R&D investments,
which are basically irreversible and sunk. Moreover, R&D projects are typically long-term
commitments that involve technology and market related risks and hence have an uncertain
outcome (Oriani and Sobrero, 2008). Since the potential for value erosion is consequently higher,
the costs of being blocked or locked-in by competitors are likely to increase with the firm’s
technology intensity. Technology-intensive firms have higher incentives to protect their own
ongoing R&D activities by erecting a patent fence of potential substitute patents (Ziedonis,
2004), either by filing those patents themselves or by means of the acquisition. In that sense, the
expected value capture from the acquired pre-emptive patents is highest when the acquirer’s
technology intensity is high since firms avoid the erosion of the value created through
innovation. Thus, we propose:
Hypothesis 2: The impact of the pre-emptive power of a target firm’s patent portfolio on the
price paid for the target by the acquiring firm increases with the acquiring firm’s technology
intensity.
Finally, we suggest that the relatedness of technologies matters for the value of a target’s pre-
emptive power for an acquiring firm. Recall that prior literature suggests that value creation
through complementarity results from a moderate degree of relatedness between the acquirer’s
13

Resource Complementarity and Value Capture
and target’s knowledge bases (Ahuja and Katila, 2001; Cassiman et al., 2005; Cloodt et al.,
2006). The absorptive capacity argument (Cohen and Levinthal, 1990) states that the more
related the knowledge bases are, the more easily acquired technology can be integrated and
commercialized. Similarity facilitates the integration of new knowledge because both the
acquirer and the target firm share skills, languages, and cognitive structures that allow firms to
learn from each other (Kogut and Zander, 1992; Makri et al., 2010). Integrating related
knowledge thus creates value for two reasons. First, it allows firms to apply the acquired
knowledge to old problems or a combination of acquired and existing knowledge to those
problems. Second, it enables firms to search for and absorb additional knowledge from the
environment (Cohen and Levinthal, 1990). However, these benefits only materialize if the
relatedness between the acquirer’s and target’s knowledge bases is not too high because the
opportunities to learn decrease with increasing relatedness after a certain point (Ahuja and
Katila, 2001).
While these arguments provide useful guidance for value creation, relatedness is likely to
play a different role when the pre-emptive power of the target’s patents is considered. We
suggest that the value captured by the acquirer is likely to increase monotonically with the
relatedness to the target firm’s patents. Acquiring firms benefit from higher relatedness because
the acquired pre-emptive power creates a patent fence directly around the firm’s own R&D
activities. In that sense, it helps to protect the firm’s sunk investments in R&D, to secure the
firm’s freedom to operate in R&D, and to exclude competitors from certain technological spaces.
Hence, increasing relatedness reduces the threat of value erosion. Moreover, firms may want to
acquire highly related patents with high pre-emptive power in order to unlock an existing patent
fence that hinders the acquirer’s value appropriation. As a result, such an acquisition would
14

Resource Complementarity and Value Capture
enable the acquirer to continue or expand ongoing R&D work (Graff, Rausser, and Small, 2003)
and to unlock the complementarity effects that represent the gains from trade in SFM. The value
that the acquirer may be able to capture by combining its own knowledge base with the pre-
emptive power of the patents held by the target firm is consequently highest if the technology
and patent portfolios are highly related or even largely overlapping in technology space.
Although a single acquisition may not be sufficient to rule out the threats imposed by the patent
positions of competitors, the acquirer can still expect to capture a higher share of value if it
succeeds in acquiring highly related patents with high pre-emptive power. Hence, our final
hypothesis reads as follows:
Hypothesis 3: There is a positive linear relationship between the relatedness of the acquiring
firm’s knowledge base and the pre-emptive power of the target firm’s patent portfolio and the
price paid for the target by the acquiring firm.
METHODS
Data
We use data from the M&A database ZEPHYR, which is published by Bureau van Dijk.
ZEPYHR is one the most comprehensive databases of deal information, covering more than
900,000 worldwide transactions since 1996. Deals were selected on the basis of the following
criteria: First, we restricted the sample to majority acquisitions in the period from 1997 to 2010.3
Although the acquisition of a minority share might offer the acquirer significant influence on the
3 The year 1996 was excluded because Bureau van Dijk cautions against a limited coverage of transactions during ZEPHYR’s first year of existence.
15
Resource Complementarity and Value Capture
target, only majority acquisitions in which the acquirer takes control over the target will provide
the acquiring firm with the opportunity to combine and integrate the acquired technology.
Second, we excluded deals in which either the acquiring or the target firm were located outside
Europe. This restriction is necessary because of our choice to use patent data from the European
Patent Office (EPO), which will be explained in further detail below.4 Third, we restrict the
sample to deals in which both the acquiring and the target firm are affiliated with an industry
classified as technology or knowledge intensive by Eurostat, the statistical office of the European
Union5, since knowledge and patented technology are essential for firm success in these
industries (Hitt et al., 2006). Finally, we excluded transactions for which either multiple
acquirers or targets were listed because the complexity of such deals might confound the effects
measured.
Our sample is complemented with balance sheet data for the acquirer and target firms
from Bureau van Dijk’s AMADEUS database. Moreover, we linked the firms to their patent
filings at the European Patent Office using the PATSTAT database and the OECD patent citation
database. On the basis of a computer-supported, text-based search algorithm, firms and granted
patents were linked to each other using firm names and addresses in both databases. Each
potential match proposed by the search engine was checked manually. It turns out that not all
firms involved in the transactions possess patents. Restricting the sample to those transactions
with patents involved, i.e. in which either the acquirer or the target have a patent, results in a
final sample of 1428 transactions.
4 There may be a home bias in patenting as firms are more likely to apply for patents at the patent office of their home country rather than at other patent offices (Dernis and Khan, 2004).
5 See http://epp.eurostat.ec.europa.eu/cache/ITY_SDDS/Annexes/htec_esms_an3.pdf
16

Resource Complementarity and Value Capture
Measures
Dependent variable
The dependent variable is the price paid by the acquirer for the target firm. Following Barney
(1988), the price p(T) approximates the value of the target when it is combined with the bidding
firm. In this regard, the price reflects the acquiring firm’s expectations of resource
complementarity. Under the condition of heterogeneous resource complementarity across
potential bidding firms, the firm with the highest expected resource complementarity can outbid
other firms and acquire the target. Since the variable is highly skewed, we take its natural
logarithm.
Explanatory variables
Our hypotheses build on the pre-emptive power of a target firm’s patent portfolio. Disentangling
the pre-emptive power of a patent portfolio from a firm’s knowledge base is difficult since a
patent reflects not only an intellectual property right over an invention but also the fact that new
knowledge has been generated as the outcome of an R&D investment. Some authors have used
subjective survey data to identify pre-emptive patenting (e.g., Ceccagnoli, 2009). Our
identification relies instead on detailed information available from the patent examination
process at the EPO. Specifically, we exploit the fact that patent applications must acknowledge
“prior art”, in which light they need to meet the requirements for patentability, i.e. they are novel
enough, involve an inventive step, and are susceptible to industrial application (Harhoff, Hoisl,
and Webb, 2005). There is ample empirical evidence that prior art that receives a large number
of citations in patent applications (“forward citations”) is technologically more important and
also economically more valuable (e.g., Trajtenberg, 1990; Harhoff et al., 1999; Hall, Jaffe, and
17

Resource Complementarity and Value Capture
Trajtenberg, 2005). Recent contributions in the literature on patent indicators have suggested that
the examination process at the EPO allows a closer look at those patent citations (e.g., Harhoff
and Reitzig, 2004; Grimpe and Hussinger, 2008; Guellec et al., 2012). In other words,
information from the EPO can be used in order to determine why a particular patent has been
cited in a patent application. The information stems from a so-called “search report”, prepared by
a patent examiner for each EPO patent application, which lists all important documents that are
considered to be prior art. The search for prior art follows the Guidelines for Examination in the
European Patent Office6 in order to ensure that each patent application is scrutinized under the
same quality standards. Patents are generally cited because they affect the patentability of new
inventions (Harhoff et al., 2005), but the information in the search report allows a distinction
between conflicting and relevant non-infringing prior art (Michel and Bettels, 2001). Conflicting
prior art threatens the novelty requirement of the patent application while other relevant prior art
provides the non-infringing state of the art in the respective field of technology.
In this regard, a reference to prior art is marked with an “X” in the search report if the
invention in question cannot be considered to be novel or cannot be considered to involve an
inventive step when the referenced document is taken into consideration. References are marked
with a “Y” if the invention cannot be considered to involve an inventive step when the
referenced document is combined with one or more other documents of the same category in a
combination obvious to a person skilled in the art (Harhoff et al., 2005; Guellec et al., 2012). A
patent application can still be granted (although this is less likely) if it has some references
classified with an X or a Y. This can be the case for patent applications with several claims. XY-
6 See http://www.epo.org/law-practice/legal-texts/guidelines.html
18

Resource Complementarity and Value Capture
type references may only pertain to single claims and the remaining claims can be strong enough
to get a (modified) application granted. In a similar vein, references are marked with an “A” if
the cited patents define the state of the art in a technology field but do not threaten the novelty of
the patent application. Prior art receiving A-type references are key contributions in a certain
technology field and constitute the basis for future inventive activity (Harhoff et al., 2005;
Guellec et al., 2012). Hence, XY-type references refer to conflicting prior art while A-type
references indicate relevant prior art. On the basis of the list of prior art summarized in the search
report a decision is made as to whether a patent application is novel enough and involves an
inventive step so that it can be granted.
Figure 1 provides a highly simplified overview of this procedure. We assume that patents
A, B, and C are held by a potential target firm. All three patents are cited by an incoming patent
application D as prior art. In the example, the reference to patent A was made by the applicant
while the references to patents B and C were added by the patent examiner. In contrast to the
procedure at the United States Patent and Trademark Office (USPTO), most references (about 90
percent) for EPO patent applications are added by the patent examiner rather than by the
applicant (Criscuolo and Verspagen, 2008). In the search report, the patent examiner evaluates
the importance of prior art for a particular claim by assigning a code letter X, Y, or A (for a full
description see Harhoff et al., 2005).7
7 An example of this is a patent application filed in 1994 by IBM (application no. EP19940105877). In the search report, the patent examiner lists Motorola’s patent no. EP1989113865 and assigns an X-type reference to the first claim in IBM’s application and a Y-type reference to claims 2 through 12. In his letter to the applicant, the examiner explains that, in the light of Motorola’s patent, IBM’s application does not appear to involve an inventive step. In its reply to the patent office, IBM suggests new claims and declares that they were delimited with regard to Motorola’s patent. Although IBM’s application was eventually granted, it had to be limited in scope, offering less protection for the applicant. Another example is IBM’s application no. EP2000114376, which cites Motorola’s patent filing no. EP1996102457. The examiner classifies this reference, which pertains to most of the 74 claims, as a Y-type. As the applicant did not submit a revised application, the application was deemed withdrawn
19

Resource Complementarity and Value Capture
[Insert Figure 1]
In order to determine the pre-emptive power of the target firm’s patent portfolio, we take the
stock of XY-type citations that the target’s patent portfolio receives as a share of the total citation
stock.8 Citation stocks are calculated in analogy to the patent stock (see equation (1) below). We
only consider citations that a patent receives in a five-year window after it has been granted as is
common in the literature (e.g., Makri et al., 2010).9 XY-type citations provide direct evidence
that claims in patent applications were actually blocked by the target firm’s patents because they
invalidated the novelty or inventiveness of the claims. Guellec et al. (2012) show that
applications citing prior art classified as an XY-type have a significantly lower likelihood of
being granted than those citing an A-type prior art. Such applications are also more often
withdrawn by the applicant before the EPO has made a decision. They conclude that XY-cited
patents exhibit higher pre-emptive power than other patents. Moreover, they find that those
patents contribute little to the state of the art, indicated, for example, by a lower number of
claims made, fewer inventors involved, a higher number of self-citations, and a higher number of
citations made by themselves (“backward citations”) (Gambardella, Harhoff, and Verspagen,
by the EPO and hence failed. The search report also lists patent no. EP1993480143, which was filed by IBM itself. The reference to this patent, which pertains to all 74 claims, is classified as an A-type. The examiner does not believe that this patent threatens the application. Instead, the reference is necessary to understand the technical background and state of the art. Hence, we can conclude that Motorola’s patents had pre-emptive power that limited the patentability of subsequent patent applications. The patent history, including all communications between the EPO and the applicant, is available from the European Patent Register (http://register.epo.org).
8 Patents can receive both XY-type and A-type citations (as well as other citations, see Harhoff et al., 2005, for details), although this is less frequent. In other words, cited patents can be both conflicting and relevant prior art to different or even the same claims in applications. For this reason, it would be inappropriate to take the number of “pre-emptive patents” held as a measure of pre-emptive power since all patents have varying degrees of pre-emptive power. Instead, we focus on the number of XY-type citations that an entire patent portfolio receives.
9 Patent equivalents, i.e. if a particular invention is patented at two different patent offices, are taken into account. If patent equivalents were ignored, the number of forward citations a patent receives would be significantly underestimated (Harhoff et al., 2005).
20
Resource Complementarity and Value Capture
2008). In fact, several recent contributions use XY-type citations as indicators of pre-emptive
patenting (e.g., Harhoff and Reitzig, 2004; Harhoff, von Graevenitz, and Wagner, 2008). To sum
up, the pre-emptive power of a patent portfolio, as evidenced by XY-type citations, can be
characterized as a separate value component in addition to the actual technological value of the
knowledge base.
Technology intensity of the acquirer. We assume that firms with higher technology intensity can
be characterized by a higher number of patents employed in relation to their total assets.
Consequently, we calculate the patent stock PS of the acquiring firm as follows:
ttt patentsgrantedPSPS +−= − )1(1 d (1)
where t refers to the year prior to the acquisition and δ is a constant knowledge depreciation rate
of δ=15 percent to weight the importance of older patents as is standard in the literature (e.g.,
Hall, 1990). The patent stock is then divided by the firm’s total assets (in millions of Euros). To
test hypothesis 2, we create an interaction term between the target’s pre-emptive power and the
acquirer’s technology intensity.
Technological relatedness. Our measure of relatedness is based on the proximity measure
introduced to the patent literature by Jaffe (1986). It captures the extent to which two firms
develop technology in the same classes. We use the International Patent Classification (IPC) to
define the distribution of the targets’ and acquirers’ patents across different technology areas.
21

Resource Complementarity and Value Capture
Following recent literature, we use the three-digit IPC level (Makri et al., 2010)10 and generate
one patent stock measure per three-digit IPC class on the basis of equation (1). Equation (2)
below provides the definition of the relatedness measure. Relatedness is defined as the angular
separation of the patent class distribution vectors F of the acquirer j and the target firm i. The
technology vectors F for each target i and acquirer j can be interpreted as their technology
portfolio. We use these vectors as a percentage of the total patent stock in order to leave out
patent portfolio size differences between the target and acquirer patent portfolios. In technical
terms the relatedness measure T equals the scalar product of these vectors normalized by their
scalar products with themselves, so that the measure takes the value of one for any two identical
technology vectors:
1000;100)')('(
≤≤×= ijjjii
jiij T
FFFFFF
T (2)
where zero represents no overlap of the firms’ patent portfolios and a value higher than zero
indicates some overlap.
To test hypothesis 3, we calculate the relatedness measure on the basis of the two
different patent portfolio components. Following on from the above discussion, the relatedness
measure is applied to the target’s patents cited as pre-emptive (XY-type) and to the acquirer’s
patents cited as contributing to the state of the art (A-type). We use fractional counting in case a
patent is cited as both an XY- and an A-type. We refer only to the acquirer’s A-type cited patents
10 Since the IPC is a hierarchical system, the first digit is the section symbol, followed by two digits that denote the class. The one-digit technology class C, for example, refers to chemistry, and the subclass C07 denotes organic chemistry while subclass C08 stands for organic macromolecular compounds. See the classification published by the World Intellectual Property Organization (WIPO), http://www.wipo.int/classifications/ipc/en/.
22

Resource Complementarity and Value Capture
since those patents have been cited as presenting the state of the art in a field of technology
(Guellec et al., 2012). In other words, those patents actually represent the technological “quality”
of a firm’s knowledge and technology base. We use the relatedness measure in a linear and a
squared term and expect only the linear term to become significant in the regression.
Control variables
We control for a number of factors that may affect the price paid for the target firm. First, we
include the total patent stock of the target firm normalized by the target’s total assets (in millions
of Euros) to control for the extent that knowledge is protected through patents by the target. The
patent stock is calculated on the basis of equation (1). Since the value of patents is highly skewed
(Harhoff et al., 1999), we control for the value of those patents by including the stock of forward
citations the target’s patents received in a five-year window after the grant. As the number of
citations a firm receives is highly correlated with its patent stock, we divide the citation stock by
the target’s patent stock. The models testing hypothesis 3 also include a linear and a squared
term of the relatedness measure. In one specification, the measure is based on both the acquirer’s
and the target’s patent portfolios; in a second specification, it is based on both firms’ A-type
cited patents. This enables us to compare our results with prior literature that found an inverse U-
shaped relationship for the relatedness between the acquiring and target firms’ knowledge bases
(Ahuja and Katila, 2001).
Regarding the non-technological assets, we include the total assets of the target (in
millions of Euros) to control for its size. Moreover, we include the target’s return on assets,
defined as the sum of profits earned by the firm and the capital gains of assets over total assets,
as well as its financial leverage measured as liabilities over total assets. As the variable for
23

Resource Complementarity and Value Capture
liabilities is missing in some cases, we include a dummy variable that takes a value of one in the
case of missing liabilities and zero otherwise. Liabilities are set to zero if missing. Further, we
include the target firm’s age measured in years.
Our model further includes a dummy variable that takes the value of one if both the
acquirer and the target are in the same two-digit NACE industry class.11 To control for
differences between domestic and international transactions we include a dummy variable that
takes a value of one in the case of a cross-border deal. Finally, we control for time effects by
including year dummies for the years from 1997 to 2009, with 2010 being the reference
category, and we include six industry dummies for the target, which are defined on the basis of
the Eurostat industry aggregation according to the technology intensity of the sector: high-tech,
medium high-tech, medium low-tech, and low-tech manufacturing, as well as knowledge-
intensive and low knowledge-intensive services. High-tech manufacturing is the reference
category in our estimations. All explanatory and control variables refer to the year prior to the
completion of the acquisition to control for potential endogeneity.
Model
We follow Hall et al. (2005) and estimate a market value function with separable components of
the total value. In our case, the value of a target firm is a function of its technological and non-
technological assets, the complementarity between the acquirer’s and the target’s resources, and
other transaction-specific controls. Patents, citations, and the type of citations are used as
11 NACE stands for “Nomenclature statistique des activités économiques dans la Communauté européenne” and is a European industry standard classification system consisting of a six-digit code. It is similar in function to the SIC or NAICS systems.
24

Resource Complementarity and Value Capture
cascading indicators of the value of the technological assets, “each adding further information on
top of what could be predicted on the basis of the previous indicator” (Hall et al., 2005: 27). For
this reason, we use the target’s patent stock over total assets, the citation stock over the patent
stock, and the stock of XY-type citations over the citation stock in our model specification to
account for the target’s technological assets. Using such cascading indicators also avoids
collinearity problems. Since the price paid by the acquirer is a continuous variable, our model
can be estimated by ordinary least squares (OLS). Besides the baseline model, which only
includes the control variables, we use several specifications to test our hypotheses.
RESULTS
Descriptive statistics
Table 1 presents summary statistics. The average acquisition price equals 458 million Euros
while the average total assets of the target are 684 million Euros. Target firms have an average
patent stock of 3.49 patents, compared to the almost 50 patents that the acquirers hold. On
average, the targets’ patent stock receives 0.86 citations within a five-year window after being
granted. With regard to the relatedness variables we find that our sample is quite balanced. On
average, deals show the same average relatedness for the knowledge base and the pre-emptive
power.12 Moreover, it turns out that 43 percent of the transactions in the subsample of deals are
international transactions and 45 percent of the transactions occur in the same industry. Target
firms are on average 34 years old, indicating that our sample is not dominated by young,
12 Note that the relatedness of the technology portfolios is, on average, quite low. This is due to the choice of the three-digit IPC level to calculate this measure.
25

Resource Complementarity and Value Capture
innovative start-up companies that get acquired soon after inception. Interestingly, target firms
on average exhibit a negative return on assets. There are no indications of collinearity problems
in our data as evidenced by the rather low correlations among the explanatory variables.
[Insert Table 1]
Multivariate analysis
Table 2 shows the results of the OLS estimation in three different model specifications to test our
hypotheses. The first specification serves as a benchmark model to show the effects of the firm
and transaction characteristics and the technology measures, our control variables, on the
acquisition price. The estimated coefficients largely show the expected signs. Regarding the non-
technology variables, we find a positive effect of the target firm’s total assets, return on assets,
and age on the acquisition price. The effect of the return on assets intuitively makes sense, as
more profitable targets provide more opportunities to recover the acquisition price. The positive
age effect can be interpreted as the value of the target firm’s goodwill, market access, reputation,
etc. which have been developed over time. As expected, the acquisition price decreases the
higher the financial leverage of the target firm. Furthermore, cross-border acquisitions turn out to
be more expensive than domestic acquisitions, suggesting that the acquirer is paying a higher
price to gain access to a foreign market. There is no significant effect for intra-industry
takeovers. With regard to the technology control variables, it turns out that the patent stock over
assets has a negative effect. This result might seem counterintuitive but the variable for the
technological value of patents, as measured by the number of citations received over the patent
stock, suggests a positive effect of high quality patents on the price paid, as suggested in the
literature (Harhoff et al., 1999). This finding might also be related to the fact that an acquirer is
26
Resource Complementarity and Value Capture
more likely to choose market-based solutions like (cross-)licensing and trading patents with a
target holding a large patent portfolio rather than choosing an acquisition (Graff et al., 2003).
Finally, while the year dummies are jointly significantly different from zero, as LR-Chi2 tests
show, the industry dummies are not. This finding suggests some changes in target valuation over
time, as would be expected from casual observation of the stock market. The effects of the
control variables are consistent across all specifications.
Model 2 includes our measure of the pre-emptive power of the target’s patent portfolio.
We find a strong positive effect, i.e. the pre-emptive power impacts significantly on the
acquisition price, and we can thus confirm the first hypothesis. Model 3 includes the acquirer’s
technology intensity, measured as the acquirer’s patent stock over total assets, as well as the
interaction term with the target’s pre-emptive power. While the acquirer’s technology intensity
does not in itself have an effect on the acquisition price (as expected), we find a strongly
significant and positive interaction effect. This finding indicates that the higher the acquirer’s
technology intensity, the more valuable the target’s pre-emptive power. Hence, we can confirm
the second hypothesis.
[Insert Table 2]
Model 4 includes the non-differentiated relatedness measure based on the entire patent portfolio
of the acquirer and the target firm as well as its squared term. We find an inverse U-shaped
relationship between the degree of technological relatedness and the acquisition price, which
suggests that the acquisition price can be regarded as an indication of the value that the acquiring
firm expects to create through innovation (Barney, 1988). Model 5 is used to test hypothesis 3.
The measure of the relatedness of the technology portfolios is now differentiated according to the
27

Resource Complementarity and Value Capture
two different types of citations that the acquirer’s and the target’s patent portfolios have
received. Our results substantiate the inverse U-shaped relationship for the relatedness between
the patent portfolio components that actually measure the technological value of the patents, i.e.
the A-type cited patents. Apparently, value creation expected by the acquirer increases up to a
certain point of relatedness of the technology portfolios and decreases if relatedness becomes too
high. When the relatedness between the A-type cited patents of the acquirer and the XY-type
cited patents of the target (i.e. its pre-emptive power) is considered, it turns out that the
relationship increases monotonically. Hypothesis 3 thus receives support. This finding suggests
that the value of the pre-emptive power of the target’s patents in fact increases with increasing
relatedness to the acquirer’s patent portfolio and is not subject to decreasing value if relatedness
becomes too high. In that sense, the inverse U-shaped relationship requires an important
qualification, depending on whether the technological value or the pre-emptive power of the
target’s patent portfolio is considered. The different estimated effects found for A-type and XY-
type citations in terms of relatedness are depicted in Figure 2.13
[Insert Figure 2]
13 To further analyze the inverse U-shaped relationships found in both model 4 and model 5 we conduct simple slope analyses and additional robustness tests (Aiken and West, 1991; Cardinal, Miller, and Palich, 2011). The turning point lies within the data range for each model. Further, the inverse U-shape is not driven by our choice of functional form for the variable of interest. Alternative specifications using dummy variables as well as the polynomial series of the variable of interest support an inverse U-shaped relationship. While the inverse U-shaped relationship receives strong support for model 5, it finds less support for model 4. This is to be expected because model 5 disaggregates the relatedness measure from model 4 and finds both a squared and a linear effect if different patent portfolio components are considered. Moreover, the results for our main variables persist if we run the regression with a limited set of control variables. Hence, there are no suppression or enhancement effects due to our control variables. All additional analyses are available from the authors upon request.
28

Resource Complementarity and Value Capture
The two remaining model specifications test for the consistency of the results. In this regard, the
findings show that the linear relationship persists if the squared term of the relatedness measure
is included. Moreover, the findings are consistent when all model variables are included.14
DISCUSSION
Under what conditions do acquiring firms benefit from the acquisition of technology in
an M&A transaction? The answer prior literature has provided centers on the concept of
complementarity, understood as a moderate degree of overlap between the knowledge and
technology portfolios of the acquiring and the target firm (e.g., Ahuja and Katila, 2001; Makri et
al., 2010). Extant SFM theory suggests that firms exhibiting superior complementarity to
resources available on SFM may create a greater surplus than other firms whose resources are
less complementary to those acquired. In that case, acquiring firms can also be guaranteed to
capture at least a part of the value created through complementarity. This conclusion rests on an
implicit, yet important assumption that the research presented here seeks to clarify. We
demonstrate that acquiring firms’ value capture depends on getting access to the relevant
property rights. In that sense, we argue that extant literature has largely overlooked the fact that
the pre-emptive power of an acquired firm’s patent portfolio associated with its knowledge base
can be an important source of value. While acquiring firms can create value through acquired
technology moderately related to the firm’s own technology, because such a combination drives
14 Our analysis implicitly assumes that it matters whether the acquirer or the target owns the patents with pre-emptive power that the other party is interested in. However, one could also argue that the suggested relationships hold in a reciprocal way, i.e. combining an acquirer’s pre-emptive power with a target’s knowledge base allows the merged entity to capture value in a similar way to the reverse situation. However, our results, which are available from the authors upon request, show that this is not the case. We attribute this finding to the fact that pre-emptive power also conveys bargaining power, which renders other solutions like licensing or the sale/acquisition of patents more attractive to a potential acquirer (Graff et al., 2003). Consequently, we would not observe an acquisition in our data. We thank an anonymous reviewer for this remark.
29

Resource Complementarity and Value Capture
innovation performance, our research suggests that capturing the benefits of complementarity
may be difficult, if not impossible, unless the acquirer owns the respective property rights. In that
sense, it is the target’s pre-emptive power that allows the acquirer to capture value.
Our findings support this hypothesis. We find that acquirers are willing to pay a higher
price for the target’s pre-emptive power since they expect to capture a higher share of the value
created. Pre-emptive patents are therefore not attractive because they allow firms to learn but
because they can be used to threaten competitors in technology areas and to secure market
exclusion and the acquirer’s freedom to operate in R&D. Moreover, these patents might help
firms to unlock an existing patent fence that hinders the acquirer from commercializing its own
technology. The expected value capture is particularly high when acquirers are technology
intensive and when the target’s pre-emptive power is highly related to the acquirer’s knowledge
base. In that sense, our research disentangles the pre-emptive power of a firm’s patent portfolio
from its knowledge base and reveals the conditions under which an acquisition of technology
serves not only a value creation but also a value capture motive. These findings have
implications for both management practice and research.
Implications for management practice
Prior research on technology acquisitions argues that acquiring firms should “search for, identify,
and acquire businesses that have scientific and technological knowledge that is complementary
to their own” (Makri et al., 2010: 620). While this finding is undisputed, it requires qualification
to reflect corporate reality. Firms also need the ability to capture the value they create (Saloner,
Shepard, and Podolny, 2001). It is equally important for firms to understand the conditions under
which the acquisition of technology helps to capture value by exploiting the target firm’s pre-
30

Resource Complementarity and Value Capture
emptive power on the acquirer’s resources and knowledge base. The findings suggest that a firm
might miss significant value capture opportunities that stem from acquiring related patents with
high pre-emptive power if an overly strong focus is put on the opportunities for learning and
cross-fertilization. Our results imply that a more nuanced understanding of the sources of value
is required in order to identify value creation and value capture opportunities for acquiring firms.
The analysis also implies that firms need to keep a careful eye on the key technologies in
their industry and identify the associated intellectual property rights. M&A transactions may not
only lead to a concentration of market power in product markets but also to a concentration of
patents with high pre-emptive power that threaten a firm’s freedom to operate in R&D and, as a
consequence, its value capture opportunities. As a response, firms should license-in potentially
critical patents before a change in ownership occurs through M&A.
Implications for research
Our research underlines that a patent portfolio not only provides an observable indicator of a
firm’s technological capabilities (Henderson and Cockburn, 1994; Adegbesan and Higgins,
2010) but that it also holds pre-emptive power. In this regard, the pre-emptive power of a patent
portfolio constitutes a source of value in itself that is distinct from the value of the firm’s
knowledge base. Hence, we contribute to research on value appropriation, which has remained a
relatively understudied area in the RBV (Coff, 1999; Barney, 2001). We also contribute to SFM
theory by clarifying an implicit, yet important assumption regarding the appropriation of value in
the presence of heterogeneous resource complementarity. Since many firms are active in SFM
where acquiring firms differ in their complementarity to target resources, SFM theory argues that
those firms that display superior complementarity can be guaranteed a minimum level of value
31

Resource Complementarity and Value Capture
appropriation (Adegbesan, 2009). This reasoning overlooks the fact that firms might not possess
the property rights necessary to commercially exploit resource complementarities and hence to
capture the value created. In that sense, we extend SFM theory by incorporating insights from
property rights economics, which has been argued to enrich research in the broader context of the
RBV (Foss and Foss, 2005). Furthermore, our research sheds new light on a common belief in
the strategy literature that inimitable and non-substitutable resources protect firms’ ability to
appropriate value from such resources (Barney, 1991). In fact, superior complementarity to
resources on SFM may be perfectly inimitable and non-substitutable by competitors, but firms
may still be hindered from capturing value because competitors possess essential property rights.
In that sense, we underline that the protection of resource value goes beyond making resources
difficult to imitate and substitute by competitors. We show that a firm’s decision making on the
acquisition price takes exactly this into account in that the price paid for an acquisition target is
driven by the acquirer’s expectation to both create and capture value. Our research thus also
shows that property rights on resources may be a second source of value that extant theoretical
and empirical literature on SFM has failed to document.
Since patents represent both the successful outcome of an R&D investment and an
intellectual property right to exclude third parties from the commercialization of an invention, a
major challenge lies in the identification of a patent portfolio’s pre-emptive power as a separate
value component in addition to the technological value of the underlying knowledge. The
application of new measures presented here informs future research that aims at uncovering the
components leading to value creation and value capture. The measures build on unique
information available from the patent examination procedure at the EPO (Guellec et al., 2012).
In that regard, the measures can be used in research to gain an overview of “who competes with
32

Resource Complementarity and Value Capture
whom” in technology areas. Compared to alternative measures of competition and infringement
in technology markets, such as litigations and oppositions15 (only at the EPO), XY-type citations
occur at a much earlier stage of the patenting procedure, i.e. after the patent application.
Significant opposition costs, consisting largely of lawyers’ salaries, and much higher litigation
costs (Harhoff and Reitzig, 2004) lead to a low opposition rate and an even lower litigation rate
(Lanjouw and Schankerman, 2001). In fact, it has been shown that oppositions are only a good
measure of competition in some industries (Hall and Harhoff, 2004). Citations at the EPO,
however, are added in the patent examination process and hence potentially infringing patents
can be identified at a very early stage of the patent application procedure, without incurring any
additional costs for the patent holder or potential infringer.16 In this regard, XY-type citations
can also be used by competition authorities to evaluate the concentration of pre-emptive power in
technology markets. While the pre-emptive use of patents has received special attention in the
clearance of Google’s acquisition of Motorola by both the U.S. and European competition
authorities, there does not yet seem to be any systematic approach towards competition issues in
technology fields.17
15 Oppositions constitute patent validity claims before court. They are not as costly for the opponents as litigations (Hall and Harhoff, 2004).
16 Hall and Harhoff (2004) show that patent applications with more patent references to prior art threatening their novelty are more likely to be opposed after being granted.
17 See an interview with Joaquin Almunia, Vice President of the European Commission and Commissioner for Competition, on the Motorola acquisition and the pre-emptive use of patents: http://www.vieuws.eu/issues/1-eu-competition/15-eu-competition/287-exclusive-interview-with-commissioner-for-competition-almunia-on-ipr-patents/
33

Resource Complementarity and Value Capture
CONCLUDING REMARKS
Our research draws on a comprehensive longitudinal dataset of 1428 firm acquisitions in Europe
during the 14-year period from 1997 to 2010 to investigate the conditions under which
technology acquisitions allow firms to create and capture value. Nevertheless, we need to
acknowledge several limitations. First, patent-based measures are subject to industry differences
in the likelihood of patenting. Some industries exhibit a higher fraction of unpatented inventions
than other industries (Mansfield, 1986), although the importance of patenting has grown rapidly
in many industries in recent years, including industries outside the manufacturing sector (Makri
et al., 2010). Second, the measures to identify the technological value of the knowledge base and
the pre-emptive power of patent portfolios can only be applied to EPO patents as the EPO
publishes an examination report indicating the importance of references to patented prior art.
Third, in this study we cannot account for the fact that acquiring firms might aim at the pre-
emptive power of a target firm’s patent portfolio because of an existing patent fence that the
acquirer wants to unlock or because the acquirer wants to pro-actively threaten other firms’
technology development activities in a certain technology area. However, this distinction is
likely to be best analyzed through case studies as an in-depth knowledge of the technologies
involved is required. Overall, this study suggests that future research should further explore the
different sources of value in technology acquisitions to overcome the rather narrow focus prior
literature has put on investigating the opportunities for learning and cross-fertilization. In a
bidding contest, potential acquirers might actually ascribe much higher value to the pre-emptive
power of a target’s patents.
34

Resource Complementarity and Value Capture
ACKNOWLEDGEMENTS
We thank Juan Alcacer, Oliver Alexy, Rene Belderbos, Kevin Boudreau, Bruno Cassiman, Paola Criscuolo, Bronwyn Hall, Dietmar Harhoff, Keld Laursen, Michael Leiblein, Sebastian Pacher, Ammon Salter and Reinhilde Veugelers as well as the editor, Richard Bettis, and two anonymous reviewers for valuable comments and discussions. Moreover, we thank Thorsten Doherr for data support.
REFERENCES
Adegbesan JA. 2009. On the Origins of Competitive Advantage: Strategic Factor Markets and Heterogeneous Resource Complementarity. Academy of Management Review 34(3): 463-475.
Adegbesan JA, Higgins MJ. 2010. The Intra-Alliance Division of Value Created through Collaboration. Strategic Management Journal 32: 187-211.
Ahuja G, Katila R. 2001. Technological Acquisitions and the Innovation Performance of Acquiring Firms: A Longitudinal Study. Strategic Management Journal 22(3): 197-220.
Aiken LS, West SG. 1991. Multiple Regression. Testing and Interpreting Interactions: Newbury Park et al.
Alchian AA, Demsetz H. 1973. The Property Rights Paradigm. Journal of Economic History 33: 16-27.
Arrow KJ. 1962. Economic Welfare and the Allocation of Resources for Invention. In RR Nelson (Ed.), The Rate and Direction of Inventive Activity: Economic and Social Factors: Princeton, NJ: 609-625.
Barney JB. 1986. Strategic Factor Markets. Expectations, Luck, and Business Strategy. Management Science 32(10): 1231-1241.
Barney JB. 1988. Returns to Bidding Firms in Mergers and Acquisitions: Reconsidering the Relatedness Hypothesis. Strategic Management Journal 9: 71-78.
Barney JB. 1991. Firm Resources and Sustained Competitive Advantage. Journal of Management 17(1): 99-120.
Barney JB. 2001. Resource-Based Theories of Competitive Advantage: A Ten-Year Retrospective on the Resource-Based View. Journal of Management 27(6): 643-650.
Blind K, Cremers K, Müller E. 2009. The Influence of Strategic Patenting on Companies' Patent Portfolios. Research Policy 38(2): 428-436.
Brandenburger AM, Stuart H, W. 1996. Value-Based Business Strategy. Journal of Economics and Management Strategy 5(1): 5-24.
Cardinal LB, Miller CC, Palich LE. 2011. Breaking the Cycle of Iteration: Forensic Failures of International Diversification and Firm Performance Research. Global Strategy Journal 1: 175-186.
Cassiman B, Colombo MG, Garrone P, Veugelers R. 2005. The Impact of M&a on the R&D Process. An Empirical Analysis of the Role of Technological- and Market-Relatedness. Research Policy 34: 195-220.
Ceccagnoli M. 2009. Appropriability, Preemption, and Firm Performance. Strategic Management Journal 30(1): 81-98.
35

Resource Complementarity and Value Capture
Cloodt M, Hagedoorn J, van Kranenburg H. 2006. Mergers and Acquisitions: Their Effect on the Innovative Performance of Companies in High-Tech Industries. Research Policy 35: 642-654.
Cockburn I, MacGarvie MJ. 2011. Entry and Patenting in the Software Industry. Management Science 57: 915-933.
Coff RW. 1999. When Competitive Advantage Doesn’t Lead to Performance: The Resource-Based View and Stakeholder Bargaining Power. Organization Science 10(2): 119-133.
Cohen WM, Goto A, Nagata A, Nelson RR, Walsh JP. 2002. R&D Spillovers, Patents and the Incentives to Innovate in Japan and the United States. Resarch Policy 31: 1349-1367.
Cohen WM, Levinthal DA. 1990. Absorptive Capacity: A New Perspective on Learning and Innovation. Administrative Science Quarterly 35(1): 128-152.
Cohen WM, Nelson RR, Walsh JP. 2000. Protecting Their Intellectual Assets: Appropriability Conditions and Why U.S. Manufacturing Firms Patent (or Not), NBER Working Paper: Cambridge, MA.
Conner KR. 1991. A Historical Comparison of Resource-Based Theory and Five Schools of Thought within Industrial Organization Economics. Do We Have a New Theory of the Firm? Journal of Management 17(1): 121-154.
Criscuolo P, Verspagen B. 2008. Does It Matter Where Patent Citations Come From? Inventor Vs. Examiner Citations in European Patents. Resarch Policy 37: 1892-1908.
Czarnitzki D, Hussinger K, Leten B. 2011. The Market Value of Blocking Patent Citations, ZEW Discussion Paper: Mannheim.
Dernis H, Khan M. 2004. Triadic Patent Families Methodology, OECD Science, Technology and Industry Working Papers: Paris.
Foss K, Foss NJ. 2005. Resources and Transaction Costs: How Property Rights Economics Furthers the Resource-Based View. Strategic Management Journal 26: 541-553.
Gambardella A, Harhoff D, Verspagen B. 2008. The Value of Patents. European Management Review 5(2): 69-84.
Graebner M. 2004. Momentum and Serendipity: How Acquired Leaders Create Value in the Integration of Technology Firms. Strategic Management Journal 25: 751-777.
Graff GD, Rausser GC, Small AA. 2003. Agricultural Biotechnology's Complementary Intellectual Assets. The Review of Economics and Statistics 85(2): 349-363.
Grimpe C, Hussinger K. 2008. Pre-Empting Technology Competition through Firm Acquisitions. Economics Letters 100(2): 189-191.
Grimpe C, Kaiser U. 2010. Balancing Internal and External Knowledge Acquisition: The Gains and Pains from R&D Outsourcing. Journal of Management Studies 47(8): 1483-1509.
Guellec D, Martinez C, Zuniga MP. 2012. Pre-Emptive Patenting: Securing Market Exclusion and Freedom of Operation. Economics of Innovation and New Technology 21(1): 1-29.
Hall BH. 1990. The Impact of Corporate Restructuring on Industrial Research and Development. Brookings Papers on Economic Activity 1990: 85-124.
Hall BH, Harhoff D. 2004. Post-Grant Reviews in the U.S. Patent System: Design Choices and Expected Impact. Berkeley Technology Law Journal 19(3): 989-1015.
Hall BH, Jaffe AB, Trajtenberg M. 2005. Market Value and Patent Citations. RAND Journal of Economics(Spring): 16-38.
Harhoff D, Hoisl K, Webb C. 2005. Analysing European and International Patent Citations: A Set of Epo Patent Database Building Blocks, OECD STI Working Paper 2005/9: Paris.
36

Resource Complementarity and Value Capture
Harhoff D, Narin F, Scherer FM, Vopel K. 1999. Citation Frequency and the Value of Patented Inventions. The Review of Economics and Statistics 81(3): 511-515.
Harhoff D, Reitzig M. 2004. Determinants of Opposition against Epo Patent Grants - the Case of Biotechnology and Pharmaceuticals. International Journal of Industrial Organization 22(4): 443-480.
Harhoff D, von Graevenitz G, Wagner S. 2008. Incidence and Growth of Patent Thickets: The Impact of Technological Opportunities and Complexity, CEPR Discussion Paper: London.
Henderson R, Cockburn I. 1994. Measuring Competence? Exploring Firm Effects in Pharmaceutical Research. Strategic Management Journal 15(8): 63-84.
Hitt M, Bierman L, Uhlenbruck K, Shimizu K. 2006. The Importance of Resources for the Internationalization of Professional Service Firms: The Good, the Bad and the Ugly. Academy of Management Journal 49: 1137-1157.
Hitt MA, Harrison JS, Ireland RD. 2001. Mergers and Acquisitions: A Guide to Creating Value for Shareholders. Oxford University Press: New York.
Hitt MA, Hoskisson RE, Johnson RA, Moesel DD. 1996. The Market for Corporate Control and Firm Innovation. Academy of Management Journal 39(5): 1084-1119.
Jaffe AB. 1986. Technological Opportunity and Spillovers of R&D: Evidence from Firms' Patents, Profits, and Market Values. American Economic Review 76(5): 984-1001.
Kogut R, Zander U. 1992. Knowledge of the Firm, Combinative Capabilities and the Replication of Technology. Organization Science 33(3): 383-397.
Lanjouw JO, Schankerman M. 2001. Characteristics of Patent Litigation: A Window on Competition. RAND Journal of Economics 32(1): 129-151.
Lippman SA, Rumelt RP. 2003. A Bargaining Perspective on Resource Advantage. Strategic Management Journal 24: 1069-1086.
Makri M, Hitt MA, Lane PJ. 2010. Complementary Technologies, Knowledge Relatedness, and Invention Outcomes in High Technology Mergers and Acquisitions. Strategic Management Journal 31: 602-628.
Mansfield E. 1986. Patents and Innovation. An Empirical Study. Management Science 32(2): 173-181.
Michel J, Bettels B. 2001. Patent Citation Analysis. Scientometrics 51(1): 185-201. Oriani R, Sobrero M. 2008. Uncertainty and the Market Valuation of R&D within a Real Options
Logic. Strategic Management Journal 29: 343-361. Peteraf MA. 1993. The Cornerstones of Competitive Advantage: A Resource-Based View.
Strategic Management Journal 14(3): 179-191. Rothaermel FT, Boeker W. 2008. Old Technology Meets New Technology: Complementarities,
Similarities, and Alliance Formation. Strategic Management Journal 29(1): 47-77. Saloner G, Shepard A, Podolny J. 2001. Strategic Management. John Wiley and Sons, Inc.: New
York. Teece DJ. 1986. Profiting from Technological Innovation. Implications for Integration,
Collaboration, Licensing and Public Policy. Research Policy 15: 285-305. Trajtenberg M. 1990. A Penny for Your Quotes: Patent Citations and the Value of Innovation.
RAND Journal of Economics 21(1): 172-187. Ziedonis RH. 2004. Don't Fence Me In: Fragmented Markets for Technology and the Patent
Acquisition Strategies of Firms. Management Science 50(6): 804-820.
37

Resource Complementarity and Value Capture
FIGURES
Figure 1: Patent application procedure at the EPO
Figure 2: Estimated effect of the relatedness of acquirer’s and target’s patent portolios
Patent Aof target firm…References to priorart:- …
Patent application D…
References to priorart:- Patent A
(made by applicant)- Patent B
(made by examiner)- Patent C
(made by examiner)- …
Search report bypatent examiner forpatent application D:…Importance of references to prior art:- Patent A: X- Patent B: Y- Patent C: A- …
Novelty requirementsfulfilled?
Patent grantdecision
Patent Cof target firm…References to priorart:- …
Patent Bof target firm…References to priorart:- …
low
high
Pr
edic
ted
acqu
isiti
on p
rice
low high
Relatedness A/A Relatedness A/XY
38

Resource Complementarity and Value Capture
TABLES
Table 1: Summary statistics
Mean St.dev. 1* 2 3 4 5 6 7 8 9 10 11 12 13 1 Acquisition price (M EUR) 457.84 2034.72 1.00 2 Target total assets (M EUR) 684.34 2380.88 0.36 1.00 3 Target patent stock/total assets 0.07 0.14 -0.09 -0.06 1.00 4 Target citation stock/patent stock 0.86 1.80 0.13 0.11 0.15 1.00 5 Target XY-citation stock/citation stock 0.05 0.14 0.13 0.11 0.13 0.37 1.00 6 Relatedness all patents 1.86 8.77 0.09 0.03 0.02 0.18 0.12 1.00 7 Relatedness A-cited/A-cited patents 0.74 2.19 0.18 0.07 0.05 0.31 0.16 0.22 1.00 8 Relatedness A-cited/XY-cited patents 0.74 2.41 0.16 0.06 0.03 0.15 0.25 0.25 0.63 1.00 9 Cross-border acquisition (d) 0.43 0.50 0.10 0.04 -0.05 -0.01 -0.03 0.02 0.04 0.05 1.00
10 Same industry acquisition (d) 0.45 0.50 0.05 0.02 -0.09 -0.02 0.03 0.01 0.03 0.04 0.19 1.00 11 Target firm age (years) 33.66 40.77 0.15 0.16 -0.04 0.07 0.03 0.05 0.03 0.03 0.02 0.06 1.00 12 Target return on assets -0.04 0.40 0.12 0.03 -0.21 0.02 0.05 0.00 0.02 -0.01 -0.00 0.03 0.06 1.00 13 Target liabilities/total assets 0.19 0.28 -0.08 -0.01 0.01 0.02 0.04 0.06 -0.03 0.02 0.06 -0.02 -0.01 0.08 1.00 14 Acquirer patent stock/total assets 0.03 0.30 0.01 0.02 0.07 0.03 -0.02 0.00 0.02 0.00 -0.02 0.01 0.01 -0.02 -0.02 n=1428; (d) dummy variable * correlation coefficients are calculated with the acquisition price in logarithm as used in the regressions.
39
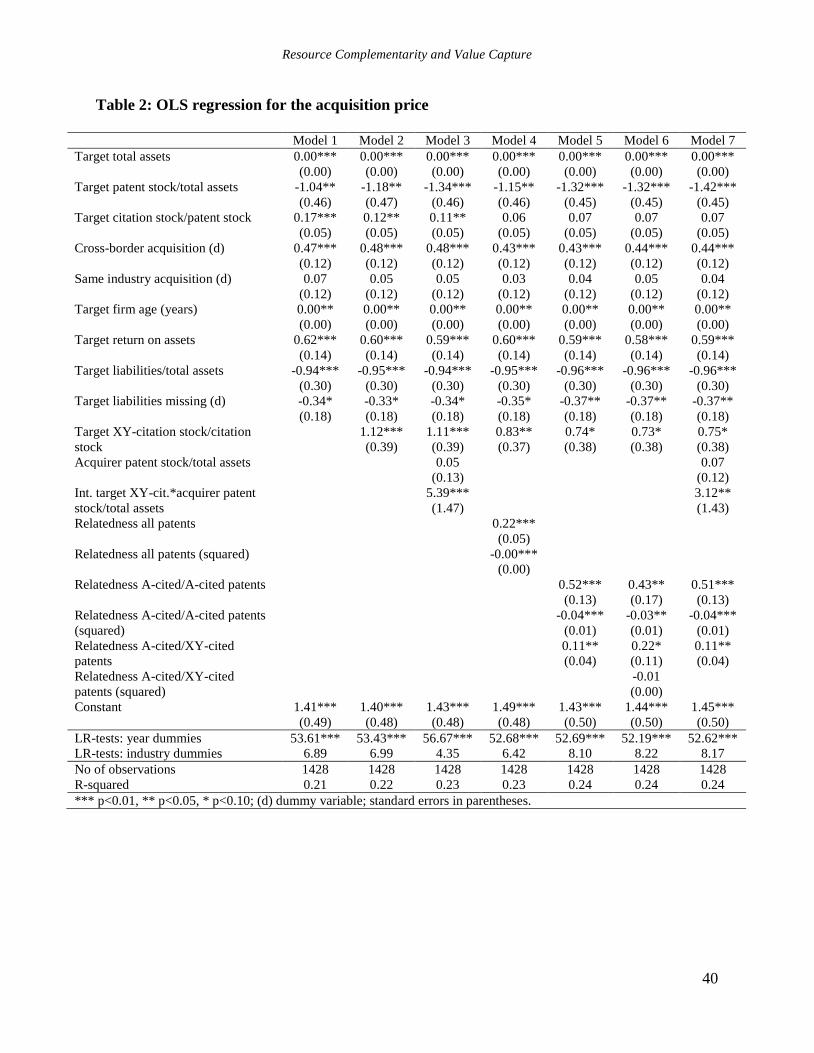
Resource Complementarity and Value Capture
Table 2: OLS regression for the acquisition price
Model 1 Model 2 Model 3 Model 4 Model 5 Model 6 Model 7 Target total assets 0.00*** 0.00*** 0.00*** 0.00*** 0.00*** 0.00*** 0.00***
(0.00) (0.00) (0.00) (0.00) (0.00) (0.00) (0.00) Target patent stock/total assets -1.04** -1.18** -1.34*** -1.15** -1.32*** -1.32*** -1.42***
(0.46) (0.47) (0.46) (0.46) (0.45) (0.45) (0.45) Target citation stock/patent stock 0.17*** 0.12** 0.11** 0.06 0.07 0.07 0.07
(0.05) (0.05) (0.05) (0.05) (0.05) (0.05) (0.05) Cross-border acquisition (d) 0.47*** 0.48*** 0.48*** 0.43*** 0.43*** 0.44*** 0.44***
(0.12) (0.12) (0.12) (0.12) (0.12) (0.12) (0.12) Same industry acquisition (d) 0.07 0.05 0.05 0.03 0.04 0.05 0.04
(0.12) (0.12) (0.12) (0.12) (0.12) (0.12) (0.12) Target firm age (years) 0.00** 0.00** 0.00** 0.00** 0.00** 0.00** 0.00**
(0.00) (0.00) (0.00) (0.00) (0.00) (0.00) (0.00) Target return on assets 0.62*** 0.60*** 0.59*** 0.60*** 0.59*** 0.58*** 0.59***
(0.14) (0.14) (0.14) (0.14) (0.14) (0.14) (0.14) Target liabilities/total assets -0.94*** -0.95*** -0.94*** -0.95*** -0.96*** -0.96*** -0.96***
(0.30) (0.30) (0.30) (0.30) (0.30) (0.30) (0.30) Target liabilities missing (d) -0.34* -0.33* -0.34* -0.35* -0.37** -0.37** -0.37**
(0.18) (0.18) (0.18) (0.18) (0.18) (0.18) (0.18) Target XY-citation stock/citation 1.12*** 1.11*** 0.83** 0.74* 0.73* 0.75* stock (0.39) (0.39) (0.37) (0.38) (0.38) (0.38) Acquirer patent stock/total assets 0.05 0.07
(0.13) (0.12) Int. target XY-cit.*acquirer patent 5.39*** 3.12** stock/total assets (1.47) (1.43) Relatedness all patents 0.22***
(0.05) Relatedness all patents (squared) -0.00***
(0.00) Relatedness A-cited/A-cited patents 0.52*** 0.43** 0.51***
(0.13) (0.17) (0.13) Relatedness A-cited/A-cited patents -0.04*** -0.03** -0.04*** (squared) (0.01) (0.01) (0.01) Relatedness A-cited/XY-cited 0.11** 0.22* 0.11** patents (0.04) (0.11) (0.04) Relatedness A-cited/XY-cited -0.01 patents (squared) (0.00) Constant 1.41*** 1.40*** 1.43*** 1.49*** 1.43*** 1.44*** 1.45***
(0.49) (0.48) (0.48) (0.48) (0.50) (0.50) (0.50) LR-tests: year dummies 53.61*** 53.43*** 56.67*** 52.68*** 52.69*** 52.19*** 52.62*** LR-tests: industry dummies 6.89 6.99 4.35 6.42 8.10 8.22 8.17 No of observations 1428 1428 1428 1428 1428 1428 1428 R-squared 0.21 0.22 0.23 0.23 0.24 0.24 0.24 *** p<0.01, ** p<0.05, * p<0.10; (d) dummy variable; standard errors in parentheses.
40