RESOURCE ASSESSMENT - houstontx.gov · Total housing units 6,721 8,150 782,378 909,336 Occupied 87%...
4
Page 1, November 2017 MacGregor Descripon MacGregor is a collecon of neighborhoods on both sides of Brays Bayou east of the Texas Medical Center. The area became home to many of Houston’s African-Amer- ican professionals during the 1950s and 1960s. At that me some large homes were demolished or converted to commercial uses. As a result some parts of the commu- nity include stately homes interspersed with small motels and deteriorated apartments. Some subdivisions, notably Timbercrest, University Oaks and Riverside Terrace along South MacGregor, retain their gracious resi- denal characteriscs and contain numer- ous examples of outstanding architecture. Highlights Houston City Council District D Houston Independent School District 5 Police beats (includes bordering beats) 2,157 acres (3.37 sq. miles) Pop. characteriscs 2000 2015 2000 2015 Total populaon 13,997 18,459 1,953,631 2,217,706 Persons per sq. mile 4,153 5,475 3,166 3,314 Age of Populaon Under 5 years 6% 4% 8% 8% 5 - 17 years 16% 8% 19% 17% 18 - 64 years 60% 76% 64% 65% 65 and over 19% 11% 9% 10% Ethnicity Non Hispanic Whites 9% 21% 31% 26% Non Hispanic Blacks 80% 59% 25% 22% Hispanics 5% 9% 37% 44% Non Hispanic Asians 4% 8% 6% 7% Non Hispanic Others 2% 3% 1% 1% Income Under $25,000 41% 35% 33% 27% $25,001 to $50,000 26% 19% 31% 25% $50,001 to $100,000 23% 21% 24% 26% Over $100,001 10% 24% 12% 22% Median Household Income $39,615 $63,118 $36,616 $46,187 Educaonal Status No Diploma 16% 8% 30% 23% High School Diploma 18% 15% 20% 23% Some College 24% 30% 23% 24% Bachelor's or Higher 43% 47% 27% 31% Housing and Households Total housing units 6,721 8,150 782,378 909,336 Occupied 87% 80% 92% 88% Vacant 13% 20% 8% 12% Total households 5,859 6,492 717,945 799,714 Family households 3,215 2,862 457,549 491,778 Median Housing Value $122,720 $251,900 $79,300 $131,700 MACGREGOR NO. 83 RESOURCE ASSESSMENT Super Neighborhood Houston
Transcript of RESOURCE ASSESSMENT - houstontx.gov · Total housing units 6,721 8,150 782,378 909,336 Occupied 87%...
Page 1, November 2017 MacGregor
DescriptionMacGregor is a collection of neighborhoods on both sides of Brays Bayou east of the Texas Medical Center. The area became home to many of Houston’s African-Amer-ican professionals during the 1950s and 1960s. At that time some large homes were demolished or converted to commercial uses. As a result some parts of the commu-nity include stately homes interspersed with small motels and deteriorated apartments. Some subdivisions, notably Timbercrest,University Oaks and Riverside Terrace along South MacGregor, retain their gracious resi-dential characteristics and contain numer-ous examples of outstanding architecture.
Highlights Houston City Council District D
Houston Independent School District
5 Police beats (includes bordering beats)
2,157 acres (3.37 sq. miles)
Super Neighborhood HoustonPop. characteristics 2000 2015 2000 2015Total population 13,997 18,459 1,953,631 2,217,706 Persons per sq. mile 4,153 5,475 3,166 3,314
Age of PopulationUnder 5 years 6% 4% 8% 8%5 - 17 years 16% 8% 19% 17%18 - 64 years 60% 76% 64% 65%65 and over 19% 11% 9% 10%
EthnicityNon Hispanic Whites 9% 21% 31% 26%Non Hispanic Blacks 80% 59% 25% 22%Hispanics 5% 9% 37% 44%Non Hispanic Asians 4% 8% 6% 7%Non Hispanic Others 2% 3% 1% 1%
IncomeUnder $25,000 41% 35% 33% 27%$25,001 to $50,000 26% 19% 31% 25%$50,001 to $100,000 23% 21% 24% 26%Over $100,001 10% 24% 12% 22%
Median Household Income $39,615 $63,118 $36,616 $46,187
Educational StatusNo Diploma 16% 8% 30% 23%High School Diploma 18% 15% 20% 23%Some College 24% 30% 23% 24%Bachelor's or Higher 43% 47% 27% 31%
Housing and HouseholdsTotal housing units 6,721 8,150 782,378 909,336 Occupied 87% 80% 92% 88% Vacant 13% 20% 8% 12%Total households 5,859 6,492 717,945 799,714Family households 3,215 2,862 457,549 491,778Median Housing Value $122,720 $251,900 $79,300 $131,700
MACGREGORNO. 83
R E S O U R C E A S S E S S M E N T
Super Neighborhood Houston

Page 2, November 2017 MacGregor
MacGregor: Land Use
SCOT
T
ELGIN
ALM
EDA
WHEELER
GRIGGS
CULL
EN
MACGREGOR
ALABAMA
DIXIE
BLODGETT
ENNIS
MAI
N
OLD SPANISH
DOWLIN
G
YELLOWSTONE
FANNIN
BINZ
SOUTHMORE
POLK
LEELAND
HOLCOMBE
LOCK
WO
OD
MAR
TIN
LUTH
ER K
ING
CALH
OUN
BAGB
Y
CRAW
FORD
RICHMOND
ERN
ESTI
NE
MACGREGOR
CULL
EN
CULL
EN
MACGREGOR
CALH
OUN
SH 2
88
IH 45
US 59
IH 610
SH 288
IH 45
Freeway
Rail Road
Super Neighborhood Boundary
Single-family Residential
Multi-family Residential
Commercial
Office
Industrial
Public and Institutional
Transportation and Utilities
Parks and Open Space
Undeveloped
Agricultural Production
Open Water
Unknown
Source: City of Houston GIS Database,
Date: November 16, 2017
Harris County Appraisal District
I 0 0.5 10.25Miles

Page 3, November 2017 MacGregor
Macgregor: Public Facilities Source: City of Houston GIS Database
Date: October 2017
Council District D
Council District I
Council District C
SCOT
T
ELGIN
ALM
EDA
WHEELER
GRIGGS
CULL
EN
MACGREGOR
ALABAMA
DIXIE
BLODGETT
ENNIS
MAI
N
OLD SPANISH
DOWLIN
GBINZ
FANNIN
YELLOWSTONE
SOUTHMORE
POLK
LEELAND
HOLCOMBE
LOCKWOOD
MAR
TIN
LUTH
ER K
ING
CALH
OUN
BAGB
Y
CRAW
FORD
RICHMOND
MACGREGOR
CULL
EN
CULL
EN
MACG
REGOR
CALH
OUN
SH 2
88
IH 45
US 59
IH 610
SB 5
9 S
TO S
B 28
8
IH 610
SH 2
88
IH 45
US 59SH
288
Community Centers
Fire Station
ÆP Harris County Hospitals
ÆP Private Hospitals
ÆP Other Health Facilities
Æc Library
Metro Rail Stations
Police Station
Rail Road
å School
Parks
I0 0.5 10.25
Miles
Super Neighborhood Boundary
Metro Rail Line¬(Å
AirportsZ
TIRZ
O.S.T. /Almeda
TIRZ
Page 4, November 2017 MacGregor
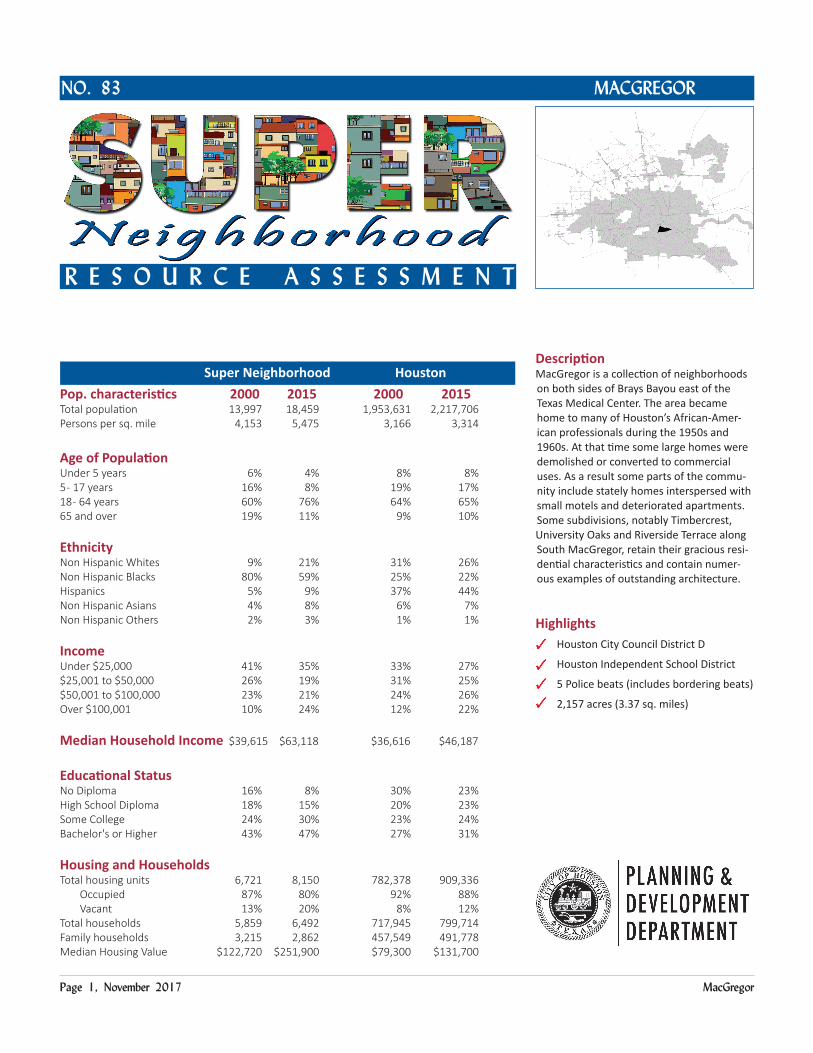
Language Spoken at Home Employment Status
Housing Units by Year Built Housing Occupancy
88%
12%
Employed Unemployed
3%
27%
7%4%
9% 8%
16% 17%
10%
0%
5%
10%
15%
20%
25%
30%
20100r Later
2000 to
2009
1990 to
1999
1980 to
1989
1970 to
1979
1960 to
1969
1950 to
1959
1940 to
1949
1939 or
earlier
83%
6%11%
0%
10%
20%
30%
40%
50%
60%
70%
80%
90%
English Spanish Other
80%
20%
Occupied Vacant
Source: U.S. Census Bureau, 2000 American Community Survey, 2011-2015 Estimates


![SI D Perez 1,7-Naphthodiyne rev bnS4# # 1.2.5Synthesis*of*5,10,15,166tetraphenyl65,10,15,166tetrahydro65,16:10,156diepoxynaphtho[2,36 a]tetraphene*(9)* To#asolution#of#1,3Fdiphenylisobenzofuran(8,150#](https://static.fdocuments.in/doc/165x107/6055bd78cda8986d7f7b0561/si-d-perez-17-naphthodiyne-rev-bn-s4-125synthesisof51015166tetraphenyl651015166tetrahydro651610156diepoxynaphtho236.jpg)