Resonant ultrasonic imaging of defects for advanced non ...
13
Int. J. Microstructure and Materials Properties, Vol. 9, Nos. 3/4/5, 2014 261 Copyright © 2014 Inderscience Enterprises Ltd. Resonant ultrasonic imaging of defects for advanced non-linear and thermosonic applications Igor Solodov Department of Non-Destructive Testing (IKT-ZfP), Institute of Polymer Technology, University of Stuttgart, Stuttgart 70569, Germany E-mail: [email protected] Abstract: An efficient wave-defect interaction is the key to high non-linear and thermal responses of flaws to be applied in ultrasonic imaging for non- destructive material evaluation. To selectively enhance defect vibrations a concept of local defect resonance is developed and applied to ultrasonic activation of defects. The frequency match between the defect resonance frequency and the probing ultrasonic wave results in a substantial rise of the defect non-linear response and its local temperature. The non-linear applications of this concept demonstrated in this paper cover both the higher harmonic and frequency mixing modes. The defect resonance is shown to be accompanied by depletion of the excitation frequency vibration due to non- linear frequency conversion to higher harmonics. The local generation of higher frequency components provides a high thermal defect response in such acoustically non-linear thermosonic mode. Keywords: local defect resonance; non-linear non-destructive evaluation; ultrasonic thermography. Reference to this paper should be made as follows: Solodov, I. (2014) ‘Resonant ultrasonic imaging of defects for advanced non-linear and thermosonic applications’, Int. J. Microstructure and Materials Properties, Vol. 9, Nos. 3/4/5, pp.261–273. Biographical notes: Igor Solodov graduated from M.V. Lomonosov Moscow State University, Moscow, Russia in 1968. In 1972 he received a PhD and in 1989 DSci degree from Faculty of Physics MSU where he held a Professor position at the Department of Acoustics. As a visiting scientist he worked at the University of California (Berkeley), Stanford University, University of Maryland (College Park), (USA), Nanjing University (China), University of Windsor (Canada), and currently works at the University of Stuttgart (Germany). His research interests include microwave acoustics, surface acoustic waves, acousto-electronics, nonlinear acoustics of solids and acoustic NDE-applications. This paper is a revised and expanded version of a paper entitled ‘Enhancement of efficiency in vibro-thermography and nonlinear ultrasonic NDTvia Local Defect Resonance (LDR)’ presented at The 12th International Conference of the Slovenian Society for Non-Destructive Testing ‘Application of Contemporary Non-Destructive Testing in Engineering’, Ljubljana, Slovenia, 4–6 September, 2013.
Transcript of Resonant ultrasonic imaging of defects for advanced non ...

Int. J. Microstructure and Materials Properties, Vol. 9, Nos. 3/4/5, 2014 261
Copyright © 2014 Inderscience Enterprises Ltd.
Resonant ultrasonic imaging of defects for advanced non-linear and thermosonic applications
Igor Solodov Department of Non-Destructive Testing (IKT-ZfP), Institute of Polymer Technology, University of Stuttgart, Stuttgart 70569, Germany E-mail: [email protected]
Abstract: An efficient wave-defect interaction is the key to high non-linear and thermal responses of flaws to be applied in ultrasonic imaging for non-destructive material evaluation. To selectively enhance defect vibrations a concept of local defect resonance is developed and applied to ultrasonic activation of defects. The frequency match between the defect resonance frequency and the probing ultrasonic wave results in a substantial rise of the defect non-linear response and its local temperature. The non-linear applications of this concept demonstrated in this paper cover both the higher harmonic and frequency mixing modes. The defect resonance is shown to be accompanied by depletion of the excitation frequency vibration due to non-linear frequency conversion to higher harmonics. The local generation of higher frequency components provides a high thermal defect response in such acoustically non-linear thermosonic mode.
Keywords: local defect resonance; non-linear non-destructive evaluation; ultrasonic thermography.
Reference to this paper should be made as follows: Solodov, I. (2014) ‘Resonant ultrasonic imaging of defects for advanced non-linear and thermosonic applications’, Int. J. Microstructure and Materials Properties, Vol. 9, Nos. 3/4/5, pp.261–273.
Biographical notes: Igor Solodov graduated from M.V. Lomonosov Moscow State University, Moscow, Russia in 1968. In 1972 he received a PhD and in 1989 DSci degree from Faculty of Physics MSU where he held a Professor position at the Department of Acoustics. As a visiting scientist he worked at the University of California (Berkeley), Stanford University, University of Maryland (College Park), (USA), Nanjing University (China), University of Windsor (Canada), and currently works at the University of Stuttgart (Germany). His research interests include microwave acoustics, surface acoustic waves, acousto-electronics, nonlinear acoustics of solids and acoustic NDE-applications.
This paper is a revised and expanded version of a paper entitled ‘Enhancement of efficiency in vibro-thermography and nonlinear ultrasonic NDTvia Local Defect Resonance (LDR)’ presented at The 12th International Conference of the Slovenian Society for Non-Destructive Testing ‘Application of Contemporary Non-Destructive Testing in Engineering’, Ljubljana, Slovenia, 4–6 September, 2013.
262 I. Solodov
1 Introduction
Elastic wave-defect interaction is a background of ultrasonic non-destructive evaluation (NDE) of materials and industrial components. In conventional (linear) ultrasonic NDE, it is responsible for sound attenuation and scattering that results in the wave amplitude and phase variations as indicators of the presence of defects. The efficiency of the interaction becomes particularly crucial for ultrasonic NDE techniques, which require an elevated acoustic power such as non-linear ultrasonic NDE and ultrasonic thermography (thermosonics). This is caused by relatively inefficient processes of clapping and/or frictional hysteretic rubbing at the defect interface and therefore depends critically on input ultrasonic power. As a result, both methodologies stand out from other conventional ultrasonic NDE counterparts for their specific instrumentation particularly adapted to high-power ultrasonics. The non-linear techniques usually require low-klirrfaktor generators and transducers combined with thorough filtering of higher harmonics barely possible for the high-voltage (hundreds volts) inputs. To provide a measurable temperature response, thermosonics traditionally employs high-power ultrasonic welding instrumentation, which includes kW power supply (at fixed frequencies 20 or 40 kHz) and piezo-stack converters combined with ultrasonic boosters and horns. The test specimen is usually pressed against the horn that results in unstable ultrasonic response and highly non-reproducible measurements.
In both methodologies, further increase in vibration amplitude is attained by choosing the excitation frequency equal to the natural frequency of the specimen (Mignogna et al., 1981; Guyer and Johnson, 1999). However, for reliable imaging of defects care should taken to assure that the defect is outside the nodal areas of the standing wave pattern. To diminish the effect of nodal lines and to prevent ‘missing’ the defect, it was suggested to excite the specimens at multiple natural frequencies instead of using a single-frequency excitation (Homma et al., 2006; Van Den Abeele, 2007). An enhancement in crack thermosonic detectability by producing a wide-band excitation (‘acoustic chaos’) was reported by Han et al. (2004). For the same acoustic power injected in a cracked Al specimen, the crack thermal response for chaotic excitation was 2–3 times higher than that for a monochromatic ultrasonic source. The authors acknowledged that the origin of the effect ‘is unclear’ and might be related to elimination of vibrational nodes of the sample or correlated with the presence of higher frequencies.
In this paper, a consistent way to enhance acoustic and thermal defect responses is suggested by using selective ultrasonic activation of defects based on the concept of local defect resonance (LDR) (Solodov et al., 2011). The LDR provides a selective excitation of a defect that results in a high local vibration amplitude and enhancement of both non-linear and thermal defect responses readily measurable even for a few mW acoustic input. This proposes LDR application as an extremely efficient and sensitive mode for non-linear and thermosonic defect-selective imaging in NDE.
2 LDR concept
The concept of LDR is based on the fact that inclusion of a defect leads to a local decrease in stiffness for a certain mass of the material in this area, which should manifest in a particular characteristic frequency of the defect. The LDR fundamental frequency

Defects for advanced non-linear and thermosonic applications 263
can be introduced as a natural frequency of the defect with an effective rigidity Keff and mass eff 0 eff eff: 1 / 2 / .M f K Mπ= To derive the expressions for Keff and Meff one could evaluate potential and kinetic vibration energy of the defect. This approach applied to a circular flat-bottomed hole (FBH) (radius a, thickness h) yields (Solodov et al., 2013):
2eff eff192 / ; 1.8 ,K D a M mπ= = (1)
where 3 2/12(1 )D Eh ν= − is the bending stiffness and m is the mass of the plate in the bottom of the defect.
Equations (1) are then combined to yield the LDR frequency of the circular FBH:
0 2 2
1.6 .12 (1 )
h Efa ρ ν
≈−
(2)
A similar phenomenology can be applied to a defect in the shape of a notch, which can be considered as a rectangular FBH. In this case, the effective mass of vibrating defect is:
eff 3 / 2,M m= (3)
while its effective rigidity: 4
eff 8 ,K Dwbwπ =
(4)
where ;m hwbρ= w and b are the notch width and length, correspondingly. The LDR frequency of the notch (for )b w>> is then found as follows:
0 2
2 .3Df
hwπ
ρ= (5)
The phenomenology presented is a simplified approach, which nonetheless enables to clarify the physical nature of the LDR. The expressions for f0 obtained above are applicable to evaluation of the fundamental resonance frequencies of the defects, like FBH as well as laminar defects in rolled sheet metals and delaminations in composites. In reality, the vibration field also comprises the higher-order modes; to calculate these eigen frequencies a rigorous theory of plate vibrations should be used.
The problem in practical use of the analytical approach is concerned with the boundary conditions for the defect edges, which were assumed to be clamped in deriving (2) and (5). This is apparently justifiable for ‘deep’ FBH in plates; however, in a general case the analytical formulation presented above becomes problematic. Instead, the finite element simulation was used to visualise the LDR vibration patterns and to evaluate the LDR frequencies. The software COMSOL MULTIPHYSICS (physics package ‘structural dynamics’, ‘eigenfrequency analysis’) was found to be suitable for analysing the vibration characteristics of structures with defects and to determine the LDR frequencies. By using eigenfrequency analysis of the model, each possible resonance of vibrations in the plate can be found and the vibration patterns plotted. Figure 1(a) illustrates the vibration pattern at frequency 10.4 kHz, which is readily identified as a fundamental

264 I. Solodov
LDR of a circular FBH followed by the higher-order LDR at the higher driving frequency of 23.25 kHz (Figure 1(b)).
Figure 1 A fundamental LDR (10.4 kHz): (a) and higher-order LDR (23.25 kHz) and (b) for a FBH (radius 1 cm, depth 2 mm) in a PMMA plate (thickness 3 mm)
(a) (b)
3 Experimental evidence for LDR
A direct way to experimentally reveal LDR is to measure an individual contribution of each point of the specimen in its overall frequency response in a wide frequency range. For this purpose, an ultrasonic excitation by a wide-band piezoelectric transducer is combined with a laser vibrometer scan of the specimen surface. It enables to probe and indicate all possible resonances in every point of the specimen. The origin of each maximum is then verified by imaging the wave pattern in the specimen at the corresponding frequency. Figure 2 shows two examples of the LDR frequency response (a) and the vibration patterns (b) measured for the defects in carbon fibre-reinforced composite (CFRP) samples. A strong enhancement (about 20 dB) of the vibration amplitude with a high Q-factor (Q~100) observed locally in the defect area is identified as a fundamental defect resonance. Besides the fundamental LDR, zoom-in scan of the vibration field inside the defect area in a wider frequency range usually reveals the higher-order LDR with multiple nodal lines in the vibration patterns. Such a methodology was successfully applied to a search of the LDR in a variety of materials (Solodov et al., 2013). Similar LDR with local resonance ‘amplification’ of the vibration amplitude as high as ~ (20–40 dB) were generally measured for other types of realistic defects.
4 LDR enhancement of defect non-linearity and imaging quality
4.1 Higher harmonic mode
Since LDR isan efficient resonance ‘amplifier’ of the local vibrations, one would expect it to contribute appreciably to ultrasonic non-linearity. To begin with the study of LDR effect on non-linearity, a circular FBH defect (h = 0.8 mm; a = 1 cm) in a typical ‘classical’ (low non-linear) material PMMA with the LDR frequency response at 11 kHz was measured. The FBH was driven by the flexural waves excited with a wide-band

Defects for advanced non-linear and thermosonic applications 265
piezoelectric transducer attached to the plate. A scanning laser vibrometer in particle velocity mode was used to monitor the LDR vibration pattern, waveform, and the spectrum including higher harmonics (HH).
Figure 2 (a) LDR frequency responses and (b) vibration patterns and for an impact damage in CFRP plate (left) and a crack in CFRP rod (right)
The experimental results in Figure 3, a show that even such ‘linear’ defects, like FBH in PMMA, turn into strongly non-linear provided the driving frequency matches the LDR (11000Hz). For realistic defects, the higher background non-linearity (contact acoustic non-linearity (CAN); Solodov et al., 2002) combined with LDR results in an extremely efficient HH generation (Figure 4). A crucial role of the driving frequency match to LDR for non-linearity increase is illustrated in Figures 5 and 6, correspondingly, for a delamination in glass fibre-reinforced (GFRP) plate and a crack in a unidirectional (UD-) CFRP rod. As the driving frequency matches the LDR frequencies, a strong enhancement (~20–40 dB) of the HH amplitudes generated locally in the defect area is observed (Figures 5 and 6).
Figure 3 HH spectra of FBH in PMMA specimen driven at LDR frequency 11 kHz

266 I. Solodov
Figure 4 HH spectrum for delamination in glass fibre reinforced (GFRP) specimen driven at LDR frequency 20.9 kHz. Input voltage is 7 V
Figure 5 Higher harmonic LDR frequency responses of a delamination in GFRP plate (LDR 20.9 kHz)
Figure 6 Higher harmonic LDR frequency responses of a crack in UD-CFRP rod (LDR 19.5 kHz (Figure 2))
By combining the resonance conditions (provided by LDR) with highly efficient elastic non-linearity (CAN) a substantial improvement in detecting and imaging of realistic defects can be expected. The benefit of the higher harmonic LDR imaging is illustrated in Figure 7(a)–(c). Under LDR condition, the higher harmonics are generated efficiently and highly localised in the defect area that provides a background for the high-contrast defect-selective imaging. A substantial improvement of the image quality was observed for the second harmonic LDR of 10 × 20 mm2 delamination in 1 mm GFRP plate:

Defects for advanced non-linear and thermosonic applications 267
the signal-to-noise ratio of the non-linear image in Figure 7(a) is ~24 dB, while ~12 dB was measured at 36.77 kHz for the fundamental frequency LDR. Similar enhancement in non-linear image quality is readily seen by comparing the linear LDR (3.67 kHz) (Figure 7(b)) and the second harmonic images (Figure 7(c)) of impact-induced fibre loss damage in CFRP plate.
Figure 7 LDR nonlinear imaging of defects: second harmonic image of delamination in (a) GFRP plate; (b) fundamental and (c) the second harmonic LDR images of impact induced fibre loss in CFRP plate
(a) (b) (c)
4.2 Mixing frequency mode
A high quality factor of LDR (Figure 2) can also be used as a ‘linear’ filter/amplifier in the frequency mixing non-linear NDE. This method is based on the non-linear interaction of ultrasonic waves of different frequencies (f1, f2) that results in a combination frequency output: 1 2 .f f f± = ± For non-linear experiments in ‘classical’ materials (like, PMMA), the efficiency of interaction is highly critical to the geometry of the wave propagation and is generally rather low: the amplitude ratio 1,2/U U± is normally below 10–3–10–2. A high-Q LDR can be used to enhance the output signal at a combination frequency (or any of the interacting frequencies) when this frequency matches the LDR frequency response. This approach will be applicable to any geometry of the wave interaction since LDR response is weakly sensitive to its position in the wave field.
An application of LDR as the ‘frequency mixing amplifier’ for NDE and imaging of realistic defects is illustrated then in Figures 8 and 9 for an impact-induced damage (area ~5 × 5mm2) in the CFRP plate (280 × 40 × 1 mm3). A linear LDR frequency response of the impact demonstrates a well-defined double-maxima peak around 110 kHz (Figure 8). In the experiment, the two interacting flexural waves were excited in a continuous wave mode by the piezo-transducers attached to the opposite edges of the plate. One of the frequencies was fixed at f1 = 77.5 kHz while the other was swept from f2 = 28.5 to 37.5 kHz to provide the sum frequency variation around the LDR frequency of the defect. The vibration velocity amplitudes at f1, f2, and f+ were monitored in the centre of FBH with a laser scanning vibrometer (vibration velocity mode). Figure 9 shows the normalised velocity amplitude at sum frequency as a function of f+ measured by changing f2 in the frequency range indicated above. The impact of LDR is clearly seen by comparing the data with those in Figure 8: more than 20 dB increase in the output is observed when the combination frequency matches the frequency of LDR.

268 I. Solodov
Figure 8 LDR frequency response for an impact induced damage in a CFRP plate
Figure 9 LDR induced amplification at the sum frequency vibration for impact damage in CFRP plate
The LDR contribution to the sum-frequency signal makes it localised in the damage area and enables it to be used for mixing frequency imaging with reasonable signal-to-noise level (~15 dB, Figure 10).
Figure 10 Sum-frequency image of the impact-induced damage (~5 × 5mm2) in a CFRP plate

Defects for advanced non-linear and thermosonic applications 269
5 Non-linear LDR thermosonics
In ultrasonic thermography, the defect thermal response is caused by a local dissipation of mechanical energy, which is converted into heat. In the frame of viscoelastic model, this process is described by introducing the internal friction force proportional to vibration velocity ( ~ )Eσ ε′′ so that the energy loss per unit time is:
2 20 .
2EW
tω ε ′′∆ =
∆ (6)
According to equation (6), the dissipated power is proportional to the square of both the frequency (ω) and the amplitude (ε0) of vibration. Therefore, the use of LDR, which strongly intensifies local vibrations, is beneficial for enhancing the efficiency of ultrasonic thermography.
According to equation (6), for a linear elastic defect response, ultrasound-induced heating is proportional to the square of excitation frequency. However, the frequency increase of injected ultrasound is accompanied by the higher ultrasonic attenuation in the material and enhancement of the background heating. The LDR induced suggests a unique opportunity to generate the higher frequency components directly in the defect and thus to enhance a local heating of the defect selectively. In the non-linear LDR mode, the defect generates multiple spectral components (see e.g., Figure 4), which extend the local excitation spectrum to a much higher frequency range. Each spectral line of the high frequency vibrations contributes to the defect thermal response, which is enhanced due to both the high number of the non-linear spectral components and their higher frequencies. A feasibility of such a non-linear LDR thermosonic mode is demonstrated below.
In the experiment below, the effect of LDR on thermal response of defects was studied for a delamination in GFRP plate with LDR ~20.9 kHz. Unlike traditional ultrasonic thermography experiments, which usually apply hand-pressed horn-type transducers for exciting high-power vibrations, LDR enables to reduce the input considerably and use conventional disk-like piezo-ceramic transducers attached (glued) to the specimen surface. The voltage from HP 33120A function generator (bandwidth up to 15 MHz) via a voltage amplifier HVA 3/450 was applied to the transducers to excite flexural waves in the frequency band up to 100 kHz. The standing wave amplitudes were monitored with scanning laser vibrometer to evaluate a total acoustic power injected in the specimens; it was found to be in the sub-watt range even for maximum input voltage. The thermal response of the defects was visualised and measured with an IR camera (IRCAM Equus 327 K, sensitivity ≈20 mK).
The laser vibrometry measurements of vibration velocity show that as the defect excitation level increases (input voltage >60 V), the vibrations at the fundamental excitation frequency (squared vibration velocity proportional to a ‘linear’ elastic energy (Figure 11, left) saturate and then reduce considerably. This is apparently caused by efficient generation of the higher harmonics in the delamination area (see Figure 4) leading to a non-linear distortion of the excitation. The relevance of the latter factor is seen in Figure 11, right: the sum of squared HH-vibration velocities (‘non-linear’ elastic energy) measured in the frequency band up to 1 MHz (over 47 HH) increases strongly at the higher excitation level. According to Figure 11, about half of the ‘loss’ of elastic energy at the excitation frequency is converted into the higher harmonic vibrations, which take place in the defect area.
270 I. Solodov
Figure 11 Laser vibrometry measurements of vibrations at fundamental excitation frequency (LDR 20.9 kHz) (left) and higher harmonics (right) as functions of excitation level
The ‘depletion’ of the vibrations at fundamental frequency, however, does not affect the thermal response of the defect (Figure 12, left), which increases steadily over the whole range of excitation level. An additional source of heating comes from non-linear vibrations of the defect: the ultrasound-induced temperature (Figure 12, left) rises synchronously with the growth of non-linear elastic energy (Figure 11, right). The non-linearity of the defect, therefore, contributes substantially to its thermal response and enhances the sensitivity of such non-linear ultrasonic thermosonics.
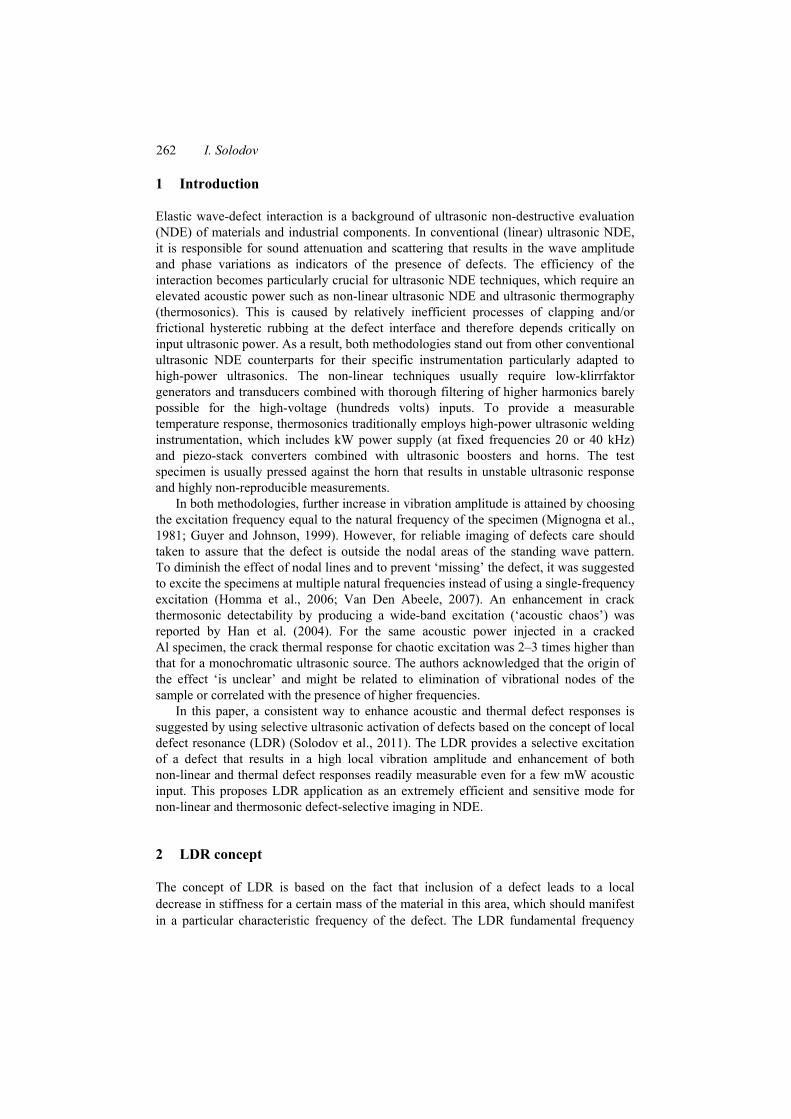
Figure 12 Thermal response of the delamination area in GFRP as a function of excitation level (left) and fundamental excitation frequency velocity amplitude (right). Ultrasonic exposure time is 2 s.
This effect is clearly illustrated in Figure 12, right, where the thermal response of the delamination is plotted as a function of the amplitude of fundamental excitation frequency component. In a low-amplitude range (acoustically linear LDR), ultrasonic heating grows quadratically, that is in full accord with (6). Transition into non-linear LDR is accompanied by depletion of the fundamental frequency vibrations; decrease in its amplitude in Figure 11, left results in the ‘turn’ of the curve in Figure 12, right. Despite the fundamental frequency amplitude decreasing above the turning point, the defect thermal response continues to grow (Figure 12, left). The ‘internal source’ for further heating is produced by the higher frequency components generated within the defects due to its non-linearity.
To verify the efficiency and the opportunity of using conventional ultrasonic transducers for non-linear thermosonic imaging, thermographic measurements were first

Defects for advanced non-linear and thermosonic applications 271
implemented for a circular FBH (radius 1 cm) in PMMA plate. Figure 13, left shows an example of thermosonic image of the FBH excited at LDR frequency (11 kHz); the dynamics of the FBH thermal response is illustrated in Figure 13, right. A quadratic dependence on the input amplitude agrees fully with theoretical expectations according to (6). The data also reveal a high efficiency of the acousto-thermal conversion: at 80 V input (0.2 W acoustic power) and 15s-ultrasonic exposure, the temperature rise in the FBH amounts to ≈3 K. According to Figure 13, the thermal response stays substantially beyond the camera sensitivity down to 15–20 V input (~10 mW power).
Figure 13 Left – thermosonic image of a circular FBH (radius 1 cm) in PMMA plate at LDR frequency (11 kHz). Insonation time 15 s; input voltage of the transducer 80 V; Right – temperature variation of a FBH at LDR as a function of input voltage of ultrasonic transducer
A crucial contribution of the LDR to the heating effect is clarified by measurements of the temperature rise as a function of driving frequency (Figure 14, right; experimental points). A sharp maximum of the thermosonic response at 11 kHz agrees fully with LDR ultrasonic frequency response (Figure 14, left). Even a 2–3% detuning from exact LDR frequency drops the temperature down to basically non-measurable values of 10–20 mK and reduces the conversion efficiency by about two orders of magnitude. Such a high-Q thermal response is a consequence of the non-linearity involved in the acousto-thermal conversion. This fact is illustrated in Figure 14, right by a close fit between the LDR ultrasonic frequency response squared and its thermal response.
Figure 14 LDR ultrasonic (left) and thermosonic (right) frequency responses for a FBH in PMMA plate

272 I. Solodov
To proceed to realistic defects, the effect of LDR on the thermal response was studied for an in-plane oval delamination in a GFRP plate with LDR at ~20.9 kHz (Figure 16, left). The results are presented in Figures 15 and 16 (right), where the thermal responses to a 2s-pulse acoustic excitation of the delamination are visualised (Figure 15) and measured (Figure 16, right) for the same input amplitudes (50 V) but different frequencies. The thermographic image of the defect taken in the vicinity of the LDR ~ 20.9 kHz (Figure 15(b)) demonstrates that the heating is mainly produced in the core part of the delamination where maximum vibration amplitude is observed by using laser vibrometry (Figure 15(a)). The temperature variation in this area (for insonation time 2 s) (Figure 16, right) confirms the contribution of LDR: At the LDR central frequency, the temperature rise (0.85°C) is almost an order of magnitude higher than that outside the LDR bandwidth. For larger deviation of the driving frequency from LDR (including the specimen natural frequencies), the thermal response of the defect was barely measurable (Figure 15(c)) with the IR camera (sensitivity ≈20 mK).
Figure 15 Resonance imaging of an oval delamination in GFRP specimen: 20.9 kHz-LDR vibrometer (a) and IR-(b) images; (c) is IR-image at the specimen natural frequency 6.8 kHz
Figure 16 LDR ultrasonic frequency response for a delamination in GFRP plate (left); its thermal 2s-pulse responses at LDR-frequency (20.9 kHz) and outside the LDR bandwidth (19 kHz)
6 Conclusions The LDR concept is based on the fact that inclusion of a defect leads to a local drop of rigidity for a certain mass of the material in this area that should manifest in a particular characteristic frequency of the defect. A straightforward phenomenology and a FEM simulation are proposed to evaluate the fundamental LDR frequencies of the defects, like

Defects for advanced non-linear and thermosonic applications 273
FBH, as well as laminar defects in rolled sheet metals and delaminations in composites. A laser scanning methodology was applied to provide experimental evidence of the LDR in a variety of materials. For simulated and realistic defects the LDR-induced local resonance ‘amplification’ of the vibration amplitude averages up to ~(20–40 dB). Whereas LDR is an efficient resonant ‘amplifier’ of the local vibrations, it manifests a profound non-linearity even at moderate ultrasonic excitation level. Besides a strong higher harmonic response, a high quality factor of LDR can also be used as a ‘linear’ filter/amplifier in the frequency mixing non-linear NDE.
Since the acoustic dissipated power is proportional to the square of the amplitude of vibration, the use of LDR is beneficial for enhancing the efficiency and sensitivity of ultrasonic thermography. Unlike traditional thermosonic experiments, the LDR thermography requires substantially lower acoustic power to activate defects that makes it possible to use conventional ultrasonic NDE instrumentation. For input acoustic power well below 1 W, the temperature rise about few K is normally measured for LDR of delaminations in composite materials. The use of LDR enables to enhance the acousto-thermal conversion efficiency by more than an order of magnitude.
Acknowledgement
The author acknowledges support of this study by EU FP-7 in the framework of ALAMSA project.
References Guyer, R. and Johnson, P. (1999) ‘Nonlinear mesoscopic elasticity: evidence for a new class of
materials’, Physics Today, Vol. 52, pp.30–36. Han, X., Zheng, Z., Li, W., Islam, Md.S., Lu, J., Loggins, V., Yitamben, E., Favro, L.D.,
Newaz, G. and Thomas, R.L. (2004) ‘Acoustic chaos for enhanced detectability of cracks by sonic infrared imaging’, Journal of Applied Physics, Vol. 95, No. 7, pp.3792–3797.
Homma, C., Rothenfusser, M., Baumann, J. and Shannon, R. (2006) ‘Study of the heat generation mechanism in acoustic thermography’, AIP Conference Proceedings, Vol. 820, pp.566–573.
Mignogna, R.B., Green Jr., R.E., Duke, J.C., Henneke II, E.G. and Reifsnider, K.L. (1981) ‘Thermographic investigation of high-power ultrasonic heating in materials’, Ultrasonics, Vol. 19, pp.159–163.
Solodov, I., Bai, J. and Busse, G. (2013) ‘Resonant ultrasound spectroscopy of defects: case study of flat bottomed holes’, Journal of Applied Physics, Vol. 113, p.223512.
Solodov, I., Bai, J., Bekgulyan, S. and Busse, G. (2011) ‘A local defect resonance to enhance acoustic wave-defect interaction in ultrasonic nondestructive testing’, Applied Physics Letters, Vol. 99, p.211911.
Solodov, I., Krohn, N. and Busse, G. (2002) ‘CAN: an example of nonclassical acoustic nonlinearity in solids’, Ultrasonics, Vol. 40, pp.621–625.
Van Den Abeele, K. (2007) ‘Multi-mode nonlinear resonance ultrasound spectroscopy for defect imaging: an analytical approach for the one-dimensional case’, Journal of Acoustical Society America, Vol. 122, No. 1, pp.73–90.


![ULTRASONIC ;MACHINING - Philips Bound... · 1956/57,No. 11 ULTRASONIC MACHINING I 327. Theindications arethat resonant piesomagneticl"] transducers (magnetostrictors) are likely to](https://static.fdocuments.in/doc/165x107/5b378e207f8b9a5a178c7004/ultrasonic-machining-bound-195657no-11-ultrasonic-machining-i-327.jpg)


