Resolving the root of the avian mitogenomic tree by breaking - HAL
29
HAL Id: halsde-00315505 https://hal.archives-ouvertes.fr/halsde-00315505 Submitted on 28 Aug 2008 HAL is a multi-disciplinary open access archive for the deposit and dissemination of sci- entific research documents, whether they are pub- lished or not. The documents may come from teaching and research institutions in France or abroad, or from public or private research centers. L’archive ouverte pluridisciplinaire HAL, est destinée au dépôt et à la diffusion de documents scientifiques de niveau recherche, publiés ou non, émanant des établissements d’enseignement et de recherche français ou étrangers, des laboratoires publics ou privés. Resolving the root of the avian mitogenomic tree by breaking up long branches. Kerryn E Slack, Frédéric Delsuc, Patricia A Mclenachan, Ulfur Arnason, David Penny To cite this version: Kerryn E Slack, Frédéric Delsuc, Patricia A Mclenachan, Ulfur Arnason, David Penny. Resolving the root of the avian mitogenomic tree by breaking up long branches.. Molecular Phylogenetics and Evolution, Elsevier, 2007, 42 (1), pp.1-13. <10.1016/j.ympev.2006.06.002>. <halsde-00315505>
Transcript of Resolving the root of the avian mitogenomic tree by breaking - HAL

HAL Id: halsde-00315505https://hal.archives-ouvertes.fr/halsde-00315505
Submitted on 28 Aug 2008
HAL is a multi-disciplinary open accessarchive for the deposit and dissemination of sci-entific research documents, whether they are pub-lished or not. The documents may come fromteaching and research institutions in France orabroad, or from public or private research centers.
L’archive ouverte pluridisciplinaire HAL, estdestinée au dépôt et à la diffusion de documentsscientifiques de niveau recherche, publiés ou non,émanant des établissements d’enseignement et derecherche français ou étrangers, des laboratoirespublics ou privés.
Resolving the root of the avian mitogenomic tree bybreaking up long branches.
Kerryn E Slack, Frédéric Delsuc, Patricia A Mclenachan, Ulfur Arnason,David Penny
To cite this version:Kerryn E Slack, Frédéric Delsuc, Patricia A Mclenachan, Ulfur Arnason, David Penny. Resolvingthe root of the avian mitogenomic tree by breaking up long branches.. Molecular Phylogenetics andEvolution, Elsevier, 2007, 42 (1), pp.1-13. <10.1016/j.ympev.2006.06.002>. <halsde-00315505>

28/8/08, page 1 of 28
Resolving the root of the avian mitogenomic tree by breaking up long branches.
Kerryn E. Slack1, 2, Frédéric Delsuc1,3, P.A. (Trish) McLenachan1,
Ulfur Arnason2 and David Penny1
1 Allan Wilson Center for Molecular Ecology
and Evolution,
Massey University
Palmerston North
New Zealand
2 Department of Genetics, Cell and Organism Biology
University of Lund
Lund
Sweden
3 Present address:
Laboratoire de Paléontologie, Phylogénie et Paléobiologie,
Institut des Sciences de l’Evolution UMR5554-CNRS
Université Montpellier II
Montpellier
France
Keywords: avian evolution, long branches, galloanseres, Passeriformes, Neoaves, Cracrafti

28/8/08, page 2 of 28
Abstract:
Incomplete taxon sampling has been a major problem in resolving the early divergences in birds. Five new
mitochondrial genomes are reported here and three break up long branches that tended to attract the distant
reptilian outgroup. These long branches were to galliforms, and to oscine and suboscine passeriformes.
Breaking these long branches leaves the root between paleognaths and neognaths as inferred by maximum
likelihood and Bayesian phylogenetic analyses. This means that morphological, nuclear and mitochondrial
data are now in agreement on the position of the root of the avian tree and we can, for the moment, move
on to other questions. An overview is then given of the deepest divisions in the mitogenomic tree inferred
from complete mitochondrial genomes. The strict monophyly of both the galloanseres and the passerines is
strongly supported, leaving the deep six-way split within Neoaves as the next major question for which
resolution is still lacking. Incomplete taxon-sampling was a major problem earlier and although some
resolution is now available there are still problems related to the fact that current phylogenetic methods still
fail to account for real features of DNA sequence evolution.

28/8/08, page 3 of 28
Introduction
After a period of relative quiescence following the publication of Sibley and Ahlquist’s DNA/DNA
hybridisation tapestry (1990) the ever-decreasing cost of DNA sequences has led to a rebirth of deep-level
avian systematics. As a part of this effort to acquire new data aiming at resolving the phylogeny of avian
orders, complete mitochondrial genomes had been sequenced for an increasing number of taxa (for
example, Mindell et al. 1999; Paton et al. 2002; Slack et al. 2003; Harrison et al. 2004). The amount of
sequence data accumulated so far permits the evaluation of a range of prior hypotheses primarily proposed
on morphological, paleontological and biogeographical grounds (for example, Cracraft 2001; Cracraft et al.
2004). In the case of placental mammals, as expected on theoretical grounds, increasing the number of taxa
led to an excellent agreement between nuclear and mitochondrial datasets (Lin et al. 2002; Reyes et al.
2004). Such agreement between different datasets is essential for corroboration (Penny et al. 1982) because
model misspecification (Buckley 2002) can be hard to detect, Systematic biases can lead to 100% bootstrap
support for conflicting trees (Phillips et al. 2004), and even maximum likelihood methods can become
inconsistent when the model is not specified accurately (Chang 1996).
An early problem was that mitogenomic-based studies of avian phylogenetic relationships appeared to
place the reptilian outgroup within Passeriformes (Härlid and Arnason 1999; Mindell et al. 1999). Such a
rooting was at odds with data from morphology (Sibley and Ahlquist 1990; Cracraft 2001; Livezey and
Zusi 2001; Mayr and Clarke 2003), nuclear DNA (Garcia-Moreno and Mindell 2000) and genomic DNA
strings (Edwards et al. 2002). These all supported a major division between paleognaths (tinamous and
ratites) and neognaths (all other birds including the species-rich Passeriformes). The passerine rooting of
the mitochondrial tree has been suggested to be the result of a possible long-branch attraction effect
between the distant reptilian outgroup and the fast-evolving passerines (Slack et al. 2003). Indeed, in the
unrooted avian tree the passerines were grouped together on the tree, but could become paraphyletic, or
even diphyletic when the outgroup was added (Slack et al. 2003). Such disruption of the ingroup by a
distant outgroup is known from simulation studies (Holland et al. 2003) and here the ingroup tree by itself
was more likely to be correct. A similar ingroup disruption was also found with mammals (Lin et al. 2002).
In general, distant outgroups are hard to place correctly into the ingroup tree (Holland et al. 2003). Taxon
sampling from Passeriformes has been sparse with only one suboscine (broadbill) and two oscines (rook
and indigobird) included at that time (Braun and Kimball 2002). Base composition bias might also have
played a role since phylogenetic reconstructions under a non-homogeneous model dealing with base
composition heterogeneity (Paton et al. 2002) and RY-coding analyses (Braun and Kimball 2002)
supported the classical rooting of the avian tree between paleognaths and neognaths. However, the position
of the root of the avian tree is still difficult to resolve clearly with complete mitochondrial data and must be

28/8/08, page 4 of 28
tested by the inclusion of more basal neognaths (Galloanserae) as well as Passeriformes that appear
especially fast evolving (Harrison et al. 2004). Ideally, it is preferable for a result to be found by all good
methods of phylogenetic analysis, not just by one specialised analysis. In difficult cases, it might thus be
necessary for both theoretical and practical reasons to first build an unrooted tree, and then test the
placement of the root secondarily.
The phylogeny of paleognaths, with a particular emphasis on both living and extinct ratites, has been well
studied from the mitogenomic viewpoint (Härlid and Arnason 1999; Härlid et al. 1999; Cooper et al. 2001;
Haddrath and Baker 2001). Their origins and biogeographic evolution in relation to the tectonic
fragmentation of Gondwana are now relatively well understood (Cooper et al. 2001; Haddrath and Baker,
2001), although some relationships within ratites and between deep ratites and tinamous are still uncertain.
Turning to neognaths, they are usually divided into Galloanserae (chicken, ducks and allies) and Neoaves
(all other neognath birds). This subdivision is now well supported from molecular data by both
mitochondrial (Paton et al. 2002; Harrison et al. 2004) and nuclear sequences (van Tuinen et al. 2000;
Garcia-Moreno et al. 2003; Chubb 2004). We have recently added the magpie goose (Anseranas
semipalmata) a basal member of the water fowl lineage (Anseriformes) to the complete mitochondrial
dataset, establishing an important calibration point for avian evolution (Harrison et al. 2004). In the present
study, we include a basal member (Ericson et al. 2002b) of the chicken-related lineage (Galliformes) by
sequencing the complete mitochondrial genome of the Australian brush-turkey (Alectura lathami,
Megapodiidae). This is expected to break the relatively long ancestral lineage leading to chicken and quail,
and to test the relationships within Galloanserae further.
Phylogenetic relationships among the six or more major groups of Neoaves that contain the vast majority of
extant bird species remain elusive and are usually represented as a multifurcation (Cracraft 2001; Cracraft
et al. 2004). Within this unresolved phylogeny, Passeriformes are by far the most speciose group. The
current taxonomy of oscines, based mainly on the results of DNA/DNA hybridizations (Sibley and
Ahlquist 1990), has recently been challenged by analyses of both nuclear and mitochondrial genes (Irestedt
et al. 2001; Ericson et al. 2002a,b; Ericson and Johansson 2003; Barker et al. 2004). Based on these new
results a new taxonomy of major passerine groups has been proposed (Ericson et al. 2002b). Three major
lineages have been distinguished: Acanthisittia (New Zealand wrens), suboscines (Eurylaimides or Old
World suboscines and Tyrannides or New World suboscines) and oscines (Menurae and Euoscines).
Oscines and Suboscines are grouped together into Eupasseres to the exclusion of New Zealand wrens, the
latter representing the most basal lineage of Passeriformes. The early emergence of New Zealand wrens

28/8/08, page 5 of 28
within Passeriformes is consistent with a Gondwanan origin for the whole passerine group (Cracraft 2001;
Barker et al. 2002; Edwards and Boles, 2002; Ericson et al. 2002a).
The passerines have been represented in the mitogenomic database by only three taxa: the gray-headed
broadbill (Smithornis sharpei; Eurylemidae) belonging to the Old World suboscines, and two Euoscines:
the village indigobird (Vidua chalybeata; Estrildidae) and the rook (Corvus frugilegus; Corvidae). Under
the new classification (Ericson et al. 2002b) rook and indigo bird are both in the Euoscines, leaving the
Menurae unrepresented. A representative of New Zealand wrens, the rifleman (Acanthisitta chloris;
Acanthisittidae) has been recently added to the complete mitochondrial dataset, but its position was still
locally unstable within passerines (Harrison et al. 2004). By incorporating the new complete mitochondrial
genomes of the superb lyrebird (Menura novaehollandiae; Menuridae) representing the second major group
of oscines, and the fuscous flycatcher (Cnemotriccus fuscatus; Tyrannidae) a member of the New World
suboscines, we now have a much more representative taxon sampling of Passeriformes. We expect from
theory (Hendy and Penny 1989) and from simulations (Holland et al. 2003) that these key taxa will stabilise
the relationships within Passeriformes by subdividing the two long branches leading to oscines and
suboscines, respectively. This is especially important in order to tackle issues such as the position of the
rifleman within passerines, and especially the central question of the position of the root of the avian tree.
Another interesting aspect of the current mitochondrial tree is the difficulty (Haring et al. 2001; Slack et al.
2003; Harrison et al. 2004) in recovering the expected monophyly of birds of prey (Falconiformes) –
currently represented by the buzzard (Buteo buteo; Accipitridae) and the falcon (Falco peregrinus;
Falconidae). Falconiformes are part of a large group of Neoaves including seabirds, shorebirds, doves,
cranes, rails, flamingos, penguins, loons and grebes (Cracraft, 2001), a major grouping we informally call
the Conglomerati (or Cracrafti). The buzzard and falcon share the same alternative mitochondrial gene
order, but are fairly divergent from each other and seem to represent an early split in the raptor lineage
(Haring et al. 2001). Thus we again have sparse taxon sampling. Previously, only partitioned-likelihood
phylogenetic analyses (with RY-coding third codon positions of the mitochondrial proteins plus nucleotides
from RNAs) appearing to support their monophyletic origin (Harrison et al. 2004).
As a first step we have sequenced the complete mitochondrial genome of the turkey vulture (Cathartes
aura; Cathartinae). This provides an opportunity to test the Sibley and Ahlquist hypothesis (1990) that New
World vultures (Cathartinae) are closer to storks (Ciconiinae) than to other birds of prey. It has long being
realised that New World and Old World vultures may not share a most recent common ancestor, but may
instead represent an example of morphological convergence resulting from adaptation to a scavenging way

28/8/08, page 6 of 28
of life (see Sibley and Ahlquist 1990 for an historical review). However, the question of whether New
World vultures are more closely related to storks, as suggested by behavioural resemblances (Rea, 1983)
and DNA/DNA hybridisations (Sibley and Ahlquist 1990), or to birds of prey (including Old World
vultures) is still ambiguous (Seibold and Helbig 1995). Resolving this question certainly requires more
molecular data (Helbig and Seibold 1996).
The order Charadriiformes represents a very large and diversified group of shorebirds which also belongs
to the Conglomerati/Cracrafti (Cracraft 2001). Shorebirds are usually divided in three major clades:
Charadrii (oystercatchers, thick-knees, sheathbills, plovers, and allies), Scolopaci (turnstones, sandpipers
and jacanas), and Lari (gulls, coursers, pratincoles, terns, skimmers, and skuas) (see Van Tuinen et al.
2004). DNA/DNA hybridisation suggested an early emergence of Scolopaci with a sister-group
relationship between Charadrii and Lari (Sibley and Ahlquist 1990). The first two shorebird mitochondrial
genomes to be sequenced were the blackish oystercatcher (Haematopus ater; Haematopodidae) and the
ruddy turnstone (Arenaria interpres; Scolopacidae) (Paton et al. 2002). Since then, data from nuclear genes
have explored the relationships among shorebirds families (Ericson et al. 2003; Paton et al. 2003; Thomas
et al. 2004). These have challenged the DNA/DNA hybridisation results by finding a closer relationship
between Scolopaci and Lari with an early divergence of Charadrii. The sequencing of the southern black-
backed gull (Larus dominicanus; Laridae) mitochondrial genome offers the opportunity to test the new
nuclear-based hypothesis by adding a representative of the previously unsampled third major group of
Charadriiformes (Lari, gulls).
Here we report mitochondrial genomes for five birds chosen to help clarify the deepest divisions and test
specific phylogenetic hypotheses in the avian tree. The sequences have been determined for the brush
turkey (Alectura lathami, Megapodiidae), two passerines with a flycatcher (Cnemotriccus fuscatus;
Tyrannidae) and the superb lyrebird (Menura novaehollandiae; Menuridae), the turkey vulture (Cathartes
aura; Cathartinae) and a gull (Larus dominicanus; Laridae). The phylogenetic analyses using maximum
likelihood and Bayesian methods support a growing consensus from nuclear, mitochondrial and
morphological data for the position of the root of the avian tree and for its first main divisions. The turkey
vulture is not positioned with the stork and the gull joins with the turnstone.
Materials and Methods
Tissue samples
The southern black-backed gull (Larus dominicanus [Lichtenstein, 1823]) came from Waikanae, New
Zealand and was supplied by the New Zealand Department of Conservation (Kapiti Area branch). The

28/8/08, page 7 of 28
Australian brush-turkey (Alectura lathami [Gray, 1831]) and superb lyrebird (Menura novaehollandiae
[Latham, 1802]) samples came from Australia. Darryl Jones (Australian School of Environmental Studies,
Griffith University, Brisbane) and Ian Owens (Queensland University) provided the brush-turkey, and
Cathy Nock (Centre for Animal Conservation Genetics, Southern Cross University [Lismore campus], New
South Wales) the lyrebird. The turkey vulture (Cathartes aura [Linnaeus, 1758]) came from Texas, USA
and the fuscous flycatcher (Cnemotriccus fuscatus [Wied-Neuwied, 1831]) from Peru. Both samples were
supplied by the Louisiana State University Museum of Natural Science Collection of Genetic Resources
(sample numbers: turkey vulture LSUMNS B-17242, flycatcher LSUMNS B-7284).
DNA extraction and sequencing
Genomic DNA was extracted from 25-50 mg of sample tissue using the High PureTM
PCR Template
Preparation Kit (Protocol Vb; Boehringer Mannheim). To minimize the possibility of obtaining nuclear
copies of mitochondrial (mt) genes (numts), the five mitochondrial genomes were amplified in two (turkey
vulture, flycatcher) or three (gull, brush-turkey, lyrebird) overlapping fragments using long range PCR. The
long range products (see below) were recovered from agarose gels using an appropriate kit (e.g. ConcertTM
Rapid Gel Extraction System kit [GIBCO BRL/Life Technologies], AccuPrep™ Gel Purification Kit
[Bioneer]). They were then used as templates in a second round of PCR amplification (overlapping
fragments of 0.3 - 3.1 kb in length). PCR reactions were set up using the long range and reamplification
conditions described in Slack et al. (2003). Annealing temperatures for the reamplifications ranged from 48
to 60°C and extension times from 1 to 3 minutes. The conserved primers used were from Kocher et al.
(1989), Sorenson et al. (1999), Cooper et al. (2001) and Cooper et al. (unpublished), with some being
modified from the original, or were designed from alignments of bird mitochondrial genes. Where
necessary (e.g. control region), specific primers were designed for individual birds using the Oligo® 4.03
program (National Biosciences, Inc.).
The positions and sizes of the long-range PCR products and the annealing temperatures, extension times
and primers used to generate them are given below. Primer nomenclature: Av (avian) position gene
direction (F: forward; R: reverse). Positions and genes indicate where the 3’ end of the primer binds in the
chicken mitochondrial genome. To avoid confusion, ‘gene’ and ‘direction’ are inverted for rRNA primers.
12S or 16S rRNA to tRNA-Leu(CUN):
Turkey vulture and flycatcher (11.3 kb): 60°C, 8 min
Gull, brush-turkey and lyrebird (9.3 kb): 53°C, 9.5 min and 2 x 54°C, 10 min, respectively
Turkey vulture and flycatcher: Av1753F12S (25 nt): 5’-AAACTGGGATTAGATACCCCACTAT-3’

28/8/08, page 8 of 28
Gull, brush-turkey and lyrebird: Av3725F16S-LR (32 nt): 5’-
AATAGGGTTTACGACCTCGATGTTGGATCAGG-3’
All five birds: Av13026tLeuR2-LR (37 nt): 5’-
CTTGGAKTTGCACCAAGRTDVTTGGTTCCTAAGACCA-3’
COIII to tRNA-Pro:
Gull and brush-turkey (5.5 kb): 54°C, 5.5 and 7 min respectively; lyrebird (7.6 kb): 52°C, 8 min
Av10647COIIIF (23 nt): 5’-TTTGAAGCAGCAGCCTGATAYTG-3’
Av16137tProR (23 nt): 5’- ARAATRCCAGCTTTGGGAGTTGG-3’
Cytb to tRNA-Met:
Gull (6.2 kb): 53°C, 8 min
Av15656CytbF (20 nt): 5’-AACCTGTTAGGRGAYCCAGA-3’
Av5201tMetR (20 nt): 5’- CCATCATTTTCGGGGTATGG-3’
tRNA-Leu(CUN) to 16S rRNA:
Brush-turkey (7.4 kb) and lyrebird (8.5 kb): 55°C and 54°C respectively, 10 min
Both: Av13063tLeuF-LR (38 nt): 5’-TGGTCTTAGGARCCATCTATCTTGGTGCAAMTCCAAGT-3’
Brush-turkey: Av3782R16S (22 nt): 5’-CGGTCTGAACTCAGATCACGTA-3’
Lyrebird: Av3797R16S (22 nt): 5’-CGACCTGGATTTCTCCGGTCTG-3’
COIII to 16S rRNA:
Turkey vulture (9.9 kb) and flycatcher (10.3 kb): Av10647COIIIF and Av3797R16S (60°C, 8 min)
The reamplification products were purified by treatment with 2 units of shrimp alkaline phosphatase (SAP)
and 10 units of Exonuclease I (incubated at 37ºC for 30 min then 80ºC for 15 min) or were recovered from
agarose gels as above. Two regions of the lyrebird mitochondrial genome were cloned: a 0.9 kb fragment
spanning the end of tRNA-Phe plus the start of 12S rRNA and a 1.4 kb fragment covering part of the
control region, tRNA-Pro and part of NADH6. The PCR products were ligated into the pGem®-T Easy
vector (Promega) and transformed into MAX Efficiency® DH5α™ competent cells (Invitrogen) following
manufacturer’s instructions. Plasmid DNA was isolated from transformants containing inserts using the
GenElute™ Plasmid Miniprep Kit (Sigma). Two clones were sequenced for the first region (plus direct
sequence from a PCR product generated using a specific control region primer) and three clones for the
second. Sequencing reactions were run on ABI 377 or ABI 3730 sequencers and were set up according to

28/8/08, page 9 of 28
manufacturer’s instructions. Sequences were manually checked/corrected (including the removal of any
primer sequence) and assembled using SequencherTM
4.1 (Gene Codes Corp.). Overlaps between sequences
were sufficient to ensure synonymy (usually ≥100 nt between individual sequences; a total of from 1 - 4 kb
between the different long range products). Sequence identity was confirmed through Fasta searches of the
EMBL database (http://www.ebi.ac.uk/fasta33/nucleotide.html).
Dataset assembly
In addition to the five new birds from this paper, 25 other complete avian mitochondrial genomes were
included in the analyses (18 neognaths and seven paleognaths). The 18 neognath taxa are: chicken (Gallus
gallus; GenBank accession number AP003317), Japanese quail (Coturnix japonica; AP003195), magpie
goose (Anseranas semipalmata; AY309455), redhead (duck, Aythya americana; AF090337), greater white-
fronted goose (Anser albifrons; AF363031), rifleman (NZ wren, Acanthisitta chloris; AY325307), gray-
headed broadbill (Smithornis sharpei; AF090340), village indigobird (Vidua chalybeata; AF090341), rook
(Corvus frugilegus; Y18522), peregrine falcon (Falco peregrinus; AF090338), Eurasian buzzard (Buteo
buteo; AF380305), blackish oystercatcher (Haematopus ater; AY074886), ruddy turnstone (Arenaria
interpres; AY074885), Oriental stork (Ciconia boyciana; AB026193), red-throated loon (Gavia stellata;
AY293618), little blue penguin (Eudyptula minor; AF362763), black-browed albatross (Diomedea
melanophris; AY158677) and Kerguelen petrel (Pterodroma brevirostris; AY158678). The seven
paleognath taxa are: emu (Dromaius novaehollandiae; AF338711), southern cassowary (Casuarius
casuarius; AF338713), great spotted kiwi (Apteryx haastii; AF338708), greater rhea (Rhea americana;
Y16884), ostrich (Struthio camelus; Y12025), great tinamou (Tinamus major; AF338707) and elegant
crested tinamou (Eudromia elegans; AF338710). The most up-to-date version of each GenBank file was
used and the original chicken mitochondrial genome (X52392) used in previous analyses (e.g. Harrison et
al. 2004, Slack et al. 2006) has been replaced by a more recent sequence.
Six reptiles were used as outgroups: American alligator (Alligator mississippiensis; Y13113), spectacled
caiman (Caiman crocodylus; AJ404872), eastern painted turtle (Chrysemys picta; AF069423), green turtle
(Chelonia mydas; AB012104), blue-tailed mole skink (Eumeces egregius; AB016606) and common iguana
(Iguana iguana; AJ278511). This is the same set of outgroups used previously (for example, Harrison et al.
2004; Slack et al. 2006).
Two neoavian taxa (an owl and a parrot; Harrison et al. 2004) and three paleognaths (extinct NZ moas;
Cooper et al. 2001, Haddrath and Baker 2001) were omitted from the full analyses until paired taxa are
available. In the meantime, the owl and parrot do not affect the position of the root of the avian tree that is

28/8/08, page 10 of 28
the focus of this study. We are in the process of sequencing a barn owl (Tyto), an African parrot (lovebird,
Agapornis) and a forest falcon (Micrastur) (www.awcmee.massey.ac.nz/mt_genomes). Based on previous
experience of improved taxon sampling (Lin et al. 2002; Delsuc et al. 2003; Harrison et al. 2004) the
addition of these three mitochondrial genomes will help stabilize the position of both owls and parrots
within Neoaves for future analyses. Similarly, there is some instability within paleognaths when moas are
included (Slack et al. 2003), and the issue of fine-tuning paleognath interrelationships will be readdressed
once additional kiwi sequences become available (G.C. Gibb, in preparation).
Phylogenetic analysis
Sequences were aligned in SeAl v1 (Rambaut 1996), at the amino acid level for protein-coding genes, and
based on secondary structure for RNA genes. Each dataset has 12 protein-coding genes, two rRNAs and 21
tRNAs (lacking tRNA-Phe because it is still not available for the rifleman). Gaps, ambiguous sites adjacent
to gaps, the NADH6 (light-strand encoded), and stop codons (often incomplete in the DNA sequence),
were excluded from the alignment.
We made two alignments; with and without the 6 outgroup taxa. The ‘birds-only’ dataset was used first to
study relationships within the ingroup (birds) in order to test whether there were any changes to the tree
when the outgroup was added. In practice, the tree from the birds-only dataset was compared with the tree
using only the birds from the full alignment (aligned including the outgroup). This allowed the separation
of any effects of adding the outgroup, from any changes from the alignment. The full dataset had 11,737
unambiguously aligned nucleotide sites, the birds-only dataset has 13,440 nucleotides (15% longer).
In previous work, RY-coding of the most variable partitions of the nucleotide data (especially the 3rd codon
position) has been shown to be advantageous (Delsuc et al. 2003; Phillips and Penny 2003; Phillips et al
2006). The recoding increases the proportion of changes on internal branches of the tree (treeness) and
alleviates the differences in nucleotide composition (Relative Compositional Variability, RCV). It also
increases concordance between mitochondrial and nuclear datasets. RY-coding does increase the ML
scores, but because RY-coding is not strictly nested within nucleotide coding (M.A. Steel, pers. comm.) it
is not valid to compare their ML scores directly. However, because of the better fit of the data to the model
(higher treeness, and less variability in nucleotide composition (lower RCV), this is our preferred method
of analysis of vertebrate mitochondrial data. Thus the trees reported here were inferred with the third codon
positions recoded as R and Y. Analysis is by standard programs including ModelTest (Posada and Crandall
1998), PAUP* (Swofford 1998) and MrBayes (Ronquist and Huelsenbeck 2003). We ran 500
unconstrained ML bootstrap replicates with PAUP* on the Helix computing cluster

28/8/08, page 11 of 28
(www.helix.massey.ac.nz), plus a partitioned Bayesian analysis using four MCMCMC chains of 107
generations. The full data sets and command blocks for both PAUP* and MrBayes are available in nexus
format at www.awcmee.massey.ac.nz/downloads. These files illustrate the procedures used both in finding
optimal estimates for gamma and invariant sites for the different data partitions, as well running subsets of
the data as RY coded.
Results
The five new avian complete mitochondrial genomes are deposited in GenBank under the following
accession numbers: Australian brush-turkey (Alectura lathami, AY346091); superb lyrebird (Menura
novaehollandiae, AY542313); fuscous flycatcher (Cnemotriccus fuscatus, AY596278); southern black-
backed gull (Larus dominicanus, AY293619); and turkey vulture (Cathartes aura, AY463690). The gull,
brush-turkey and turkey vulture have the standard avian gene order first identified in the chicken
(Desjardins and Morais 1990). This is expected in that the other galliforms in the dataset (chicken and
quail) and the two other shorebirds (oystercatcher and turnstone) are already known to have the standard
gene order. However, the turkey vulture also appears to have the standard avian gene order, and thereby
differs from the two falconiform mitochondrial genomes (falcon and buzzard) already available. By itself,
this is certainly of interest, but not sufficient yet to exclude it from the falconiforms, even though for
characters with an extremely high number of states parsimony is an ML estimator (Steel and Penny 2004).
The lyrebird and flycatcher genomes have the alternative avian gene order first recognized by Mindell et al.
(1998). The flycatcher result is as expected; Mindell et al. (1998) examined nine major suboscine lineages
(including a tyrannid flycatcher) and found that all had the alternative gene order. On the other hand,
Mindell et al. (1998) found that a set of 106 oscine species had the standard avian gene order. However,
that set was mostly Passeridae (90 taxa) and Fringillidae (11 taxa) and the remaining five families
(Corvidae, Sturnidae, Cisticolidae, Certhiidae, Estrildidae) were each represented by a single taxon.
Although Mindell et al. (1998) concluded “that the alternative mitochondrial gene orders distinguish the
two primary groups of songbirds (order Passeriformes), oscines and suboscines” Bensch and Härlid (2000)
subsequently identified the alternative gene order in an oscine group (Phylloscopus warblers, Sylviidae).
The lyrebird (Menuridae) now provides the second example of the alternative gene order in oscine
passerines. The duplicated control region associated with the alternative gene order has been reduced to a
short non-coding region in both the lyrebird and the Phylloscopus warblers. However, if this non-coding
region is still similar to the control region then the sequence fragment (most of NADH6, tRNA-Glu, part of
the control region) that Mindell et al. (1998) used to examine most of their oscine species (102 of 106)
might not detect the alternative gene order when it is present. This could happen, for example, where the

28/8/08, page 12 of 28
rearrangement is recent, or if a form of concerted gene evolution homogenized the duplicates (G.C. Gibb et
al. in prep.).
Unrooted tree
We know from both simulations (Holland et al. 2003) and empirical studies on mammals (Lin et al. 2002)
and birds (Slack et al. 2003) that an outgroup can disrupt a previously established ingroup tree (see
Introduction). Therefore we first report an unrooted ML tree for the 30 bird sequences, together with the
results of 500 full ML bootstrap runs. The data is the combined protein coding and RNA genes for both
datasets – aligned with or without the 6 outgroup taxa, giving a combined length of 11,737 and 13,440
nucleotides respectively. Again, we find that re-coding the 3rd
position (cdp) as R/Y characters markedly
reduces the relative compositional variability (RCV), and increases the signal on the internal branches
compared with the external branches (the treeness value is increased). As before, the models were
optimized separately for each of the four data partitions using ModelTest (Posada and Crandall 1998). The
four partitions were: codons 1&2; codon 3; RNA stems; and RNA loops. The unrooted maximum
likelihood tree for the birds-only dataset is shown in Figure 1.
The position of the megapode (brush turkey) is, as expected, a deep lineage in Galliformes, and the three
galliforms (chicken, quail and brush-turkey) then group with the three anseriforms (duck, goose, and
magpie goose [Anseranas]), forming Galloanserae. The tyrant flycatcher, as expected, joins with the other
suboscine (broadbill) and their union is quite deep. Similarly, the lyrebird is deeper in the oscines than the
indigo bird/rook divergence. It is worth noting that with the new oscine and suboscine included that the NZ
wren (rifleman) now comes basal to the passerines. Overall, the results strongly support the revised
classification of oscines (Ericson et al. 2002b) into Menurae (which includes lyrebird) and Euoscines
(which includes rook and indigo bird). These three new taxa (brush turkey, tyrant flycatcher and lyrebird)
were selected from prior knowledge in anticipation that they would break up long branches that could be
attracting the outgroup (a long-branch attraction problem, Hendy and Penny 1989) when rooting the avian
tree. This will be re-examined later when examining the position of the root.
The gull joins strongly with the turnstone, rather than with the other shorebird (oyster catcher). More
formally, the Lari (gulls) are closer to the Scolopaci (turnstones) than to the Charadrii (oyster catcher). The
result is in agreement with the results from nuclear data of Ericson et al. (2003) and Paton et al. (2003). It is
not in agreement with Sibley and Ahlquist (1990), but it is only a single interchange (nearest neighbor
interchange) on the tree. We say that a tree is ‘locally stable’ if taxa shift no more than one branch on the

28/8/08, page 13 of 28
tree (Cooper and Penny, 1997). Again, the agreement of nuclear and mitochondrial data is pleasing, but
expected.
The fifth new species is the turkey vulture – a New World vulture. The two issues here are whether the
falconiforms (in a broad sense) are monophyletic, and if not, whether the turkey vulture goes with the stork.
On the present dataset, turkey vulture does not come with the two other falconiforms, but nor is it
particularly close to the stork. Thus there is some support for the independent origin of core falconiforms
and New World vultures, but we need a wider selection of taxa, such as flamingos, grebes, herons, rails,
etc. before firmly identifying the closest relative of New World vultures. However, it is also desirable to
have additional core falconiforms, because the falcon still has a tendency to go deeper in the tree,
disrupting the falcon/buzzard group. Similarly, Fain and Houde (2004) do not recover the falcon/buzzard
clade, emphasizing the need for additional taxa. On the present data set the falconiforms (in the broad
sense, including New World vultures) are not monophyletic, but we cannot distinguish yet between their
being polyphyletic (diphyletic in this case) or paraphyletic. This latter case is potentially interesting from
the ecological/life histories viewpoint in that many of the sea- and shorebirds may have diversified from
carnivores (raptors) into a related niche in a marine environment. At present, the position of both the
peregrine falcon and the stork are still locally unstable and improved taxon sampling is thus required.
Rooted tree
The incorporation of the brush turkey, the tyrant flycatcher and the lyrebird breaks up long unbranched
edges situated deep in the avian tree. Therefore the next step is to identify what (if any) effect this has for
locating the position of the root in the avian tree. Figure 2 is the rooted tree, using the six taxa outgroup
constituted of two crocodilians, two turtles and two lizards. This reptilian outgroup joins with strong
support between paleognaths and neognaths (Figure 2), and is thus consistent with most recent work on
both nuclear genes (van Tuinen et al. 2000; Chubb 2004; Garcia-Moreno et al. 2003) and mitochondrial
genomes (Paton et al. 2002; Harrison et al. 2004). Of the outgroup taxa, crocodilians are again closest to
birds.
An important observation is that the addition of the outgroup does not make major disruptions to the
ingroup tree as was previously the case with fewer taxa (Slack et al. 2003). As mentioned earlier,
simulations (Holland et al. 2003) have shown that the addition of the outgroup can lead to disruption of the
previously established relationships within the ingroup as it has been observed in placental mammal
mitogenomic trees for example (Lin et al. 2002). It is therefore pleasing that the basic ingroup tree (from
the unrooted tree of Figure 1) is not altered when the outgroup is included, giving us more confidence in

28/8/08, page 14 of 28
the present rooting. As a result, the paleognath/neognath division is supported as well as the strict
monophyly of passerines. As before, there is increased support for the chicken/duck grouping
(Galloanseriforms), again in agreement with morphological (Cracraft 2001), nuclear (van Tuinen et al.
2000; Chubb 2004; Garcia-Moreno et al. 2003) and mitochondrial (Paton et al. 2002; Harrison et al. 2004)
datasets. Within the Neoaves, there is strong support for Passeriformes occupying a basal position, and the
Conglomerati (Cracrafti) still holds up, though significant groups such as rails and pigeons are not yet
represented and there are differences in predictions between Cracraft (2001) and Cracraft et al. (2004).
There is one interesting difference between the birds-only results (Figure 2), and the tree derived from the
alignment that includes the 6 outgroup taxa (Figure 1). This is that the first divergence is between
shorebirds and raptors/ seabirds on the birds-only dataset, but the falconiforms (buzzard and falcon in
particular) are deeper on the tree from the alignment containing the 6-taxon outgroup. This difference,
especially the deeper divergence of shorebirds is worth following up, given the comment of Feduccia
(2006) that shorebirds appear to be a late Cretaceous lineage, and from the results of Slack et al (2006) that
discusses the agreement here between estimates of times of divergence from molecular data and existence
of early fossil footprints of birds. However, some relationships within the Conglomerati remain unresolved
with low bootstrap values except for the monophyly of Charadriiformes and for the putative grouping of
Procellariformes with Gaviiformes, Sphenisciformes and Ciconiiformes (Figures 2 and 3). The lack of
conflicting signal for this latter grouping (see Figure 3) is interesting in that it argues against there being
any strong systematic bias (Phillips et al. 2004).
Increased stability from breaking up long branches (edges).
A primary interest here is testing whether the improved taxon sampling (breaking up long branches within
the avian tree) leads to improved stability. Qualitatively it appears so since the addition of brush turkey,
tyrant flycatcher and lyrebird, has significantly increased the strength of the rooting between paleognaths
and neognaths. To make this conclusion quantitative we deleted each of the 30 avian taxa in turn, and ran
100 bootstrap samples on each of the reduced 30 data sets, using ML. Thus each dataset had 29 birds and
the 6 outgroup taxa. This is essentially a jackknife approach (Lanyon 1985), deleting taxa sequentially and
measuring the effect (Penny and Hendy 1985). For the 30 bootstrap runs, the outgroup was constrained so
that the six outgroup taxa always grouped together, as well as the two turtles, the two crocodilians and the
two lizards. There were no constraints on the avian tree. For each of the 30 datasets the percentage of trees
from the 100 bootstrap samples were summed under the categories of paleo/neognath rooting, rooting
within paleognaths, galloanseriform rooting, passerine rooting, or within the Neoaves generally (Table 1).
For both the galloanseriform and passerine cases the results include the rooting within, for example,
galloanseriforms or between galloanseriforms and all other birds.
28/8/08, page 15 of 28
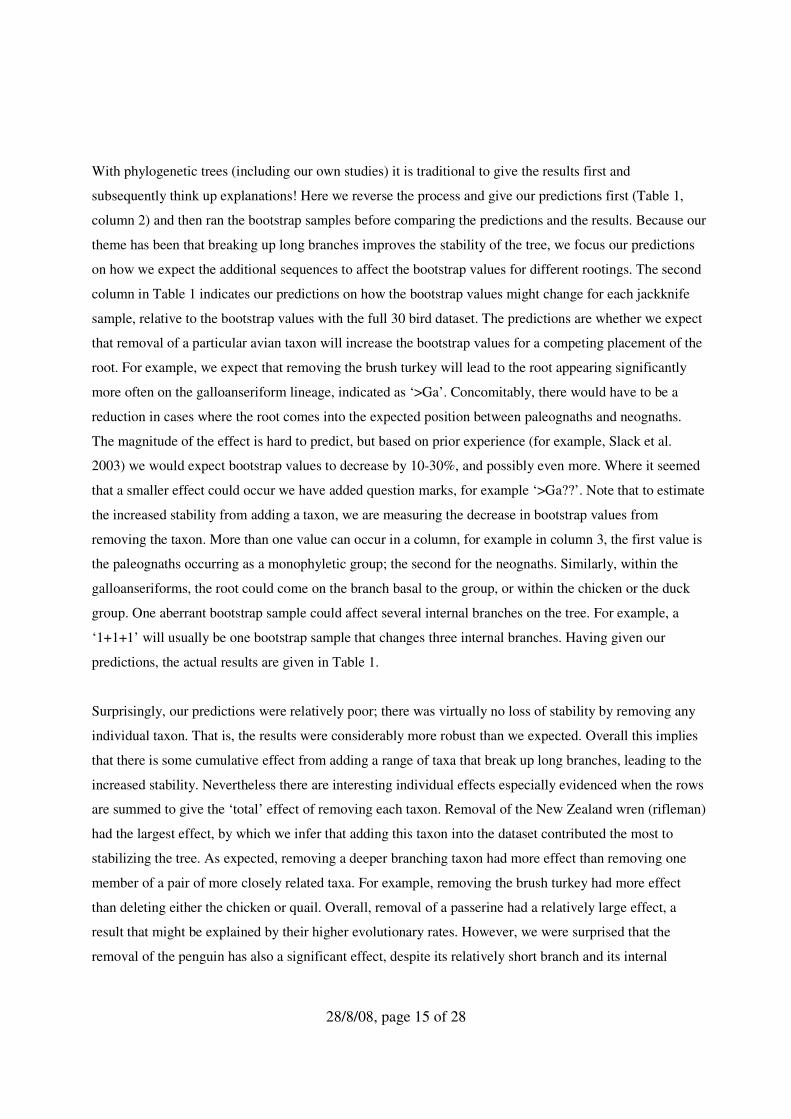
With phylogenetic trees (including our own studies) it is traditional to give the results first and
subsequently think up explanations! Here we reverse the process and give our predictions first (Table 1,
column 2) and then ran the bootstrap samples before comparing the predictions and the results. Because our
theme has been that breaking up long branches improves the stability of the tree, we focus our predictions
on how we expect the additional sequences to affect the bootstrap values for different rootings. The second
column in Table 1 indicates our predictions on how the bootstrap values might change for each jackknife
sample, relative to the bootstrap values with the full 30 bird dataset. The predictions are whether we expect
that removal of a particular avian taxon will increase the bootstrap values for a competing placement of the
root. For example, we expect that removing the brush turkey will lead to the root appearing significantly
more often on the galloanseriform lineage, indicated as ‘>Ga’. Concomitably, there would have to be a
reduction in cases where the root comes into the expected position between paleognaths and neognaths.
The magnitude of the effect is hard to predict, but based on prior experience (for example, Slack et al.
2003) we would expect bootstrap values to decrease by 10-30%, and possibly even more. Where it seemed
that a smaller effect could occur we have added question marks, for example ‘>Ga??’. Note that to estimate
the increased stability from adding a taxon, we are measuring the decrease in bootstrap values from
removing the taxon. More than one value can occur in a column, for example in column 3, the first value is
the paleognaths occurring as a monophyletic group; the second for the neognaths. Similarly, within the
galloanseriforms, the root could come on the branch basal to the group, or within the chicken or the duck
group. One aberrant bootstrap sample could affect several internal branches on the tree. For example, a
‘1+1+1’ will usually be one bootstrap sample that changes three internal branches. Having given our
predictions, the actual results are given in Table 1.
Surprisingly, our predictions were relatively poor; there was virtually no loss of stability by removing any
individual taxon. That is, the results were considerably more robust than we expected. Overall this implies
that there is some cumulative effect from adding a range of taxa that break up long branches, leading to the
increased stability. Nevertheless there are interesting individual effects especially evidenced when the rows
are summed to give the ‘total’ effect of removing each taxon. Removal of the New Zealand wren (rifleman)
had the largest effect, by which we infer that adding this taxon into the dataset contributed the most to
stabilizing the tree. As expected, removing a deeper branching taxon had more effect than removing one
member of a pair of more closely related taxa. For example, removing the brush turkey had more effect
than deleting either the chicken or quail. Overall, removal of a passerine had a relatively large effect, a
result that might be explained by their higher evolutionary rates. However, we were surprised that the
removal of the penguin has also a significant effect, despite its relatively short branch and its internal

28/8/08, page 16 of 28
position in the avian tree. We had assumed that the problem was that the stork was relatively unstable on
the tree, but we must consider penguin as a potentially difficult taxon.
In an additional analysis, we computed a Z-closure super-network (Huson et al. 2004), using SplitsTree
4.1 (Huson and Bryant 2006), from the 30 jackknife ML trees where each avian species was omitted in
turn from the rooted tree (Figure 3). This method offers a graphical summary of the topologies of the 30
jackknifed trees and allows identification of the parts of the phylogeny which were in agreement for all the
30 trees with 29 avian taxa. Areas of conflict are represented as rectangles in the super-network, reflecting
any instability caused by removing individual taxa. The results in Figure 3 are striking in that there is no
incongruence detected with respect to the position of the root of the avian part of the tree. This again
shows the lack of effect of removing any single taxon and illustrates that a robust rooting of the avian tree
can be obtained by using an expanded number of mitochondrial genomes. In contrast, uncertainty is
detected in three places within the avian tree corresponding to areas of instability identified previously
(see Figure 2). The first is between the tinamou and the deeper ratites (ostrich and rhea) where the tree is
not completely stable and therefore removing taxa has an effect. Similarly, there is a tendency for the
rifleman to come onto the basal suboscine branch as represented by a cycle in Figure 3. However, the
major effect was inside the Conglomerati (Cracrafti) with a series of boxes involving the raptors
(including turkey vulture) and the sea birds and shore birds. Either the core raptors (falcon and buzzard) or
the shore birds can come out basal in this Conglomerati group. This relatively unstable part of the avian
tree is being studied further by sequencing additional mitochondrial genomes, including osprey, a forest
falcon, and additional potential relatives of stork and penguin. However, although the variability within
the Conglomerati (Cracrafti) is very interesting, it is not relevant to the question at hand of demonstrating
the stability of the root of the avian tree.
Discussion
The long-term goal of this project is to use nuclear and mitochondrial sequences, together with fossil data,
to test modes of macroevolution in the Late Cretaceous (Penny and Phillips 2004). The primary aim of this
study is to determine whether the breaking up of some long branches on the avian tree leads to agreement
between nuclear and mitochondrial data on the position of the root. In this respect, the position of the root
now appears in agreement between morphological, nuclear and mitochondrial data, and thus it is time to
move on to other questions. Data from complete mitochondrial genomes obviously takes longer to obtain
for each taxon than sequences from a single nuclear gene. This has lead to some false starts concerning the
position of the avian root due in part to incomplete taxon sampling (Härlid and Arnason 1999; Mindell et
al. 1999), though earlier analyses by Braun and Kimball (2002) and Slack et al. (2003) indicated that the

28/8/08, page 17 of 28
paleognath/neognath division could not be rejected. There appears to have been an ‘urban myth’ that
mitochondrial genomes could not recover the same avian root as morphological and nuclear data. In fact,
the main problem was incomplete taxon sampling, a problem that is better solved by more data collection
than by polemics. Indeed, it is hard to imagine theoretical reasons that would lead to different roots from
different datasets. It is unlikely that the trees would be fundamentally different and therefore additional
sequences and better methods of analysis are a more likely solution to the problem. We should all aim at
improving data sets to test whether they lead to consensus.
With the major early divisions having been resolved, perhaps the next step on the avian tree is to provide
resolution within Neoaves and especially within the Conglomerati (Cracrafti). For this specific question,
breaking up long branches does appear to be an effective strategy, but obviously depends on appropriate
taxa being available. When there was only a single suboscine (broadbill) and a single Falconiform (falcon)
in the dataset, there was a strong tendency for them to come together (see discussion in Slack et al. 2003).
However, with additional passerine being incorporated, we now have strong support for the respective
monophyly of both Passeriformes and Conglomerati. The falcon and the stork have both been difficult to
place in the mitogenomic tree in that both still appear to be uncertain about their final position. In early
datasets, the falcon could even occur at the base of the passerines (Slack et al. 2003). The addition of the
buzzard has reduced the wandering of the falcon, but the falcon/buzzard grouping is relatively weak, and
the falcon can go deeper within the neoaves. We are currently sequencing a forest falcon (Micrastur) to
determine its effect because in Sibley and Ahlquist (1990) this was the deepest divergence among relatives
of the falcon. The present data set has no species from within the proposed Metaves group of Fain and
Houde (2004), and thus we cannot yet comment on that hypothesis. Mitochondrial genomes from members
of that group are being completed and then we will be able to test the predicted distinction of Neoaves into
Metaves and Coronaves.
The problem of the early divisions of Neoaves is going to be difficult. Cracraft (2001) proposed six
unresolved groups, and this increased to nine in Cracraft et al. (2004). It has been suggested that the early
divergence of neoavian birds was an ‘explosive radiation’ (as just one example, see Poe and Chubb 2004).
However, for a radiation to be ‘explosive’ it requires both a rapid series of lineage divergences, combined
with simultaneous morphological and/or ecological adaptations. It would not be sufficient just for
divergences of lineages to be close together – that could occur very easily by a rapidly dispersing taxon
even though the subsequent ecological and morphological divergences occurred many millions of years
later. Such a delayed adaptation would scarcely be an ‘explosive’ radiation. The first aspect (rate of
diversification of lineages) is best studied from molecular data (as is done here). The second, the timing of

28/8/08, page 18 of 28
adaptations to new environments/niches is perhaps better studied from the fossil record. As yet, in the
present data we do not see any evidence whatsoever for an ‘explosive radiation’ of neoavian birds, even
though the early divergences may have been relatively rapid in Neoaves. We are more cautious, and want
to see data on the speed of morphological and ecological changes before coming to such dramatic
conclusion about an explosive radiation. We prefer at present to consider the early diversification of
Neoaves as an adaptive radiation, indicating that it is a relatively fast radiation but strictly according to
known microevolutionary principles.
Indeed, as mentioned earlier, one of our main goals is to determine the extent to which the processes of
microevolution are sufficient to explain macroevolution. This is the theme behind our models of avian and
mammal diversification in the Late Cretaceous (Penny and Phillips 2004), and whether (by comparing the
human and chimpanzee genomes) there is any aspect of the human genome that is not a normal
microevolutionary (genetic) process (Penny 2004). We think that the ‘explosive radiation’ should be to
restrict to possible cases where normal microevolutionary process are clearly insufficient to account for
macroevolution. To test such hypotheses we need a tree sufficiently stable in order that good timing
estimates are possible, preferably on combined nuclear and mitochondrial data. All progress in this
direction is welcomed.
Acknowledgements
We especially thank Dick Gill, Darryl Jones, Ian Owens, Cathy Nock, Fred Sheldon and Donna Dittman
for the samples. Tim White and Warwick Allen assisted with computer programs for running analyses on
the Helix supercomputer and Gillian Gibb for considerable assistance in manuscript preparation. F.D.
acknowledges the support of a Lavoisier Postdoctoral Grant from the French Ministry of Foreign Affairs.
Both the New Zealand Marsden Fund and the Centre for Research Excellence funds supported the work.

28/8/08, page 19 of 28
References
Barker, F.K., Barrowclough, G.F., Groth, J.G., 2002. A phylogenetic hypothesis for passerine birds:
taxonomic and biogeographic implications of an analysis of nuclear DNA sequence data. Proc. R. Soc.
Lond. B 269, 295–308.
Barker, F.K., Cibois, A., Schikler, P., Feinstein, J., Cracraft, J., 2004. Phylogeny and diversification of the
largest avian radiation. Proc. Natl. Acad. Sci. U.S.A. 101, 11040-11045.
Bensch, S., Härlid, A., 2000. Mitochondrial genomic rearrangements in songbirds. Mol. Biol. Evol. 17,
107-113.
Braun, E.L, Kimball, R.T., 2002. Examining basal avian divergences with mitochondrial sequences: Model
complexity, taxon sampling, and sequence length. Syst. Biol. 51, 614–625.
Buckley, T.R., 2002. Model misspecification and probabilistic tests of topology: Evidence from empirical
data sets. Syst. Biol. 51, 509-523.
Chang, J.T., 1996. Inconsistency of evolutionary tree topology reconstruction methods when substitution
rates vary across characters. Math. Biosc. 134, 189-215.
Chubb, A.L., 2004. New nuclear evidence for the oldest divergence among neognath birds: the
phylogenetic utility of ZENK (i). Mol. Phylogen. Evol. 30, 140-151.
Cooper, A., Lalueza-Fox, C., Anderson, S., Rambaut, A., Austin, J., Ward, R., 2001. Complete
mitochondrial genome sequences of two extinct moas clarify ratite evolution. Nature 409, 704–707.
Cooper, A., Penny, D., 1997. Mass survival of birds across the Cretaceous-Tertiary boundary: Molecular
evidence. Science 275, 1109–1113.
Cracraft, J., 2001. Avian evolution, Gondwana biogeography and the Cretaceous-Tertiary mass extinction
event. Proc. Roy. Soc. Lond. B 268, 459–469.
Cracraft, J., Barker, F.K., Braun, M. and 11 others, 2004. Phylogenetic relationships among modern birds
(Neornithes). In: J. Cracraft and M.J. Donoghue (Eds), Assembling the Tree of Life. Oxford Univ.
Press, pp 468-489.
Delsuc, F., Phillips, M.J., Penny, D., 2003. Comment on “Hexapod origins: monophyletic or paraphyletic?”
Science 301, 1482d.
Desjardins, P., Morais, R., 1990. Sequence and gene organization of the chicken mitochondrial genome - a
novel gene order in higher vertebrates. J. Mol. Biol. 212, 599-634.
Edwards, S.V., Boles, W. E., 2002. Out of Gondwana: the origin of passerine birds. Trends Ecol. Evol. 17,
347–340.
Edwards, S.V., Fertil, B., Giron, A., Deschavanne, P.J., 2002. A genomic schism in birds revealed by
phylogenetic analysis of DNA strings. Syst. Biol. 51, 599–613.

28/8/08, page 20 of 28
Ericson, P.G.P., Christidis, P.L., Cooper, A., Irestedt, M., Jackson, J., Johansson, U.S., Norman, J.A.,
2002a. A Gondwanan origin of passerine birds supported by DNA sequences of the endemic New
Zealand wrens. Proc. Roy. Soc. Lond. B 269, 235–241.
Ericson, P.G.P., Christidis, P.L., Irestedt, M., Norman, J.A., 2002b. Systematic affinities of the lyrebirds
(Passeriformes: Menura), with a novel classification of the major groups of passerine birds. Mol.
Phylogenet. Evol. 25, 53–62.
Ericson, P.G.P., Johansson, U.S., 2003. Phylogeny of Passerida (Aves: Passeriformes) based on nuclear
and mitochondrial sequence data. Mol. Phylogenet. Evol. 29, 126-138.
Ericson, P.G.P., Envall, I., Irestedt, M., Norman, J.A., 2003. Inter-familial relationships of the shorebirds
(Aves: Charadriiformes) based on nuclear DNA sequence data. BMC Evol. Biol. 3, 16.
Fain M.G., Houde, P., 2004. Parallel radiations in the primary clades of birds. Evolution 58, 2558-2573.
Feduccia, A., 2006. Mesozoic aviary takes form. Proc. Natl Acad. Sci. USA 103, 5-6.
Garcia-Moreno, J., Mindell, D.P., 2000. Rooting a phylogeny with homologous genes on opposite sex
chromosomes (gametologs): a case study using avian CHD. Mol. Biol. Evol. 17, 1826–1832.
Garcia-Moreno, J., Sorenson, M.D., Mindell, D.P., 2003. Congruent avian phylogenies inferred from
mitochondrial and nuclear DNA sequences. J. Mol. Evol. 56, 1–11.
Haddrath, O., Baker, A.J., 2001. Complete mitochondrial DNA genome sequences of extinct birds: ratite
phylogenetics and the vicariance biogeography hypothesis. Proc. R. Soc. Lond. B 268, 939–945.
Haring, E., Kruckenhauser, L., Gamauf, A., Riesing, M.J., Pinsker, W., 2001. The complete sequence of
the mitochondrial genome of Buteo buteo (Aves, Accipitridae) indicates an early split in the
phylogeny of raptors. Mol. Biol. Evol. 18, 1892–1904.
Härlid, A., Arnason, U., 1999. Analyses of mitochondrial DNA nest ratite birds within the “Neognathae”
supporting a neotenous origin of ratite morphological characters. Mol. Phylogenet. Evol. 12, 115–123.
Härlid, A., Janke, A., Arnason, U., 1999. The complete mitochondrial sequence of Rhea americana and
early avian divergences. J. Mol. Evol. 46, 669–679.
Harrison, G.L., McLenachan, P.A., Phillips, M.J., Slack, K.E., Cooper, A., Penny, D., 2004. Four new
avian mitochondrial genomes help get to basic evolutionary questions in the Late Cretaceous. Mol.
Biol. Evol. 21, 974-983
Helbig, A.J., Seibold, I. 1996. Are storks and New World vultures paraphyletic? Mol. Phylog. Evol. 6,
315–319.
Hendy, M.D., Penny, D., 1989. A framework for the quantitative study of evolutionary trees. Syst. Zool.
38, 297–309.
Holland, B.R., Penny, D., Hendy, M.D., 2003. Outgroup misplacement and phylogenetic inaccuracy under
a molecular clock: A simulation study. Syst. Biol. 52, 229–238.

28/8/08, page 21 of 28
Huson, D.H., Dezulian, T., Kloepper, T., Steel, M.A., 2004. Phylogenetic super-networks from partial
trees. IEEE/ACM Trans. Comput. Biol. Bioinform. 1, 151-158.
Huson D.H., Bryant D., 2006. Application of phylogenetic networks in evolutionary studies. Mol. Biol.
Evol. 23, 254 - 267.
Irestedt, M., Johansson, U.S., Parsons, T.J., Ericson, P.G.P., 2001. Phylogeny of major lineages of
suboscines (Passeriformes) analysed by nuclear DNA sequence data. J. Avian Biol. 32, 15–25.
Kocher, T.D., Thomas, W.K., Meyer, A., Edwards, S.V., Pääbo, S., Villablanca, F.X. and Wilson, A.C.,
1989. Dynamics of mitochondrial DNA evolution in animals: amplification and sequencing with
conserved primers. Proc. Natl Acad. Sci. USA 86, 6196-6200.
Lanyon, S.C., 1985. Detecting internal inconsistencies in distance data. Syst. Zool. 34, 397-403.
Lin, Y.-L., McLenachan, P.A., Gore, A.R., Phillips, M.J., Ota, R., Hendy, M.D., Penny, D., 2002. Four
new mitochondrial genomes, and the stability of evolutionary trees of mammals. Mol. Biol. Evol. 19,
2060–2070.
Livezey, B.C., Zusi, R.L., 2001. Higher-order phylogenetics of modern Aves based on comparative anatomy.
Netherlands J. Zool. 51, 179-205.
Mayr, G., Clarke, J., 2003. The deep divergences of neornithine birds: a phylogenetic analysis of
morphological characters. Cladistics 19, 527-553.
Mindell D.P., Sorenson, M.D., Dimcheff, D.E., 1998. Multiple independent origins of mitochondrial gene
order in birds. Proc. Natl Acad. Sci. USA 95, 10693–10697.
Mindell D.P., Sorenson, M.D., Dimcheff, D.E., Hasegawa, M., Ast, J.C., Yuri, T., 1999. Interordinal
relationships of birds and other reptiles based on whole mitochondrial genomes. Syst. Biol. 48, 138–
152.
Paton, T., Haddrath, O., Baker, A.J., 2002. Complete mitochondrial DNA genome sequences show that
modern birds are not descended from transitional shorebirds. Proc. Roy. Soc. Lond. B 269, 839–846.
Paton, T., Baker, A.J., Groth, J.G., Barrowclough, G.F., 2003. RAG-1 sequences resolve phylogenetic
relationships within Charadriiform birds. Mol. Phylogenet. Evol. 29, 268–278.
Penny, D., 2004. Our relative genetics. Nature 427, 208-209.
Penny, D., Foulds, L.R., Hendy, M.D., 1982. Testing the theory of evolution by comparing phylogenetic
trees constructed from five different protein sequences. Nature 297, 197–200.
Penny, D., Hendy, M.D., 1985. The use of tree comparison metrics. Syst. Zool. 34, 75-82.
Penny, D. Phillips, M.J., 2004. The rise of birds and mammals: Are microevolutionary processes sufficient
for macroevolution. Trends Ecol. Evol. 19, 516-522.
Phillips, M. J., Delsuc, F., D. Penny, D., 2004. Genome-scale phylogeny: sampling and systematic errors
are both important. Mol. Biol. Evol. 21, 1455-1458.

28/8/08, page 22 of 28
Phillips, M.J., Penny, D., 2003. The root of the mammalian tree inferred from whole mitochondrial
genomes. Mol. Phylogenet. Evol. 28, 171–185.
Phillips, M.J., McLenachan, P.A., Gibb, G.C., Penny, D., 2006. Combined nuclear and mitochondrial
protein-coding DNA sequences resolve the interrelations of the major Australasian marsupial
radiations. Syst. Biol. 55, 122-137.
Poe, S., Chubb, A.L., 2004. Birds in a bush: Five genes indicate explosive evolution of avian orders.
Evolution 58, 404-415.
Posada, D., Crandall, K.A., 1998. Modeltest: testing the model of DNA substitution. Bioinformatics 14,
817–818.
Rambaut, A., 1996. Se-Al: Sequence Alignment Editor. Available at http://evolve.zoo.ox.ac.uk/.
Rea, A.M., 1983. Cathartid affinities: a brief overview. In: Wilbur, S.R., Jackson, J.A. (Eds), Vulture
biology and management. University of California Press, Berkeley, California, pp 26–54.
Reyes, A., Gissi, C., Catzeflis, F., Nevo, E., Pesole, G., Saccone, C., 2004. Congruent mammalian trees
from mitochondrial and nuclear genes using Bayesian methods. Mol. Biol. Evol. 21, 397-403.
Ronquist, F., Huelsenbeck, J. P., 2003. MrBayes3: Bayesian phylogenetic inference under mixed models.
Bioinformatics 19, 1572–1574.
Seibold, I., Helbig, A. J., 1995. Evolutionary history of New and Old World vultures inferred from
nucleotide sequences of the mitochondrial cytochrome b gene. Phil. Trans. Roy. Soc. Lond. B 350,
163–178.
Sibley, C.G., Ahlquist, J. E., 1990. Phylogeny and classification of birds. Yale University Press, New
Haven, CT.
Slack, K.E., Janke, A., Penny, D., Arnason, U., 2003. Two new avian mitochondrial genomes (penguin and
goose) and a summary of bird and reptile mitogenomic features. Gene. 302, 43–52.
Slack, K.E., Jones, C.M., Tatsuro, A., Harrison, G.L., Fordyce, R.E., Arnason, U., Penny, D., 2006. Early
penguin fossils, plus mitochondrial genomes, calibrate avian evolution. Mol. Biol. Evol. 23, (in press,
available on line)
Sorenson M.D., Ast, J.C., Dimcheff, D.E., Yuri, T., Mindell, D.P., 1999. Primers for a PCR-based
approach to mitochondrial genome sequencing in birds and other vertebrates. Mol. Phylogenet. Evol.
12, 105–114.
Steel, M.A., Penny, D., 2004. Two further links between MP and ML under the Poisson model. Appl. Math
Lett. 17, 785-790
Swofford, D.L., 1998. PAUP*: Phylogenetic Analysis Using Parsimony (*and other methods). Sinauer
Associates Sunderland, Massachusetts.

28/8/08, page 23 of 28
Thomas, G.H., Wills, M.A. Székely, T., 2004. Phylogeny of shorebirds, gulls, and alcids (Aves: Charadri)
from the cytochrome c gene: parsimony, Bayesian inference, minimum evolution and quartet puzzling.
Mol. Phyl. Evol. 30, 516-526
Van Tuinen, M., Sibley, C. Hedges, S. B., 2000. The early history of modern birds inferred from DNA
sequences of nuclear and mitochondrial ribosomal genes. Mol. Biol. Evol. 17, 451–457.
Van Tuinen, M., Waterhouse, D., Dyke, G.J., 2004. Avian molecular systematics on the rebound: a fresh
look at modern shorebird phylogenetic relationships. J. Avian Biol. 35, 191-194.

28/8/08, page 24 of 28
Table 1. Predicted and actual effects on the position of the root from taxon removal
species omitted predicted paleo/
neognaths‡
Paleognaths
Pg
Galloanseres
Ga
Passerines
Pa
Neoaves
Total
None, all 30 birds n.a.
emu − 100/99 - 1 - - 1
cassowary − 99/97 - 2+1 1+1+1 - 6
kiwi − 100/97 - 1+1 1 1 4
rhea >Pg?? 100/95 - 1+1 3+4x1 4 13
ostrich >Pg?? 100/93 - 3+1 3+1 4 12
tinamou >Pg 100/91 - 1 2+2+2 8 15
gs_tinamou >Pg 100/95 - 3+1 1+1+1 2 9
magpie goose >Ga 100/94 - 3 1+1 3 8
goose − 100/98 - 1+1 1+1+1 1 6
duck − 99/96 1 2 - 2 5
brush turkey >Ga 100/92 - 7+3 - 1 11
chicken − 100/99 - 1+1 - - 2
quail − 100/97 - 2 1+1 1 5
rifleman >Pa? 100/91 - 2 5+5+3 7 22
broadbill >Pa 100/94 - 3+1 2 3 9
flycatcher >Pa 98/96 2 - 2+1+1 4 10
lyrebird >Pa 99/93 1 3+1 3+2+2 4 16
rook >Pa?? 100/94 - 4+3x1 1+1 2 11
indigobird >Pa?? 100/93 - 3+1 1+2x1* 4 11
falcon − 99/97 1 3+2 - - 6
buzzard >Oth?? 100/96 - - 2+1+1 4 8
turkey vulture − 99/94 - 2+1 1 4 8
oystercatcher − 100/95 - 2+1 1 3 7
turnstone − 100/97 - 2+3x1 1 1 7
gull − 99/98 1 1+1+1 - - 4
stork − 100/98 - 1 1 1 3
penguin − 100/91 - 4+1 3+1+1 5 15
albatross − 100/98 - 1 - 1 2
petrel − 100/95 - 2 - 3 5
loon − 100/95 - 3 1+1 2 7
‡ Expected position of the root from nuclear and morphological data.
**crested tinamou joins rhea, inside ratites

28/8/08, page 25 of 28
Figure Captions
Figure 1. Unrooted tree on complete mitochondrial genomes from 30 birds. The 3rd
codon position was RY
coded with other sites (1st and 2nd positions for protein genes, stems and loops for RNA genes) remained as
nucleotides. Bootstrap values are from 500 runs.
Figure 2. Rooted tree using six outgroup taxa. The same coding as for Figure 1. Bootstrap values are
shown; * is 100%.
Figure 3. Phylogenetic super-network obtained by applying the Z-closure method to the 30 jackknife ML
trees where each individual bird taxon has been removed in turn from the complete dataset. This figure
represents a graphical summary of multiple phylogenies reconstructed from the different sets of taxa. It
shows on which parts of the phylogeny all partial trees are in agreement (dichotomous parts) and where
there exist contradicting signals (networking parts).

28/8/08, page 26 of 28
Ostrich
Kiwi
Cassowary
Emu
Greater Rhea
Crested-Tinamou
Tinamou
Quail
Chicken
Brush-Turkey Magpie Goose
Goose Duck
Indigobird
Rook
Lyrebird Rifleman
Broadbill
Flycatcher
Falcon
Buzzard
Turkey Vulture
Oystercatcher Turnstone
Gull
Albatross
Petrel
Stork
Penguin
Loon
0.1
*
* *
*
*
* *
99
81
* *
*
* 99
69
* 92
* 98
64
78
54
Galloanserae
Palaeognathae
Passeriformes
Conglomerati (Cracrafti)

28/8/08, page 27 of 28
emu
cassowary
kiwi
greater rhea
ostrich
tinamou
crested-tinamou
chicken
quail
brush-turkey
magpie goose
duck
goose
rifleman
broadbill
flycatcher
lyrebird
indigobird
rook
falcon
buzzard
oystercatcher
turnstone
gull
stork
penguin
loon
albatross
petrel
turkey vulture
alligator
caiman
Eastern painted turtle
green turtle
skink
iguana
0.05 substitutions/site
rep
tile
ou
tgro
up
Anseriformes
Charadriiformes
Ciconiiformes
Falconiformes
Galliformes
Passeriformes
Procellariiformes
Gaviiformes
Sphenisciformes
Tinamiformes
Pa
laeo
gn
ath
ae
Neo
gn
ath
ae
Struthioniformes
*
81
60
60
*
*
*
*
*
*
89
*
*
*
99
96
96
99
89
41*
*
*
96
85
49
22
*
98
80
99
48
49

28/8/08, page 28 of 28
Alligator Caiman
Iguana Skink
Green Turtle
Eastern Painted Turtle
Ostrich Kiwi
Cassowary
Emu Greater Rhea
Crested-Tinamou
Tinamou
Quail
Chicken
Brush-Turkey
Magpie Goose
Goose Duck
Indigobird Rook
Lyrebird
Rifleman
Broadbill
Flycatcher
Falcon
Buzzard
Turkey Vulture
Oystercatcher
Turnstone Gull
Albatross
Petrel Stork
Penguin
Loon
1.