Resolution of a Reflector Shroud Fatigue Failure
14
Resolution of a Reflector Shroud Fatigue Failure James Umali Northrop Grumman Azusa, CA ABSTRACT Two cracks were observed on a reflector shroud for a space program after previously being subjected to the protoflight test campaign and several regression tests. After extensive analysis and investigations by the engineering team, the failure mechanism was identified to be fatigue as a result of the numerous vibration tests imposed on the unit. Two feasible corrective actions were proposed: first, a notched vibration profile which possesses sufficient margin from the anticipated acoustic and launch loads, while maintaining adequate fatigue life through launch and on-orbit operations, and second, a re-design of the shroud to strengthen the fatigue-susceptible areas. In this paper, we present the inspections, testing, and analysis performed to establish that the cracks were a result of fatigue failure. We discuss the conservative fatigue analysis methodology used in the development of both corrective action options. Finally, we review the lessons learned and the actions incorporated into the rework, subsequent regression testing, and the test plans to minimize the risk of recurrence in future units. BACKGROUND During the environmental test campaign for a space program, a thorough inspection revealed the presence of two cracks on the aluminum reflector shroud. Prior to identifying the cracks, the shroud had been subjected to proto-flight random vibration (RV) testing as part of the component- level assembly, protoflight RV testing as part of the higher level instrument assembly, and several minimum-workmanship level regression RV tests at the instrument level of assembly. As shown in Figure 1, the cracks (labeled “A” and “B”) were observed to be approximately 0.5” in length and were essentially mirror images of one another, occurring on both sides of the symmetric shroud. The cracks occurred over a thin, ribbed edge near a fillet and propagated into the recessed pocketed region. Note that the shroud is symmetric about two planes, and hence a total of 4 regions with identical geometry are present on the shroud. The remaining 2 regions on the opposite side of the shroud did not exhibit any cracking. Figure 1: Photographs of Cracks on Reflector Shroud
Transcript of Resolution of a Reflector Shroud Fatigue Failure

Resolution of a Reflector Shroud Fatigue Failure
James Umali Northrop Grumman
Azusa, CA
ABSTRACT Two cracks were observed on a reflector shroud for a space program after previously being subjected to the protoflight test campaign and several regression tests. After extensive analysis and investigations by the engineering team, the failure mechanism was identified to be fatigue as a result of the numerous vibration tests imposed on the unit. Two feasible corrective actions were proposed: first, a notched vibration profile which possesses sufficient margin from the anticipated acoustic and launch loads, while maintaining adequate fatigue life through launch and on-orbit operations, and second, a re-design of the shroud to strengthen the fatigue-susceptible areas. In this paper, we present the inspections, testing, and analysis performed to establish that the cracks were a result of fatigue failure. We discuss the conservative fatigue analysis methodology used in the development of both corrective action options. Finally, we review the lessons learned and the actions incorporated into the rework, subsequent regression testing, and the test plans to minimize the risk of recurrence in future units.
BACKGROUND During the environmental test campaign for a space program, a thorough inspection revealed the presence of two cracks on the aluminum reflector shroud. Prior to identifying the cracks, the shroud had been subjected to proto-flight random vibration (RV) testing as part of the component-level assembly, protoflight RV testing as part of the higher level instrument assembly, and several minimum-workmanship level regression RV tests at the instrument level of assembly. As shown in Figure 1, the cracks (labeled “A” and “B”) were observed to be approximately 0.5” in length and were essentially mirror images of one another, occurring on both sides of the symmetric shroud. The cracks occurred over a thin, ribbed edge near a fillet and propagated into the recessed pocketed region. Note that the shroud is symmetric about two planes, and hence a total of 4 regions with identical geometry are present on the shroud. The remaining 2 regions on the opposite side of the shroud did not exhibit any cracking.
Figure 1: Photographs of Cracks on Reflector Shroud
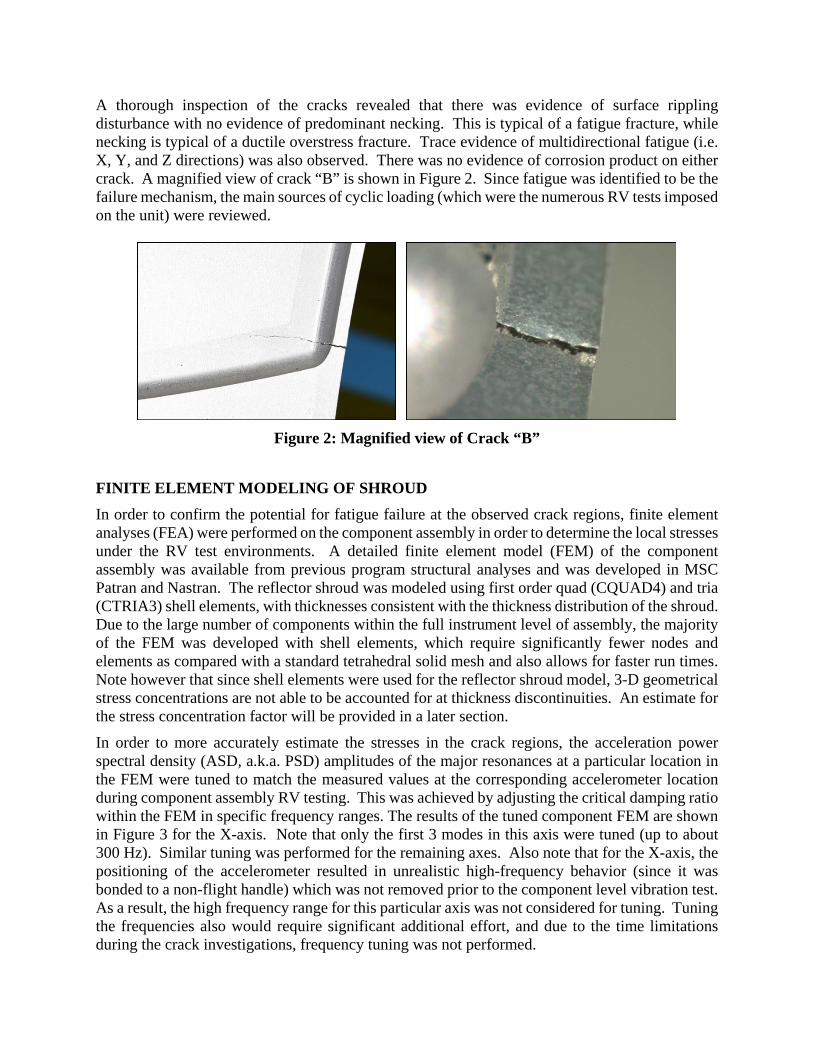
A thorough inspection of the cracks revealed that there was evidence of surface rippling disturbance with no evidence of predominant necking. This is typical of a fatigue fracture, while necking is typical of a ductile overstress fracture. Trace evidence of multidirectional fatigue (i.e. X, Y, and Z directions) was also observed. There was no evidence of corrosion product on either crack. A magnified view of crack “B” is shown in Figure 2. Since fatigue was identified to be the failure mechanism, the main sources of cyclic loading (which were the numerous RV tests imposed on the unit) were reviewed.
Figure 2: Magnified view of Crack “B”
FINITE ELEMENT MODELING OF SHROUD In order to confirm the potential for fatigue failure at the observed crack regions, finite element analyses (FEA) were performed on the component assembly in order to determine the local stresses under the RV test environments. A detailed finite element model (FEM) of the component assembly was available from previous program structural analyses and was developed in MSC Patran and Nastran. The reflector shroud was modeled using first order quad (CQUAD4) and tria (CTRIA3) shell elements, with thicknesses consistent with the thickness distribution of the shroud. Due to the large number of components within the full instrument level of assembly, the majority of the FEM was developed with shell elements, which require significantly fewer nodes and elements as compared with a standard tetrahedral solid mesh and also allows for faster run times. Note however that since shell elements were used for the reflector shroud model, 3-D geometrical stress concentrations are not able to be accounted for at thickness discontinuities. An estimate for the stress concentration factor will be provided in a later section. In order to more accurately estimate the stresses in the crack regions, the acceleration power spectral density (ASD, a.k.a. PSD) amplitudes of the major resonances at a particular location in the FEM were tuned to match the measured values at the corresponding accelerometer location during component assembly RV testing. This was achieved by adjusting the critical damping ratio within the FEM in specific frequency ranges. The results of the tuned component FEM are shown in Figure 3 for the X-axis. Note that only the first 3 modes in this axis were tuned (up to about 300 Hz). Similar tuning was performed for the remaining axes. Also note that for the X-axis, the positioning of the accelerometer resulted in unrealistic high-frequency behavior (since it was bonded to a non-flight handle) which was not removed prior to the component level vibration test. As a result, the high frequency range for this particular axis was not considered for tuning. Tuning the frequencies also would require significant additional effort, and due to the time limitations during the crack investigations, frequency tuning was not performed.

Figure 3: X-Axis Amplitude Tuning of Component FEM for First 3 Structural Modes
Reviewing the mode shapes and random vibration analysis results, the primary modes contributing to the majority of the stresses in the crack region are able to be identified. As shown in Figure 4, 99% of the local stress in the crack region is achieved within the 20-209 Hz region, with the major contributors being the 165 Hz and 167 Hz modes. Further review of these mode shapes confirms that significant bending occurs at the local crack region for these resonances. A similar process was performed for the X axis (with 99% of the stress achieved in the 20 – 234 Hz range) and Z axis (20 – 927 Hz range). Note that the Z-Axis does not significantly energize the main resonances (at 165 Hz and 167 Hz) which contribute the majority of the stresses on the crack region, and so additional resonances (up to 927 Hz) are required to achieve 99% of the Z-axis max stress. As a result, tuning the amplitudes for the first few modes is confirmed to be sufficient since the majority of the local stresses in the crack region occur in this range.
Figure 4: Major Y-Axis Modes Contributing to Stresses in Crack Region
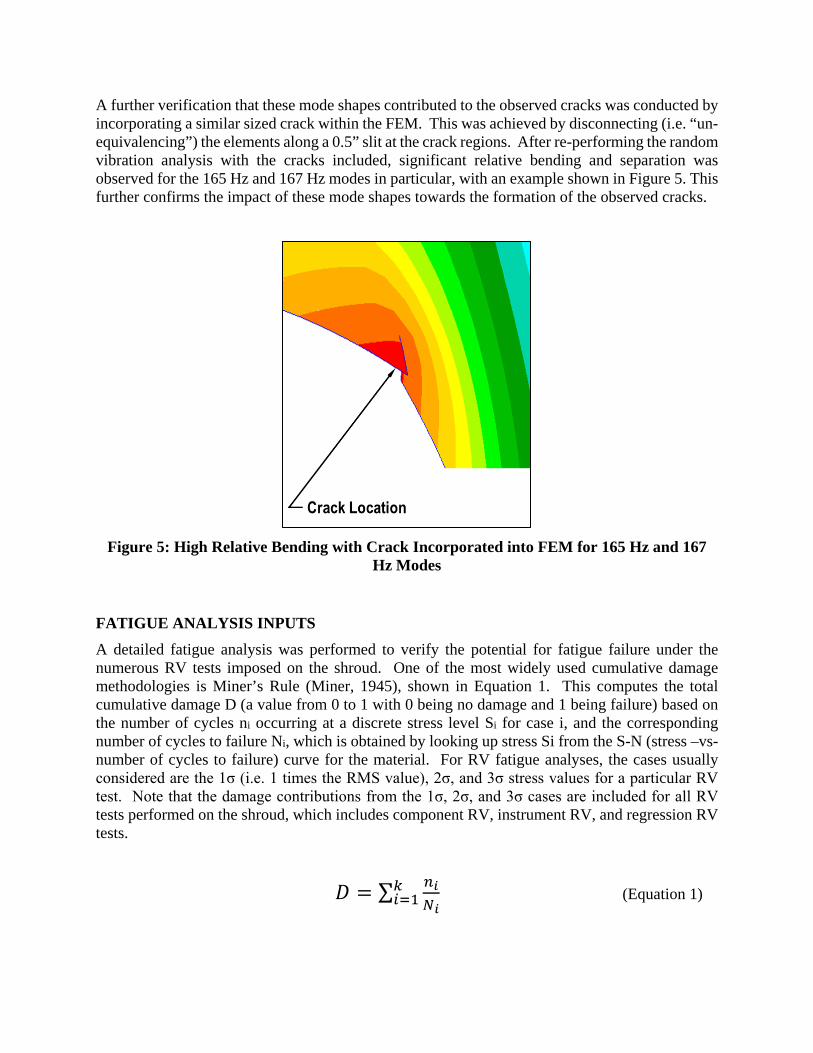
A further verification that these mode shapes contributed to the observed cracks was conducted by incorporating a similar sized crack within the FEM. This was achieved by disconnecting (i.e. “un-equivalencing”) the elements along a 0.5” slit at the crack regions. After re-performing the random vibration analysis with the cracks included, significant relative bending and separation was observed for the 165 Hz and 167 Hz modes in particular, with an example shown in Figure 5. This further confirms the impact of these mode shapes towards the formation of the observed cracks.
Figure 5: High Relative Bending with Crack Incorporated into FEM for 165 Hz and 167
Hz Modes
FATIGUE ANALYSIS INPUTS A detailed fatigue analysis was performed to verify the potential for fatigue failure under the numerous RV tests imposed on the shroud. One of the most widely used cumulative damage methodologies is Miner’s Rule (Miner, 1945), shown in Equation 1. This computes the total cumulative damage D (a value from 0 to 1 with 0 being no damage and 1 being failure) based on the number of cycles ni occurring at a discrete stress level Si for case i, and the corresponding number of cycles to failure Ni, which is obtained by looking up stress Si from the S-N (stress –vs- number of cycles to failure) curve for the material. For RV fatigue analyses, the cases usually considered are the 1σ (i.e. 1 times the RMS value), 2σ, and 3σ stress values for a particular RV test. Note that the damage contributions from the 1σ, 2σ, and 3σ cases are included for all RV tests performed on the shroud, which includes component RV, instrument RV, and regression RV tests.
𝐷𝐷 = ∑ 𝑛𝑛𝑖𝑖𝑁𝑁𝑖𝑖
𝑘𝑘𝑖𝑖=1 (Equation 1)
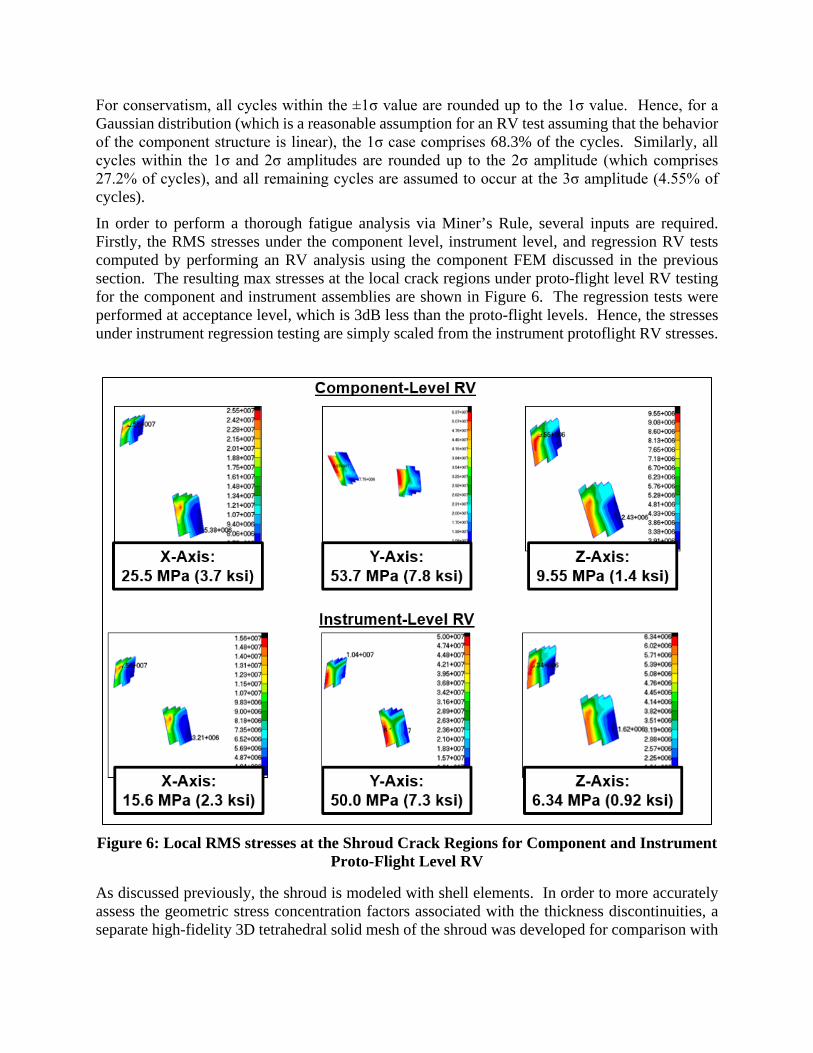
For conservatism, all cycles within the ±1σ value are rounded up to the 1σ value. Hence, for a Gaussian distribution (which is a reasonable assumption for an RV test assuming that the behavior of the component structure is linear), the 1σ case comprises 68.3% of the cycles. Similarly, all cycles within the 1σ and 2σ amplitudes are rounded up to the 2σ amplitude (which comprises 27.2% of cycles), and all remaining cycles are assumed to occur at the 3σ amplitude (4.55% of cycles). In order to perform a thorough fatigue analysis via Miner’s Rule, several inputs are required. Firstly, the RMS stresses under the component level, instrument level, and regression RV tests computed by performing an RV analysis using the component FEM discussed in the previous section. The resulting max stresses at the local crack regions under proto-flight level RV testing for the component and instrument assemblies are shown in Figure 6. The regression tests were performed at acceptance level, which is 3dB less than the proto-flight levels. Hence, the stresses under instrument regression testing are simply scaled from the instrument protoflight RV stresses.
Figure 6: Local RMS stresses at the Shroud Crack Regions for Component and Instrument
Proto-Flight Level RV
As discussed previously, the shroud is modeled with shell elements. In order to more accurately assess the geometric stress concentration factors associated with the thickness discontinuities, a separate high-fidelity 3D tetrahedral solid mesh of the shroud was developed for comparison with
the shell representation model within the component assembly FEM. A comparison of the meshes are shown in Figure 7.
Figure 7: Mesh Comparison for Shroud Crack Region: Shell Mesh (left) Color Coded
Based on Thickness, Solid Mesh (right)
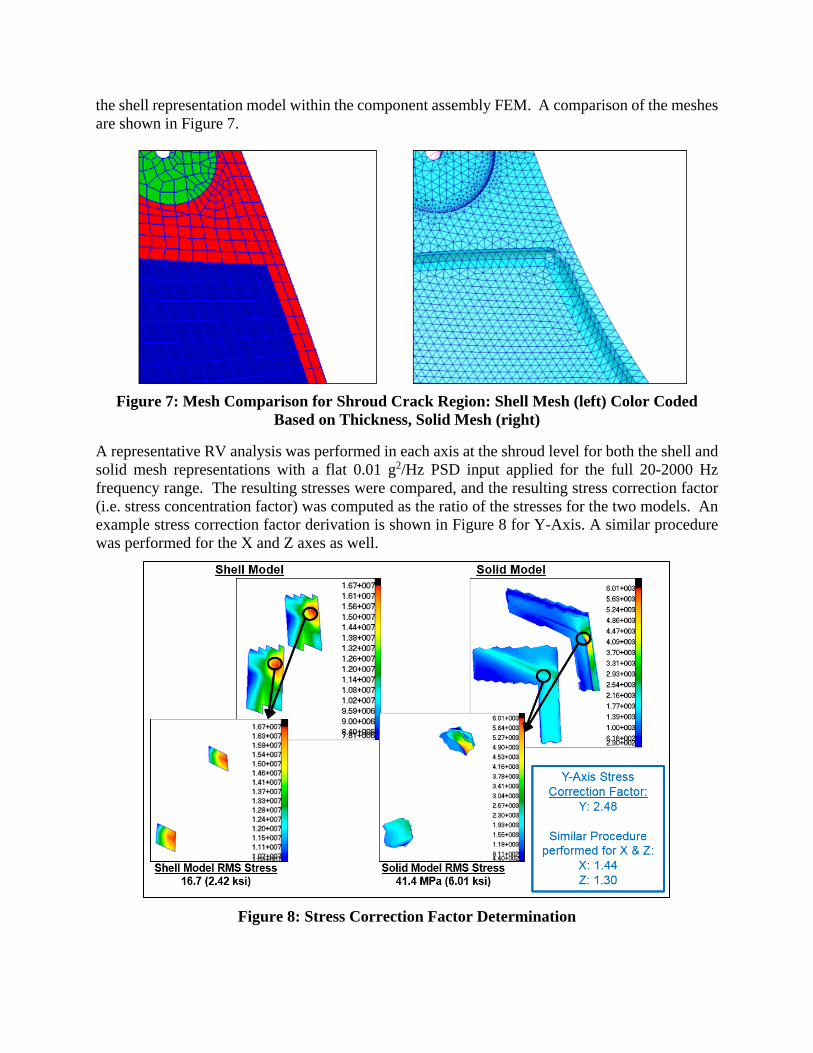
A representative RV analysis was performed in each axis at the shroud level for both the shell and solid mesh representations with a flat 0.01 g2/Hz PSD input applied for the full 20-2000 Hz frequency range. The resulting stresses were compared, and the resulting stress correction factor (i.e. stress concentration factor) was computed as the ratio of the stresses for the two models. An example stress correction factor derivation is shown in Figure 8 for Y-Axis. A similar procedure was performed for the X and Z axes as well.
Figure 8: Stress Correction Factor Determination
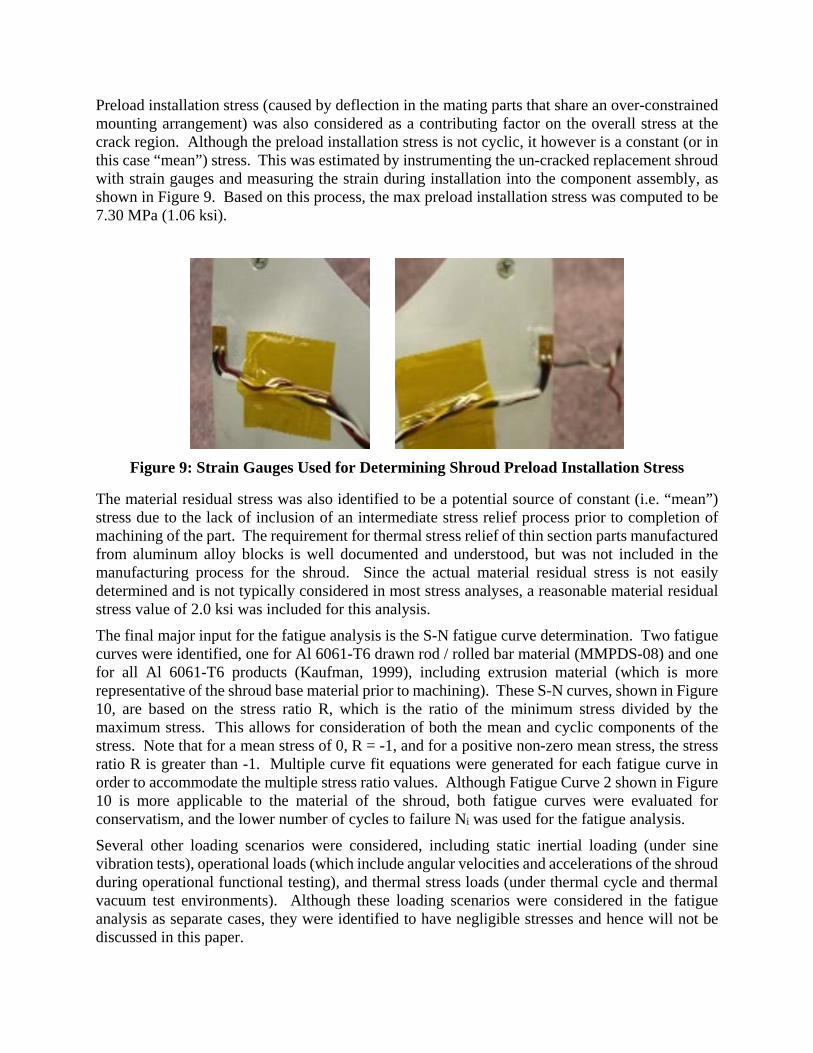
Preload installation stress (caused by deflection in the mating parts that share an over-constrained mounting arrangement) was also considered as a contributing factor on the overall stress at the crack region. Although the preload installation stress is not cyclic, it however is a constant (or in this case “mean”) stress. This was estimated by instrumenting the un-cracked replacement shroud with strain gauges and measuring the strain during installation into the component assembly, as shown in Figure 9. Based on this process, the max preload installation stress was computed to be 7.30 MPa (1.06 ksi).
Figure 9: Strain Gauges Used for Determining Shroud Preload Installation Stress
The material residual stress was also identified to be a potential source of constant (i.e. “mean”) stress due to the lack of inclusion of an intermediate stress relief process prior to completion of machining of the part. The requirement for thermal stress relief of thin section parts manufactured from aluminum alloy blocks is well documented and understood, but was not included in the manufacturing process for the shroud. Since the actual material residual stress is not easily determined and is not typically considered in most stress analyses, a reasonable material residual stress value of 2.0 ksi was included for this analysis. The final major input for the fatigue analysis is the S-N fatigue curve determination. Two fatigue curves were identified, one for Al 6061-T6 drawn rod / rolled bar material (MMPDS-08) and one for all Al 6061-T6 products (Kaufman, 1999), including extrusion material (which is more representative of the shroud base material prior to machining). These S-N curves, shown in Figure 10, are based on the stress ratio R, which is the ratio of the minimum stress divided by the maximum stress. This allows for consideration of both the mean and cyclic components of the stress. Note that for a mean stress of 0, R = -1, and for a positive non-zero mean stress, the stress ratio R is greater than -1. Multiple curve fit equations were generated for each fatigue curve in order to accommodate the multiple stress ratio values. Although Fatigue Curve 2 shown in Figure 10 is more applicable to the material of the shroud, both fatigue curves were evaluated for conservatism, and the lower number of cycles to failure Ni was used for the fatigue analysis. Several other loading scenarios were considered, including static inertial loading (under sine vibration tests), operational loads (which include angular velocities and accelerations of the shroud during operational functional testing), and thermal stress loads (under thermal cycle and thermal vacuum test environments). Although these loading scenarios were considered in the fatigue analysis as separate cases, they were identified to have negligible stresses and hence will not be discussed in this paper.

Figure 10: S-N Fatigue Curves for Al 6061-T6 (MMPDS-08 and Kaufman 1999)
FATIGUE ANALYSIS RESULTS Using the inputs determined in the previous section, a fatigue analysis using Miner’s cumulative damage methodology was performed and included the test environments leading up to the observation of the cracks. A summary of the stress correction factors and dominant frequencies are provided in Table 1. A scatter factor of 4 was included as a reduction to the number of allowable cycles to failure. For conservatism, a heat treatment factor of 1.2 and grain direction factor of 1.08 are typically included on top of the stress correction factors for each axis for computing the maximum stresses. However, for purposes of identifying the potential for fatigue failure, these factors were set to 1 (unity) for this analysis. For the fatigue analyses in a subsequent section where correction actions are assessed, these factors of 1.2 and 1.08 will be applied.
Table 1: Inputs for Shroud Fatigue Analysis
Fatigue Analysis Inputs Stress Correction Factor (X-Axis) 1.44 Stress Correction Factor (Y-Axis) 2.48 Stress Correction Factor (Z-Axis) 1.3 Heat Treatment Factor 1 Grain Direction Factor 1 Total Scaling Factor (X-Axis) 1.866 Total Scaling Factor (Y-Axis) 3.214 Total Scaling Factor (Z-Axis) 1.685 Dominant Frequency (X-Axis) [Hz] 234 Dominant Frequency (Y-Axis) [Hz] 209 Dominant Frequency (Z-Axis) [Hz] 927 Scatter Factor 4
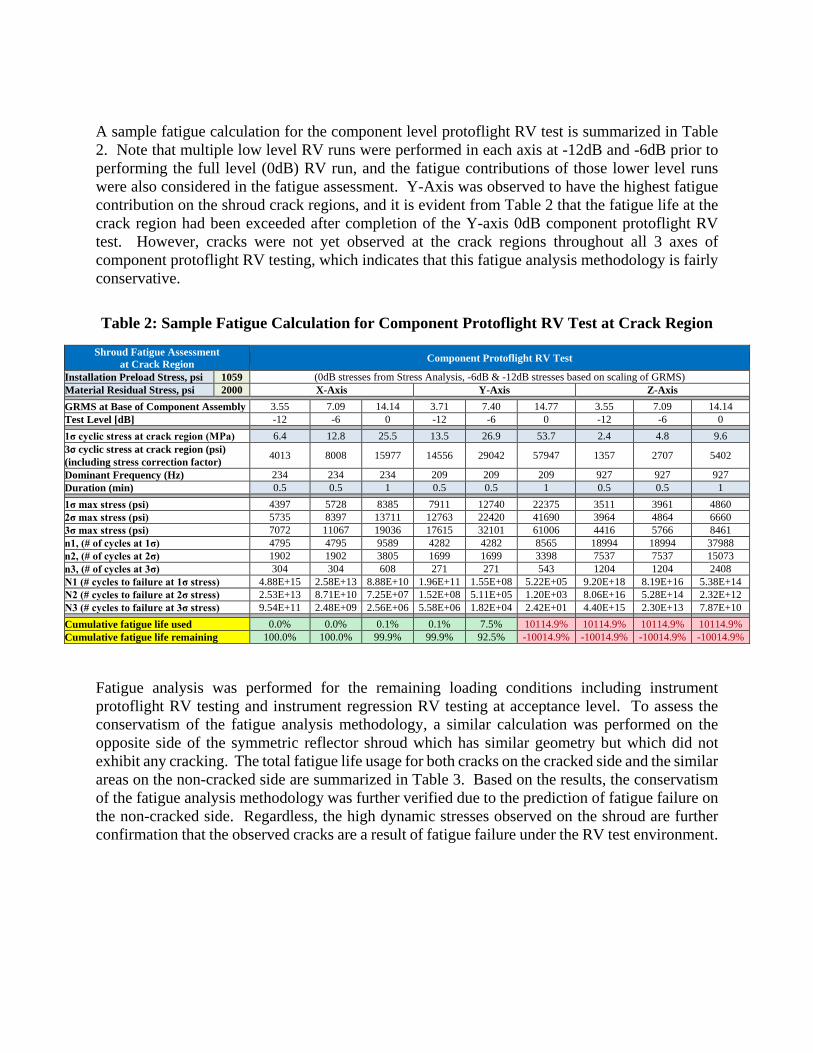
A sample fatigue calculation for the component level protoflight RV test is summarized in Table 2. Note that multiple low level RV runs were performed in each axis at -12dB and -6dB prior to performing the full level (0dB) RV run, and the fatigue contributions of those lower level runs were also considered in the fatigue assessment. Y-Axis was observed to have the highest fatigue contribution on the shroud crack regions, and it is evident from Table 2 that the fatigue life at the crack region had been exceeded after completion of the Y-axis 0dB component protoflight RV test. However, cracks were not yet observed at the crack regions throughout all 3 axes of component protoflight RV testing, which indicates that this fatigue analysis methodology is fairly conservative.
Table 2: Sample Fatigue Calculation for Component Protoflight RV Test at Crack Region
Shroud Fatigue Assessment at Crack Region Component Protoflight RV Test
Installation Preload Stress, psi 1059 (0dB stresses from Stress Analysis, -6dB & -12dB stresses based on scaling of GRMS) Material Residual Stress, psi 2000 X-Axis Y-Axis Z-Axis
GRMS at Base of Component Assembly 3.55 7.09 14.14 3.71 7.40 14.77 3.55 7.09 14.14 Test Level [dB] -12 -6 0 -12 -6 0 -12 -6 0
1σ cyclic stress at crack region (MPa) 6.4 12.8 25.5 13.5 26.9 53.7 2.4 4.8 9.6 3σ cyclic stress at crack region (psi) (including stress correction factor) 4013 8008 15977 14556 29042 57947 1357 2707 5402
Dominant Frequency (Hz) 234 234 234 209 209 209 927 927 927 Duration (min) 0.5 0.5 1 0.5 0.5 1 0.5 0.5 1
1σ max stress (psi) 4397 5728 8385 7911 12740 22375 3511 3961 4860 2σ max stress (psi) 5735 8397 13711 12763 22420 41690 3964 4864 6660 3σ max stress (psi) 7072 11067 19036 17615 32101 61006 4416 5766 8461 n1, (# of cycles at 1σ) 4795 4795 9589 4282 4282 8565 18994 18994 37988 n2, (# of cycles at 2σ) 1902 1902 3805 1699 1699 3398 7537 7537 15073 n3, (# of cycles at 3σ) 304 304 608 271 271 543 1204 1204 2408 N1 (# cycles to failure at 1σ stress) 4.88E+15 2.58E+13 8.88E+10 1.96E+11 1.55E+08 5.22E+05 9.20E+18 8.19E+16 5.38E+14 N2 (# cycles to failure at 2σ stress) 2.53E+13 8.71E+10 7.25E+07 1.52E+08 5.11E+05 1.20E+03 8.06E+16 5.28E+14 2.32E+12 N3 (# cycles to failure at 3σ stress) 9.54E+11 2.48E+09 2.56E+06 5.58E+06 1.82E+04 2.42E+01 4.40E+15 2.30E+13 7.87E+10
Cumulative fatigue life used 0.0% 0.0% 0.1% 0.1% 7.5% 10114.9% 10114.9% 10114.9% 10114.9% Cumulative fatigue life remaining 100.0% 100.0% 99.9% 99.9% 92.5% -10014.9% -10014.9% -10014.9% -10014.9%
Fatigue analysis was performed for the remaining loading conditions including instrument protoflight RV testing and instrument regression RV testing at acceptance level. To assess the conservatism of the fatigue analysis methodology, a similar calculation was performed on the opposite side of the symmetric reflector shroud which has similar geometry but which did not exhibit any cracking. The total fatigue life usage for both cracks on the cracked side and the similar areas on the non-cracked side are summarized in Table 3. Based on the results, the conservatism of the fatigue analysis methodology was further verified due to the prediction of fatigue failure on the non-cracked side. Regardless, the high dynamic stresses observed on the shroud are further confirmation that the observed cracks are a result of fatigue failure under the RV test environment.

Table 3: Fatigue Analysis Summary for Reflector Shroud
Location Component PF RV
Instrument PF RV
Regression RV
Total Fatigue Life Used
Shroud (Cracked Side) 10114.9% 5089.4% 1225.5% 16429.8% Shroud (Non-Cracked Side) 887.6% 2692.6% 652.6% 4232.7%
CORRECTIVE ACTION OPTION 1: RV PROFILE NOTCHING/RESPONSE LIMITING Two feasible corrective actions were proposed by the engineering team to prevent recurrence on the replacement shroud. The first approach was to specify notches on the RV test profile at the critical shroud frequencies to minimize stresses at the crack regions. As discussed previously, it was identified that the 165 Hz and 167 Hz modes contributed to the majority of the stress at the crack region. So by reducing the energy in those frequency ranges, the corresponding local stresses at the cracked regions can also be reduced. The second approach (which will be discussed in the next section) was to perform a re-design of the shroud to strengthen the cracked regions. Although notching is a useful method for reducing the energy within specific frequency ranges, the unit must still be tested to sufficient RV levels that envelope the maximum vibrational environment at spacecraft level at all frequencies. Hence, the measured test data from a previous spacecraft-level protoflight acoustic test was reviewed. A notch between 155 Hz and 245 Hz was developed for use in the regression RV testing after installation of the replacement shroud. The resulting notched regression RV profile is shown in Figure 11 and is confirmed to envelope the protoflight acoustic test vibration environment at all frequencies.
Figure 11: Notched Regression RV Test Profile
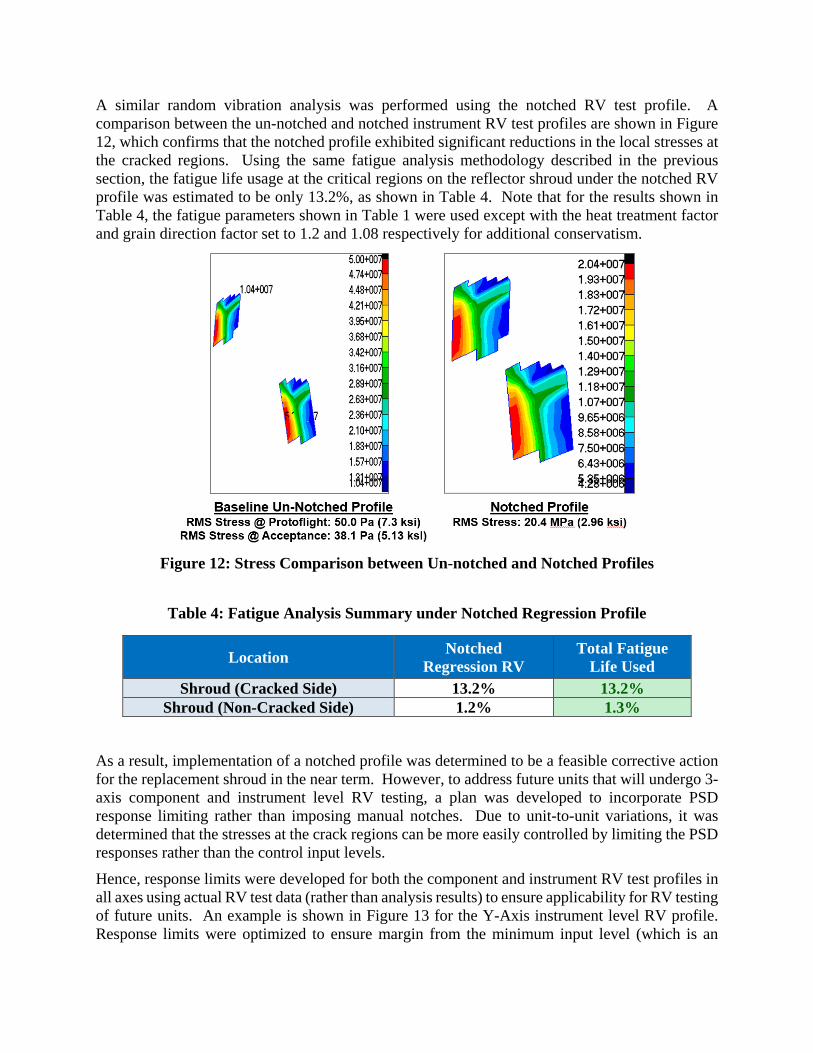
A similar random vibration analysis was performed using the notched RV test profile. A comparison between the un-notched and notched instrument RV test profiles are shown in Figure 12, which confirms that the notched profile exhibited significant reductions in the local stresses at the cracked regions. Using the same fatigue analysis methodology described in the previous section, the fatigue life usage at the critical regions on the reflector shroud under the notched RV profile was estimated to be only 13.2%, as shown in Table 4. Note that for the results shown in Table 4, the fatigue parameters shown in Table 1 were used except with the heat treatment factor and grain direction factor set to 1.2 and 1.08 respectively for additional conservatism.
Figure 12: Stress Comparison between Un-notched and Notched Profiles
Table 4: Fatigue Analysis Summary under Notched Regression Profile
Location Notched Regression RV
Total Fatigue Life Used
Shroud (Cracked Side) 13.2% 13.2% Shroud (Non-Cracked Side) 1.2% 1.3%
As a result, implementation of a notched profile was determined to be a feasible corrective action for the replacement shroud in the near term. However, to address future units that will undergo 3-axis component and instrument level RV testing, a plan was developed to incorporate PSD response limiting rather than imposing manual notches. Due to unit-to-unit variations, it was determined that the stresses at the crack regions can be more easily controlled by limiting the PSD responses rather than the control input levels. Hence, response limits were developed for both the component and instrument RV test profiles in all axes using actual RV test data (rather than analysis results) to ensure applicability for RV testing of future units. An example is shown in Figure 13 for the Y-Axis instrument level RV profile. Response limits were optimized to ensure margin from the minimum input level (which is an
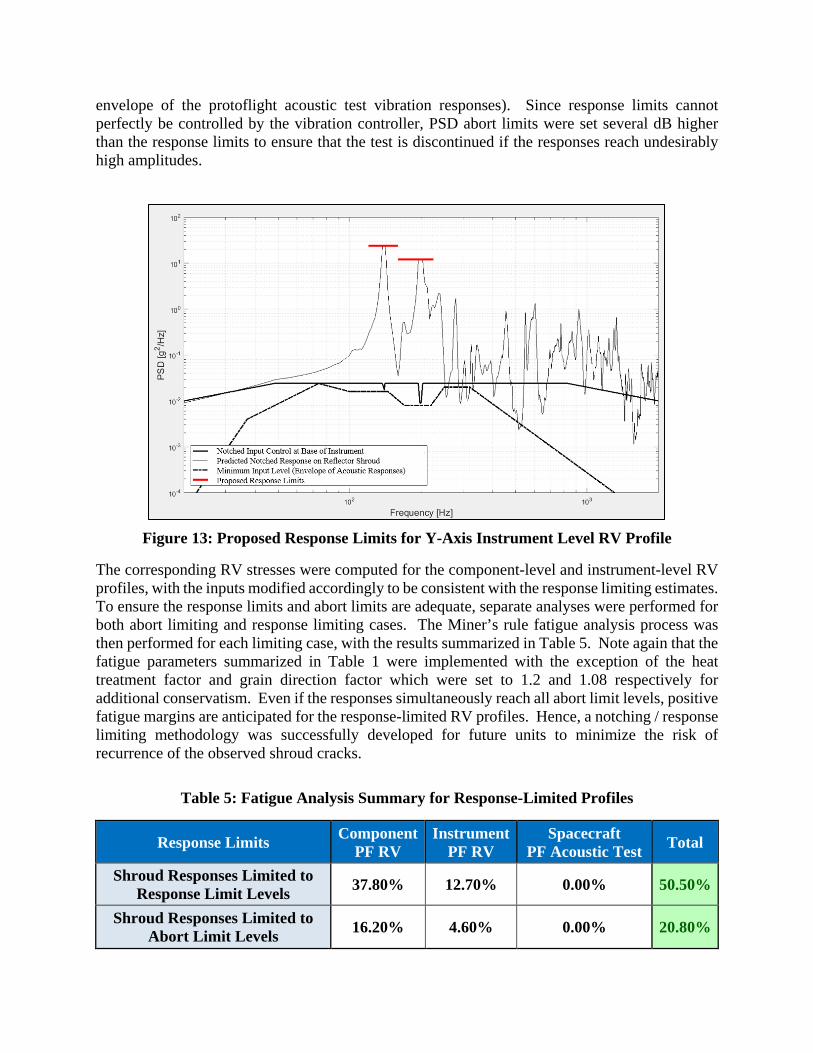
envelope of the protoflight acoustic test vibration responses). Since response limits cannot perfectly be controlled by the vibration controller, PSD abort limits were set several dB higher than the response limits to ensure that the test is discontinued if the responses reach undesirably high amplitudes.
Figure 13: Proposed Response Limits for Y-Axis Instrument Level RV Profile
The corresponding RV stresses were computed for the component-level and instrument-level RV profiles, with the inputs modified accordingly to be consistent with the response limiting estimates. To ensure the response limits and abort limits are adequate, separate analyses were performed for both abort limiting and response limiting cases. The Miner’s rule fatigue analysis process was then performed for each limiting case, with the results summarized in Table 5. Note again that the fatigue parameters summarized in Table 1 were implemented with the exception of the heat treatment factor and grain direction factor which were set to 1.2 and 1.08 respectively for additional conservatism. Even if the responses simultaneously reach all abort limit levels, positive fatigue margins are anticipated for the response-limited RV profiles. Hence, a notching / response limiting methodology was successfully developed for future units to minimize the risk of recurrence of the observed shroud cracks.
Table 5: Fatigue Analysis Summary for Response-Limited Profiles
Response Limits Component PF RV
Instrument PF RV
Spacecraft PF Acoustic Test Total
Shroud Responses Limited to Response Limit Levels 37.80% 12.70% 0.00% 50.50%
Shroud Responses Limited to Abort Limit Levels 16.20% 4.60% 0.00% 20.80%
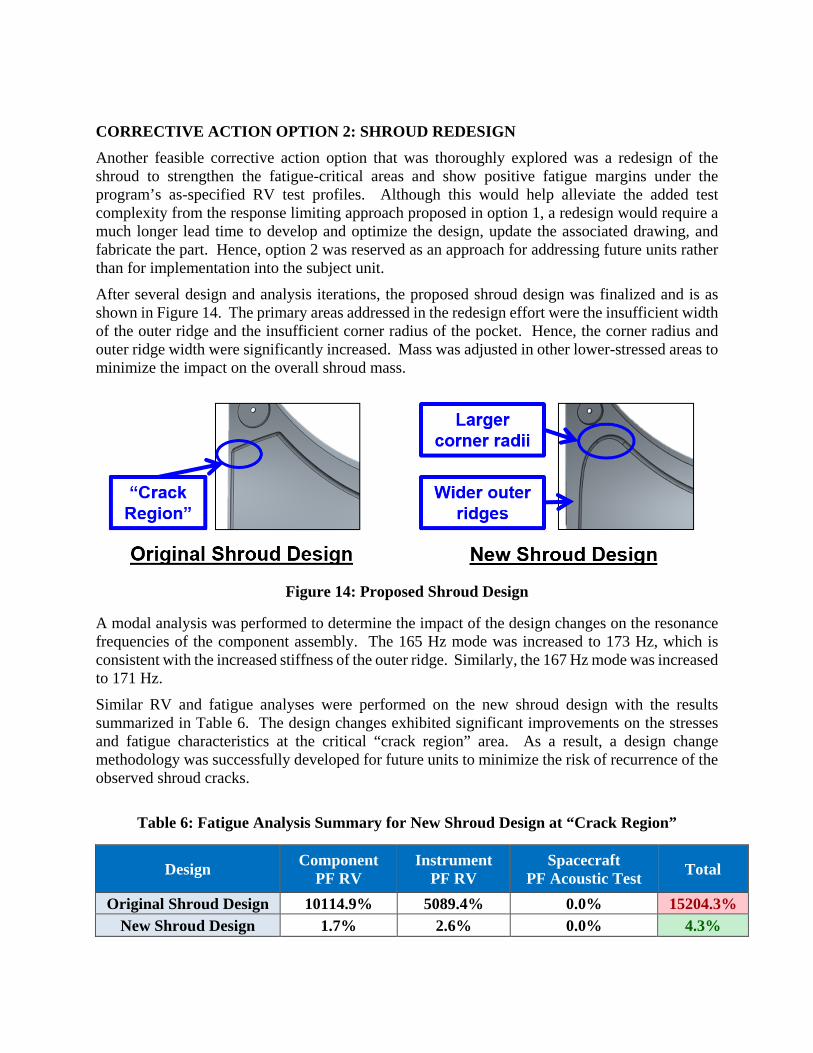
CORRECTIVE ACTION OPTION 2: SHROUD REDESIGN Another feasible corrective action option that was thoroughly explored was a redesign of the shroud to strengthen the fatigue-critical areas and show positive fatigue margins under the program’s as-specified RV test profiles. Although this would help alleviate the added test complexity from the response limiting approach proposed in option 1, a redesign would require a much longer lead time to develop and optimize the design, update the associated drawing, and fabricate the part. Hence, option 2 was reserved as an approach for addressing future units rather than for implementation into the subject unit. After several design and analysis iterations, the proposed shroud design was finalized and is as shown in Figure 14. The primary areas addressed in the redesign effort were the insufficient width of the outer ridge and the insufficient corner radius of the pocket. Hence, the corner radius and outer ridge width were significantly increased. Mass was adjusted in other lower-stressed areas to minimize the impact on the overall shroud mass.
Figure 14: Proposed Shroud Design
A modal analysis was performed to determine the impact of the design changes on the resonance frequencies of the component assembly. The 165 Hz mode was increased to 173 Hz, which is consistent with the increased stiffness of the outer ridge. Similarly, the 167 Hz mode was increased to 171 Hz. Similar RV and fatigue analyses were performed on the new shroud design with the results summarized in Table 6. The design changes exhibited significant improvements on the stresses and fatigue characteristics at the critical “crack region” area. As a result, a design change methodology was successfully developed for future units to minimize the risk of recurrence of the observed shroud cracks.
Table 6: Fatigue Analysis Summary for New Shroud Design at “Crack Region”
Design Component PF RV
Instrument PF RV
Spacecraft PF Acoustic Test Total
Original Shroud Design 10114.9% 5089.4% 0.0% 15204.3% New Shroud Design 1.7% 2.6% 0.0% 4.3%
CONCLUSIONS The observed cracks on the reflector shroud were confirmed to be attributable to a fatigue failure (based on detailed visual inspections and a fatigue analysis using Miner’s cumulative damage methodology) as a result of an insufficient shroud design which was not capable of withstanding the as-specified RV test environments. Several corrective action options were successfully developed, with the near term resolution being the implementation of a notched RV profile (which sufficiently reduces the energy in critical high-stress frequencies while maintaining margin from the spacecraft level acoustic environment) on the replacement shroud. For future units, two feasible options were developed which included response limited profiles and a redesign of the shroud. Both options were thoroughly explored and verified by a conservative fatigue analysis to show positive margins at the fatigue-susceptible areas. Although the analysis and corrective actions presented in this paper were specific to the fatigue failure on the reflector shroud, the major lessons learned and resolution methodologies (e.g. fatigue analysis approach, root cause determination, notching/response limiting, and design optimization and verification) are applicable to all space programs.
REFERENCES “Metallic Materials Properties Development and Standardization (MMPDS).” MMPDS-08. Federal Aviation Administration, April 2013
Miner, M. A. "Cumulative Damage in Fatigue." Journal of Applied Mechanics 12 (1945): 159-164.
Kaufman, J G. Properties of Aluminum Alloys: Tensile, Creep, and Fatigue Data at High and Low Temperatures. Materials Park, Ohio: ASM International, 1999.
BIOGRAPHY James Umali received a B.S. degree in Aerospace Engineering with a minor in Mathematics at UCLA. He received his M.S. degree in Mechanical Engineering also at UCLA, with a focus in structural analysis and theory. He is currently a mechanical and structural engineer at Northrop Grumman in Azusa, CA, where his main responsibilities include providing support in the area of structural analyses (e.g. via finite element methods) and dynamic testing (e.g. random/sine vibration, spin balancing, disturbance torque, etc) for space-based instruments. He also has experience in performing mechanical design of space flight hardware and mechanical ground support equipment as well as developing efficient and user-friendly tools in Matlab for optimizing and automating structural analysis and test processes.
ACKNOWLEDGMENTS The success of the shroud failure investigation and resolution efforts are thanks to the hard work, dedication, and collaboration of the Northrop Grumman engineering and customer team.