
Resilient and Proactive Utilization of Opportunities and ...
81
JOSU TAKALA TEUVO UUSITALO (Eds) Resilient and Proactive Utilization of Opportunities and Uncertainties in Service Business PROCEEDINGS OF THE UNIVERSITY OF VAASA ___________________________________________ REPORTS 177 VAASA 2012
Transcript of Resilient and Proactive Utilization of Opportunities and ...

JOSU TAKALA TEUVO UUSITALO
(Eds)
Resilient and Proactive Utilization of Opportunities and Uncertainties in Service Business
PROCEEDINGS OF THE UNIVERSITY OF VAASA ___________________________________________
REPORTS 177
VAASA 2012

Vaasan yliopisto – University of Vaasa PL 700 – P.O. Box 700 (Wolffintie 34)
FI–65101 VAASA Finland
www.uwasa.fi
ISBN 978–952–476–404–9 ISSN 1238–7118 = Proceedings of the University of Vaasa. Reports © University of Vaasa

III
Contents
1 INTRODUCTION ........................................................................................ 1 1.1 Research objectives and approach ...................................................... 2 1.2 Structure of the report ......................................................................... 3
2 SERVICE CULTURE FROM TRANSFORMATION LEADERSHIP AND KNOWLEDGE AND TECHNOLOGY REQUIREMENTS POINT OF VIEW ........................................................................................................... 5 2.1 Operational strategies ......................................................................... 5
2.1.1 Sustainable Operative Housing by Dynamic Renting .......... 5 2.1.2 Results ............................................................................... 6
2.1.2.1 Balanced Score Cards (BSC) ......................... 6 2.1.2.2 Operations (OP) ............................................. 9
2.1.3 Validation ........................................................................ 13 2.1.3.1 Conclusions ................................................. 13
2.1.4 Comparison of social housing policies in Finland, China and Thailand .................................................................... 14 2.1.4.1 Introduction ................................................. 14 2.1.4.2 Social housing ............................................. 14 2.1.4.3 Research approach ....................................... 19
2.2 Transformational leadership ............................................................. 28 2.2.1 Transformational leadership ............................................. 28 2.2.2 Transformational leadership during crisis ......................... 29
2.3 Knowledge and technology requirements ......................................... 30 2.3.1 Validation of Sense & Respond Methodology Through the prism of technology implementation ........................... 30 2.3.2 Results ............................................................................. 31 2.3.3 Validation ........................................................................ 34
2.4 Conclusions ...................................................................................... 35
3 RISK MANAGEMENT IN SERVICE VALUE NETWORKS .................... 37 3.1 Introduction ...................................................................................... 37 3.2 Risk management in value networks ................................................. 38 3.3 Risks and success factors in new service business development ........ 39 3.4 Case study results ............................................................................. 41 3.5 Conclusions ...................................................................................... 43
4 ASSET-SPECIFIC SERVICE DEVELOPMENT ........................................ 44 4.1 Introduction ...................................................................................... 44 4.2 Outlining the process of asset-specific maintenance service
development ..................................................................................... 45 4.3 Reliability Centred Maintenance (RCM) .......................................... 48
4.3.1 RCM as a method in the service development process ...... 48 4.3.2 Failure Modes and Effects and Criticality Analysis
(FMECA) as a part of an RCM process ............................ 50

IV
5 INTEGRATION OF OPERATIONS STRATEGY INTO DYNAMIC SENSE & RESPONSE RESOURCE ALLOCATIONS BY TECHNOLOGY RANKINGS ................................................................................................ 52 5.1 Introduction ...................................................................................... 52 5.2 Theory and research ......................................................................... 52
5.2.1 Manufacturing Operations Strategy .................................. 52 5.2.2 Sense & Respond Methodology........................................ 53 5.2.3 Critical Factor Index / Balanced Critical Factor Index ...... 53
5.3 RAL Model relation with BCFI ........................................................ 55 5.4 Development proposition.................................................................. 56 5.5 Results ............................................................................................. 60 5.6 General findings ............................................................................... 61 5.7 Conclusion ....................................................................................... 62
6 IMPACTS FOR NEW KNOWLEDGE CREATIONS, LIMITATIONS, FURTHER STUDIES AND MANAGERIAL IMPLICATIONS ................ 64 6.1 Experiences from the use of the methods during response................. 64 6.2 Sustainable operative housing by dynamic renting ............................ 64 6.3 Validation of sense and respond methodology through the prism of
technology implementation ............................................................... 65 6.4 Detection of a company’s preferable strategy type by Sense &
Respond methodology ...................................................................... 66 6.5 Limitations and Further Studies ........................................................ 67 6.6 Conclusions ...................................................................................... 68
ACKNOWLEDGEMENTS ............................................................................... 69
REFERENCES ................................................................................................. 70
Figures
Figure 1. PERFORMANCE (BSC): Expectations vs. experiences among Companies A and B. ....................................................................... 7
Figure 2. CFI: Matches of the extreme attributes among Companies A and B (PERFORMANCE - BSC). ................................................... 8 Figure 3. BCFI: Matches of the extreme attributes among Companies A and
B (PERFORMANCE – BSC). ......................................................... 9 Figure 4. RESOURCES (OP): Expectations vs. Experiences among
Companies A and B. ..................................................................... 10 Figure 5. CFI: Matches of the extreme attributes among Companies A and B (RESOURCES - OP). .......................................................... 11 Figure 6. BCFI: Matches of the extreme attributes among Companies A and B (RESOURCES - OP). .......................................................... 12 Figure 7. The hierarchy tree for the housing policy decision making. ........... 20 Figure 8. Main policy factors weightings among the three countries ............. 21

V
Figure 9. Complete hierarchy weights for Finland. ....................................... 22 Figure 10. Complete hierarchy weights for China........................................... 23 Figure 11. Complete hierarchy weights for Thailand. ..................................... 23 Figure 12. Population growth (annual %). ...................................................... 24 Figure 13. Human Development Index. .......................................................... 24 Figure 14. Income per person, Gross Domestic Product per capita in constant
2000 US$. (World Bank World Development Indicators). ............. 25 Figure 15. Urban population (% of total). ....................................................... 26 Figure 16. Transformational leadership CZ4 model: The four different
components of the management of change. ................................... 30 Figure 17. Comparison of traditional BCFI to the extended one in past (2008-2011). ................................................................................. 32 Figure 18. Possible correction of BCFI attributes in Past (2008-2011). ........... 33 Figure 19. Comparison of traditional BCFI to the extended one in Future
(2011-2015). ................................................................................. 33 Figure 20. Possible correction of BCFI attributes in Future (2011-2015). ....... 34 Figure 21. Implication Levels for three sections of questionnaire: expectations, experience and technology. ...................................... 35 Figure 22. Phases related to developing customer-specific maintenance
services. ........................................................................................ 45 Figure 23. RCM-based development of an asset specific initial maintenance
programme. ................................................................................... 48 Figure 24. Concept of on-going maintenance programme according to IEC
60300-3-11.................................................................................... 49 Figure 25. Objective setting for reliability centred maintenance planning
(RCM) (Rosqvist et al. 2009). ....................................................... 50 Figure 26. Example of the final graphic based on BCFI calculations. ............. 55 Figure 27. RAL model (Takala 2007). ............................................................ 56 Figure 28. Example of the final graphic based on the strategy type calculation. .................................................................................... 59 Figure 29. Visual representation of the attributes divided between the RAL
model elements. ............................................................................ 60 Figure 30. Implication Levels for three sections of questionnaire: expectations,
experience and technology. ........................................................... 66
Tables
Table 1. Main factors importance present values. .................................. 22 Table 2. Descriptive statistic for income per person indicator. ............... 25 Table 3. Descriptive statistic for urban population % indicator. ............. 27 Table 4. Pearson Correlation coefficients between Income per person,
Urban population % and Human development index from year 1960 to 2008. ........................................................................... 27
Table 5. Risk factors related to the value network of the case companies. ............................................................................... 42

VI
Table 6. The list of formulas for BCFI calculation (Nadler & Takala 2008). ...................................................................................... 54
Table 7. AHP Competitive Priorities (Saaty 2008). ................................ 57 Table 8. Deviation of the attributes into four groups. ............................. 58 Table 9. Example of summarized BCFI values per group. ..................... 59 Table 10. Example of the finalized calculation. ....................................... 59 Table 11. Resulting table. ........................................................................ 61

1 INTRODUCTION
Future competitiveness of business operations under the dynamic and complex business situations relies on forward-thinking strategies. In this research, we study how to implement Sustainable Competitive Advantage (SCA), the highly compet-itive operation strategy for managing new business situations through fast strategy by integrating manufacturing and technology strategies with transformational leadership profiles of the decision makers. The key idea of fast strategy is strate-gic agility. Strategy cannot be based only on exceptional forecasting, but also on fast learning and adjustment according to the changes of business situations like the influence of global economic crisis. How can we compare in global context the operational competitiveness of Finnish companies with foreign companies which are highly competitive in e.g. dealing with crisis, and how can we evaluate the performance of new strategy adjustments, whether they are effective to deal with the changing business situations? In this research we use brand new analyti-cal models proposed by Shubin, Liu and Takala (2009) for evaluating the overall operational competitiveness by integrating manufacturing strategy, transforma-tional leadership, and technology strategy, to test with case companies under dy-namic and unforeseen business situations such as dealing with the economic crisis (Liu, Takala & Si 2009) and expanding the business in global context.
Uncertainty management is an essential part of service business management. A significant conceptual reformulation is the shift in emphasis from “risk” to “un-certainty”. The traditional emphasis has been on various modes of “risk manage-ment”, of protecting the system, and its users, from the failures in the system. When considering the performance of a system in its larger commercial and polit-ical environment, that uncertainty may provide opportunities as well as dangers. It is important to consider managing not only the downside possibilities, but also the upside potentials (de Neufville 2004). The success factors related to innovative service development can be grouped in many different ways e.g. to internal and external success factors. On the other hand, barriers related to new service devel-opment can be categorized similarly, and they can in many cases be seen as “oth-er sides of the coin” to the success factors. The following success factor catego-ries have been identified in a recent study (Ojanen et al. 2008a):
– strategic factors (clearly-defined directions, resource allocation, staffing etc.)
– organisational factors (cultural issues, inspiring environment etc.) – structural/process factors (formal processes etc.) – technological factors (efficient use of ICT, technical competences etc.) – market factors (changes in the market / in competition, regulations etc.)
2 Proceedings of the University of Vaasa. Reports
– network-related factors (depth of relationship, level of communication, trust and communication between partners etc.)
Moving towards service-oriented business models introduces new risks that must be taken into account in the development of new services. There is a need to con-sider risks in customer collaboration, information exchange among service value network partners, and capabilities related to collaboration and communication. Internal risks are related to capabilities required by the high-intensity customer relationships of the new services. External risks include e.g. how customers are willing to share critical information needed for successful delivery of new ser-vices (Gebauer, Fleisch & Friedli 2005).
Service value is created in a network context; the complexity of service delivery is influenced by the structure and dynamics of the value network and by customer expectations. This needs to be taken into account when considering the manage-ment of risks. Value for customers is created at the network level, each network partner contributing incremental value to the overall offering. Network actors contribute to the value creation process by focusing on their core competence and cooperating with other network actors – such as suppliers, partners, allies, and customers (Basole & Rouse 2008).
1.1 Research objectives and approach
The objectives of this study were:
1. To study how analytical models for evaluating the overall operational competitiveness can be applied in service business development.
2. To test these analytical models with case companies under dynamic and unforeseen business situations such as dealing with the economic crisis and expanding the business in global context.
3. To study what are the novel and effective uncertainty management princi-ples and practices in service business and international service networks with several and diverse actors.
The selected research approach for this was a multiple case study. The case study is the preferred strategy when ”how” or “why” questions are being posed, when the investigator has little control over events, when the focus is on a contempo-rary phenomenon within some real-life context, and when new areas of research are explored (Eisenhardt 1991).

Proceedings of the University of Vaasa. Reports 3
The case study was carried out in four companies, two from the manufacturing sector and two from the real estate business. Specific service business cases were chosen from each company for the purpose of understanding the actual business environment, value networks and risk management processes in service business. The service business cases from the manufacturing companies were delivery of after-sales services, and service business as part of new product offering. The real estate cases were related to the development of rental services. A key step in this case study involved within-case analysis, with detailed case study reports for each site. These reports are central to the generation of insight because they help re-searchers cope early in the analysis process with the volume of data. This process allows the unique patterns of each case to emerge before investigators push to generalise patterns across cases (Eisenhardt 1989).
The data gathering in the case study included interviews, working groups and workshops. The key personnel within the companies were first interviewed to establish the current status and the key development areas. The interviews were recorded and transcribed. The data of the initial interviews were used for familiar-isation with the company and its current practices and key development targets, and analysed to create an overview of the main challenges and strengths related to the value network and new service business development.
1.2 Structure of the report
The main authors of each chapter are listed below:
1. Introduction (Josu Takala, Teuvo Uusitalo)
2. Service culture from transformation leadership and knowledge and techno-logy requirements point of view (Rayko Toshev, Yang Liu, Teppo Forss, Ivan Golovko, Heli Korpi, Heikki Hallikainen, Josu Takala, Antti Pastu-hov, Asiya Kazmi, Antti Rajala, Antti Kukkola)
3. Risk management in service value networks (Teuvo Uusitalo, Katariina Palomäki, Eija Kupi)
4. Asset-specific service development (Toni Ahonen, Marita Hietikko, Kata-riina Palomäki)
5. Integration of operations strategy into dynamic sense & response resource allocations by technology rankings (Rayko Toshev, Yang Liu, Teppo

4 Proceedings of the University of Vaasa. Reports
Forss, Ivan Golovko, Heli Korpi, Heikki Hallikainen, Josu Takala, Antti Pastuhov, Asiya Kazmi, Antti Rajala, Antti Kukkola)
6. Impacts for New Knowledge Creations, Limitations, Further Studies and Managerial Implications (Josu Takala)

Proceedings of the University of Vaasa. Reports 5
2 SERVICE CULTURE FROM TRANSFORMATION LEADERSHIP AND KNOWLEDGE AND TECHNOLOGY REQUIREMENTS POINT OF VIEW
2.1 Operational strategies
2.1.1 Sustainable Operative Housing by Dynamic Renting
The critical factors of knowledge intensive business in a globally competitive case company can be measured and dynamically developed by “Sense & Re-spond” methodology (Bradley & Nolan 1998). Critical Factor Index (CFI) (Ranta & Takala 2007), as well as its developed and stabilized form Balanced Critical Factor Index (BCFI) (Nadler & Takala 2010) refer directly to the concept of “Sense & Respond” philosophy and represents easy in use tool for supporting the strategic decision-making which applicability has wide potential on various mar-kets and types of organizations.
Knowledge intensive business aims at constant modernization, development and innovation, therefore the whole market segment is quite unstable and barely pre-dictable. The bright representatives of the knowledge intensive business are hous-ing (retailing) companies, as they depend a lot on customers’ opinion, experience, and satisfaction and face various and unique requirements from the customers’ side. Customer satisfaction has crucial impact on the business. The loyalty of the customers increases with the satisfaction level which is beneficial for the compa-ny. (Forss & Toshev 2010)
This chapter presents results of a comparative study based on two significant ac-tors of housing business in Finland. Due to confidentiality issues the real names of the companies will not appear in the chapter; they were replaced by ‘Company A’ and ‘Company B’. The work aims to find a new method for dynamic resource allocations in the operative renting processes in housing, especially in the process where the customers move from one apartment to another one (exchange). The purpose is to evaluate business performance in the case companies through utili-zation of (B)CFI methodology and find possible similarities, like relationships with customers, processes and possibilities for growth internally and externally. The main limitation of the research is the small sample – little number of cases to be tested. The study proposes to compare the results of the case companies with
6 Proceedings of the University of Vaasa. Reports
each other in a way to find similarities in critical areas, therefore to detect a pos-sible trend of the housing market development.
2.1.2 Results
The results were gained by utilization of two types of questionnaire for (B)CFI calculation. BSC (Balanced Score Cards) questionnaire is targeted on strategic holistic resources, and OP (Operations) questionnaire is enquiring holistic opera-tional resources to be measured in different manners. BSC questionnaire has 18 attributes to be measured, OP questionnaire has 21 attributes. The questionnaires were applied for three different groups of respondents for better reliability of the results: ‘Hosting’, ‘Management’ and ‘Rent’. This chapter presents the results of the combined calculation - from all the three groups of respondents together. In the case of the Company A, 10 respondents participated in the research and 8 re-spondents participated from the side of the Company B. The number of partici-pants can be considered as sufficient for making strong judgments and sugges-tions.
2.1.2.1 Balanced Score Cards (BSC)
It is reasonable to begin with tracing similarities in what the case companies ex-pect to achieve in the future and consider more important for the future competi-tiveness. Figure 1 demonstrates the comparison between the experiences and ex-pectations of the companies (left picture – Company A; the right one –Company B). The attributes with the biggest gap between experience (past/present) and ex-pectation (future) are the strongest ones.
The matches between the expected positive changes for the companies are marked by rectangles over the attributes. The above listed graphic implies that among the attributes with the biggest gap only one is expected to improve in both companies – ‘Information technology’. Both companies feel that they are lacking in the men-tioned attribute and expect it to improve in the future.

Proceedings of the University of Vaasa. Reports 7
Figure 1. PERFORMANCE (BSC): Expectations vs. experiences among Companies A and B.
Figure 2 demonstrates the results of CFI (BSC) calculation for both companies. Both red and yellow attributes belong to the extremes and should be considered as critical or potentially critical.

8 Proceedings of the University of Vaasa. Reports
Figure 2. CFI: Matches of the extreme attributes among Companies A and B (PERFORMANCE - BSC).
As for the previous figure (Figure 2), the matches are marked by rectangles over the attributes. The graphic shows that three attributes may become critical in the close future: ‘Brand’, ‘Information technology’ and ‘Benevolent collaboration’; that is why the companies need to pay attention to them.
The following Figure 3 uses the same logic with only one difference – it refers to BCFI (BSC) calculation. Now matches were traced in both extreme groups (red and yellow). The following attributes have the potential to become critical for the companies’ business performance: ‘Brand’, ‘Information technology’ (as in the case of CFI (BSC) calculation).

Proceedings of the University of Vaasa. Reports 9
Figure 3. BCFI: Matches of the extreme attributes among Companies A and B
(PERFORMANCE – BSC).
At the same time, the following attributes are critical already for both case com-panies: ‘Openness’ and ‘Customer’.
2.1.2.2 Operations (OP)
As in the previous sub-chapter, we begin with the investigation of experiences, expectations and gaps between them inside the two case companies. The target is to understand, which of the attributes from resource point of view are taken by the companies more seriously and which they want to improve. Figure 4 demon-strates the comparison between the experiences and expectations of the compa-nies (left picture – Company A; the right one – Company B). The most interesting for us are the attributes with the biggest gap between experience (past/present) and expectation (future).

10 Proceedings of the University of Vaasa. Reports
Figure 4. RESOURCES (OP): Expectations vs. Experiences among Compa-nies A and B.
The matches between the expected positive changes for the companies are marked by rectangles over the attributes. Figure 4 shows the following matching attributes – ‘Communication between different departments and hierarchy levels’ and ‘Availability of information in information systems’. Both companies express their will to improve the mentioned attributes in the nearest future to have a better functioning internal processes.

Proceedings of the University of Vaasa. Reports 11
Figure 5 demonstrates the results of CFI (OP) calculation for both companies. The similarities among the critical areas of the companies are marked by rectan-gles over the attributes.
Figure 5. CFI: Matches of the extreme attributes among Companies A and B (RESOURCES - OP).
The figure shows that two attributes are critical for both companies: ‘Adaptation to knowledge and technology’ and ‘Utilizing different types of organizing systems
12 Proceedings of the University of Vaasa. Reports
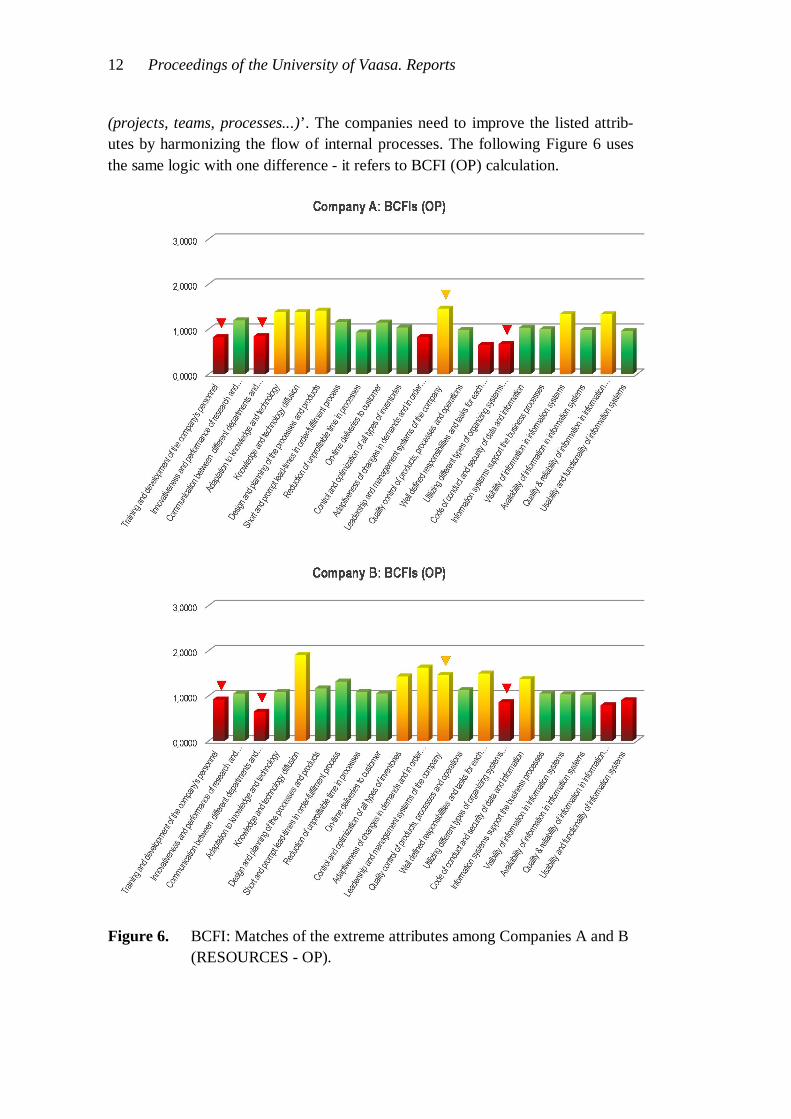
(projects, teams, processes...)’. The companies need to improve the listed attrib-utes by harmonizing the flow of internal processes. The following Figure 6 uses the same logic with one difference - it refers to BCFI (OP) calculation.
Figure 6. BCFI: Matches of the extreme attributes among Companies A and B (RESOURCES - OP).

Proceedings of the University of Vaasa. Reports 13
Now matches were traced in both extreme groups (red and yellow). The following attribute has potential to become critical for the companies’ business perfor-mance: ‘Leadership and management systems of the company’. At the same time, the following attributes are critical already for both case companies: ‘Training and development of the company's personnel’, ‘Communication between different departments and hierarchy levels’ and ‘Utilizing different types of organizing systems (projects, teams, processes...)’ (as in case of CFI (OP) calculation).
2.1.3 Validation
The significance of results’ validation is important for all research, as it indicates the reliability and correctness of the study made. In addition, it enables detection of the study’s drawbacks and judgments about further research needs in the area. The results of the analysis for Company A are at the semi-strong market test stage as the decisions made on the results’ basis have been already applied (Kasanen, Lukka & Siitonen 1993).
The results of Company B have gone through weak market test (Kasanen et al. 1991). The test was carried out by asking the commitment of the management to propose an improvement (efficiency and effectiveness) of the attributes found critical, for example: ‘Communication between different departments and hierar-chy levels’ and ‘Utilizing different types of organizing systems (projects, teams, processes...)’. The main limitation of the research is the small sample – little number of participating case companies.
2.1.3.1 Conclusions
A new method for dynamic resource allocations in the operative processes in housing, especially in the renting, where the customers move from one apartment to another one, has been proposed, and preliminarily validated and verified by weak and semi-strong market tests. Through the applied methodology we found out which areas of the companies’ business performance and resources (internal process flow) are critical and may become critical. Hence, it became possible to trace tendencies which take place internally and externally of, at least, two com-panies operating on the housing market of Finland. With more participants the method has good potential to predict the behaviour of the whole Finnish housing market. This might be considered as a strong tool of strategic planning and deci-sion-making. Another benefit is comparatively simple application of the method to other market segments and industries. The study has shown high level of exper-tise for the answers obtained and sufficient level of the overall reliability. Never-theless, the method is at the very early stage of development and has been tested

14 Proceedings of the University of Vaasa. Reports
only with two participating company. Further development and validation is re-quired for getting stronger data about trends and correlations existing in the pro-posed method.
2.1.4 Comparison of social housing policies in Finland, China and Thailand
2.1.4.1 Introduction
During the RESPONSE project Chinese, Thai and Finnish social housing models were compared to get profound knowledge of the variances in affordable housing policies. This comparison takes into account the influence of number of factors at macroeconomic level - urbanization level, population growth, gross domestic product etc. The work ranks targets and goals of policy makers and project devel-opers for the implementation of policies and describes the role of social housing for regional development and economic growth. Comparing different countries with the Finnish model highlights major differences in the developing cycles of the real estate business. Statistical indicators for the 50 year historic values are discussed.
2.1.4.2 Social housing
Social housing policies are one of the tools that governments use when trying to provide welfare for all citizens and ensure economic stability. With high turbu-lence in global markets and growing social unrest social housing is high in the agenda of policy makers
The link between social housing and economic factors is quite acquainted to poli-cy makers, but still studies of the factors behind the actual measures taken to ad-dress the topics are not proportional to the importance of the issue. Housing poli-cies are closely connected to overall economic performance and living standards. Indeed, as recent analysis shows, effectively supervised financial and mortgage market development combined with policies that enhance housing supply flexibil-ity are key for macroeconomic stability (Forss & Toshev. 2012.)
There are substantial variations around the world in the countries policy responses to economic and demographic changes. They differ depending on national cul-tures and political traditions as well as on the impulses of the development of the national economies. Still housing has been a major policy ingredient for almost every state regulation in the effort to adopt welfare-state model. (Feddes & Die-leman 1996.)

Proceedings of the University of Vaasa. Reports 15
Starting from the 60’s substantial efforts have been directed to building more dwellings in response to the housing shortage. Over the years the focus moved from construction subsidies, meant to keep the cost of housing low, to housing-cost subsidies that were made accessible to households whose earnings did not let increase in housing expenses. Such help was offered mostly to tenants in some countries, while elsewhere similar packages also included low-income homeown-ers (Weesep 2000). In countries where such policies are implemented, house pric-es easily reach market levels. At the same time, it stimulated efforts to improve housing quality within and outside designated urban renewal areas. Nowadays the links between housing policies and economic cycles took the form of adjustments made in various housing programs to keep up with changes in national economic conditions. Motivation for adjusting the housing policies derived from policy de-cisions concerning the national budget.
States have had to take proactive measures in the context of global economic cri-sis, which gave the size of the national debt so much political weight. Yet, at low-er levels of policy-making, there is another economic dimension of housing. There are clear signs that local and regional governments turn increasingly to so-cial housing as tool to stabilize economic environment and sustain wellbeing. This is a response to fundamental changes in the world economy. (Weesep 2000)
The accessibility of affordable housing for low-income groups varies widely among countries. It depends on the shares of social, subsidized, and market-rate housing as well as on the mix of rental and owner-occupier dwellings. From this perspective and considering the various levels of economic development in dif-ferent societies, it is understandable that housing finance – and more broadly speaking, housing policy instruments – have taken various courses in different countries. Historically, each country’s housing policy can be divided into three main stages:
1. Concentration on new construction
2. Emphasis on management and maintenance of the existing stock and im-proving the use of existing assets
3. Emphasis on addressing problems in connection with regenerating urban areas and restructuring housing within wider social infrastructures, again within the framework of privatization and reduced funding
Policy-makers have to make some basic choices regarding the design of a housing finance system to address specific housing sector objectives:
16 Proceedings of the University of Vaasa. Reports
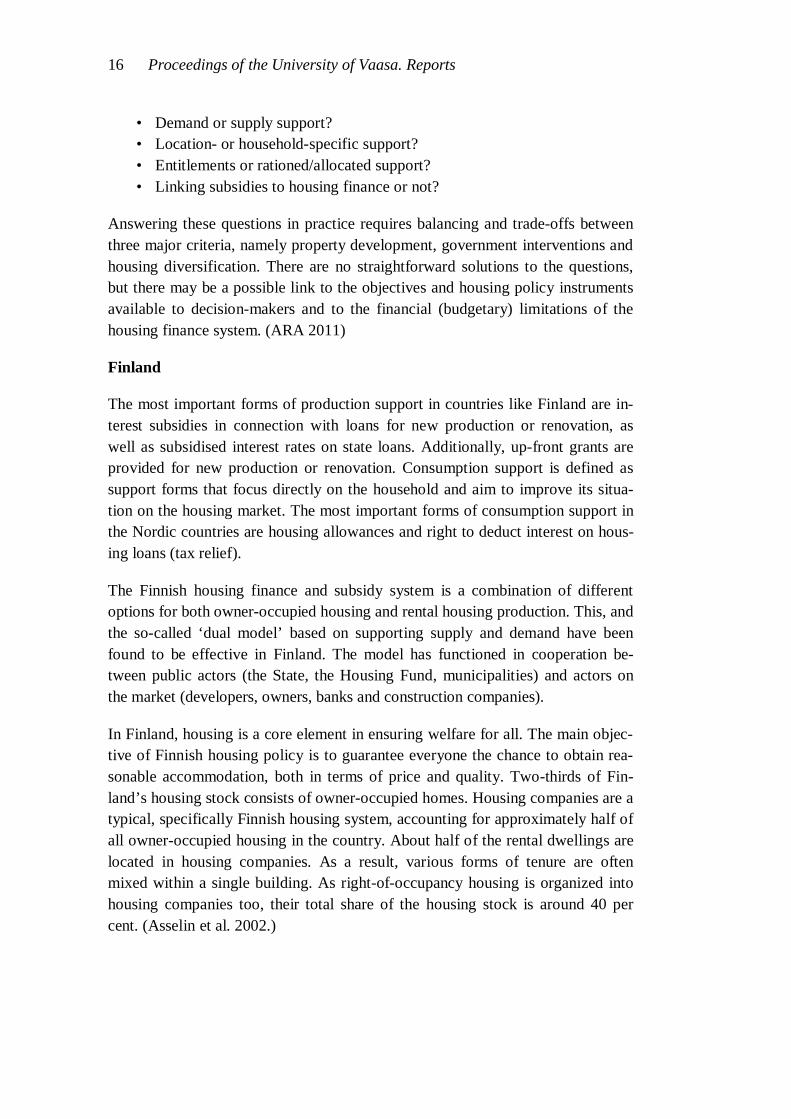
• Demand or supply support? • Location- or household-specific support? • Entitlements or rationed/allocated support? • Linking subsidies to housing finance or not?
Answering these questions in practice requires balancing and trade-offs between three major criteria, namely property development, government interventions and housing diversification. There are no straightforward solutions to the questions, but there may be a possible link to the objectives and housing policy instruments available to decision-makers and to the financial (budgetary) limitations of the housing finance system. (ARA 2011) Finland
The most important forms of production support in countries like Finland are in-terest subsidies in connection with loans for new production or renovation, as well as subsidised interest rates on state loans. Additionally, up-front grants are provided for new production or renovation. Consumption support is defined as support forms that focus directly on the household and aim to improve its situa-tion on the housing market. The most important forms of consumption support in the Nordic countries are housing allowances and right to deduct interest on hous-ing loans (tax relief).
The Finnish housing finance and subsidy system is a combination of different options for both owner-occupied housing and rental housing production. This, and the so-called ‘dual model’ based on supporting supply and demand have been found to be effective in Finland. The model has functioned in cooperation be-tween public actors (the State, the Housing Fund, municipalities) and actors on the market (developers, owners, banks and construction companies).
In Finland, housing is a core element in ensuring welfare for all. The main objec-tive of Finnish housing policy is to guarantee everyone the chance to obtain rea-sonable accommodation, both in terms of price and quality. Two-thirds of Fin-land’s housing stock consists of owner-occupied homes. Housing companies are a typical, specifically Finnish housing system, accounting for approximately half of all owner-occupied housing in the country. About half of the rental dwellings are located in housing companies. As a result, various forms of tenure are often mixed within a single building. As right-of-occupancy housing is organized into housing companies too, their total share of the housing stock is around 40 per cent. (Asselin et al. 2002.)

Proceedings of the University of Vaasa. Reports 17
In the same way as owner-occupied housing, the housing company format can be adopted for rental housing. In fact, owners and tenants often occupy dwellings in the same housing company building. In other cases, mostly in state-financed housing, rental-housing companies are organized as limited liability companies in which the company’s shares do not entitle the owner to the possession of an indi-vidual dwelling.
Right-of-occupancy dwellings are organized in the form of housing companies. Right-of occupancy agreements give residents certain rights, which are similar to ownership of one’s own home. Residents pay a right-of-occupancy fee amounting to 15 per cent of the purchase price of the dwelling and a monthly occupancy fee. Right-of-occupancy schemes do not ultimately entitle residents to purchase their homes, although the owners of the housing may not unilaterally terminate the right-of-occupancy agreement.
Part-ownership housing is a new way to finance the purchase of a dwelling. The opportunity for part-ownership brings home-ownership within the reach of many more people. Residents of state-subsidized part-ownership housing first purchase a 15 per cent share of the dwelling, granting them the right of residency under a fixed-period tenancy during which they pay rent to the majority owner. At the end of the tenancy, the residents can buy the rest of the shares. In this manner, resi-dents are entitled to full ownership of the dwelling, under the provisions of the Housing Companies Act. Eligibility for part-ownership of housing produced through Housing Fund interest subsidy schemes is based on social and financial factors. After residents have completely purchased such housing, control over factors such as residence eligibility and sale price no longer apply. Conditions for market financed part-ownership schemes run by housing companies differ from those applying to state-subsidized housing. (ARA 2011)
China
Chinese housing policy is strongly centralized with government situated in Bei-jing. Advices and recommendations are given to local governance and authorities. From the capital they are monitoring closely the environment in provinces, cities and rural areas. The main tools for implementation housing policies in china are naturally the right and ownership of land, construction project implementation and financial regulations. The government goals are to ensure the development and stability in the society with urbanization progress, along with infrastructure modernization and economic growth. The government and authorities manage the housing policy by control over land, regulations and capitals. The land is one of the crucial resources of new building. It cannot be owned by private individuals, only leased. In principal the government can always take the land its use when it

18 Proceedings of the University of Vaasa. Reports
needs it necessary. City and areal planning is the most important guide for project developers. Projects are then led by constructions allowances and regulations. The government can and does decide what and where can/must be built.
Housing is financed by private and public capital. Owners occupied apartments finance consists of own capital and bank loan. The guarantee needed for bank loan is under government control. The guarantee is one practical tool to control and drive housing markets development. Public support forms for rental housing are supply and demand based. Supply support is provided to project developer to decrease rent prices. The valid market price is always according to location, quali-ty and other issues. To get the support the development company must accept certain technical rules and profit limitations. Actually the government can and does orders the companies to produce these supported houses in areas they like. The individuals can get also additional support for rent.
Government launched public housing program 2008. The aim is to provide more affordable and lower cost housing for people. The housing prices have risen rap-idly and it has many negative influences to people and good development. Pro-gram supports practically economic growth and wellbeing and avoids unrest in society.
Thailand
The start of the modern housing policy in Thailand came after WWII and the re-construction of Bangkok. The city industrialization rate was high and the popula-tion grew annually almost 4 % annually over the years. This pressed the govern-ment to put more effort to city and housing planning. The first efforts were to establish authorities with responsibilities for planning. Some major actions were taken, like clean up the slums and production of new more affordable housing, like in project “walk up apartments” did. The end of 60’s and beginning of 70’s brought “Turn the Key” housing in Bangkok. This was suitable to middle- and higher income customers but also for the financial institutions. The oil crisis in 70’s and second in 80’s slowed down well begun development a bit. The big boom started in the mid-80’s and continued until the fall of “Asia tigers” in 1997. During the boom Thailand developed fast due of its cheap labour force and natu-ral resources. The land became attractive for investors from Japan, Korea, Tai-wan, Singapore etc. At that time the real estate markets developed also and chanced the city structure to the new direction. The land and former under-estimated housing areas for low-income people became more profitable and forced the people to find new places to live. The boom lasted while the Gulf war cooled the markets for a while. Many things together made the boom overheat and in 1997 finally came the financial crisis. It was not until 1999 the recovery

Proceedings of the University of Vaasa. Reports 19
was seen. Development has been stronger and weaker all the time until the world’s financial crisis, which slowed the development.
Three government units, Government Housing bank (GH Bank), National Hous-ing Authority (NHA) and Community Development Organization Institute (CODI), implement government middle- and low-income housing programs. GH Bank emphasis finance for low- and middle income mortgages. The Bank has been financing different public housing projects and energy saving projects. NHA assures shelter for all residents. NHA provides apartments, condominiums, gov-ernment employee homes etc. NHA acts primarily between government and pri-vate sector. The government budget funded GODI finance slum-area communi-ties. Well-developed private-sector housing industry provides homes from low-income sector to multi-billion dollar homes.
A change in economic variables has relatively fast influence on housing market. For example, a reduction in interest rate is likely to stimulate both demand and supply in housing market in the short-run (Hossain & Latif 2009). Whereas, urban dynamics is a changing process that take a long period of time to show a signifi-cant impact on housing market. Therefore, urban dynamics plays an important role in a long-run analysis.
All of these country profiles differ to one another, but still there are appealing reasons for policy makers to pursued models devised to create an equitable hous-ing system, since the lowest income groups can gain access to low-rent units – in principle at least. The study emphasize on identifying tailored best practices gov-ernment policies that can be effective to proactively deal with the possible pitfalls this countries are facing. Social restructuring, slowing economic growth and ten-ant mixing in more expensive new housing to increase local housing opportunities to socially rising households have already been tested and there tailored imple-mentation is a must in the Asian housing market. (Priemus & Van Kempen 1999.)
2.1.4.3 Research approach
During the RESPONSE project we collected data for the description of social housing models in Finland, China and Thailand, and identified the major factors, influencing the structure of the policies of these countries. Structured interviews with decision makers in the sector, housing managers and operators, as well as residents and tenants were conducted in the countries. The topics of discussion were the applied policies, the existing elements of social support for low-income population; the role of social housing as a part of the whole housing market; tar-gets, indicators and goals, what should be the share of social housing in existing housing stock and in new production, as well as future development trends and

20 Proceedings of the University of Vaasa. Reports
challenges in the implementation of policies. Apartment complexes were visited and awarded social housing projects were inspected to get representative sample of the housing environment. On this basis the hierarchy of criteria for decision making was derived, showed at Figure 7.
Figure 7. The hierarchy tree for the housing policy decision making.
During the visits, questionnaire generated from the hierarchy model with Analyti-cal Hierarchy Process AHP software “Expert choice”, were filled by national housing authorities, social housing sector stakeholders, housing companies’ rep-resentatives and university researchers. Out of twenty selected representatives seven participants answered in China, 7 out of 16 answered in Thailand, as well as twenty two informants out of 30 answered in Finland. They filled in the pro-vided questionnaire either as paper format or using the online web based tool. Based on the answers of the pairwise comparison, calculations allow to solve im-portance weight value for each factor and to compare overall the ranking of crite-ria in complete synthesis. In such a way AHP permits decision makers to institute multi-focused housing policy, balancing between factors as is appropriate for their specific country environment targets. (Saaty 2008)
We combined individual judgements in country profiles and ranked the consisten-cy of the answers to validate the logic of the respondents. Importance weight re-sults are a measure of current resource allocation and a foundation for estimates about the effect of reallocating in times of global economic turbulence. This can be further develop scenario planning implementation and enhance policy making. (Forss & Toshev. 2012)
Analysing decision hierarchy for diverse countries can generate versatile signals. It helps to minimize information gaps and inefficient decision making from stra-tegic goals to day to day operations. Management have to make decisions for the

Proceedings of the University of Vaasa. Reports 21
future of the company/organization based on information for the capital flows and level of service needed. (Forss & Toshev. 2012)
For additional verification of the presented social housing factor importance weightings, we take a historic review of the major macroeconomic indicators such as Urbanization level, Population growth, Gross Domestic Product levels and Human development, and generate regression trends in last 50 years data window. They are compared in order to explain the different environment of the housing markets. Descriptive statistics for the indicators are also discussed.
Data analysis
After all the information from the questionnaire was analyzed, the calculated rela-tive importance values are presented in Figure 8. Each country profile represents the combined participants’ evaluation and the weights of three major policy fac-tors sum up to 100%.
Figure 8. Main policy factors weightings among the three countries.
As it is evident from Figure 8, government intervention is the single most im-portant factor for the social housing policy of China. This comes as no surprise given the centralized decision structure that is dominant in the country. The same criteria also have the highest priority in Thailand, though in that state all three measures are well balanced. In Finland property development have the highest priority with 42 % importance, 11 more than the level of China and Thailand.

22 Proceedings of the University of Vaasa. Reports
Government intervention and housing diversification are of equal value in the Scandinavian country too.
Table 1. Main factors importance present values.
Finland China Thailand Government Interventions 28,6% 54,3% 38,5% Property development 42,9% 31,7% 31,2% Housing Diversification 28,5% 14,0% 30,3%
Inconsistencies in the answers were measured at 0,007 for the Finnish sample, 0,01 for the Chinese and Thailand, which are all in the acceptable limits for the model.
In Figure 9, Figure 10 and Figure 11 all the factors are sorted according there val-ues with respect to the overall social housing policy. The small gap between the factors in Finnish results indicates more balanced strategy, and advanced culture of private housing system.
Figure 9. Complete hierarchy weights for Finland.
In China there is a group of five very important factors and large importance gap to the last 6 elements. Strong urbanisation and fast economic growth present is-sues that need to be addressed by central government as social housing supply and demand are of highest priority. There is strong state control and trust in it. Social infrastructure and stability are a big concern having in mind the lack of organization and resources for distant and rural population groups.
M aintenance_an d_manage ment .130Produc t ion_of_new _homes .102Re nov ation_of_exist ing_houses .091Spec ial Groups housing .087Location region dev .087Soc ial inf rastru c ture .077State s Subsidized R enta l H ousing .076Ow ner oc cu pancy .074Soc ial_H ousing_ Supply_supp ort .061Sellin g houses on the market .055M ark et fin anced Rental Housing .039De molition o f houses .035Re gulat ion of rent and entitlement/ rat.. . .034Right of occ upanc y .028Soc ial_H ousing_ Demand_support .027

Proceedings of the University of Vaasa. Reports 23
Figure 10. Complete hierarchy weights for China.
Social structure issues are influencing the prioritization in Thailand as well, but there maintenance and management and private ownership are of high signifi-cance. Social stability is an issue, as the country lacks confidence in public hous-ing. The results suggest also China and Thailand lack’s renovation efforts for old houses, which is a reason for the partially bad housing conditions present there.
Figure 11. Complete hierarchy weights for Thailand.
Macroeconomic Indices analysis
The path of these three countries population growth differs a lot (Figure 12), but the latest data shows they are all reaching for 0,5 % average annual population growth.
Social_H ousing_ Supply_S upp.. . .195Soc ial_Infrastruc ture .172Soc ial_H ousing_ Demand_Su... .169Loc at ion_ and_Reg ion_D evel. .. .140Produc tion_of_N ew_H ouses .114De molition_of_Houses .055Ow ner_Occup ancy .050Maintenanc e_an d_Mana gem... .039Re novation_of_Houses .028Priv ate_R ental_Housing .026Subsidized_R ental_H ousing .013
Soc ial_Infrastruc ture .202M aintenance_an d_Mana gem... .164Ow ner_Occ up ancy .159Re nov ation_of_Houses .117Location_ and_Reg ion_D ev el. .. .070Produc t ion_of_N ew_H ouses .061Soc ial_H ousing_ Supply_Supp.. . .056Subsidized_R ental_H ousing .053Soc ial_H ousing_ Demand_Su... .049De molition_of_Houses .035Private_R ental_Housing .033

24 Proceedings of the University of Vaasa. Reports
Figure 12. Population growth (annual %).
Annual population growth rate for year t is the exponential rate of growth of mid-year population from year t-1 to t, expressed as a percentage. Population is based on the de facto definition of population, which counts all residents regardless of legal status or citizenship--except for refugees not permanently settled in the country of asylum, who are generally considered part of the population of the country of origin (derived from total population). (United Nations Population Division 2009.)
The Human Development Index for the period 1980- 2010 demonstrates in Figure 13 similar trends for positive development, with fairly equal growth factor for Finland and Thailand, while China shows steeper growth.
Figure 13. Human Development Index.

Proceedings of the University of Vaasa. Reports 25
Human Development Index is an index used to rank countries by level of "human development". It contains three dimensions: health level, educational level and living standard.
In our data analysis we used multi tools for extracting regression and correlation results for the income per person, gross domestic product per capita and urban population indicators for the historic period from 1960 till 2010.
The economic conditions in the three countries differ as China and Thailand GDP figures are much lower compared to the Finnish level. Finnish income per person grew much faster over the period 1960-1989, while for the two Asian countries it was almost flat. This is of major importance for the economic and housing cycle.
Figure 14. Income per person, Gross Domestic Product per capita in constant 2000 US$. (World Bank World Development Indicators).
The data in Figure 14 shows that Chinese average income will soon equal those of Thailand. Table 2 shows that China is the only country with positive kurtosis translating to ever positive increase in the indicator with lowest standard devia-tion from the mean growth. As for Finland, while having the highest income still have also the highest deviation and variance from the growth rate.
Table 2. Descriptive statistic for income per person indicator.
Standard Deviation
Sample Variance Kurtosis Skewness Minimum Maximum
Finland 5969.08 35629968.33 -0.80 0.24 7305.22 28626.73 China 498.67 248672.00 1.32 1.46 72.32 1964.71 Thailand 738.25 545009.92 -1.20 0.52 317.08 2640.29
26 Proceedings of the University of Vaasa. Reports
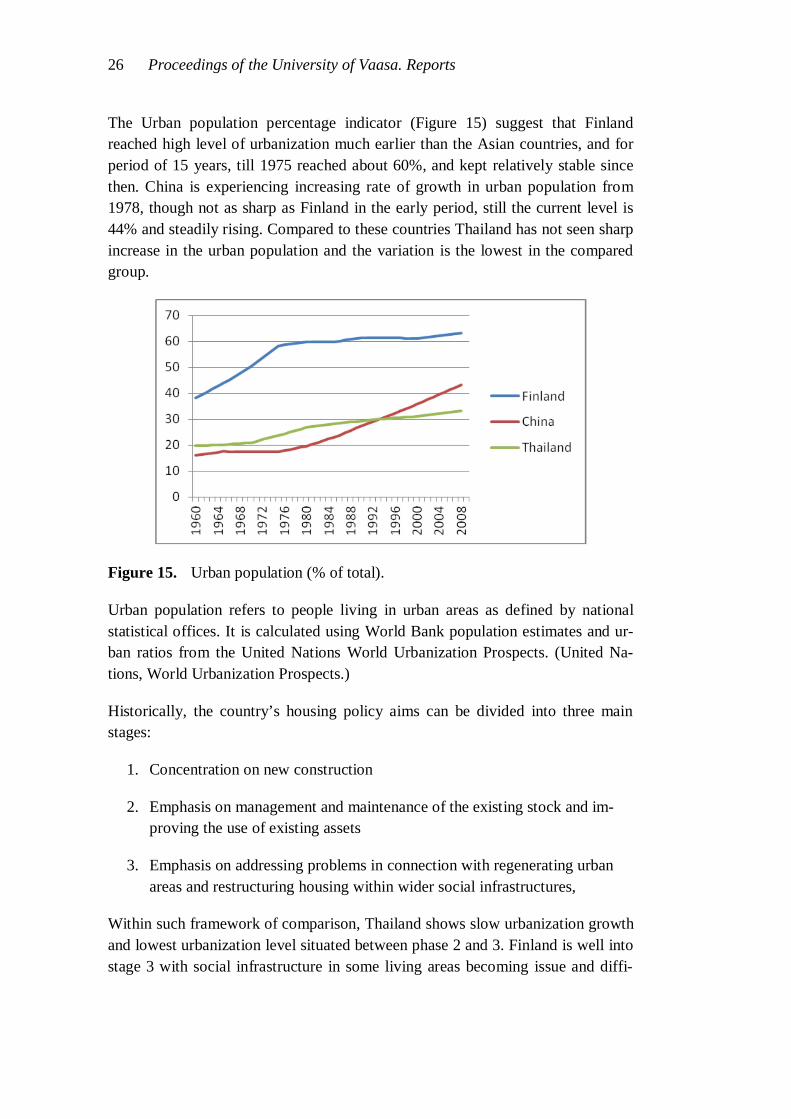
The Urban population percentage indicator (Figure 15) suggest that Finland reached high level of urbanization much earlier than the Asian countries, and for period of 15 years, till 1975 reached about 60%, and kept relatively stable since then. China is experiencing increasing rate of growth in urban population from 1978, though not as sharp as Finland in the early period, still the current level is 44% and steadily rising. Compared to these countries Thailand has not seen sharp increase in the urban population and the variation is the lowest in the compared group.
Figure 15. Urban population (% of total).
Urban population refers to people living in urban areas as defined by national statistical offices. It is calculated using World Bank population estimates and ur-ban ratios from the United Nations World Urbanization Prospects. (United Na-tions, World Urbanization Prospects.)
Historically, the country’s housing policy aims can be divided into three main stages:
1. Concentration on new construction
2. Emphasis on management and maintenance of the existing stock and im-proving the use of existing assets
3. Emphasis on addressing problems in connection with regenerating urban areas and restructuring housing within wider social infrastructures,
Within such framework of comparison, Thailand shows slow urbanization growth and lowest urbanization level situated between phase 2 and 3. Finland is well into stage 3 with social infrastructure in some living areas becoming issue and diffi-
Proceedings of the University of Vaasa. Reports 27
culties as aging population is in need of renovation old housing stock. Though China has stable economic growth, still shows features of stage 1 policy priorities.
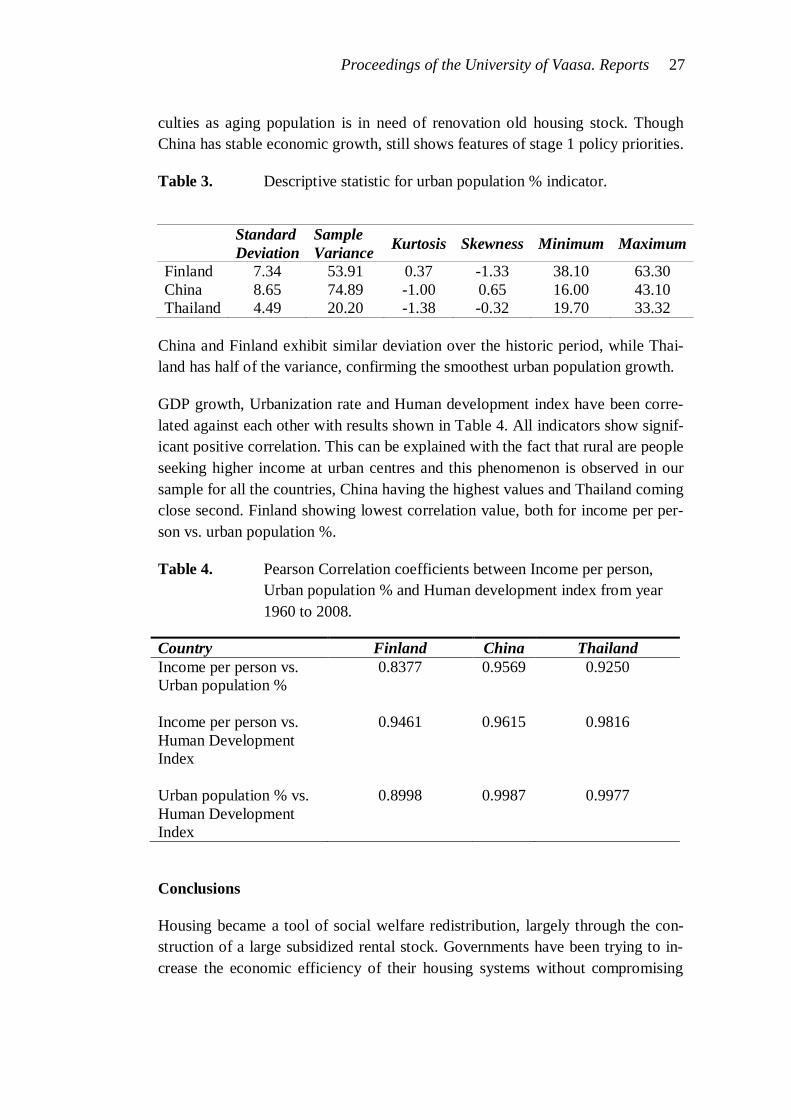
Table 3. Descriptive statistic for urban population % indicator.
Standard Deviation
Sample Variance Kurtosis Skewness Minimum Maximum
Finland 7.34 53.91 0.37 -1.33 38.10 63.30 China 8.65 74.89 -1.00 0.65 16.00 43.10 Thailand 4.49 20.20 -1.38 -0.32 19.70 33.32
China and Finland exhibit similar deviation over the historic period, while Thai-land has half of the variance, confirming the smoothest urban population growth.
GDP growth, Urbanization rate and Human development index have been corre-lated against each other with results shown in Table 4. All indicators show signif-icant positive correlation. This can be explained with the fact that rural are people seeking higher income at urban centres and this phenomenon is observed in our sample for all the countries, China having the highest values and Thailand coming close second. Finland showing lowest correlation value, both for income per per-son vs. urban population %.
Table 4. Pearson Correlation coefficients between Income per person, Urban population % and Human development index from year 1960 to 2008.
Country Finland China Thailand Income per person vs. Urban population %
0.8377 0.9569 0.9250
Income per person vs. Human Development Index
0.9461
0.9615
0.9816
Urban population % vs. Human Development Index
0.8998
0.9987
0.9977
Conclusions
Housing became a tool of social welfare redistribution, largely through the con-struction of a large subsidized rental stock. Governments have been trying to in-crease the economic efficiency of their housing systems without compromising

28 Proceedings of the University of Vaasa. Reports
social equity. Therefore, with time the focus of housing policy shifted from pro-duction to maintenance, to support for households in need. More vital changes are coming for fast growing economies, as governments give priority to development goals. It is up to policy-makers to prove that there are rational and bring equity to population. Whereas housing policy generally follows the economy, that link could also work the other way around. As local governments compete for eco-nomic growth, a promising strategy is to improve local housing conditions and proactively address social infrastructure issues.
Further analysis
The identified trends can be used in scenario planning and SWOT analysis to cal-culate the direction of change and the variation of main criteria. Empirical con-nections can be made with main criteria values to rearrange the complete hierar-chy weights depending of global economic figures.
2.2 Transformational leadership
2.2.1 Transformational leadership
The transformational leadership studies were started by James MacGregor Burns. The baseline and purpose of transformational leadership is to inspire, encourage and motivate each other by taking into account trust building between different individuals, and to work together towards common goals. (Bass 1985)
Transformational leadership is an interesting leadership style. It leads different positive issues and changes in the working life by demanding forecasts of quickly changing operational environment and on different levels in an organization. A transformational leader is an energetic and helpful person who usually takes the situation under control by aiming forward with clear goals and clear vision. Transformational leadership survives best from the challenges, because they have the will to forecast and to prepare the organization to the changes fast enough. To guarantee the competitiveness and the market capability, the resources will be utilized effectively. The managers utilizing transformational leadership are ‘al-ways there for you’, visible, not hidden in their offices. They are willing to be role models for the others and show an example to them. When problems appear, the manager will settle the issue, search for different solutions for the best results in practice. The transformational leader may also get frustrated without being able to use their skills in situations they could change things for a better direction and get results by a proactive manner to meet the goals.
Proceedings of the University of Vaasa. Reports 29
2.2.2 Transformational leadership during crisis
Serious problems in economy caused by the turbulent changes in the business environments may drive the business down. The problem is usually that the situa-tion has not been focused enough. Organizations should always aim at the adap-tation to the changes in the environment so that the quick changes in their strate-gies and business plans could be made. When success is created, the highlighted individuals are the ones who adapt and quickly learn new things, and will be aim-ing to common goals. The organization culture defines the principles affecting the procedures made by the transformational leaders being in the key position for changes.
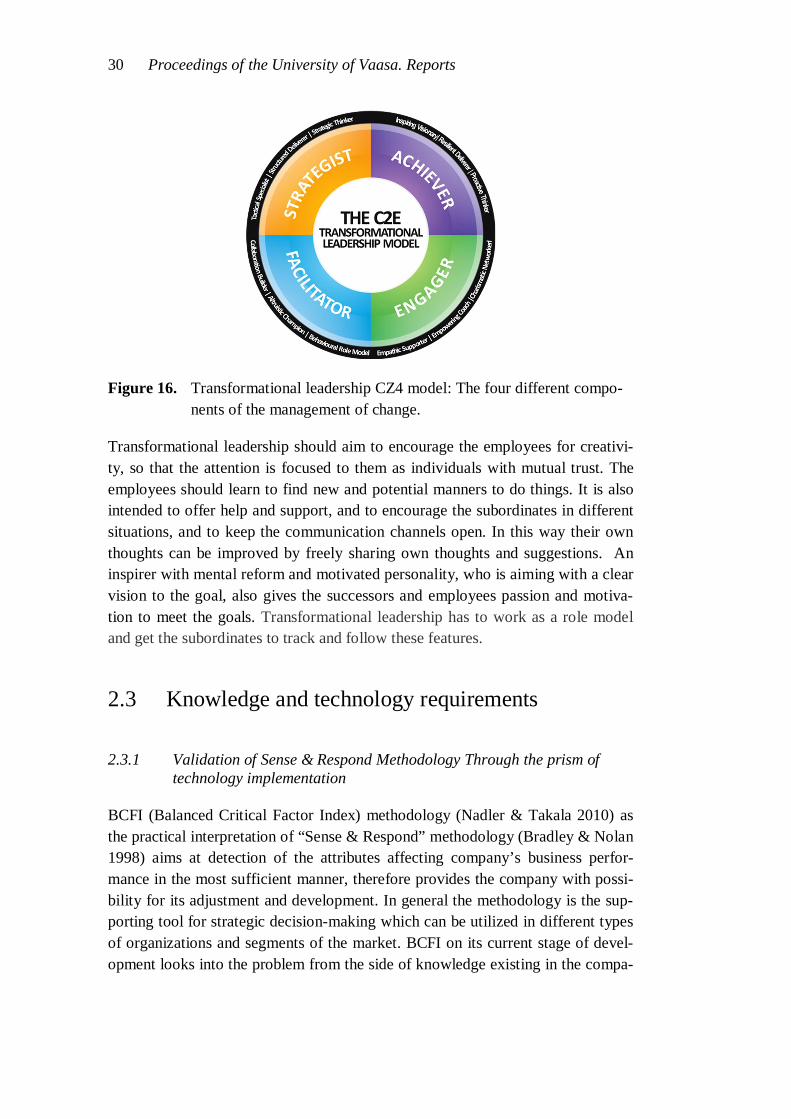
According to RESPONSE case studies, transformational leadership indexes changed because of the crisis in economy after 2008. The biggest reason for this was the fast speed of change and the lack of protean in organizations. The prob-lem was too low level of proactiveness, e.g. the subordinates coaching for the production calculations and encouraging meeting goals. These problems should be paid more attention to, so that they could be quickly taken into account and their competitive position would sustain. The problems also affect the decrease of the companies’ results. The decreases were also affected by the tightened compe-tition and the slow down of customer inquiries. The continuous development and maintaining competitiveness, is the most important matter in every organization. Organizations must be able to do quick changes in constantly changing environ-ments. Problems that were experienced after the case- research require immediate inspections and improving, so the companies’ competitive advantage would sus-tain. In the case companies, the company's strategic direction was not always clear. On the base of the operational competitiveness in category (MSI), they mostly operated as prospector and defender simultaneously. It is important to consider that operational competitiveness in category (MSI) and transformational leadership (TLI) are compatible and supportive to the company's sustainable competitive advantage. By training the organization managers to the change, pos-sibilities for comprehensive changes and innovations are opened for the organiza-tions. (Figure 16, Nissinen 2004, p. 55)
30 Proceedings of the University of Vaasa. Reports
Figure 16. Transformational leadership CZ4 model: The four different compo-nents of the management of change.
Transformational leadership should aim to encourage the employees for creativi-ty, so that the attention is focused to them as individuals with mutual trust. The employees should learn to find new and potential manners to do things. It is also intended to offer help and support, and to encourage the subordinates in different situations, and to keep the communication channels open. In this way their own thoughts can be improved by freely sharing own thoughts and suggestions. An inspirer with mental reform and motivated personality, who is aiming with a clear vision to the goal, also gives the successors and employees passion and motiva-tion to meet the goals. Transformational leadership has to work as a role model and get the subordinates to track and follow these features.
2.3 Knowledge and technology requirements
2.3.1 Validation of Sense & Respond Methodology Through the prism of technology implementation
BCFI (Balanced Critical Factor Index) methodology (Nadler & Takala 2010) as the practical interpretation of “Sense & Respond” methodology (Bradley & Nolan 1998) aims at detection of the attributes affecting company’s business perfor-mance in the most sufficient manner, therefore provides the company with possi-bility for its adjustment and development. In general the methodology is the sup-porting tool for strategic decision-making which can be utilized in different types of organizations and segments of the market. BCFI on its current stage of devel-opment looks into the problem from the side of knowledge existing in the compa-

Proceedings of the University of Vaasa. Reports 31
ny as the basis of resource allocation arrangement. The growing role of technolo-gy cannot be underestimated nowadays as it brings vast number of opportunities for business development, growth and strengthen of the competitive advantages. In the current century of the world wide spreading of information technology (IT) even the companies with conservative forms of operations relay on them. The technology has overcome the barrier when was only created by knowledge, but now vice versa, technology gained ability for the knowledge creation. In this sense, at least two points of view should be applied by BCFI methodology – knowledge and technology.
The current article demonstrates validation of Balanced Critical Factor Index through utilization of technology component. The validation is arranged through comparison of traditional BCFI and technology-extended BCFI calculation. It goes in close relation with Constructive Research Approach (Kasanen, Lukka & Siitonen 1993), as tries to build a new method based on previously developed theories. In result two sides of business are analyzed what leads to more measured and accurate strategic decisions. In addition, the extended model brings possibil-ity for displacing attributes from critical to non-critical ones. The case study is at the semi-strong market test stage as the decisions made on the results’ basis have been already applied. Nevertheless, the main limitation of the research is the small sample – little number of participants.
2.3.2 Results
The current chapter demonstrates the application of the described methods to the case company TEAK (the abbreviation is in Finnish). TEAK abbreviation stands for ‘Leading Technology and Training Centre’ for wood and furniture industries in Scandinavia. The chosen research method is survey; the interviewee focus group consists of the company’s board members (seven participants), hence insur-ing high level of expertise for the obtained answers. The case study is in the semi-strong market test stage as the decisions made on the results have been already applied. The strong market test results will be available when the consequence of the made decisions appear.
Figure 17 compares the traditional BCFI (the columns on the left hand side) with the technology extended BCFI, measuring technology importance by knowledge (the columns on the right hand side). The arrows on the top of the columns show the direction of attributes change in case of application both of BCFI results, the arrows’ colour relates attributes with the critical (red and yellow) or non-critical (green) category. The same logic is further used in similar type of graphics.

32 Proceedings of the University of Vaasa. Reports
From Figure 17 it is possible to note the significant difference in attitude of knowledge and technology to criticality. From technology point of view, the at-tributes number 2, 3, 13, 14, 15, 18, 24, 25, 29, 30, 33 and 39 were even more critical in comparison with the traditional attitude of BCFI. They referred to the critical (red colour) category. At the same time, some of the attributes from the non-critical (green colour) sector felt even more stable: the attributes number 1, 4, 6, 7, 9, 16, 19, 26, 34, 35 and 38.
Figure 17. Comparison of traditional BCFI to the extended one in past (2008-
2011).
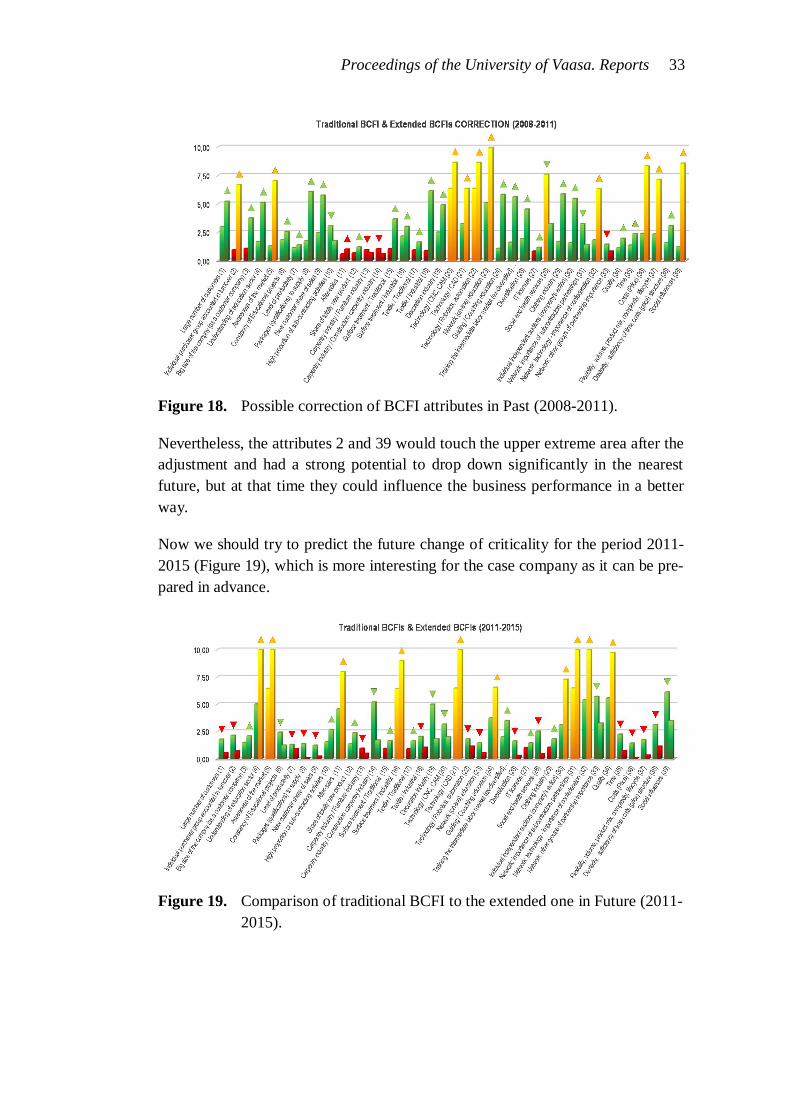
The study offers to check if we would have an opportunity in the past to adjust at least some of the attributes in a way to make them non-critical, or not that critical as they were. Figure 18 demonstrates the alternative choice from the dominating technology, which brings the possibility to adjust number of attributes and dis-place them from critical to non-critical category.
The following attributes (Figure 18) could be adjusted and normalized in the past through application of other technology level: 2, 3, 15, 18, 24, 25, 29, 30 and 39. In result 75% of the critical attributes might leave the most critical level (red).
Proceedings of the University of Vaasa. Reports 33
Figure 18. Possible correction of BCFI attributes in Past (2008-2011).
Nevertheless, the attributes 2 and 39 would touch the upper extreme area after the adjustment and had a strong potential to drop down significantly in the nearest future, but at that time they could influence the business performance in a better way.
Now we should try to predict the future change of criticality for the period 2011-2015 (Figure 19), which is more interesting for the case company as it can be pre-pared in advance.
Figure 19. Comparison of traditional BCFI to the extended one in Future (2011-
2015).
34 Proceedings of the University of Vaasa. Reports
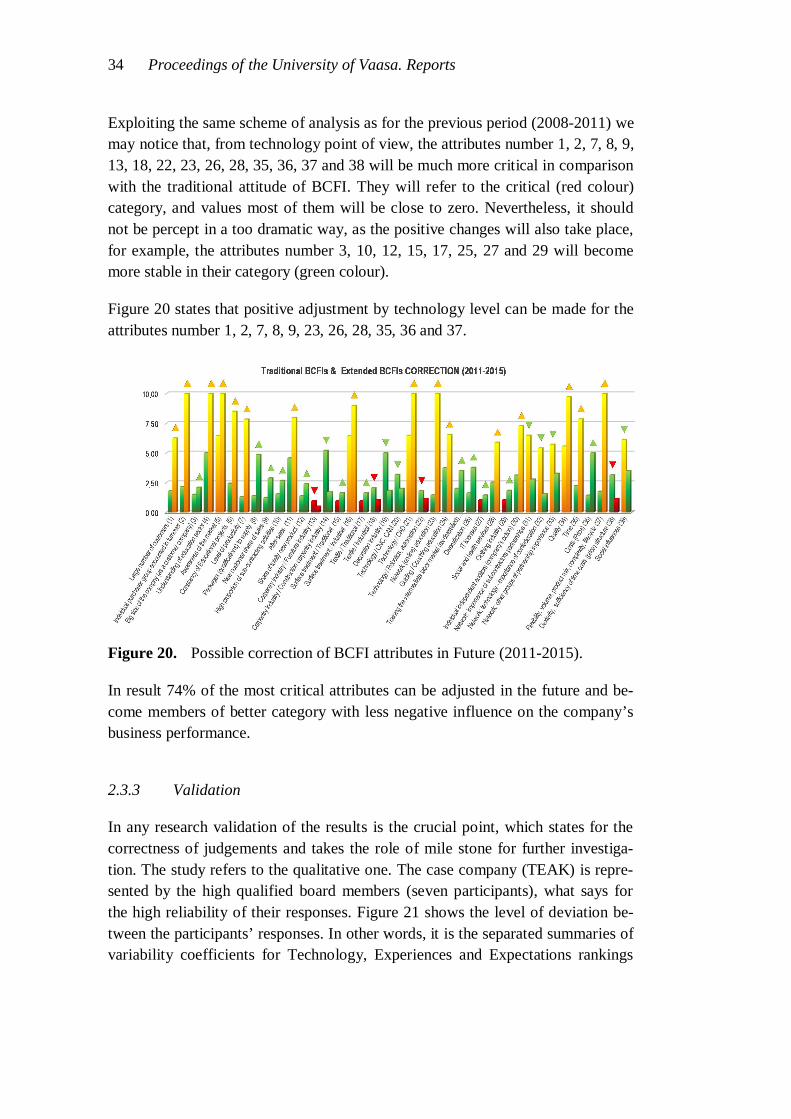
Exploiting the same scheme of analysis as for the previous period (2008-2011) we may notice that, from technology point of view, the attributes number 1, 2, 7, 8, 9, 13, 18, 22, 23, 26, 28, 35, 36, 37 and 38 will be much more critical in comparison with the traditional attitude of BCFI. They will refer to the critical (red colour) category, and values most of them will be close to zero. Nevertheless, it should not be percept in a too dramatic way, as the positive changes will also take place, for example, the attributes number 3, 10, 12, 15, 17, 25, 27 and 29 will become more stable in their category (green colour).
Figure 20 states that positive adjustment by technology level can be made for the attributes number 1, 2, 7, 8, 9, 23, 26, 28, 35, 36 and 37.
Figure 20. Possible correction of BCFI attributes in Future (2011-2015).
In result 74% of the most critical attributes can be adjusted in the future and be-come members of better category with less negative influence on the company’s business performance.
2.3.3 Validation
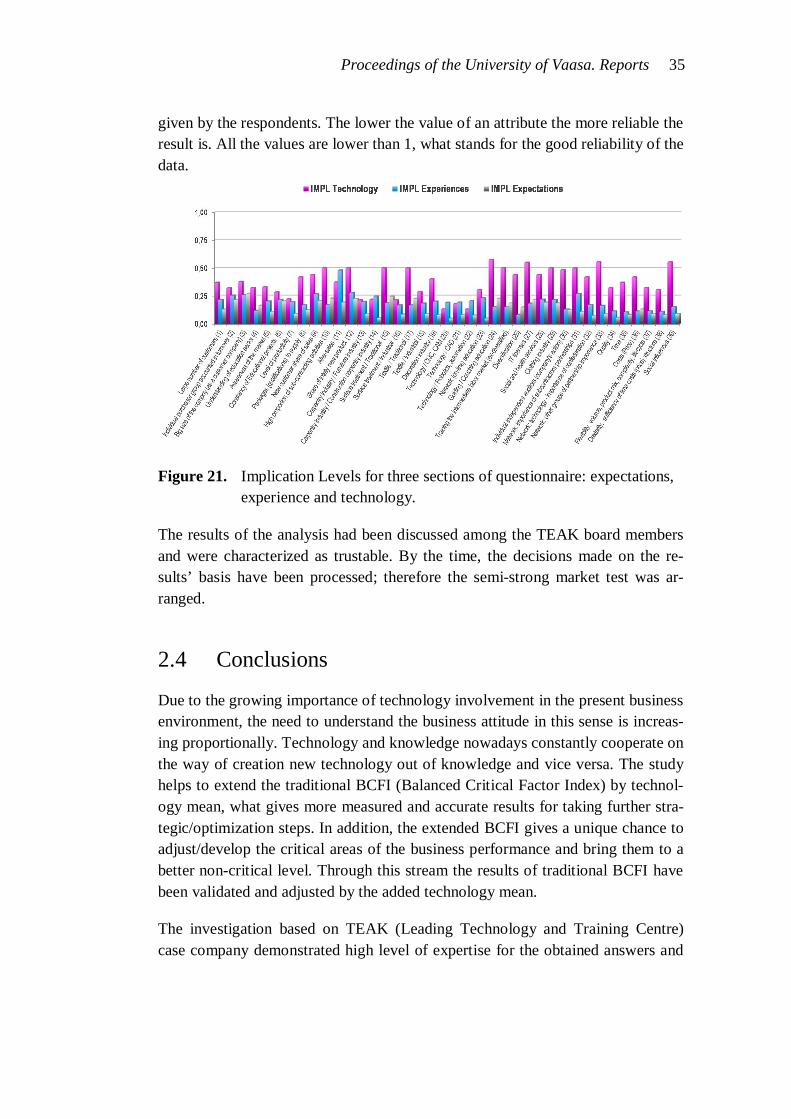
In any research validation of the results is the crucial point, which states for the correctness of judgements and takes the role of mile stone for further investiga-tion. The study refers to the qualitative one. The case company (TEAK) is repre-sented by the high qualified board members (seven participants), what says for the high reliability of their responses. Figure 21 shows the level of deviation be-tween the participants’ responses. In other words, it is the separated summaries of variability coefficients for Technology, Experiences and Expectations rankings
Proceedings of the University of Vaasa. Reports 35
given by the respondents. The lower the value of an attribute the more reliable the result is. All the values are lower than 1, what stands for the good reliability of the data.
Figure 21. Implication Levels for three sections of questionnaire: expectations, experience and technology.
The results of the analysis had been discussed among the TEAK board members and were characterized as trustable. By the time, the decisions made on the re-sults’ basis have been processed; therefore the semi-strong market test was ar-ranged.
2.4 Conclusions
Due to the growing importance of technology involvement in the present business environment, the need to understand the business attitude in this sense is increas-ing proportionally. Technology and knowledge nowadays constantly cooperate on the way of creation new technology out of knowledge and vice versa. The study helps to extend the traditional BCFI (Balanced Critical Factor Index) by technol-ogy mean, what gives more measured and accurate results for taking further stra-tegic/optimization steps. In addition, the extended BCFI gives a unique chance to adjust/develop the critical areas of the business performance and bring them to a better non-critical level. Through this stream the results of traditional BCFI have been validated and adjusted by the added technology mean.
The investigation based on TEAK (Leading Technology and Training Centre) case company demonstrated high level of expertise for the obtained answers and

36 Proceedings of the University of Vaasa. Reports
good level of overall reliability. The case study is at the semi-strong market test stage as the decisions made on the results’ basis have been already applied.
The method is at the very early stage of development, therefore has been tested only with one participating company. It can be called as the main limitation at the moment. Further development and validation is required for getting stronger data about trends and correlations existing in the proposed BCFI extension.

Proceedings of the University of Vaasa. Reports 37
3 RISK MANAGEMENT IN SERVICE VALUE NETWORKS
3.1 Introduction
Developing business through service excellence is one way of surviving the com-petition while improving customer service and loyalty. In service business man-agement it is important to take risks into careful consideration e.g. during the transition process of organisations from a manufacturer to a service provider (Ojanen et al. 2008a) as moving towards service oriented business models intro-duces new risks which must be taken into account in the development of new ser-vices.
Value for customers is created at the network level, in which each network part-ner contributes incremental value to the overall offering. The structure and dy-namics of the value network and customer expectations influence the complexity of service delivery. This needs to be taken into account when considering man-agement of risks. Network actors contribute to the value creation process by fo-cusing on their core competence and cooperating with other network actors, such as suppliers, partners, allies, and customers, through various value constellations (Basole & Rouse 2008).
Managing risks is essential part of service business management. Risks related to e.g. quality of services, service cost-effectiveness, available resources for service development, and service contracts need to be taken into account. Moreover, there is a need to consider risks in customer collaboration, information exchange be-tween service value network partners and capabilities related for collaboration and communication. Internal risks are related to capabilities required by the high-intensity customer relationships of the new services. External risks include e.g. how customers are willing to share critical information needed for successful de-livery of new services (Gebauer, Fleisch & Friedli 2005).
Risk management is about improving business performance via systematic identi-fication, appraisal and management of business related risk. The traditional em-phasis of risk management has been on protecting the system, and its users, from the failures in the system. ISO/EIC Guide 73 defines risk as the “effect of uncer-tainty on objectives”. Effect is a deviation from the expected and can be positive or negative (ISO/IEC Guide 73 2009), and therefore improving performance co-vers also exploiting opportunities or favourable possibilities, upside risks, in addi-tion to downside. When considering the performance of a system in its larger

38 Proceedings of the University of Vaasa. Reports
commercial and political environment, uncertainty may provide opportunities as well as threats. As competition is more and more happening at the network level, it is challenging to identify threats and opportunities that may rise, and act on them.
In order to manage risks systematically, organizations are typically applying for-mal risk management methods and procedures. In addition to formal practices, organizations need to increase flexibility to absorb the unexpected and to be pre-pared for the uncertainties that cannot be assessed beforehand (Williamson 2007; Power 2009). The understanding of risk and uncertainty management has mainly been based on linear models that describe how various risk events are present in considered business activities. These models provide valuable information as to why firms should manage risks. They provide, however, less information about how firms turn the incentives to manage risk into actual decisions on the choice of risk management measures, how risks change and how the risk management strat-egies evolve over time (Lanne 2008).
As an important part of business continuity management, risk management is a way to identify and manage the various sources of uncertainties which can give rise to threats that can at worst end in failures but also to opportunities and suc-cess. Factors that positively affect development of new service business are criti-cal if an organisation wants to succeed, but if they are ignored or fallen down on, there is a risk that the service development may fail. Risks can be considered as “the other side of the coin” to the success factors (Lanne & Ojanen 2009).
3.2 Risk management in value networks
New networked business models challenge the traditional theory of the firm. The new business models are based on complicated inter-organisational systems for innovation, production, marketing and connecting with customers and investors. On the supply side, outsourcing, and the Internet have led to new connections that provide variety of services. On the demand side, open architectures and empow-ered consumers are driving both innovation and customisation of existing prod-ucts and services and their marketing. This requires companies to view their prof-its and risks not in terms of what they control internally, but in terms of their rela-tional capabilities to the networks in which they are embedded (Kleindorfer & Wind 2009).
While networks present opportunities, they also raise a number of risks and chal-lenges. Accountability and transparency can be lost in the complex web of net-
Proceedings of the University of Vaasa. Reports 39
works. Business networks are increasingly complex and dynamically changing webs of relationships. Key drivers are increasing product and service complexity, e-business, outsourcing and globalisation (Harland, Brenchley & Walker 2003). New networks have provided considerable increases in access to resources and markets. At the same time this change has exposed companies and economies to new complexities and risks because of the increased interdependencies implied by the networks. These risks are the downside of the opportunities reflected by the new value networks (Kleindorfer & Wind 2009).
The current models and frameworks for enterprise risk management (ERM) em-phasise the need to embed risk management systems within business processes, and therefore the focus is usually concentrated on the individual organisation as the appropriate unit of analysis, bearing little or no relation to the company’s in-volvement in wider networks. It has been argued that the recent financial crisis is largely the result of a failure to represent and understand interconnectedness in this wider sense of embeddedness in networks (Power 2009). Lately however the focus has been shifting towards the extended organisation and network level. As companies are increasingly relying on different collaborative arrangements in their business models, they become also more dependent on other companies ca-pabilities and resources. This makes their situation more unpredictable regarding possible changes in the business environment (Hallikas & Varis 2009).
Networks increase interdependencies and this creates challenges for managing risks. This is especially apparent in areas such as security and enterprise risk management, where the actions of a single player can cause problems to everyone in the network (Kunreuther 2009). The networks have led to second-order and third-order effects that are absent from bilateral relationship. Networked enter-prises raise issues of group influence, cascading, contagion and interdependent risks that cannot be controlled through standard mechanisms (Kleindorfer & Wind 2009).
3.3 Risks and success factors in new service business development
Different risks and success factors are critical at the different stages of new ser-vice development process. Johnson et al. (2000) introduce a process cycle of new service development. In the development stage of a new service, new ideas are screened, and winning concepts are developed and tested for feasibility. The first steps of the new service development process require deep understanding of the customers’ behaviour and needs, production, and business processes (see e.g.

40 Proceedings of the University of Vaasa. Reports
Ojanen et al. 2008a). Concepts that pass the development hurdle are then consid-ered in the analysis stage to determine their potential as part of a profitable busi-ness venture. At this stage it is important to consider the value network structure and information flows. Successful concepts then move to the design phase where a new service product and process is created and field-tested with appropriate personnel training and marketing campaign. Finally, a proven new service is giv-en a full launch. The new service development process is driven by enablers: teams that are cross-functional, tools, and an organisation context that includes a culture of accepting innovation. (Johnson et al. 2000.) A service product consists of people, systems, and technology.
In service companies, the foundation for quick and effective service development lays on the strategic operation choices made regarding the use of teams, infor-mation technology and the process design of new service development (Froehle et al. 2000). In addition to these, success factors influencing new service develop-ment include e.g. management support and involvement of both managers and other employees, interaction with customers, skilful project leader, and formal new service development process that also has some elements of improvisation. Besides external communication, also managing internal communication among company’s personnel is important. (Edvardsson, Haglund & Mattson 1995; Edvardsson, Gustafsson & Enquist 2007; Johne & Storey 1998; Martin & Horne 1995.)
Especially the role of customers has been recognised as important, and typically the more successful new service developers have utilised efficiently information about the customer in idea generation, business evaluation and marketing plan preparation (Martin & Horne 1995). Understanding the customer is the key to commercial success, and therefore, when developing and launching new services, attention should be paid to the customers’ needs, expectations, quality percep-tions, and values. The service culture and strategy of a company should be cus-tomer-centric and in line with customers’ values and priorities. Also involving the customer in the actual development process is important. However, besides cus-tomers, company needs to monitor and understand market and future trends (Edvardsson, Gustafsson & Enquist 2007). Development of new services should be based on an intimate knowledge of customer needs, problems and operating systems. In addition, involvement of expert front line personnel in the process, and implementing a formal and planned launch programme for the new service are critical for the success of new services (De Brentani 2001).
In addition to the importance of customer orientation in the service business de-velopment, there are also great challenges and risks in the collaboration between

Proceedings of the University of Vaasa. Reports 41
customer and supplier as well as in the activities of service network (Ojanen 2008b). Possible obstacles may relate to lack of information about specifications, goals and markets, uncertainty about the sponsor, difficulties in dividing respon-sibilities and resource allocation, and a lack of systematic documentation, report-ing and feedback (Edvardsson, Haglund & Mattson 1995). Besides these obsta-cles and challenges, also the aforementioned success factors need to be consid-ered in order to be better prepared to make use of the opportunities and on the other hand to avoid the pitfalls and risks when developing new service business.
Based on the literature review new service design is a process that needs to be formalised and carefully considered also from the risk management perspective. When identifying and assessing threats and opportunities related to the new ser-vice design the following topics are important to take into account:
– Strategic choices regarding teams, process design and information tech-nology
– Management support and involvement – Resource allocation – Customer interaction – Service value network structure and relationships – Market and business environment
3.4 Case study results
The analysis of the case study data showed that the companies had set targets for developing new product offering and related new services. It was, however, not clear how these targets could be reached. The market potential had been analysed but there was a need to get more detailed information about the market potential of the service business and international market opportunities particularly.
The study of the threats and opportunities related to new services revealed that there were significant external and internal factors that the company needs to take into account when developing new services. Threats were related to reaching new customers, collaboration with new partners, failures to develop new product and service offering, lack of required resources and competence, and new competitors. The new services can provide opportunities in expanding the customer base, in-creasing revenue, and forming new profitable partnerships and long-term relation-ships with customers.
The case companies’ service value network risks were related to suppliers and supplier networks, clients, stakeholders, and competitors. Risks related to suppli-

42 Proceedings of the University of Vaasa. Reports
ers included failures in selection of partners, lack of competence, lack of re-sources, lack of communication and poor financial status. Supplier network relat-ed risks were similar to the supplier related risks but these were more difficult to control as there usually was no direct contact to the suppliers’ suppliers. Stake-holder related risks were related to e.g. authorities’ requirements, delays in vari-ous permit procedures and communication problems. Clients’ requirements and understanding of the client needs were the common risks concerning clients. The risk factors related to the value network are detailed in . The risk factors can be seen to include both threats and opportunities.
Table 5. Risk factors related to the value network of the case companies.
Value network actor Risk factors Company’s internal organisation Competence
Resources Coordination of network activities Communication
Supplier Selection of partners Competence and resources Communication Financial status
Supplier’s network Scheduling of activities Visibility to the suppliers’ suppliers Communication
Stakeholders Requirements Permit procedures Communication
Clients Understanding of client needs Communication
The results of the case study identified the following key challenges related to managing risks in the development of new service business:
– Allocation of resources for the development of new service business. – Networking and forming partnerships required for delivering new ser-
vices. – Designing the new service business offering. – Development of new technologies and related services concurrently. – Setting of clear objectives for the development of new services. – Following changes in the operational environment.
Based on the results of the case study, the following key steps of managing risks related to new service business development were identified: 1) analysis of mar-

Proceedings of the University of Vaasa. Reports 43
ket potential of the new services, 2) analysis of risks related to internal resources and capabilities available for the service development, 3) analysis of external risk factors affecting the business environment, 4) identification of the key players and their role and related risks in service business network, and 5) development of measures that mitigate threats and utilising the opportunities related to new ser-vice business. When the services have been launched and are on the market it is important to monitor the development of risks. Risk monitoring needs to cover the value network related risk factors.
3.5 Conclusions
The case study results indicate that service business changes business and risk environment forcing organizations to identify new risks and adapt their thinking about risks and the ways of managing risks. The results from the case study show that it is important to explore both organisation’s internal and external environ-ment and their future development when analysing new services and related threats and opportunities. Risk assessment and management needs to cover the whole service business value network.
Risks related to value networks identified in this study are related to coordination, control and communication of the networks. Based on this study a framework for integrating risk management in service value networks can be proposed. The framework includes five main phases: market potential analysis, internal re-sources and capability analysis, external business environment analysis, value network risk analysis and development of risk management measures. In each of these phases risks should be identified, their significance assessed and risk man-agement measures designed and implemented. In addition, risk monitoring needs to be organised to cover the risk factors in value networks.

44 Proceedings of the University of Vaasa. Reports
4 ASSET-SPECIFIC SERVICE DEVELOPMENT
4.1 Introduction
By systematic collection and processing of data from asset use and locations, the service providers may aim to create more active and continuous relationship to customers so that information would be distributed regularly and customers would experience feeling of a better service. It is important that customers and providers share an understanding of the benefits of the services, which for in-stance can be analysed based on availability rates that could be achieved in certain locations with the service offering considered. By representing the benefits and potential savings through life cycle costs, among others, to customer, customer may become more committed to the company and the collaboration may develop towards a partnership.
Customer needs related to services may vary greatly among customers, depending on customers’ strategic, production environment and business environment. While productising service offerings, the company still often wants to preserve flexibility and the possibility to tailor the contents of the service offering. Devel-opment process proposed in this section proceeds from understanding the service needs at a general level to more asset specific information, and finally to customer specific service planning that considers differing needs between customers. Thor-ough understanding of the general, and asset and customer specific needs allows the company to offer right kind of services to its customers throughout the prod-uct life cycle. The explicated service concept should cover the organising idea, the customer’s service experience, and service outcome for the customer (John-ston & Clark 2008).
While planning the collaborative relationship, the service provider and customer need to communicate and agree on the objectives related to the service deliveries and at the practical level on the maintenance plan. While the planning process should support collection of adequate information of factors that affect the re-quirements for the services and also the costs and assumed value of the services, the communication during the operational period may be dominated by the im-plementation of the services (actions against possible failures and reaction to sur-rounding environment, etc.).
While development of services also needs to focus on economies of scale, productization of services and the avoidance of strategic drifting, service provid-ers are simultaneously aware of the importance of the need for customer specific

Proceedings of the University of Vaasa. Reports 45
implementations. Thus, we conclude that it is necessary to focus on the service providers’ capability to react to varying customer needs.
4.2 Outlining the process of asset-specific maintenance service development
When defining asset-specific services, both business and operational perspective relating to customer’s production activities and environment need to be consid-ered. Figure 22 proposes how customer-oriented service concept, asset-specific data and maintenance task and spare parts service planning all contribute to the asset-specific service content.
Figure 22. Phases related to developing customer-specific maintenance ser-vices.
Firstly, the company needs to have understanding about the service concept and its key elements. Business models (e.g. proposed by Osterwalder 2010) can be applied for the presentation of the key elements related to the services. Secondly, data that addresses working environment, such as failure data combined with in-formation on the prevailing conditions in the location, increase the asset-specific understanding. Having more information and data about failures and prevailing conditions and their effects not only gives a possibility to develop better products. Understanding the effects of environmental factors on the service requirements is also very important. To sum up, different maintenance environments affect how the maintenance operations are shaping up.
Asset-specificservice
Customer-orientedservice concept
Asset-specific data
Plans for maintenance tasks
and spare partsservice
Defining customer value
Data collection regarding working environment•Failure data•Prevailing conditions•…
Planning asset-specific maintenance tasks etc. measures
Defining the key elements of service
Business model
Considering customers business-specific features in service offering
Information from component suppliers•Service recommendations•….
Customer-specific pricing
Asset-specific data collection•Methods of production•Use of devices•….
DESCRIBING BUSINESSDESCRIBING CUSTOMER’S PRODUCTION
ACTIVITIES AND ENVIRONMENT
Defining the influence of environmental conditions
Defining service needs according to conditions
Data collection for defining service concept

46 Proceedings of the University of Vaasa. Reports
The baseline for the services or service offering can be designed based on the technical knowledge and understanding of the customer basis in general. Various methods are available for exploiting the technical knowledge in the organisation and for transforming this into applicable knowledge in, for instance, the mainte-nance programme development. These methods include reliability centred maintenance (RCM), business centred maintenance (BCM), value-driven mainte-nance planning (VDMP) and various individual risk management approaches. We depict the process of further development of the services for the individual needs related to assets (see Figure 22 for the basic principle), as follows.
– Gathering of the initial data: Gathering of the initial data includes actions taken to get together sufficient amount of data on the failures of the con-sidered equipment and the operational conditions. The extent of the initial data defines how well in practice the environment can be taken into ac-count in the maintenance service offering. The initial failure data should include as detailed descriptions of the failures as possible. This makes it possible to use the data more efficiently when making the decisions on maintenance. Existing classification of, for instance, the failure modes and mechanisms helps in the analysis of the data and in finding the proper maintenance actions and service content for the needs. When possible, the failure data should be pre-analysed and prepared so that early failures and a selection of irrelevant failure types are excluded.
– Gathering of knowledge regarding customers’ business processes: Devel-opment of the customer specific service offering should be based on not only the technical and environmental data but complemented with suffi-cient amount of information on the customers’ businesses. Generation of the value proposition of the services, for instance, can be supported by in-formation on how various decisions, approaches, methods, actions and services can have effects on the customer’s business.
– Analysis of data: The data analysis, performed as a part of the process in Figure 22, can be based on the principles presented in that section. The phase results in a classification: the different classes have their specific failure behaviour relating to the environmental conditions (depending on the characteristics of the production environment, for instance humidity, temperature).
– Identification of the effects of customer’s specific characteristics on maintenance objectives: The specific characteristics of customer’s busi-ness have effects on the design of maintenance and carrying out the tasks.

Proceedings of the University of Vaasa. Reports 47
These characteristics include the value of the production, utilization rate, time windows allowed for maintenance, etc.
– Development of maintenance: Gathering the new failure, environment and business knowledge is meant to support the development of the service of-fering – the maintenance tasks, when addressing the offering at the practi-cal level. The maintenance service offering at the practical level is a com-bination of maintenance tasks carried out based on a careful selection. The selection of appropriate and cost-efficient maintenance tasks for the target can be based on a selection of systematic methods, such as reliability cen-tred maintenance (RCM).
– Customer value assessment and tailoring of the customer/target specific service offering: In order to be on a profitable basis, service offering needs to meet the customer needs and create value in customers’ processes. Since the effects of services on customers’ business are not always self-evident, analysis of customer value of the services is found important. The added value assessment is a phase where one needs to analyse how the customer’s cost elements are affected by the services considered. For in-stance, a cost-based Failure, Modes, Effects and Criticality Analysis (FMECA) shows the failures in economic terms and together with the analysis of customers’ operational costs, the resulted information can be utilized as a basis for the value calculations. Thus, the analysis of value fi-nally shows how much money the customer may save by consuming the services considered.
Furthermore, the maintenance planning phase can be divided into sub phases, as presented in Figure 23. We propose that the customer specific maintenance plan-ning is a combination of once-made tasks and customer specific recurring tasks. The core of the customer/asset specific assessment is the criticality evaluation based on the initial failure modes, effects and criticality analysis. Thus, the initial analysis is updated at least regarding the probability of the different failure modes. The update is needed because of, for instance, the variation in environ-mental conditions as well as other factors that affect the probability of failures (how and how much the equipment is used, age of the equipment etc.).

48 Proceedings of the University of Vaasa. Reports
Figure 23. RCM-based development of an asset specific initial maintenance programme.
4.3 Reliability Centred Maintenance (RCM)
IEC 60300-3-11 presents the concepts of initial and in-service maintenance pro-grammes, where the idea is in the development of the maintenance programme based on the experiences gathered in use. Herein, we present a high-level frame-work for composing the initial maintenance programme, based on the selected items of asset and location specific information.
Thus, in Figure 23, the key elements of Reliability Centred Maintenance (RCM) are integrated with asset and location specific elements and information. In the following sections, we discuss the RCM methodology, the core of our proposal, a bit further.
4.3.1 RCM as a method in the service development process
Reliability-centred maintenance (RCM) is a systematic process that aims to define a cost-efficient maintenance programme by selecting applicable maintenance tasks against the fault modes and failure mechanisms identified during the pro-cess. There is a technical standard IEC 60300-3-11 (IEC 60300-3-11) that intro-duces this approach (see Figure 24). RCM was initially developed for the com-mercial aviation industry in the late 1960s. It is now a proven and accepted meth-

Proceedings of the University of Vaasa. Reports 49
odology used in a wide range of industries. The final objective of using RCM approach is an overall safety, availability and economy of operation.
Figure 24. Concept of on-going maintenance programme according to IEC 60300-3-11.
RCM focuses on the preservation of system function. RCM process includes e.g. the identification of specific failure modes to define loss of function or functional failure and the prioritisation of the importance of the failure modes. The latter is done because all functions or functional failures are not equal. In RCM process effective and applicable preventive maintenance tasks for the appropriate failure modes are identified. Effective means that among competing candidates the se-lected preventive maintenance task is the most cost-effective option. Applicable means that the task will prevent, mitigate, detect the onset of failure mode or dis-cover failure mode.
The development of an RCM programme is based on the identification of func-tionally significant items (FSIs) and identification of applicable and effective pre-ventive maintenance tasks against the known failure modes and mechanisms (see further details on FMEA in the next sub-section). The selection of maintenance tasks is carried out by using decision tree logic. The possible preventive mainte-nance task types can be (a) condition-based, like periodic functional testing, peri-odic inspection, condition monitoring or operation supervision, or (b) predeter-mined maintenance, like periodic restoration, periodic servicing or modification
Actual maintenance dataActual operational data
Actual failure data
New technologyNew materials
New maintenance techniques and tools
Initial maintenance programme
On-going maintenance programme
Task developmentTask frequency (RCM)
MaintenanceFailure data
Maintenance methodMaintenance tools
Training plan
SpecificationFunction
Operating conditionEnvironment condition
Reliability target
Analysis of maintenance planIdentifying FSIs
Before operationAfter operation
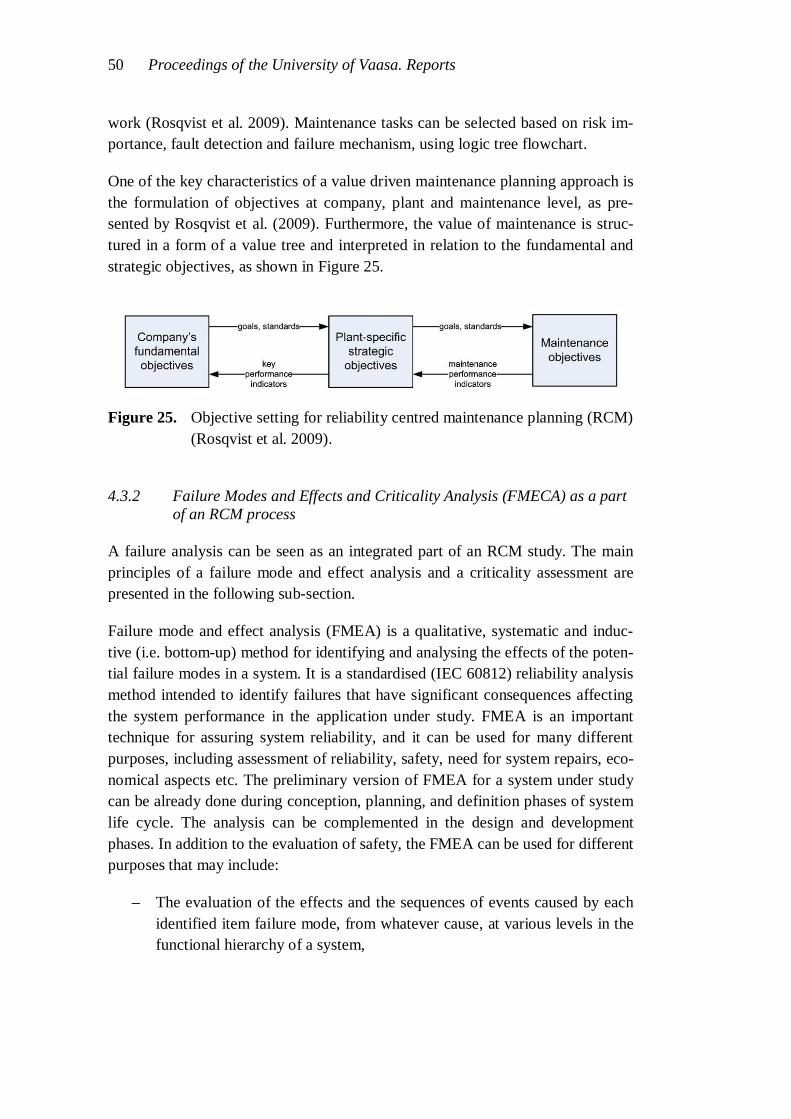
50 Proceedings of the University of Vaasa. Reports
work (Rosqvist et al. 2009). Maintenance tasks can be selected based on risk im-portance, fault detection and failure mechanism, using logic tree flowchart.
One of the key characteristics of a value driven maintenance planning approach is the formulation of objectives at company, plant and maintenance level, as pre-sented by Rosqvist et al. (2009). Furthermore, the value of maintenance is struc-tured in a form of a value tree and interpreted in relation to the fundamental and strategic objectives, as shown in Figure 25.
Figure 25. Objective setting for reliability centred maintenance planning (RCM) (Rosqvist et al. 2009).
4.3.2 Failure Modes and Effects and Criticality Analysis (FMECA) as a part of an RCM process
A failure analysis can be seen as an integrated part of an RCM study. The main principles of a failure mode and effect analysis and a criticality assessment are presented in the following sub-section.
Failure mode and effect analysis (FMEA) is a qualitative, systematic and induc-tive (i.e. bottom-up) method for identifying and analysing the effects of the poten-tial failure modes in a system. It is a standardised (IEC 60812) reliability analysis method intended to identify failures that have significant consequences affecting the system performance in the application under study. FMEA is an important technique for assuring system reliability, and it can be used for many different purposes, including assessment of reliability, safety, need for system repairs, eco-nomical aspects etc. The preliminary version of FMEA for a system under study can be already done during conception, planning, and definition phases of system life cycle. The analysis can be complemented in the design and development phases. In addition to the evaluation of safety, the FMEA can be used for different purposes that may include:
– The evaluation of the effects and the sequences of events caused by each identified item failure mode, from whatever cause, at various levels in the functional hierarchy of a system,

Proceedings of the University of Vaasa. Reports 51
– Determination of the significance or criticality of each failure mode,
– Classification of identified failure modes according to different kind of factors like the detection of failures, diagnosability, testability, item re-placeability, compensating and operating provisions (repair, maintenance and logistics, etc.) and any other relevant characteristics.
FMEA is a technique for design review support and for assurance and assessment, which should be put into use from the very first steps of system and subsystem design. FMEA is appropriate to all levels of system design. Special training of personnel performing FMEA is required, and they must have the close collabora-tion of systems engineers and designers. The FMEA must be updated as the pro-ject progresses and as designs are modified. By the end of the project, FMEA is used to check the project design and may be essential for demonstration of con-formity of a designed system to required standards, regulations, and user's re-quirements (IEC 60812).
The FMEA can be documented using a table that is specially designed for a cer-tain analysis. Very often FMEA analysis document includes at least the following columns: item number, part name, failure mode, failure cause, failure effect, fail-ure detection, remarks (including e.g. notes in which conditions the failure mode can cause a danger). If FMECA (Fault Modes, Effects and Criticality Analysis, which is an extension of FMEA) is carried out, for example the severity of failure and the probability of a failure mode are also estimated and documented. In an FMECA each identified fault mode can be ranked, for example, according to the combined influence of its probability of occurrence and the severity of its conse-quences. The quantification of both the criticality and the probability of failure can be used as an aid to decision-making on the possible resulting corrective ac-tions and their priorities. IEC 60812 presents an example for the failure effects’ criticality scale. A criticality grid can also be used to illustrate the relation be-tween the severity and probability of failure modes.
We conclude that the lack of profound knowledge about the specific requirements of the operation environment and about the customer is among the challenges of developing value-adding industrial services. The framework and methods pre-sented in this section offer possibilities for systematic consideration of mainte-nance services based on customer specific needs. While the service providers have increased their capabilities in the creation of customer centric maintenance service offerings, we further identify following development targets for the fu-ture: more efficient utilisation of the gathered data and practical analysis ap-proaches, new forms of collaboration with the end customer from the service per-spective and efficient exchange of knowledge.

52 Proceedings of the University of Vaasa. Reports
5 INTEGRATION OF OPERATIONS STRATEGY INTO DYNAMIC SENSE & RESPONSE RESOURCE ALLOCATIONS BY TECHNOLOGY RANKINGS
5.1 Introduction
This research aims at further developing of the existing strategic decision-making tool – Critical Factor Index (CFI) (Ranta & Takala 2007). The key target of the research is creation of a method for the strategy type detection through utilization of CFI analysis, to be more exact, its better developed form - BCFI (Balanced Critical Factor Index). The further validation of the method is to be organized with the case companies.
It is reasonable to state that the main limitation of the study is the little number of case companies analyzed with the method. Even though in the research four case companies took part, the validation field is not wide enough. Therefore further deeper validation with different types and sizes of participating companies is nec-essary.
5.2 Theory and research
5.2.1 Manufacturing Operations Strategy
The sub-chapter concentrates only on one classification of the companies’ behav-iour based on strategy type - Miles & Snow Topology (1978). Mintzberg explains strategy as a future plan of the organization, a pattern of its performance, a posi-tion or niche in certain markets, a perspective (out-in as well as in-out) to look its business and a ploy to overcome its competitors (Mintzberg 1998). Strategic choices of an organization in certain market conditions determine its particular stance for business operations conditions (Miles, 1978).
The typology divides the business strategies into four groups, Defenders, Pro-spectors, Analyzers and Reactors. Managers adopt one of these strategies at cer-tain time, to be consistence facing the external environment. The adaptive capa-bility broadens the opportunities that organizations can materialize (Daft, 2009).

Proceedings of the University of Vaasa. Reports 53
5.2.2 Sense & Respond Methodology
‘Sense & Response’ (Bradley & Nolan 1998) is more than a desired behaviour; it is a scalable managerial framework for the ability to adopt improvements. This means that it is relevant to any leader, regardless of the size of the unit. The exist-ing framework for most organizations is ‘Make & Sell’, which does not satisfy the highly competitive and constantly changing business environment any more (Ranta & Takala 2007). The main idea of ‘Sense & Response’ philosophy is the execution of the best practices in a dynamically changing environment by detect-ing changes (sensing) and reacting to them properly (responding), in other words, converting threats into opportunities, drawbacks into strengths. Sensing earlier and responding better to what is happening at a moment requires a fundamentally different decision-making supporting model, therefore Balanced Critical Factor Index (BCFI) methodology will be presented in the following part (Nadler & Ta-kala 2008).
5.2.3 Critical Factor Index / Balanced Critical Factor Index
“The CFI method is a measurement tool to indicate which attribute of a business process is critical and which is not, based on the experience and expectations of the company’s employees, customers or business partners”. (Ranta & Takala 2007)
In fact, the CFI method is a supporting tool for the strategic decision-making. In the current business environment fast adaptation and development can be consid-ered as one of the most important strengths. Balanced Critical Factor Index (BCFI), which presents the modified CFI, detects the most critical factors affect-ing the overall company’s performance much more properly and reliably. BCFI method provides the company with the crucial strategic data for the approach de-velopment and correction.
The easiest way for the required data collection is the qualitative questionnaire. The important characteristic is that the more respondents take place in the data collection, the more reliable the results are. After the data collection, the indexes from table 6 need to be calculated to finalize the analysis (Nadler & Takala 2008).

54 Proceedings of the University of Vaasa. Reports
Table 6. The list of formulas for BCFI calculation (Nadler & Takala 2008).
GAP INDEX (GI)
Determines the gap between the expectation and ex-perience for a particular attribute.
=( . . ) ,
DEIRECTION OF DEVELOPMENT INDEX (DDI)
Demonstrates the actual change of an attribute’s per-formance in time (positive or negative).
=( % %) ,
IMPORTANCE INDEX (II)
Determines the importance level of every evaluated attribute. =
PERFORMANCE INDEX (PI)
Reflects the degree of an attribute’s performance based on the actual experience of the respondents. =
STANDARD DEVIATION EXPECTATION INDEX (SD expc I)
Determines the level of deviation existing in the re-sponses regarding all the attributes’ expectations. = +
STANDARD DEVIATION EXPERIENCE INDEX (SD expr I)
Determines the level of deviation existing in the re-sponses regarding all the attributes’ experiences. = +
BALANCED CRITICAL FACTOR INDEX (BCFI)
The resulting index detects the most critical factors affecting the overall company’s performance. =
The results of BCFI calculations can be further presented in the graphical form that provides reader with the clearer representation of the criticality allocation among the attributes (Figure 26).

Proceedings of the University of Vaasa. Reports 55
Figure 26. Example of the final graphic based on BCFI calculations.
The above stated figure clearly demonstrates us which of the attributes are critical at the moment (marked by red colour), those which may become critical in the nearest future (marked by yellow colour) and ones that non-critical at the moment (marked by green colour).
5.3 RAL Model relation with BCFI
Originally the RAL Model (Takala 2007) is used to measure the success factors in logistics. The method has been successfully replicated for the manufacturing strategies as well as operational competitiveness of various organizations (Figure 27). RAL is abbreviated from Responsiveness, Agility and Leanness. An Organi-zation achieves the optimization of the RAL model components (Responsiveness, Agility, Leanness) by prioritizing between cost, quality, time and flexibility. Bal-ancing act between these four attributes reflects in the company strategy and can be tested by the mean of mathematical models proposed by Takala (2007).
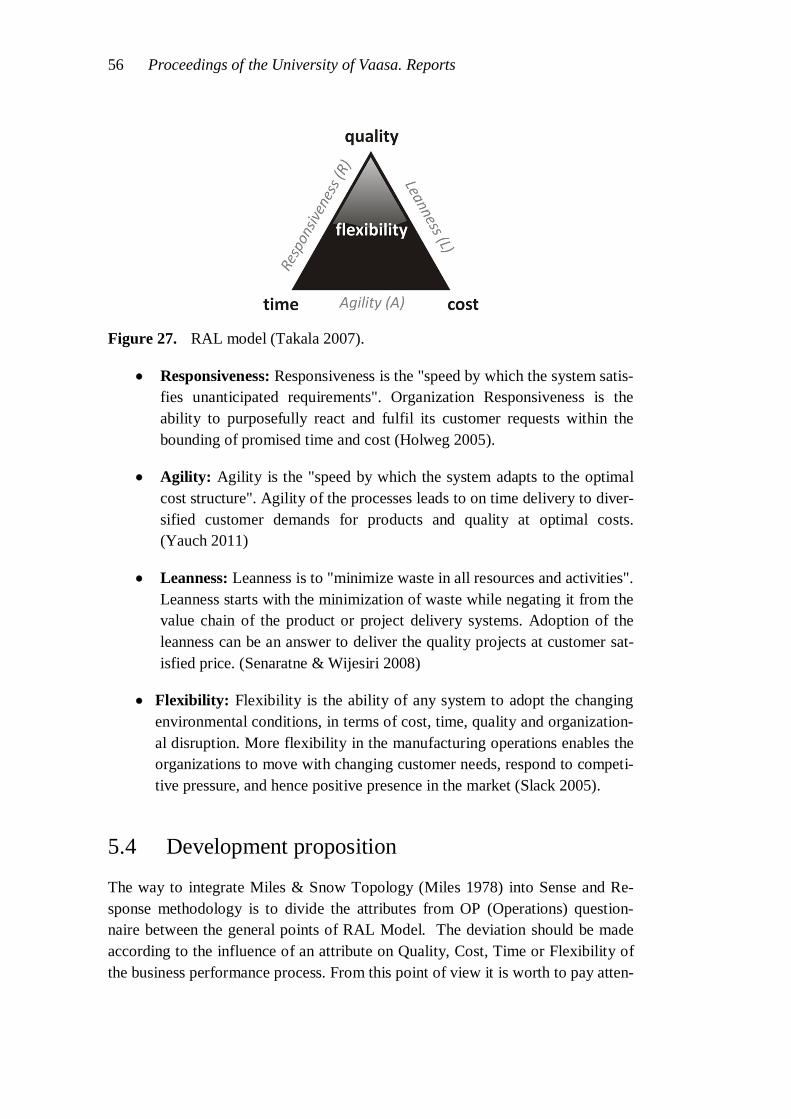
56 Proceedings of the University of Vaasa. Reports
Figure 27. RAL model (Takala 2007).
Responsiveness: Responsiveness is the "speed by which the system satis-fies unanticipated requirements". Organization Responsiveness is the ability to purposefully react and fulfil its customer requests within the bounding of promised time and cost (Holweg 2005).
Agility: Agility is the "speed by which the system adapts to the optimal cost structure". Agility of the processes leads to on time delivery to diver-sified customer demands for products and quality at optimal costs. (Yauch 2011)
Leanness: Leanness is to "minimize waste in all resources and activities". Leanness starts with the minimization of waste while negating it from the value chain of the product or project delivery systems. Adoption of the leanness can be an answer to deliver the quality projects at customer sat-isfied price. (Senaratne & Wijesiri 2008)
Flexibility: Flexibility is the ability of any system to adopt the changing environmental conditions, in terms of cost, time, quality and organization-al disruption. More flexibility in the manufacturing operations enables the organizations to move with changing customer needs, respond to competi-tive pressure, and hence positive presence in the market (Slack 2005).
5.4 Development proposition
The way to integrate Miles & Snow Topology (Miles 1978) into Sense and Re-sponse methodology is to divide the attributes from OP (Operations) question-naire between the general points of RAL Model. The deviation should be made according to the influence of an attribute on Quality, Cost, Time or Flexibility of the business performance process. From this point of view it is worth to pay atten-

Proceedings of the University of Vaasa. Reports 57
tion to the key idea of the Analytic Hierarchy Process (AHP), firstly developed by Saaty (1980). According to Saaty:
“To make a decision we need to know the problem, the need and purpose of the decision, the criteria of the decision, their sub-criteria, stakeholders and groups affected and the alternative actions to take.” (Saaty 2008)
All of these can successfully help to manage the company perfectly and place it at a top level in the market. Although the system is firstly described for mathematics and psychology, nowadays it is used to make decisions in government, health care, education, business, and industry. AHP implies the following relation of sub-criteria to their criteria (Quality, Cost, Time and Flexibility), what leads to better understanding of the basic elements of RAL Model Ttable 7).
Table 7. AHP Competitive Priorities (Saaty 2008).
Following the general idea of the above presented table the BCFI attributes gath-ered in OP (Operation) questionnaire can be divided among the RAL Model ele-ments in the similar manner (Table 8):
Goal
COMPETITIVE PRIORITIES OF MANUFACTURING STRATEGY
Crite
ria
QUALITY COST TIME FLEXIBILITY
Sub-
Crite
ria
Low Defect Rate
Product Performance
Reliability
Environmental Aspects
Certification
Low Cost
Value Added
Quality Costs
Activity Based Measurem
ent
Continuous Improvem
ent
Fast Delivery
On Agreed Tim
e
Right Amount
Right Quality
Dependable Promises
Design Adjustment
Volume Change
Mix Changes
Broad Product Line
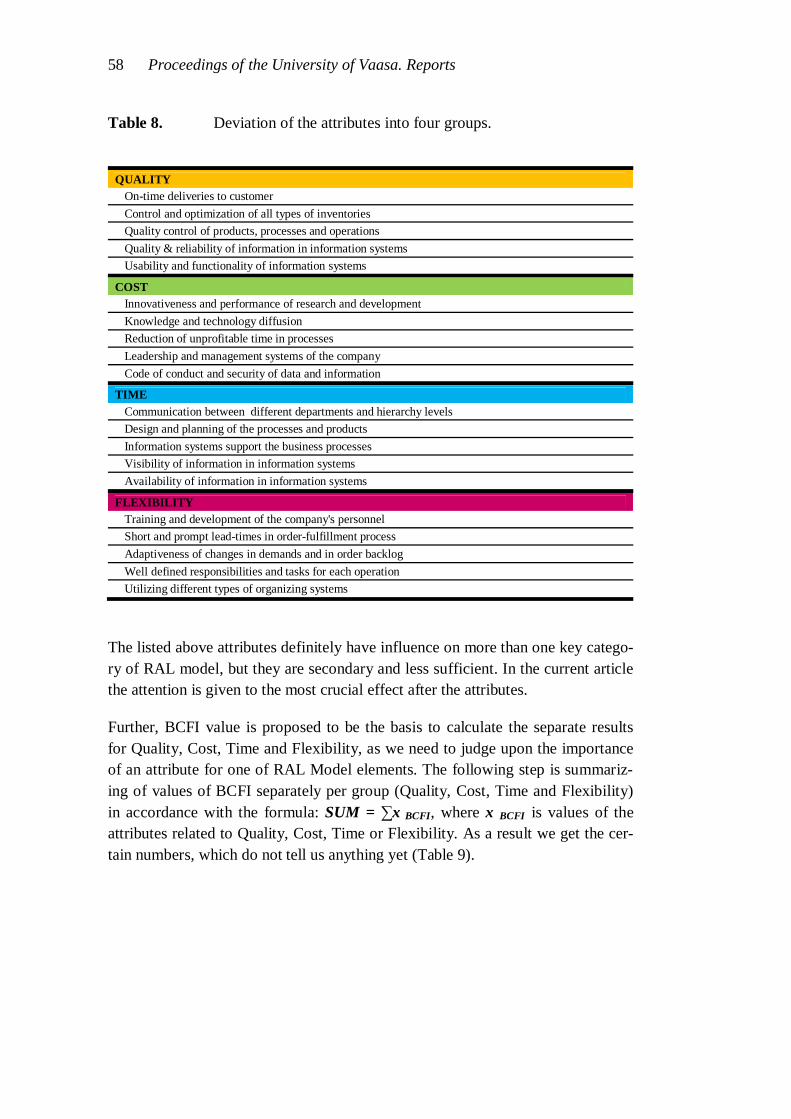
58 Proceedings of the University of Vaasa. Reports
Table 8. Deviation of the attributes into four groups.
QUALITY
On-time deliveries to customer Control and optimization of all types of inventories Quality control of products, processes and operations Quality & reliability of information in information systems Usability and functionality of information systems
COST Innovativeness and performance of research and development Knowledge and technology diffusion Reduction of unprofitable time in processes Leadership and management systems of the company Code of conduct and security of data and information
TIME Communication between different departments and hierarchy levels Design and planning of the processes and products Information systems support the business processes Visibility of information in information systems Availability of information in information systems
FLEXIBILITY Training and development of the company's personnel Short and prompt lead-times in order-fulfillment process Adaptiveness of changes in demands and in order backlog Well defined responsibilities and tasks for each operation Utilizing different types of organizing systems
The listed above attributes definitely have influence on more than one key catego-ry of RAL model, but they are secondary and less sufficient. In the current article the attention is given to the most crucial effect after the attributes.
Further, BCFI value is proposed to be the basis to calculate the separate results for Quality, Cost, Time and Flexibility, as we need to judge upon the importance of an attribute for one of RAL Model elements. The following step is summariz-ing of values of BCFI separately per group (Quality, Cost, Time and Flexibility) in accordance with the formula: SUM = x BCFI, where x BCFI is values of the attributes related to Quality, Cost, Time or Flexibility. As a result we get the cer-tain numbers, which do not tell us anything yet (Table 9).

Proceedings of the University of Vaasa. Reports 59
Table 9. Example of summarized BCFI values per group.
QUALITY COST TIME FLEXIBILITY 8,4500 5,9540 8,1700 9,9900
According to Miles & Snow topology (1978) the strategy type can be detected depending on fixed proportions between RAL Model elements. For example, Pro-spector Strategy has definite focus on quality; Defender Strategy aims at achiev-ing advantage in cost and Analyzer Strategy is balancing between quality, cost as well as time. The used formulas were formulas developed by Takala and de-scribed in the detailed way in the article: ‘Analytic calculation of global operative competitiveness’ (Takala, Kamdee, Hirvelä, Kyllonen, 2007). As a result, the biggest value will show the most preferred strategy type by the analyzed company (table 10). The table declares that by BCFI values utilization, the analyzed case company most probably prefers Defender strategy type.
Table 10. Example of the finalized calculation.
QUALITY COST TIME FLEXIBILITY 8,4500 5,9540 8,1700 9,9900
Prospector Analyzer Defender Reactor 0,6283 0,6190 0,7443 0,6863
The method users may also be interested in understanding the proportions among the main strategy types preferred; therefore, for better visual interpretation of the results the following graphic may be built (Figure 28).
Figure 28. Example of the final graphic based on the strategy type calculation.
The following figure (Figure 29) gives reader a better understanding of the criti-cality allocation among the attributes in reference to the key elements of RAL model. The practical sense of the figure is high, as it helps to understand which strategic behaviour may lead company to a better performance. In the current

60 Proceedings of the University of Vaasa. Reports
case, for example, the critical attributes refer to the following RAL categories: two of them are related to Time: ‘Communication between different departments and hierarchy levels’, ‘Information systems support the business processes’; two to Cost: ‘Knowledge and technology diffusion’ and one attribute – to Quality: ‘Usability and functionality of information systems’. The company should pay attention to the listed attributes as they have the most sufficient influence on its performance.
Figure 29. Visual representation of the attributes divided between the RAL model elements.
Based on Miles & Snow topology (1978), we can conclude that the company could achieve better performance if behaving like Analyzer (concentrating on Cost, Time and Quality).
5.5 Results
The method validation was arranged among four case companies, which wished not to show their names in publications. The information represented in the chap-ter is confidential; therefore the official names of the case companies will not ap-pear in the study. The names are replaced with abbreviations CC1, CC2, CC3 and CC4. Due to the limited size of the article, there are be presented only the results of the method application in the chapter. In other words, Results section provides readers with the empirical data and the practical experience gained during the research. Therefore a clear proof of the method reliability can be proposed. The

Proceedings of the University of Vaasa. Reports 61
validation involves comparison of the MSI results (preferable strategy detection) with the developed BCFI results.
Table 11 demonstrates the results of MSI and BCFI derived data per case compa-ny, the detected strategy type and how well the results by two methods match. In addition the validity and reliability grades were given based on the information about the participating respondents per company.
Table 11. Resulting table.
The most valuable for the current research conclusion is that both methods of analysis (MSI and BCFI) show similar results, therefore, tested with four case companies the proposed development of Balanced Critical Factor Index demon-strates high durability.
5.6 General findings
The study demonstrates the correlation between the theoretical aspects of RAL model and practical application of Balanced Critical Factor Index. The deviation of the OP questionnaire attributes correspondence to the general idea of RAL model and its key elements. Therefore the bridge between Manufacturing Opera-tions Strategy and BCFI methodology has been found. With the additional devel-opment the applicability of the method increases, as modification allows analyz-ers to detect the preferable by the company strategy type. In combination with BCFI potential, one might derive at least three additional benefits:
Case Company Name Strategy Type
Sequence of Dominance
Do the results match?
Cred
ibili
ty
Tran
sfer
abili
ty
Dep
enda
bilit
y
Conf
orm
abili
ty
Case company 1 (CC1) Manufacturing Strategy Index (MSI) Prospector P < R < D < A
YES 5 5 5 5 BCFI derived results Prospector P < R < D < A
Case company 2 (CC2) Manufacturing Strategy Index (MSI) Defender D < R < P < A
YES 5 3 4 5 BCFI derived results Defender D < R < P < A
Case company 3 (CC3) Manufacturing Strategy Index (MSI) Defender D < R < P < A
YES 5 5 4 5 BCFI derived results Defender D < R < P < A
Case company 4 (CC4) Manufacturing Strategy Index (MSI) Prospector P < R < D < A
YES 4 4 5 5 BCFI derived results Prospector P < R < D < A
Average Value 4,7 4,2 4,5 5,0

62 Proceedings of the University of Vaasa. Reports
1. Firstly, the analysis specifies all the critical attributes in relation to the ele-ments of RAL model (Quality, Cost, Time and Flexibility). Therefore it is possible to see which strategy type may bring a better business perfor-mance for the company. With such additional information the company’s management has a great opportunity to adjust the general strategy and take better strategic steps.
2. Secondly, in case the analysis is arranged among different departments in a company the top management has the possibility to check either the de-partments follow the general strategy or not; which strategy is preferable per department; which attributes in the departments need to be adjusted to achieve a better correspondence with the general company’s strategy.
3. Thirdly, with the adjusted questionnaire it becomes possible even to fore-cast the future strategy of the analyzed company supported by the future critical attributes affecting the business performance.
Balanced Critical Factor Index methodology returns to analyzer the set of critical for the company parameters describing the weaknesses and the strengths of the operating area. The proposed development brings to BCFI results the vector of development, which, saying in the language of Physics, transforms the static situ-ation into the kinetic (dynamic) one. The described above may be called as the main benefit out of the developed method application.
5.7 Conclusion
During the research the key focus was given to the stage of the strategy detection as an important step of the strategic analysis. The research has demonstrated a strong theoretical basis connecting together different approaches like Manufactur-ing Operations Strategy, RAL model and Sense & Respond methodology into the solid core, with its nucleus represented by Miles & Snow topology (1978).
Based on the found theoretical correlations the new method of the strategy type detection was proposed through utilization of Sense & Respond methodology and Balanced Critical Factor Index in particular. Therefore the key target may be con-sidered as fulfilled.
With the developed method the BCFI’s applicable scope has been increased in the direction of provision companies with more data for strategic decision-making. Therefore, BCFI gained possibility for being a broad based method with bigger quantity of potential users. In combination with the BCFI analysis the developed

Proceedings of the University of Vaasa. Reports 63
method provides a clear vector of development for the company, completed with the strategic information about the most affected edges of business performance.
The validation of the method was arranged among four case companies represent-ing separated industries and business areas. The number of respondents, overall and per case company, was sufficient for making strong statements. Nevertheless, the further deeper investigation of the method with different types and sizes of participating companies is necessary. The testing was organized in a form of comparison between the results of Manufacturing Strategy Index (MSI) and the results derived from Balanced Critical Factor Index (BCFI). The method demon-strated high accuracy, validity and reliability in detection of the preferable strate-gy type. The arranged comparison of MSI and BCFI results shows absolute match for every case company, moreover, the tested sequence of dominance (the ranking of preferred strategy type from the most to the less wanted) reflects similar re-sults. At the end of the research a set of practical advice for the method applica-tion was described, what represented the potential benefits out of it:
A possibility to see which strategy type may bring a better business per-formance for the company.
An additional opportunity to adjust the general strategy and take better strategic steps by operation with complementary information.
A possibility to check either business units follow the general strategy or not (in case of separate analysis per unit); which strategy is preferable per unit; which attributes in the units need to be adjusted to achieve a better correspondence with the general company’s strategy.
An extended form of questionnaire brings the potential for forecasting the future strategy of the analyzed company supported by the future critical attributes affecting the business performance.
In general, the proposed method has a wide potential and sufficient practical val-ue for strategic decision-making process and strategic analysis. With further in-vestigation and validation it might become multifunctional and applicable to dif-ferent forms of questionnaires and methods of research.

64 Proceedings of the University of Vaasa. Reports
6 IMPACTS FOR NEW KNOWLEDGE CREATIONS, LIMITATIONS, FURTHER STUDIES AND MANAGERIAL IMPLICATIONS
6.1 Experiences from the use of the methods during response
Seven manager-level respondents replied to a questionnaire concerning their ex-periences of RESPONSE project and tools used during the project. All of the re-spondents assessed that they have been actively involved in the project (satisfac-tory 14 %, good 71 % and excellent 14 %). The benefits of the project for compa-nies involved have been satisfactory (29 %) or good (71 %). According to re-spondents’ comments the most significant benefits have been strategic typing of companies and the development work as such instead of continuing in the old way. The development plans made during the project were considered to be feasi-ble, but the actual implementation of plans is still in progress in most of the cases. Being involved in the project has been beneficial for taking forward the develop-ment projects of the companies involved. Systematic analysis of company’s oper-ations has helped to find out the most important development needs of the com-pany. About half of the respondents think that the development work would have been done also without Response-project. The rest consider that it might not have been done or that it would have been done much later. The respondents consider that similar development projects should be done also later, e.g. because the oper-ations of a company need to be constantly improved and the companies get good examples of systematic development work. The question “how did the project correspond with your expectations?” aroused varying comments. Some respond-ents were satisfied with the project and though it was carried out well while some respondents though the process was difficult to understand and still a work in process. The respondents consider the tools (AHP-analysis, Sense & Respond questionnaires, interviews, roadmap, and network analysis) useful and feasible. The application of different tools during the project was sufficiently good, the respondents could use the tools also in the future, and they though the tools worked quite well together.
6.2 Sustainable operative housing by dynamic renting
Knowledge intensive business aims at constant modernization, development and innovation, therefore the whole market segment is quite unstable and barely pre-

Proceedings of the University of Vaasa. Reports 65
dictable. The bright representatives of the knowledge intensive business are hous-ing (retailing) companies, as they depend a lot on customers’ opinion, experience, and satisfaction; face various and unique requirements from the customers’ side. Customer satisfaction has crucial impact on the business, hence valuable. The loyalty of the customers increases with the satisfaction level what is beneficial for the company. A new method for dynamic resource allocations in the operative processes in housing, especially in the renting, where the customers move from one apartment to another one, has been proposed. Through the applied methodol-ogy we found out which areas of the companies’ business performance and re-sources (internal process flow) are critical and may become critical. Hence, it became possible to trace tendency which takes place internally and externally of, at least, two companies operating on the housing market of Finland. With more participants the method has a huge potential to predict the behavior of the whole Finnish housing market, what might be considered as the very strong tool of stra-tegic planning and decision-making. Another benefit is comparatively simple ap-plicability of the method to other market segments and industries. The investiga-tion has shown high level of expertise for the answers obtained and sufficient lev-el of the overall reliability. The case study is at the semi-strong and weak market test stages. Nevertheless, the method is at the very early stage of development, therefore has been tested only with two participating company. It can be called as the main limitation at the moment. Further development and validation is required for getting stronger data about trends and correlations existing in the proposed method.
6.3 Validation of sense and respond methodology through the prism of technology implementation
In general the methodology is the supporting tool for strategic decision-making which can be utilized in different types of organizations and segments of the mar-ket. Operative business performance based balanced critical factor index (BCFI) on its current stage of development looks into the problem from the side of knowledge existing in the company as the basis of resource allocation arrange-ment. The growing role of technology cannot be underestimated nowadays as it brings vast number of opportunities for business development, growth and strengthen of the competitive advantages. In the current century of the world wide spreading of information technology (IT) even the companies with conservative forms of operations relay on them. The technology has overcome the barrier when was only created by knowledge, but now vice versa, technology gained ability for the knowledge creation. In this sense, at least two points of view should be ap-plied by BCFI methodology – knowledge and technology. Figure 30 shows the

66 Proceedings of the University of Vaasa. Reports
variability by the separated summaries of variability coefficients for Technology, Experiences and Expectations rankings given by the respondents. The lower the value of an attribute the more reliable the result is. All the values are lower than 1, what stands for the good reliability of the data.
Figure 30. Implication Levels for three sections of questionnaire: expectations, experience and technology.
Technology and knowledge nowadays constantly cooperate on the way of crea-tion new technology out of knowledge and vice versa. The extended BCFI gives a unique chance to adjust/develop the critical areas of the business performance and bring them to a better non-critical level. Through this stream the results of tradi-tional BCFI have been validated and adjusted by the added technology mean. The case study is at the semi-strong market test stage as the decisions made on the results’ basis have been already applied. The method is at the very early stage of development, therefore has been tested only in a couple of case companies. Fur-ther development and validation is required for getting stronger data about trends and correlations existing in the proposed BCFI extension.
6.4 Detection of a company’s preferable strategy type by Sense & Respond methodology
The key focus was given to the stage of the strategy detection as an important step of the strategic analysis. The research has demonstrated a strong theoretical basis connecting together different approaches like Manufacturing Operations Strategy,

Proceedings of the University of Vaasa. Reports 67
RAL model and Sense & Respond methodology into the solid core, with its nu-cleus represented by Miles & Snow topology (1978). Based on the found theoret-ical correlations the new method of the strategy type detection was proposed through utilization of Sense & Respond methodology and operative business per-formance based Balanced Critical Factor Index (BCFI). The validation of the method was arranged among four case companies representing separated indus-tries and business areas. The further deeper investigation of the method with dif-ferent types and sizes of participating companies is necessary. The testing was organized in a form of comparison between the results of Manufacturing Strategy Index (MSI) and the results derived from Balanced Critical Factor Index (BCFI). The arranged comparison of MSI and BCFI results shows match for every case company. And, the tested sequence of dominance (the ranking of preferred strate-gy type from the most to the less wanted) reflects similar results. A set of practi-cal advice to apply the method was described and justified with some benefits as follows:
A possibility to see which strategy type may bring a better business per-formance for the company.
A possibility to check either business units follow the general strategy or not (in case of separate analysis per unit); which strategy is preferable per unit; which attributes in the units need to be adjusted to achieve a better correspondence with the general company’s strategy.
A huge potential for further studies and applications to forecast and verify reciprocally the future strategy by the future critical resources and vice versa for recognise and develop Sustainable Competitive Advantage (SCA).
The method proposed has a wide potential and sufficient practical value for stra-tegic decision-making process and strategic analysis.
6.5 Limitations and Further Studies
Organisational cultures and cultures within industrial branches are crucial when moving towards knowledge intensive service businesses from production orien-tated cultures quite typical in Finland. Basing on the dynamic decision making models developed, applied and quite extensively published as well from global comparative cases during RESPONSE for fast strategy implementations within knowledge intensive business cases we have collected quite many lessons learned. By transformational leadership we may ‘sense’ organizational cultures

68 Proceedings of the University of Vaasa. Reports
and cultures within industrial branches to recognize and cope with the contradic-tions that may appear between operations (manufacturing of service) strategies and transformational leadership (decision making) profiles. This obstacle may take place especially with strong cultures where e.g. professional identities tend to be barriers against staff communications and commitments during rapid changes.
In qualitative (deep) case studies the number of informants tends always to be quite limited. The methods proposed need to be validated in a bigger number of cases. And, the methods should also be triangulated by other methods like qualita-tive interviews and archival analyses and numerical input output data (e.g. basing on Data Envelopment Analyses, DEA) from other documents available in the case companies.
6.6 Conclusions
What might be the competitive operations and technology strategies in the global race for Finland when the world economy is growing especially in Asia (‘China Effect’)? This study is basing on Global Manufacturing Strategies created sepa-rate results basing on partly qualitative and partly quantitative case studies and surveys published before during 2007-11. These separate results should be inte-grated by the applicant’s international research network to help the Finnish com-panies operationalize their business potentials in the global race.

Proceedings of the University of Vaasa. Reports 69
ACKNOWLEDGEMENTS
The authors would like to express gratitude to Vaasa Engineering Oy, The Switch Oy, YH Länsi Oy, TVT Asunnot Oy and TEKES - the Finnish Funding Agency for Technology and Innovation and its SERVE Programme for funding this re-search.
70 Proceedings of the University of Vaasa. Reports
REFERENCES ARA The Housing Finance and Development Centre of Finland (2011). Housing Finance for All – Learning from the Finnish Model. [online] [Cited 25 May 2012] Available from World Wide Web: http://www.ara.fi/download.asp?contentid =20269&lan=en.
Asselin, A., Murray, G., Shirley, T. & Streich, P. (2002). Review of Finland’s Housing Policy. [Online] [Cited 25 May 2012] Available from World Wide Web: www.ymparisto.fi/download.asp?contentid=11758.
Basole, R.C. & Rouse, W.B. (2008). Complexity of service value networks: Con-ceptualization and empirical investigation. IBM Systems Journal 47:1, 53–70.
Bass, B.M. (1985). Leadership and Performance Beyond Expectations. New York: Free Press.
Bass, B.M. & Avolio, B.J. (1994). Improving Organizational Effectiveness through Transformational Leadership. USA: SAGE Publishing.
Bass, B.M. (1997). Does the transactional – Transformational leadership para-digm transcend organizational and national boundaries? American Psychologist, Vol. 52.
Bradley S. & Nolan, R. (1998). Sense and Respond. Capturing Value in the Net-work Era. Boston: Harvard Business School Press.
De Brentani, U. (2001). Innovative versus incremental new business services: Different keys for achieving success. The Journal of Product Innovation Man-agement 18:3, 169–187.
Brunn, S.D. & William, J.F. & Zeigler, D.J. (2003). World Reginal Urban Devel-opment Cities of the World (3rd ed.). Oxford: Rowman & Littlefield Publishers, Inc.
Daft R. L. (2009). Organization Theory and Design. Masson: Cengage Learning.
Department of Provincial Administration. 2010. Department of Provincial Ad-ministration. Retrieved 10.04.2010, from http://www.dopa.go.th/stat/y_stat.html.
Edvardsson, B., Haglund, L. & Mattson, J. (1995). Analysis, planning, improvisa-tion and control in the development of new services. International Journal of Ser-vice Industry Management 6:2, 24–35.
Edvardsson, B., Gustafsson, A. & Enquist, B. (2007). Success factors in new ser-vice development and value creation through services. In: Spath, D. & Fähnrich, K.-P. (eds) Advances in Service Innovations. Berlin Heidelberg: Springer. 165– 188.

Proceedings of the University of Vaasa. Reports 71
Eisenhardt, K.M. (1989). Building theories from case study research. Academy of Management Review, Vol. 14, No. 4, pp. 532–550.
Eisenhardt, K.M. (1991). Better stories and better constructs: the case for rigor and comparative logic. Academy of Management Review, Vol. 16, No. 3, pp. 620–627.
Feddes, A. & Dieleman, F.M. (1996). Investment in housing in ten northwest Eu-ropean countries. Tijdschrift voor Economische en Sociale Geografie, Vol. 87, pp. 73–79.
Forss, T. & Toshev, R. (2010). Implementing Customer Delight in Decision Sup-port System with Performance Indicators: Comparative Study of Finnish Housing Market. International Conference on Innovation & Management (ASIA-ICIM). December 4–5, Wuhan, China.
Forss, T., Takala J. & Golovko, I. (2012). Sustainable Operative HousinG By Dynamic Renting, TIIM 2012 Conference, Lublin, Poland 22–25.5.2012.
Forss, T. & Toshev, R. Comparison of Social Housing Policies in Finland, China and Thailand.
Froehle, C.M., Roth, A.V., Chase, R.B. & Voss, C.A. (2000). Antecedents of new service development effectiveness – An exploratory examination of strategic op-erations choices. Journal of Service Research 3:1, 3–17.
Gebauer, H., Fleisch, E. & Friedli, T. (2005). Overcoming the service paradox in manufacturing companies. European Management Journal 23:1, 14–26.
Glassman, J. (2010). “The provinces elect governments, Bangkok overthrows them": Urbanity, class and post-democracy in Thailand. Urban Studies 47:6, 1301–1323.
Grant, R.M. (2005). Contemporary Strategy Analysis. Malden: Blackwell Pub-lishing.
Hara, Y., Hiramatsu, A., Honda, R., Sekiyama, M., Matsuda, H. (2010). Mixed land-use planning on the periphery of large Asian cities: the case of Nonthaburi Province, Thailand. Sustain Sci 5, 237–248.
Harland, C., Brenchley, R. & Walker, H. (2003). Risk in supply networks. Jour-nal of Purchasing and Supply Management 9:2, 51–62.
Hallikas, J. & Varis, J. (2009). Risk management in value networks. In supply chain risk. International Series in Operations Research & Management Science 124:1, 35–52.
Holweg, M. (2005). The three dimensions of responsiveness. International Journal of Operations & Production Management 25:7, 603–622.
72 Proceedings of the University of Vaasa. Reports
Hossain, B. & Latif, E. (2009). Determinants of housing price volatility in Cana-da: A dynamic analysis. Applied Economics 41:27, 3521–3531.
ISO/IEC Guide 73. (2009). Risk management – Vocabulary. International Organi-sation for Standardisation.
IEC 60300-3-11. (1999). Dependability management – Part 3-11: Application guide – Reliability centred maintenance. 107 p.
IEC 60812. (2006). Analysis techniques for system reliability – Procedure for failure mode and effects analysis (FMEA). 93 p.
Johne, A. & Storey, C. (1998). New service development: a review of the litera-ture and annotated bibliography. European Journal of Marketing 32:3/4, 184– 251.
Johnson, S.P., Menor, L.J., Roth, A.V. & Chase, R.B. (2000). A critical evalua-tion of the new service development process: integrating service innovation and service design. In: Fitzsimmons, J.A. & Fitzsimmons, M.J. (eds), New Service Development – Creating Memorable Experiences. Thousand Oaks, CA: Sage Publications, pp. 1–32.
Johnston, R. & Clark, G. (2008). Service Operations Management – Improving Service Delivery. 3rd ed. Harlow, England: Prentice Hall. 533 p.
Kasanen, E., Lukka, K. & Siitonen, A. (1991). Constructive research approach in business science. Liiketaloudellinen Aikakauskirja 40:3, 301–327.
Kasanen E., Lukka K., Siitonen A. (1993). The Constructive Approach in Man-agement Accounting. Journal of Management Accounting Research 5, 243–264.
Kleindorfer, P.R. & Wind, Y. (2009). The Network Imperative: Community or Contagion? In: Kleindorfer, P.R., Wind, Y. & Gunther, R. The Network Chal-lenge: Strategy, Profit and Risk in an Interlinked World. Wharton School Pub-lishing, pp. 3–24.
Kunreuther, H. (2009). The Weakest Link: Risk Management Strategies for Deal-ing with Interdependencies. In: Kleindorfer, P.R., Wind, Y. & Gunther, R. The Network Challenge. Strategy, Profit and Risk in an Interlinked World. Wharton School Publishing, pp. 383-398.
Lanne, M. (2008). The role of risk management in industrial service business. In: Vähä, P., Salkari, I., Alahuhta, P. & Leviäkangas, P. (eds), VTT Symposium 253. Espoo: VTT. pp. 63–72.

Proceedings of the University of Vaasa. Reports 73
Lanne, M. & Ojanen, V. (2009). Teollisen palveluliiketoiminnan menestystekijät ja yhteistyösuhteen hallinta – Fleet asset management – hankkeen työraportti 1. VTT Working Papers 127. Espoo: VTT. 63 p.
Li, Zhang (2002). Development and Contractions of Wuhan’s Public Housing System. Department of real estate, National University of Singapore.
Lin, J. & Lind, H. (2011). The Development of Affordable Housing – A Case Study in Guanzhou City, China, Dept of Real estate and Construction Manage-ment, KTH Stockholm.
Liu, Y., Takala, J. & Si, S. (2009). Crisis Management of Chinese State-Owned Manufacturing Enterprises in Global Context. Proceedings of Management Inter-national Conference – MIC 2009. Sousse.
Martin, C.R. & Horne, D.A. (1995). Level of success inputs for service innova-tions in the same firm. International Journal of Service Industry Management 6:4, 40–56.
Miles R. E. (1978). Organizational Strategy, Structure, and Process. New York: McGraw-Hill.
Mintzberg H. (1998). Strategy Safari: a Guided Tour through the Wilds of Strate-gic Management. New York: Free Press.
Nadler, D. & Takala, J. (2008). The Development of the Critical Factor Index Method. Vaasa: University of Vaasa, Faculty of Technology, Department of Pro-duction.
de Neufville, R. (2004). Uncertainty Management for Engineering Systems Plan-ning and Design. MIT Engineering Systems Monograph. 18 p.
Nissinen, V. (2001). Military Leadership. A Critical Constructivist Approach to Conceptualizing, Modeling and Measuring Military Leadership in The Finnish Defence Forces. Helsingin yliopiston väitöskirja. Maanpuolustuskorkeakoulun johtamisen laitoksen julkaisusarjan tutkimuksia n: 20. Helsinki: Edita.
Nissinen, V. (2004). Deep Leadership. Second print from 2006. Hämeenlinna, Finland: Talentum.
Ojanen, V., Lanne, M., Reunanen, M., Kortelainen, H. & Kässi, T. (2008a). New Service Development: Success Factors from the Viewpoint of Fleet Asset Man-agement of Industrial Service Providers. Fifteenth International Working Seminar of Production Economics. Innsbruck, AT, 3–7 March 2008. Linköping Institute of Technology & Universität Innsbruck. Innsbruck. Vol. 1, 369 – 380.
Ojanen, V., Lanne, M., Ahonen, T. & Tuominen, M. (2008b). The Customer-centric Development of New Industrial Services: Antecedents, Risks and Their
74 Proceedings of the University of Vaasa. Reports
Management. In Proceedings of the 1st ISPIM Innovation Symposium. The Inter-national Society for Professional Innovation Management (ISPIM).
Osterwalder, A. & Pigneur, Y. (2010). Business Model Generation – A Handbook for Visionaries, Game Changers, and Challengers. Hoboken, New Jersey: John Wiley & Sons, Cop.
Pornchokchai, S. (2002). Bangkok Housing Market´s Booms and Busts, What Do We Learn? Pacific Rim Real Estate Society 2002. Christchurch, New Zealand, pp. 1–9.
Power, M. (2009). The risk management of nothing. Accounting, Organizations and Society 34:6–7, 849–855.
Priemus, H. & Van Kempen, R. (1999). Policy and practice: Restructuring urban neighborhoods in the Netherlands: Four birds with one stone. Netherlands Jour-nal of Housing and the Built Environment 14, 403–412.
Ranta, J.-M. & Takala, J. (2007). A holistic method for finding out critical fea-tures of industry maintenance services. International Journal of Services and Standards by Inderscience Enterprises Ltd. 3:3, 312–325.
Rosqvist, T. Laakso, K. & Reunanen, M. (2009). Value-driven maintenance plan-ning for a production plant. Reliability Engineering and System Safety 94, 97–110.
Saaty, T. L. (2008). Decision making with the analytic hierarchy process. Interna-tional Journal of Services Sciences 1:1, 83–98.
Senaratne, S., Wijesiri, D. (2008). Lean Construction as a Strategic Option: Testing its suitability and acceptability in Sri Lanka. [Online] . Lean Construction Journal, 2008 Issue, pp. 34–48. [Cited 25 May 2012] Available from World Wide web: http://www.leanconstruction.org/lcj/2008/LCJ_07_006.pdf.
Shubin, S., Takala, J. & Liu, Y. (2009). Competitiveness of Chinese high-tech manufacturing companies in global context. Industrial Management & Data Sys-tems 109:3, 404–424.
Slack, N. (2005). The flexibility of manufacturing systems. International Journal of Operations & Production Management 25:12, 1190–1200.
Takala, J. (2005). Management and Deep Leadership Sand Cone Model for Human Resource Allocation. The 11th International Conference on Productivity and Quality Research.
Takala, J. (2007). Global manufacturing strategies require “dynamic engineers?” Case study in Finnish industries. Industrial Management & Data Systems, pp. 326–344.

Proceedings of the University of Vaasa. Reports 75
Takala, J., Hirvelä, J., Hiippala, P., Nissinen, V. (2005). Management and Deep Leadership Sand Cone Model for Human Resource Allocation. The 11th Interna-tional Conference on Productivity and Quality Research - ICPQR 2005.
Takala, J., Kamdee, T., Hirvelä, J. & Kyllönen, S. (2007). Analytic calculation of global operative competitiveness. Proceedings of the 16th International Confer-ence on Management of Technology – IAMOT 2007. Orlando: International As-sociation for Management of Technology.
Toshev, R. & Forss, T. (2011). Finnish Social Housing Model as an Efficient Pol-icy Making Tool in Turbulent Economic Environment. Technology Innovation and Industrial Management (TIIM). July 28-30, Oulu, Finland.
Toshev, R., Forss, T. & Takala, J. (2011). Decision Support System Implementing Critical Performance Indicators In Finnish Real Estate. Conference of the Inter-national Association for Management of Technology (IAMOT). April 10–14, Miami, USA.
Toshev, R., Forss, T. & Phusavat K. (2008). Property Management Process in Real Estate and Housing Business. Management International Conference (MIC). November 26–29, Barcelona, Spain.
UN HABITAT (2008). Housing Finance Mechanisms in Thailand. The Human Settlements Finance System Series; Nairobi.
United Nations Population Division (2009). World Population Prospects. The 2008 Revision. New York: United Nations, Department of Economic and Social Affairs.
Weesep, J. V. (2000). Housing policy – the link between welfare and economic development. Journal of Housing and the Built Environment 15, 165–181.
Williamson, D. (2007). The COSO ERM framework: a critique for systems theo-ry of management control. International Journal of Risk Assessment and Man-agement 7:8, 1089–1119.
Yauch, C. (2011). Measuring agility as a performance outcome. Journal of Manufacturing Technology 22:3, 381–404.
Yin, R.K. (2008). Case Study Research: Design and Methods. Third Edition. Thousand Oaks, California: Sage Publications, Inc.