Resilience to shocks in Malawian households
17
African Journal of Agricultural and Resource Economics Volume 16 Number 2 pages 95-111 Resilience to shocks in Malawian households Elizabeth Mubanga Chishimba* Department of Agricultural and Applied Economics, Virginia Polytechnic Institute and State University, Hutcheson Hall, Blacksburg, VA. E-mail: [email protected] Paul N. Wilson Department of Agricultural and Resource Economics, University of Arizona, Severance, Colorado. E-mail: [email protected] * Corresponding author Abstract Building up resilience in agricultural households has assumed a critical role in development strategies in recent years because, it is argued, the costs of strengthening resilience are less than the recurring expenditure for disaster assistance. Relying on large household datasets from 2010 and 2013, we explored the resilience of Malawian households to the exogenous shocks of flooding and currency devaluation during this period. We utilised two strategies for understanding resilience. The first, a classification framework pioneered by Briguglio and others, categorises households into resilience and vulnerability spaces. The second approach employs econometric analysis to explore food security resilience. These two complementary analyses reveal that infrastructure, assets, education and non-agricultural employment opportunities contribute most to food security resilience. Key words: Malawi; resilience; shocks; vulnerability 1. Introduction Resilience is the inherent ability of an agent, organisation or system to recover or bounce back from an adverse shock or shocks over time. These shocks generally are sudden, often unexpected, high- impact events. Floods, hail, typhoons, drought, earthquakes, volcanic activity and landslides are natural events that shock both natural and human systems. Biological shocks, such as human epidemics, pest infestations and animal diseases, are common in low-income countries. Human- caused shocks include civil war, land evictions, devaluation of a currency, and hyperinflation. Generally, these shocks are exogenous, outside the control of individuals, groups or natural systems. Engineers have long designed physical structures and systems to adapt to changing conditions without permanent loss of function (Park et al. 2013). In the design phase, hazards are explicitly acknowledged, so flexibility and back-up systems or subsystems are incorporated into the larger structure or system to guard against total failure. In contrast, resilience in natural systems implies that biological systems have the capacity to restore themselves over time to reach an equilibrium level once more (Torrico & Janssens 2010). A resilient, efficient ecosystem rebuilds itself over a relatively shorter period of time. For example, silvo-pastoral systems are more resilient to natural shocks than intensive cattle grazing and crop production systems. Resilient individuals are realistic, optimistic, hopeful and improvisational (Coutu 2002). Despite adverse shocks in their life, resilient people are able to bounce back under the stress caused by their changing environment. McDonald et al. (2014) investigated the resilience of small businesses in the
Transcript of Resilience to shocks in Malawian households

African Journal of Agricultural and Resource Economics Volume 16 Number 2 pages 95-111
Resilience to shocks in Malawian households Elizabeth Mubanga Chishimba* Department of Agricultural and Applied Economics, Virginia Polytechnic Institute and State University, Hutcheson Hall, Blacksburg, VA. E-mail: [email protected] Paul N. Wilson Department of Agricultural and Resource Economics, University of Arizona, Severance, Colorado. E-mail: [email protected] * Corresponding author
Abstract Building up resilience in agricultural households has assumed a critical role in development strategies in recent years because, it is argued, the costs of strengthening resilience are less than the recurring expenditure for disaster assistance. Relying on large household datasets from 2010 and 2013, we explored the resilience of Malawian households to the exogenous shocks of flooding and currency devaluation during this period. We utilised two strategies for understanding resilience. The first, a classification framework pioneered by Briguglio and others, categorises households into resilience and vulnerability spaces. The second approach employs econometric analysis to explore food security resilience. These two complementary analyses reveal that infrastructure, assets, education and non-agricultural employment opportunities contribute most to food security resilience. Key words: Malawi; resilience; shocks; vulnerability 1. Introduction Resilience is the inherent ability of an agent, organisation or system to recover or bounce back from an adverse shock or shocks over time. These shocks generally are sudden, often unexpected, high-impact events. Floods, hail, typhoons, drought, earthquakes, volcanic activity and landslides are natural events that shock both natural and human systems. Biological shocks, such as human epidemics, pest infestations and animal diseases, are common in low-income countries. Human-caused shocks include civil war, land evictions, devaluation of a currency, and hyperinflation. Generally, these shocks are exogenous, outside the control of individuals, groups or natural systems. Engineers have long designed physical structures and systems to adapt to changing conditions without permanent loss of function (Park et al. 2013). In the design phase, hazards are explicitly acknowledged, so flexibility and back-up systems or subsystems are incorporated into the larger structure or system to guard against total failure. In contrast, resilience in natural systems implies that biological systems have the capacity to restore themselves over time to reach an equilibrium level once more (Torrico & Janssens 2010). A resilient, efficient ecosystem rebuilds itself over a relatively shorter period of time. For example, silvo-pastoral systems are more resilient to natural shocks than intensive cattle grazing and crop production systems. Resilient individuals are realistic, optimistic, hopeful and improvisational (Coutu 2002). Despite adverse shocks in their life, resilient people are able to bounce back under the stress caused by their changing environment. McDonald et al. (2014) investigated the resilience of small businesses in the

AfJARE Vol 16 No 2 June 2021 Chishimba & Wilson
96
wake of a natural disaster (viz. Hurricane Katrina) and found that the ability to bounce back (i.e. reopen after a short period of time) was largely due to preparing for a possible adverse shock well before it occurred. Communities, particularly in low-income countries, base their resilience on well-developed social capital and community networks that enable them to recover from shocks in a timely manner (Bernier & Meinzen-Dick 2014). Regional economies develop relatively shock-proof economic systems through diversification and education, and an entrepreneurial business sector with limited governmental constraints (Chia-Yun et al. 2015). Briguglio et al. (2009), in addition to analysing the resilience capacities of nations, incorporate the concept of vulnerability exposure to shocks into their analysis. Factors that create vulnerability are permanent or quasi-permanent features of the economy that are not controlled or easily influenced by policy decisions (e.g. being landlocked), while resilience-enhancing factors are an open economy, good governance and social development. The agricultural sector, possibly to a greater extent than other sectors of the economy, is vulnerable to shocks such as natural disasters, climatic events, the volatility of commodity prices, regional conflicts, trade disputes and family setbacks due to the illness or death of the main income earner. Smallholder farmers are more vulnerable and less resilient than larger operations, because these operations are resource constrained with little access to credit and risk-mitigating technologies. Researchers have found that African smallholders face a wide range of uncontrollable shocks to their livelihoods in the form of volatile prices, shifts in public policy and environmental events, such as floods and pest invasions (Chuku & Okoye 2009; Mwangi & Kariuki 2015). Development agencies (e.g. USAID, DFID, the World Bank) have shifted much of their focus on responding to natural disasters, economic instability and local conflicts to building up the resilience of local people to withstand and bounce back from these shocks. This policy shift requires a clear understanding of the factors that affect the ability of a household, community and nation to anticipate, adapt to and recover from adverse events in a manner that protects livelihoods, accelerates and sustains recovery, and strengthens future economic and social development efforts. What determines the vulnerability and resilience of households? Are there strategies to build resilience in households that are the most vulnerable to shocks? This paper seeks to provide insights into these and similar questions with a focus on agricultural households in Malawi. After a brief review of the relevant general literature on agricultural shocks, risk management and managerial resilience, we explore previous work on resilience in African agriculture. We then set the stage for our analysis by presenting an overview of the Malawian economy, with special attention given to the dominant agricultural sector. Using a large-scale household dataset, we first apply a classification model from Briguglio et al. (2009) to explore the vulnerability and resilience levels of Malawian households, a unique analysis in the economic development literature. We then complement the classification analysis with three econometric models capturing factors contributing to resilience under two shocks: a currency devaluation and floods. After discussing the results from the classification and econometric modelling, we conclude the paper with our insights for development policy and programming, as well as future directions for resilience research in low-income nations. 2. Agricultural resilience Understanding managerial resilience in the agricultural sector has a long and distinguished theoretical and empirical legacy in farm-level decision analysis under uncertainty (Anderson et al. 1977; Barry 1984; Patrick et al. 1985). Weather events, price fluctuations, government policy and programme instability, macroeconomic and trade shocks, and personal crises produce both short- and longer-term risks to a farming system. Agricultural managers rely on a wide range of strategies and tools to cope with disturbances in their business environments. Innovative labour management, product pricing

AfJARE Vol 16 No 2 June 2021 Chishimba & Wilson
97
strategies, livelihood and enterprise diversification, pacing investments, strong supplier and buyer networks, and family and community social capital are sample responses in an uncertain world. Darnhofer (2014) classifies farm resilience using three capabilities: buffer, adaptive, and transformative. Buffer capability is the ability of a farmer to maintain the current level of farm operations through everyday disruptions and disturbances. Adaptive capability points to the ability of the operation to strategically position itself to cope successfully with longer-term changes associated with climate, government policy and future family management, for example. Transformative capability arises when the farm management can make new operating and planning decisions that create a more resilient, and possibly new, business model for the near and distant future. All three capabilities are integral for a resilient business. Low-income farming households respond to sources of variability with similar responses. Ellis (2000) emphasises the importance of livelihood diversification as a resilience strategy. A variety of on-farm and off-farm income sources, as well as remittances, allow the household to construct an income portfolio with low covariate risk. More broadly, Heltberg et al. (2013) found that fuel and financial shocks in 17 lower income countries between 2008 and 2011 affected farmers, farm owners, and informal and formal sector workers differently. Generally, those with fewer assets (e.g. savings, land) were less resilient. Women appeared to be less resilient than men because women acted as “shock absorbers” for the family, as they managed tighter household budgets. Many turned to formal organisations (religious communities, nongovernmental groups, microcredit institutions) for assistance, while nearly everyone relied on the informal safety nets provided by family and friends to cope with variability during this period. Explorations of resilience in African households and on African farms have focused their attention on weather shocks and climate change. Seo (2010) examined farm resilience in ten countries, while Bryan et al. (2013) investigated household resilience strategies in Kenya, Hoddinott (2006) explored resilience in Zimbabwe, Mutabazi et al. (2015) analysed resilience in Tanzania, and Daressa et al. (2009) used cross-sectional survey data from 1 000 Ethiopian farming households to explore how these households adapted to climate change. There is a growing body of literature with a focus on the interaction between resilience, poverty and food security. Haile et al (2021) analysed the role of resilience in reducing multidimensional poverty in Ethiopia, Murendo et al. (2020) examined the role of absorptive, adaptive, and transformative resilience capacities in household dietary diversity and consumption in the presence of shock exposure in Malawi, Ado et al. (2019) explored the determinants of resilience among households in Niger and their livelihood strategies toward food security, and Smith and Frankenberger (2018) analysed the effect of resilience capacity on household food security in Bangladesh. Although farmers in each country and in region of a country produce localised resilience strategies, their resilience capabilities overall feature several common characteristics or strategies. First, on-farm diversification generally indicates a more resilient farming operation. Integrated cropping and livestock systems create a more shock-resilient income portfolio as the climate changes. Second, vulnerable farmers who make adjustments to their planting and cultivation practices within their agro-environmental constraints (e.g. soils, climate zone, topography) use examples of adaptive capability. Third, farming operations with financial and other asset reserves cope more successfully with changes in their business environments than their neighbours with limited assets. Fourth, farming households that place greater importance on education and social capital within and outside their communities demonstrate greater buffer and adaptive capabilities. Finally, greater transformative capability is associated with farm household managers who consciously plan for the near and distant future. Those operations that actively manage for change demonstrate more transformative capability.

AfJARE Vol 16 No 2 June 2021 Chishimba & Wilson
98
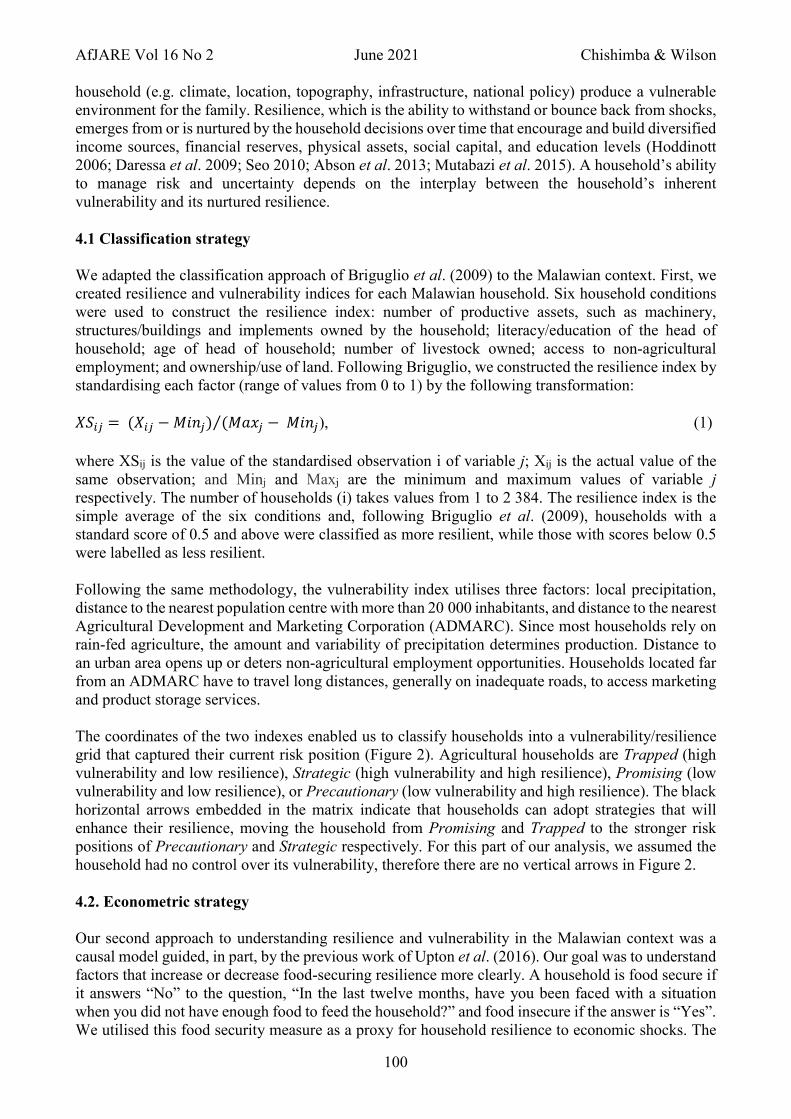
3. The Malawian context Landlocked by Zambia, Tanzania and Mozambique, Malawi covers an area of 118 484 km2, with 24 404 km2 being water in the form of Lake Malawi. A long and narrow country, Malawi is divided into three regions, with the northern and central areas characterised by high plateaus and the southern region by mountains (Figure 1). Lilongwe, located in the central region, is the national and administrative capital, Blantyre in the south is the commercial and manufacturing hub of the country, while Mzuzu is the principal town in the north. Eighty percent of the population of 18 million lives in rural areas. With a per capita GDP of $1 200, Malawi is one of the poorest countries in the world, with half the population living below the poverty line. In terms of the Human Development Index and Transparency International measures, Malawi ranks 170 out of 188 countries and 122 out of 189 countries respectively (UNDP 2016; Transparency International 2017; Food and Agriculture Organization [FAO] 2018; USAID 2021).
Figure 1: Geographic and agricultural regions of Malawi

AfJARE Vol 16 No 2 June 2021 Chishimba & Wilson
99
South Africa is Malawi’s major trading partner, although Malawi also trades with the United States, China and neighbouring countries. Major exports are agricultural commodities (burley tobacco, tea, cotton, sugar, peas), while Malawi imports almost all consumer and industrial goods because of its rudimentary, domestic industrial sector. Malawi’s mostly rain-fed agricultural sector, a dualistic export-oriented cash-crop estate and subsistence food-crop small-farmer system, accounts for over 40% of the total GDP, at 81% of export earnings, and most day-to-day employment (Wilson 2014); FAO 2017). Annual rainfall in this strongly seasonal sub-tropical climate can vary widely, from 725 to 2 500 mm (Malawi Department of Climate Change and Meteorological Services 2018). In rural areas, land is the most critical production asset for Malawians, other than their own labour (Wilson 2014). Extreme land fragmentation is due to a mix of matrilineal and patrilineal inheritance rules. Land tenure falls into three classifications: private, public and customary land. Approximately 70% of all rural lands fall into the customary or community property classification and represent the predominant land tenure system for smallholders. Local chiefs serve as trustees over customary land and allocate the land to community members. Once acquired by a community member, land can be passed along to heirs on a quasi-permanent basis. On average, one hectare of land supports a family of five. Larger-scale estate farmers produce primarily burley tobacco for the export sector on their private land. Smallholders mainly grow food for their own consumption, with their farm size determined by the availability of farm labour and the necessary household cash to hire farm labour and buy farm inputs (e.g. fertiliser). Maize, sorghum, millet, pulses, rice, cassava, vegetables, fruit and some tobacco are the principal small-farm outputs. Many smallholder households rely on non-farm sources of income (i.e. agricultural wages, non-agricultural wages, their non-farm businesses) to supplement their agricultural production. Several comments on maize are in order. Maize accounts for nearly 90% of the cultivated hectares in the country and is consumed at nearly every meal, making Malawi the number one per capita consumer of maize for food in the world. It is estimated that the average maize consumption in Malawi in 2011 was 382 g/capita/day (Ecker & Qaim 2011). Maize acreage is determined by food security, with producers responding more to family consumption needs than to crop price when making cropping decisions. Maize not consumed in the household is sold to neighbours, intermediaries, and to the Agricultural Development and Marketing Corporation (ADMARC), a government agency. In the period from 2010 to 2013, Malawian households experienced two significant shocks. In 2011, after a period of low tobacco earnings and reductions in foreign aid hampering the country’s ability to buy critical goods (e.g. fuel, medicine), the federal government devalued the exchange rate from K167 to K250 per US dollar (a devaluation of 33%) and adopted a floating exchange rate regime (International Monetary Fund [IMF] 2012). The devaluation lowered consumer purchasing power, particularly for the poor, as prices for basic commodities rose significantly (Reliefweb 2012). Then, starting in mid-December 2012, Malawi was struck by heavy rains that produced flooding throughout the country, but particularly in the southern district. Floods drowned livestock, destroyed crops during the main growing season, collapsed houses, contaminated drinking water sources, and rendered most roads impassable. These two, unexpected exogenous events provide a natural experiment for assessing the level of vulnerability and resilience of agricultural households in Malawi. 4. Conceptual and analytical strategies Agricultural households operate in an environment in which they face risk and uncertainties on a daily basis. The exposure to vulnerability and resilience capacities of a household determine the effect an exogenous shock will have on the household’s wellbeing. Factors outside the control of the
AfJARE Vol 16 No 2 June 2021 Chishimba & Wilson
100
household (e.g. climate, location, topography, infrastructure, national policy) produce a vulnerable environment for the family. Resilience, which is the ability to withstand or bounce back from shocks, emerges from or is nurtured by the household decisions over time that encourage and build diversified income sources, financial reserves, physical assets, social capital, and education levels (Hoddinott 2006; Daressa et al. 2009; Seo 2010; Abson et al. 2013; Mutabazi et al. 2015). A household’s ability to manage risk and uncertainty depends on the interplay between the household’s inherent vulnerability and its nurtured resilience. 4.1 Classification strategy We adapted the classification approach of Briguglio et al. (2009) to the Malawian context. First, we created resilience and vulnerability indices for each Malawian household. Six household conditions were used to construct the resilience index: number of productive assets, such as machinery, structures/buildings and implements owned by the household; literacy/education of the head of household; age of head of household; number of livestock owned; access to non-agricultural employment; and ownership/use of land. Following Briguglio, we constructed the resilience index by standardising each factor (range of values from 0 to 1) by the following transformation: ���� = (��� − ����) (����⁄ − ����), (1)
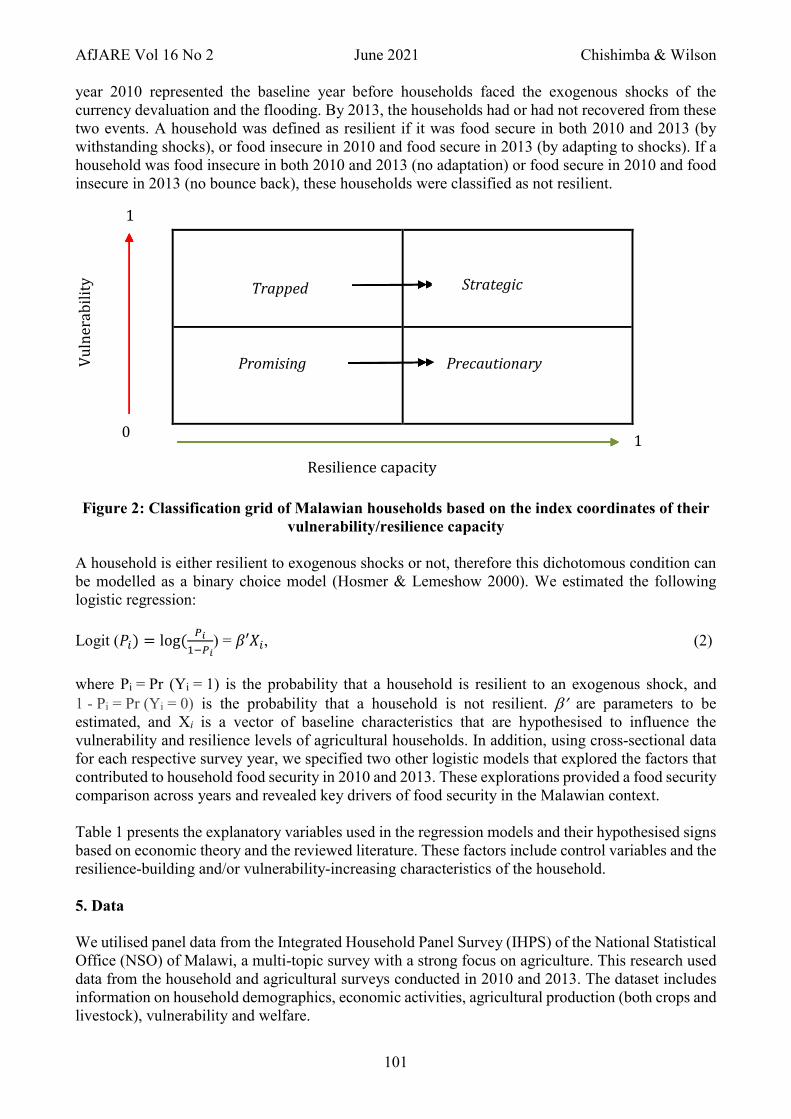
where XSij is the value of the standardised observation i of variable j; Xij is the actual value of the same observation; and Minj and Maxj are the minimum and maximum values of variable j respectively. The number of households (i) takes values from 1 to 2 384. The resilience index is the simple average of the six conditions and, following Briguglio et al. (2009), households with a standard score of 0.5 and above were classified as more resilient, while those with scores below 0.5 were labelled as less resilient. Following the same methodology, the vulnerability index utilises three factors: local precipitation, distance to the nearest population centre with more than 20 000 inhabitants, and distance to the nearest Agricultural Development and Marketing Corporation (ADMARC). Since most households rely on rain-fed agriculture, the amount and variability of precipitation determines production. Distance to an urban area opens up or deters non-agricultural employment opportunities. Households located far from an ADMARC have to travel long distances, generally on inadequate roads, to access marketing and product storage services. The coordinates of the two indexes enabled us to classify households into a vulnerability/resilience grid that captured their current risk position (Figure 2). Agricultural households are Trapped (high vulnerability and low resilience), Strategic (high vulnerability and high resilience), Promising (low vulnerability and low resilience), or Precautionary (low vulnerability and high resilience). The black horizontal arrows embedded in the matrix indicate that households can adopt strategies that will enhance their resilience, moving the household from Promising and Trapped to the stronger risk positions of Precautionary and Strategic respectively. For this part of our analysis, we assumed the household had no control over its vulnerability, therefore there are no vertical arrows in Figure 2. 4.2. Econometric strategy Our second approach to understanding resilience and vulnerability in the Malawian context was a causal model guided, in part, by the previous work of Upton et al. (2016). Our goal was to understand factors that increase or decrease food-securing resilience more clearly. A household is food secure if it answers “No” to the question, “In the last twelve months, have you been faced with a situation when you did not have enough food to feed the household?” and food insecure if the answer is “Yes”. We utilised this food security measure as a proxy for household resilience to economic shocks. The
AfJARE Vol 16 No 2 June 2021 Chishimba & Wilson
101
year 2010 represented the baseline year before households faced the exogenous shocks of the currency devaluation and the flooding. By 2013, the households had or had not recovered from these two events. A household was defined as resilient if it was food secure in both 2010 and 2013 (by withstanding shocks), or food insecure in 2010 and food secure in 2013 (by adapting to shocks). If a household was food insecure in both 2010 and 2013 (no adaptation) or food secure in 2010 and food insecure in 2013 (no bounce back), these households were classified as not resilient.
Figure 2: Classification grid of Malawian households based on the index coordinates of their
vulnerability/resilience capacity A household is either resilient to exogenous shocks or not, therefore this dichotomous condition can be modelled as a binary choice model (Hosmer & Lemeshow 2000). We estimated the following logistic regression:
Logit (��) = log(��
����) = �′��, (2)
where Pi = Pr (Yi = 1) is the probability that a household is resilient to an exogenous shock, and 1 - Pi = Pr (Yi = 0) is the probability that a household is not resilient. are parameters to be estimated, and Xi is a vector of baseline characteristics that are hypothesised to influence the vulnerability and resilience levels of agricultural households. In addition, using cross-sectional data for each respective survey year, we specified two other logistic models that explored the factors that contributed to household food security in 2010 and 2013. These explorations provided a food security comparison across years and revealed key drivers of food security in the Malawian context. Table 1 presents the explanatory variables used in the regression models and their hypothesised signs based on economic theory and the reviewed literature. These factors include control variables and the resilience-building and/or vulnerability-increasing characteristics of the household. 5. Data We utilised panel data from the Integrated Household Panel Survey (IHPS) of the National Statistical Office (NSO) of Malawi, a multi-topic survey with a strong focus on agriculture. This research used data from the household and agricultural surveys conducted in 2010 and 2013. The dataset includes information on household demographics, economic activities, agricultural production (both crops and livestock), vulnerability and welfare.
Trapped Strategic
Promising Precautionary
1
1
0
Resilience capacity
Vu
lner
abil
ity
Trapped Strategic Trapped
Promising Precautionary
Strategic Trapped

AfJARE Vol 16 No 2 June 2021 Chishimba & Wilson
102
Table 1: Explanatory variables and their hypothesised signs Variable Description Hypothesised sign Control variables Gender dummy Gender of the HH head, 1 if female and 0 if male +/- Household size Number of household members +/- Regional dummies Dummies for Northern, Central and Southern Regions +/- Resilience-building variables Age Age of household head in years (proxy for experience) +
Education/literate dummy HH head can read and write in Chichewa or English or has attained at least primary school
+
Productive (farming) assets Number of agricultural machinery and buildings assets for agricultural production that a household owns
+
Number of livestock Number of livestock, such as cattle, pigs, goats, etc., owned by a HH 12 months prior to baseline
+
Number of poultry Number of poultry, such as chickens, turkeys, ducks, etc., owned by a HH 12 months prior to baseline
+
Corn planted (hectares) Area of corn a household planted in hectares during the 2009/ 2010 season
+
Tobacco planted (hectares) Area of corn a household planted in hectares during the 2009/ 2010 season
+
Non-agricultural employment
Number of HH members involved in non-agricultural (non-farm) employment income
+
Ganyu Number of HH members involved in ganyu + Electricity dummy HH has access to electricity for cooking or lighting + Access to credit dummy HH has access to credit + Vulnerability variables Distance to population centre (km)
Household distance to nearest population centre with 20 000 people
-
Distance to ADMARC (km) Household distance to nearest Agricultural Development and Marketing Corporation (ADMARC) centre
-
Temperature of wettest quarter (°C)
Temperature of the wettest quarter in degrees Celsius +/-
Precipitation in wettest quarter (mm)
Precipitation of the wettest quarter in millimetres +/-
5.1 Survey coverage The baseline survey, consisting of 3 246 households, was conducted between March and November 2010. The 2013 follow-up survey (April to December) attempted to track all baseline survey households, including individuals who had moved away from the baseline dwellings between 2010 and 2013, who were neither guests nor servants during the baseline survey, and who were at least 12 years of age at the time. If individuals had moved away from a baseline household and fulfilled the aforementioned criteria, these were called split households. These new households were included in the 2013 sample, resulting in a total of 4 000 households that were traceable back to baseline units. Of the 3 246 baseline households, 2 384 did not split, while 720 households split into two or more units. After accounting for 20 baseline households that disappeared between 2010 and 2013, the overall attrition rate between the two years was less than 4% (Malawi National Statistical Office [NSO] 2013). 5.2 Data cleaning Given our definition of household resilience as the change in food security between 2010 and 2013, data files for 2010 were merged with those from 2013 for the same households. Next, household baseline characteristics were selected from the 2010 dataset. So, although the dependent variable (household resilience) draws on both years, all the explanatory and control variables in the resilience model come from the baseline year (2010), because these are the characteristics that enable the households to withstand or adapt to exogenous shocks in 2011 and late 2012. The small number of

AfJARE Vol 16 No 2 June 2021 Chishimba & Wilson
103
split households were excluded from our analysis. Potentially, this exclusion could introduce some degree of selection bias,1 but any potential bias is outweighed by the desire to capture changes in household food security (resilience) for the same households over the period from 2010 to 2013. We weighted the survey data for all descriptive statistics and econometric analyses to correct for any known bias and to make the sample representative of the population. Baseline survey weights were used. After split households were dropped, 2 384 households remained in the 2013 dataset. Our merger of the 2010 and 2013 panels, after controlling for extreme and missing values, produced a final dataset of 2 384 households. 5.3 Summary statistics Table 2 presents the household-level statistics of all the regressors in the resilience logistical model. On average, Malawian households have five members, with the largest household counting 19 family and non-family members. Most households are headed by a male; however, a quarter of the households have a female head. The average age of the head of household is 42 years, and more than half of them are literate, meaning they are able to read and write English and/or Chichewa, or they have attained at least a primary education. Eighty-three percent of the households are agricultural – owning and farming land. On average, these households own two large animals (cows or goats) and four poultry. As noted earlier, maize production captures a significant portion of Malawian productive energies, so in this dataset an average household was found to plant 0.4 hectares of maize. Although tobacco is the major cash crop in Malawi, the average household only planted 0.04 hectares of tobacco. Table 2: Summary statistics Variable Mean SD Min Max
A. Continuous variables (mean)
Age (years) 41.6 16.6 13 110
Household size 4.5 2.1 1 19
Productive (farming) assets 5.3 4.5 0 48
Number of livestock 1.4 3.5 0 46
Number of poultry 3.2 6.3 0 59
Maize planted (hectares) 0.4 0.5 0 6.8
Tobacco planted (hectares) 0.04 0.2 0 3.6
Employment (# of HH members with non-agricultural employment) 0.3 0.5 0 3
Ganyu labour (# of HH members involved in ganyu) 0.6 0.9 0 6
Distance to population centre (km) 32.5 18.6 0.3 92.8
Distance to ADMARC (km) 7.5 5.4 0.1 25.1
Temperature of wettest quarter (°C) 23.1 1.9 19.6 28.5
Precipitation in wettest quarter 671.6 87.3 497 1 199 B. Discrete variables (%)
Education/literacy 64.3 47.9 0 1
Gender dummy (1 = female) 24.4 42.9 0 1
Electricity dummy (1 = yes) 6.2 24.2 0 1
Access to credit dummy (1 = yes) 14.3 35.1 0 1
Northern region dummy (1 = yes) 13.2 33.8 0 1
Central region dummy (1 = yes) 38.6 48.7 0 1
Southern region dummy (1 = yes) 48.2 50.0 0 1 C. Dependent variables (%) Resilience dummy (1 = yes) 33.9 47.4 0 1
Food secure in 2010 (1 = yes) 49.6 50.0 0 1
Food secure in 2013 (1 = yes) 33.9 47.4 0 1 † SD indicates standard deviation; Survey baseline sampling weights applied Source: Government of Malawi National Statistical Office (NSO) data.
1 There were no differences in the observables of interest between split households and those that did not split.

AfJARE Vol 16 No 2 June 2021 Chishimba & Wilson
104
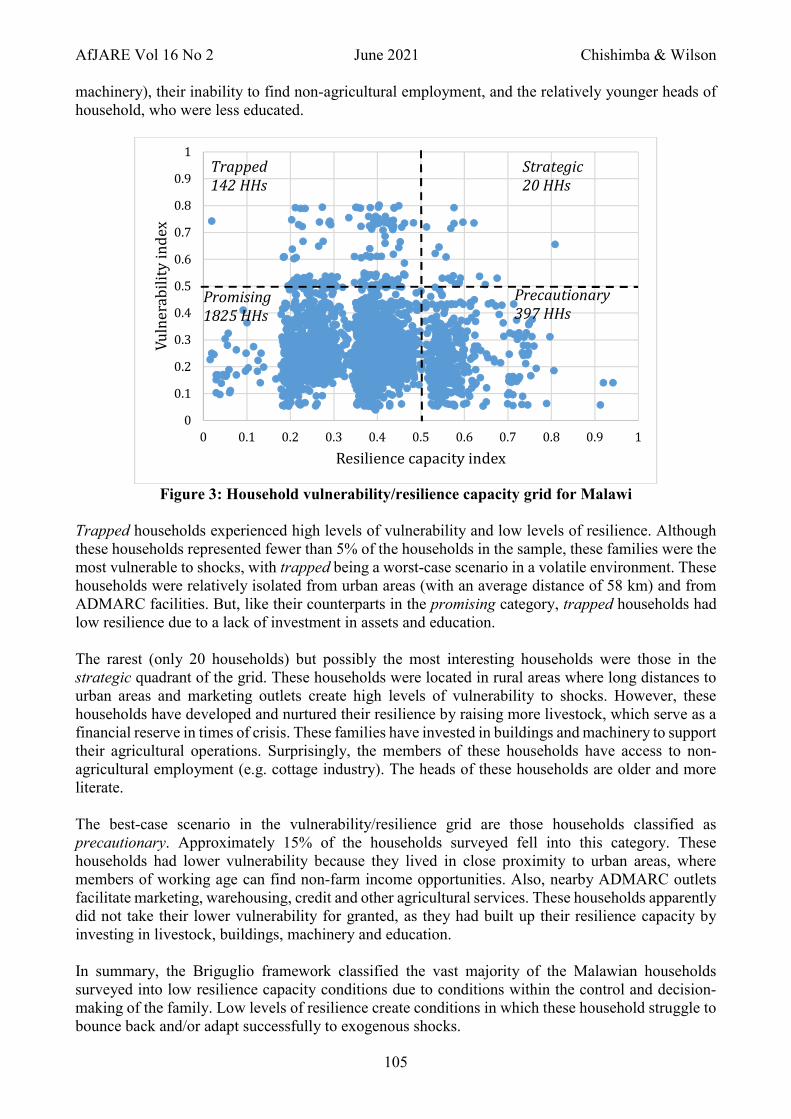
These agricultural households supplemented their income through non-agricultural employment (e.g. working in the town or city) and ganyu (i.e. farm labour income earned by working on other farms). A quarter of the households had access to non-agricultural employment, while 41% earned ganyu income. Only 14% of the households had access to credit. Geographically, 13% of the households in the sample were located in the Northern Region, while 39% and 48% of the households in the dataset resided in the Central and Southern Regions respectively (Figure 1). The average distance to the nearest ADMARC was eight kilometres, while the average trip (one way) to a population centre with 20 000 people was 33 kilometres. Only 6% of the households in the sample had access to electricity. Finally, as noted earlier, most of the agricultural production in Malawi occurs during the rainy season, so maize yields were heavily dependent on the timing and quantity of precipitation. Rainfall during the wettest quarter ranged between 497 and 1 199 millimetres, with an average of 672 millimetres. The average temperature during the wettest quarter during the study period was 23° Celsius. 6. Results and discussion 6.1 What did the households say? Of the 2 384 panel households interviewed in 2013, 96% reported experiencing severe shocks that had a negative effect on the household. The eight most frequently reported shocks were: 1. Unusually high prices for food 2. Unusually high costs of agricultural inputs 3. Drought/irregular rains 4. Serious illness or accident of household member(s) 5. Unusually low prices for agricultural outputs 6. Floods/landslides 7. Theft of money/valuables/assets/agricultural output 8. Unusually high levels of crop pests or diseases These, as well as less frequently cited shocks, can be aggregated under the general categories of prices, weather and human relationships. The most frequently cited response to shocks was the reliance on household savings. Surprisingly, the second most common response was “Did not do anything”. Changing dietary patterns involuntarily (e.g. less food security) and receiving unconditional help from relatives/friends (e.g. social capital) were the other most frequently accessed resilience strategies these households used to manage shocks. 6.2. Household classification grid Utilising Briguglio’s classification approach presented in section 4.1, we found that Malawian households could be classified into four groups based on the coordinates of their resilience capacity and vulnerability indices: promising, trapped, strategic and precautionary (Error! Reference source not found.). Eighty percent of the Malawian households were classified as promising. Despite having low levels of vulnerability, these households also had low levels of resilience against shocks. Although these households could take steps to build their resilience, they failed to do so for a host of good and not so good reasons. This result supports the “Did not do anything” response to the household strategy for responding to shocks. These households’ vulnerability to shocks was mitigated because they lived within a reasonable distance from an urban area where they could find non-farm work opportunities. On the agricultural side, these households were in close proximity to ADMARC outlets. Yet their resilience was low due to the lack of livestock and physical agricultural assets (e.g.
AfJARE Vol 16 No 2 June 2021 Chishimba & Wilson
105
machinery), their inability to find non-agricultural employment, and the relatively younger heads of household, who were less educated.
Figure 3: Household vulnerability/resilience capacity grid for Malawi
Trapped households experienced high levels of vulnerability and low levels of resilience. Although these households represented fewer than 5% of the households in the sample, these families were the most vulnerable to shocks, with trapped being a worst-case scenario in a volatile environment. These households were relatively isolated from urban areas (with an average distance of 58 km) and from ADMARC facilities. But, like their counterparts in the promising category, trapped households had low resilience due to a lack of investment in assets and education. The rarest (only 20 households) but possibly the most interesting households were those in the strategic quadrant of the grid. These households were located in rural areas where long distances to urban areas and marketing outlets create high levels of vulnerability to shocks. However, these households have developed and nurtured their resilience by raising more livestock, which serve as a financial reserve in times of crisis. These families have invested in buildings and machinery to support their agricultural operations. Surprisingly, the members of these households have access to non-agricultural employment (e.g. cottage industry). The heads of these households are older and more literate. The best-case scenario in the vulnerability/resilience grid are those households classified as precautionary. Approximately 15% of the households surveyed fell into this category. These households had lower vulnerability because they lived in close proximity to urban areas, where members of working age can find non-farm income opportunities. Also, nearby ADMARC outlets facilitate marketing, warehousing, credit and other agricultural services. These households apparently did not take their lower vulnerability for granted, as they had built up their resilience capacity by investing in livestock, buildings, machinery and education. In summary, the Briguglio framework classified the vast majority of the Malawian households surveyed into low resilience capacity conditions due to conditions within the control and decision- making of the family. Low levels of resilience create conditions in which these household struggle to bounce back and/or adapt successfully to exogenous shocks.
0
0.1
0.2
0.3
0.4
0.5
0.6
0.7
0.8
0.9
1
0 0.1 0.2 0.3 0.4 0.5 0.6 0.7 0.8 0.9 1
Vu
lner
abil
ity
in
dex
Resilience capacity index
Trapped 142 HHs
Strategic20 HHs
Precautionary397 HHs
Promising1825 HHs

AfJARE Vol 16 No 2 June 2021 Chishimba & Wilson
106
6.3. Econometric results The econometric exploration of vulnerability and resilience employed a comparison of separate logistical models for 2010 and 2013 to study the factors that affected food security (Table 3). As noted in section 4.2, the dependent variable is 1 if the household is food secure and 0 if it is food insecure, based on the household response to the survey question, “In the last twelve months, have you been faced with a situation when you did not have enough food to feed the household?” Variables that significantly affected food security in 2010 were household size, gender of the household head, number of livestock reared, number of productive assets owned, access to electricity, the geographic region, access to non-agricultural employment and access to ganyu income. The households with greater numbers of livestock, more productive assets, living in the Northern region and with access to electricity were more likely to be food secure in 2010. Households with female heads were less likely to be food secure compared to male-headed households. Households with more members were less likely to be food secure in 2010. In addition, households that had access to ganyu income were less likely to be food secure in 2010, possibly indicating that those relying on off-farm agricultural employment were, by definition, poorer than their more food-secure neighbours. Table 3: Food security and resilience results for 2010 and 2013 (1) (2) (3) Variables 2010 Food Security 2013 Food Security Food Security Resilience Age (years) -0.005 -0.002 -0.003 (0.004) (0.004) (0.003) Gender (1 = female) -0.348** -0.195 -0.205 (0.162) (0.154) (0.131) Household size -0.146*** -0.124*** -0.112*** (0.027) (0.031) (0.028) Education/literacy (1 = yes) 0.173 0.378*** 0.301** (0.137) (0.131) (0.122) Productive (farming) assets 0.057*** 0.083*** 0.062*** (0.017) (0.019) (0.018) Number of livestock 0.033* 0.076*** 0.042** (0.017) (0.022) (0.019) Number of poultry 0.005 0.014* 0.004 (0.009) (0.008) (0.009) Maize planted (hectares) 0.168 0.182 0.365*** (0.147) (0.117) (0.126) Tobacco planted (hectares) -0.270 -0.250* 0.188 (0.360) (0.134) (0.408) Non-agricultural employment 0.221* 0.336*** 0.417*** (0.113) (0.116) (0.124) Ganyu -0.590*** -0.554*** -0.446*** (0.078) (0.088) (0.069) Electricity(1 = yes) 1.376*** 1.373*** 1.542*** (0.296) (0.199) (0.216) Access to credit (1 = yes) -0.055 -0.318** 0.199 (0.198) (0.145) (0.172) Distance to population centre (km) -0.004 -0.002 -0.002 (0.004) (0.003) (0.004) Distance to ADMARC (km) -0.002 -0.015 -0.015 (0.012) (0.011) (0.012) Temperature of wettest quarter (°C) -0.061 -0.077 -0.053 (0.040) (0.047) (0.046) Precipitation in wettest quarter (mm) 0.0008 0.0002 -4.34e-05 (0.0008) (0.0007) (0.0008) Regional dummies, base = Southern Northern region (1 = yes) 0.514*** 0.301* 0.357* (0.171) (0.165) (0.188)

AfJARE Vol 16 No 2 June 2021 Chishimba & Wilson
107
Central region (1 = yes) -0.0915 -0.451** -0.405** (0.171) (0.184) (0.182) Constant 1.600 1.235 0.733 (1.152) (1.203) (1.213) Observations 2 383 2 381 2 383 LR chi2 (19) 448.35 503.25 375.24 Prob > chi2 0.000 0.000 0.000 Log-likelihood -1412.154 -1332.041 -1397.010 Pseudo R2 0.137 0.159 0.1184
Standard errors in parentheses; survey baseline sampling weights applied *** p < 0.01, ** p < 0.05, * p < 0.1
The results from the 2013 cross-sectional data produced largely similar results to the 2010 data. In summary, key positive factors explaining food security in the sample households were head of household education/literacy, number of productive assets owned, access to non-agricultural employment, access to electricity, number of livestock owned, number of poultry owned, and living in the Northern region. Larger households, the use of ganyu income, engaging in tobacco production, living in the Central region and access to credit had a negative effect on food security. Surprisingly, households with access to credit were less food secure, a result that conflicts with the positive relationship between household resilience and credit found by Mutabazi et al. (2015) in Tanzania. A possible explanation is that the variable was constructed to capture those households that had borrowed from a financial institution, which may be an indication that such households are worse off, as indicated by their low resilience capacity. The next step in our econometric analysis explored the effect of resilience-building and vulnerability variables on our measure of food security. The dependent variable was the measure of food security resilience, as explained in section 4.2, with values for the explanatory variables taken from the 2010 survey. Model 3 in Table 3 explains the resilience of households to exogenous shocks between 2010 and 2013. In most cases, the results in Model 3 are consistent with the research literature. Households with access to electricity were more resilient, highlighting the importance of infrastructure for reducing household vulnerability to exogenous shocks. Electricity supports milking machines, refrigerated food storage, safe drinking water and learning (e.g. night light for studying). Furthermore, households with access to electricity had literate heads and more members that worked. Seo (2010) also found a positive effect of electricity on the profit levels of mixed and livestock-only farms in Africa. Households with physical assets employed in the farming operation (e.g. machinery, buildings) were more resilient than their capital-less counterparts. Physical capital increases labour productivity and, in a severe crisis, can serve as a financial reserve buffer to smooth household consumption. In addition, households with physical assets tend to cultivate more hectares of maize and tobacco, which contributes to food security and promotes resilience. Again, this finding is consistent with Hoddinott’s (2006) work on the role of physical assets in the mitigation of exogenous shocks to farming systems in Zimbabwe. Likewise, livestock assets (i.e. cows, goats) promote household resilience by acting as a buffer against shocks. Livestock produce income and protein for the stressed household, a result also supported by Hoddinott’s research. Those households with more land in maize production are more resilient, according to our findings. As noted in section 3, maize is the major food crop in Malawi, so it follows that those households growing more maize were more likely to be more resilient to shocks when resilience is a food security measure. Agricultural households with members who have access to non-agricultural employment cope better with shocks. Furthermore, households located in the Northern region are more resilient compared to those from the Southern region.

AfJARE Vol 16 No 2 June 2021 Chishimba & Wilson
108
Larger households (i.e. with more mouths to feed) and households with ganyu income are statistically significant factors for explaining lower resilience. The negative influence of ganyu income does not support the research findings of Daressa et al. (2009), who show the importance of diversified income sources, of which ganyu income is an important part. We argue that this result suggests that households that work for day wages on other farms do not generate enough income on their own farms to feed their families. Therefore, households with ganyu income are less resilient and more vulnerable compared to households that do not rely on off-farm income for food security. Finally, our results indicate that, compared to households that are located in the southern region, those from the central region are less likely to be resilient. Marginal effects reveal key insights into or highlights on the vulnerability and resilience conditions of Malawian households (Table 4). Families with electricity were 37% more likely to be resilient than those with no access to the electric power grid in the country. This finding supports the argument that infrastructure (e.g. electricity, roads, potable water) is critical for reducing vulnerability and enhancing resilience. Those households with non-agricultural income were 9% more likely to be resilient to exogenous shocks. Growing more maize (i.e. farm size) on your own land improved resilience. Households with a literate head were 6% more likely to cope with exogenous shocks. A final note is in order on the robustness of the resilience econometric model (not shown). In-sample predictions reveal that the model is much stronger in predicting non-resilient households (88%) than resilient households (40%). Our specification of non-resilience and our understanding of the many contributing factors welcome improved specifications and insights. Overall, our econometric model correctly predicts 70% of the households’ status. Table 4: Marginal effects for resilience model (Model 3 resilience)
Variable Marginal effect Age (years) -0.001 Gender dummy (1 = female) -0.04 Household size -0.02*** Education/literacy (1 = yes) 0.06** Productive (farming) assets 0.01*** Number of livestock 0.01** Number of poultry 0.001 Maize planted (hectares) 0.08*** Tobacco planted (hectares) 0.04 Non-agricultural employment 0.09*** Ganyu -0.1*** Electricity (1 = yes) 0.37*** Access to credit (1 = yes) 0.04 Distance to population centre (km) -0.001 Distance to ADMARC (km) -0.003 Temperature of wettest quarter (°C) -0.01 Precipitation in wettest quarter (mm) -9.45E-06 Region dummies, base = Southern
Northern region dummy (1 = yes) 0.08* Central region dummy (1 = yes) -0.09**
Level of significance at *** p < 0.01, ** p < 0.05, * p < 0.1
7. Conclusions and policy implications Most Malawian households are stuck or trapped in a low-resilience status quo due to circumstances within, but mostly beyond, their control due to the nation’s poverty and lack of economic opportunities. The low vulnerability classification of the majority of the households using the Briguglio method signals that there is a promising opportunity for improving resilience through more

AfJARE Vol 16 No 2 June 2021 Chishimba & Wilson
109
effective household decision-making and government policies and programmes. The ability of the Malawian people to withstand and recover from exogenous shocks could be improved through improved access to markets, not just ADMARC, but also creating an enabling environment for businesses to open shops, building/improving market infrastructure, and lowering the cost of installing electricity. Furthermore, extension or advisory services should be provided to farmers to inform and help them adapt to shocks in the future. This can be done through the provision of early warning systems for weather shocks or macroeconomic conditions, as well information on how such shocks might affect farmers. Our results complement the Malawi National Resilience Strategy for 2018 to 2030 (Government of Malawi 2018), which, among other strategies, has identified increased market development, the promotion of climate-smart agriculture and increased agricultural diversification as factors to contribute to resilient agricultural growth. In the sample utilised in this analysis, only 6% of the households had access to electricity. Yet electric power proved to be a significant, positive explanatory factor contributing to food security and resilience. In this analysis, electricity serves as a proxy for distance from population centres, access to ADMARC outlets, and availability of potable water. The importance of public infrastructure should not be diminished as a contributor to household resilience in Malawi and, most probably, other lower-income nations. The quantity and quality of household income sources are critical for Malawian households, as this econometric finding has also been proven in other risk management studies in Malawi, Africa and beyond. First, farming more hectares of corn on your own land mitigates the possibility that the household will experience hunger. Second, non-agricultural income diversification appears to be an important strategy. Although ganyu income can be part of the portfolio of management strategies and a source of additional income for agricultural households, it is not sufficient for building household resilience. Therefore, households should consider other diversification strategies, such as income generation in cottage industries, manufacturing, services and government employment, in order to build their resilience. Finally, literate families exhibit higher levels of resilience than households with low levels of education. Literacy opens up employment opportunities beyond the farm and local community. Private and public programmes to improve literacy and general education levels could contribute significantly to the development of a more resilient population. Acknowledgements The authors wish to thank Mark Langworthy and Gary Thompson, for their helpful comments on an earlier version of this paper. Special thanks to the leadership of TANGO International, for their encouragement and sharing of data associated with this research project. References Abson DJ, Fraser ED & Benton TG, 2013. Landscape diversity and the resilience of agricultural
returns: A portfolio analysis of land-use patterns and economic returns from lowland agriculture. Agriculture & Food Security 2: Article #2.
Ado AM, Savadogo P & Abdoul-Azize HT, 2019. Livelihood strategies and household resilience to food insecurity: Insight from a farming community in Aguie district of Niger. Agriculture and Human Values 36(4): 747–61.
Anderson JR, Dillon JL & Hardaker B, 1977. Agricultural decision analysis. Ames, Iowa: Iowa State University Press.
Barry PJ (ed.), 1984. Risk management in agriculture. Ames, Iowa: Iowa State University Press.

AfJARE Vol 16 No 2 June 2021 Chishimba & Wilson
110
Bernier Q & Meinzen-Dick RS, 2014. Networks for resilience: The role of social capital. Food Policy Report, International Food Policy Research Institute (IFPRI), Washington DC. http://dx.doi.org/10.2499/9780896295674
Briguglio L, Cordina G, Farrugia N & Vella S, 2009. Economic vulnerability and resilience: Concepts and measurements. Oxford Development Studies 37(3): 229–47.
Bryan E, Ringler C, Okoba B, Roncoli C, Silvestri S & Herrero M, 2013. Adapting agriculture to climate change in Kenya: Household strategies and determinants. Journal of Environmental Management 114: 26–35.
Chia-Yun T, Wilson PN & Rahman T, 2015. Economic resilience and vulnerability in the rural West. Department Working Paper 2015-01, Department of Agricultural and Resource Economics, University of Arizona. Available at https://ageconsearch.umn.edu/record/202969
Chuku CA & Okoye C, 2009. Increasing resilience and reducing vulnerability in sub-Saharan African agriculture: Strategies for risk coping and management. African Journal of Agricultural Research 4(11): 1524–35.
Coutu DL, 2002. How resilience works. Harvard Business Review 80(5): 46–56. Daressa TT, Hassan RM, Ringler C, Alemu T & Yesuf M, 2009. Determinants of farmers’ choice of
adaptation methods to climate change in the Nile Basin of Ethiopia. Global Environmental Change 19(2): 248–255.
Darnhofer I, 2014. Resilience and why it matters for farm management. European Review of Agricultural Economics 41(3): 461–84.
Ecker O & Qaim M, 2011. Analyzing nutritional impacts of policies: an empirical study for Malawi. World Development 39(3): 412–28.
Ellis F, 2000. The determinants of rural livelihood diversification in developing countries. Journal of Agricultural Economics 51(2): 289–302.
Food and Agriculture Organization (FAO), 2017. FAO Malawi Country Programme Framework (CPF) 2014–2017. Available at http://www.fao.org/3/a-bp619e.pdf (Accessed 18 December 2017).
Food and Agriculture Organization, 2018. Malawi. Available at http://www.fao.org/faostat/en/#country/130 (Accessed 9 February 2018).
Government of Malawi, 2018. National Resilience Strategy (2018-2030). Available at https://www.usaid.gov/sites/default/files/documents/1860/Malawi_National_Resilience_Strategy.pdf (Accessed 17 May 2021).
Haile D, Seyoum A & Azmeraw A, 2021. Does building the resilience of rural households reduce multidimensional poverty? Analysis of panel data in Ethiopia. Scientific African e00788. https://doi.org/10.1016/j.sciaf.2021.e00788
Heltberg R, Hossain N, Reva A & Turk C, 2013. Coping and resilience during the food, fuel, and financial crises. The Journal of Development Studies 49(5): 705–18.
Hoddinott J, 2006. Shocks and their consequences across and within households in rural Zimbabwe. The Journal of Development Studies 42(2): 301–21.
Hosmer DW & Lemeshow S, 2000. Applied logistic regression. New York: Wiley Interscience Publication.
International Monetary Fund [IMF] 2012. IMF Country Report No. 12/221: Malawi. Washington DC: IMF. Available at https://www.imf.org/external/pubs/ft/scr/2012/cr12221.pdf (Accessed 9 February 2018).
Malawi Department of Climate Change and Meteorological Services, 2018. Climate of Malawi. Available at https://www.metmalawi.com/climate/climate.php (Accessed 9 February 2018).
Malawi National Statistical Office (NSO), 2013. Methodology for poverty analysis in Malawi in 2010–2013. Lilongwe, Malawi: NSO.
McDonald T, Florax R & Marshall MI, 2014. Informal and formal financial resources and small business resilience to disasters. Paper read at the Agricultural and Applied Economics Association (AAEA) Annual Meeting, 27–29 July, Minneapolis, Minnesota.

AfJARE Vol 16 No 2 June 2021 Chishimba & Wilson
111
Murendo C, Kairezi G & Mazvimavi K, 2020. Resilience capacities and household nutrition in the presence of shocks. Evidence from Malawi. World Development Perspectives 20: 100241. https://doi.org/10.1016/j.wdp.2020.100241
Mutabazi KD, Amjath-Babu TS & Sieber S, 2015. Influence of livelihood resources on adaptive strategies to enhance climatic resilience of farm households in Morogoro, Tanzania: An indicator-based analysis. Regional Environmental Change 15(7): 1259–68.
Mwangi M & Kariuki S, 2015. Factors determining adoption of new agricultural technology by smallholder farmers in developing countries. Journal of Economics and Sustainable Development 6(5): 208–16.
Park J, Seager TP, Rao PSC, Convertino M & Linkov I, 2013. Integrating risk and resilience approaches to catastrophe management in engineering systems. Risk Analysis 33(3): 356–67.
Patrick GR, Wilson PN, Barry PJ, Boggess WG & Young DL, 1985. Risk perceptions and management responses: Producer-generated hypotheses for risk modeling. Journal of Agricultural and Applied Economics 17(2): 231–8.
Reliefweb, 2012. Malawi: Food insecurity – 2012–2014. Available at https://reliefweb.int/disaster/ot-2012-000156-mwi (Accessed 9 February 2018).
Seo SN, 2010. Is an integrated farm more resilient against climate change? A micro-econometric analysis of portfolio diversification in African agriculture. Food Policy 35(1): 32–40.
Smith LC & Frankenberger TR, 2018. Does resilience capacity reduce the negative impact of shocks on household food security? Evidence from the 2014 floods in Northern Bangladesh. World Development 102: 358–76.
Torrico JC & Janssens MJ, 2010. Rapid assessment methods of resilience for natural and agricultural systems. Anais da Academia Brasileira de Ciências 82(4): 1095–105.
Transparency International 2017. Corruption perceptions index 2017. Available at https://www.transparency.org/news/feature/corruption_perceptions_index_2017 (Accessed 18 December 2017).
UNDP 2016. Human Development Report 2016: Human development for everyone. Available at http://hdr.undp.org/sites/default/files/2016_human_development_report.pdf (Accessed 18 December 2017).
Upton JB, Cissé JD & Barrett CB, 2016. Food security as resilience: Reconciling definition and measurement. Agricultural Economics 47(S1): 135–47.
USAID, 2021. Working in crises and conflict. Available at https://www.usaid.gov/malawi/working-crises-and-conflict
Wilson PN, 2014. Malawian agriculture: The commercialization challenge. Working paper 2014-3, Department of Agricultural and Resource Economics, University of Arizona. Available at https://ageconsearch.umn.edu/record/281278