Residues of veterinary drugs and coccidiostats in eggs and ...
80
Residues of veterinary drugs in eggs and possible explanations for their distribution between egg white and yolk Cornelis Adriaan Kan 2003
Transcript of Residues of veterinary drugs and coccidiostats in eggs and ...

Residues of veterinary drugs in eggs and possible explanations
for their distribution between egg white and yolk
Cornelis Adriaan Kan
2003

Residues of veterinary drugs in eggs and possible explanations for their distribution between
egg white and yolk
Dem Fachbereich Chemie der Bergischen Universität Wuppertal zur
Erlangung des Grades eines Doktors der Naturwissenschaften
- Dr. rer. nat. -
vorgelegte Dissertation
von
Cornelis Adriaan Kan
2003

The work described in this thesis was carried out at the former Spelderholt Centre for
Poultry Research and Extension, Beekbergen, The Netherlands between 1990 and
1996.
Professor Dr. Michael Petz, Faculty of Chemistry, Department of Food Chemistry,
Bergische Universität Wuppertal, Germany, provided the scientific guidance to this
project.
Referee: Prof. Dr. M. Petz
Co-referee: Prof. Dr. H. Guth
Acknowledgements Thanks are due to Jorg Jacobs and Roelof Rump for the analytical work involved in
this research project.
The staff of the housing department of the Spelderholt Institute for Poultry Research
expertly took care of the laying hens and collected the eggs.
My different bosses over the years � Abel Kuit, Roel Mulder, Lisette Brink, Sierk
Spoelstra, Berthold Janszen, Ad van Vuuren � all stimulated me to finalize this
project.
Parts of the work described in this thesis have already been published in:
Kan, C.A., Jacobs, J.G.& Petz, M.: The distribution of different sulfonamides between
dichloromethane/water at different pH values and between egg white and yolk
after oral administration to laying hens. Proceedings EURORESIDUE III, N.
Haagsma & A. Ruiter eds., 582-585 (1996)
Kan, C.A. & Petz, M. Residues of veterinary drugs in eggs and their distribution
between yolk and white. Journal of Agricutural and Food Chemistry, 48, 6397-
6403 (2000)

Contents
CONTENTS Page 0. ABSTRACT................................................................................................ 5 1. INTRODUCTION........................................................................................ 6
1.1 Formation and composition of the egg ................................................. 7
1.2 Formation of ....................................................................................... 10
1.2.1 Yolk .................................................................................... 10
1.2.2 Egg white............................................................................ 13
1.2.3 Shell membrane and shell .................................................. 13
1.3 Residues in egg white and yolk.......................................................... 14
1.4 Available data on drug levels in egg white and yolk ........................... 15
1.5 General observations on the distribution data.................................... 15
1.6 Possible explanations ........................................................................ 16
1.6.1 Lipid solubility ..................................................................... 17
1.6.2 Partitioning between phases with different pH.................... 17
1.6.3 Protein binding.................................................................... 18
1.6.4 Other .................................................................................. 18
1.6.5 Other remarkable points ..................................................... 19
1.7 Conclusions........................................................................................ 20
1.8 Literature data on drug residues in white and yolk (Table 1).............. 21
2. EXPERIMENTAL PART
2.1 Introduction ........................................................................................ 31
2.2 Materials and methods....................................................................... 33
2.2.1 Determination of partitioning coefficients............................ 33
2.3 Analysis of sulfonamides.................................................................... 34
2.3.1 Sulfonamide standards ........................................................... 34
2.3.2 Chemicals................................................................................ 34
2.3.3 Solutions............................................................................. 35
2.3.4 Apparatus................................................................................ 37
2.3.5 Usables ................................................................................... 38
2.3.6 Sample preparation................................................................. 38
2.3.7 Recovery measurements........................................................ 39
3

Contents
2.3.8 HPLC-conditions ..................................................................... 40
2.3.9 Ultrafiltration ....................................................................... 41
2.4 Animal experiments............................................................................ 42
2.5 Technical results
2.5.1 Chemical analysis............................................................... 44
2.5.1.1 Chromatographic conditions ................................. 44
2.5.1.2 Linearity of the response....................................... 48
2.5.1.3 Recovery percentages .......................................... 48
2.5.2 Laboratory tests ...................................................................... 49
2.5.2.1 Partitioning coefficient .......................................... 49
2.5.3 Animal trials............................................................................. 52
2.5.3.1 Contents in yolk and egg white (Trial 1) ................... 52
2.5.3.2 Contents in white and yolk (Trial 2)..........................54
2.5.3.3 Protein/macromolecular binding...............................56 3. RESULTS AND DISCUSSION
3.1 Introduction ........................................................................................ 57
3.2 Parameters studied ............................................................................ 58
3.2.1 Lipid solubility and partitioning coefficient in relation to white/yolk
ratio.......................................................................................... 58
3.2.2 pKa value and white/yolk ratio ................................................ 59
3.2.3 Protein/macromolecular binding and white/yolk ratio ............61
3.3 Other (unexplained) observations........................................................... 62
3.4 Some points still to be tackled............................................................ 63
3.5 Overall conclusions ................................................................................64
4. ANNEXES................................................................................................ 65 5. REFERENCES......................................................................................... 71
4

Abstract
0. ABSTRACT Veterinary drugs are therapeutically used for laying hens but may also reach them
unintentionally via the feed e.g. as a result of cross-contamination during premix
manufacture, feed preparation in the feed mill or during feed transport.
When these compounds reach the bloodstream, they will occur in the ovary with
growing follicles and the oviduct, where the egg white is formed and secreted. The
deposition of drugs in either yolk or white or both phases determines where one
should look for residues.
Three reasons might rule the distribution of drugs between egg yolk and egg white:
lipid solubility as fat soluble compounds generally occur in yolk, pKa value as ionised
molecules will distribute in a certain way between phases with different pH values
such as yolk and white or protein binding to egg white proteins.
An extensive survey of available literature data on residues in egg yolk and white
after administration to laying hens was made. The data on the distribution of residues
between yolk and white differ considerably between drugs, but show remarkable
resemblance for data on a given drug. All data on sulfonamides as well as on
tetracyclines were considered carefully for any relationship between physicochemical
characteristics and residue data in yolk and white. The lipid solubility hypothesis was
certainly not supported by the available data including own previous experiments.
All three explanations have also been tested in two animal experiments in which
several sulfonamides differing in lipid solubility, pKa value and protein binding were
administered to laying hens via the feed during 14 days and the levels in both yolk
and egg white measured.
None of the three reasons could satisfactorily explain the ratio of the sulfonamide
residues in egg white and yolk found in these experiments.
The conclusion therefore is that � at least for the sulfonamides tested � egg yolk and
egg white are not two phases separated by a semi-permeable membrane and in
some way in equilibrium with each other.
Rather, two independent physiological processes in the laying hen govern the
deposition of residues of the sulfonamides in egg yolk and egg white.
5

Chapter 1
1. INTRODUCTION Veterinary drugs are therapeutically used for laying hens, generally by mass
application via water or feed in order to combat occurring diseases. Drugs or
coccidiostats may also reach them unintentionally via the feed e.g. as a result of
cross-contamination during premix manufacture, feed preparation in the feed mill or
during feed transport.
Some of the drugs are designed to work systemically; thus they must cross the
intestinal wall in order to exert their function. Other drugs � and certainly those that
combat endoparasites such as coccidiostats � should exert their action within the
gastro-intestinal tract but they are nevertheless (partly) absorbed. This absorption is
quite logical as both veterinary drugs and coccidiostats possess certain lipophilic
properties in order to interact with and pass through membranes. These lipophilic
properties are a prerequisite to reach target organs or cells and to fulfil their task of
eliminating micro-organisms, coccidia or other endoparasites.
When these compounds reach the bloodstream, they will be distributed over the
whole body. In the laying hen this includes also the ovary with growing follicles and
the oviduct, where the egg white is formed and secreted. The amount of the
compounds or its metabolites in each tissue depends on their characteristics, such
as differences in rate of metabolism or lipid solubility.
Knowledge about the deposition of drugs in either yolk or white or both is required for
at least three reasons:
1. To know whether either the white or the yolk might still be safe for human
consumption in case residues are found in whole egg
2. To know whether yolk or white or both should be sampled to correctly assess the
residue content of whole eggs
3. To develop drugs with special properties to target specifically either yolk or white
if required.
6

Chapter 1
1.1 Formation and composition of the egg The main components of the avian egg are: egg shell, white and yolk. Figure 1 gives
a schematic drawing of the egg and its components.
The follicles � later becoming the yolks - grow on the ovary and after ovulation the
free ovum is picked up by the infundibulum (Figure 2) of the oviduct and then
transported towards the albumen secreting region or magnum (Figures 2 and 3).
Figure 1: Components of the egg (Gilbert 1971a)
7

Chapter 1
Figure 2: The reproductive tract of the hen (Nesheim et al., 1971)
Figure 3: Processes occurring during egg formation (Gilbert 1971b)
8

Chapter 1
Via the isthmus, where the membranes are formed, the �egg� then enters the shell
gland or �uterus�. There, fluid and minerals are added during the plumping process to
the egg white and the shell is formed. Then the �ready-to-lay� egg is transported via
the vagina and through the cloaca (Figure 2), and the egg is laid. The time frame of
the whole process is outlined in Figure 4.
Figure 4: Time schedule of egg formation (Gilbert 1971a)
9

Chapter 1
1.2 Formation of
1.2.1 Follicles or Yolk
Yolk components (pre-dominantly lipoproteins) are formed in the liver and
transported via the blood to the ovary. The ovary of hens in active production
(Figure 2 and 8) contains three types of follicles where the yolk can be deposited:
1. Very small ones, in the slow phase of development which can take months or
even years. These are also called the white follicles as no (coloured)
carotenoids are deposited there.
2. Those in the intermediate phase of growth (lasting some 60 days)
3. Follicles in the rapid growth phase which lasts approximately 10 days. The
follicle weight increases during this time from some 1 gram to about 20 grams
and deposition occurs in concentric layers one after each other (Figures 5, 6
and 7).
Figure 5: Growth curve of the follicles (Gilbert 1972)
10

Chapter 1
Figure 6: Yolk deposition schematically
Figure 7: Yolk deposition as pictured by MRI (Donoghue and Myers, 2000)
11

Chapter 1
As one follicle ovulates approximately every 24 hours, roughly ten follicles are
present in different stages of the rapid growth. Figure 8 (Donoghue and Myers, 2000)
shows the ovary with follicles as can be found in hens in active production and the
separate yolks.
Figure 8: Ovary and separate yolks (Donoghue and Myers, 2000)
It is not well known, whether yolk material deposition carries on right until the
moment of ovulation or that one day elapses between last deposition of yolk material
and ovulation.
The physiological and endocrinological processes probably taking place before
ovulation are schematically shown in Figure 9.
12

Chapter 1
Figure 9: Time schedule of ovulation (Gilbert 1971a) LH = Luteinizing Hormone; FSH = Follicle Stimulating Hormone
A more detailed description of the total physiology of egg formation and laying
can be found in various textbooks on poultry physiology e.g. Bell & Freeman
(1971)
1.2.2 Egg white
The (water-soluble) proteins are formed in and secreted by one part of the oviduct
called the magnum. Formation of the proteins takes 1-2 days and deposition of
egg white around the yolk at some 2-3 hours after ovulation (Figure 3)
1.2.3 Shell membrane and shell
Shell membranes are formed at some 3-4 hours after ovulation (Figure 4) and
finally addition of water and salts (�plumping�) (Figures 2 and 3) and the
deposition of the (calciumcarbonate) eggshell (Figures 1 and 4) takes place in
about 18-20 hours (Bell & Freeman, 1971).
The time schedule as outlined in Figure 4 has been deducted many years ago
when egg production was much lower than presently achieved by high productive
13

Chapter 1
hens. Therefore, it is not certain that at present this time schedule is still totally
accurate.
1.3 Residues in egg white and yolk
Due to the physiological processes described above, the pharmacokinetics of drug
residues in yolk and egg white show the following features:
1. Residues of drugs appear first in egg white, at least when the drug is distributed
towards that compartment (Donoghue et al., 2000).
2. Residues in egg white are a reflection of drug plasma levels and will therefore
show a constant level over time when plasma levels do. The time needed to
achieve a constant drug level in egg white is generally 2-3 days.
3. Residues in yolk reflect the plasma drug levels during the ten days of their rapid
growth. Thus depending on the length and time of exposure to the drug relative to
yolk growth, drug levels in yolk � when measured during a number of consecutive
days -can increase, be constant or decrease.
4. Residues of drugs in yolk generally require exposure for about 8 - 10 days to
reach a constant level.
5. A single exposure towards a drug might be sufficient to detect the drug in either
egg white or yolk (Donoghue et al., 1998), depending on the characteristics of the
drug and the sensitivity of the analytical method used.
6. Disappearance of drugs from white and yolk depends heavily on the plasma
levels of the drug tested. Drugs that clear rapidly from the body also disappear
from egg white in about 2-3 days after cessation of exposure. Disappearance of
drugs from yolk generally takes about 10 days. By that time, drug-containing
lipoproteins deposited during the rapid growth phase of the yolk have been
excreted with the eggs.
7. However, if the exposure level is very high and the detection limit for the drug
involved is very low, then residues deposited in the yolks, which are in the
intermediate stage of growth, will also be detectable. This can explain the
observation, that Arnold & Somogyi (1986) found chloramphenicol residues in
eggs until 70 days after administration.
14
Chapter 1
8. On the other hand, if the limit of detection of the method is similar to the drug
residue levels in the egg, residues may not be detected at all or only during a very
short time period.
Microbiological methods, which measure the unbound fraction of antimicrobial
drugs only, may for that reason indicate lower residue levels than methods �
such as those using HPLC - which measure also the amount absorbed to protein
as the organic solvent used to extract the drug, generally breaks up this type of
binding.
Both Anhalt (1977) and Hafez (1991) consider the egg yolk to be the main
compartment of eggs to be taken into account when considering drug residues. This
in contrast to the observations of Blom (1975) � quoted by both authors � who
reported much higher residues of some sulfonamides in egg white than in egg yolk.
Recently Donoghue et al. (2000) showed that transfer of drugs � or at least
oxytetracycline � into egg white also occurs during the plumping phase. This had
been anticipated to be found, as we observed several times, that drugs administered
to the hens in the afternoon led to residues in the eggs laid the next day. This could
only occur if transfer of the drug into the white during the plumping phase happened.
In addition Furusawa (1999) detected the presence of spiramycine, oxytetracycline
and sulfamonomethoxine in both the isthmus and magnum part of the oviduct.
1.4 Available data on drug levels in egg white and yolk
The data found in the literature from experiments where exposure was sufficiently
long to expect a constant residue level in egg white and yolk and from own studies
that have not been published are summarised in Table 1. They sometimes are
(educated) guesses from either graphs or tables made on steady state levels and
may deviate from the data in the original papers.
1.5 General observations on the distribution data
Sulfonamides show appreciable levels in both egg white and yolk and levels in egg
white are at least equal to those in yolk, but often they are (much) higher.
15

Chapter 1
Tetracyclines as a group show a more divergent picture. Remarkably some very
lipophilic ones (doxycycline and minocycline) show higher levels in egg white than in
(the fat rich) yolk. On the contrary the more water soluble oxytetracycline and
chlortetracycline show similar levels in white and yolk.
The quinolones flumequine, oxolinic acid and enrofloxacine also show much higher
residues in egg white than in yolk.
Many other substances such as macrolides and nitrofurans show diverging patterns
of distribution, but in all instances, levels in egg white are substantial.
Some compounds like trimethoprim, pyrimethamine, amprolium, nicarbazine,
decoquinate, dinitolmide, and ivermectin occur almost exclusively in yolk and show
very low levels in egg white.
1.6 Possible explanations
The physicochemical properties of drugs largely determine their pharmacokinetics.
Martinez (1998) in a review mentions the following factors influencing drug kinetics in
animals:
• molecular weight: too bulky molecules not being able to cross membranes,
• lipid solubility as measured by the octanol/water partition coefficient
• pKa value, which determines whether a molecule is ionised at a certain pH, as
according to some theories only unionised compounds would penetrate biological
membranes.
• protein binding to plasma proteins as it determines availability to other
compartments,
Hafez (1991) in his review makes a distinction between drug factors, bird factors and
analytical method factors. Drug factors deal with metabolism that includes
absorption, distribution, biotransformation and excretion. The bird factor focuses on
the yolk as the drug-containing compartment of eggs and pays little attention to
residues in egg white. Regarding analytical factors he emphasises variation in
sensitivity within substances between methods and between substances within
methods. The possibility of false positive results, both in microbiological and chemical
methods, due to natural substances or contamination after sampling is also
mentioned.
16

Chapter 1
Anhalt (1977) largely concentrates on yolk deposition processes in relation to drug
residues in eggs and treats the possibility of residues in egg white as a minor issue.
1.6.1 Lipid solubility
Lipid solubility of the drug certainly influences its deposition in the (fat rich)
yolk (Blom, 1975) but higher residues of (the lipophilic) doxycycline in egg
white than in yolk (Table 1) can not be explained in this way. Nevertheless
Furusawa (1999) states � The drugs having the property of lipid-solubility are
found in much higher levels in egg yolk than in albumen, whereas those
having water-solubility are found in higher concentrations in albumen than in
egg yolk�. However, he also admits (Furusawa personal communication, 2000)
that it can not be the only determining factor.
Gorla et al. (1997) consider the possibility that differences in lipid solubility due
to a different chemical structure may alter intracellular penetration and thus
explain the patterns of distribution they observed for enrofloxacine end
ciprofloxacine between yolk and egg white. As ciprofloxacine is a metabolite of
enrofloxacine (and thus generally better water-soluble) their observation that
ciprofloxacine is predominantly present in yolk, does not concur with this
explanation.
1.6.2 Partitioning between phases with different pH
The pH of yolk is around 6.0 when the egg is just laid and that of egg white at
that time is 7.6. Distribution of drugs between compartments with different pH
values according to their pKa values has been established for a number of
different combinations of compartments. Distribution of drugs between plasma
and gastric juice was e.g. explained by Shore et al. (1957), distribution
between plasma and cerebrospinal fluid by Rall et al. (1959) and intestinal
absorption of drugs by Hogben et al. (1959). Schanker et al. (1964)
established it for passage of drugs into red cells and Atkinson and Begg
(1990) predicted in this way the distribution of drugs between plasma and milk.
Blom (1975) compared distribution of three sulfonamides between plasma and
egg white with the pKa values of those drugs and could not draw an
unambiguous conclusion whether or not this hypothesis should be accepted.
17

Chapter 1
1.6.3 Protein binding
Roudaut (1998) considered protein binding to be a possible explanation for the
observed distribution of oxolinic acid between egg white and yolk. Gorla et
al.(1997) considered the same possibility for the related compounds
enrofloxacine and ciprofloxacine.
Blom (1975) measured protein binding of three sulfonamides and
pyrimethamine in plasma and egg white both in vitro and in vivo. Sulfadimidine
had the lowest binding percentage (some 10 %) and sulfaquinoxaline the
highest (some 50 % in egg white). The ratio of residues in egg white and yolk
did however not differ in the same way in that study (Table 1). Furusawa
(Personal communication, 2000) considers protein binding and especially the
rate of binding and the amount of binding material of major importance for
distribution of a drug within body or egg.
As to binding of drugs to yolk or to yolk macromolecules, Blom (1975) testing
sulfonamides and Kan and Rump (unpublished observations on tetracyclines)
were not able to find a satisfactory methodology.
1.6.4 Other
Riberzani et al. (1993) suggested that the much higher levels of flumequine in
egg white than in yolk might be caused by the high solubility of the �acid� drug
flumequine in the basic matrix egg white. Roudaut (1998) studying the related
compound oxolinic acid also considered this a possibility to explain higher
levels of both oxolinic acid and sulfadimidine in egg white than in yolk.
Diffusion from yolk to white during storage as suggested by Geertsma et al.
(1987), was ruled out by Roudaut (1998) as eggs where separated
immediately after laying. We also compared (Kan and Rump, unpublished
observations) the distribution of doxycycline in eggs in experiments with direct
separation of egg white and yolk to experiments with prolonged storage of
whole eggs and found no differences in distribution patterns. Exchange of
drugs between yolk and egg white during egg formation � especially during the
18 hours of shell deposition at a body temperature of 41 0C � can however not
be ruled out. In line with this option, Gorla et al. (1997) consider diffusion a
possibility to explain the observed distribution of enrofloxacine between yolk
and egg white
18

Chapter 1
Botsoglou et al. (1989) ascribe the different distribution of furazolidone
between yolk and egg white to the dissimilarity in their mode of formation in
respect to the time frame: this time of formation being much longer for yolk
than for egg white. This explanation might be true for drugs like furazolidone
showing higher levels in yolk, but it can not explain how levels of certain drugs
in egg white can be higher than their levels in yolk.
1.6.5 Other remarkable points
Roudaut and Boisseau (1990) could detect residues of oxolinic acid in egg
white much longer than in plasma and somewhat longer than in yolk. This is
not compatible with the theory mentioned above (Paragraph 1.3) that the
levels in egg white are a reflection of levels in plasma. Also the general rule
that residues are detectable longer in yolk than in white is not followed here.
Van Leeuwen and van Gend (1989) observed that levels of the related
compound flumequine also persisted longer in egg white than in yolk. The
results of these two studies suggest that quinolones might have special
characteristics in combination with egg white (proteins).
Furusawa (1999) observed that levels of spiramycine are quite high in the
oviduct and suggests that this �storage� might be the reason for the longer
presence of spiramycine in egg white than in yolk (Yoshida et al., 1971;
Roudaut and Moretain, 1990). He also found that levels of spiramycine,
oxytetracycline and sulfamonomethoxine in albumen and oviduct tissue were
higher than those in blood.
The difference in distribution ratios between the ionophore type coccidiostats
narasin and salinomycine is also striking. These two compounds differ only by
one - uncharged - methyl group in a rather large and complicated molecule but
evidently this difference is sufficient to result in a substantial difference in
distribution (Table 1) between egg white and yolk.
19

Chapter 1
1.7 Conclusions
Drug residues will appear in both egg white and yolk after intentional or unintentional
administration to laying hens. Bacitracine (Furusawa 2001) might be an exception to
this rule. Intestinal absorption of the drug is a pre-requisite for residue formation, as
transport via blood (plasma) is responsible for deposition of drugs in follicles on the
ovary or in egg white in the oviduct. Physicochemical properties of the drugs and the
physiology of the hen and physiology of egg formation will determine how much drug
will be deposited and at what place. At present we cannot explain or predict from
variables measurable in vitro what will happen in vivo.
20

1.8 Table 1: Literature data on drug residues in white and yolk Compound name pKa value Content in
white in mg /kg
Content in yolk in mg/kg
Ratio white/yolk
Exposure way Author
Sulfonamides
Sulfanilamide 10.5 35 43 0.8 1000 mg/l in water 8 days Blom (1975)
Sulfadiazine 6.5 0.22 0.14 1.6 200 mg/l in water 5 days Atta et al. (2001)
0.32 0.18 1.8 400 mg/l in water 5 days Atta et al. (2001)
0.015 < 0.008 > 1.8 1.3 mg/kg in feed 21 days Tomassen et al. (1996b)
0.04 < 0.008 > 5 3.8 mg/kg in feed 21 days Tomassen et al. (1996b)
0.10 0.022 4.5 8.1 mg/kg in feed 21 days Tomassen et al. (1996b)
Sulfadimethoxine 6.3 4.6 1.7 2.7 400 mg/kg feed 5 days Furusawa et al. (1994)
8.2 1.6 5 500 mg/kg feed 14 days Furusawa (2001)
3.0 1.5 2 0.02 % in rofenaid feed C 14, 14 days Laurencot et al. (1972)
0.15 0.05 3 25 mg/kg in feed 21 days Nagata et al. (1989)
0.25 0.1 2.5 50 mg/kg in feed 21 days Nagata et al. (1989)
0.5 0.2 2.5 100 mg/kg in feed 21 days Nagata et al. (1989)
0.04 0.02 2 10 mg/kg in feed 14 days Nagata et al. (1992)
0.04 0.01 4 10 mg/kg in feed 14 days Nagata et al. (1992)
35 12 2.9 2000 mg/kg in feed 25 days Onodera et al. (1970)
35 9 3.9 500 mg/l in water 5 days Roudaut (1993)
21

Chapter 1
Compound name pKa value Content in white in mg /kg
Content in yolk in mg/kg
Ratio white/yolk
Exposure way Author
Sulfadimidine 7.5 56 45 1.2 1000 mg/l in water 8 days Blom (1975)
97 83 1.2 2000 mg/l in water 8 days Blom (1975)
20 5 4 5 x 100 mg/kg BW in 5 days Geertsma et al. (1987)
19 19 10 500 mg/kg feed 14 days Furusawa (2001)
70 30 2.3 1000 mg/l in water 5 days Krieg (1966)
51 34 1.5 1000 mg/l in water 5 days Roudaut (1993)
50 34 1.5 1000 mg/l in water 5 days Roudaut and Garnier (2002)
70 45 1.6 2000 mg/l in water 5 days Roudaut and Garnier (2002)
38 23 1.7 1500 mg/kg in feed 5 days Seib (1991)
Sulfamerazine 7.0 23 6 3.8 2000 mg/kg in feed 25 days Onodera et al. (1970)
Sulfamethoxazole 20 1.8 11 2000 mg/kg in feed 5 days Oikawa et al. (1977)
39 2.9 14 4000 mg/kg in feed 5 days Oikawa et al. (1977)
Sulfamonomethoxine 6.0 6.8 1.5 4.5 400 mg/kg in feed 5 days Furusawa and Mukai (1995)
5.2 1.1 4.9 400 mg/kg in feed 7 days Furusawa (1999)
10.5 2.8 3.8 500 mg/kg feed 14 days Furusawa (2001)
0.20 0.04 5 25 mg/kg in feed 21 days Nagata et al. (1989)
0.35 0.07 5 50 mg/kg in feed 21 days Nagata et al. (1989)
1.0 0.2 5 100 mg/kg in feed 21 days Nagata et al. (1989)
21 5 4 2000 mg/kg in feed 25 days Onodera et al. (1970)
22

Chapter 1
Compound name pKa value Content in white in mg /kg
Content in yolk in mg/kg
Ratio white/yolk
Exposure way Author
Sulfaquinoxaline 5.5 50 36 1.4 400 mg/l in water 8 days Blom (1975)
2.3 2.0 1.2 200 mg/kg in feed 7 days Furusawa et al. (1998)
0.95 1.6 0.6 60 mg/kg in feed 14 days Nose et al. (1982)
3.7 1.4 2.6 100 mg/kg in feed 7 days Petz (1993)
80 20 4 350 mg/l water 3 days Rana et al. (1993)
3.4 2.9 1.2 500 mg/kg in feed 12 days (intermittent) Righter et al. (1970)
8 2 4 400 mg/l water 3 days Romvary and Simon (1992)
8.3 2 4.2 6000 mg/l in water Sakano et al. (1981)
Folic acid antagonists
Ormetoprim 0.44 5.5 0.08 500 mg/kg feed 14 days Furusawa (2001)
0.25 3.5 0.07 0.02 % in feed C14, 14 days Laurencot et al. (1972)
Trimethoprim 6.6 0.24 0.43 0.6 200 mg/l in water 5 days Atta et al. (2001)
0.43 0.8 0.5 400 mg/l in water 5 days Atta et al. (2001
<0.02 0.05 < 0.4 4 mg/kg in feed 19 days Nagata et al. (1991)
0.02 0.25 0.08 16 mg/kg in feed 19 days Nagata et al. (1991)
0.07 0.9 0.08 56 mg/kg in feed 19 days Nagata et al. (1991)
Pyrimethamine 7.0 2 88 0.02 100 mg/l in water 8 days Blom (1975)
<0.01 0.03 < 0.3 0.1 mg/kg in feed 21 days Nagata et al. (1990)
23

Chapter 1
Compound name pKa value Content in white in mg /kg
Content in yolk in mg/kg
Ratio white/yolk
Exposure way Author
0.04 0.7 0.06 1 mg/kg in feed 21 days Nagata et al. (1990)
0.13 3.3 0.04 10 mg/kg in feed 21 days Nagata et al. (1990)
<0.02 0.25 < 0.08 1 mg/kg in feed 14 days Nagata et al. (1992)
Coccidiostats
Amprolium 0.4 5 0.08 500 mg/kg feed 14 days Furusawa (2001)
0.006 0.2 0.03 5 mg/kg in feed 10 days Kan et al. (1989)
0.05 1.7 0.03 250 mg/kg in feed 10 days Kan et al. (1989)
0.05 0.6 0.08 100 mg/kg in feed 14 days Nose et al. (1982)
Decoquinate 0.02 0.6 0.03 40 mg/kg in feed 14 days Nose et al. (1982)
Dinitolmide 0.15 1.6 0.09 125 mg/kg in feed 14 days Nose et al. (1982)
Meticlorpindol 5 2.5 2 110 mg/kg in feed 10 days Mattern et al. (1990)
Nicarbazine 0.3 13 0.02 500 mg/kg feed 14 days Furusawa (2001)
Other feed additives
Dimetridazole 0.002 0.002 1 0.95 mg/kg in feed 21 days Kan et al. (1995)
0.01 0.01 1 4.7 mg/kg in feed 21 days Kan et al. (1995)
0.25 0.30 0.8 3 x 50 mg/kg BW 3 days Posyniak et al. (1996)
24

Chapter 1
Compound name pKa value Content in white in mg /kg
Content in yolk in mg/kg
Ratio white/yolk
Exposure way Author
1.2 1.4 0.9 3 x 250 mg/kg BW 3 days Posyniak et al. (1996)
Olaquindox 0.002 <0.001 > 2 0.39 mg/kg in feed 21 days Keukens et al. (1996)
0.007 0.003 2.3 1.7 mg/kg in feed 21 days Keukens et al. (1996)
0.02 0.008 2.5 5.4 mg/kg in feed 21 days Keukens et al. (1996)
Tetracyclines
Chlortetracycline 3.4; 7.4;
9.3
0.1 0.4 0.25 600 mg/kg in feed 5 days Roudaut et al. (1989)
0.25 0.25 1 8000 mg/kg in feed 7 days Yoshida et al. (1973a)
Doxycycline 3.5; 7.7;
9,5
0.015 <0.01 > 1.5 1.1 mg/kg in feed 21 days Tomassen et al. (1996a)
0.08 0.04 2 6.7 mg/kg in feed 21 days Tomassen et al. (1996a)
0.15 0.07 2 11.5 mg/kg in feed 21 days Tomassen et al. (1996a)
11 3.5 3 0.5 g/l water 7 days Yoshimura et al. (1991)
Minocycline 2.8; 5.0;
7.8; 9.5
0.7 0.1 7 90 mg/l water 4 days Kan and Rump unpublished results
(1989)
Oxytetracycline 3.3; 7.3;
9.1
0.10 0.06 1.6 400 mg/kg in feed 7 days Furusawa (1999)
25

Chapter 1
Compound name pKa value Content in white in mg /kg
Content in yolk in mg/kg
Ratio white/yolk
Exposure way Author
0.21 0.25 0.8 500 mg/kg feed 14 days Furusawa (2001)
1.9 2.9 0.7 2 g/l water 7 days Nagy et al. (1997)
<0.05 0.2 < 0.2 400 mg/l 7 days Omija et al. (1994)
0.05 0.5 0.1 600 mg/l 7 days Omija et al. (1994)
0.25 0.6 0.4 800 mg/l 7 days Omija et al. (1994)
0.13 0.3 0.4 0.25 g/l water 5 days Roudaut et al. (1987a)
0.15 0.3 0.5 0.5 g /l water 5 days Roudaut et al. (1987a)
0.08 <0.20 > 0.4 300 mg/kg in feed 7 days Roudaut et al. (1987a)
0.17 0.5 0.3 600 mg/kg in feed 7 days Roudaut et al. (1987a)
0.6 0.5 1.2 2000 mg/kg in feed 7 days Yoshida et al. (1973b)
0.8 1.1 0.7 4000 mg/kg in feed 7 days Yoshida et al. (1973b)
0.7 1.2 0.6 0.5 g/l water 5 days Yoshimura et al. (1991)
Tetracycline 8.3; 10.2 0.11 0.5 0.2 0.25 g/l water 5 days Roudaut et al. (1989)
0.2 0.9 0.2 0.5 g/l water 5 days Roudaut et al. (1989)
0.17 0.9 0.2 300 mg/kg in feed 7 days Roudaut et al. (1989)
0.3 1.5 0.2 600 mg/kg in feed 7 days Roudaut et al. (1989)
Nitrofurans
Furazolidone 0.05 0.07 0.7 100 mg/kg in feed 28 days Botsoglou et al. ( (1989)
0.1 0.15 0.7 200 mg/kg in feed 14 days Botsoglou et al. ( (1989)
0.2 0.25 0.8 400 mg/kg in feed 14 days Botsoglou et al. ( (1989)
26

Chapter 1
Compound name pKa value Content in white in mg /kg
Content in yolk in mg/kg
Ratio white/yolk
Exposure way Author
0.22 0.37 0.6 500 mg/kg feed 14 days Furusawa (2001)
0.015 0.010 1.5 400 mg/kg in feed 7 days Krieg (1972)
0.48 0.17 2.8 400 mg/kg in feed 8 days McCracken et al. (2001)
0.4 0.5 0.8 400 mg/kg in feed 14 days Petz (1984)
Furaltadon 0.1 0.2 0.5 100 mg/kg in feed 7 days Petz (1993)
Nitrofurazone 9.28 0.25 0.4 0.6 100 mg/kg in feed 7 days Petz (1993)
Nitrofurantoine 7.2 0.1 <0.001 > 100 100 mg/kg in feed 7 days Petz (1993)
Quinolones
Flumequine 6.25 2.1 0.3 7 90 mg/l water 10 days van Leeuwen and van Gend (1989)
9 1.7 5.3 200 mg/l water 5 days Riberzani et al. (1993)
2 0.3 6.7 5 x 12 mg/kg BW 5 days oral Samaha et al. (1991)
Oxolinic acid 6.3 1.5 0.2 7.5 0.15 (0.5??) g/l water 5 days Roudaut and Boisseau (1990)
11.5 1.2 9.6 300 mg/kg in feed 5 days Roudaut (1998)
Enrofloxacine 6.2 1.1 0.3 3.7 5 mg/kg/day in water 5 days Gorla et al. (1997)
Ciprofloxacine 6.3 < 0.15 0.18 < 0.8 5 mg/kg/day in water 5 days Gorla et al. (1997)
27

Chapter 1
Compound name pKa value Content in white in mg /kg
Content in yolk in mg/kg
Ratio white/yolk
Exposure way Author
Macrolides
Erythromycine 8.7 0.04 IU/g 0.12 IU/g 0.3 0.22 g/l water 5 days Roudaut and Moretain (1990)
0.1 IU/g 0.3 IU/g 0.3 0.5 g/l water 5 days Roudaut and Moretain (1990)
0.03 IU/g 0.12 IU/g 0.3 400 mg/kg in feed 7 days Roudaut and Moretain (1990)
0.47 1.54 0.3 0.5 g/l water 7 days Yoshimura et al. (1978)
Kitasamycine 6.7 0.35 0.27 1.3 0.5 g/l water 7 days Yoshimura et al. (1978)
Oleandomycine 4.6 11.4 0.4 0.5 g/l water 7 days Yoshimura et al. (1978)
Spiramycine 8.0 0.40 0.32 1.3 400 mg/kg in feed 7 days Furusawa (1999)
2.1 IU/g 4.5 IU/g 0.5 0.4 g/l water 5 days Roudaut and Moretain (1990)
0.9 IU/g 1.3 IU/g 0.7 400 mg/kg in feed 7 days Roudaut and Moretain (1990)
3 2.2 1.4 1000 mg/kg in feed 7 days Yoshida et al. (1971)
2.7 4.2 0.6 0.5 g/l water 7 days Yoshimura et al. (1978)
Tylosin 7.1 0.05 0.05 1 500 mg/kg feed 14 days Furusawa (2001)
0. 25 IU/g 0.6 IU/g 0.4 1 g/l water 5 days Roudaut and Moretain (1990)
5 5 1 8000 mg/kg in feed 7 days Yoshida et al. (1973c)
1 1 1 0.5 g/l water 7 days Yoshimura et al. (1978)
28

Chapter 1
Compound name pKa value Content in white in mg /kg
Content in yolk in mg/kg
Ratio white/yolk
Exposure way Author
Ionophores
Monensin 0.1 0.08 1.3 110 mg/kg in feed 7 days Keukens, Aerts and Kan unpublished
results (1987)
Narasin 0.25 0.8 0.3 70 mg/kg in feed 7 days Keukens, Aerts and Kan unpublished
results (1987)
Salinomycine < 0.01 1.4 < 0.007 30 mg/kg in feed 14 days Akhtar et al. (1996)
0.08 2 0.04 60 mg/kg in feed 14 days Akhtar et al. (1996)
0.1 2.8 0.04 90 mg/kg in feed 14 days Akhtar et al. (1996)
0.2 3.7 0.05 150 mg/kg in feed 14 days Akhtar et al. (1996)
0.05 1.5 0.03 60 mg/kg in feed 7 days Keukens, Aerts and Kan unpublished
results (1987)
<0.01 0.22 < 0.05 66 mg/kg in feed days Sambeth et al. (1985)
<0.01 0.4 < 0.02 60 mg/kg in feed 5 days Sinigoj-Gacnik (1996)
Anthelmintics
Flubendazole <0.02 0.04 < 0.5 2.6 mg/kg in feed 21 days Kan et al. (1998)
0.02 0.1 0.2 9.4 mg/kg in feed 21 days Kan et al. (1998)
0.03 0.3 0.1 27.0 mg/kg in feed 21 days Kan et al. (1998)
Ivermectine <0.0005 0.001 < 0.5 0.11 mg/kg in feed 21 days Van Dijk et al. (1997)
29

Chapter 1
Compound name pKa value Content in white in mg /kg
Content in yolk in mg/kg
Ratio white/yolk
Exposure way Author
<0.0005 0.005 < 0.1 0.36 mg/kg in feed 21 days Van Dijk et al. (1997)
<0.0005 0.02 < 0.02 0.76 mg/kg in feed 21 days Van Dijk et al. (1997)
Various
Ampicilline 2.5; 7.3 0.008 0.025 0.3 1.5 g/l water 5 days Roudaut et al. (1987b)
Chloramphenicol 5.5 2 10 0.2 400 mg/l water 10 days Arnold and Somogyi (1986)
0.35 2 0.17 500 mg/kg feed 14 days Furusawa (2001)
0.5 1.8 0.3 400 mg/kg in feed 14 days Petz (1984)
0.05 0.2 0.3 200 mg/kg in feed 5 days Samouris et al. (1998)
0.5 1.5 0.3 500 mg/kg in feed 5 days Samouris et al. (1998)
0.5 2.5 0.2 800 mg/kg in feed 5 days Samouris et al. (1998)
1.2 4 0.3 1000 mg/kg in feed 5 days Samouris et al. (1998)
0.15 0.2 0.8 40 mg/l water 5 days Sisodia and Dunlop (1972)
Kanamycine 7.2 < 0.5 1.5 < 0.3 4.000 mg/kg feed 7 days Yoshida et al. (1976)
<0.5 2.2 < 0.2 8.000 mg/kg feed 7 days Yoshida et al. (1976)
<0.5 4 < 0.1 16.000 mg/kg feed 7 days Yoshida et al. (1976)
30

Chapter 2
2 EXPERIMENTAL PART
2.1 Introduction
The available data from the literature - with the exception of the work of Blom (1975)
� lack a comparative approach, that should help to elucidate what physicochemical
factors determine the partitioning of drugs between egg white and yolk.
The following factors were considered of possible importance:
• Lipid solubility
• Distribution between the aqueous and organic phase (log p value)
• pKa value
• Protein binding
Therefore we ran a number of tests with a group of sulfonamides, as a possible
relationship between physicochemical characteristics and distribution within the egg
was considered more likely to be found within a group of related compounds. A
further advantage of choosing sulfonamides as model substances was their relative
stability in different matrices and easiness to carry out residue determinations. The
different sulfonamides and their structural formulas are given in Figure 10.
The following experiments were therefore planned:
1. Determination of log p values of 11 sulfonamides (Figure 10), with pKa values
ranging from 4.7 � 11.3, with both dichloromethane and cyclohexane as organic
phase against phosphate buffers of pH 6.0 and 7.6 respectively. The pH of yolk is
around 6.0 when the egg is just laid and that of egg white at that time is 7.6.
2. Administration of feeds with the 11 different sulfonamides to groups of 3 laying
hens during 3 weeks and assessment of the residues in mixed samples per group
of both yolk and egg white after about 2 weeks of administration.
3. Administration of feeds with 5 sulfonamides, diverging in physicochemical
characteristics, to groups of 5 laying hens during 3 weeks. Assessment of the
residues in mixed samples per hen of both yolk and egg white and the amount of
protein or macromolecular binding in vivo in both matrices.
31

Chapter 2
Basic sulfonamide structure
NH= SO2 NH2R
SulfaguanidineSulfanilamide
NH
NH2
RHR
Sulfapyridine
NR
Sulfadimidine
N
NR CH3
CH3
Sulfamerazine
N
NR CH3
Sulfadiazine
N
NR
Sulfadimethoxine
N
N
R
OCH3CH3O
Sulfamethoxazole
NO CH
3
R
Sulfaquinoxaline
N
NR
Sulfachloropyrazine
N
N ClR
Sulfisoxazole
NO
CH3CH3
R
Figure 10: Structural formulas of the sulfonamides examined
32

Chapter 2
2.2 Materials and methods
2.2.1 Determination of partitioning coefficients
The OECD guideline 107 was used as starting point for the determination of the
partitioning coefficients. They lead to the following requirements for the testing:
1. Testing of one substance (as pure as possible) at the time with a not too high
concentration.
2. The substance must be water soluble and stable in aqueous solutions; the
substances must not associate or dissociate or behave as a surfactant.
3. Three different concentrations of the substance or of the aqueous/organic phase
should be tested in duplicate and the equilibrium should be reached at one
constant temperature and pressure.
The partitioning coefficients were determined at both pH 6.0 (to mimic yolk pH) and
7.6 (to mimic egg white pH) of the aqueous phase and dichloromethane and
cyclohexane as the organic phase. Octanol, which is often used in these kinds of
measurements, was avoided, as the formation of hydrogen bonds between solvent
and sulfonamides, which could lead to aberrant values, was feared.
The sulfonamide buffer solutions should have had an strength of 0.3-0.4 mM, but this
could not always be achieved due to the limited solubility of the sulfonamides in
aqueous media. The solutions were prepared in a phosphate buffer saturated with
dichloromethane.
The partitioning between the aqueous and the organic phase was carried out in 25 ml
glass tubes with a screwing cap lined with teflon®. The tubes were rotated at
approximately 20 rpm during some 30 minutes. The tubes were then centrifuged at
approximately 1000 g for 15 minutes and afterwards left for equilibration for about
one hour. All processes took place at room temperature being about 23 0C.
To achieve three different concentrations of the substance as prescribed by the
above mentioned OECD guideline, amounts of 18, 12 and 6 ml aqueous buffer were
mixed with 6, 12 and 18 ml of the organic phase. The sparely water-soluble
sulfonamides sulfachloropyrazine, sulfaquinoxaline and sulfadimethoxine were mixed
in the ratios 21, 22 and 23 ml aqueous buffer and 3, 2 and 1 ml organic phase.
33

Chapter 2
2.3 Analysis of sulfonamides
The HPLC analysis of sulfonamide concentrations in the different samples was
carried out on a C 18 column with an ammonium acetate buffer/acetonitrile mixture
as eluent and UV/fluorescence detection as outlined below.
2.3.1 Sulfonamide standards
Sulfisoxazole; Sigma nr. S 6377
Sulfachloropyrazine-sodium.1 aq; Ciba-Geigy prod.standard. 90
Sulfaquinoxaline-sodium; Sigma nr. S 7382
Sulfamethoxazole; Sigma nr. S 7507
Sulfadimethoxine; Sigma nr. S 7007
Sulfadiazine; Sigma nr. S 8626
Sulfamerazine; Sigma nr. S 8867
Sulfadimidine; Sigma nr. S 6256
Sulfapyridine; Sigma nr. S 6252
Sulfanilamide; Sigma nr. S 9251
Sulfaguanidine; Sigma nr. S 8751
2.3.2 Chemicals
Acetonitrile p.a.; Merck nr. 3
Ammoniumacetate p.a.; Merck nr 1116
Acetic acid 99-100% p.a.; Baker nr. 6052
Buffer pH 7.00; Merck nr. 9477
Buffer pH 4.00; Merck nr. 9475
Citric acid monohydrate p.a.; Merck nr. 244
Dichloromethane UVASOL; Merck nr. 6048
Ethylacetate UVASOL; Merck nr.863
Methanol p.a.; Merck nr. 6009
Ortho-phosphoric acid 85 % p.a.; Merck nr. 573
Petroleum-ether boiling point 40-60 oC p.a.; Merck nr. 1775
di-Potassiumhydrogenphosphate (anhydrous) p.a.; Merck nr 5104
Sodiumdihydrogenphosphate monohydrate p.a.; Merck nr. 6346
34

Chapter 2
di-Sodiumhydrogenphosphate dihydrate p.a.; Merck nr 6580
Sodiumhydroxide pellets p.a.; Merck nr. 6498
Water (milliQ)
2.3.3 Solutions
Ammoniumacetate buffer 0.01 M pH 5.3
Dissolve 0.77 g ammoniumacetate in ca. 800 ml water. Adjust to pH 5.3 with
approximately 10 drops 100 % acetic acid measured with a pH meter. Adjust volume
to1000 ml with water and mix well.
Dichloromethane saturated with sodiumphosphatebuffer 0.10 M pH 6.0 and pH 7.6
Transfer approximately 800 ml dichloromethane into a bottle with screw cap and teflon
lining. Add approximately 100 ml sodium phosphate buffer 0.10 M pH 6.0 or pH 7.6 and
close the bottle. Mix during 24 hours on a mechanical shaker at room temperature and
let the phases separate for 24 hours at 23 0C. Take the lower layer by pipette. During
transfer of the pipette through the upper layer apply some air pressure on it, in order to
avoid the upper layer from entering the pipette.
Phosphate buffer 0.05 M pH 10
Dissolve 4.36 g di-potassiumhydrogenphosphate in approximately 400 ml water. Adjust
pH to10.0 with approximately 13 drops of 1 M sodiumhydroxide measured with a pH
meter. Adjust the volume to 500 ml with water and mix well.
Ortho-phosphoric acid 0.5 M
Add 3.4 ml ortho-phosphoric acid 85 % to approximately 50 ml water. Add water till 100
ml and mix well.
Sodiumcitratebuffer 2 M pH 4.2
Dissolve 21 g citric acid monohydrate with approximately 25 ml water and
approximately 10 ml 10 M sodiumhydroxide. Adjust pH to 4.2 with a pH meter by
adding approximately 5 ml 10 M sodiumhydroxide; make sure that the solution is at
room temperature. Add water till a volume of 50 ml and mix well.
35

Chapter 2
Sodium-di-hydrogenphosphate solution 0.10 M
Take 13.8 g sodium-di-hydrogenphosphate monohydrate. Dissolve and adjust the
volume with water till 1000 ml and mix well.
di-Sodiumhydrogenphosphate solution 0.10 M
Take 8.8 g di-sodiumhydrogenphosphate dihydrate. Dissolve and adjust the volume
with water till 1000 ml and mix well.
Sodiumphosphatebuffer 0.10 M pH 6.0 and pH 7.6
Mix the sodium-di-hydrogenphosphate solution 0.10 M and the di-
sodiumhydrogenphosphate solution 0.10 M till the desired end-pH is obtained, by
measuring with a calibrated pH-meter. To obtain pH 6.0 or pH 7.6 respectively the
mixing ratios will be approximately 85:15 and 15:85. Mix and measure pH after each
addition and add smaller amounts when the pH reaches it desired value.
Sodiumphosphatebuffer 0.10 M pH 6.0 and pH 7.6 saturated with dichloromethane
Transfer approximately 800 ml sodiumphosphatebuffer 0.10 M pH 6.0 or pH 7.6 into a
bottle with screw cap lined with teflon. Add approximately 100 ml dichloromethane and
close the bottle. Mix during 24 hours on a mechanical shaker at room temperature and
let the phases separate for 24 hours at 23 0 C. Use the upper layer.
Sodiumphosphatebuffer approximately 0.01 M and pH 7.6
Dilute sodiumphosphatebuffer 0.10 M pH 7.6 in a ratio1:10 with water.
Sodiumhydroxide 10 M
Dissolve 40 g sodiumhydroxide pellets in 100 ml water.
Sodiumhydroxide 1 M
Dilute10 ml 10 M sodiumhydroxide with water until 100 ml and mix well.
Sulfonamide spike-solutions
Accurately weigh about 2.5 mg sulfonamide in a 100 ml bottle. Dissolve it in
sodiumphosphatebuffer ca. 0.01 M and about pH 7.6 . Add water till 100 ml and mix
well.
36

Chapter 2
2.3.4 Apparatus
A/D Converter 18652A ; Hewlett-Packard
Analytical Systems 3359AX (HP 1000); Hewlett-Packard
Balance (0.01 mg accuracy), AT 250; Mettler
Centrifuge, IECCR-6000; IEC
Desiccator; glass
Dispenser, Multipette; Eppendorf
Evaporator, Reacti-vap&therm ; Pierce
Fluorescence HPLC Monitor RF-530 ; Shimadzu
Guard Column bestelnr.28141, 1 cm length 2 mm ID stainless steel column packed with
Reversed Phase R2; Chrompack
Horizontal mechanical mixer; Edmund Bühler
HPLC Column Chromsep ordernr. 28267 2*10 cm length 3 mm ID glass column packed
with Chromspher C18, 5 µm; Chrompack
Liquid Chromatograph + LC Terminal, Series 4 ; Perkin-Elmer
Membrane pump Divac 2.4L; Leybolt
pH meter (2 decimals accuracy), SA 720; Orion
Pipettes fixed volume 10 µl-1 ml; Eppendorf
Programmable Multiwavelength Detector Type 490 ; Waters
Recorder BD 111/112 ; Kipp & Zonen
Rotation apparatus for 24 tubes; GFL 3025
Sample Injector Model 230 + 401 Dilutor + 20µl loop; Gilson
Tube shaker, Vortex-Evaporator; Buchler
Ultrasonic bath, T 480/H-2; ELMA
Ultra-turrax T25; IKA
Vial-crimper for 12 mm cap's; Phase Sep
2.3.5 Usables
Glass round bottom tubes 15 ml 16*100 mm; Renes
Glass culture tubes with screwing caps and teflon® lining 25 ml, 18*145 mm; Elgebe
Glass flask with screwing cap and teflon® lining
Pasteur pipette (glass) 23 cm long
37

Chapter 2
Polypropylene pointed tube with screwing cap 50 ml nr. 227261; Greiner
Polypropylene round bottom tube
Sep-Pak Silica Plus column nr 20520; Waters
Nitrogen gas, purity 2.8 or better
Vial (glass) 1-2 ml 12*32 mm with crimp-cap; Phase Sep
Disposable syringe 50 ml, Plastipak; Becton Dickinson
2.3.6 Sample preparation
Aqueous samples
The dilution of the sample with 1.00 ml eluent is aimed at reaching a concentration of
about 2 µg/ml sulfonamide in the vial.
Samples from the organic phase
Transfer sample into polypropylene tube and transfer from here the required amount
into a vial. Evaporate under nitrogen and dissolve the residue in 0.250 ml acetonitrile;
Add 1.00 ml 0.01 M ammoniumacetate buffer pH 5.2 (1.5 % volume contraction).
Sulfaguanidine had such a low partitioning coefficient, that a larger amount of
dichloromethane had to be evaporated first.
Yolk/Egg white
Pure yolk or white is homogenised with an ultra-turrax (30 seconds at about 10.000
rpm) and 5.0 0.05 g is weighed into a 50 ml polypropylene pointed tube. Add 0.5 ml of
a 2 M sodium citrate buffer pH 4.2 and mix immediately; add then 40 ± 0.5 ml
dichloromethane and mix shortly at once. Let the air escape and shake the tube
horizontally for 30 minutes at 200 rpm.
Yolk samples, centrifuge for 5 minutes at about 1000 g. White samples, break the gel
by shaking.
Penetrate the clean lower surface of the tube with a sharp needle and collect the extract
in a 100 ml Erlenmeyer; Yolk samples will yield 38 ± 0.5 ml extract and egg white
samples 33 ± 2 ml.
Connect the "barrel" of a 50 ml disposable syringe to a Sep-Pak Silica Plus column
(stored in a desiccator) and fill the "barrel" with 10.0 ml petroleum-ether 40-60 first and
with 10.0 ml extract thereafter. Suck the fluid at a 10-20 ml/min rate through the column,
38

Chapter 2
rinse with 5 ml 1:1 petroleum-ether 40-60/dichloromethane and dry at least 20 minutes
with 100 ml/min nitrogen gas.
If no further concentration is needed (content > 0.25 µg/g): elute with 5.0 ml 0.05 M
phosphate buffer pH 10 at a rate of about 10 ml/minute. Weigh the collected amount
(approximately 4 ml) together with the glass tube and adjust the pH of the eluate to 5.5-
4.0 with 250 µl 0.5 M ortho-phosphoric acid. Transfer an aliquot part to a 11 x 32 mm
vial for HPLC analysis.
Concentration can be achieved by collecting the eluate, adjusting pH to 6.0-5.5 with 200
µl 0.5 M ortho-phosphoric acid and shake 5 minutes with 5 ml ethylacetate. Centrifuge 5
minutes at approximately 1000 g, transfer as much ethylacetate as possible to a glass
tube and extract the aqueous phase again with 5 ml ethylacetate. Evaporate the
combined extracts under nitrogen gas at about 40 oC. The residue is dissolved in 20 µl
acetonitrile and 500 µl 0.01 M ammonium acetate buffer pH 5.3 is added. After an
ultrasonic treatment during 10 minutes the solution is transferred for the HPLC analysis
into a 11 x 32 mm vial.
2.3.7 Recovery measurements
Linearity of the clean-up method has not been checked. Therefore recovery
measurements were made at expected concentrations in the samples.
Blank eggs were treated in the same way as residue-containing eggs. After weighing
the required amount into a 50 ml polypropylene tube, 20 µl of the spike solution of
sulfisoxazole, sulfadiazine, sulfamerazine, sulfadimidine and sulfapyridine was added to
the yolk to obtain a spike level of 100 ppb to measure recovery. All other recovery
measurements in yolk and those in white were done at 500 ppb after a spike of 100 µl.
Then the samples were homogenised with the aid of a Vortex mixer and they were
incubated for 1.5 hours at room temperature. Then citrate buffer was added and the
clean-up proceeded as described above for yolk and egg white samples.
At the same time duplicate 100 µl portions of the spike solutions were pipetted into the
vials and after addition of 1.25 ml eluent these samples were analysed by HPLC to
determine the real concentration.
39

Chapter 2
2.3.8 HPLC-conditions
Isocratic
Eluent: 78% 0.01 M ammoniumacetate pH 5.2 + 22% acetonitrile
Gradient
Starting eluent: 0.01 M ammoniumacetate buffer pH 5.3 with 2.5 % acetonitrile
Final eluent: 0.01 M ammoniumacetate buffer pH 5.3 with 22 % acetonitrile
Equilibrate during 20 minutes with 100 % starting eluent, then injection, then in 1 minute
linear to 100 % final eluent. Elute during 15 minutes with final eluent and finally switch
back to starting eluent.
Dwell volume of pump + pulse equaliser: 3.5 ml
Flow: 0.6 ml/min
Pressure: ca. 10 Mpa
Column temperature: ca. 26 °C
Solvent for injection in isocratic run: eluent
Solvent for injection meant for gradient elution: ca 0.05 M phosphate buffer with pH
lower or equal to pH (if no concentration was needed) or starting eluent (if concentration
was carried out)
Injection: 100 µl sample in 20 µl loop
UV-detector: Channel 1 2 3 4
Mode A A A A
AUFS 1.000 0.100 1.000 0.100
Wavelength 280 nm 280 nm 254 nm 254 nm
Second List Yes Yes Yes Yes
Time Const. 1.0 1.0 1.0 1.0
Threshold 0% FS 0% FS 0% FS 0% FS
Auto Zero Yes Yes Yes Yes
Chart Mark No Yes No Yes
Auto Range No No No No
Polarity + + + +
Chart Zero 0% FS 0% FS 0% FS 0% FS
Connected to A/D 4 Rec.blue A/D_1
40

Chapter 2
Fluorescence detector: Excitation 275 nm
Emission 340 nm
Sensitivity High
Range 16
Connected to A/D_7 and Recorder red
Recorder: Chart speed 5 mm/min.
Data acquisition and management: Data acquisition lasted 20 minutes. When running
the gradient programme it thus extends into the equilibration phase. On applying the
gradient conditions a chromatogram with the following peaks and retention times was
obtained:
Name Approximate retention time in minutes
Dead volume (potassium nitrate) 1.1
Sulfaguanidine 3.3
Sulfanilamide 3.9
Sulfadiazine 8.8
Sulfapyridine 9.8
Sulfamerazine 10.1
Sulfisoxazole 10.6
Sulfadimidine 11.1
Sulfachloropyrazine 12.8
Sulfamethoxazole 13.1
Sulfaquinoxaline 17.2
Sulfadimethoxine 18.0
2.3.9 Ultrafiltration
Two ml egg white or yolk was transferred into a disposable ultrafiltration cartridge
(Ultrafree-CL Polysulfone 30000 NWML, Millipore Cat.No. UFC4TTK25) and
centrifuged for 2 hours at 3000 rpm (1000 g) in a Sorvall RC-5B centrifuge with SA-600
rotor. The sample size of the ultrafiltrate for HPLC was 0.3 ml.
41

Chapter 2
2.4 Animal experiments
Trial 1:
Groups of 3 laying hens received during 3 weeks feeds with the following amounts of
sulfonamides added (Table 2)
Table 2: Concentrations in the feed
Group Sulfonamide mg/kg feed
1: Sulfisoxazole 100
2: Sulfachloropyrazine 50
3: Sulfaquinoxaline 20
4: Sulfamethoxazole 50
5: Sulfadimethoxine 100
6: Sulfadiazine 20
7: Sulfamerazine 100
8: Sulfadimidine 20
9: Sulfapyridine 50
10: Sulfanilamide 20
11: Sulfaguanidine 100
The eggs were stored at 4 0C until analysis and mixed samples per group of both
yolk and egg white laid on days 14/15 and 16/17 have been analysed.
Trial 2:
Groups of five hens received during three weeks feed with 50 mg/kg of the following
sulfonamides
Group 1: Sulfachloropyrazine
Group 2: Sulfadimethoxine
Group 3: Sulfadiazine
Group 4: Sulfadimidine
Group 5: Sulfaguanidine
42

Chapter 2
The eggs laid were stored at 4 0C until analysis. A mixed sample per animal of eggs
laid from day 15-20 for both yolk and egg white was analysed. Protein binding was
assessed by filtration through an ultrafiltration cartridge as described above.
43
Chapter 2
2.5 Technical results
2.5.1 Chemical analysis
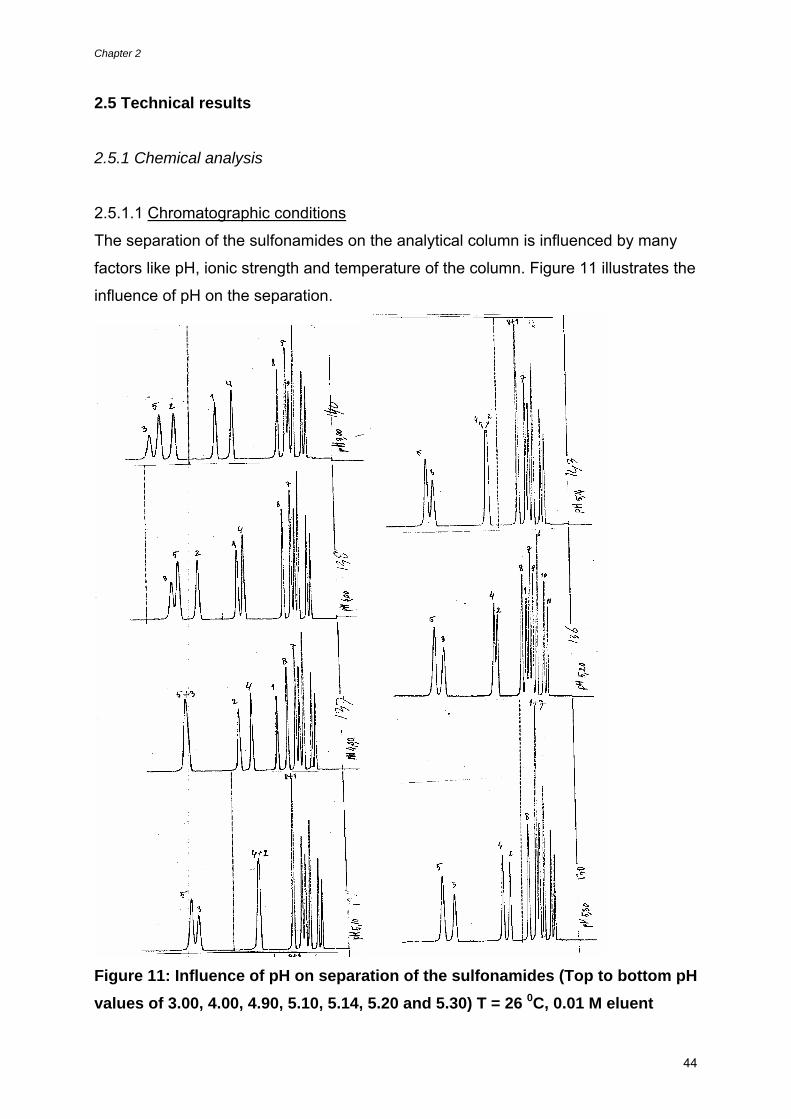
2.5.1.1 Chromatographic conditions
The separation of the sulfonamides on the analytical column is influenced by many
factors like pH, ionic strength and temperature of the column. Figure 11 illustrates the
influence of pH on the separation.
Figure 11: Influence of pH on separation of the sulfonamides (Top to bottom pH values of 3.00, 4.00, 4.90, 5.10, 5.14, 5.20 and 5.30) T = 26 0C, 0.01 M eluent
44

Chapter 2
It is quite clear from these graphs that the optimal pH for separation of the different
sulfonamides lies around pH 5.2-5.3.
Figure 12: Influence of molarity on separation of the sulfonamides (Top to bottom molarity of 0.01, 0.02, 0.05 and 0.1 M) T = 26 0C, pH = 5.14
Figure 12 shows the influence of molarity on the separation. Similarly Figure 13
shows the influence of temperature. The different sulfonamides used in the laboratory
and animal experiments were always tested one at the time. Therefore a method
which always separated all eleven sulfonamides was not an absolute prerequisite.
However for the sake of simplicity and avoidance of confusion, we have chosen to
use the one set of conditions described above for all determinations in the study.
45

Chapter 2
Figure 13: Influence of temperature on separation of the sulfonamides (Top to bottom temperature increase from 14 till 34 oC) pH = 5, 0.01 M eluent
To illustrate the applicability of the conditions chosen, figures 14 and 15 show
respectively a chromatogram of a blank sample to prove the absence of interfering
peaks and a chromatogram after injection of a standard solution of all eleven
sulfonamides.
46

Chapter 2
Figure 14: Chromatogram of blank egg white sample
Figure 15: Chromatogram of standard sulfonamide solution
47

Chapter 2
2.5.1.2 Linearity of the response
The linearity of the detector response has also been tested and the figures included
in the appendix prove that for all eleven sulfonamides a good linear response was
obtained.
2.5.1.3 Recovery percentages The recovery percentages from the aqueous and organic solutions were considered
to be around 100 %, as no interfering factors are suspected to be present.
The method used in this study to determine the sulfonamides in yolk and white was
necessarily a compromise and for that reason some low recovery percentages
occurred. In study 1 the following percentages were found:
Recovery % Yolk White
Sulfisoxazole 36 94
Sulfachloropyrazine 81 86
Sulfaquinoxaline 40 70
Sulfamethoxazole 80 92
Sulfadimethoxine 72 94
Sulfadiazine 97 102
Sulfamerazine 84 91
Sulfadimidine 81 82
Sulfapyridine 59 84
Sulfanilamide 44 33
Sulfaguanidine 20 < 3
The low but consistent recovery percentages in some instances were nevertheless
accepted as they were considered to have no impact on the outcome of the studies
48

Chapter 2
2.5.2 Laboratory tests
2.5.2.1 Partitioning coefficient
The solubility of the sulfonamides in cyclohexane proved to be so low, that the
measurements with this solvent have not been completed and the results are not
shown here.
The partitioning coefficients obtained with dichloromethane as the organic phase
together with the Sd values are given in Table 3.
The variability in the analytical results largely results from variation (about 5%) in the
analyses in the dichloromethane layer. Evaporation of the solvent might have played an
important role in causing this variability. The variability of the analyses of the aqueous
layer was about 3 % and that of the standard solutions and the pipettes about 1 %.
The reliability of the partitioning coefficients was tested according to the OECD
guidelines, by comparison of the P value at any given condition to the average P
value. This test did not show that a relationship between concentration and P values
existed. The calculated log P values were well within the prescribed 0.3 log unit
range, to be acceptable according to the guidelines.
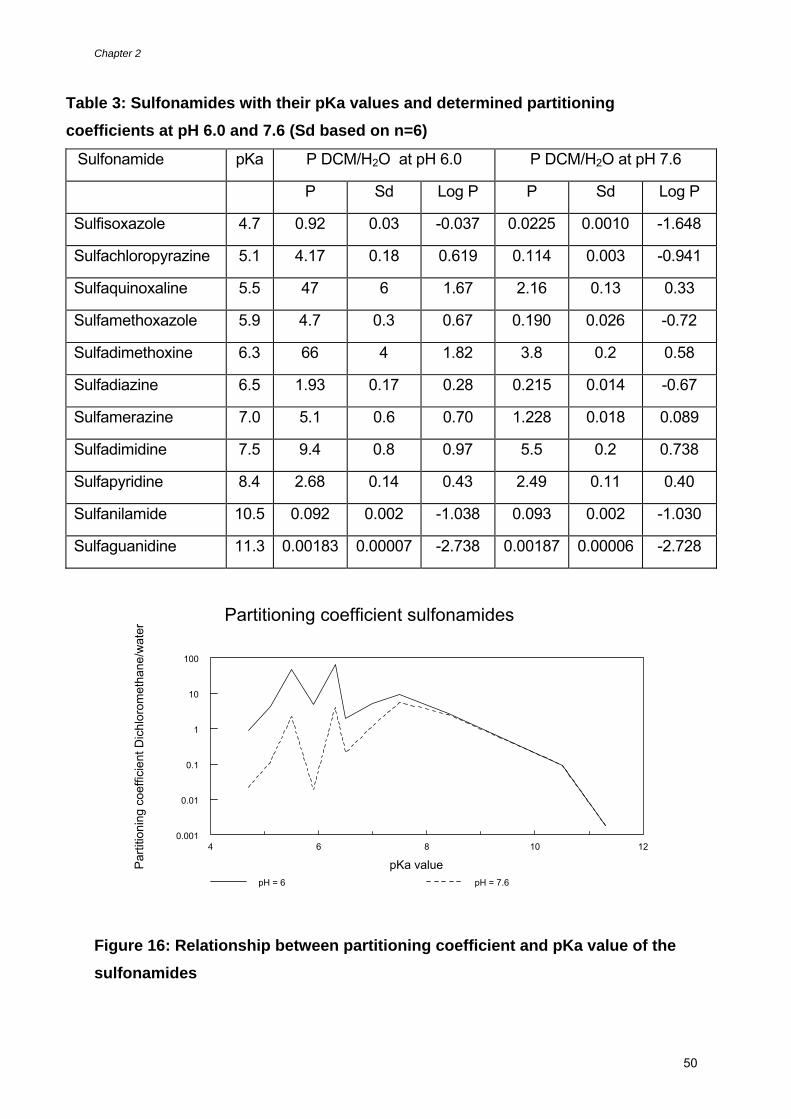
The partitioning of the sulfonamides between dichloromethane and an aqueous buffer
solution showed large differences with sulfadimethoxine having (on average) the largest
affinity for the organic phase and sulfaguanidine the least. The P and log P values �
which are also indicator of the solubility � showed no clear relationship with the pKa
values of the different sulfonamides (see also figure 16).
49
Chapter 2
Table 3: Sulfonamides with their pKa values and determined partitioning coefficients at pH 6.0 and 7.6 (Sd based on n=6)
Sulfonamide pKa P DCM/H2O at pH 6.0 P DCM/H2O at pH 7.6
P Sd Log P P Sd Log P
Sulfisoxazole 4.7 0.92 0.03 -0.037 0.0225 0.0010 -1.648
Sulfachloropyrazine 5.1 4.17 0.18 0.619 0.114 0.003 -0.941
Sulfaquinoxaline 5.5 47 6 1.67 2.16 0.13 0.33
Sulfamethoxazole 5.9 4.7 0.3 0.67 0.190 0.026 -0.72
Sulfadimethoxine 6.3 66 4 1.82 3.8 0.2 0.58
Sulfadiazine 6.5 1.93 0.17 0.28 0.215 0.014 -0.67
Sulfamerazine 7.0 5.1 0.6 0.70 1.228 0.018 0.089
Sulfadimidine 7.5 9.4 0.8 0.97 5.5 0.2 0.738
Sulfapyridine 8.4 2.68 0.14 0.43 2.49 0.11 0.40
Sulfanilamide 10.5 0.092 0.002 -1.038 0.093 0.002 -1.030
Sulfaguanidine 11.3 0.00183 0.00007 -2.738 0.00187 0.00006 -2.728
4 6 8 10 12
pKa value
0.001
0.01
0.1
1
10
100
Parti
tioni
ng c
oeffi
cien
t Dic
hlor
omet
hane
/wat
er
Partitioning coefficient sulfonamides
pH = 6 pH = 7.6
Figure 16: Relationship between partitioning coefficient and pKa value of the sulfonamides
50

Chapter 2
The partitioning at the different pH values of the aqueous buffer solutions did show � as
anticipated - a relationship with the pKa values.
Table 4 gives the calculated ratio of the measured partitioning ratios at pH values 6.0
and 7.6 and the calculated distribution of the uncharged molecule over a semi-
permeable membrane separating two aqueous phases with pH values 6.0 and 7.6. This
calculation was made according to Hogben et al. (1959).
Table 4: Ratio of the partitioning coefficients measured at pH values 6.0 and 7.6 and the calculated distribution.
Sulfonamide pKa Ratio of P values measured
at pH 6.0 and 7.6
Calculated distribution at
pH values 6.0 and 7.6
Sulfisoxazole 4.7 40.9 38.0
Sulfachloropyrazine 5.1 36.6 35.5
Sulfaquinoxaline 5.5 21.8 30.5
Sulfamethoxazole 5.9 24.7 22.6
Sulfadimethoxine 6.3 17.4 14.0
Sulfadiazine 6.5 9.0 10.3
Sulfamerazine 7.0 4.2 4.5
Sulfadimidine 7.5 1.7 2.2
Sulfapyridine 8.4 1.08 1.15
Sulfanilamide 10.5 0.99 1.00
Sulfaguanidine 11.3 0.98 1.00
The ratio of the partitioning at the pH values 6.0 and 7.6 showed a good correlation with
the calculated distribution of the uncharged molecule over a semi-permeable
membrane separating aqueous phases of these pH values. This strongly suggests that
both the pKa values used in the calculations were about right and that in measuring the
partitioning coefficients between organic and aqueous phases of different pH values,
indeed only the uncharged molecules contribute to the distribution.
51

Chapter 2
2.5.3 Animal trials
2.5.3.1 Contents in yolk and egg white (Trial 1)
The average contents in yolk and white measured in the samples after about two
weeks of feeding (days 14/15 and 16/17) are given in Table 5.
Table 5: Contents of the sulfonamides in feed, yolk and white. Sulfonamide Feed content
mg/kg
Yolk content in
µg/kg*
White content in
µg/kg*
Ratio white/yolk
Sulfisoxazole 100 10 + 32 SA < 15
+ 16 SA
< 1.5
SA 0.48
Sulfachloropyrazine 50 167 523 3.13
Sulfaquinoxaline 20 261 542 2.08
Sulfamethoxazole 50 117 418 3.56
Sulfadimethoxine 100 370 860 2.32
Sulfadiazine 20 15 135 9.27
Sulfamerazine 100 26 226 8.77
Sulfadimidine 20 9 27 2.88
Sulfapyridine 50 < 4.5
+ 31 SA
< 100
+ 16 SA
?
SA 0.51
Sulfanilamide 20 137 149 1.09
Sulfaguanidine 100 336 < 1000 ? (<3)
*The yolk and white data are an average of two measurements in mixed samples;
each mixed sample consisting of 5-6 individual egg samples and are corrected for
recovery
The recovery of the sulfonamides with high pKa values was quite low (see above), so
the results of these compounds must be viewed with caution.
The analyses of yolk and white from hens in the sulfisoxazole and the sulfapyridine
groups indicated the possible presence of sulfanilamid. We have not been able to
confirm these observations later on.
The concentrations of the different sulfonamides are nearly always higher in egg white
than in yolk. The ratio of the contents in white/yolk of the different sulfonamides does
52

Chapter 2
not show a clear correlation with their pKa values (Table 3). The partitioning coefficients
at the different pH values (Table 3) and the ratio of the partitioning coefficients at pH
values 6.0 (Yolk) and 7.6 (White) given in Table 4 also showed no correlation with the
observed white/yolk ratios. Figures 17 and 18 illustrate this.
0 2 4 6 8 10
White/yolk ratio
0.001
0.01
0.1
1
10
100
Parti
tioni
ng c
oeffi
cien
t Dic
hlor
omet
hane
/wat
er
White/yolk ratio and partitioning coefficientof 10 sulfonamides
pH = 6 pH = 7.6
Figure 17: The white/yolk ratio of 10 sulfonamides and the P values at pH 6 and 7.6
0 2 4 6 8 10
White/yolk ratio
0.1
1
10
100
Rat
io p
val
ues
at p
H 6
and
7.6
White/yolk ratio and ratio p values at pH 6 and 7.6of 10 sulfonamides
Figure 18: White/yolk ratio and ratio of p values at pH 6 and 7.6 of 10 sulfonamides
53

Chapter 2
2.5.3.2 Contents in white and yolk (Trial 2)
The residue levels reported in Table 6 are the results of a mixed sample of 4-5 eggs
per animal laid during days 15-20 of the experiment. The results were corrected for
recovery.
The data show that at the same level in the feed (50 mg/kg) the different sulfonamides
will give different residue levels in both yolk and white. They also show that although
between hens there are considerable differences in absolute amounts, for each
substance the ratio of the levels in white and yolk is quite constant.
Furthermore the differences between substances both in absolute amounts and in the
white/yolk ratio are also quite consistent. The ratios sometimes agree quite well
between the two experiments and sometimes they do not. As the methodology was
improved between both experiments (especially for sulfaguanidine) and levels near the
detection limit (sulfadiazine, sulfadimidine and sulfaguanidine) were not present in the
second trial, these factors may explain some of the differences in the results between
the trials.
54

Chapter 2
Table 6: Average contents of sulfonamides in yolk and egg Hen nr Sulfonamide Yolk in µg/kg White in µg/kg Ratio white/yolk
1 Sulfachloropyrazine 191 416 2.17
2 Sulfachloropyrazine 234 668 2.85
3 Sulfachloropyrazine 253 705 2.79
4 Sulfachloropyrazine 292 806 2.76
5 Sulfachloropyrazine 401 1108 2.76
Mean Sulfachloropyrazine 274 741 2.67
6 Sulfadimethoxine 170 431 2.53
7 Sulfadimethoxine 177 531 1.98
8 Sulfadimethoxine 176 444 2.52
9 Sulfadimethoxine 161 330 2.05
10 Sulfadimethoxine 215 440 2.04
Mean Sulfadimethoxine 180 399 2.23
11 Sulfadiazine 146 639 4.38
12 Sulfadiazine 141 622 4.41
13 Sulfadiazine 158 642 4.07
14 Sulfadiazine 136 635 4.67
15 Sulfadiazine 167 636 3.81
Mean Sulfadiazine 149 635 4.27
16 Sulfadimidine 23 147 6.55
17 Sulfadimidine 44 229 5.20
18 Sulfadimidine 34 121 3.57
19 Sulfadimidine 34 159 4.71
20 Sulfadimidine 22 121 5.49
Mean Sulfadimidine 31 155 5.11
21 Sulfaguanidine 352 249 0.71
22 Sulfaguanidine 218 170 0.78
23 Sulfaguanidine 236 199 0.84
24 Sulfaguanidine 289 231 0.80
25 Sulfaguanidine 360 273 0.76
Mean Sulfaguanidine 291 224 0.78
55

Chapter 2
2.5.3.3 Protein/macromolecular binding
Ultrafiltration of yolk samples proved not to be possible due to clogging of material on
the membrane.
The ultrafiltration of the white samples indicated the following average protein binding;
Sulfachloropyrazine 27 %
Sulfadimethoxine 30 %
Sulfadiazine - 31 %
Sulfadimidine 5 %
Sulfaguanidine 9 %
The data on sulfadiazine can only be explained if a much lower recovery from the
incurred total white samples occurred, than measured in the recovery experiments with
added material. Therefore the absolute values of the protein binding experiments must
be viewed with caution. Assuming however that in relative terms they are correct, the
differences in protein binding percentages can not explain the observed differences in
white/yolk ratios. Sulfadimidine and sulfaguanidine have a similar protein binding but
differ considerably in white/yolk ratio, whereas sulfadimidine having a lower protein
binding than sulfachloropyrazine and sulfadimethoxine has a much higher white/yolk
ratio.
56

Chapter 3
3 RESULTS AND DISCUSSION 3.1 Introduction Furusawa (1999) makes the following statements on the reasons for drug residues in
white and yolk and the distribution between of drugs between white and yolk.
� Therefore, the drug content in egg yolk is a cumulative sum of the drug during the
growth of the yolk. On the other hand, albumen synthesized in the cells of the magnum
are secreted by this part of the oviduct (concentrated albumen). The albumen is then
later diluted with water (plumping water) in the shell gland. Therefore the drugs
presence in the albumen reflects closely the blood concentration during the substantial
time (~10-13 h) required for albumen formation in the oviduct. This seems to agree with
the hypothesis of passive diffusion of the drug across the albumen glandular epithelium
and an equilibrium between the drug concentrations in blood and in the albumen in the
oviduct. The drugs tested are transported as one soluble compound in blood. The
relative contents of a drug in egg yolk or albumen depends on its relative solubility in
lipid or water, respectively. The drugs having the property of lipid-solubility are found in
much higher levels in egg yolk than in albumen, whereas those having water-solubility
are found in higher concentrations in albumen than in yolk.”
Furusawa (2001) later stated shortly “Large variations in the ratio of the contents of
the drugs in egg yolk to that in albumen occur with different drugs. This variation
should depend mainly on the relative lipid-solubility and water-solubility of the drug.
Drugs that are lipid soluble, such as amprolium or nicarbazin are found in much
higher concentrations in egg yolk than in albumen. In contrast, those that are water
soluble, such as the sulfonamides, are found in a higher concentration in albumen
than in egg yolk.” These statements nicely summarise the traditional approach to the subject of this
study. Literature data and data out of our previous studies and the present one
clearly indicate certain inconsistencies or mistakes in this concept.
57

Chapter 3
3.2 Parameters studied
To prove or disprove the concept outlined above, the distribution of sulfonamides
between egg white and yolk was studied and the following physicochemical
characteristics of the different substances were considered of possible importance for
this distribution:
• Lipid solubility
• Distribution between the aqueous and organic phase (log p value)
• pKa value
• Protein binding
3.2.1 Lipid solubility and partitioning coefficient in relation to white/yolk ratio
The partitioning coefficients of the different sulfonamides obtained with dichloromethane
as the organic phase have been given in Table 3. The white/yolk ratios have been given
in Tables 5 and 6. Table 7 shows the direct comparison of P values at pH values 6.0
and 7.6 and the white yolk ratios found in the two trials. The partitioning of the
sulfonamides between dichloromethane and an aqueous buffer solution showed large
differences between the different substances. Sulfadimethoxine shows (on average) the
largest affinity for the organic phase and sulfaguanidine the least. The P or log P values
� which are also indicator of the solubility in the organic phase � and the white/yolk
ratios of the different sulfonamides given in Table 7 show no obvious relationship.
Sulfadimethoxine, which has the highest P values, so the highest affinity for the organic
phase and probably the highest lipid solubility, certainly has not the lowest white/yolk
ratio, as would follow from the lipid solubility theory. Sulfanilamide having a low P value
and lipid solubility should have had a high white to yolk ratio, if lipid solubility would
have been the main driving force but it has a white/yolk ratio close to 1. Sulfaguanidine
has an extremely low partitioning ratio and solubility in the organic phase. It does not
have a correspondingly low white to yolk ratio, which also does not support lipid
solubility as being the driving force for distribution of sulfonamides between white and
yolk.
58

Chapter 3
Table 7: Sulfonamides and their determined partitioning coefficients at pH 6.0 and 7.6 and white/yolk ratios found in trials 1 and 2
Sulfonamide P at pH 6.0
DCM/H2O
P at pH 7.6
DCM/H2O
Ratio white/yolk
trial 1
Ratio white/yolk
trial 2
Sulfisoxazole 0.92 0.0225 < 1.5
SA 0.48
Sulfachloropyrazine 4.17 0.114 3.13 2.67
Sulfaquinoxaline 47 2.16 2.08
Sulfamethoxazole 4.7 0.190 3.56
Sulfadimethoxine 66 3.8 2.32 2.23
Sulfadiazine 1.93 0.215 9.27 4.27
Sulfamerazine 5.1 1.228 8.77
Sulfadimidine 9.4 5.5 2.88 5.11
Sulfapyridine 2.68 2.49 ? (SA 0.51)
Sulfanilamide 0.092 0.093 1.09
Sulfaguanidine 0.00183 0.00187 ? (<3) 0.78
The data in Table 7 thus show no obvious general relationship between P value and
white to yolk ratio.
Gorla et al. (1997) and Furusawa (1999, 2001) both state, that lipid soluble drugs will
predominantly be present in yolk and water-soluble drugs predominantly in white. The
results on the lipid soluble doxycycline in contrast to the less lipid soluble
oxytetracycline (see Table 1) as well as the results presented above on the
sulfonamides do not fully support this statement.
So - generally spoken - lipid solubility of a drug, when given to laying hens, on its own
does not determine the white/yolk ratio of that drug.
3.2.2 pKa value and white/yolk ratio
Table 8 shows the calculated ratio of the measured partitioning ratios at pH values 6.0
and 7.6 (Table 4) and for comparison the white/yolk ratios measured in the two trials
(Tables 5 and 6). The pH values 6.0 and 7.6 were chosen for this determination as they
mimic the pH values of yolk and white in freshly laid eggs.
59

Chapter 3
Table 8: Ratio of the partitioning coefficients measured at pH values 6.0 and 7.6 and the white/yolk ratios.
Sulfonamide
pKa
Ratio of P values measured
at pH 6.0 and 7.6
White/yolk
ratio trial 1
White/yolk
ratio trial 2
Sulfisoxazole 4.7 40.9 < 1.5
SA 0.48
Sulfachloropyrazine 5.1 36.6 3.13 2.67
Sulfaquinoxaline 5.5 21.8 2.08
Sulfamethoxazole 5.9 24.7 3.56
Sulfadimethoxine 6.3 17.4 2.32 2.23
Sulfadiazine 6.5 9.0 9.27 4.27
Sulfamerazine 7.0 4.2 8.77
Sulfadimidine 7.5 1.7 2.88 5.11
Sulfapyridine 8.4 1.08 ? (SA 0.51)
Sulfanilamide 10.5 0.99 1.09
Sulfaguanidine 11.3 0.98 ? (<3) 0.78
The ratio of the P values at pH 6.0 and 7.6 shows quite a good correlation with the pKa
of the different sulfonamides. This indicates that at each pH of the aqueous phase, only
the uncharged molecule seems to contribute to the observed distribution between the
organic phase and aqueous phase. The ratio of the distributions observed at the two
different pH values shows data very similar to those, calculated for a distribution of
uncharged molecules between aqueous phases with the different pH values separated
by a semi-permeable membrane.
Such a relationship between pKa of various drugs and pH values of different aqueous
phases has been proven accurate for the explanation of a number of observed
distribution ratios. The successful explanation of distribution of different drugs in
different physiological systems, such as plasma/gastric juice, plasma/cerebrospinal
fluid, plasma/red cells and plasma/milk has been outlined in the introduction.
The ratio of the P values at pH 6.0 (yolk) and 7.6 (white) and the white/yolk ratio
observed for the 11 different sulfonamides tested (Table 8) shows no obvious (linear)
relationship. The white/yolk ratio of the 11 sulfonamides seems to be non-related to
60

Chapter 3
their pKa value. The assumption that the egg can be considered as two aqueous
phases with different pH values separated by a semi-permeable membrane and
distribution of the sulfonamides between white and yolk being only governed by
distribution of the uncharged sulfonamide molecule, can thus not be substantiated.
Blom (1975) tried to explain the distribution between plasma and egg white of the three
sulfonamides studied by him on the basis of their pKa values and could not draw an
unambiguous conclusion.
Apparently the distribution of sulfonamides between plasma and white and between
white and yolk is not only � or may be not at all - governed by diffusion or passage of
the uncharged molecule only.
3.2.3 Protein/macromolecular binding and white/yolk ratio
Numerous drugs including sulfonamides have been observed to bind to (plasma)
proteins. This binding has both been observed in vivo and in vitro: thus either after
treatment of an individual with a drug or after adding a drug to a blank plasma, the
plasma sample contained both bound and free drug. Protein binding measured in vivo
has the large advantage that it is governed by those process occurring in the living
object, where as in vitro artefacts not occurring in life might show up.
The results obtained by measuring in vivo protein binding of five sulfonamides in egg
white and the observed white/yolk ratios are given in Table 9.
Table 9: Comparison of protein binding and white/yolk ratio Sulfonamide Protein binding % White/yolk ratio
Sulfachloropyrazine 27 2.67
Sulfadimethoxine 30 2.23
Sulfadiazine -31 4.27
Sulfadimidine 5 5.11
Sulfaguanidine 9 0.78
No obvious relationship between measured in vivo protein binding in egg white and
white/yolk ratio is evident from the data. Blom (1975) measured both in vivo and in
vitro binding of three sulfonamides in egg white. No relationship between protein
binding and white to yolk ratio could be deduced from his data. Nevertheless some
61

Chapter 3
kind of active binding must take place in oviduct or albumen as Furusawa (1999)
reported lower concentrations of spiramycine, oxytetracycline and sulfamonomethoxine
in blood than in oviduct tissue and albumen. He nevertheless assumes that passive
diffusion from blood to albumen occurs and that water or lipid solubility is the major
determining factor. On the other hand (Furusawa personal communication, 2000) he
believes, that protein binding (both rate of binding and amount of binding material) can
have a major impact on distribution of the drug in the body and within the egg.
3.3 Other (unexplained) observations Spiramycine (Yoshida et al., 1971; Roudaut and Moretain, 1990) as well as the
quinolones, oxolinic acid (Roudaut and Boisseau, 1990) and flumequin (van Leeuwen
and van Gend, 1989) show a longer persistence of residues in egg white than in yolk.
McCracken et al. (2001) fed furazolidone to laying hens during 8 days and measured
both the parent compound and a major metabolite (AOZ) in egg white as well as in
yolk. During treatment they found all compounds in all compartments but at 11 days
after withdrawal no parent furazolidone could be detected (as can be anticipated) in
either yolk or egg white, but the metabolite was present still in both egg white and yolk.
The presence of a drug or metabolite in both white and yolk suggests storage of it at
some other place in the body and redistribution via the blood (or lymphatic system).
The presence of a compound in white only suggests more specifically a kind of storage
in the oviduct tissue (or elsewhere in the body) together with a strong affinity of the egg
white for it (or vice versa). Protein binding of some kind is the most likely candidate for
this.
Furusawa (1999) observed quite high levels of spiramycine in oviduct tissue �much
higher than in blood or albumen -, which he suggested (Furusawa personal
communication, 2000) to be caused by some kind of protein binding. This high binding
might in turn be responsible for the prolonged half-live in egg white observed by others.
Furusawa (1999) also observed high levels of oxytetracycline and
sulfamonomethoxine in oviduct tissue, but these were comparable to levels in
albumen.
Furusawa and Kishida (2002) fed five different sulfonamides (sulfadiazine,
sulfadimidine, sulfamonomethoxine, sulfamethoxazole and sulfaquinoxaline) at 100
mg/kg diet to laying hens for seven days and then measured levels in plasma, liver,
62

Chapter 3
muscle, ovary, the magnum fraction of the oviduct and the shell gland fraction. They
found considerable differences in the distribution over the different tissues between the
five sulfonamides tested. Plasma levels were (much) higher than levels for all other
tissue with the exception of sulfadimidine in which case plasma and liver contents were
about equal. Sulfadiazine, which in our experiments had a considerable white to yolk
ratio and to a lesser extent sulfaquinoxaline, showed in their experiment a similar
content in oviduct (magnum) tissue and ovary. Sulfadimidine and sulfamethoxazole
showed a higher content in ovary tissue than in magnum tissue which contradicts our
white to yolk ratios of about 3. The results from Furusawa and Kishida (2002) on
distribution of sulfonamides within the tissues of the laying hen, thus do not explain the
white to yolk ratios found in our experiments.
3.4 Some points still to be tackled 1. Determination of the complex or form in which drugs are transported (via the
blood) to and deposited in the ovary.
2. Determination how and at what time and place drugs enter the egg white: during
deposition of egg white or (also) during plumping or even during calcification of
the egg. Donoghue et al. (2000) have proven the transfer of oxytetracycline
during plumping, but more data should be gathered.
3. Determination of pH values at the micro-scale at those places where processes
really occur and not only in the bulk of the phase. This would help to ascertain
whether indeed only the non-ionised form of the molecules is involved in the
different processes.
4. Study of possible (re) distribution processes of drugs between egg white and yolk
during egg- and shell-formation.
63

Chapter 3
3.5 Overall conclusions 1. The processes of yolk formation and deposition and the processes of egg white
formation and deposition govern the shape of the residue curves in eggs (white and
yolk) when drugs are given to or withdrawn from laying hens.
2. The eleven tested sulfonamides all show considerable levels in egg white despite
their often high affinity for the organic phase, which � according to the lipid solubility
concept - would suggest the predominant deposition in yolk.
3. The physiochemical characteristics measured: log P (at two different pH values),
pKa and protein binding fail to predict or explain the observed distribution of the
eleven sulfonamides between egg white and yolk when administered to laying
hens.
4. The concept that concentrations of sulfonamides in egg white and yolk are directly
related to and can be explained or predicted by one or two physicochemical
measurements or characteristics is too simplistic. In other words, egg white and
yolk are not two liquid phases separated by a semi-permeable membrane
exhibiting equilibrium in contents of sulfonamides between them.
5. The complicated reality is that levels in yolk depend on both yolk deposition and
solubility or affinity of the drug for the lipid phase. Levels in egg white probably
depend on circulating plasma levels and specific binding of the drug to protein(s) in
plasma and egg white and the affinity constants of that binding. Thus two non-
directly related processes are taking place.
64

4. Annexes
4.ANNEXES
0 1 2 3 4
Concentration in µg/ml in standard solution
0
100
200
300
400
(Tho
usan
ds)
Area
cou
nts
Linearity of responseSulfisoxazole
0 1 2 3 4 5
Concentration in µg/ml in standard solution
0
100
200
300
400
500
(Tho
usan
ds)
Area
cou
nts
Linearity of responseSulfachloropyrazine
65

4. Annexes
0 1 2 3 4 5
Concentration in µg/ml in standard solution
0
100
200
300
400
500
(Tho
usan
ds)
Area
cou
nts
Linearity of responseSulfaquinoxaline
0 1 2 3 4
Concentration in µg/ml in standard solution
0
100
200
300
400
500
(Tho
usan
ds)
Area
cou
nts
Linearity of responseSulfamethoxazole
66

4. Annexes
0 1 2 3 4 5
Concentration in µg/ml in standard solution
0
100
200
300
400
500
600
(Tho
usan
ds)
Area
cou
nts
Linearity of responseSulfadimethoxine
0 1 2 3 4
Concentration in µg/ml in standard solution
0
100
200
300
400
500
(Tho
usan
ds)
Area
cou
nts
Linearity of responseSulfadiazine
67

4. Annexes
0 1 2 3 4 5
Concentration in µg/ml in standard solution
0
100
200
300
400
500
(Tho
usan
ds)
Area
cou
nts
Linearity of responseSulfamerazine
0 1 2 3 4 5
Concentration in µg/ml in standard solution
0
100
200
300
400
500
(Tho
usan
ds)
Area
cou
nts
Linearity of responseSulfadimidine
68

4. Annexes
0 1 2 3 4
Concentration in µg/ml in standard solution
0
100
200
300
400
(Tho
usan
ds)
Area
cou
nts
Linearity of responseSulfapyridine
0 1 2
Concentration in µg/ml in standard solution
30
100
200
(Tho
usan
ds)
Area
cou
nts
Linearity of responseSulfanilamide
69

4. Annexes
0 1 2 3 4
Concentration in µg/ml in standard solution
0
10
20
30
40
50
60
70(T
hous
ands
)
Area
cou
nts
Linearity of responseSulfaguanidine
70

5. References
5. REFERENCES
Akhtar, M. H., K. A. El-Sooud and M.A.A. Shehata (1996) Concentrations of
Salinomycin in Eggs and Tissues of Laying Chickens Fed Medicated Feed for 14
Days Followed by Withdrawal for 3 Days. Food Additives and Contaminants 13, 897-
707
Anhalt, G. (1977) Physiologie der Eientstehung und Einlagerung
antibakterieller Wirkstoffe. Archiv für Geflügelkunde 41, 232-237
Arnold, D. and A. Somogyi (1986) Chloramphenicol Residues in Edible
Tissues of Food Animals. Proceedings 2nd World Congress on Foodborne Infections
Berlin, 832-836
Atkinson, H.C. and E.J. Begg (1990) Prediction of Drug Distribution into
Human Milk from Physicochemical Characteristics. Clininical Pharmacokinetics 18,
151-167
Atta, A.H. and S.A. El-zeini (2001) Depletion of Trimethoprim and
Sulphadiazine from Eggs of Laying Hens Receiving Trimethoprim/Sulphadiazine
Combination. Food Control 12, 2669-274
Bell, D.J. and B.M. Freeman (1971) Physiology and Biochemistry of the
Domestic Fowl. Academic Press, London, New York, ISBN 0-12-085003-6, vol. 3
Blom, L. (1975) Plasma Half-Lives and the Excretion into Egg-White and -yolk
of Three Sulphonamides and Pyrimethamine after Medication of Laying Hens. Acta
Pharmacologica and Toxicology 37, 79-93
Botsoglou, N.A., D. Kufidis, A.B. Spais and V.N. Vassilopoulos (1989)
Furazolidone in Eggs Following Feeding Trials to Laying Hens. Archiv für
Geflügelkunde 53, 163-168
Donoghue, D.J. and H. Hairston (2000) Food Safety Implication: Certain
Antibiotics May Rapidly Contaminate Egg Albumen during the Process of its
Formation. British Poultry Science 41, 174-177
Donoghue, D.J. and K. Myers (2000) Imaging Residue Transfer into Egg
Yolks. Journal of Agricultural and Food Chemistry 48, 6428-6430
Furusawa, N. and T. Mukai (1995) Easiness of Transfer of Dietary
Sulfamonomethoxine into Eggs. Japanese Poultry Science 32, 26-33
Furusawa, N., T. Mukai and M. Yoshida(1994) Easiness of Transfer of Dietary
Sulfadimethoxine into Eggs and its Disappearance Pattern from Eggs. Japanese
71

5. References
Poultry Science 31, 168-180
Furusawa, N., Y. Tsuzukida and H. Yamaguchi (1998) Decreasing Profile of
Residual Sulphaquinoxaline in Eggs. British Poultry Science 39, 241-244
Furusawa, N. (1999) Spiramycin, Oxytetracycline and Sulphamonomethoxine
Contents of Eggs and Egg-Forming Tissues of Laying Hens. Journal of Veterinary
Medicine A 46, 599-603.
Furusawa, N. (2001) Transference of Dietary Veterinary Drugs into Eggs.
Veterinary Research Communications, 25, 651-662.
Furusawa, N. and K. Kishida (2002) Transfer and Distribution Profiles of
Dietary Sulphonamides in the Tissues of the Laying Hen. Food Additives and
Contaminants 19, 368-372.
Geertsma, M. F., J. F. M. Nouws, J.L. Grondel, M.M.L. Aerts, T.B. Vree and
C.A. Kan (1987) Residues of Sulphadimidine and its Metabolites in Eggs Following
Oral Sulphadimidine Medication of Hens. Veterinary Quarterly 9, 67-75
Gilbert, A.B. (1971a) The Female Reproductive Effort: Chapter 49 in: Bell, D.J.
and B.M. Freeman, Physiology and Biochemistry of the Domestic Fowl. Academic
Press, London, New York, ISBN 0-12-085003-6, vol. 3
Gilbert, A.B. (1971b) Egg Albumen and its Formation: Chapter 54 in: Bell, D.J.
and B.M. Freeman, Physiology and Biochemistry of the Domestic Fowl. Academic
Press, London, New York, ISBN 0-12-085003-6, vol. 3
Gilbert, A.B. (1971c) The Egg: its Physical and Chemical Aspects: Chapter 58
in: Bell, D.J. and B.M. Freeman, Physiology and Biochemistry of the Domestic Fowl.
Academic Press, London, New York, ISBN 0-12-085003-6, vol. 3
Gilbert, A.B. (1972) The Activity of the Ovary in Relation to Egg Production, in:
Freeman, B.M. and Lake, P.E., Egg Formation and Production. British Poultry
Science Ltd. Edinburgh, 8
Gorla, N., E. Chiostri, L. Ugnia, A. Weyers, N. Giacomelli, R. Davicino, and
H.G. Ovando (1997) HPLC Residues of Enrofloxacin and Ciprofloxacin in Eggs of
Laying Hens. International Journal of Antimicrobial Agents 9, 253-256
Hafez, H.M. (1991) Factors Influencing Drug Residues in Poultry Products: A
Review. Archiv für Geflügelkunde 55, 193-195
Hogben, C.A.M., D.J. Tocco, B.B. Brodie and L.S. Schanker (1959) On the
Mechanism of Intestinal Absorption of Drugs. Journal of Pharmacology and
Experimental Therapeutics 125, 275-282
72

5. References
Kan, C.A. and R. Rump (1992) Distribution of Veterinary Drugs and
Coccidiostats between Yolk and Egg White. Proceedings XIX Worlds Poultry
Congress III, 68-71
Kan, C. A., H. J. Keukens and W.M.J. Beek (1995) Experimentally Induced
Dimetridazole Residues in Eggs. Proceedings VI European Symposium on th Quality
of Eggs & Egg Produts 425-429 (1995) also in Euroresidue III, 586-590
Kan, C. A., W. van Leeuwen and H.W. van Gend (1989) Residuen van
amprolium in eieren na toediening van amprolium/ethopabaat aan leghennen en
opfokleghennen. Tijdschrift voor Diergeneeskunde 114, 76-82
Kan, C. A., H. J. Keukens and M.J.H. Tomassen (1998) Flubendazole
Residues in Eggs after Oral Administration to Laying Hens: Determination with
Reversed Phase Liquid Chromatography. Analyst 123, 2525-2527
Keukens, H. J., C. A. Kan and M.J.H. Tomassen (1996) Study on the
Presence of Olaquindox Residues in Eggs after Administration of Feeds containing
Low Levels of Olaquindox to Laying Hens. Euroresidue III, 611-615
Krieg, R. (1966) Der Sulfonamidgehalt in Eiern, Blut und Organen von
Weissen Leghorn während und nach einer Behandlung mit dem Sulfonamid Sulmet.
1.Mitteilung:Der Sulmetgehalt in den Eiern von Weissen Leghorn. Archiv für
Geflügelkunde 30, 299-308
Krieg, R. (1972) Der Übergang von Furazolidon in das Ei bei therapeutischer
Anwendung. Archiv für Geflügelkunde 36, 171-174
Laurencot, H. J., A. Schlosser, and J.L. Hempstead (1972) The Deposition
and Clearance of Rofenaid in Chicken and Turkey Eggs. Poultry Science 51, 1181-
1187
Martinez, M.N. (1998) Use of Pharmacokinetics in Veterinary Medicine. III:
Physicochemical Properties of Pharmaceuticals. Journal of the American Veterinary
Medical Association 213, 1274-1277
Mattern, E. M., C. A. Kan and H.W. van Gend (1990) An Automated HPLC
Determination of Meticlorpindol in Eggs with UV Absorbance Detection, Using on-line
Dialysis and Pre-Concentration as Sample Clean-Up; Occurrence in and Carry Over
to Eggs. Zeitschrift für Lebensmitteluntersuchung und Forschung 190, 25-30
McCracken, R.J., D.E Spence, S.D. Floyd and D.G. Kennedy (2001)
Evaluation of the Residues of Furazolidone and its Metabolite, 3-amino-2-
oxazolidone (AOZ), in Eggs. Food Additives and Contaminants, 18, 954-959
73

5. References
Nagata, T., M. Saeki, T. Iida, M. Kataoka and R. Ino, (1989) Transfer of
Dietary Sulfadimethoxine and Sulfamonomethoxine into Eggs and their
Disappearance from Eggs. Journal of the Food and Hygiene Society Japan 30, 373-
383
Nagata, T., M. Saeki, T. Iida, M. Kataoka and R. Ino (1990) Residue Studies in
Egg on Pyrimethamine Given with Feed. Journal of the Food and Hygiene Society
Japan 31, 297-302
Nagata, T., M. Saeki, T. Iida, M. Kataoka and S. Shikano (1991) High
Performance Liquid Chromatographic Determination of Trimethoprim Residues in
Egg Yolk and Albumen in a Feeding Experiment. British Veterinary Journal 147, 346-
351
Nagata, T., M. Saeki, T. Iida, M. Kataoka and S. Shik (1992) Determination of
Pyrimethamine and Sulphadimethoxine Residues in Eggs by High Performance
Liquid Chromatography. British Poultry Science 33, 953-961
Nagy, J., J. Sokol, P. Turek, L. Korimova and H. Rozanska (1997) Residues of
Oxytetracycline in Egg White and Yolk after Medication of Laying Hens. Bulletin of
the Veterinary Institute Pulawy 41, 141-147
Nesheim, M.C., R.E. Austic and L.E. Card (1979) Poultry Production, Lea &
Febiger, Philadelphia, 43
Nose, N., Y. Hoshino, Y. Kikuchi, H. Masaki, S. Horie and S. Kawauchi (1982)
Residues of Synthetic Antibacterial Food Additives in Tissues and Eggs of Chickens.
Journal of the Food and Hygiene Society Japan 23, 246-252
OECD Guideline for the Testing of Chemicals (1981) Partition Coefficient (n-
octanol/water) (Flask-shaking method). Guideline 107, 9 pp.
Oikawa, H., K. Nakamoto, K. Hirota and K. Katagiri (1977) Clearance of
Sulfamethoxazole in Eggs and Tissues of Chickens. Poultry Science 56, 813-821
Omija, B., E. S. Mitema and T.E. Maitho (1994) Oxytetracycline Residue
Levels in Chicken Eggs after Oral Administration of Medicated Drinking Water to
Laying Chickens. Food Additives and Contaminants 11, 641-647
Onodera, T., S. I. Inoue, A. Kasaharaand Y. Oshima (1970) Experimental
Studies on Sulfadimethoxine in Fowls III. Egg- and other Tissue-Levels of
Sulfonamides. Japanese Journal of Veterinary Science 32, 275-283
Petz, M. (1984) Rückstände in Ei nach Behandlung von Legehennen mit
Chloramphenicol und Furazolidon. Archiv für Lebensmittel Hygiene 35, 51-54
74

5. References
Petz, M. (1993) Distribution of Sulfaquinoxaline and Three Nitrofurans
between Yolk and Egg White during Medication and Depletion. Euroresidue II, 528-
532
Posyniak, A., S. Semeniuk, J. Zmudzki, J. Niedzielska and B. Biernacki (1996)
Residues of Dimetridazole in Eggs after Treatment of Laying Hens. Veterinary
Research Communications 20, 167-174
Rall, D.P., J.R. Stabenau and C.G. Zubrod. (1959) Distribution of Drugs
between Blood and Cerebrospinal Fluid: General Methodology and Effect of pH
Gradients. Journal of Pharmacology and Experimental Therapeutics 125, 185-193
Rana, R., M. S. Akhtar and M. Nawaz (1993) Residues of Sulfaquinoxaline in
Poultry Products. Pakistan Veterinary Journal 13, 161-166
Riberzani, A., G. Fedrizzi and S. Espositi (1993) Presence of Flumequine in
Eggs: Experimental Results of a Simulated Field Trial. Euroresidue II, 576-580
Righter, H. F., J. M. Worthington, H.E. Zimmerman and H.D. Mercer (1970)
Tissue-Residue Depletion of Sulfaquinoxaline in Poultry. American Journal of
Veterinary Research 31, 1051-1054
Romvary, A. and F. Simon (1992) Sulfonamide Residues in Eggs. Acta
Veterinaria Hungarica 40, 99-106
Roudaut, B. (1993) Residues of Sulphonamides in Eggs Following Oral
Medication of Laying Hens. Euroresidue II, 591-595
Roudaut, B. (1998) Elimination of Oxolinic Acid in Eggs after Oral Treatment of
Laying Hens. British Poultry Science 39, 47-52
Roudaut, B. and J. Boisseau (1990) Elimination of Oxolinic Acid in Laying
Hens. In: Residues of Veterinary Drugs in Food; Proceedings Euroresidue I 21-23
may 1990, Noorwijkerhout. 311-314
Roudaut, B. and J. P. Moretain (1990) Residues of Macrolide Antibiotics in
Eggs Following Medication of Laying Hens. British Poultry Science 31, 661-675
Roudaut, B., J. P. Moretain and J. Boisseau (1987a) Excretion of
Oxytetracycline in Eggs after Medication of Laying Hens. Food Additives and
Contaminants 4, 297-307
Roudaut, B., J. P. Moretain and J. Boisseau (1987b) Residus d'ampicilline
dans les oeufs apres administration orale et parenterale. Receuil Medicine
Veterinaire 163, 43-47
Roudaut, B., J. P. Moretain and J. Boisseau (1989) Excretion of Tetracycline
75

5. References
and Chlortetracycline in Eggs after Oral Medication of Laying Hens. Food Additives
and Contaminants 6, 71-78
Roudaut B. and M. Garnier (2002) Sulphonamide Residues in Eggs following
Drug Administration via the Drinking Water. Food Additives and Contaminants 19,
373-378
Sakano, T., S. Masuda and T. Amano (1981) Determination of Residual
Diaveridine and Sulfaquinoxaline in Hen's Egg, Chicken Plasma and Tissues by
High-Performance Liquid Chromatography. Chemical Pharmaceutical Bulletin 29,
2290-2295
Samaha, I., A. Ebrecht, L. Ellerbroek, S. Matthes and S. Wenzel (1991)
Flumequine Residues in Eggs. Archiv für Lebensmittel Hygiene 42, 37-39
Sambeth, W., F. Bauer and G. Dost (1985) Safety Evaluation of Sacox in
Poultry. Zootechnica International April, 48-51
Samouris, G., H. Tsoukali-Papadopoulou, B. Nathanael and V. Mirtsou-Fidani
(1998) Chloramphenicol Residues in Albumen and Yolk of Hen's Eggs after
Experimental Administration. Archiv für Geflügelkunde 62, 83-85
Schanker, L.S., J.M. Johnson and J.J. Jeffrey (1964) Rapid Passage of
Organic Anions into Human Red Cells. American Journal of Physiology 207, 503-508
Seib, U. (1991) Zum Rückstandsverhalten von Sulfadimidin in Eieren, Follikeln
und Geweben von Legehennen. Dissertation Universität Kiel, 130 pp
Shore, P.A. and B.B. Brodie (1957) The Gastric Secretion of Drugs: A pH
Partition Hypothesis. Journal of Pharmacology and Experimental Therapeutics 119,
361-369
Sinigoj-Gacnik, K. (1996) Residues of Salinomycin in Eggs, the Influence of
Thermal Treatment. Euroresidue III, 859-862
Sisodia, C. S. and R. H. Dunlop (1972) Chloramphenicol Residue in Eggs.
Canadian Veterinary Journal 13, 279-282
Tomassen, M. J. H., H. J. Keukens and C.A. Kan(1996a) Overdracht van lage
doseringen doxycycline van voer naar ei. RIKILT rapport 96.36, 11 pp
Tomassen, M. J. H., H. J. Keukens and C.A. Kan (1996b) Overdracht van lage
doseringen sulfadiazine van voer naar ei. RIKILT rapport 96.37, 10 pp
van Dijk, J., H. J. Keukens and C.A. Kan (1997) Overdracht van lage
doseringen ivermectine van voer naar ei. RIKILT rapport 97.38, 11 pp
van Leeuwen, W. and H. W. van Gend (1989) Geautomatiseerde bepaling van
76

5. References
flumequine in heelei, melk en vlees met behulp van continuous flow / hoge prestatie
vloeistofchromatografie (CF/HPLC). Rapport KvW Utrecht IR/73/03/89/D33, 17 pp
Yoshida, M., D. Kubota, S. Yonezawa, H. Nakamura, H. Azechi and N.
Terakado (1971) Transfer of Dietary Spiramycin into the Eggs and its Residue in the
Liver of Laying Hen. Japanese Poultry Science 8, 103-110
Yoshida, M., D. Kubota, S. Yonezawa, H. Nakamura, R. Yamaoka and H.
Yoshimura (1973a) Transfer of Dietary Chlortetracycline into Eggs and its
Disappearance from Eggs and from the Liver. Japanese Poultry Science 10, 261-268
Yoshida, M., D. Kubota, S. Yonezawa, H. Nakamura, R. Yamaoka and H.
Yoshimura (1973b) Transfer of Dietary Oxytetracycline into Eggs and its
Disappearance from Eggs. Japanese Poultry Science 10, 254-260
Yoshida, M., D. Kubota, S. Yonezawa, H. Nakamura and R. Yamaoka (1973c)
Transfer of Dietary Tylosin into the Eggs and its Residue in the Liver of Laying Hen.
Japanese Poultry Science 10, 29-36
Yoshida, M., D. Kubota, S. Yonezawa, H. Nogawa, H. Yoshimura and O. Ito
(1976) Transfer of Dietary Kanamycin into Eggs and its Disappearance from Eggs
and from the Liver and Bile. Japanese Poultry Science 13, 129-134
Yoshimura, H., O. Itoh, K. Kondo, S. Yonezawa and S. Nagura (1978)
Residues of Macrolide Antibiotics in Eggs Laid by Hens Given Medicated Drinking
Water. Annual Report of the National Veterinary Assay Laboratory, 4 pp
Yoshimura, H., N. Osawa, F.S.C. Rasa, D. Hermawati, S. Werdiningsih,
N.M.R. Isriyanthi, and T. Sugimori (1991) Residues of Doxycycline and
Oxytetracycline in Eggs after Medication via Drinking Water to Laying Hens. Food
Additives and Contaminants 8, 65-69
77

ID-Lelystad B.V. P.O. Box 65
8200 AB Lelystad The Netherlands Cover Design: A. van Welie
ID-Lelystad Report number: 03/0008615 April 2003
Alle rechten voorbehouden. Niets uit deze uitgave mag worden vermenigvuldigd of openbaar gemaakt door middel van druk,fotokopie microfilm of op welke andere wijze dan ook, zonder voorafgaande toestemming van ID-Lelystad.