RESIDUAL STRENGTH PRESSURE TESTS AND NONLINEAR ANALYSES …mln/ltrs-pdfs/NASA-98-2jcaa-rdy.pdf ·...
19
1 RESIDUAL STRENGTH PRESSURE TESTS AND NONLINEAR ANALYSES OF STRINGER- AND FRAME-STIFFENED ALUMINUM FUSELAGE PANELS WITH LONGITUDINAL CRACKS Richard D. Young, Marshall Rouse, Damodar R. Ambur, and James H. Starnes, Jr. NASA Langley Research Center Hampton, VA 23381 Tel: 757-864-2894 Fax: 757-864-7791 [email protected] ABSTRACT The results of residual strength pressure tests and nonlinear analyses of stringer- and frame-stiffened alumi- num fuselage panels with longitudinal cracks are presented. Two types of damage are considered: a longi- tudinal crack located midway between stringers, and a longitudinal crack adjacent to a stringer and along a row of fasteners in a lap joint that has multiple-site damage (MSD). In both cases, the longitudinal crack is centered on a severed frame. The panels are subjected to internal pressure plus axial tension loads. The axial tension loads are equivalent to a bulkhead pressure load. Nonlinear elastic-plastic residual strength analyses of the fuselage panels are conducted using a finite element program and the crack-tip-opening-angle (CTOA) fracture criterion. Predicted crack growth and residual strength results from nonlinear analyses of the stiffened fuselage panels are compared with experimental measurements and observations. Both the test and analysis results indicate that the presence of MSD affects crack growth stability and reduces the residual strength of stiffened fuselage shells with long cracks. 1. INTRODUCTION The fail-safe design philosophy applied to transport aircraft fuselage structures requires that the structures retain adequate structural integrity in the presence of discrete source damage or fatigue cracks. As econom- ic factors encourage the use of commercial and military transport aircraft well beyond their original design requirement, it has become increasingly important to develop methods to predict accurately the residual strength of structures with cracks. The goal of NASA’s Aircraft Structural Integrity Program is to develop a verified nonlinear structural analysis methodology for stiffened structures with damage and subjected to combined internal pressure and mechanical loads. The approach to accomplish this goal has been to: de- velop hierarchical modeling strategies required to represent the multi-dimensional length scales present in fuselage shells with cracks and multiple-site damage (MSD); develop material and geometric nonlinear shell analysis capabilities and conduct nonlinear analyses of stiffened shells subjected to internal pressure and mechanical loads; and conduct experiments to verify analyses and to identify critical behavioral char- acteristics. The present paper presents recent results of residual strength pressure tests and nonlinear analyses of string- er- and frame-stiffened aluminum fuselage panels with longitudinal cracks. The tests and analyses, per- formed by the Structural Mechanics Branch at the NASA Langley Research Center, were intended to verify the analyses methods and to identify critical behavioral characteristics of the crack growth in generic wide-
Transcript of RESIDUAL STRENGTH PRESSURE TESTS AND NONLINEAR ANALYSES …mln/ltrs-pdfs/NASA-98-2jcaa-rdy.pdf ·...
1
RESIDUAL STRENGTH PRESSURE TESTS AND NONLINEAR ANALYSES OF STRINGER- AND FRAME-STIFFENED ALUMINUM FUSELAGE PANELS WITH LONGITUDINAL CRACKS
Richard D. Young, Marshall Rouse, Damodar R. Ambur, and James H. Starnes, Jr.NASA Langley Research Center
Hampton, VA 23381Tel: 757-864-2894Fax: 757-864-7791
ABSTRACT
The results of residual strength pressure tests and nonlinear analyses of stringer- and frame-stiffened alumi-num fuselage panels with longitudinal cracks are presented. Two types of damage are considered: a longi-tudinal crack located midway between stringers, and a longitudinal crack adjacent to a stringer and along arow of fasteners in a lap joint that has multiple-site damage (MSD). In both cases, the longitudinal crack iscentered on a severed frame. The panels are subjected to internal pressure plus axial tension loads. The axialtension loads are equivalent to a bulkhead pressure load. Nonlinear elastic-plastic residual strength analysesof the fuselage panels are conducted using a finite element program and the crack-tip-opening-angle(CTOA) fracture criterion. Predicted crack growth and residual strength results from nonlinear analyses ofthe stiffened fuselage panels are compared with experimental measurements and observations. Both the testand analysis results indicate that the presence of MSD affects crack growth stability and reduces the residualstrength of stiffened fuselage shells with long cracks.
1. INTRODUCTION
The fail-safe design philosophy applied to transport aircraft fuselage structures requires that the structuresretain adequate structural integrity in the presence of discrete source damage or fatigue cracks. As econom-ic factors encourage the use of commercial and military transport aircraft well beyond their original designrequirement, it has become increasingly important to develop methods to predict accurately the residualstrength of structures with cracks. The goal of NASA’s Aircraft Structural Integrity Program is to developa verified nonlinear structural analysis methodology for stiffened structures with damage and subjected tocombined internal pressure and mechanical loads. The approach to accomplish this goal has been to: de-velop hierarchical modeling strategies required to represent the multi-dimensional length scales present infuselage shells with cracks and multiple-site damage (MSD); develop material and geometric nonlinearshell analysis capabilities and conduct nonlinear analyses of stiffened shells subjected to internal pressureand mechanical loads; and conduct experiments to verify analyses and to identify critical behavioral char-acteristics.
The present paper presents recent results of residual strength pressure tests and nonlinear analyses of string-er- and frame-stiffened aluminum fuselage panels with longitudinal cracks. The tests and analyses, per-formed by the Structural Mechanics Branch at the NASA Langley Research Center, were intended to verifythe analyses methods and to identify critical behavioral characteristics of the crack growth in generic wide-
2
body fuselage panels with long cracks. Two damage conditions are considered: a longitudinal crack locatedmidway between stringers, and a longitudinal crack adjacent to a stringer and along a row of fasteners in alap joint that has multiple-site damage (MSD). The loading condition for the panels is internal pressure plusaxial tension loads. The axial tension loads are equivalent to a bulkhead pressure load. The fuselage paneltests are described and experimental results are reported. Then, analysis and finite element modeling meth-ods using the STructural Analysis of General Shells (STAGS) program
1
are described. A description of thecrack-tip-opening-angle (CTOA) skin fracture criterion
2,3
and the procedure for defining fracture parame-ters based on small laboratory specimens are presented. Predicted crack growth and residual strength resultsfrom nonlinear analyses on the stiffened fuselage panels are then compared with experimental measure-ments and observations.
2. EXPERIMENTS
Two stringer- and frame-stiffened aluminum fuselage panels with longitudinal cracks were tested in thepressure-box test machine at NASA Langley Research Center. The test specimens, the test machine, andthe test method, are described. Then, the test results are presented.
2.1 TEST SPECIMENS
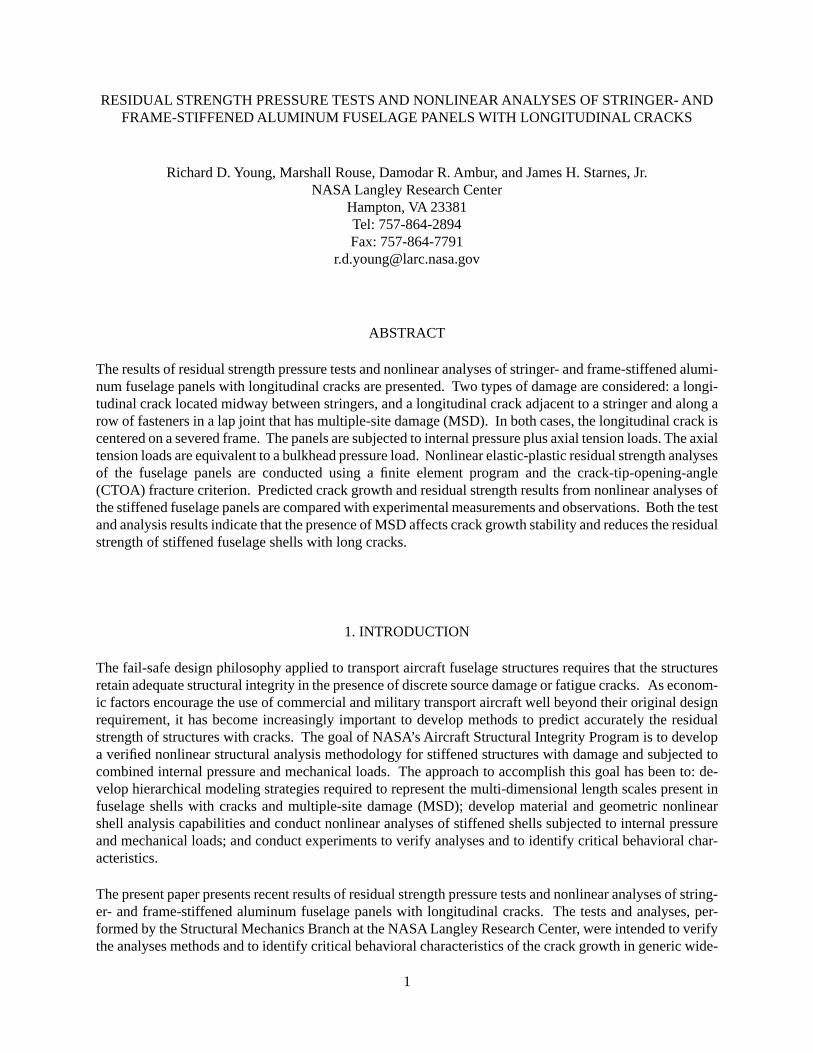
The first fuselage panel tested in this study, ASIP1, has six stringers and three frames, and is shown in Fig. 1prior to testing. The overall dimensions of the panel include a 122-in. radius, a 72-in. length, and a 63-in.arc width. The skin is 0.063-in.-thick 2024-T3 aluminum with the sheet rolling direction parallel to thestringers. The stringers are 7075-T6 aluminum Z-section stringers with a stringer spacing of 8.1 in. Theframes are 7075-T6 aluminum I-section frames with a frame spacing of 22 in. There are 0.063-in.-thick2024-T3 aluminum circumferential tear straps, bonded to the skin, and located midway between the frames.The stringers and frames are riveted to the skin, and the frames are connected to the stringers by rivetedstringer clips. Aluminum doublers are fastened to the curved ends of the panel between the stringers andalong the sides of the panel between the frames. These doublers distribute the loads from the axial and hoopload plates into the panel skin, and they are slotted to be flexible in the direction parallel to the panel edges.The initial damage for panel ASIP1 was a 10-in.-long longitudinal crack, located midway between stringersand centered on a severed frame, as indicated in Fig. 1.
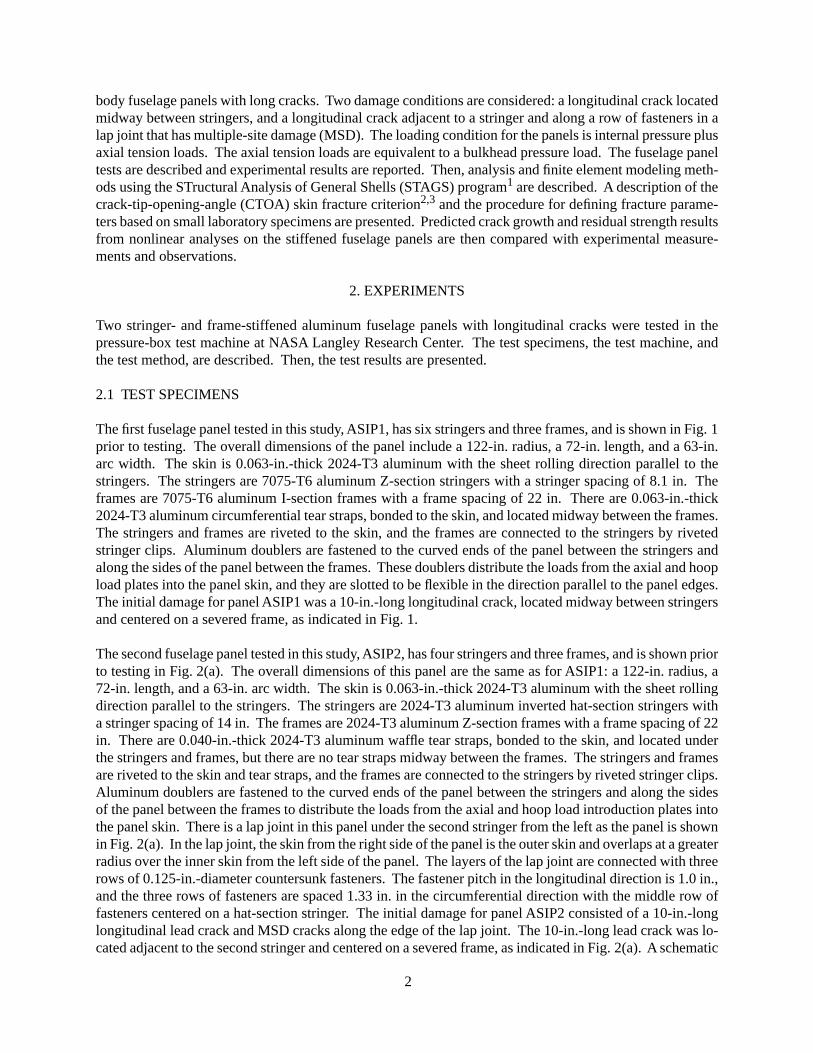
The second fuselage panel tested in this study, ASIP2, has four stringers and three frames, and is shown priorto testing in Fig. 2(a). The overall dimensions of this panel are the same as for ASIP1: a 122-in. radius, a72-in. length, and a 63-in. arc width. The skin is 0.063-in.-thick 2024-T3 aluminum with the sheet rollingdirection parallel to the stringers. The stringers are 2024-T3 aluminum inverted hat-section stringers witha stringer spacing of 14 in. The frames are 2024-T3 aluminum Z-section frames with a frame spacing of 22in. There are 0.040-in.-thick 2024-T3 aluminum waffle tear straps, bonded to the skin, and located underthe stringers and frames, but there are no tear straps midway between the frames. The stringers and framesare riveted to the skin and tear straps, and the frames are connected to the stringers by riveted stringer clips.Aluminum doublers are fastened to the curved ends of the panel between the stringers and along the sidesof the panel between the frames to distribute the loads from the axial and hoop load introduction plates intothe panel skin. There is a lap joint in this panel under the second stringer from the left as the panel is shownin Fig. 2(a). In the lap joint, the skin from the right side of the panel is the outer skin and overlaps at a greaterradius over the inner skin from the left side of the panel. The layers of the lap joint are connected with threerows of 0.125-in.-diameter countersunk fasteners. The fastener pitch in the longitudinal direction is 1.0 in.,and the three rows of fasteners are spaced 1.33 in. in the circumferential direction with the middle row offasteners centered on a hat-section stringer. The initial damage for panel ASIP2 consisted of a 10-in.-longlongitudinal lead crack and MSD cracks along the edge of the lap joint. The 10-in.-long lead crack was lo-cated adjacent to the second stringer and centered on a severed frame, as indicated in Fig. 2(a). A schematic
3
of the lap joint, shown in Fig. 2(b), indicates that the lead crack was along the third row of fasteners in thelap joint. The MSD cracks were introduced prior to panel assembly by making small longitudinal cuts inthe outer skin of the lap joint that extend 0.05 in. on each side of the fastener countersink for each fastenerin the third row of fasteners. The resulting initial damage state was a 10-in.-long longitudinal lead crackwith 0.33-in.-long MSD cracks in the outer skin, spaced ahead of the lead crack with a 1 in. pitch. The leadcrack and MSD cracks were defined to be along the ‘critical third row of fasteners’ which is where lap jointeccentricity, pressure pillowing of the skin, and the fastener countersink combine to promote crack growthin the outer skin.
Figure 1. Panel ASIP1 prior to testing.
Tear strap
Crack
Figure 2. Panel ASIP2 prior to testing.
Crack
(a) Photograph of panel ASIP2
1 in.
0.33 in.
MSD typ
1/8 D fastener
Outer skin
Inner skin
Lead crack
(b) Lap joint detail with lead crack andMSD cracks
4
2.2 PRESSURE-BOX TEST MACHINE AND TEST METHOD
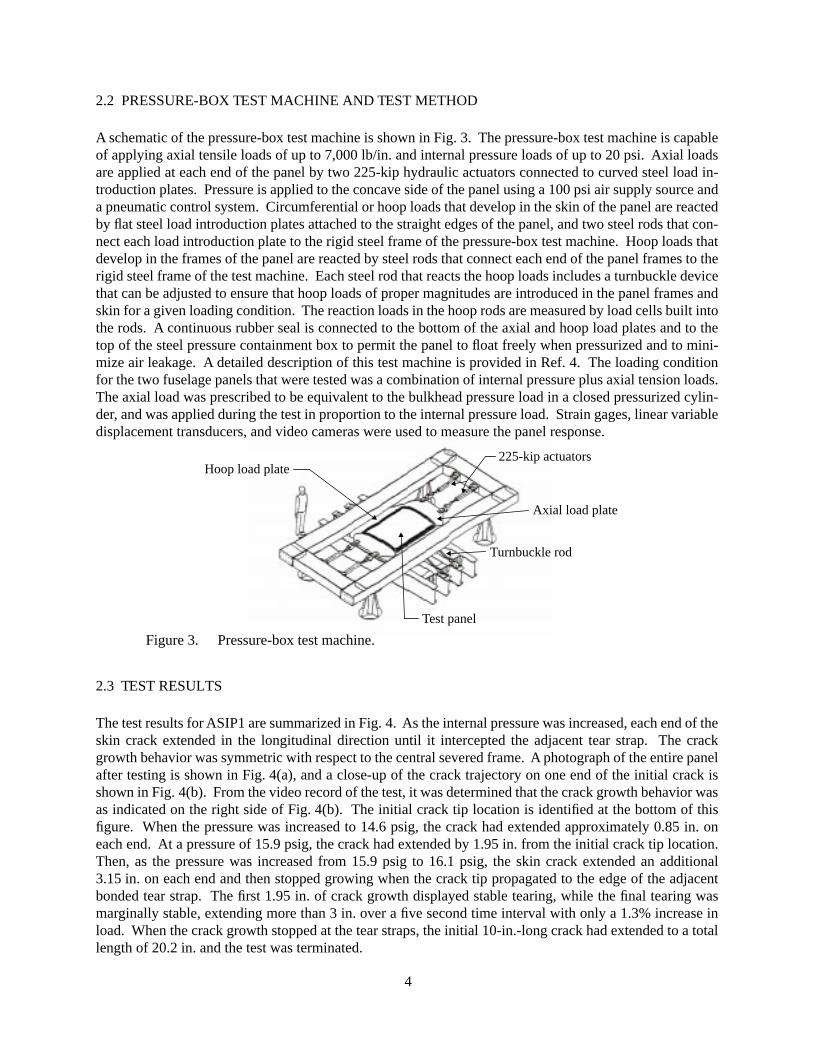
A schematic of the pressure-box test machine is shown in Fig. 3. The pressure-box test machine is capableof applying axial tensile loads of up to 7,000 lb/in. and internal pressure loads of up to 20 psi. Axial loadsare applied at each end of the panel by two 225-kip hydraulic actuators connected to curved steel load in-troduction plates. Pressure is applied to the concave side of the panel using a 100 psi air supply source anda pneumatic control system. Circumferential or hoop loads that develop in the skin of the panel are reactedby flat steel load introduction plates attached to the straight edges of the panel, and two steel rods that con-nect each load introduction plate to the rigid steel frame of the pressure-box test machine. Hoop loads thatdevelop in the frames of the panel are reacted by steel rods that connect each end of the panel frames to therigid steel frame of the test machine. Each steel rod that reacts the hoop loads includes a turnbuckle devicethat can be adjusted to ensure that hoop loads of proper magnitudes are introduced in the panel frames andskin for a given loading condition. The reaction loads in the hoop rods are measured by load cells built intothe rods. A continuous rubber seal is connected to the bottom of the axial and hoop load plates and to thetop of the steel pressure containment box to permit the panel to float freely when pressurized and to mini-mize air leakage. A detailed description of this test machine is provided in Ref. 4. The loading conditionfor the two fuselage panels that were tested was a combination of internal pressure plus axial tension loads.The axial load was prescribed to be equivalent to the bulkhead pressure load in a closed pressurized cylin-der, and was applied during the test in proportion to the internal pressure load. Strain gages, linear variabledisplacement transducers, and video cameras were used to measure the panel response.
2.3 TEST RESULTS
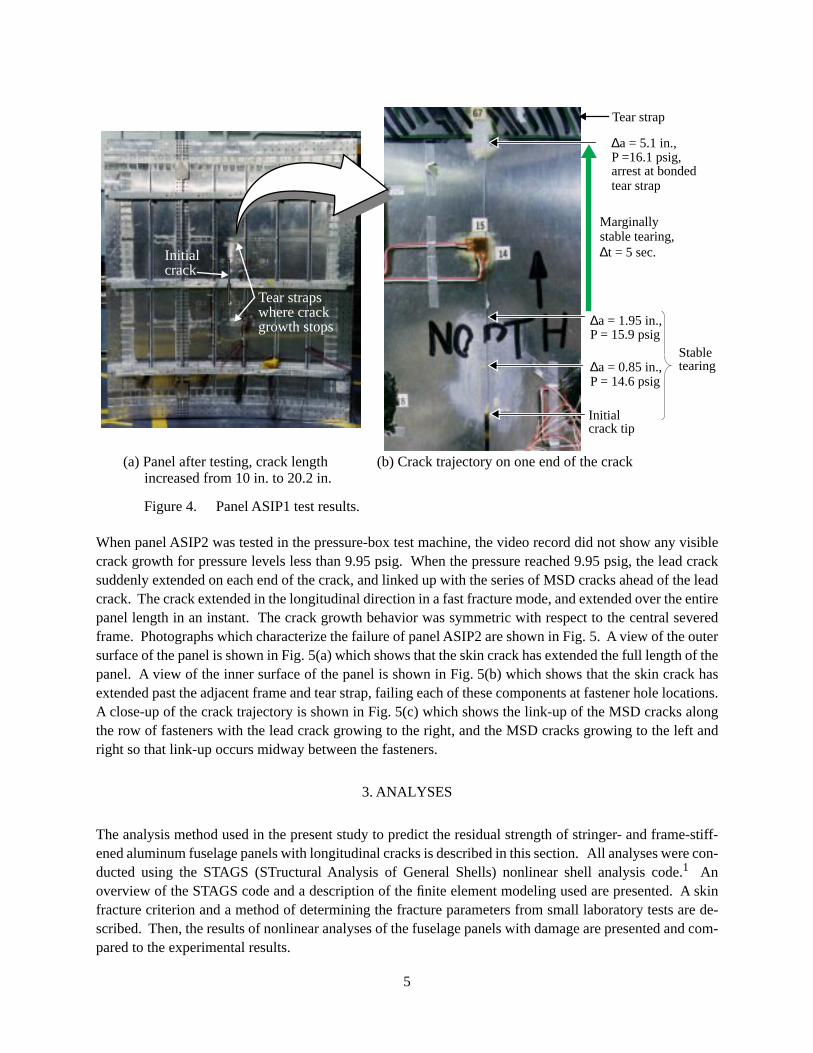
The test results for ASIP1 are summarized in Fig. 4. As the internal pressure was increased, each end of theskin crack extended in the longitudinal direction until it intercepted the adjacent tear strap. The crackgrowth behavior was symmetric with respect to the central severed frame. A photograph of the entire panelafter testing is shown in Fig. 4(a), and a close-up of the crack trajectory on one end of the initial crack isshown in Fig. 4(b). From the video record of the test, it was determined that the crack growth behavior wasas indicated on the right side of Fig. 4(b). The initial crack tip location is identified at the bottom of thisfigure. When the pressure was increased to 14.6 psig, the crack had extended approximately 0.85 in. oneach end. At a pressure of 15.9 psig, the crack had extended by 1.95 in. from the initial crack tip location.Then, as the pressure was increased from 15.9 psig to 16.1 psig, the skin crack extended an additional3.15 in. on each end and then stopped growing when the crack tip propagated to the edge of the adjacentbonded tear strap. The first 1.95 in. of crack growth displayed stable tearing, while the final tearing wasmarginally stable, extending more than 3 in. over a five second time interval with only a 1.3% increase inload. When the crack growth stopped at the tear straps, the initial 10-in.-long crack had extended to a totallength of 20.2 in. and the test was terminated.
Hoop load plate
Axial load plate
Turnbuckle rod
Test panel
225-kip actuators
Figure 3. Pressure-box test machine.
5
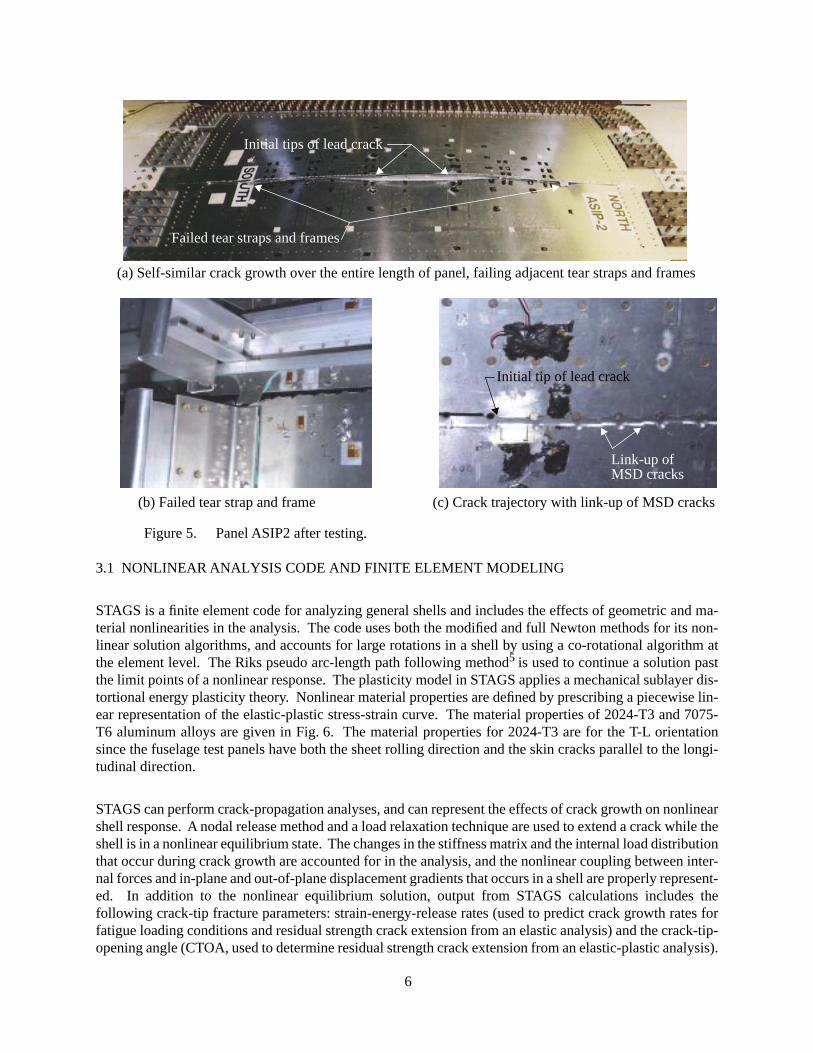
When panel ASIP2 was tested in the pressure-box test machine, the video record did not show any visiblecrack growth for pressure levels less than 9.95 psig. When the pressure reached 9.95 psig, the lead cracksuddenly extended on each end of the crack, and linked up with the series of MSD cracks ahead of the leadcrack. The crack extended in the longitudinal direction in a fast fracture mode, and extended over the entirepanel length in an instant. The crack growth behavior was symmetric with respect to the central severedframe. Photographs which characterize the failure of panel ASIP2 are shown in Fig. 5. A view of the outersurface of the panel is shown in Fig. 5(a) which shows that the skin crack has extended the full length of thepanel. A view of the inner surface of the panel is shown in Fig. 5(b) which shows that the skin crack hasextended past the adjacent frame and tear strap, failing each of these components at fastener hole locations.A close-up of the crack trajectory is shown in Fig. 5(c) which shows the link-up of the MSD cracks alongthe row of fasteners with the lead crack growing to the right, and the MSD cracks growing to the left andright so that link-up occurs midway between the fasteners.
3. ANALYSES
The analysis method used in the present study to predict the residual strength of stringer- and frame-stiff-ened aluminum fuselage panels with longitudinal cracks is described in this section. All analyses were con-ducted using the STAGS (STructural Analysis of General Shells) nonlinear shell analysis code.
1
Anoverview of the STAGS code and a description of the finite element modeling used are presented. A skinfracture criterion and a method of determining the fracture parameters from small laboratory tests are de-scribed. Then, the results of nonlinear analyses of the fuselage panels with damage are presented and com-pared to the experimental results.
Figure 4. Panel ASIP1 test results.
Tear straps
Initial
Initial
∆a = 5.1 in., P =16.1 psig,
∆a = 0.85 in.,P = 14.6 psig
∆a = 1.95 in.,P = 15.9 psig
Marginally
∆t = 5 sec.
arrest at bonded
Tear strap
tear strap
where crackgrowth stops
(a) Panel after testing, crack lengthincreased from 10 in. to 20.2 in.
(b) Crack trajectory on one end of the crack
stable tearing,
Stabletearing
crack tip
crack
6
3.1 NONLINEAR ANALYSIS CODE AND FINITE ELEMENT MODELING
STAGS is a finite element code for analyzing general shells and includes the effects of geometric and ma-terial nonlinearities in the analysis. The code uses both the modified and full Newton methods for its non-linear solution algorithms, and accounts for large rotations in a shell by using a co-rotational algorithm atthe element level. The Riks pseudo arc-length path following method
5
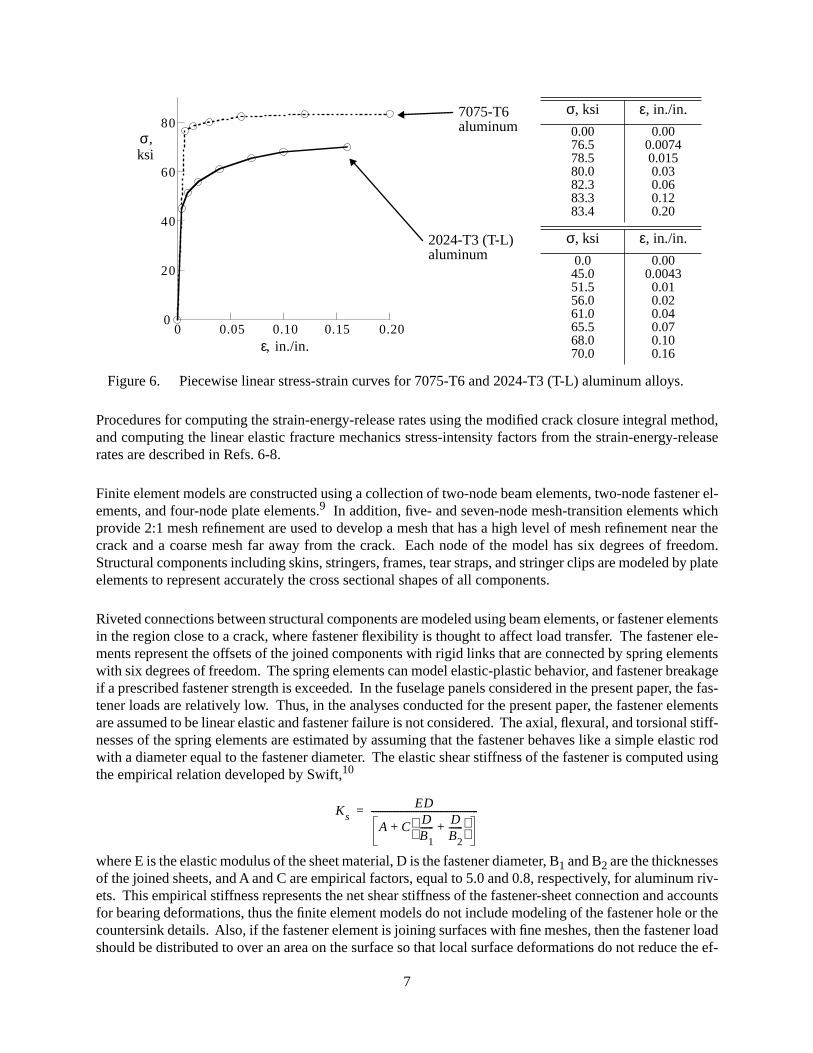
is used to continue a solution pastthe limit points of a nonlinear response. The plasticity model in STAGS applies a mechanical sublayer dis-tortional energy plasticity theory. Nonlinear material properties are defined by prescribing a piecewise lin-ear representation of the elastic-plastic stress-strain curve. The material properties of 2024-T3 and 7075-T6 aluminum alloys are given in Fig. 6. The material properties for 2024-T3 are for the T-L orientationsince the fuselage test panels have both the sheet rolling direction and the skin cracks parallel to the longi-tudinal direction.
STAGS can perform crack-propagation analyses, and can represent the effects of crack growth on nonlinearshell response. A nodal release method and a load relaxation technique are used to extend a crack while theshell is in a nonlinear equilibrium state. The changes in the stiffness matrix and the internal load distributionthat occur during crack growth are accounted for in the analysis, and the nonlinear coupling between inter-nal forces and in-plane and out-of-plane displacement gradients that occurs in a shell are properly represent-ed. In addition to the nonlinear equilibrium solution, output from STAGS calculations includes thefollowing crack-tip fracture parameters: strain-energy-release rates (used to predict crack growth rates forfatigue loading conditions and residual strength crack extension from an elastic analysis) and the crack-tip-opening angle (CTOA, used to determine residual strength crack extension from an elastic-plastic analysis).
Figure 5. Panel ASIP2 after testing.
growth stops
(b) Failed tear strap and frame
(a) Self-similar crack growth over the entire length of panel, failing adjacent tear straps and frames
Initial tips of lead crack
Failed tear straps and frames
(c) Crack trajectory with link-up of MSD cracks
Initial tip of lead crack
Link-up of MSD cracks
7
Procedures for computing the strain-energy-release rates using the modified crack closure integral method,and computing the linear elastic fracture mechanics stress-intensity factors from the strain-energy-releaserates are described in Refs. 6-8.
Finite element models are constructed using a collection of two-node beam elements, two-node fastener el-ements, and four-node plate elements.
9
In addition, five- and seven-node mesh-transition elements whichprovide 2:1 mesh refinement are used to develop a mesh that has a high level of mesh refinement near thecrack and a coarse mesh far away from the crack. Each node of the model has six degrees of freedom.Structural components including skins, stringers, frames, tear straps, and stringer clips are modeled by plateelements to represent accurately the cross sectional shapes of all components.
Riveted connections between structural components are modeled using beam elements, or fastener elementsin the region close to a crack, where fastener flexibility is thought to affect load transfer. The fastener ele-ments represent the offsets of the joined components with rigid links that are connected by spring elementswith six degrees of freedom. The spring elements can model elastic-plastic behavior, and fastener breakageif a prescribed fastener strength is exceeded. In the fuselage panels considered in the present paper, the fas-tener loads are relatively low. Thus, in the analyses conducted for the present paper, the fastener elementsare assumed to be linear elastic and fastener failure is not considered. The axial, flexural, and torsional stiff-nesses of the spring elements are estimated by assuming that the fastener behaves like a simple elastic rodwith a diameter equal to the fastener diameter. The elastic shear stiffness of the fastener is computed usingthe empirical relation developed by Swift,
10
where E is the elastic modulus of the sheet material, D is the fastener diameter, B
1
and B
2
are the thicknessesof the joined sheets, and A and C are empirical factors, equal to 5.0 and 0.8, respectively, for aluminum riv-ets. This empirical stiffness represents the net shear stiffness of the fastener-sheet connection and accountsfor bearing deformations, thus the finite element models do not include modeling of the fastener hole or thecountersink details. Also, if the fastener element is joining surfaces with fine meshes, then the fastener loadshould be distributed to over an area on the surface so that local surface deformations do not reduce the ef-
0
20
40
60
80
0 0.05 0.10 0.15 0.20ε, in./in.
σ,ksi
σ, ksi ε, in./in.
0.0076.578.580.082.383.383.4
0.000.00740.0150.030.060.120.20
σ, ksi ε, in./in.
0.045.051.556.061.065.568.070.0
0.000.00430.010.020.040.070.100.16
7075-T6
2024-T3 (T-L)
aluminum
aluminum
Figure 6. Piecewise linear stress-strain curves for 7075-T6 and 2024-T3 (T-L) aluminum alloys.
KsED
A CDB1------ D
B2------+
+------------------------------------------------=
8
fective stiffness of the fastener-sheet connection. Load distribution can be accomplished by defining rigidlinks, beam elements, or a least-squares loading condition to connect the fastener node to the surroundingshell nodes.
11
The area in the shell over which the fastener load is distributed should be of the order of thefastener cross-sectional area, since distributing the load over a larger area may inadvertently stiffen the shell.The bonded tear straps and the skin are modeled as stacked layers in a single shell with the appropriate ec-centricity included, thus ignoring any flexibility in the adhesive bond. For conditions where deformation ofthe model would cause interpenetration of elements, the general contact capability in STAGS is invoked toprevent such penetration.
To simulate the experimental conditions, the finite element models include the load introduction hardwareand replicate the loading conditions as applied in the experiments. Symmetry conditions are applied in themodel whenever possible to increase the computational efficiency.
3.2 FRACTURE CRITERION
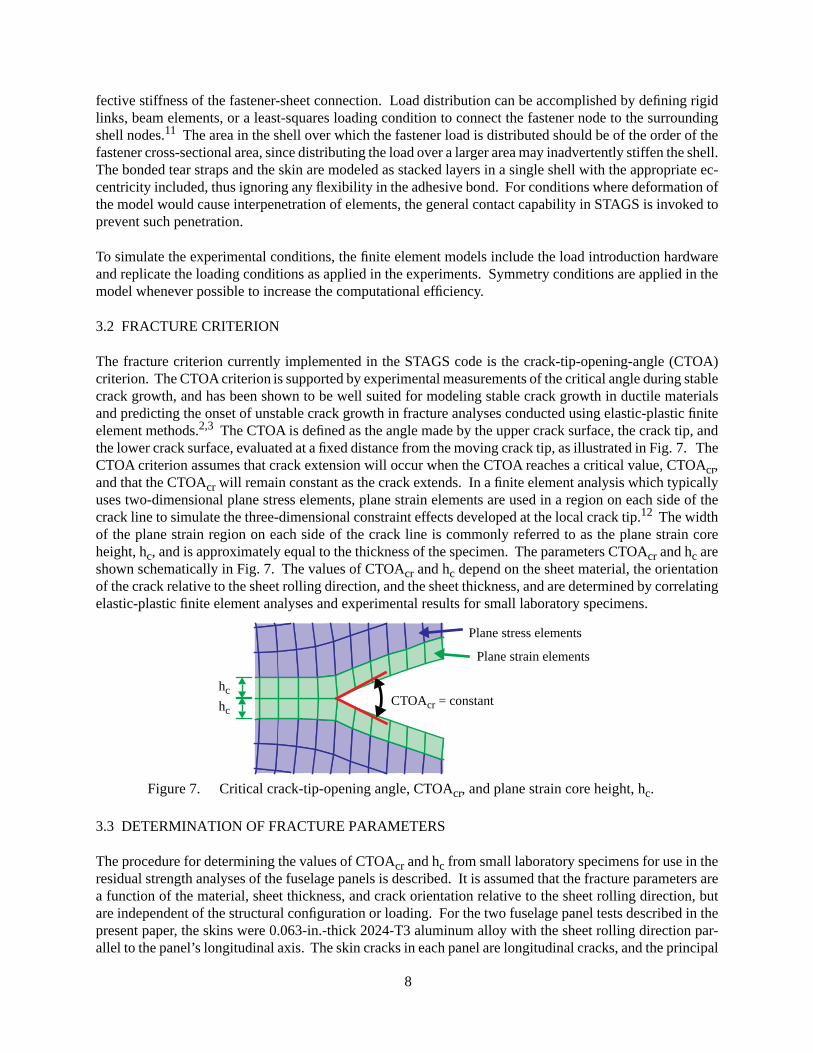
The fracture criterion currently implemented in the STAGS code is the crack-tip-opening-angle (CTOA)criterion. The CTOA criterion
is supported by experimental measurements of the critical angle during stablecrack growth, and has been shown to be well suited for modeling stable crack growth in ductile materialsand predicting the onset of unstable crack growth in fracture analyses conducted using elastic-plastic finiteelement methods.
2,3
The CTOA is defined as the angle made by the upper crack surface, the crack tip, andthe lower crack surface, evaluated at a fixed distance from the moving crack tip, as illustrated in Fig. 7. TheCTOA criterion assumes that crack extension will occur when the CTOA reaches a critical value, CTOA
cr
,and that the CTOA
cr
will remain constant as the crack extends. In a finite element analysis which typicallyuses two-dimensional plane stress elements, plane strain elements are used in a region on each side of thecrack line to simulate the three-dimensional constraint effects developed at the local crack tip.
12
The widthof the plane strain region on each side of the crack line is commonly referred to as the plane strain coreheight, h
c
, and is approximately equal to the thickness of the specimen. The parameters CTOA
cr
and h
c
areshown schematically in Fig. 7. The values of CTOA
cr
and h
c
depend on the sheet material, the orientationof the crack relative to the sheet rolling direction, and the sheet thickness, and are determined by correlatingelastic-plastic finite element analyses and experimental results for small laboratory specimens.
3.3 DETERMINATION OF FRACTURE PARAMETERS
The procedure for determining the values of CTOA
cr
and h
c
from small laboratory specimens for use in theresidual strength analyses of the fuselage panels is described. It is assumed that the fracture parameters area function of the material, sheet thickness, and crack orientation relative to the sheet rolling direction, butare independent of the structural configuration or loading. For the two fuselage panel tests described in thepresent paper, the skins were 0.063-in.-thick 2024-T3 aluminum alloy with the sheet rolling direction par-allel to the panel’s longitudinal axis. The skin cracks in each panel are longitudinal cracks, and the principal
Figure 7. Critical crack-tip-opening angle, CTOAcr, and plane strain core height, hc.
CTOAcr = constanthc
hc
Plane strain elements
Plane stress elements
9
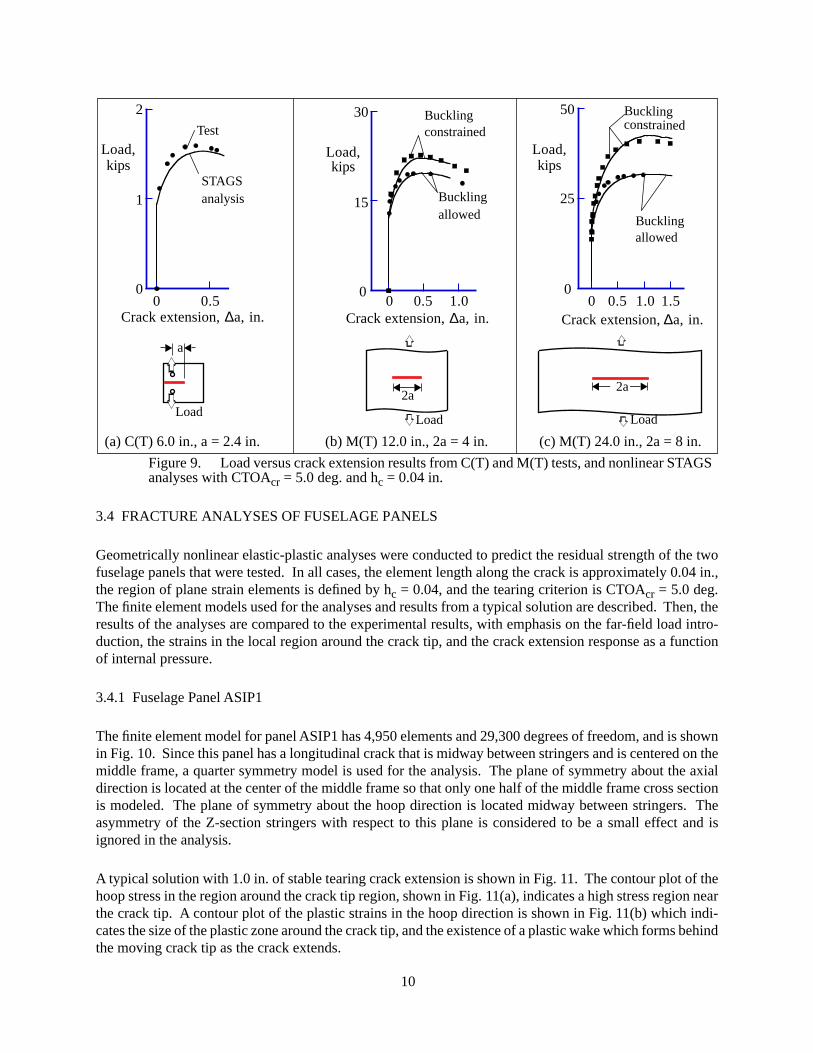
stress and yielding in the skin near the crack is in the direction perpendicular to the crack. Thus, the prin-cipal stress and yielding in the skin is perpendicular to the sheet rolling direction, which is referred to as theT-L orientation of the material. To determine the fracture parameters for this material and crack orientation,the Mechanics of Materials Branch at NASA Langley Research Center conducted compact tension (C(T))and middle-crack-tension (M(T)) laboratory tests on 0.063-in.-thick sheets of 2024-T3 aluminum with thecracks parallel to the sheet rolling direction. The compact-tension test was conducted with a 6-in.-widespecimen with an initial crack length a = 2.4 in. Middle-crack-tension tests were conducted for 12-in.-wideand 24-in.-wide specimens with initial crack lengths 2a = 4 in. and 8 in., respectively. These tests includedtests where the sheet was constrained against buckling and tests where buckling of the sheet was allowed.Personnel from the Mechanics of Materials Branch then conducted geometrically linear elastic-plastic anal-yses of the compact-tension test and the middle-crack-tension tests with buckling constrained. Analyseswere conducted using three-dimensional elements in the ZIP3D code
13,14
to determine the value of CTOA
cr
so that ZIP3D analysis results were consistent with the test results. Using three-dimensional elements elim-inates the plane stress and plane strain elements required in a two-dimensional analysis, which allows anindependent determination of CTOA
cr
. Then, analyses were conducted using two-dimensional elements inthe ZIP2D code
15,16
to determine the value of h
c
so that ZIP2D analysis results were consistent with ZIP3Dresults. By following this procedure, personnel of the Mechanics of Materials Branch determined thatCTOA
cr
= 5.0 deg. and h
c
= 0.04 in. for 0.063.in.-thick 2024-T3 aluminum for fracture in the T-L orienta-tion.
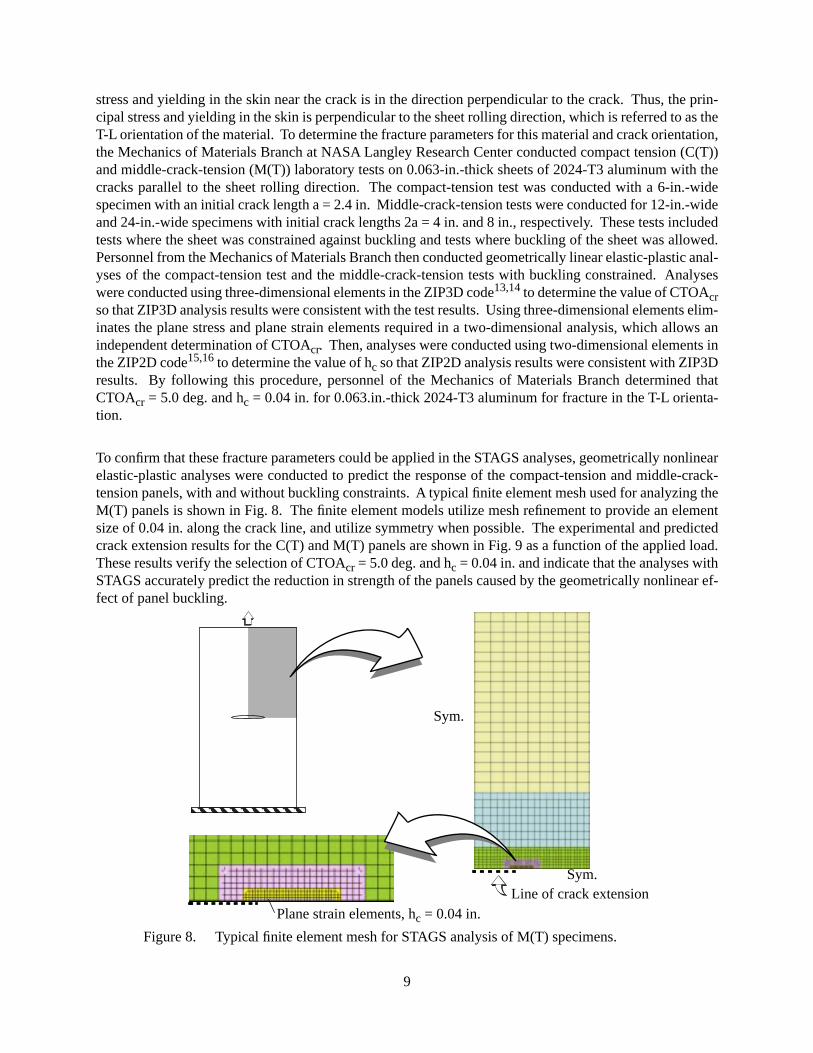
To confirm that these fracture parameters could be applied in the STAGS analyses, geometrically nonlinearelastic-plastic analyses were conducted to predict the response of the compact-tension and middle-crack-tension panels, with and without buckling constraints. A typical finite element mesh used for analyzing theM(T) panels is shown in Fig. 8. The finite element models utilize mesh refinement to provide an elementsize of 0.04 in. along the crack line, and utilize symmetry when possible. The experimental and predictedcrack extension results for the C(T) and M(T) panels are shown in Fig. 9 as a function of the applied load.These results verify the selection of CTOA
cr
= 5.0 deg. and h
c
= 0.04 in. and indicate that the analyses withSTAGS accurately predict the reduction in strength of the panels caused by the geometrically nonlinear ef-fect of panel buckling.
Sym.
Sym.
Line of crack extensionPlane strain elements, hc = 0.04 in.
Figure 8. Typical finite element mesh for STAGS analysis of M(T) specimens.
10
3.4 FRACTURE ANALYSES OF FUSELAGE PANELS
Geometrically nonlinear elastic-plastic analyses were conducted to predict the residual strength of the twofuselage panels that were tested. In all cases, the element length along the crack is approximately 0.04 in.,the region of plane strain elements is defined by h
c
= 0.04, and the tearing criterion is CTOA
cr
= 5.0 deg.The finite element models used for the analyses and results from a typical solution are described. Then, theresults of the analyses are compared to the experimental results, with emphasis on the far-field load intro-duction, the strains in the local region around the crack tip, and the crack extension response as a functionof internal pressure.
3.4.1 Fuselage Panel ASIP1
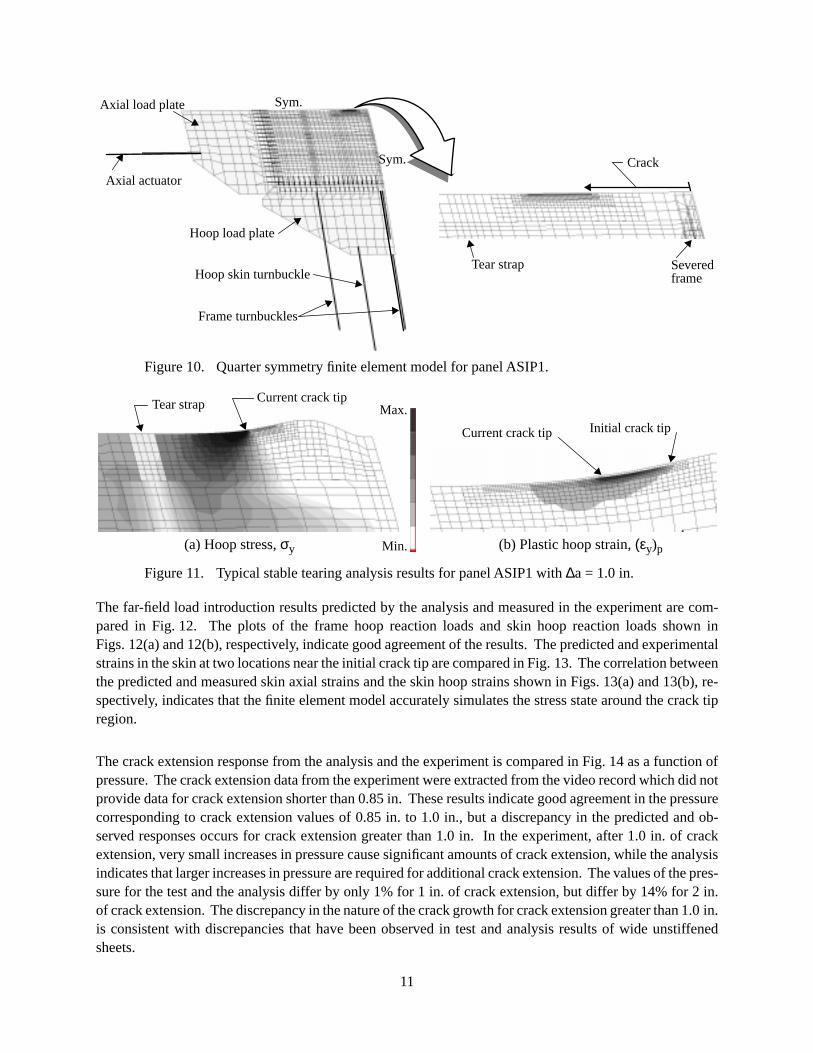
The finite element model for panel ASIP1 has 4,950 elements and 29,300 degrees of freedom, and is shownin Fig. 10. Since this panel has a longitudinal crack that is midway between stringers and is centered on themiddle frame, a quarter symmetry model is used for the analysis. The plane of symmetry about the axialdirection is located at the center of the middle frame so that only one half of the middle frame cross sectionis modeled. The plane of symmetry about the hoop direction is located midway between stringers. Theasymmetry of the Z-section stringers with respect to this plane is considered to be a small effect and isignored in the analysis.
A typical solution with 1.0 in. of stable tearing crack extension is shown in Fig. 11. The contour plot of thehoop stress in the region around the crack tip region, shown in Fig. 11(a), indicates a high stress region nearthe crack tip. A contour plot of the plastic strains in the hoop direction is shown in Fig. 11(b) which indi-cates the size of the plastic zone around the crack tip, and the existence of a plastic wake which forms behindthe moving crack tip as the crack extends.
0 0.50
1
2
Crack extension, ∆a, in.
Load,kips
2a2a
Test
Bucklingconstrained
Bucklingallowed
STAGSanalysis
Bucklingallowed
Bucklingconstrained
(b) M(T) 12.0 in., 2a = 4 in. (c) M(T) 24.0 in., 2a = 8 in.
a
(a) C(T) 6.0 in., a = 2.4 in.
Figure 9. Load versus crack extension results from C(T) and M(T) tests, and nonlinear STAGS analyses with CTOAcr = 5.0 deg. and hc = 0.04 in.
LoadLoad
Load
0 0.5 1.0 1.50
25
50
Crack extension, ∆a, in.
Load,kips
0 0.5 1.00
15
30
Crack extension, ∆a, in.
Load,kips
11
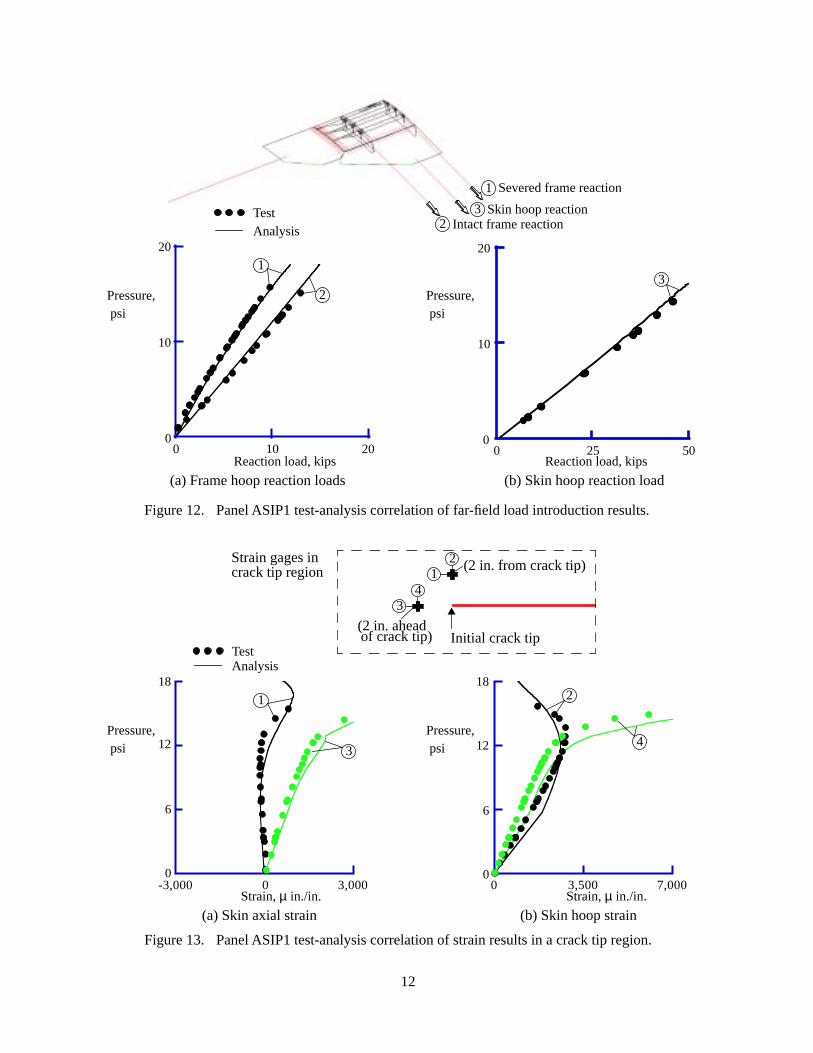
The far-field load introduction results predicted by the analysis and measured in the experiment are com-pared in Fig. 12. The plots of the frame hoop reaction loads and skin hoop reaction loads shown inFigs. 12(a) and 12(b), respectively, indicate good agreement of the results. The predicted and experimentalstrains in the skin at two locations near the initial crack tip are compared in Fig. 13. The correlation betweenthe predicted and measured skin axial strains and the skin hoop strains shown in Figs. 13(a) and 13(b), re-spectively, indicates that the finite element model accurately simulates the stress state around the crack tipregion.
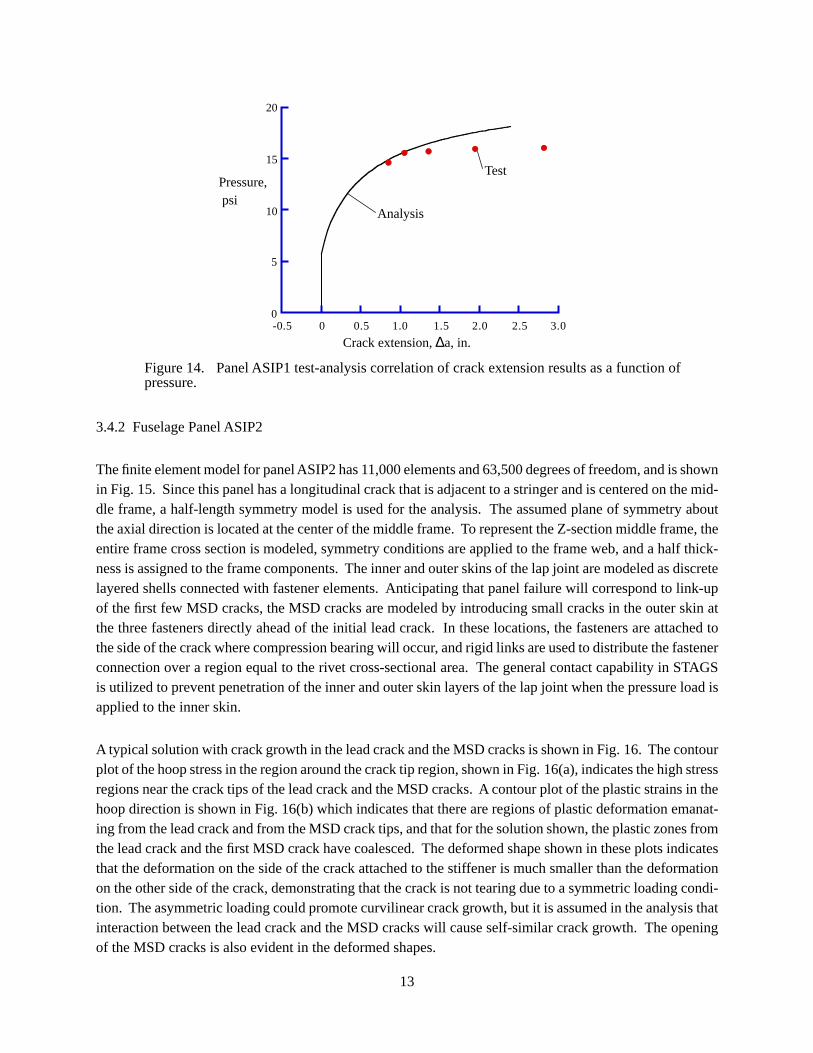
The crack extension response from the analysis and the experiment is compared in Fig. 14 as a function ofpressure. The crack extension data from the experiment were extracted from the video record which did notprovide data for crack extension shorter than 0.85 in. These results indicate good agreement in the pressurecorresponding to crack extension values of 0.85 in. to 1.0 in., but a discrepancy in the predicted and ob-served responses occurs for crack extension greater than 1.0 in. In the experiment, after 1.0 in. of crackextension, very small increases in pressure cause significant amounts of crack extension, while the analysisindicates that larger increases in pressure are required for additional crack extension. The values of the pres-sure for the test and the analysis differ by only 1% for 1 in. of crack extension, but differ by 14% for 2 in.of crack extension. The discrepancy in the nature of the crack growth for crack extension greater than 1.0 in.is consistent with discrepancies that have been observed in test and analysis results of wide unstiffenedsheets.
Sym.
Sym.
Hoop load plate
Axial actuator
Frame turnbuckles
Hoop skin turnbuckle
Axial load plate
Severed
Crack
frameTear strap
Figure 10. Quarter symmetry finite element model for panel ASIP1.
Tear strap
Figure 11. Typical stable tearing analysis results for panel ASIP1 with ∆a = 1.0 in.
Current crack tip
(a) Hoop stress, σy (b) Plastic hoop strain, (εy)p
Initial crack tipCurrent crack tip
Max.
Min.
12
0 25 500
10
20
Figure 12. Panel ASIP1 test-analysis correlation of far-field load introduction results.
Severed frame reaction
TestAnalysis
1
23 Skin hoop reaction
Intact frame reaction
0 10 200
10
20
Pressure, psi
Pressure, psi
1
23
Reaction load, kips
(a) Frame hoop reaction loads (b) Skin hoop reaction loadReaction load, kips
-3,000 0 3,0000
6
12
18
0 3,500 7,0000
6
12
18
34
Figure 13. Panel ASIP1 test-analysis correlation of strain results in a crack tip region.
TestAnalysis
1
Pressure, psi
Pressure, psi
1
34
(a) Skin axial strain (b) Skin hoop strainStrain, µ in./in.
Initial crack tip
(2 in. from crack tip)
(2 in. aheadof crack tip)
Strain gages in crack tip region
2
Strain, µ in./in.
2
13
3.4.2 Fuselage Panel ASIP2
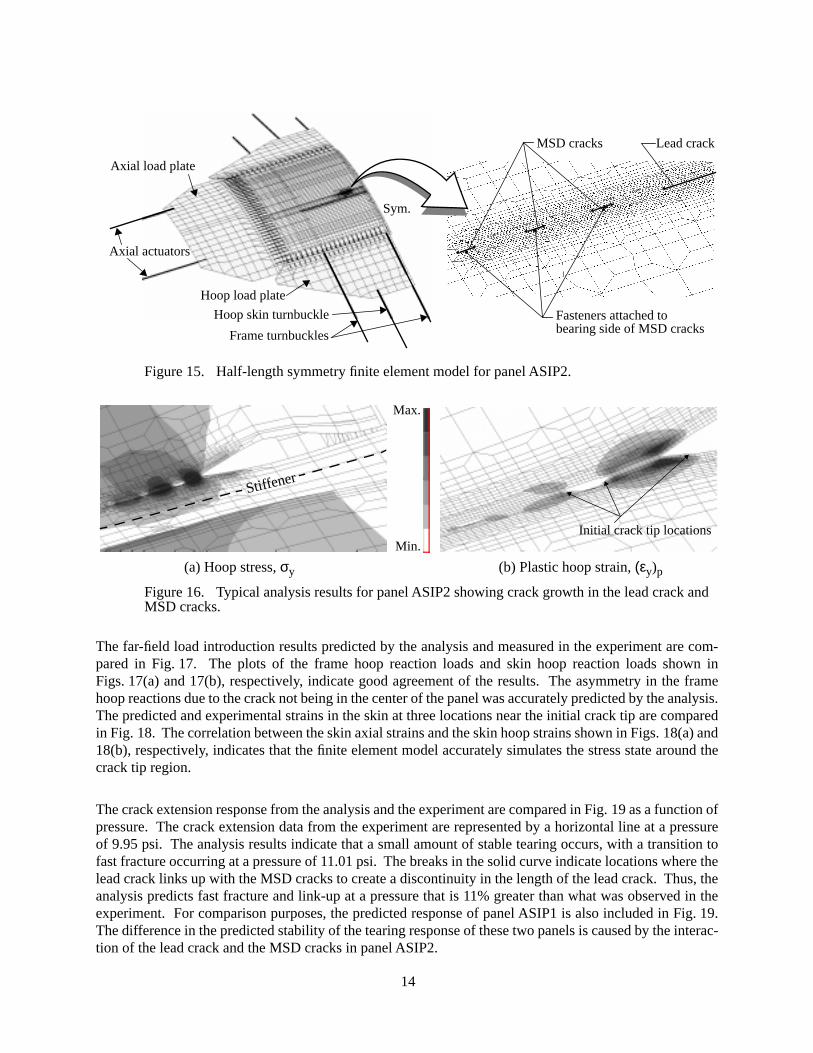
The finite element model for panel ASIP2 has 11,000 elements and 63,500 degrees of freedom, and is shownin Fig. 15. Since this panel has a longitudinal crack that is adjacent to a stringer and is centered on the mid-dle frame, a half-length symmetry model is used for the analysis. The assumed plane of symmetry aboutthe axial direction is located at the center of the middle frame. To represent the Z-section middle frame, theentire frame cross section is modeled, symmetry conditions are applied to the frame web, and a half thick-ness is assigned to the frame components. The inner and outer skins of the lap joint are modeled as discretelayered shells connected with fastener elements. Anticipating that panel failure will correspond to link-upof the first few MSD cracks, the MSD cracks are modeled by introducing small cracks in the outer skin atthe three fasteners directly ahead of the initial lead crack. In these locations, the fasteners are attached tothe side of the crack where compression bearing will occur, and rigid links are used to distribute the fastenerconnection over a region equal to the rivet cross-sectional area. The general contact capability in STAGSis utilized to prevent penetration of the inner and outer skin layers of the lap joint when the pressure load isapplied to the inner skin.
A typical solution with crack growth in the lead crack and the MSD cracks is shown in Fig. 16. The contourplot of the hoop stress in the region around the crack tip region, shown in Fig. 16(a), indicates the high stressregions near the crack tips of the lead crack and the MSD cracks. A contour plot of the plastic strains in thehoop direction is shown in Fig. 16(b) which indicates that there are regions of plastic deformation emanat-ing from the lead crack and from the MSD crack tips, and that for the solution shown, the plastic zones fromthe lead crack and the first MSD crack have coalesced. The deformed shape shown in these plots indicatesthat the deformation on the side of the crack attached to the stiffener is much smaller than the deformationon the other side of the crack, demonstrating that the crack is not tearing due to a symmetric loading condi-tion. The asymmetric loading could promote curvilinear crack growth, but it is assumed in the analysis thatinteraction between the lead crack and the MSD cracks will cause self-similar crack growth. The openingof the MSD cracks is also evident in the deformed shapes.
-0.5 0 0.5 1.0 1.5 2.0 2.5 3.00
5
10
15
20
Figure 14. Panel ASIP1 test-analysis correlation of crack extension results as a function of pressure.
Test
Analysis
Pressure, psi
Crack extension, ∆a, in.
14
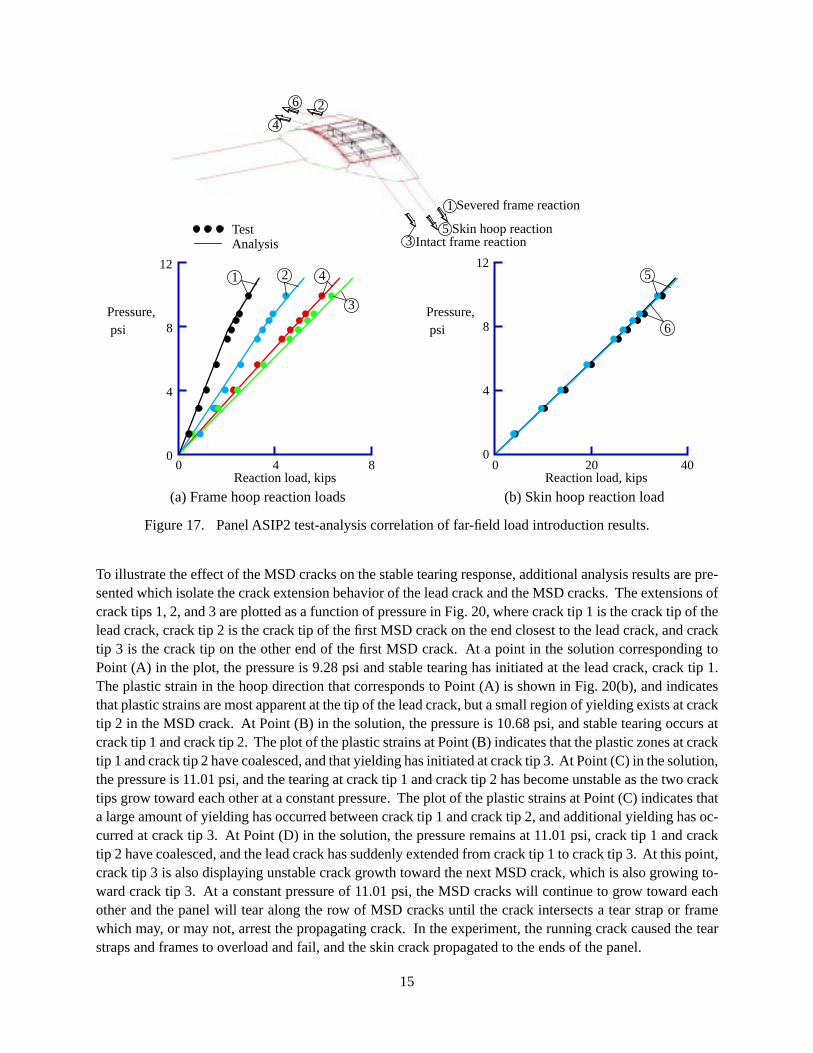
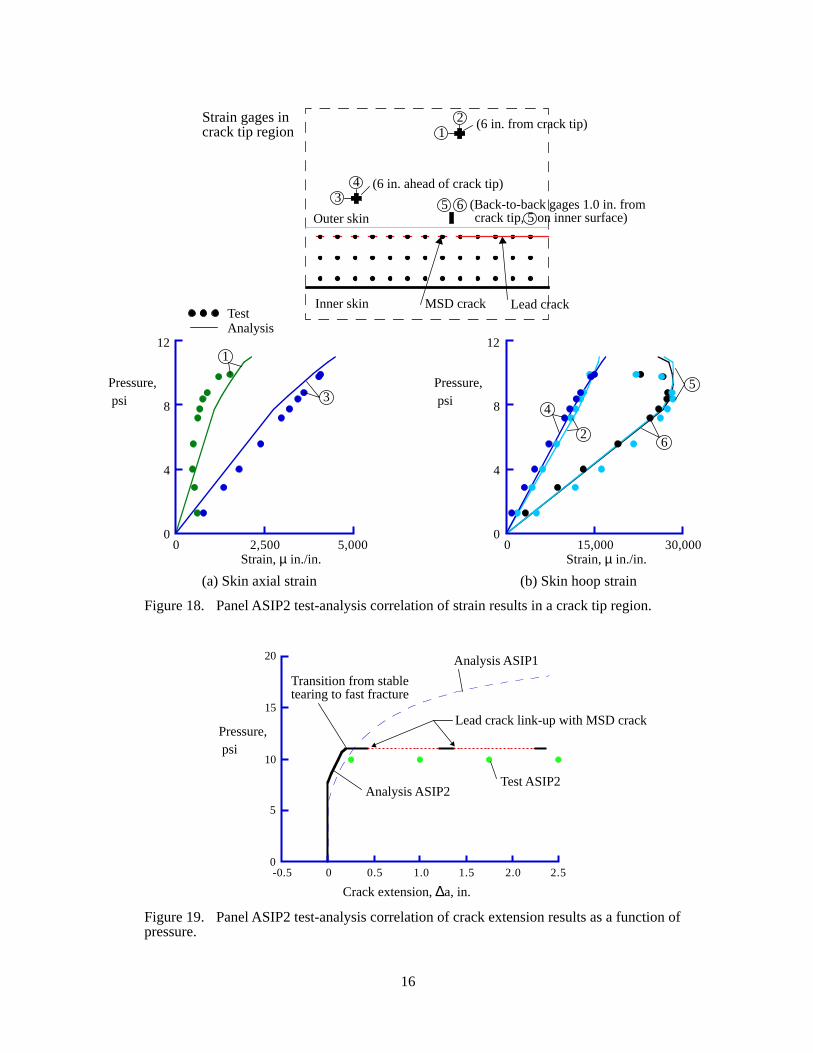
The far-field load introduction results predicted by the analysis and measured in the experiment are com-pared in Fig. 17. The plots of the frame hoop reaction loads and skin hoop reaction loads shown inFigs. 17(a) and 17(b), respectively, indicate good agreement of the results. The asymmetry in the framehoop reactions due to the crack not being in the center of the panel was accurately predicted by the analysis.The predicted and experimental strains in the skin at three locations near the initial crack tip are comparedin Fig. 18. The correlation between the skin axial strains and the skin hoop strains shown in Figs. 18(a) and18(b), respectively, indicates that the finite element model accurately simulates the stress state around thecrack tip region.
The crack extension response from the analysis and the experiment are compared in Fig. 19 as a function ofpressure. The crack extension data from the experiment are represented by a horizontal line at a pressureof 9.95 psi. The analysis results indicate that a small amount of stable tearing occurs, with a transition tofast fracture occurring at a pressure of 11.01 psi. The breaks in the solid curve indicate locations where thelead crack links up with the MSD cracks to create a discontinuity in the length of the lead crack. Thus, theanalysis predicts fast fracture and link-up at a pressure that is 11% greater than what was observed in theexperiment. For comparison purposes, the predicted response of panel ASIP1 is also included in Fig. 19.The difference in the predicted stability of the tearing response of these two panels is caused by the interac-tion of the lead crack and the MSD cracks in panel ASIP2.
Sym.
Hoop load plate
Axial actuators
Frame turnbuckles
Hoop skin turnbuckle
Axial load plate
Lead crackMSD cracks
Figure 15. Half-length symmetry finite element model for panel ASIP2.
Fasteners attached to bearing side of MSD cracks
Figure 16. Typical analysis results for panel ASIP2 showing crack growth in the lead crack and MSD cracks.
(a) Hoop stress, σy (b) Plastic hoop strain, (εy)p
Max.
Min.Initial crack tip locations
Stiffener
15
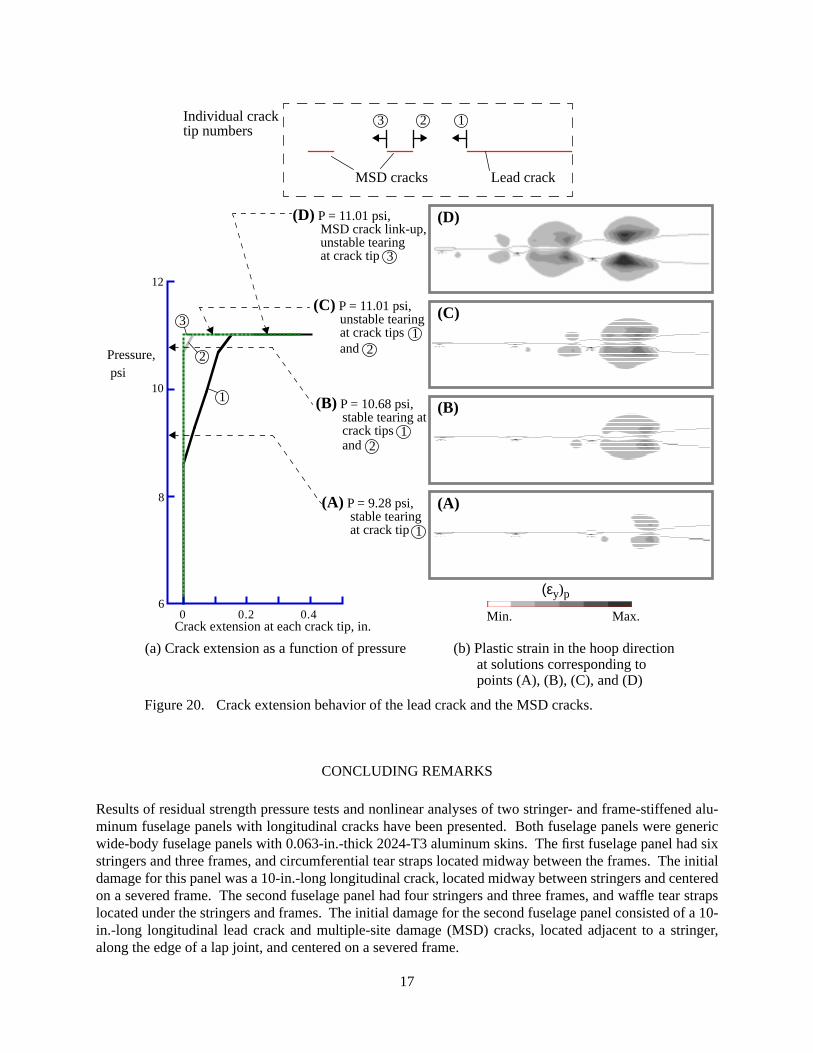
To illustrate the effect of the MSD cracks on the stable tearing response, additional analysis results are pre-sented which isolate the crack extension behavior of the lead crack and the MSD cracks. The extensions ofcrack tips 1, 2, and 3 are plotted as a function of pressure in Fig. 20, where crack tip 1 is the crack tip of thelead crack, crack tip 2 is the crack tip of the first MSD crack on the end closest to the lead crack, and cracktip 3 is the crack tip on the other end of the first MSD crack. At a point in the solution corresponding toPoint (A) in the plot, the pressure is 9.28 psi and stable tearing has initiated at the lead crack, crack tip 1.The plastic strain in the hoop direction that corresponds to Point (A) is shown in Fig. 20(b), and indicatesthat plastic strains are most apparent at the tip of the lead crack, but a small region of yielding exists at cracktip 2 in the MSD crack. At Point (B) in the solution, the pressure is 10.68 psi, and stable tearing occurs atcrack tip 1 and crack tip 2. The plot of the plastic strains at Point (B) indicates that the plastic zones at cracktip 1 and crack tip 2 have coalesced, and that yielding has initiated at crack tip 3. At Point (C) in the solution,the pressure is 11.01 psi, and the tearing at crack tip 1 and crack tip 2 has become unstable as the two cracktips grow toward each other at a constant pressure. The plot of the plastic strains at Point (C) indicates thata large amount of yielding has occurred between crack tip 1 and crack tip 2, and additional yielding has oc-curred at crack tip 3. At Point (D) in the solution, the pressure remains at 11.01 psi, crack tip 1 and cracktip 2 have coalesced, and the lead crack has suddenly extended from crack tip 1 to crack tip 3. At this point,crack tip 3 is also displaying unstable crack growth toward the next MSD crack, which is also growing to-ward crack tip 3. At a constant pressure of 11.01 psi, the MSD cracks will continue to grow toward eachother and the panel will tear along the row of MSD cracks until the crack intersects a tear strap or framewhich may, or may not, arrest the propagating crack. In the experiment, the running crack caused the tearstraps and frames to overload and fail, and the skin crack propagated to the ends of the panel.
0 20 400
4
8
12
0 4 80
4
8
12
Figure 17. Panel ASIP2 test-analysis correlation of far-field load introduction results.
Severed frame reaction1
35 Skin hoop reaction
Intact frame reaction
Pressure, psi
Pressure, psi
1 2 5
Reaction load, kips
(a) Frame hoop reaction loads (b) Skin hoop reaction loadReaction load, kips
26
4
4
3
6
TestAnalysis
16
0 15,000 30,0000
4
8
12
0 2,500 5,0000
4
8
12
34
Figure 18. Panel ASIP2 test-analysis correlation of strain results in a crack tip region.
1
Pressure, psi
Pressure, psi
1
34
(a) Skin axial strain (b) Skin hoop strain
Strain, µ in./in.
(Back-to-back gages 1.0 in. from
(6 in. ahead of crack tip)
Strain gages in crack tip region
2
Strain, µ in./in.
2
Lead crack
Outer skin
Inner skin MSD crack
5 6crack tip, 5 on inner surface)
(6 in. from crack tip)
TestAnalysis
5
6
-0.5 0 0.5 1.0 1.5 2.0 2.50
5
10
15
20
Figure 19. Panel ASIP2 test-analysis correlation of crack extension results as a function of pressure.
Test ASIP2Analysis ASIP2
Pressure, psi
Crack extension, ∆a, in.
Analysis ASIP1
Transition from stabletearing to fast fracture
Lead crack link-up with MSD crack
17
CONCLUDING REMARKS
Results of residual strength pressure tests and nonlinear analyses of two stringer- and frame-stiffened alu-minum fuselage panels with longitudinal cracks have been presented. Both fuselage panels were genericwide-body fuselage panels with 0.063-in.-thick 2024-T3 aluminum skins. The first fuselage panel had sixstringers and three frames, and circumferential tear straps located midway between the frames. The initialdamage for this panel was a 10-in.-long longitudinal crack, located midway between stringers and centeredon a severed frame. The second fuselage panel had four stringers and three frames, and waffle tear strapslocated under the stringers and frames. The initial damage for the second fuselage panel consisted of a 10-in.-long longitudinal lead crack and multiple-site damage (MSD) cracks, located adjacent to a stringer,along the edge of a lap joint, and centered on a severed frame.
0 0.2 0.46
8
10
12
Lead crack
1
Pressure, psi
Crack extension at each crack tip, in.
2Individual crack
MSD cracks
3tip numbers
(A) P = 9.28 psi,
1stable tearing
(B) P = 10.68 psi,
1stable tearing atcrack tips
2and
at crack tip
(C) P = 11.01 psi,
1unstable tearingat crack tips
2and
(D) P = 11.01 psi,MSD crack link-up,unstable tearing
3at crack tip
Figure 20. Crack extension behavior of the lead crack and the MSD cracks.
(a) Crack extension as a function of pressure (b) Plastic strain in the hoop directionat solutions corresponding to points (A), (B), (C), and (D)
Max.Min.
(εy)p
(A)
(B)
(C)
(D)
1
2
3
18
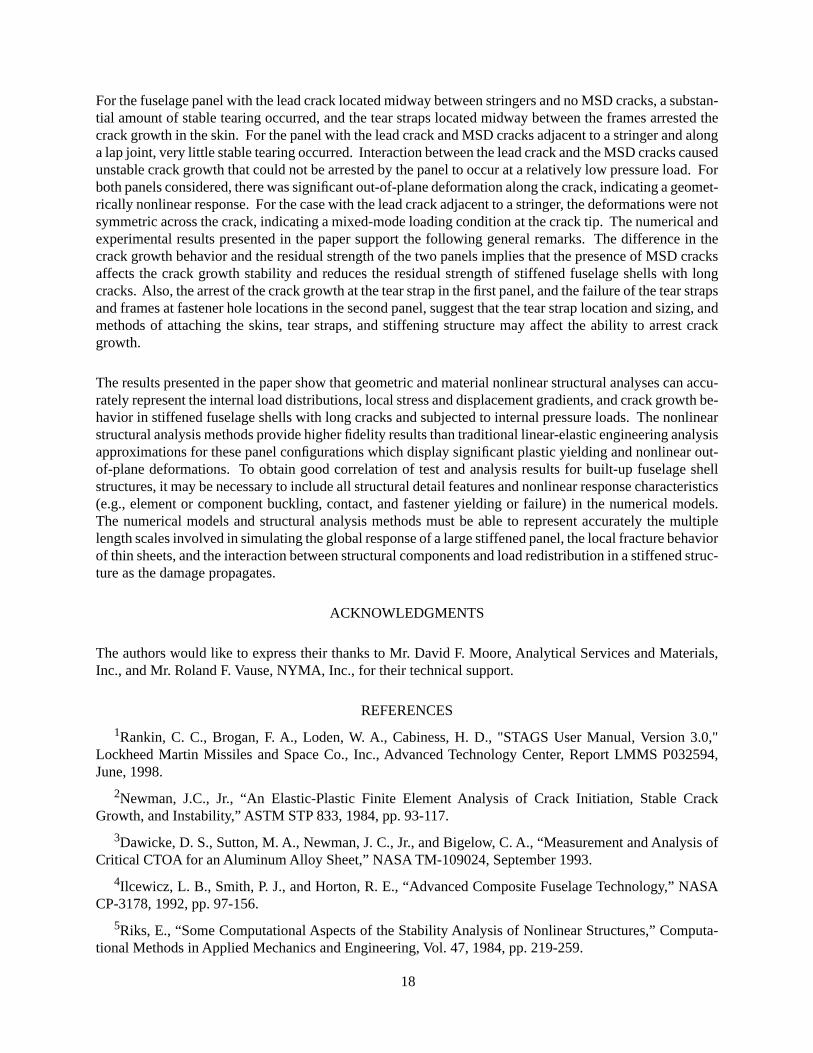
For the fuselage panel with the lead crack located midway between stringers and no MSD cracks, a substan-tial amount of stable tearing occurred, and the tear straps located midway between the frames arrested thecrack growth in the skin. For the panel with the lead crack and MSD cracks adjacent to a stringer and alonga lap joint, very little stable tearing occurred. Interaction between the lead crack and the MSD cracks causedunstable crack growth that could not be arrested by the panel to occur at a relatively low pressure load. Forboth panels considered, there was significant out-of-plane deformation along the crack, indicating a geomet-rically nonlinear response. For the case with the lead crack adjacent to a stringer, the deformations were notsymmetric across the crack, indicating a mixed-mode loading condition at the crack tip. The numerical andexperimental results presented in the paper support the following general remarks. The difference in thecrack growth behavior and the residual strength of the two panels implies that the presence of MSD cracksaffects the crack growth stability and reduces the residual strength of stiffened fuselage shells with longcracks. Also, the arrest of the crack growth at the tear strap in the first panel, and the failure of the tear strapsand frames at fastener hole locations in the second panel, suggest that the tear strap location and sizing, andmethods of attaching the skins, tear straps, and stiffening structure may affect the ability to arrest crackgrowth.
The results presented in the paper show that geometric and material nonlinear structural analyses can accu-rately represent the internal load distributions, local stress and displacement gradients, and crack growth be-havior in stiffened fuselage shells with long cracks and subjected to internal pressure loads. The nonlinearstructural analysis methods provide higher fidelity results than traditional linear-elastic engineering analysisapproximations for these panel configurations which display significant plastic yielding and nonlinear out-of-plane deformations. To obtain good correlation of test and analysis results for built-up fuselage shellstructures, it may be necessary to include all structural detail features and nonlinear response characteristics(e.g., element or component buckling, contact, and fastener yielding or failure) in the numerical models.The numerical models and structural analysis methods must be able to represent accurately the multiplelength scales involved in simulating the global response of a large stiffened panel, the local fracture behaviorof thin sheets, and the interaction between structural components and load redistribution in a stiffened struc-ture as the damage propagates.
ACKNOWLEDGMENTS
The authors would like to express their thanks to Mr. David F. Moore, Analytical Services and Materials,Inc., and Mr. Roland F. Vause, NYMA, Inc., for their technical support.
REFERENCES
1
Rankin, C. C., Brogan, F. A., Loden, W. A., Cabiness, H. D., "STAGS User Manual, Version 3.0,"Lockheed Martin Missiles and Space Co., Inc., Advanced Technology Center, Report LMMS P032594,June, 1998.
2
Newman, J.C., Jr., “An Elastic-Plastic Finite Element Analysis of Crack Initiation, Stable CrackGrowth, and Instability,” ASTM STP 833, 1984, pp. 93-117.
3
Dawicke, D. S., Sutton, M. A., Newman, J. C., Jr., and Bigelow, C. A., “Measurement and Analysis ofCritical CTOA for an Aluminum Alloy Sheet,” NASA TM-109024, September 1993.
4
Ilcewicz, L. B., Smith, P. J., and Horton, R. E., “Advanced Composite Fuselage Technology,” NASACP-3178, 1992, pp. 97-156.
5
Riks, E., “Some Computational Aspects of the Stability Analysis of Nonlinear Structures,” Computa-tional Methods in Applied Mechanics and Engineering, Vol. 47, 1984, pp. 219-259.
19
6
Rankin, C. C., Brogan, F. A., and Riks, E., “Some Computational Tools for the Analysis of ThroughCracks in Stiffened Fuselage Shells,” Computational Mechanics, Springer International, Vol. 13, No. 3,December 1993, pp. 143-156.
7
Potyondy, D. O., “A Software Framework for Simulating Curvilinear Crack Growth in PressurizedThin Shells,” Ph.D. Thesis, Cornell University, Ithaca, NY, 1991.
8
Potyondy, D. O., Wawrzynek, P. A., and Ingraffea, A. R., “Discrete Crack Growth Analysis Methodol-ogy for Through Cracks in Pressurized Fuselage Structures,” International Journal for Numerical Methodsin Engineering, Vol. 38, 1995, pp. 1611-1633.
9
Rankin, C. C., and Brogan, F. A., “The Computational Structural Mechanics Testbed Structural Ele-ment Processor ES5: STAGS Shell Element,” NASA CR-4358, 1991.
10
Swift, T., “Fracture Analysis of Stiffened Structure,” In Damage Tolerance of Metallic Structures:Analysis Methods and Application, ASTM STP 842, 1984, pp. 69-107.
11
Young, R. D., Rose, C. A., Dávila, C. G., Starnes, J. H., Jr., and Rankin, C. C., “Crack Growth andResidual Strength Characteristics of Selected Flat Stiffened Aluminum Panels,” Proceedings of the FirstJoint DoD/FAA/NASA Conference on Aging Aircraft, Ogden, UT, July, 1997.
12
Dawicke, D. S., Newman, J.C., Jr., and Bigelow, C. A., “Three-Dimensional CTOA and ConstraintEffects During Stable Tearing in a Thin-Sheet Material,” In Fracture Mechanics: 26th Volume, ASTM STP1256, 1995, pp. 223-242.
13
Shivakumar, K. N. and Newman, J. C., Jr., "ZIP3D - An Elastic-Plastic Finite-Element Analysis Pro-gram for Cracked Bodies," NASA TM-102753, 1990.
14
Dawicke, D. S. and Newman, J. C., Jr., "Residual Strength Predictions for Multiple Site DamageCracking Using a Three-Dimensional Finite Element Analysis and a CTOA Criterion," Fatigue and Frac-ture Mechanics: 29th Volume, ASTM STP 1332, T. L. Panontin and S. D. Sheppard, Eds., American Soci-ety for Testing and Materials, 1998.
15
Newman, J. C., Jr., "Finite Element Analyses of Fatigue Crack Propagation -- Including the Effects ofCrack Closure," Ph.D. Thesis, Virginia Polytechnic institute and State University, Blacksburg, VA, May1974.
16
Dawicke, D. S., "Residual Strength Predictions Using a Crack Tip Opening Angle Criterion," FAA-NASA Symposium on the Continued Airworthiness of Aircraft Structures, DOT/FAA/AR-97/2, Vol. II,July 1997, pp. 555-566.