Residual Oil Zone Screening with - CO2 & ROZ … · Basin evolution modeling could be used to...
19
Transcript of Residual Oil Zone Screening with - CO2 & ROZ … · Basin evolution modeling could be used to...


Residual Oil Zone Screening with
Basin Evolution Modeling
CO2 Conference
Midland, Texas
4–7 December 2017
Matt Burton-Kelly
Geologist
Energy & Environmental Research Center
3
Current Project funded by U.S. Department of Energy
Objectives:
• Identify and characterize the presence
and extent of potential residual oil zones
(ROZs) in the Williston Basin and
Powder River Basin.
• Estimate residual oil in place and CO2
storage potential.
• Determine feasibility of CO2 enhanced
oil recovery in identified ROZs.
• Develop repeatable methodology for
sedimentary basins to be included in a
best practices manual.
• “To see if we could.”

4
Provides a complete record of the
evolution of a petroleum system,
including:
• Deposition and erosion.
• Pressure and compaction.
• Heat flow analysis.
• Petroleum generation.
• Fluid pressure, volume,
temperature analysis.
• Reservoir volumetrics.
• Structural evolution.
• Generation, migration, and
accumulation of hydrocarbons.
Basin Evolution Modeling – Schlumberger PetroMod
5
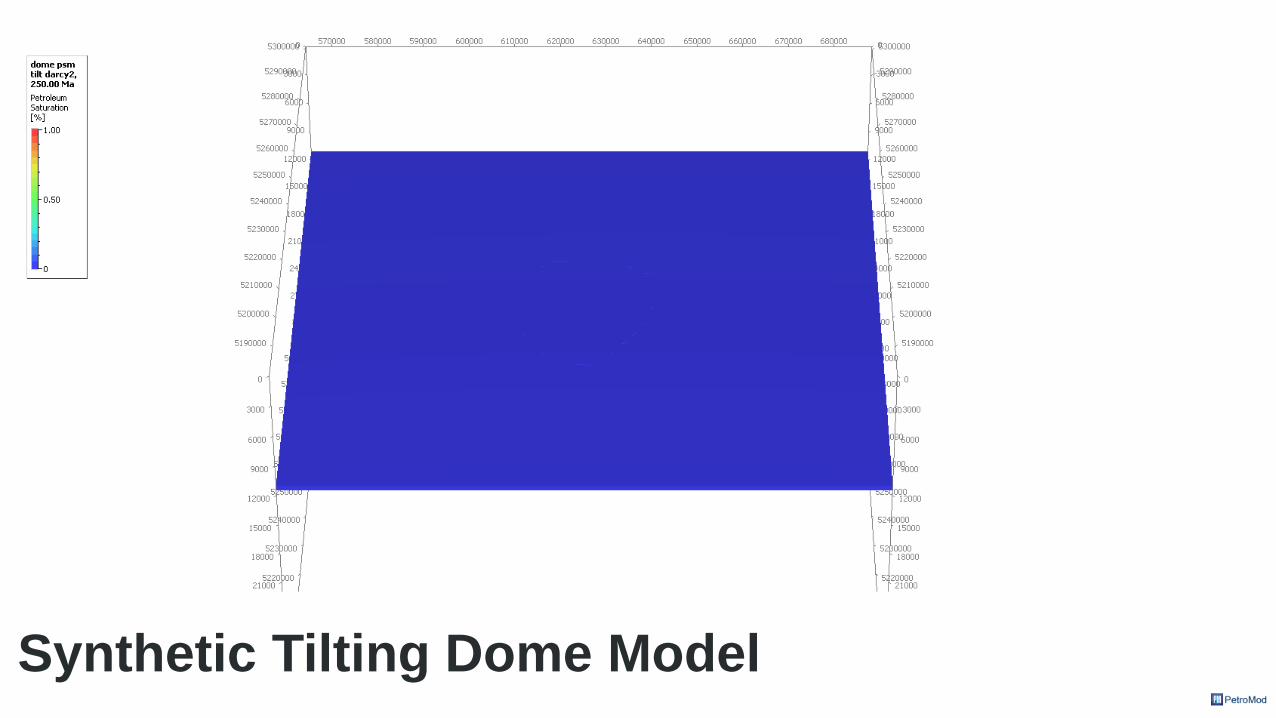
Synthetic Tilting Dome Model

6
ROZ Process Definition
“ROZs are zones that used to be full of oil but have been naturally waterflooded.”
This definition requires:
• A high-saturation (paleo)trap.
• Natural waterflooding.
Oil “traffic” alone doesn’t count without an
accumulation.
source
Basin evolution modeling could be used to
identify (paleo)traps and naturally
waterflooded zones.

7
PetroMod Output and Grid
300 Ma
200 Ma
100 Ma
75 Ma
50 Ma
0 Ma
Unit A
Unit A
Unit A
Unit A
Unit A
Unit A
Hydrocarbon Mass: 0
Hydrocarbon Mass: 10
Hydrocarbon Mass: 8
Hydrocarbon Mass: 2
Hydrocarbon Mass: 11
Hydrocarbon Mass: 7
Change: +10
Change: -2
Change: -6
Change: +9
Change: -4
Raster Output, One Layer per
Property per Time Step
(e.g., hydrocarbon mass)
Cell-by-Cell
Oil saturation output is less trustworthy than mass
with large cells, so an alternative was needed.
*Ma = Millions of years ago.
Mass
Time
8
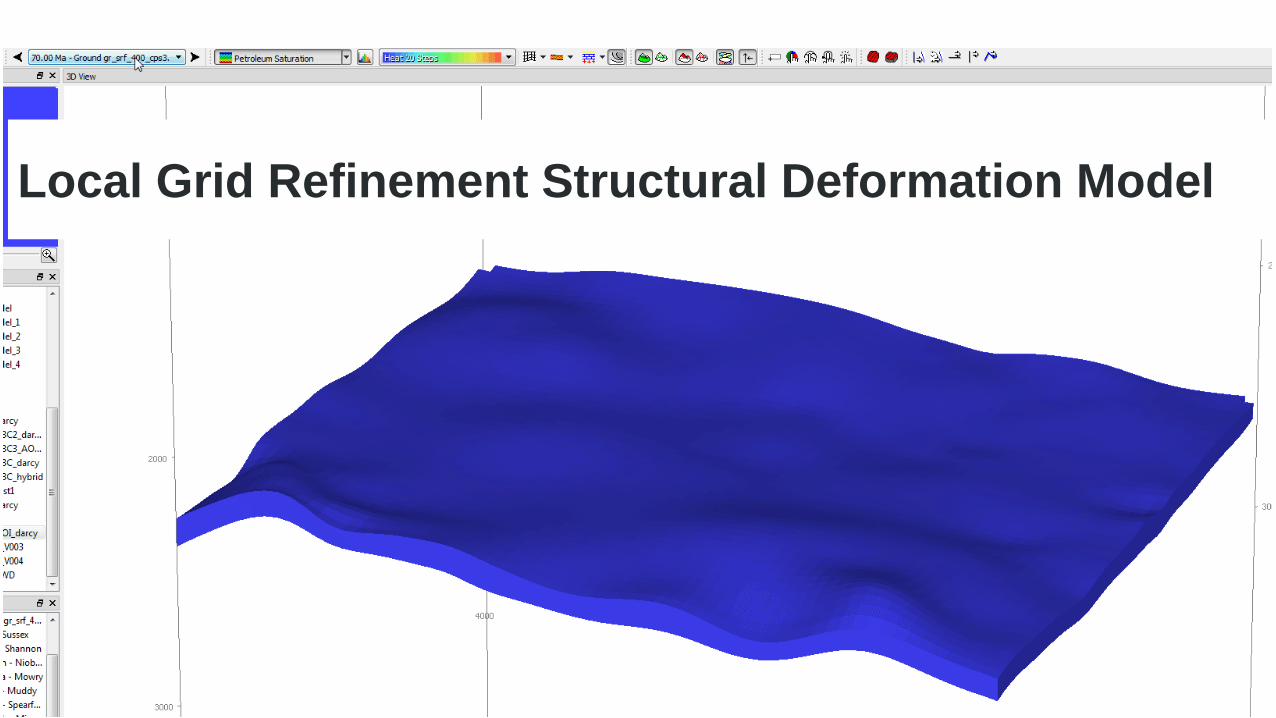
Local Grid Refinement Structural Deformation Model

9
Potential ROZ Hydrocarbon Mass Curves
A High-Mass (Paleo)Trap
Natural Waterflooding

10
Non-ROZ Hydrocarbon Mass Curves
A High-Mass (Paleo)Trap
Natural Waterflooding
“Paleo-ROZs”

11
Calculating Potential ROZ Mass
𝑇𝑜𝑡𝑎𝑙𝑡=0 and 𝑀𝑜𝑏𝑖𝑙𝑒𝑡=(𝑚𝑎𝑥,0) are derived from PetroMod
output. 𝑆𝑜𝑐 is a rock property input to PetroMod, taken from
lab analysis (oil % irreducible with respect to water).
Green terms are known at each step.
• 𝑇𝑜𝑡𝑎𝑙𝑡=0 = 𝑀𝑃𝑍𝑡=0 + 𝑅𝑂𝑍𝑡=0
• 𝑅𝑂𝑍𝑡=𝑚𝑎𝑥 =100 ×𝑀𝑜𝑏𝑖𝑙𝑒𝑡=(𝑚𝑎𝑥,0)
𝑆𝑜𝑐
• 𝑅𝑂𝑍𝑡=0 = 𝑅𝑂𝑍𝑡=𝑚𝑎𝑥 −𝑀𝑜𝑏𝑖𝑙𝑒𝑡=(𝑚𝑎𝑥,0)
• 𝑀𝑃𝑍𝑡=0 = 𝑇𝑜𝑡𝑎𝑙𝑡=0 − 𝑅𝑂𝑍𝑡=0
Automated Process, per Cell, per Formation
t =
𝑇𝑜𝑡𝑎𝑙𝑡=0
𝑅𝑂𝑍𝑡=𝑚𝑎𝑥𝑀𝑜𝑏𝑡=(𝑚𝑎𝑥,0)
𝑅𝑂𝑍𝑡=0
𝑀𝑃𝑍𝑡=0
𝑀𝑃𝑍𝑡=0: Main Pay Zone at timestep = 0 Ma
𝑅𝑂𝑍𝑡=0: Residual Oil Zone at timestep = 0 Ma
𝑀𝑜𝑏𝑖𝑙𝑒𝑡=(𝑚𝑎𝑥,0): Oil that left the cell between
the timestep with maximum hydrocarbon
mass and 0 Ma.

12
Output/ExampleOne Williston Basin Formation
Mass over Time
Mass at t = 0
13
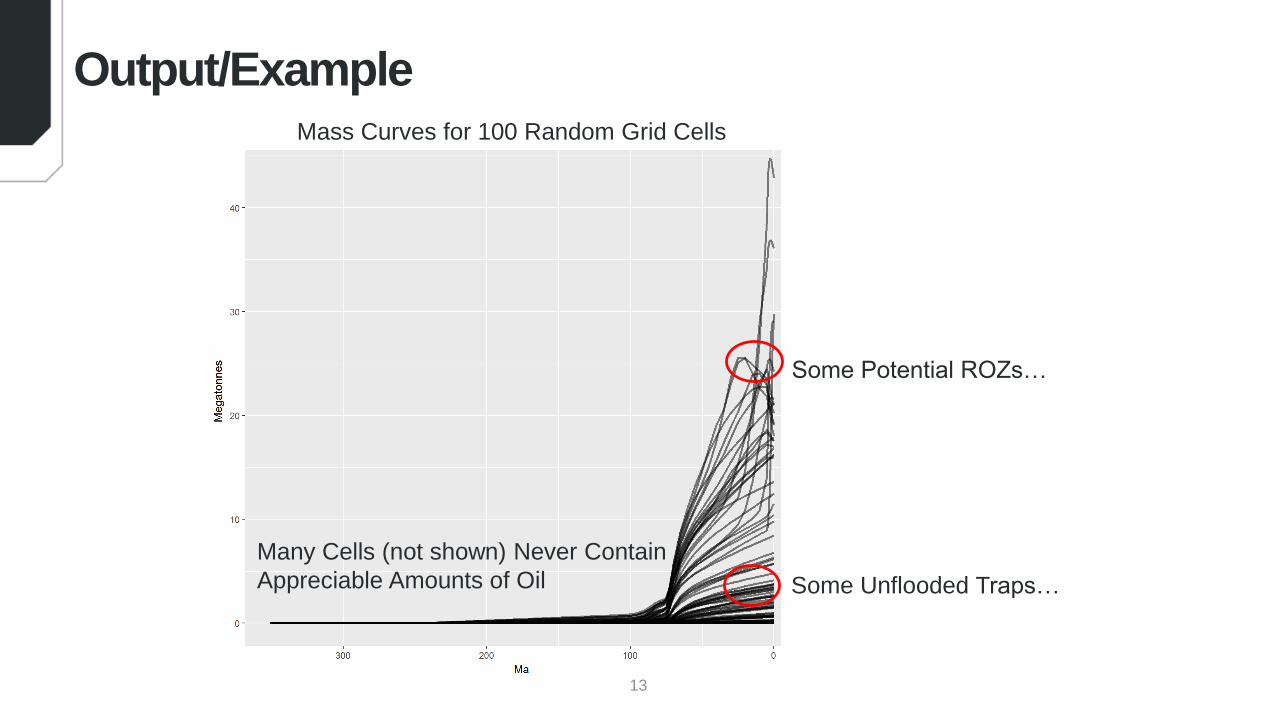
Output/Example
Some Potential ROZs…
Some Unflooded Traps…
Many Cells (not shown) Never Contain
Appreciable Amounts of Oil
Mass Curves for 100 Random Grid Cells
14
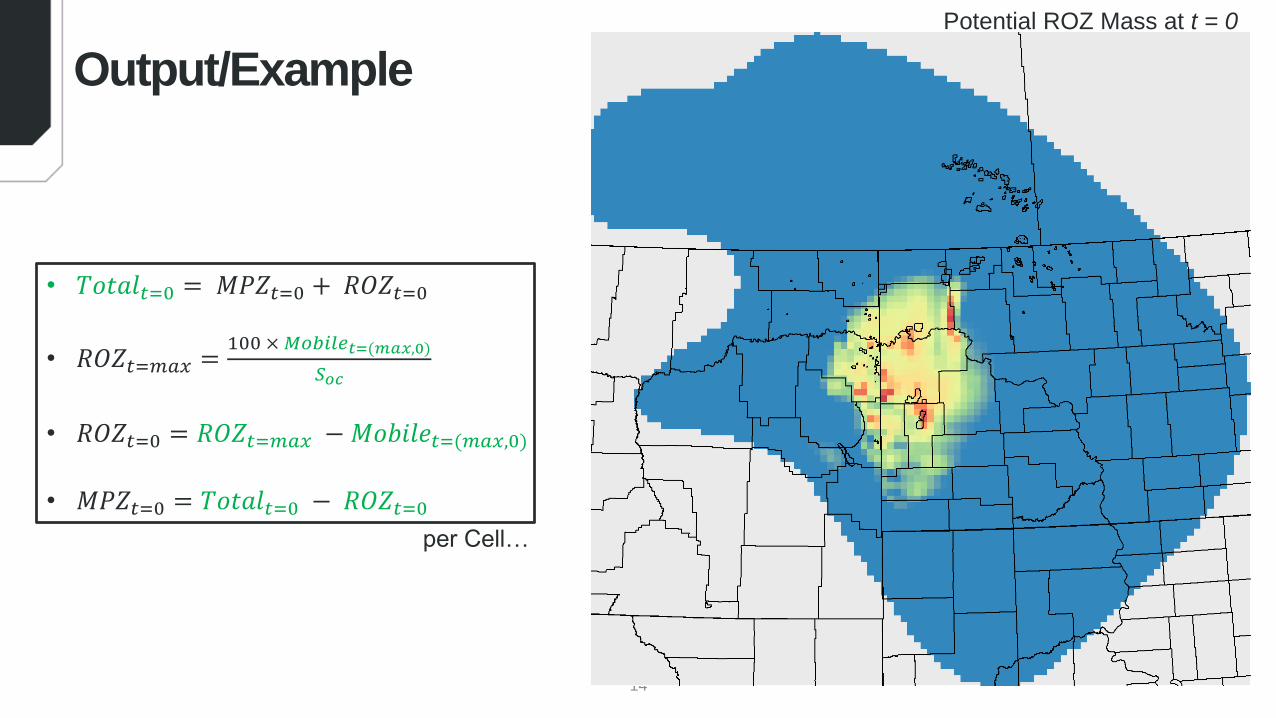
Output/Example
Potential ROZ Mass at t = 0
• 𝑇𝑜𝑡𝑎𝑙𝑡=0 = 𝑀𝑃𝑍𝑡=0 + 𝑅𝑂𝑍𝑡=0
• 𝑅𝑂𝑍𝑡=𝑚𝑎𝑥 =100 ×𝑀𝑜𝑏𝑖𝑙𝑒𝑡=(𝑚𝑎𝑥,0)
𝑆𝑜𝑐
• 𝑅𝑂𝑍𝑡=0 = 𝑅𝑂𝑍𝑡=𝑚𝑎𝑥 −𝑀𝑜𝑏𝑖𝑙𝑒𝑡=(𝑚𝑎𝑥,0)
• 𝑀𝑃𝑍𝑡=0 = 𝑇𝑜𝑡𝑎𝑙𝑡=0 − 𝑅𝑂𝑍𝑡=0per Cell…
15
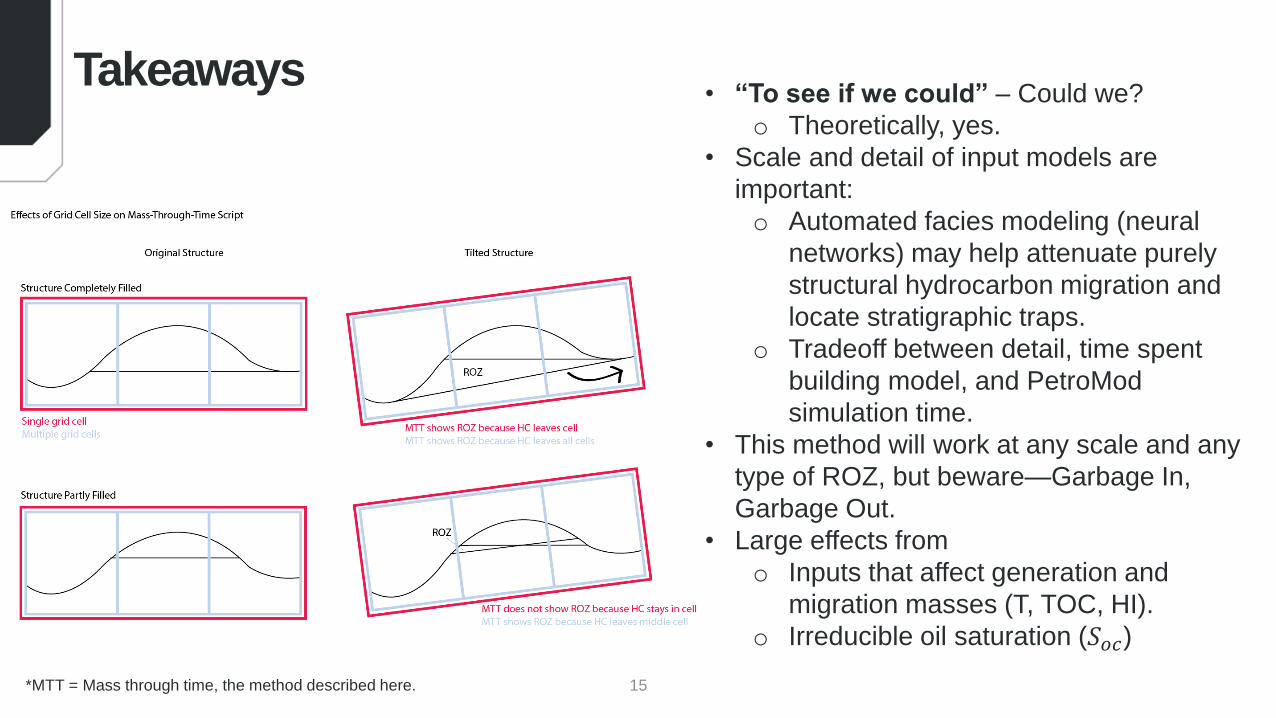
Takeaways• “To see if we could” – Could we?
o Theoretically, yes.
• Scale and detail of input models are
important:
o Automated facies modeling (neural
networks) may help attenuate purely
structural hydrocarbon migration and
locate stratigraphic traps.
o Tradeoff between detail, time spent
building model, and PetroMod
simulation time.
• This method will work at any scale and any
type of ROZ, but beware—Garbage In,
Garbage Out.
• Large effects from
o Inputs that affect generation and
migration masses (T, TOC, HI).
o Irreducible oil saturation (𝑆𝑜𝑐)
*MTT = Mass through time, the method described here.

THANK YOU!

Extra Animations

18
CONTACT INFORMATION
Energy & Environmental Research Center
University of North Dakota
15 North 23rd Street, Stop 9018
Grand Forks, ND 58202-9018
www.undeerc.org
701.777.5297 (phone)
701.777.5181 (fax)
Matt Burton-Kelly
Geologist