Residents Pilot Study of studying this unique population. 1. Introduction Hurricane Katrina struck...
39
Tracing the Effects of Hurricane Katrina on the Population of New Orleans The Displaced New Orleans Residents Pilot Study NARAYAN SASTRY WR-483 April 2007 WORKING P A P E R This product is part of the RAND Labor and Population working paper series. RAND working papers are intended to share researchers’ latest findings and to solicit informal peer review. They have been approved for circulation by RAND Labor and Population but have not been formally edited or peer reviewed. Unless otherwise indicated, working papers can be quoted and cited without permission of the author, provided the source is clearly referred to as a working paper. RAND’s publications do not necessarily reflect the opinions of its research clients and sponsors. is a registered trademark. GULF STATES POLICY INSTITUTE
Transcript of Residents Pilot Study of studying this unique population. 1. Introduction Hurricane Katrina struck...

Tracing the Effects of Hurricane Katrina on the Population of New Orleans The Displaced New Orleans Residents Pilot Study
NARAYAN SASTRY
WR-483
April 2007
WORK ING P A P E R
This product is part of the RAND Labor and Population working paper series. RAND working papers are intended to share researchers’ latest findings and to solicit informal peer review. They have been approved for circulation by RAND Labor and Population but have not been formally edited or peer reviewed. Unless otherwise indicated, working papers can be quoted and cited without permission of the author, provided the source is clearly referred to as a working paper. RAND’s publications do not necessarily reflect the opinions of its research clients and sponsors.
is a registered trademark.
GULF STATES POLICY INSTITUTE

† The author gratefully acknowledges the contributions of many colleagues in designing, implementing, and analyzing the Displaced New Orleans Residents Study, including Megan Beckett, Sandro Galea, Katherine Hall, Amelia Haviland, Anne Kenyon, Karol Krotki, Nicole Luire, Adrian Overton, Kavita Patel, Christine Peterson, Michael Rendall, Ben Springgate, Greg Stone, Susan Twiddy, Joseph McMichael, Lily Trofimovich, Mark VanLandingham, Clayton Williams, and Julie Zissimopolous.
Tracing the Effects of Hurricane Katrina on the Population of New Orleans:
The Displaced New Orleans Residents Pilot Study†
April 2007
Narayan Sastry
University of Michigan and RAND Corporation
E-mail: [email protected]
Tel/Fax: 734-926-0462

Abstract
The Displaced New Orleans Residents Pilot Study was designed to examine the current
location, well-being, and plans of people who lived in the City of New Orleans when Hurricane
Katrina struck on 29 August 2005. The study is based on a representative sample of pre-Katrina
dwellings in the City of New Orleans. Fieldwork focused on tracking respondents wherever they
currently resided, including back to New Orleans. Respondents were administered a short paper-
and-pencil interview by mail, by telephone, or in person. The pilot study was fielded in the
fall of 2006, approximately one-year after Hurricane Katrina.
In this paper, we describe the motivation for the pilot study, outline its design, and
describe the fieldwork results. Our analysis of the results focuses on the study’s ability to locate
and successfully interview displaced New Orleans residents and includes calculating a set of
outcome rates and estimating a series of multivariate logistic models for outcome indicators. We
end with a discussion of the lessons learned from the pilot study for future studies of the effects
of Hurricane Katrina on the population of New Orleans. The results point to the challenges and
opportunities of studying this unique population.

1. Introduction
Hurricane Katrina struck New Orleans, Louisiana, on the morning of August 29, 2005.
The magnitude of the displacement that resulted was immense: the city’s entire population of
455,000 was forced to leave the city and resettle, which some did temporarily and others
permanently. The toll from the hurricane was enormous and continues to unfold. Many people
had family members or friends who died or were injured, had homes that were severely damaged
or destroyed, lost their jobs or businesses, and had their lives severely disrupted. Although this
event occurred more than one-and-a-half years ago, research on many major topics of scientific
continues to be hampered by a lack of appropriate data.
A critical need in assessing the impact of the Hurricane Katrina and in planning a
recovery is to obtain representative data on the whereabouts, status, health, and well-being of
displaced residents. In this paper, we describe the Displaced New Orleans Residents Pilot Study
(DNORPS), which was designed to collect such information for people who lived in the City of
New Orleans when Hurricane Katrina struck on 29 August 2005. The pilot study was based on a
representative sample of pre-Katrina dwellings in the City of New Orleans. Fieldwork efforts
focused on tracking respondents wherever they currently resided, including back to New
Orleans. Respondents were administered a short paper-and-pencil interview by mail, by
telephone, or in person. DNORPS was fielded in the fall of 2006, approximately one year after
Hurricane Katrina.
The goal of DNORPS was to assess the feasibility of the study design and thereby to lay
the groundwork for launching a major longitudinal study of displaced New Orleans residents.
There is a compelling need for a full-scale, representative, panel study to investigate the effects
of this major disaster—in particular, to examine trends and disparities in a variety of measures of
1

well-being over the medium and long term and to investigate how individual, family, and
contextual characteristics shape the successful or unsuccessful adjustment to this extraordinarily
disruptive experience. DNORPS allowed us to assess the design of and outcomes from fielding a
survey of this population, such as identifying a sampling frame, tracking displaced respondents,
and assessing non-response patterns. The results provide valuable insights for ways to
successfully undertake a full-scale study, but are also interesting in their own right. In particular,
the methods and results for DNORPS may be applicable to studying population effects in the
aftermath of other natural or man-made disasters, and the results from this study may thus be of
wider interest.
The paper is organized as follows. In the next section, we describe New Orleans before
Hurricane Katrina and in the aftermath of the storm and provide an overview of current research
on the demographic effects of Hurricane Katrina. We then describe the design of the Displaced
New Orleans Residents Pilot Study, including the sampling plan, questionnaire, and fieldwork
operations. The results of the pilot study are presented next, and focus on descriptive results and
a multivariate analysis of outcomes using logistic regression models. Three main findings
emerged from DNORPS. First, the main challenge in achieving a high response rate is to find
sampled respondents. Second, among respondents who we successfully located and were able to
contact, a very high percentage participated in the study. Finally, few systematic patterns of non-
response are apparent.
2. New Orleans and Hurricane Katrina
The size, composition, and characteristics of the New Orleans population at the time of
Hurricane Katrina shaped the effects of the hurricane on the city, and also strongly influence our
ability to conduct survey research on this population.
2

At the beginning of the current decade, New Orleans was the 31st largest city in the
country (U.S. Census Bureau, 2000). The population of Orleans Parish in 2005 was 454,863,
accounting for about one-third of the total population of 1,338,000 in the metropolitan area (U.S.
Census Bureau, 2005).1 According to the 2004 American Community Survey, the majority
(69%) of the population in New Orleans was African-American. Whites accounted for 28% of
the city’s population and Asians 2.4%.
The population of New Orleans was declining long before the widespread devastation
brought about from the levee failures following Hurricane Katrina, with the city steadily losing
population in recent decades. The population decreased by 18% (109,000 residents) between
1970 and 2000 (Brookings Institution, 2005) and fell by a further 6% (30,000 residents) from
2000 to 2005 (U.S. Census Bureau, 2005).
Declining population in New Orleans has meant that many people may have been
considering leaving the city and, after being forced to evacuate, may not plan to return. Lessons
on the demographic consequences of other natural disasters, such as Hurricane Andrew, suggest
that these events accelerated demographic shifts that were already underway (Solecki, 1999).
Any survey of the pre-Katrina population of New Orleans will therefore have to locate these
movers in their new residential locations rather than waiting for—or expecting—them to return.
Prior to Hurricane Katrina, New Orleans experienced high rates of poverty, which, as
elsewhere, were associated with crime, shortfalls in the provision of basic services such as health
care and education, illiteracy, substandard housing, and lack of opportunity. Around 23% of
New Orleans residents lived below the poverty line in 2004, which was ten percentage points
higher than the national average; the median family income was only two-thirds of the national
1 The New Orleans metropolitan area comprises seven parishes, of which Orleans Parish had the largestpre-Katrina population. Orleans Parish boundaries correspond precisely with the incorporated limits of the City ofNew Orleans, and we use these two terms interchangeably.
3

average (U.S. Census Bureau, 2005). The city’s unemployment rate in 2004 was nearly 12%—
twice the national rate (U.S. Census Bureau, 2005).
New Orleans has always had a substantial black population, and historically it was the
least geographically segregated of large American cities (Spain, 1970). But by 2000, the
standard index of black-white segregation showed New Orleans to be above the national average
(Mumford Center, 2001). Since the 1970s, the number of neighborhoods with concentrated
poverty grew by two-thirds (Berube and Katz, 2005), even though the poverty rate remained
stable. Almost all of the extreme-poverty neighborhoods in New Orleans were predominantly
black by the time Katrina struck and, when it did, these racially and economically segregated
areas bore the brunt of the disaster. A block-by-block analysis of Census data and flood maps
reveals that about half of the city’s white residents experienced serious flooding, compared with
three-quarters of African-Americans (Brazile, 2006).
African Americans in New Orleans had a poverty rate of 35%, which was the highest
among all large cities in the country (U.S. Census Bureau, 2000). But poverty afflicted both
white and black families in the city, and disparities between blacks and whites were similar to
comparable cities. For example, differences in black and white incomes for New Orleans are at
the national median for large metropolitan areas with significant black populations (Logan,
2002). Rates of college education for blacks in the city were only about one-fourth of that for
whites; and only two-thirds of black adults had at least a high school degree compared to 89% of
whites. Finally, African American and low-income families in New Orleans had far lower rates
of homeownership than whites and higher-income families. Only 41% of African Americans in
New Orleans owned their homes, compared to 56% of white households in the city (U.S. Census
Bureau, 2000).
4
High rates of poverty and disadvantage among the pre-Katrina population of New
Orleans are likely to affect the displacement experience and shape fieldwork efforts to track
sampled cases that moved. For example, the choice of where to migrate may have been
constrained in possibly unexpected ways among poor families. Although we would expect
poorer New Orleanians to have stayed closer to the city to minimize travel costs and because
they lacked cars, limited evidence (e.g., Tizon and Smith, 2005) suggests that many may instead
have been forced to move further away from the city. Poor families may also have faced
challenges in reestablishing connections with displaced friends and neighbors because they could
not afford the cost of traveling back to the city regularly or at all. Another issue is that
concentrated poverty neighborhoods in New Orleans are unattractive places to which to return,
particularly for many poor people who experienced better neighborhood environments, job
opportunities, schools, and amenities in their new locations. A final issue is that low rates of
homeownership place a significant barrier for residents to return to the city because of the
difficulty of finding rental housing in New Orleans. Of course, homeowners who are poor
themselves face considerable challenges in either renovating or selling their houses in New
Orleans.
New Orleans after Hurricane Katrina
Hurricane Katrina struck New Orleans, Louisiana, on the morning of August 29, 2005.2
The city suffered moderate damage from the hurricane itself, but enormous damage from
extensive flooding caused by breaks in several levees. The population of New Orleans was
reduced to fewer than several thousand people by the end of the first week of September 2005.
Several weeks after Hurricane Katrina, the levee breaches were closed and the
2 For more background information on Hurricane Katrina and its effects on New Orleans, see Comfort(2006).
5

floodwaters were drained from the city. By the end of September 2005, former residents were
allowed to begin returning the city. Initially, only residents of areas that were not flooded were
allowed back. However, as water was pumped out of the flooded areas and basic services and
infrastructure were restored, residents from more of the affected areas were allowed to return.
Still, the depth of the floodwaters and the duration of flooding meant that most housing in areas
flooded with water depths of two feet or more was substantial damage and, for the most part, was
not habitable (McCarthy et al., 2006). Many residents who had fled the city and expected to
return shortly were displaced for substantial periods; many still are.
The first reliable post-Katrina estimate of the New Orleans population was based on data
from the American Community Survey, which placed the city’s population on January 1, 2006,
at 158,000 (U.S. Census Bureau, 2006)—which was about one-third of the pre-Katrina
population. A more recent population estimate, based on data from 2006 Louisiana Health and
Population Survey, placed the New Orleans population at 191,000 in the fall of 2006 (LPHI,
2006). Neither of these estimates provide information on the proportion of the city’s current
population that are new residents, which is necessary for estimating the number of pre-Katrina
residents of New Orleans that have returned to the city and the number that continue to live away
from the city. Nevertheless, it is clear that at least half of all displaced New Orleans residents
have not returned to the city. Furthermore, given the rapid slow-down in the pace at which the
city’s population is growing, it is also seems clear that few of the former residents still living
away from the New Orleans will return to the city.
Little is known about the current location of displaced New Orleans residents. In the
initial period following Hurricane Katrina, there were several useful sources of data about where
displaced residents from New Orleans were currently living. In particular, information on the
6

current location of evacuees was available from change-of-address forms filed with the U.S.
Postal Service and from registrations with FEMA for aid. Analyses of these data showed that
nearly 15% of evacuees from New Orleans relocated to distant cities in the East Coast, Midwest,
and West Coast (Tizon and Smith, 2005). However, the main destinations for displaced
residents were suburban New Orleans, Houston, Dallas, Atlanta, and Baton Rouge.
Unfortunately, the usefulness of these data sources waned when the change-of-address forms
expired and FEMA aid came to an end.
In the medium term, the well-being of displaced New Orleans residents is likely to be
shaped by several main factors, which center on their ability to reestablish permanency in their
lives. Key aspects of permanency include finding housing, securing employment and economic
statbility, and enrolling children in school. Evidence on the status of displaced New Orleans
across these various domains points to a situation of substantial initial disruption—although,
again, little is known about whether this disruption is continuing.
The economic consequences of Hurricane Katrina are likely to be enormous and lasting.
For most families who own their home, equity in their property represents their largest wealth
component. Uninsured property losses due to flooding are therefore potentially devastating. On
average, about half of all losses from natural disasters are uninsured (Seeman, 2005). Contrary
to popular perception, however, New Orleans had among the highest participation rates in the
flood insurance program in the country, with about two-thirds of homes in the city having flood
insurance (Swenson, 2006). The average policy coverage in New Orleans ($152,000) was
roughly equal to the median home price at the time of the storm. This means that even if a house
were insured, the average flood policy may not be sufficient to repair serious or severe damage,
as well as the loss of contents. Moreover, flood insurance does not cover the loss of the use of a
7

home. Although most evacuees received housing allowances from FEMA, many displaced
families were forced to dissave to cover living expenses.
Nearly half of the housing units in New Orleans were rental units, according to data from
the 2000 Census. Renters may not have faced the same financial losses that homeowners did,
but they were forced to find new housing. Many poor residents were tenants who, on average,
paid extremely low rents—few of these people could afford to return to New Orleans because of
the higher rents that now prevail for reconstructed dwellings in the city. On the other hand,
many of these disadvantaged residents, especially those on public assistance or living in public
housing, will be able to find better housing, employment opportunities, schooling for their
children, and living environments in their new locations.
The New Orleans public school system prior to Hurricane Katrina was among the worst
in the country (Hill and Hannaway, 2006). About 66,000 students were enrolled in New Orleans
public schools when Katrina struck; by the end of the 2005-06 school year, fewer than 5,000
students had returned to the city’s public schools (Pane et al., 2006). Although 37% enrolled in
public schools in other districts in the state, the majority (57%) of displaced students did not
reenroll in Louisiana public schools—either because they moved to another state (and enrolled in
school there) or because they did not enroll in any school. Among those did return to school,
they nevertheless lost a substantial number of school days (Pane et al., 2006).
Research on Demographic Effects of Hurricane Katrina
Existing literature on natural disasters and their population effects has focused largely on
immediate impacts, such as survival, evacuation, job losses, health care, school enrollment, and
related topics. Less is known about the intermediate- and longer-term effects on broader
measures of health and well-being. Furthermore, in analyzing the demographic effects of other
8

natural disasters—such as Hurricane Andrew, which struck Florida in 1992—researchers have
fielded new population surveys, after concluding that virtually all other data sources have
significant shortcomings (Smith, 1996; Smith and McCarty, 1996).
Although we know much about the characteristics of New Orleans residents prior to
Hurricane Katrina, there has been very little systematic data collected on evacuees. Existing
studies of the demographic effects of Hurricane Katrina fall into two categories: first, early and
generally small-scale studies of evacuees and, second, larger-scale studies, including on-going
national studies. Aggregate data on the current location of people displaced by Katrina have also
been made available by FEMA and the U.S. Postal Service, but neither of these agencies will
release individual-level data to researchers.
The early studies of evacuees include a number of surveys of shelter populations and
evacuee lists and of early returnees to New Orleans. For example, Gallup, CNN, and USA Today
conducted a survey about one month after Hurricane Katrina of 1,510 randomly sampled people
who registered with the American Red Cross for assistance. Elliott and Pais (2006) used these
data to examine differences in experiences in the aftermath of Hurricane Katrina by race and by
socioeconomic status, and found independent effects of each on evacuation timing, employment,
and stress. Another study, conducted by the Washington Post, Kaiser Family Foundation, and
the Harvard School of Public Health, focused on the evacuee population in Houston shelters two
weeks after Hurricane Katrina. This study documented the disadvantaged background of
evacuees and their suffering in the immediate aftermath of the storm—during the evacuation and
at shelters (Brodie et al., 2006). A third study, conducted by researchers at the Columbia
University School of Public Health, fielded a survey among children and families in FEMA-
sponsored trailer parks, hotels, and housing units in Louisiana in February of 2006 (Abramson
9

and Garfield, 2006) and conducted a similar study on Mississippi’s Gulf Coast in August 2006
(Abramson, Garfield, and Redlener, 2007). Both surveys found children to be suffering from
high rates of chronic health conditions, mental health problems, and poor access to health care.
Finally, a series of rapid population surveys were conducted in New Orleans by the city’s
Emergency Operation Center, to provide up-to-date estimates of the city’s population in the
initial months after the storm (Stone, Grant, and Weaver, 2006).
The early studies were conducted rapidly and under very demanding circumstances, but
provided useful information on the immediate aftermath of Hurricane Katrina. However, all of
these studies were cross-sectional and often not representative of the population they sought to
capture due, for example, to high (and often unknown) non-response rates and shortcomings with
the listings from which the samples were drawn. But the most significant shortcoming of these
early studies was that they did not produce representative data on all of the affected population.
For example, to this day, there has been no systematic data collected on the evacuation
experience, subsequent resettlement, and well-being of more affluent population groups that
were not evacuated to shelters and did not seek assistance from the Red Cross.
The second set of Katrina studies, which are larger in scale and include several
nationally-representative data surveys, overcome many of the shortcomings of the early small-
scale studies. Among the studies that focus specifically on the effects of Hurricane Katrina are
the Hurricane Katrina Community Advisory Group, the Mississippi Community Study, and the
Louisiana Health and Population Survey. National studies include the American Community
Survey and the Current Population Survey.
The Hurricane Katrina Advisory Group (2006) is a panel study of 1,043 adults from
Alabama, Mississippi, and Louisiana who were selected from multiple sampling frames. This
10

study, funded by the National Institute for Mental Health (NIMH) and directed by Ron Kessler,
focuses on the psychological well-being of adults. Although this was the first large-scale study
launched after Katrina, it suffers from a number of shortcomings for addressing topics of interest
to social scientists, such as migration and broader measures of well-being. Among these
shortcomings are a response rate of approximately 27%, no information on characteristics of
non-respondents, a total of only 168 respondents in New Orleans, and no contextual information
on respondents’ pre-Katrina neighborhood of residence (Hurricane Katrina Community Advisory
Group, 2006).
The Mississippi Community Study, a survey being led by researchers at the University of
Michigan for which data collection is currently underway, is sampling respondents from a listing
of all addresses in coastal areas of the state. This study focuses largely on mental health
outcomes, although it is designed to examine the effects of contextual factors. There are a
number of significant parallels between the DNORPS and the Mississippi Community Study,
and the two studies will provide complementary information on adjacent areas.
The 2006 Louisiana Population and Health Survey collected cross-sectional data for
parishes in Louisiana that were directly affected by Hurricane Katrina, including Orleans Parish.
Basic demographic information was obtained for all respondents, including some broader
measures of health status and social and economic well-being. This study provides
complementary information to DNORPS because both studies include information on people
who lived in New Orleans prior to Katrina and have subsequently returned to the city. However,
DNORPS also collects information on previous New Orleans residents who have not returned
while the Louisiana Population and Health Survey collects data on new migrants to the city.
Finally, the American Community Survey (ACS) and the Current Population Survey
11
(CPS) provide extremely valuable data on the entire region affected by Katrina. Both of these
surveys are fielded by the U.S. Census Bureau. Sample sizes in the CPS are unfortunately too
small to provide detailed estimates for New Orleans, but sample sizes in the ACS are sufficiently
large to identify and analyze displaced New Orleanians as well as the current population of the
city. Both studies will provide only a brief window into the whereabouts and well-being of
displaced New Orleans residents: they each ask just a single migration question about place of
residence one year previously and the ACS is cross-sectional and the CPS a short panel. The
CPS’s special questions on Katrina migrants will no longer be asked after 2006 (Cahoon et al.,
2006). Preliminary results from analyses of the CPS indicate strong negative employment
effects among displaced residents: the estimated unemployment rate among Katrina evacuees
was 15%, with unemployment rates that are almost five times as high for black evacuees than for
white evacuees (Bureau of Labor Statistics, 2006).
3. Design of the Displaced New Orleans Residents Pilot Study
To begin to address the major research and policy questions that will likely remain
unanswered by studies that have been conducted or are underway, we designed the Displaced
New Orleans Residents Pilot Study. This pilot study was designed to provide key information
and insights for launching a major panel study of displaced New Orleans residents. The results
are also likely to be useful for surveys following major man-made or natural disasters in other
settings. In this section, we describe the Displaced New Orleans Residents Pilot Study,
providing an overview of the study design, questionnaire content, and fieldwork operations.
Study Design
The design of the Displaced New Orleans Residents Pilot Study is based on a stratified,
area-based probability sample of pre-Katrina dwellings in the City of New Orleans. A total of
12

344 cases were sampled for the study, with the sample size determined by the budget. These
cases were selected at random from two separate lists of “named” and “unnamed” housing units
using a systematic sampling algorithm that incorporated explicit stratification by flood depth.
Using the study weights, the data provide representative information on pre-Katrina residents of
New Orleans.
Area-based sampling meant that dwelling units were selected at random from the entire
geographic area of the study in a single-stage—in other words, dwellings were the primary
sampling unit and there was no geographic clustering of cases. This design provides greater
statistical power for a given sample size because design effects are minimized. The disadvantage
of this design is higher costs per case for any in-person interactions due to the need for traveling
greater distances compared to a clustered sample, and the inability to use statistical methods to
identify the effects of unobserved cluster-level factors.
Knowing the addresses of all sampled cases allows us to geocode the sample and to
attach area-based summaries at the block, block-group, tract, and zip-code level from the 2000
U.S. Census and from other data sources. This has two major benefits. First, it allows us to
better understand non-response patterns. In particular, we can assign demographic and
socioeconomic characteristics at a very fine geographic level (block and block-group) to all
sampled cases and can then compare respondents and non-respondent along a number of key
dimensions. Second, it allows us to study the effects of neighborhood contextual factors on
outcomes and behaviors of interest—such as the effects of neighborhood-level recovery on the
probability that a family decides to relocate back to New Orleans.
Flooding in New Orleans in the aftermath of Hurricane Katrina was most severe in the
low-lying areas near Lake Pontchartrain and in the mid-city area, while neighborhoods situated
13

on the natural levees on both sides of the Mississippi River had no flooding. Areas along several
natural ridges that cross the city and along the shore of Lake Pontchartrain also escaped major
flooding. Flood depth was directly tied to housing damage (McCarthy et al., 2006), and thus
represents a crucial factor shaping residents’ post-Katrina migration decisions (such as whether
to return to the city) and financial and other dimensions of well-being.
New Orleans was divided into three strata based on flood depth for sampling purposes.
Information on the depth of the floodwater was derived from remote sensing data made available
by FEMA on the extent of flooding in New Orleans on 31 August 2005. The floodwater depth
was calculated using a geographic information system that included detailed topographic
information for the city, and was coded at the Census block level. The three flood depth strata,
shown in Figure 1, were as follows:
1. Areas with no flooding. Housing in these areas largely suffered from wind damage,
such as leaking roofs, broken windows, and fallen trees. Most structures remained
habitable or could be lived in after making minor repairs. About 29% of all dwellings in
New Orleans (61,400 dwellings out of a total of 211,000) were located in areas with no
flooding.
2. Areas with less than 4 feet of flooding. Housing in these areas had minor to serious
damage, depending on the foundation. About 42,300 dwellings (20% of the total) were
in areas flooded with less than 4 feet of water.
3. Areas with 4+ feet of flooding. Housing units in these areas suffered serious damage,
with many units experiencing severe structural and integrity damage. About 107,500
dwellings (51% of total) were located in areas with 4+ feet of flooding.
In order to achieve an even distribution of the sample within each stratum by three
14

potentially important factors (geographic location, racial composition, and home owners versus
renters), the sample included implicit stratification (through sorting, prior to sampling) by
Census tract, by the percent of the population at the block level that was black, and by the block-
level proportion of dwellings that were owner-occupied.
The sample was drawn from a listing of all dwellings in the city of New Orleans created
by Marketing Systems Group, Inc. (MSG). MSG develops and maintains an enhanced listing of
all households in the U.S. based on records from the U.S. Postal Service and other sources. The
specific listing that was used to draw the sample is an archived version from August 2005. We
confirmed that the MSG listing file was comprehensive and complete by comparing it to data
from the 2000 Census. MSG matches its listing to telephone directories, driver’s license records,
real estate transactions, and other sources to obtain, where possible, the name of the household
head and a telephone number for each dwelling. For New Orleans, approximately half of all
listed dwellings were “named.”
The final stage of stratification and sampling was to oversample dwellings from the
named sample, under the assumption that these cases would be easier to locate. For similar
reasons, DNORPS oversampled dwellings in the no-flood and low-flood strata, and
undersamples dwellings in the high-flooding stratum. Table 1 describes the final DNORPS
sample.
Questionnaire
DNORPS respondents completed a brief questionnaire that covered topics of central
interest for the study. The questionnaire began with a confirmation of eligibility by verifying
that the respondent did indeed reside at the sampled dwelling in New Orleans at the time of
Hurricane Katrina. Next, a complete roster was obtained of all pre-Katrina household residents.
15

Information was collected on these individuals’ relationships with each other and their
background characteristics, such as age, sex, race and ethnicity, place of birth, and education.
The questionnaire asked about the evacuation and resettlement experience, including when each
person left New Orleans, the initial evacuation destination, the evacuation location where they
spent the most time, the current place of residence, and, if they currently resided in New Orleans,
when they had moved back to the city. Information was also collected on the likelihood that
each person will be living in New Orleans in one year’s time. The questionnaire respondent was
asked for further details about his or her own evacuation experience, including the type of
accommodation they lived in for the first month after the storm, how long they lived in
temporary housing, and the specific organizations to which they applied for aid.
The questionnaire asked about each person’s pre-Katrina and current employment,
marital, and health status. Other measures of well-being for each person include whether they
had consulted a health professional for mental health problems and whether their lives were
better, the same, or worse since the hurricane.
Information collected on housing characteristics includes the type of dwelling sampled,
whether the unit was owned or rented, and the extent of damage from Hurricane Katrina and
flooding. Respondents were also asked to report their household’s total monthly income after
taxes in the month preceding Hurricane Katrina.
Finally, the survey respondent was administered the K6 scale of non-specific
psychological distress (Kessler et al, 2002; Kessler et al., 2003) which screens for anxiety and
mood disorders in the previous 30 days. The K6 is widely used in the U.S. as a screener for
mental illness, and has been used previously to examine psychological effects of Hurricane
Katrina (Kessler et al., 2006).
16

It took respondents approximately 15 minutes, on average, to complete the ten-page
questionnaire. Respondents received a check for $20.00 as an incentive for participating in the
study.
Fieldwork Operations
Fieldwork for the Displaced New Orleans Residents Pilot Study began in mid-September
2006 and ended in November 2006. The fieldwork was conducted by RTI International. The
goal was to complete interviews with an adult respondent in each sampled household through
one of the following three modes: first, as a mail survey; next, through a telephone interview for
cases that did not complete the mail survey; and, finally, through an in-person interview for
respondents who were unable or unwilling to complete the survey by mail or telephone.
Fieldwork began by mailing a cover letter and questionnaire to all 344 cases, with an
address correction requested. Problems with the postal system in New Orleans meant that,
although we received 36 completed mail surveys, we received only seven address correction
cards and 126 mailings returned as undeliverable. At the same time that questionnaires were
mailed out, we began batch tracing of respondents using electronic databases such as Telematch,
TransUnion, Death Audit Search, National Change of Address database, and Accurint, in order
to obtain names (for the unnamed sample) and up-to-date telephone numbers and addresses.
Names were obtained for 270 cases (78% of total) and telephone numbers were obtained for 230
of these cases, leaving 114 cases to be traced interactively by telephone or in person. Cases with
a telephone number were sent to the RTI call center for an attempt at a telephone interview.
Cases without a telephone number, or which could not be reached by telephone, were sent to one
of four field interviewers located in New Orleans for on-the-ground tracing and in-person
interviewing.
17
As fieldwork was ending, we decided to subsample pending cases and send only a
random selection of cases to the field for in-person tracing in order to use remaining funds and
time most effectively. A total of 29 cases were selected for this final fieldwork stage from the
154 then-pending cases. There were a total of 7 completes from these subsampled cases.
Fieldwork ended in mid-November 2006, when the budget was exhausted. At that time,
there was a total of 113 cases for which tracing activities were still pending because we had not
been able to obtain a confirmed name, telephone number, or new address (and had not
determined the dwelling to be vacant at the time Hurricane Katrina struck). We had a further 45
cases for which we had located a respondent but had not successfully contacted him or her.
4. Fieldwork Results
Our analysis of the fieldwork results for DNORPS is based, first, on describing outcome
rates for the study and, second, on using multivariate logistic regression models to examine
specific demographic, social, and economic factors at the neighborhood level that are associated
with the outcomes for individual cases. The goal for this analysis is to document and explain the
fieldwork results in order to understand the strengths and shortcomings of the pilot and to inform
future studies of displaced New Orleans residents.
Descriptive Results
The detailed fieldwork results for DNORPS are summarized in Table 2. The upper part
of the table shows the disposition of all cases released to the field, and the panel at the bottom
shows several key outcome rates based on guidelines from the American Association for Public
Opinion Research (AAPOR, 2006). The fieldwork results are presented for each of the three
strata separately as well as for the entire sample.
The top panel in Table 2 shows that a total of 147 interviews were completed for
18

DNORPS. About one-quarter of interviews (36 cases) were completed by mail, while almost
three-quarters (107 cases) were completed by telephone. For a handful of cases, questionnaires
were completed by both mail and telephone (these cases are counted among those completed by
telephone). Only four cases (less than three percent of the total) were completed through in-
person interviews. This reflects the fact that on-the-ground fieldwork efforts were limited, and
that a number of cases that were located in the field were transferred to the call center for
completion as a telephone interview.
The next panel in Table 2 shows that out of the 344 cases released to the field, a total of
17 were determined to be ineligible. Reasons for ineligibility are that there were no surviving
household members, the dwelling was vacant at the time of Hurricane Katrina, or that the case
could not be classified as a pre-Katrina household from New Orleans.
The number of cases identified as vacant at the time of Hurricane Katrina is substantially
smaller than we would expect based on data from other sources. In particular, results from the
2000 Census indicate that 12% of dwellings in New Orleans were vacant—and it is likely that
vacancy rates rose by 2005 along with the modest decline in the city’s population. The 2000
vacancy rates imply that approximately 344 x .12 = 41 sampled cases in DNORPS should have
been vacant. However, only five dwellings were identified as vacant at the time of Hurricane
Katrina. The small number of vacant cases reflects the difficulty of determining the past
occupancy status of a dwelling using fieldwork methods that centered on tracking cases by mail
and telephone. Nevertheless, we were able to classify at least some cases as being vacant at the
time of Hurricane Katrina, largely through on-the-ground fieldwork efforts. This result shows
the value of having interviewers in the field as part of any larger-scale survey of this population.
The third panel in Table 2 shows cases that were not interviewed. The main reason for
19
not completing an interview is that the case could not be located. We were unable to locate 113
cases, which is about one-third of all eligible cases—although note that some of these may in
fact be ineligible, a fact that can only be determined by locating and questioning a respondent or
informant. For virtually all of these cases, there remained leads that could still be pursued by the
fieldwork staff. In other words, few of these cases had reached a dead-end and hence, with
additional time and resources, further tracking activities would be warranted.
The remaining 67 non-interviewed cases comprised one-fifth of eligible cases. These
cases had been located by the fieldwork staff and were approximately evenly divided among
three groups—refusals, unable-to-contact cases, and cases on which work had stopped. Unable-
to-contact cases were finalized cases with an identified respondent and a current telephone
number or address, but which we were unable to reach after numerous attempts. Additional
attempts to contact these cases were judged to be unwarranted. Cases on which work had
stopped include those that were not selected for the final fieldwork stage and those with an
address outside of New Orleans but no telephone number (and which hence required an in-
person visit).
The bottom panel of Table 2 presents outcome rates for the pilot study that were
calculated based on guidelines established by AAPOR (2006). Overall, in DNORPS we located
65% of sampled cases. In the no-flood stratum, 76% of cases were located, but this dropped to
62% in the low-flood stratum and to 58% in the high-flood stratum. It was clearly more difficult
to locate respondents in areas that had flooded, because a higher fraction of these respondents no
longer resided in the sampled dwellings. Differences in rates of locating cases across strata are
statistically significant, based on a sample design-based F-test. Figure 2 shows the distribution
of cases—which reflects the distribution of housing units and population across the city—and
20
distinguishes cases that were located from those that were not located. No clear spatial patterns
are visible in the map, except for the higher likelihood of locating a case in the non-flooded
stratum.
The overall contact rate for DNORPS, calculated as the percent of eligible located cases
that were successfully contacted, was 79%. There was little variation across strata in contact
rates, which varied from 77% in the no-flood stratum, to 81% in the low-flood stratum, to 79% in
the high-flood stratum. Differences in the contact rates across strata are not statistically
significant.
The DNORPS cooperation rate, calculated as the percent of contacted cases that were
interviewed, was 88% overall. This high cooperation rate corresponds directly to a low refusal
rate of 12%, which was achieved even in the absence of extensive refusal-conversion efforts.
Cooperation rates did not vary greatly by stratum, given the 12% refusal rate in the no-flood
stratum, 8% rate in the low-flood stratum, and 15% refusal rate in the high-flood stratum.
Differences across strata in the cooperation rates were not statistically significant.
At the bottom of Table 2 we present two separate response rates—an observed response
rate and an adjusted response rate. In both cases, these rates reflect the percentage of eligible
cases that were successfully interviewed. The adjusted rate controls for the final fieldwork stage
in which a subsample of cases were selected for additional tracking and interview attempts,
while work stopped on the remaining cases. The adjusted response rate varies substantially by
strata, from a high of 63% in the no-flood stratum to a low of 41% in the high-flood stratum.
The overall observed response rate for the study was 45%, with the response rate in the no-flood
stratum exceeding this rate by six percentage points (51%) and the response rate in the high-
flood stratum falling six percentage points below this rate (39%). However, differences in the
21

observed response rates across strata were not statistically significant.
Multivariate Logistic Regression Analysis of Outcome Rates
The area-based sample design of the DNORPS allows us to conduct a multivariate
logistic regression analysis of fieldwork outcomes, with covariates based on area-characteristics
at the block and block-group level from the 2000 Census. Covariates are available for all
cases—i.e., both responding and non-responding cases in the sample—and hence allows us to
investigate whether there are systematic patterns for the various outcome rates according to
demographic, social, and economic characteristics of the local-area of the dwelling.
The dependent variables for the regression analyses are fieldwork outcomes coded at the
individual level that indicate whether an eligible case was located, a located case was contacted,
or a contacted case cooperated (i.e., was interviewed). In addition, we examine the individual-
level analog of the overall response rate by modeling whether or not an eligible case was
successfully interviewed. Note that the probability of responding reflects the product of the first
three outcomes (located, contacted, and cooperated) all occurring.
Covariates in the model include sample-design variables (flood-depth stratum and
whether the case was named or unnamed), flood depth, and Census-based areal measures of
demographic characteristics (age and percent of population black), socioeconomic status (percent
of employed adults with executive or professional occupations and median family income),
residential stability (percent of dwellings classified as non-family and a residential stability
factor score),3 and percent of dwellings vacant. All of the covariates were based on block or
block-group information. Table 3 presents summary statistics for the model covariates.
We estimated logistic regression models using statistical techniques designed for
3 The residential stability factor score was based on the percentage of dwellings in multiple-unit structures,percent of dwellings that were owner-occupied, and percent of residents who lived in the same dwelling five yearspreviously.
22

analyzing complex survey data that adjust for stratification of the sample, with robust standard
errors calculated using the jackknife method. The results, presented in Table 4, show the
exponentiated parameter estimates and standard errors, along with an indicator of statistical
significance. Also shown are the goodness-of-fit test statistics for each model and the number of
observations.
Only the first model, which estimates the probability of locating a respondent for an
eligible case in the sample, fits the data according to the model’s goodness-of-fit F-statistic. In
other words, for the first model alone we find systematic differences in the outcome based on the
covariates examined. Although some of the individual covariates are statistically significant in
the other models, we cannot reject the hypothesis that the estimated parameters are jointly equal
to one (i.e., have no effect on the outcome). There are two factors which drive this result. First,
it reflects the modest sample size of the pilot, which leads to the standard errors for the estimated
parameters being moderately large. Second, it points to the true absence of systematic patterns
of nonresponse in these various fieldwork outcomes and to the genuinely small magnitudes of
the estimated parameter effects.
For the model describing the probability of locating a case, there are several results worth
noting. Although there are substantially lower rates of locating cases in the low-flood and high
flood strata, compared to the no-flood stratum, these effects are not jointly statistically
significant. Rather, the only statistically significant difference is between the no-flood and low-
flood strata—but only at the .10 significance level. There are no statistically significant
differences in locating named versus unnamed cases, which is due to an estimated parameter
very close to one (rather than a large standard error) and points to the effectiveness of finding
contact information for the unnamed sampled. Cases classified as “older” (based on the average
23

age of residents in the New Orleans block of the dwelling) were located at higher rates. This
may be because households in neighborhoods with older residents may be more established and
have stronger ties to the neighbors and to the local area. Cases in tracts with a higher fraction of
non-family households had lower rates of being located. This reflects the greater likelihood of
respondents living alone or with roommates and correspondingly higher levels of transiency and
weaker ties to the dwelling, the neighborhood, and the city. Finally, note that none of the
covariates describing race or socioeconomic status were statistically significant.
There were no statistically significant effects for any parameters in the model describing
whether or not a located case is contacted. For the next model, describing whether or not a
contacted case completes an interview, the effects of age and percent of population that is black
are marginally significant (at the .10 significance level). Older age is associated with lower
probability of cooperating while blacks appear to have higher cooperation rates. Finally, for the
non-response model, the only statistically significant result is a finding of a lower probability of
response in the high-flood stratum. Looking at this covariate across the models, reveals that
cases in the high-flood stratum have worse outcomes across the board; however, only when
compounded across the outcome stages does this negative effect on the survey outcome of being
in the high-flood stratum become statistically significant.
5. Conclusions
The goal of Displaced New Orleans Residents Pilot Study was to establish the feasibility
of identifying a representative sample of pre-Katrina residents of New Orleans and to determine
the likely success of efforts to track and interview this sample.
With regard to the first study goal, the pilot study demonstrated the feasibility of the
sample design and highlighted a number of its features. These features include an area-based
24

sample design that supports analyses of fieldwork outcomes and, in particular, the effects of local
area-based measures of demographic, socioeconomic, and housing characteristics. With regard
to the second study goal, the DNORPS results showed that sampled respondents once contacted
could be successfully interviewed with cooperation rates approaching 90%, but that the main
challenge was in locating respondents. Also, there were few systematic differences in fieldwork
outcomes, by demographic, socioeconomic, and housing characteristics, across any of the
fieldwork stages—with the exception of locating sampled cases.
The main challenge in improving the fieldwork results and in launching a full-scale study
of this population is to locate a high fraction of sampled cases. Although the rate of successfully
locating cases for DNORPS of 65% is reasonably high given the study constraints, it could be
improved. Successfully locating a higher percentage of cases will involve two separate, but
related, activities. One activity is to establish which cases are ineligible and, in particular, which
dwellings were vacant at the time of Hurricane Katrina. Additional tracking and fieldwork
activities are likely to be fruitful for determining the vacancy status at the time of Hurricane
Katrina. For instance, these activities might include identifying and contacting public housing
administrators, landlords, and rental property managers and asking them about occupancy status
of sampled dwellings at the time of Hurricane Katrina. The second activity that will raise the
proportion of eligible cases that are found is to conduct additional tracking activities. Fieldwork
operations for the pilot study ended because of budget and time constraints rather than because
all leads had been exhausted.
Overall, the results of the pilot provide a useful foundation for launching a larger-scale
panel survey of displaced New Orleans to study well-being of this population over the coming
years. The findings may also be relevant to studying the effects of man-made or natural disasters
25

in other settings. Longitudinal studies are useful for providing an on-going assessment of the
population effects of a disaster. They allow researchers to determine for whom the disaster is an
experience from which they will never recover—and for whom on-going support is essential—
and to identify individuals for whom the disaster may have been a life-altering experience for the
better.
26

References
AAPOR (The American Association for Public Opinion Research). 2006. Standard Definitions:
Final Dispositions of Case Codes and Outcome Rates for Surveys. 4th edition. Lenexa,
Kansas: AAPOR.
Abramson, David, and Richard Garfield. 2006. On the Edge: Children and Families Displaced
by Hurricanes Katrina and Rita Face a Looming Medical and Mental Health Crisis.
Columbia University, Mailman School of Public Health.
Abramson, David, Richard Garfield, and Irwin Redlener. 2007. The Recovery Divide: Poverty
and the Widening Gap Among Mississippi Children and Families Affected by Hurricane
Katrina. Columbia University, Mailman School of Public Health.
Berube, Alan, and Bruce Katz. 2005. Katrina’s Window: Confronting Concentrated Poverty
Across America. Washington: Brookings Institution.
Brazile, Donna L. 2006. “New Orleans: Next steps on the Road to Recovery,” Pp. 233-7 in The
State of Black America. National Urban League.
Brodie, Mollyann, Erin Weltzien, Drew Altman, Robert J. Blendon, and John M. Benson. 2006.
“Experiences of Hurricane Katrina Evacuees in Houston Shelters: Implications for Future
Planning,” American Journal of Public Health 96: 1402-8.
Brookings Institution. 2005. New Orleans After the Storm: Lessons from the Past, a Plan for the
Future, Washington, D.C.: Metropolitan Policy Program, Brookings Institution.
Bureau of Labor Statistics. 2006. “The labor market impact of Hurricane Katrina: An overview,”
Monthly Labor Review August: 3-10.
Cahoon, L.S., et al. 2006. “The Current Population Survey response to Hurricane Katrina,”
Monthly Labor Review August: 40-51.
27
Comfort, Louise K. 2006. “Cities at Risk: Hurricane Katrina and the Drowning of New Orleans,”
Urban Affairs Review 41: 501-16.
Elliott, James R., and Jeremy Pais. 2006. “Race, class and Hurricane Katrina: Social Differences
in Human Responses to Disaster,” Social Science Research 35: 295-321.
Hill, Paul, and Jane Hannaway. 2006. “The Future of Public Education in New Orleans,”
Washington, D.C.: Urban Institute.
Hurricane Katrina Community Advisory Group. 2006. Overview of Baseline Survey Results:
Hurricane Katrina Community Advisory Group. Harvard School of Public Health.
Kessler, R.C., G. Andrews, L.J. Colpe, E. Hiripi, K.D. Mroczek, S.L. Normand, E.E. Walters,
and A.M. Zaslavsky. 2002. “Short screening scales to monitor population prevalences and
trends in non-specific psychological distress,” Psychological Medicine 32: 959-976.
Kessler, R.C., P.R. Barker, L.J. Colpe, J.F. Epstein, J.C. Gfroerer, E. Hiripi, M.J. Howes, S.L.
Normand, R.W. Manderscheid, E.E. Walters, and A.M. Zaslavsky. 2003. “Screening for
serious mental illness in the general population,” Archives of General Psychiatry 60: 184-9.
Kessler, R.C., S. Galea, R.T. Jones, and H.A. Parker on behalf of the Hurricane Katrina
Community Advisory Group. 2006. “Mental illness and suicidality after hurricane Katrina,”
Bulletin of the World Health Organization 84: 1-21.
Logan, John. 2002. “Separate and Unequal: The Neighborhood Gap for Blacks and Hispanics in
Metropolitan America.” Lewis Mumford Center for Comparative Urban and Regional
Research, University at Albany.
LPHI (Louisiana Public Health Institute). 2006. Louisiana Health and Population Survey
Report: Orleans Parish. New Orleans, LA.
McCarthy, Kevin, D.J. Peterson, Narayan Sastry, and Michael Pollard. 2006. The Repopulation
28

of New Orleans After Hurricane Katrina. RAND: Santa Monica, CA.
Mumford Center. 2001. “Ethnic Diversity Grows, Neighborhood Integration Lags Behind.”
Lewis Mumford Center for Comparative Urban and Regional Research, University at
Albany.
Pane, John F., Daniel F. McCaffrey, Shannah Tharp-Taylor, Gary J. Asmus, and Billy R. Stokes.
2006. Student Displacement in Louisiana After the Hurricanes of 2005: Experiences of
Public Schools and Their Students. Santa Monica, CA: RAND Corporation
Seeman, Bruce Taylor. 2005. “Uninsured Losses Complicate Disaster Recovery,” Newhouse
News Service, October 11, 2005.
Smith, Stanley K. 1996. “Demography of Disaster: Population Estimates After Hurricane
Andrew,” Population Research and Policy Review 15: 459–77.
Smith, Stanley K., and Christopher McCarty. 1996. “Demographic Effects of Natural Disasters:
A Case Study of Hurricane Andrew,” Demography 33: 265–75.
Solecki, William D. 1999. “Environmental hazards and interest group coalitions: Metropolitan
Miami after hurricane Andrew,” in James K. Mitchell (ed.), Crucibles of Hazard: Mega-
Cities and Disasters in Transition. New York: United Nations University Press.
Spain, Daphne. 1970. “Race Relations and Residential Segregation in New Orleans: Two
Centuries of Paradox,” Annals of the American Academy of Political and Social Science
441: 82–96.
Stone, Greg, Tim Grant, and Nathaniel Weaver. 2006. Rapid Population Estimate Project:
January 28-29 2006 Survey Report. Emergency Operations Center, City of New Orleans.
Swenson, Dan. 2006. “After Katrina, pundits criticized New Orleans, claiming too many
residents had no flood insurance: In fact, few communities were better covered,” Times-
29

Picayune March 19, 2006.
Tizon, Tomas Alex, and Doug Smith. 2005. “Evacuees of Hurricane Katrina Resettle Along a
Racial Divide, Los Angeles Times, December 12, 2005.
U.S. Census Bureau. 2000. Decennial Census. www.census.gov.
U.S. Census Bureau. 2005. American Factfinder. Sep 7, 2005. www.factfinder.census.gov.
U.S. Census Bureau. 2006. Special Population Estimates for Impacted Counties in the Gulf
Coast Area. www.census.gov/Press-
Release/www/emergencies/impacted_gulf_estimates.html.
30

Table 1. Stratification and sampling for the Displaced New Orleans Residents Pilot Study
Population Dwellings Sampled DwellingsFloodingstratum Count Percent Count Percent Named Unnamed Total Percent0 feet 122,073 25% 61,411 29% 93 31 124 36%< 4 feet 94,470 20 42,313 20 59 21 80 23
4 feet 268,131 55 107,522 51 70 70 140 41Total 484,674 100 211,246 100 222 122 344 100Note: Population estimates based on 2000 U.S. Census block data; dwelling estimates based on 2005 addresslisting file from Marketing Systems Group
31

Table 2. Final Disposition of Displaced New Orleans Residents Pilot Study Cases
Flooding stratum0 feet < 4 feet 4 feet Total
Disposition of cases
Interviewed Mail 20 11 5 36 Telephone 37 23 47 107 In-person 2 1 1 4 Total interviewed 59 35 53 147
Ineligible Not a resident 5 2 0 7 Vacant dwelling[a] 3 0 4 7 Deceased[b] 2 2 1 5 Total ineligible 10 4 5 19
Not-interviewed Located cases Refusal 8 3 9 20
Unable to contact 11 6 3 20Incapable 1 0 1 2Work stopped 9 3 13 25Total located 29 12 26 67
Unlocated casesTotal unlocated 27 29 57 113
Total not-interviewed 56 41 83 180
Total sample 124 80 140 344
Outcome rates
Located cases[c] 76% 62% 58% 65% Contacted cases[d] 77% 81% 79% 79% Cooperation rate[e] 88% 92% 85% 88% Observed response 51% 46% 39% 45% Adjusted response[f] 63% 52% 41% 51%
Notes: [a] Dwelling vacant at time of Hurricane Katrina.[b] No surviving household members.[c] Percent of eligible cases that were located. [d] Percent of located cases that contacted.[e] Percent of contacted cases that were completed.[f] Adjusted response rate accounts for subsampling of final round of cases.
32

Table 3. Summary Statistics for Covariates Used in Analysis of OutcomeIndicators for the Displaced New Orleans Residents Pilot Study
Covariate
Percent or
Mean (std. dev)
Stratum
No-flood 36% Low-flood 23 High-flood 41Named case
No 29% Yes 71Flood depth (feet) 3 (4)Median age (years) 36 (10)Black population (%) 60 (38)Exec/prof occupation (%) 49 (29)Median family income ($) 40,219 (28,278)Non-family HHs (%) 40 (18)Residential stab. (score) 0 (0.9)Vacant dwellings (%) 11 (10)
Observations 325Note: Covariates are block or block-group level
measures. Only eligible observations are tabulated.
33

34
Table 4. Logistic Regression Model Results for Outcome Indicators in the Displaced New Orleans Residents Pilot Study
Fieldwork Outcome
Covariate Located[b]
Contacted[c]
Cooperated[d]
Responded[e]
Stratum
No-flood[a] . . . . . . . . Low-flood 0.49* (0.19) 1.05 (0.62) 1.53 (1.46) 0.69 (0.25) High-flood 0.35 (0.23) 0.35 (0.37) 0.35 (0.45) 0.29** (0.18) Named case
No[a] . . . . . . . . Yes 1.02 (0.30) 1.02 (0.47) 0.27 (0.29) 0.82 (0.22) Flood depth (feet) 1.00 (0.08) 1.21 (0.19) 1.02 (0.19) 1.09 (0.09) Median age (years) 1.04** (0.02) 1.02 (0.02) 0.96* (0.02) 1.01 (0.01) Black population (%) 0.97 (0.06) 0.87 (0.08) 1.22* (0.13) 0.98 (0.05) Exec/prof occupation (%) 1.25 (0.17) 1.01 (0.22) 1.29 (0.35) 1.22 (0.16) Median family income ($) 1.00 (0.00) 1.00 (0.00) 1.00 (0.00) 1.00 (0.00) Non-family HHs (%) 0.79** (0.08) 0.98 (0.15) 0.84 (0.23) 0.85 (0.09) Residential stab. (score) 1.04 (0.19) 1.18 (0.33) 0.64 (0.40) 1.07 (0.19) Vacant dwellings (%) 0.92 (0.13) 0.85 (0.18) . . 0.93 (0.13)
Model F-test (df1, df2) 2.19** (11, 312) 0.76 (11, 199) 1.33 (10, 155) 1.58 (11, 312)
Observations 325 212 167 325
Odds ratios shown; standard errors in parentheses; *p<.10; **p<.05; ***p<.01. All % variables divided by 10. Source: Author’s calculations using data from the 2006 Displaced New Orleans Residents Pilot Study. Notes: [a] Reference category. [b] Percent of eligible cases that were located. [c] Percent of located cases that contacted. [d] Percent of contacted cases that were interviewed. [e] Percent of eligible cases that were interviewed

Figure 1. Flood Depth Strata for the Displaced New Orleans Residents Pilot Study
35
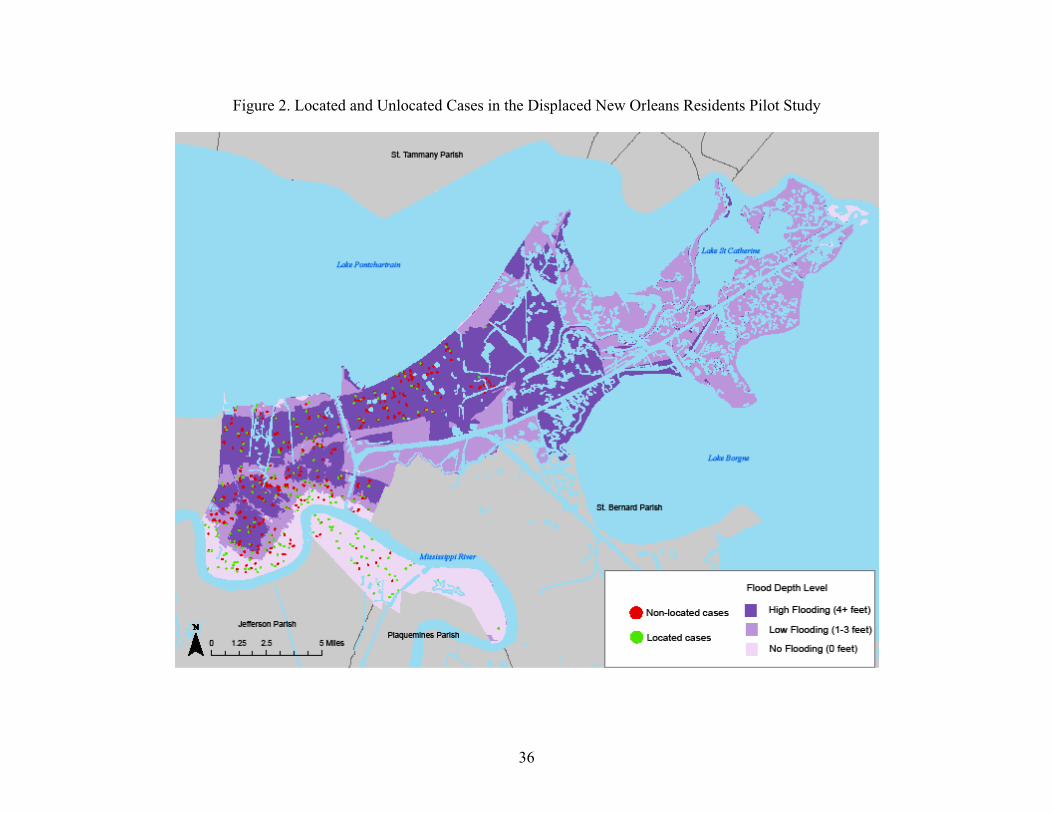
Figure 2. Located and Unlocated Cases in the Displaced New Orleans Residents Pilot Study
36