
Residential Real Estate - teja8.kuikr.com · PDF fileestate developers.The sector is expected...
66
INDIA RESIDENTIAL REAL ESTATE I RESEARCH ANNUAL REPORT 2016 India Residential Real Estate BENGALURU I NCR I MMR I PUNE I CHENNAI I HYDERABAD I KOLKATA
Transcript of Residential Real Estate - teja8.kuikr.com · PDF fileestate developers.The sector is expected...

INDIA RESIDENTIAL REAL ESTATE I RESEARCH
ANNUAL
REPORT
2016
I nd i a
Res iden t i a l
Rea l E s t a te
BENGALURU I NCR I MMR I PUNE I CHENNAI I HYDERABAD I KOLKATA

INDIA RESIDENTIAL REAL ESTATE I RESEARCH
F O R E W O R D
The year 2016 was yet another lackluster year for the Indian Real Estate Industry in terms of sales and new
launches. However, the flurry of policy announcements in the form of RERA, GST, Demonetization, and Benami
act made during the year have ensured that 2016 will be remembered as a year of reincarnation of the Indian Real
Estate Industry.
The perennial issues of transparency that had severely impacted buyers sentiment were addressed by the
government by making RERA into a reality. Passing of RERA was welcomed by almost all the recognized builders.
It helps weed out the bad apples of the developer community, that normally tarnishes the image of the entire real
estate developers. The sector is expected to witness consolidation in the coming years, predominantly due to the
smaller players who may find complying with RERA norms difficult as well as expensive and may end up merging
with a stronger entity.
Having said that, well established developers too will now have to re-look at their strategy of new launches,
project planning and execution. Not to mention the importance of better capital deployment will gain the center
stage. With the vigil increasing on Benami transaction and black money, the early stage investors and speculators
almost abandoned the pre-launch and early stage construction projects. However, there has been a gradual
increase in the enquiries of ready-to-move-in projects. This is a good sign for the industry, as it clearly indicates
that the interest of genuine end users that stands to gain momentum over a period of time.
Overall, in 2016, the rules of the games were reset, but, its evident that all the policy development and
announcements made during the year have laid down a very strong ground for the revival of industry.
Prashant Kumar Thakur Head of Research & Data Services
INDIA RESIDENTIAL REAL ESTATE I RESEARCH
E X E C U T I V E S U M M A R Y
• In 2016, the top seven cities in the country have recorded a decline of nearly 40 percent in the new launch
supply compared to its preceding year. The major reason behind this turmoil can be attributed to the huge
stock of unsold inventory in the primary market, low sales velocity and negative buyer sentiments due to high
property prices. Moreover, developers in these cities started focusing on clearing the existing stock by
providing lucrative offers to home buyers, instead of infusing new launch supply.
• The top seven cities across India have witnessed launch of approximate 2.25 Lac residential dwelling units in
2016. MMR contributed a maximum share of this new launch supply, at 28 percent, followed by Pune,
Bengaluru and NCR at 18,17 & 16 percent, respectively.
• The residential market of National Capital Region (NCR) was the the worst affected in terms of new launch
supply in 2016, an approximate 61 percent decline recorded compared to the new launch supply of 2015,
followed by Bengaluru, Chennai and Kolkata, at 41, 37 and 33 percent, respectively. Negative investor
sentiment coupled with enormous quantum of under construction supply in Greater Noida and Gurgaon has
restricted the developer focus on new launch projects.
• Q4 2016 has recorded a sharp decline of 58 percent in new launch supply compared to Q4 2015. The
demonetization drive by the central government has restricted developers to launch new projects in the cash
crunch market. This is because the pre launch and new launch are the only stages, where developers get
maximum traction from the consumer due to low ticket price.
• In 2016, in the top seven cities, an approximate 66 percent unit launched were under the budget of 60 Lacs
ticket price properties. The new launch supply trend clearly connotes that developers in top cities started
aligning with the consumer demand for affordable and mid segment properties.
• Interestingly, the premium residential market of the country (MMR) has recorded 57 percent launches under
the ticket price of 60 Lacs. The above price bracket has been primarily chosen to cater the demand of those
home buyers who are holding their purchase decision due to skyrocketing prices and non-availability of
affordable property options in the region.
• Fewer new launches in the last quarter of 2016 have helped in bringing down the unsold inventory level in top
seven cities. Unsold inventory decreased by 3 percent, from 7,56,373 units in Q3 2016 to 7,34,610 units in Q4
2016. Lucrative offers and easy payment plans on ready to move in properties and mid stage construction
properties have marginally helped developers to clear their existing stock.
• The year 2016 witnessed active participation from Private equity players in the Indian real estate industry.
Approximately $5.5 billion was pumped in through the private equity route, which was an increase of 40
percent as compared to 2011.

INDIA RESIDENTIAL REAL ESTATE I RESEARCH
H I G H L I G H T S O F U N I O N B U D G E T 2 0 1 7 - 1 8 A N D I T S I M P A C T O N R E A L E S T A T E S E C T O R
Announcement Impact
Infrastructure Status to Affordable
Housing
Reduces the cost of borrowing for real estate developers, Provides easy
access to finance and spur investments, Opening of External Commercial
Borrowing (ECB) route and Taxation benefits for the developers.
An increase in budget allocation under
PMAY from 15,000 Cr to 23,000 Cr to
complete 1 Crore houses by 2019
Increased PMAY will provide budget housing segment with a cheaper
source of finance and increase employment opportunities in rural area
which extends supports to the "Housing For All By 2022" mission.
Revising the size of carpet area for low
income group houses
Will enhance uniformity in market measurement and thereby easing the
decision making process for the homebuyers. The buyer will now get a
spacious house of carpet area 30 to 60 Sq.mt. instead of built up area. The
30 sq.m limit will apply only in case of municipal limits of 4 metropolitan
cities and for the rest of the country, the limit is 60 sq.m
Revising the holding period for capital
gain tax from 3 years to 2 years
This move will reduce the capital gain tax liability while encouraging the
mobility of assets. It will also make the real estate sector more attractive
for investors.
Boost in home loans
The refinancing of individual housing loans of 20,000 crore by the National
Housing Bank (NHB) will aid the housing finance companies and low
income borrowers.
Special benefit for AMRUT and Smart
Cities
An increased fund allocation of 9,000 crore for AMRUT and Smart Cities
will boost the real estate development, especially in tier 2 and tier 3 cities
falling under this scheme.
Ease in FDI Norms
FDI can now be bought into the construction sector in any amount and
for any size of project. This decision will help in strengthening those
projects that could not receive capital due to conditions applicable for
attracting FDI.
Tax relaxation for JDA developed
properties
For Joint Development Projects, the payment of capital gain tax will be in a
year after the project is completed.
Interest subsidy for lower income
group home buyers
Interest subsidy of 3% and 4% for housing loans of up to INR 12 Lacs and
INR 9 Lacs was announced for middle-income group segment. In rural
areas, 3% subsidy was announced for loans of up to INR 2 Lacs to build
and expand existing housing unit.
Tax relief for developers holding
unsold stock
The developer will now pay capital gain tax only in the year when the
project is completed. This will reduce the tax burden of the developer and
encourage to liquidate inventory at a faster rate.

INDIA RESIDENTIAL REAL ESTATE I RESEARCH
CONTENTS
PAN INDIA
6
BENGALURU
11
43
CHENNAI
HYDERABADKOLKATA
MMR
PUNE
27
36
NCR
19
5851

INDIA RESIDENTIAL REAL ESTATE I RESEARCH

INDIA RESIDENTIAL REAL ESTATE I RESEARCH
No. o
f U
nits
R E S I D E N T I A L S U P P L Y - 2 0 1 5 V S 2 0 1 6
2016 ended with the lowest number of new launches
across the top seven cities of India since 2012. There
has been a 40 percent decline in the new launch supply
recorded in the year 2016 compared to the previous
year.
Q4 2016, considered as the worst time-frame in 2016,
has recorded nearly 58 percent whopping decline in
new launch supply when compared to Q4-2015.
Due to demonetization drive by the Central
Government, most of the developers restricted to
infuse new launch supply in the market. Even festive
season couldn't boost the market sentiments in the last
quarter of the year 2016. Additionally, the sales volume
in top cities also impacted badly in the Q4- 2016.
** Source: QuikrHomes Data – Values excluding layout and plots
Note: The Top seven cities are Bengaluru, Chennai, National Capital Region(NCR), Hyderabad, Kolkata, Mumbai Metropolitan Region(MMR) and Pune.
Time-frame Q1 2016 Q2 2016 Q3 2016 Q4 2016
% Change -2015 vs 2016 -33% -36% -35% -58%
R E S I D E N T I A L S U P P L Y – T O P C I T I E S
National Capital Region witnessed the sharpest
drop in new launch supply by 61 percent in 2016,
compared to the preceding year. This was
followed by Bengaluru, Chennai and Kolkata by
41, 37 and 33 percent, respectively.
However, Hyderabad is the only city, which has
witnessed a marginal drop in new launch supply
by just 4 percent.
Post formation of the separate state, the realty
sentiments in Hyderabad are heading towards
the north and showing a marginal increase in
capital price and new launch supply.
INDIA RESIDENTIAL REAL ESTATE I RESEARCH
C I T Y W I S E S P L I T O F R E S I D E N T I A L L A U N C H E S - 2 0 1 6
B U D G E T W I S E S P L I T O F N E W L A U N C H E S - T O P C I T I E S 2 0 1 6
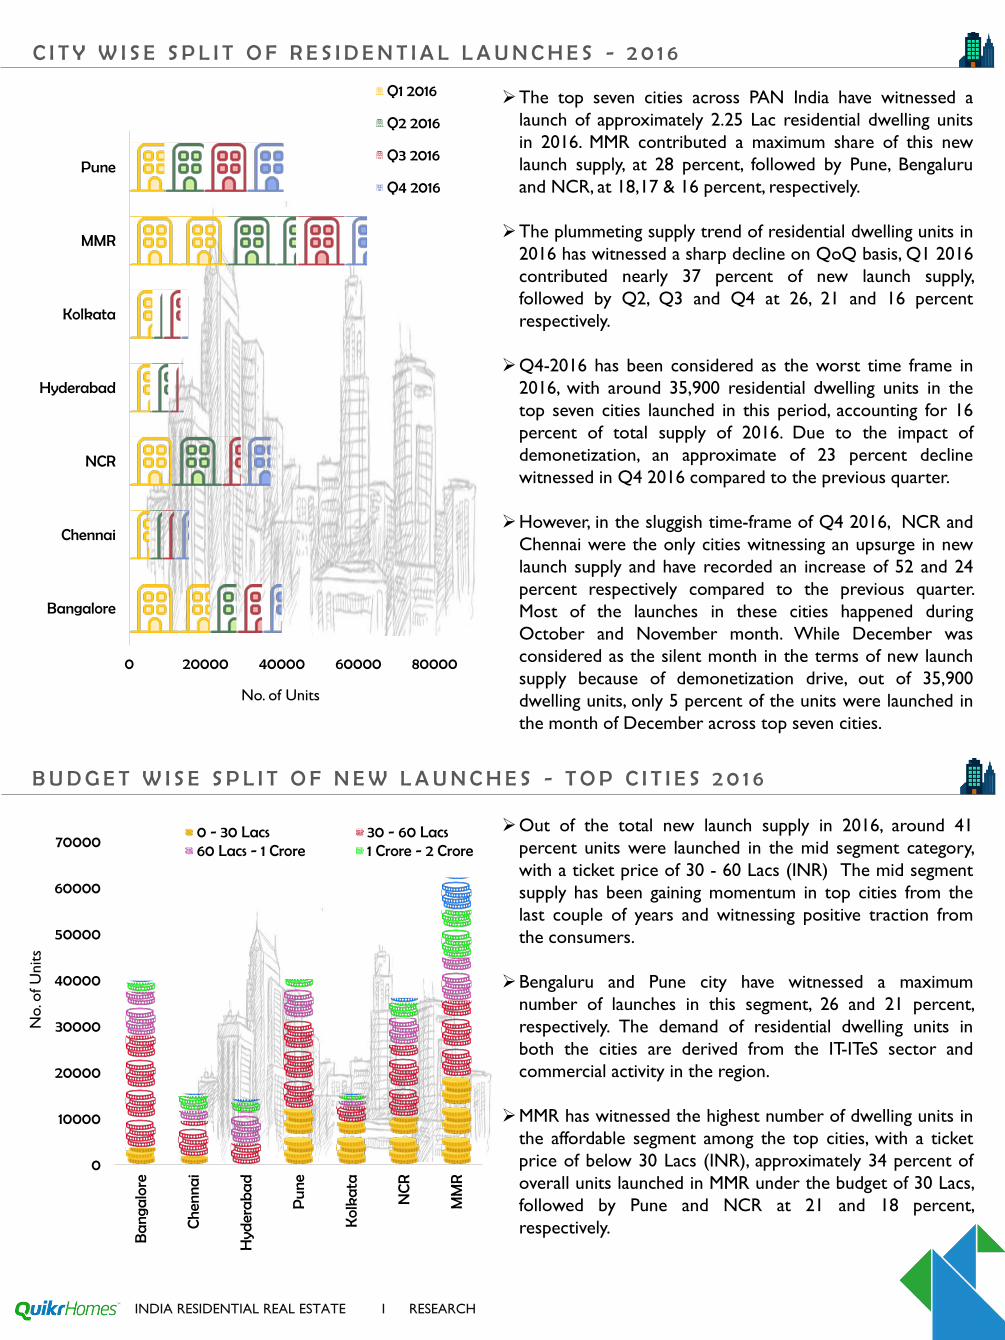
The top seven cities across PAN India have witnessed a
launch of approximately 2.25 Lac residential dwelling units
in 2016. MMR contributed a maximum share of this new
launch supply, at 28 percent, followed by Pune, Bengaluru
and NCR, at 18,17 & 16 percent, respectively.
The plummeting supply trend of residential dwelling units in
2016 has witnessed a sharp decline on QoQ basis, Q1 2016
contributed nearly 37 percent of new launch supply,
followed by Q2, Q3 and Q4 at 26, 21 and 16 percent
respectively.
Q4-2016 has been considered as the worst time frame in
2016, with around 35,900 residential dwelling units in the
top seven cities launched in this period, accounting for 16
percent of total supply of 2016. Due to the impact of
demonetization, an approximate of 23 percent decline
witnessed in Q4 2016 compared to the previous quarter.
However, in the sluggish time-frame of Q4 2016, NCR and
Chennai were the only cities witnessing an upsurge in new
launch supply and have recorded an increase of 52 and 24
percent respectively compared to the previous quarter.
Most of the launches in these cities happened during
October and November month. While December was
considered as the silent month in the terms of new launch
supply because of demonetization drive, out of 35,900
dwelling units, only 5 percent of the units were launched in
the month of December across top seven cities.
0 20000 40000 60000 80000
Bangalore
Chennai
NCR
Hyderabad
Kolkata
MMR
Pune
No. of Units
Q1 2016
Q2 2016
Q3 2016
Q4 2016
Out of the total new launch supply in 2016, around 41
percent units were launched in the mid segment category,
with a ticket price of 30 - 60 Lacs (INR) The mid segment
supply has been gaining momentum in top cities from the
last couple of years and witnessing positive traction from
the consumers.
Bengaluru and Pune city have witnessed a maximum
number of launches in this segment, 26 and 21 percent,
respectively. The demand of residential dwelling units in
both the cities are derived from the IT-ITeS sector and
commercial activity in the region.
MMR has witnessed the highest number of dwelling units in
the affordable segment among the top cities, with a ticket
price of below 30 Lacs (INR), approximately 34 percent of
overall units launched in MMR under the budget of 30 Lacs,
followed by Pune and NCR at 21 and 18 percent,
respectively.
0
10000
20000
30000
40000
50000
60000
70000
Ba
nga
lore
Che
nna
i
Hyd
era
ba
d
Pu
ne
Kol
kata
NC
R
MM
R
No. o
f U
nits
0 - 30 Lacs 30 - 60 Lacs60 Lacs - 1 Crore 1 Crore - 2 Crore

INDIA RESIDENTIAL REAL ESTATE I RESEARCH
Most of the launches in this segment happened in the peripheral regions of the city. Zones such as Mumbai Beyond
Thane and Mumbai Beyond Mira Road were the biggest contributors in this supply. High property prices and shortage of
land bank within the city center have forced the developer interest to focus on these areas for their portfolio expansion.
Additionally, easy accessibility and connectivity to city commercial hub has made these zones one of the most sought
after.
MMR is the hub of premium segment properties, out of total supply in the premium segment (above 2 crore (INR)),
nearly 68 percent units were launched in the micro markets of Western suburbs, Central suburbs and South zone of
MMR region, followed by NCR and Hyderabad, at 10 and 7 percent, respectively.
Fewer new launches in the last quarter of 2016 have helped in bringing down the unsold inventory level in top seven cities.
Unsold inventory decreased by 3 percent, from 7,56,373 units in Q3 2016 to 7,34,610 units in Q4 2016.
On an average basis, the current unsold stock in the top seven cities will take nearly 47 months to absorb in the primary
market. The calculation of inventory overhang is arrived from the average sales velocity of last 12 months in the primary
market in the respective city.
Pune continues to be among the best performing residential markets in the country, with lowest inventory overhang,
followed by Kolkata and Bengaluru.
NCR and MMR remained the worst performing market in terms of unsold inventory. Out of total unsold inventory, nearly
31 percent of unsold stock is available in NCR at the different stages of construction, followed by MMR and Bengaluru, at
25 and 15 percent, respectively.
To liquidate current unsold inventory, NCR residential market will take an approximate 70 months and MMR will take an
approximate 60 months, while Bengaluru residential market will take 40 odd months to absorb the current unsold
inventory.
U N S O L D I N V E N T O R Y I N T O P C I T I E S

INDIA RESIDENTIAL REAL ESTATE I RESEARCH
REGULATORY UPDATES
Proposals for reduction of stamp duty on registration of houses has come up to reduce burden to the home buyers
as 2508 cities in 26 states have been shortlisted by the GoI under the 'Pradhan Mantri Awas Yojana' for providing
affordable houses to the urban poor
The Securities and Exchange Board of India (Sebi) has relaxed rules on Real Estate Investment Trusts (REITs) by
allowing high investments in under-construction projects, rationalised unit holder consent on related transactions and
removed restrictions on special purpose vehicle (SPV)
INFRASTRUCTURE UPDATES
Monetization of completed public funded national highway projects through Toll-Operate Transfer mode based on the
predicted collection of user fee receivables, through private sector efficiency and expertise has been proposed and
the proceeds shall be utilised for construction, operation and maintenance of national highways
A 1,400-km long highway which starts in the eastern region of India from Moreh and ends in Myanmar’s Tamu city
aids in linking India with Southeast Asia by land which will boost the trade and cultural exchanges between the three
countries
MAJOR DEALS
About Rs 7,296 crore has been allocated for two central schemes -- Atal Mission for Rejuvenation and Urban
Transformation (AMRUT) and 'Smart Cities' Mission with focus on provision of clean drinking water, setting up of
sanitation and solid waste management systems, efficient mobility and public transportation and affordable housing
Tata Value Homes, a 100 per cent subsidiary of Tata Housing Development Company, has raised USD 25 million i.e. Rs
168 crore for construction of affordable housing projects through CDC, UK's Development Finance Institution (DFI)
and IFC, a member of the World Bank group
R E A LT Y N E W S

INDIA RESIDENTIAL REAL ESTATE I RESEARCH

INDIA RESIDENTIAL REAL ESTATE I RESEARCH
POPULATION
CITY
OVERVIEW
709 km2 8.42 Million
AREA
ABOUT CITY
Third most populous city and fifth most populous urban
agglomeration in India
POPULATION GROWTH RATE
38% 10.3%
ECONOMIC GROWTH RATE
*As of year 2008
RESIDENTIAL MARKET GROWTH DRIVERS
East Bengaluru: Whitefield, ITPL, Marathahalli-Sarjapur Road
West Bengaluru: Peenya Industrial Area.
North Bengaluru: Manyata Tech Park, Kempegowda
International Airport, Bagalur Tech Park (Under Construction)
South Bengaluru: Electronic City and Hosur Road
INFRASTRUCTURE
Existing: Namma Metro Phase 1, Signal Free Bellary Road, Outer Ring Road
Upcoming: Peripheral Ring Road (PPR), Namma Metro Phase 3
RESIDENTIAL UNITS LAUNCHED
39,935 units
PREDOMINANT BUDGET RANGE
30 Lac - 60 Lac
*Constitutes 61 % of total Supply
HIGHEST NUMBER OF LAUNCHES
East Bengaluru (13,308 units)
% CHANGE IN PRICE 2015 vs 2016
% CHANGE IN NEW LAUNCH SUPPLY – 2015 vs 2016
41%
UNSOLD STOCK
1,09,452 units
CITY INVENTORY OVERHANG
UNDER CONSTRUCTION
UNITS
1,98,711 units
*As per Census 2011
Icons Source: Flaticon
40 Months
3%

INDIA RESIDENTIAL REAL ESTATE I RESEARCH
N E W L A U N C H S U P P L Y T R E N D - 2 0 1 5 V S 2 0 1 6
Bengaluru, one of the best performing residential market
among top cities has witnessed a decline of 41 percent in
new launch supply in 2016 compared to its preceding year.
The decline in new launch supply in the residential market
is directly related to piled up stock in the primary market.
Moreover, developers are also focusing to clear the piled
up stock, instead of infusing new supply in the market.
Demonetization has badly impacted the residential supply
in the last quarter of 2016, a whopping 74 percent decline
was recorded in new launch supply in Q4 2016, compared
to Q4 2015. The drive not only halted the new launch
supply trend in the city, but also impacted the sales
volume dreadfully.
Z O N E W I S E S P L I T O F R E S I D E N T I A L L A U N C H E S
0 5000 10000 15000
Central Bangalore
East Bangalore
North Bangalore
South Bangalore
West Bangalore
No. of units
City
Zones
Q1 2016 Q2 2016 Q3 2016 Q4 2016
East Bengaluru accounted for 33 percent of new launch
supply in 2016, followed by South and North Bengaluru,
30 and 24 percent respectively.
East Bengaluru is one of the prominent zones of the
Bengaluru city. The zone has witnessed the whopping
decline of 55 percent in new launch supply in 2016 over
2015. Well established offices spaces in Whitefield and
commercial developments along Marathahalli - Sarjapur
Road stretch have made this zone one of the most sought
after in the city and attracted lot of developers for their
portfolio expansion. Micro Market such as Whitefield,
Varthur and Sarjapur road are persistently witnessing new
launch supply due to their proximity to the commercial
hub of the city and improved physical and social
infrastructure.
South Bengaluru recorded the decline of 40 percent in new launch supply compared to previous year. The peripheral
boundaries of the zone are slowly gaining the momentum in new launch supply from past couple of years Micro markets
such as Chandapura Anekal Road, Jigani, Attibele and Chandapura have witnessed the launch of nearly 25 percent of
dwelling units out of total supply launched in the South Bengaluru in 2016. Commercial office spaces in Electronic city
and commercial corridor along with the Bannerghatta Road and Hosur Road have derived the realty sentiments in the
zone and boosted the real estate activity in and around the South Bengaluru.
North Bengaluru is one of the most sought after zone of the Bengaluru city because of the presence of Kempegowda
International Airport in the vicinity and the upcoming Bagalur Tech Park. The zone has witnessed a decline of nearly 23
percent in new launch supply compared to previous year because of the high number of unsold inventory in the primary
market.
The North Zone of Bengaluru has been witnessing traction from the developer from 2012 onwards and has completely
transformed the realty landscape, nearly 67,753 dwelling units has been infused in the North Bengaluru, since then. Micro
Markets such as Hebbal, Thanisandra Main Road, Hennur Main Road, Yelahanka, and Jakkur are the key micro market of
this zone and hold strong future growth potential because of the availability of ample land bank, proximity to Manyata
Tech Park and easy accessibility and connectivity to Kempegowda International Airport.Continued..

INDIA RESIDENTIAL REAL ESTATE I RESEARCH
T O P M I C R O M A R K E T S O F 2 0 1 6 - B A S E D O N N E W L A U N C H S U P P L Y
0 1000 2000 3000 4000
Sarjapur Road
Kengeri
Chandapura Anekal Road
Panathur
Devanahalli
Kanakapura Road
No. of Units
Mic
ro M
arke
ts
Located in south east Bengaluru, Sarjapur Road has
emerged as one of the most prominent residential
destination in the city over the last decade. The
micro market has witnessed the launch of 3,611
dwelling units in the year 2016. The locality is
strategically located between two major IT hotspots
of the city – Outer Ring Road (ORR) on one side
and Electronic City on the other. The micro market
has witnessed the launch of 13 projects in the year
2016. Additionally, the 16 km stretch offers excellent
property options for all segments of home buyers.
Kengeri and Chandapura Road are the emerging
micro market in the city. Both the micro markets
offer affordable property options and hold strong
future growth potential.
Devanahalli, Kanakapura Road and Panathur are the fastest developing micro market in the city, The IT/ITeS services in the
region has derived the realty sentiments in these micro markets and has boosted real estate development. Devanahalli and
Panathur holds strong growth potential due to ample availability of land bank and proximity to the key commercial hub,
while Kanakapura Road has witnessed a positive traction from the developers for the last couple of years and has a
presence of improved physical and social infrastructure, making it more viable for the end use purpose.
The western quadrant of the city has witnessed an upsurge in new launch supply, an approximate 31 percent increase is
recorded in 2016 compared to the previous year. The zone is slowly gaining momentum and transforming it into a
residential market from the industrial area status.
Central Bengaluru, the high end residential market of the city has witnessed a limited number of residential supply in
2016 due to unavailability of land bank.
B U D G E T W I S E S P L I T O F N E W L A U N C H E S
0 5000 10000 15000
CentralBangalore
EastBangalore
NorthBangalore
SouthBangalore
WestBangalore
No. of Units
City
Zones
0 - 30 Lacs 30 - 60 Lacs 60 Lacs - 1 Crore
1 Crore - 2 Crore Above 2 Crore
The southern and the eastern zones of the city have
witnessed a maximum number of launches under the
budget of 30 - 60 Lacs in 2016, accounting for 36
percent and 32 percent, respectively.
North Bengaluru has witnessed maximum number of
launches under the budget range of 60 Lacs - 1
crore, with approximately 40 percent out of total
supply of 60 Lacs - 1 crore budget properties,
followed by East and South Bengaluru, at 30 and 15
percent, respectively.
East Bengaluru has witnessed most of the launches in
the luxury segment properties. Out of the overall
supply of 1 crore – 2 crore ticket price properties,
nearly 87 percent have been launched in the eastern
quadrant of the city.

INDIA RESIDENTIAL REAL ESTATE I RESEARCH
S P L I T O F U N D E R - C O N S T R U C T I O N I N V E N T O R I E S – Z O N E W I S E
S P L I T O F U N S O L D I N V E N T O R I E S – Z O N E W I S E
East Bengaluru accounts for the major share of the
total number of under construction dwelling units, to
the tune of 35 percent, given the fact that the region
has been continuously witnessing launches of
residential projects from Category A developers in
the past years. The region is preferred by potential
home buyers due to the presence of commercial
hubs and its improved social and physical
infrastructure. Additionally, the region is easily
accessible from the city center and has excellent
property options for the all segments of home
buyers.
The Southern and Northern markets contributes 32
and 25 percent of the supply of under construction
dwelling units, while West Bengaluru is yet to catch
up on the residential market scene.
East Bengaluru accounts for the major share of the
total number of unsold inventory in the city, nearly
36 percent, followed by South and North Bengaluru
at 33 and 22 percent, respectively.
High property prices, delay in execution and
negative market sentiments were the major reasons
behind the doldrums and pilled up inventory.
However, the initiatives announced by the
government, to make real estate more transparent
and viable will bring back the consumer confidence
towards the real estate market and solve the
problem of huge unsold stocks.

INDIA RESIDENTIAL REAL ESTATE I RESEARCH
Area/Locality
Price Q4 2016
Rate Per Sqft
(INR)
% Change
(Q3 vs.
Q4)
1BHK Rental Range
(INR)
2 BHK Rental
Range (INR)
3 BHK Rental
Range (INR)
HSR Layout 3,650-5,732 -0.10 9,500-15,750 11,500-18,800 16,200-31,500
Bannerghatta 3,594-4,700 -0.08 7,500-12,500 11,800-19,000 14,500-32,000
Hebbal 3,788-6,124 -0.75 7,500-15,000 12,000-25,000 20,000-40,000
Indira Nagar 9,710-12,083 0.36 11,500-19,000 15,000-27,777 21,000-45,000
Jayanagar 7,504-10,338 1.65 10,000-17,500 13,500-26,700 16,300-40,000
Koramangala 7,370-9,350 0.56 11,500-13,700 12,000-26,000 15,000-39,000
Marathahalli 4,066-5,342 1.73 11,200-14,000 12,000-22,000 14,600-30,000
Sarjapur Road 3,530-5,800 -1.00 10,000-14,500 11,000-20,000 16,500-29,200
Whitefield 3,748-6,204 0.00 9,900-14,000 12,400-26,000 15,300-32,100
Yelahanka 3,824-5,657 5.70 7,500-11,500 11,500-20,200 12,500-31,500
Electronic City 3,176-5,034 -5.15 9,200-16,000 11,000-26,000 15,500-30,000
Jakkur 3,969-6,100 0.57 7,800-12,000 10,500-24,000 14,000-25,000
Banaswadi 3,825-6,077 5.61 7,200-13,000 10,500-15,000 15,000-25,000
Domlur 4,566-8,192 -3.18 9,500-16,000 14,000-20,000 14,500-22,000
Project Name LocalityDeveloper
Name
Possession
Date
No. of Units
(Approx.)
Lump sum
Price (INR)BHK Type
BHK Sizes
(Sqft)
Assetz 63 Degree
East
Sarjapur
RoadAssetz Homes Dec-19 1608
40.93Lac to
41.26 Lac1,2
685 Sqft - 1157
Sqft
Bren Champion
Square
Sarjapur
Road
Bren
CorporationApr-18 401
35.11 Lac to
57.24 Lac1,2,3
733 Sqft - 1644
Sqft
Sobha Gateway Of
DreamsPanathur Sobha Limited Jun-19 1800
34.41 Lac to
64.05 Lac1,2
650 Sqft - 1210
Sqft
Sipani Royal
Heritage
Chandapura
Anekal Road
Sipani
Properties
Private
Limited
Dec-18 128414.37 Lac to
27.87 Lac1,2,3
575 Sqft - 1115
Sqft
Godrej EternityKanakapura
Road
Godrej
Properties
Limited
Dec-18 180044.04 Lac to
79.78 Lac2,3
1049 Sqft - 1900
Sqft
Salarpuria Sattva
Park CubixDevanahalli
Salarpuria
Sattva GroupJun-21 1620
26.93 Lac to
60.88 Lac1,2,3
657 Sqft - 1485
Sqft
Bhagini RJM
EnclaveKengeri
Bhagini
DevelopersDec-20 1150
56.04 Lac to
1.22 Crore2,3
927 Sqft - 2450
Sqft
T O P L A U N C H E S O F 2 0 1 6 - B A S E D O N N E W L A U N C H S U P P L Y
P R I C E M O V E M E N T A N D R E N T A L P R I C E S O F K E Y M I C R O M A R K E T S

INDIA RESIDENTIAL REAL ESTATE I RESEARCH
T O P L A U N C H E S O F 2 0 1 6 - B A S E D O N N E W L A U N C H S U P P L Y

INDIA RESIDENTIAL REAL ESTATE I RESEARCH
REGULATORY UPDATES
Bengaluru Development Authority (BDA) has reduced the property tax by 50 per cent for vacant sites while hiking
the tax for buildings. The revised property tax for BDA Layouts and BDA-approved Layouts has been fixed as
1/2000th of the Guidance Value for sites of higher dimensions and 1/4000th of the Guidance Value for sites of small
dimensions
Department of rural development and Panchayat raj (RDPR) has passed an order that handwritten khatas are illegal
as touts and agents have been forging the property documents and using handwritten khatas to get legal sanctity for
their transactions
INFRASTRUCTURE UPDATES
Feasibility study for running high-speed trains in the southern corridor of Chennai-Bengaluru-Mysore has been taken
up by Germany. Discussions were made on various issues involving running high-speed train, raising speed on the
existing track to 200kmph and redevelopment of stations
The Bengaluru Metro Rail Corporation Ltd (BMRCL) has plans on linking the city with the Kempegowda International
Airport by extending the Phase II Metro line from Nagawara all the way to the airport
MAJOR DEALS
RMZ Corp has acquired Bengaluru’s Shangri-La hotel for over $100 million (Rs 700 crore) to build an additional 2.5
million sqft office space in the city's IT suburbs at Ecoworld business park on Outer Ring Road
Indiabulls has loaned Rs.800 crore to Embassy Group to help the southern property developer acquire the listed Mac
Charles, which owned the Le Meridien hotel
R E A LT Y N E W S

INDIA RESIDENTIAL REAL ESTATE I RESEARCH

INDIA RESIDENTIAL REAL ESTATE I RESEARCH
POPULATION
CITY
OVERVIEW
58332 km2 46.07 Million
AREA
ABOUT CITY
India's largest agglomeration and one of the world's largest
agglomerations
POPULATION GROWTH RATE
20.96 % 8.40 %
ECONOMIC GROWTH RATE
*As of year 2008
RESIDENTIAL MARKET GROWTH DRIVERS
Gurgaon- Cyber City, Golf Course Road, Sohna Road, UdyogVihar Ph- 1,2,3,4,5
Noida- Sector-18, Sector-63, Sector-62 Delhi- Connaught PLace, Bhikaji Cama PLace, Nehru PLace,
Netaji Subash PLace Ghaziabad- Sahibabad Industrial Area, kaushambi
INFRASTRUCTURE
Existing: NH-8, Rapid Metro, Delhi Metro
Upcoming: Delhi-Mumbai Industrial Corridor Project (DMIC), Faridabad-Noida-Ghaziabad Corridor (FNG)
RESIDENTIAL UNITS LAUNCHED
36,997 units
PREDOMINANT BUDGET RANGE
30 Lac - 60 Lac
*Constitutes 43% of total Supply
HIGHEST NUMBER OF LAUNCHES
Greater Noida(9,921 units)
% CHANGE IN PRICE 2015 vs 2016
% CHANGE IN NEW LAUNCH SUPPLY – 2015 vs 2016
61%
UNSOLD STOCK
2,26,981 units
CITY INVENTORY OVERHANG
UNDER CONSTRUCTION
UNITS
4,91,712 units
*As per Census 2011
Icons Source: Flaticon
70 Months
0.38%

INDIA RESIDENTIAL REAL ESTATE I RESEARCH
N E W L A U N C H S U P P L Y T R E N D - 2 0 1 5 V S 2 0 1 6
Predominantly an investor-driven market, NCR is
losing its shine in new launch supply, an approximate
61 percent decline in new launch supply was
recorded in 2016 compared to supply of 2015. This
is the lowest number of launches happened in NCR
from last 7 years, the reason, clearly identified as the
huge piled up unsold inventory in the region,
execution delays in a micro markets of Greater
Noida, Noida and Gurgaon along with high property
prices and litigation issues in the sectors of Dwarka
expressway.
Moreover, potential buyers and investors are also
holding their purchase decision and opting the wait
and watch approach, while developers are struggling
to deliver the project in the cash crunch market.
Third quarter of 2016 witnessed the lowest number of new launch supply in 2016, nearly 76 percent decline recorded in
new launch supply compared to same quarter previous year. On the contrary, Q4 2016 recorded an increase of 34
percent in new launch supply over Q3 2016, despite of demonetization and sluggish market condition.
Z O N E W I S E S P L I T O F R E S I D E N T I A L L A U N C H E S
0 2000 4000 6000 8000 10000 12000
Delhi
Dharuhera
Faridabad
Ghaziabad
Greater Noida
Gurgaon
Noida
No. of Units
Citie
s
Q1 2016 Q2 2016 Q3 2016 Q4 2016
Greater Noida is the major contributor in the
new launch supply in the National Capital
Region in the year 2016. The city has
witnessed launch of nearly 27 percent
dwelling units out of total supply i.e. 36,997
units, followed by Gurgaon, Ghaziabad and
Noida, at 25, 20 and 16 percent, respectively.
Meanwhile, Delhi, Faridabad and Dharuhera
witnessed limited supply in the year 2016.
Ghaziabad, the end user driven market of
NCR has recorded a supply of 35 percent in
Q4 2016, highest among all cities of NCR,
followed by Greater Noida and Noida, at 23
and 16 percent, respectively.
On the other hand, Gurgaon, the most active
market of NCR in the large scale residential
development has witnessed a plummeting
supply trend in Q4 2016 and has recorded a
whopping decline of nearly 61 percent in new
launch supply compared to the previous
quarter of the same year.
Moreover, Gurgaon residential market is
going through a tough time in this sluggish
market condition, where investors are taking
an exit mode, while end users are preferring
to buy ready to move in properties.

INDIA RESIDENTIAL REAL ESTATE I RESEARCH
T O P M I C R O M A R K E T S O F 2 0 1 6 - B A S E D O N N E W L A U N C H S U P P L Y
0 500 1000 1500 2000 2500 3000
Yamuna Expressway
Sector 76 - Noida
Sector 144 - Noida
L Zone
Knowledge Park-5
No. of Units
Mic
ro M
arke
ts
Yamuna Expressway in Greater Noida has witnessed
the launch of 2,421 dwelling units supply in 2016,
highest among all micro markets of NCR. The stretch is
witnessing the rapid real estate development and has
attracted several property developers and investors to
bring new setups in commercial, residential, industrial
and institutional sectors. Being developed by Yamuna
Expressway Industrial Development Authority the
locality holds strong growth potential due to the large-
scale residential development, fast connectivity and
upcoming world-class projects in the micro market.
With the launch of Amrapali Adarsh Awas Yojna a large
scale residential development project consisting 2,000
units, Sector 76 Noida holds the second position
among the top localities in 2016, based on the units
launched. The Micro market has been already house of
several big ticket size projects such as Supertech Cape
town and Prateek Wisteria.
L Zone located in the South West of Delhi is persistently witnessing the developer focus, the micro market has
witnessed the launch of nearly 20,000 dwelling units in last 4 years. Under the jurisdiction of Delhi Development
Authority, the micro market is considered as the largest zone of Delhi with 22,840 hectares.
B U D G E T W I S E S P L I T O F N E W L A U N C H E S
0 5000 10000 15000
Delhi
Dharuhera
Faridabad
Ghaziabad
Greater Noida
Gurgaon
Noida
No. of Units
Citie
s
0 - 30 Lacs 30 - 60 Lacs 60 Lacs - 1 Crore
1 Crore - 2 Crore Above 2 Crore
The residential market of NCR has witnessed
maximum launches in affordable and mid segment of
properties. Out of total new launch supply in 2016, an
approximate 43 percent unit launched under the
budget range of 30 - 60 Lacs, followed by below 30
Lacs and 60 Lacs - 1 crore budget properties, at 29
and 16 percent, respectively. Surprisingly, out of overall
supply in 2016, nearly 88 percent unit launched under
the ticket price of 1 crore, which clearly indicates that
developers in NCR are catering the demand of those
home buyers who are looking property under the
affordable and mid segment category.
Greater Noida is the hub of mid segment budget
properties, an approximate 42 percent unit launched
in the city under the budget range of 30 Lacs - 60
Lacs. Additionally, out of total new launch supply in
Greater Noida, nearly 89 percent dwelling units falls
under the budget of below 60 Lacs. The residential
market of Greater Noida is slowly gaining the
momentum backed by improved social and physical
infrastructure.
In line with the trend of other metro cities, Gurgaon
has witnessed the launch of 31 percent dwelling units
under the budget of 30 Lacs, followed by Ghaziabad
and Greater Noida.

INDIA RESIDENTIAL REAL ESTATE I RESEARCH
S P L I T O F U N D E R - C O N S T R U C T I O N I N V E N T O R I E S – Z O N E W I S E
S P L I T O F U N S O L D I N V E N T O R I E S – Z O N E W I S E
The major chunk of the under construction dwelling unit is lying in the micro-markets of Greater Noida, Gurgaon,
Ghaziabad and Noida. Out of the overall supply of under construction dwelling units, an approximate 83 percent falls
under the micro markets of these regions. Greater Noida accounts for 36 percent of under construction dwelling units,
highest among of all cities of NCR, followed by Gurgaon, Ghaziabad and Noida at 21,13 and 12 percent, respectively.
The execution delays in the major micro market of Greater Noida (Noida Extension) and Gurgaon (Dwarka Expressway)
due to litigation, were the major reasons behind this turmoil and increasing under construction units.
With nearly 2.26 Lac unsold inventory in the region, NCR is leading the pack. The residential market of NCR is at its all
time low with the decline in new launch supply trend and plummeting sales velocity. In order to liquidate the current flow
of unsold inventory, it will take almost 70 odd months.
In NCR, Greater Noida hold the highest sum of unsold inventory at 33 percent, followed by Gurgaon, Ghaziabad and
Noida at 19,18 and 13 percent, respectively. Yamuna Expressway and Noida Extension are the biggest contributors in
unsold supply in the Greater Noida City, an approximate 44 percent of unsold stock lies in these 2 micro markets, out of
total unsold stock in the city. The sum of unsold inventory in NCR region is directly related to the sum of under
construction supply in these cities, the highest the under construction supply, higher the unsold units, vice -versa.

INDIA RESIDENTIAL REAL ESTATE I RESEARCH
T O P L A U N C H E S O F 2 0 1 6 - B A S E D O N N E W L A U N C H S U P P L Y
P R I C E M O V E M E N T A N D R E N T A L P R I C E S O F K E Y M I C R O M A R K E T S
CityProject
NameLocality
Developer
Name
Possessio
n Date
No. of Units
(Approx.)
Lump sum
Price (INR)
BHK
Type
BHK Sizes
(Sqft)
DelhiJay Kay
GreensL Zone Jaykay Buildtech May-19 350
35.93 Lac to
1.08 Crore2,3,4
980 Sqft - 2950
Sqft
Ghaziabad
UPAVP
Gulmohar
Enclave
Tronica City UPAVP Dec-20 195111.40 Lac to
18.80 Lac1,2
366 Sqft - 603
Sqft
Greater NoidaLe Solitairian
Estate
Yamuna
Expressway
Le Solitairian
GroupMay-19 1900
22.44 Lac to
47.73 Lac1,2,3
670 Sqft - 1425
Sqft
Greater NoidaAarcity
Foreste
Knowledge
Park-5
Aarcity
Infrastructure
Pvt Ltd.
Dec-19 167722.75 Lac. to
61.59 Lac2,3,3.5
875 Sqft - 2360
Sqft
Noida
Amrapali
Adarsh Awas
Yojna
Sector 76 Amrapali Group Feb-21 200035.09 Lac to
71.34 Lac2,3,4
1070 Sqft -
2175 Sqft
NoidaShantiniketan
PrakritiSector 144
Shantiniketan
Buildcon Pvt.
Ltd
Sep-19 108848.30 Lac to
1.49 Crore2,3,4
1150 Sqft -
3550 Sqft
City Area/Locality
Price Q4 2016
Rate Per Sqft
(INR)
%
Change
(Q3 vs.
Q4)
1BHK Rental
Range (INR)
2 BHK Rental
Range (INR)
3 BHK Rental
Range (INR)
Faridabad Sector-86 2,906-4,421 1.48 3,500-8,000 8,500-11,000 9,000-16,500
Faridabad Sector-88 2,906-4,005 2.96 4,000-5,000 8,000-12,500 12,000-14,000
Faridabad Sector-82 3,445-4,439 2.47 3,500-4,000 9,800-16,000 10,500-21,500
Ghaziabad Raj Nagar Extension 2,401-3,079 -0.90 4,000-7,000 6,000-9,000 7,500-10,000
Ghaziabad Crossing Republik 2,925-3,344 -1.00 4,500-5,500 8,000-16,000 9,000-19,000
Ghaziabad Indirapuram 4,168-5,248 0.29 9,500-12,500 11,000-18,000 15,000-28,000
Ghaziabad Vasundhara 3,844-5,042 -0.24 9,000-12,500 11,000-18,000 9,000-21,000
Ghaziabad Vaishali 4,983-6,004 0.15 9,000-12,000 12,500-19,000 13,500-22,000
Greater Noida Noida Extension 2,803-4,103 4.70 3,000-6,000 5,000-10,000 8,000-12,000
Greater Noida Tech Zone IV 3,022-3,432 -1.06 5,500-9,000 8,000-10,000 10,000-14,000
Gurgaon Sector-54 11,255-14,437 -1.76 15,000-18,000 22,000-40,000 35,000-85,000
Gurgaon Sector-50 6,814-9,267 -1.09 12,000-15,000 23,000-32,000 30,000-40,000
Gurgaon Sector-25 9,064-14,240 -2.82 12,000-15,000 30,000-45,000 36,000-55,000
Gurgaon Sector-86 3,631-5,299 0.60 6,000-7,000 8,100-12,500 10,000-14,000
Gurgaon Sushant Lok I 7,445-10,513 -2.50 10,000-13,000 18,000-40,000 28,000-60,000
Gurgaon Golf Course Road 9,244-14,700 -2.38 15,000-18,000 22,000-40,000 35,000-85,000
Gurgaon Sohna Road 5,938-9,523 -1.31 7,000-15,000 18,000-28,000 25,000-48,000
Noida Sector-119 4,036-5,604 1.78 7,500-10,000 10,000-16,500 11,000-25,000
Noida Sector-129 3,895-5,409 0.48 7,500-15,000 11,000-16,000 13,200-18,000
Noida Sector-76 4,390-5,942 6.05 7,500-13,000 11,500-16,000 13,500-17,500
Noida Sector-50 5,526-8,662 -0.13 7,500-12,000 15,000-20,000 18,000-35,000

INDIA RESIDENTIAL REAL ESTATE I RESEARCH
M A P O F N C R

INDIA RESIDENTIAL REAL ESTATE I RESEARCH
REGULATORY UPDATES
Construction sites above 20,000 square metres will be fined Rs 5 Lac for causing dust pollution and flouting
environmental norms. Similarly, buildings of plot size 200 to 500 sq.m will pay Rs 30,000 while sites of 500 to 20,000
sq.m will pay Rs 50,000 as environmental compensation
CREDAI- NCR has started encouraging builders to adapt green building norms, especially norms pertaining to the
inclusion of the differently-abled. Upon adhering to the norms, the builders automatically get benefit of increased
floor area ratio (FAR)
INFRASTRUCTURE UPDATES
The 600m bridge which was proposed to link Noida’s Sector 150 with Faridabad’s Tilori village, will be completely
funded by the Noida Authority and the second proposed bridge between the FNG expressway from Noida’s Sector
168 with Faridabad in Haryana will be constructed by the NHAI
Delhi Development Authority (DDA) has formed a Special Purpose Vehicle for the maintenance and development of
green zones at par with international parks like London's Hyde Park, NewYork's Central park
MAJOR DEALS
Gurgaon-based real estate developer M3M India has raised Rs 1,250 crore from Indiabulls Housing Finance through a
structured debt transaction
Realty developer Lodha Group has raised single largest debt transaction of Rs 2,320 crore from Piramal Fund
Management, the realty investment arm of Piramal Enterprises, for a portfolio of projects in south and central Mumbai
includingThe World Towers
R E A LT Y N E W S

INDIA RESIDENTIAL REAL ESTATE I RESEARCH

INDIA RESIDENTIAL REAL ESTATE I RESEARCH
POPULATION
CITY
OVERVIEW
603 km2 12.47 Million
AREA
ABOUT CITY
A Metropolitan area in Maharashtra state, consisting of the state
capital Mumbai and its satellite towns.
POPULATION GROWTH RATE
3.87 % 8.50 %
ECONOMIC GROWTH RATE
*As of year 2008
RESIDENTIAL MARKET GROWTH DRIVERS
Central Mumbai: Dadar, Lower Parel, Parel, Prabhadevi, Wadala,Worli
Mumbai West: Andheri MIDC South Mumbai: Nariman Point, Bandra Kurla Complex Navi Mumbai: CBD Belapur, Taloja MIDC, Mindspace (Airoli) Thane: Waghle Industrial Estate, Ghodbunder Road
INFRASTRUCTURE
Existing: Bandra-Worli Sea Link (BWSL), Eastern Express Highway,Mumbai Eastern Freeway, Santacruz – Chembur Link Road (SCLR),Sahar Elevated Road, Western Express Highway, Monorail
Upcoming: Mumbai Trans Harbour Link, Navi Mumbai InternationalAirport, Mumbai Metro Phase-2)
RESIDENTIAL UNITS LAUNCHED
62,271 units
PREDOMINANT BUDGET RANGE
0 Lac - 30 Lac
*Constitutes 31% of total Supply
HIGHEST NUMBER OF LAUNCHES
Mumbai Beyond
Thane (24,882 units)
% CHANGE IN PRICE 2015 vs 2016
% CHANGE IN NEW LAUNCH SUPPLY – 2015 vs 2016
30%
UNSOLD STOCK
1,87,198 units
CITY INVENTORY OVERHANG
UNDER CONSTRUCTION
UNITS
3,62,776 units
*As per Census 2011
Icons Source: Flaticon
60 Months
20%

INDIA RESIDENTIAL REAL ESTATE I RESEARCH
Z O N E W I S E S P L I T O F R E S I D E N T I A L L A U N C H E S
N E W L A U N C H S U P P L Y T R E N D - 2 0 1 5 V S 2 0 1 6
The premium residential market of the country
witnessed a serious setback, with high unsold
inventory, skyrocketing prices, lower sales velocity
and shrinking new launch supply. The residential
market of MMR has recorded a decline of nearly 30
percent in new launch supply compared to the
preceding year 2015.
The demonetization drive has severely impacted
the residential market of MMR. Q4 2016 witnessed
a whopping decline of 73 percent in new launch
supply, compared to the previous year same period
and 53 percent decline over Q3-2016. The sales
velocity in the region has also been badly impacted
post demonetization, as the cash component in
most of the transaction remains high. Additionally,
investors have taken the back seat and opted the
wait and watch approach, while end users are
holding their purchase decision for price
correction in the coming time frame.
0 5000 10000 15000 20000 25000 30000
Mumbai Beyond Thane
Mumbai Western Suburbs
Mumbai Central Suburbs
Mumbai Harbour
Mumbai South
Mumbai Mira Road & Beyond
Mumbai Others
NaviMumbai
Thane
No. of Units
City
Zones
Q1 2016 Q2 2016 Q3 2016 Q4 2016
The Mumbai Beyond Thane zone emerged as the largest market, with 40 percent of all new launches in 2016, followed by
Thane and Navi Mumbai city, at 22 and 13 percent respectively. The premium residential zones of MMR, such as Mumbai
South, Mumbai Central Suburbs and Mumbai Harbour have recorded a limited new launch supply in 2016.
Mumbai Beyond Thane is most sought after zone of the region and holds strong growth potential. From 2013 onwards,
the zone has recorded a supply of around 1.03 Lac dwelling units and is coined as one of the most active zone in terms of
new launch supply. Because of its improved connectivity to the city center and affordability, most of the top category
developers have launched large scale residential projects in the vicinity. Moreover, limited availability of land bank within
the city center has shifted the developer interest to these peripheral locations of the city, making them most preferred
for large scale residential development. Localities such as Dombivli, Badlapur, Kalyan, Bhiwandi and Karjat are persistently
getting traction from the developers.

INDIA RESIDENTIAL REAL ESTATE I RESEARCH
B U D G E T W I S E S P L I T O F N E W L A U N C H E S
T O P M I C R O M A R K E T S O F 2 0 1 6 - B A S E D O N N E W L A U N C H S U P P L Y
0 1000 2000 3000 4000 5000
Dombivli East
Neral
Kharghar
BadlapurWest
Karjat
GhodbunderRoad
No. of units
Mic
ro M
arke
ts
Dombivli East, Neral, Badlapur West and Karjat
altogether have recorded a supply of 14,313 dwelling
units. All the mentioned micro markets falls under
Mumbai Beyond Thane zone and offer excellent
affordable property options. Dombivli has an added
advantage of close proximity to the satellite cities of
Mumbai, the micro market shares excellent
connectivity to the commercial hub of the Navi
Mumbai and Thane city. Moreover, the micro market is
already witnessing capital value appreciation and a rise
in rental demand.
Ghodbunder Road emerged as the favored destination
in the Thane city. The stretch provides excellent
connectivity and quick accessibility to Mira Road from
Thane, and to other micro markets such as Mulund,
Bhandup and Ghatkopar. The road is witnessing rapid
development, and has attracted several developers for
their portfolio expansion, along with several initiatives
by MMRDA to improve the connectivity. The micro
market is on the verge of becoming a realty hotspot in
the city.
0 5000 10000 15000 20000 25000 30000
Mumbai Beyond Thane
Mumbai Central Suburbs
Mumbai Harbour
Mumbai Mira Road & Beyond
Mumbai Others
Mumbai South
Mumbai Western Suburbs
Navi Mumbai
Thane
No. of Units
City
Zones
0 - 30 Lacs 30 - 60 Lacs 60 Lacs - 1 Crore 1 Crore - 2 Crore Above 2 Crore
Affordability is the new mantra in MMR for the developers to cater the residential demand of end users. Out of the total
supply in 2016, nearly 31 percent units were launched in below 30 Lacs ticket price properties, followed by 30 Lacs - 60
Lacs, 1 crore - 2 crore and 60 Lacs - 1 crore budget properties, at 26,17 and 15 percent, respectively. Interestingly, the
premium residential market of the country has witnessed 72 percent units launched under the ticket price of 1 crore. The
new launch supply trend clearly connotes that developers in MMR have started tapping the market sentiments and infusing
more supply in affordable and mid segment of properties. Mumbai beyond Thane zone is the biggest contributor in low
ticket price supply. Out of the total units launched under the ticket price of 30 Lacs, Mumbai Beyond Thane zone
contributes an approximate 84 percent units alone.
MMR has witnessed nearly 6,976 dwelling units launched under the premium categories, i.e. properties above the 2 crore
ticket price. Out of overall supply of 2 crore and above ticket price properties, nearly 38 percent units were launched in
Mumbai Western Suburbs followed by Mumbai Central (20 %), Mumbai Harbour (18%) and Mumbai South (18%). Mumbai
South, Mumbai Harbour and Mumbai Central, the relatively premium markets of the MMR, have witnessed a sharp decline
in new launches in 2016.

INDIA RESIDENTIAL REAL ESTATE I RESEARCH
S P L I T O F U N D E R - C O N S T R U C T I O N I N V E N T O R I E S – Z O N E W I S E
The Mumbai Beyond Thane zone, contributing 24 percent of over all supply of under construction unit in 2016, is the
largest residential market in the MMR in terms of the quantum of under-construction dwelling units. Relatively affordable
property prices and improved connectivity to commercial hubs in Mumbai make this zone an attractive choice for home
buyers.
The residential micro markets of Navi Mumbai and Thane holds the second and third position in terms of under
construction dwelling units, at 18 and 15 percent respectively. The micro markets in these cities relatively offers lower
prices besides good connectivity to the commercial hub of the Western Suburbs, Central Mumbai and South Mumbai.
The Western Suburb ranks fourth in terms of under construction dwelling units, at 14 percent. Andheri, Borivali,
Goregaon and Dahisar are the major micro markets in this zone and have witnessed decent supply of residential units in
past years.Altogether, the zone has around 49,205 units under construction supply at the different stages of construction.
Navi Mumbai has witnessed launch of around 7,799 dwelling units in 2016. An approximate 48 percent unit in the city
have been launched under the budget range of 1 crore - 2 crore which indicates that the city is slowly gaining the
moment in luxury segment supply. Kharghar has witnessed launch of nearly 3,621 dwelling units in this segment. Based on
the new launch supply, the second most happening segment in the city is the mid segment, nearly 30 percent unit
launched under the budget range of 30 Lacs - 60 Lacs, followed by properties below 30 Lac ticket price , which accounts
for 17 percent of total supply of 2016. Micro market such as Dronagiri, Khalapur, Panvel and Taloja have witnessed
launches under the budget of 60 Lacs ticket size properties.
Thane city, predominantly known as an industrial estate, has transformed itself in to an upscale residential destination.
IT/ITeS services in the region and improved rail-road connectivity have derived the realty sentiments in the city and
boosted the real estate activity. In 2016, the city has recorded launch of around 13,765 dwelling units. An approximate 34
percent new supply launch in the budget range of 30 Lacs - 60 Lacs, followed by 60 Lacs - 1 crore and 1 crore - 2 crore
ticket price properties, at 29 and 27 percent, respectively.

INDIA RESIDENTIAL REAL ESTATE I RESEARCH
S P L I T O F U N S O L D I N V E N T O R I E S – Z O N E W I S E
The Mumbai Metropolitan Region (MMR) has an approximate 1.87 Lac unsold inventory available in the primary market.
The MMR region has the second highest unsold inventory among all top cities, followed by the National Capital Region,
which will take an approximate 5 years to offload.
Unsold inventories, high property prices, low sales velocity and Lack of transparency in real estate sector has created this
doldrums, with the market reaching the stagnant position, and for developers it is getting hard to offload their current
pilled up stock. Moreover, the property developers are focusing on clearing existing unsold stock, instead of infusing new
supply in the market.

INDIA RESIDENTIAL REAL ESTATE I RESEARCH
T O P L A U N C H E S O F 2 0 1 6 - B A S E D O N N E W L A U N C H S U P P L Y
P R I C E M O V E M E N T A N D R E N T A L P R I C E S O F K E Y M I C R O M A R K E T S
CityProject
NameLocality
Developer
Name
Possession
Date
No. of Units
(Approx.)
Lump sum
Price (INR)BHK Type
BHK Sizes
(Sqft)
MumbaiLodha Palava
- Casa Bella
Dombivli
EastLodha Group Jan-19 2592
46.98 Lac to
89.64 Lac1,2,3
783 Sqft -
1494 Sqft
Mumbai KK Ashray NeralKK
DevelopersJan-19 1650
12.60 Lac to
24.64 Lac1,2
450 Sqft -
880 sqft
Mumbai Maple cityBadlapur
West
Abhishek
Shelters
Limited
Jan-19 350016.14 Lac to
22.73 Lac1
600 Sqft -
845 Sqft
MumbaiNK Neel
EmpireKarjat
NK
EnterprisesDec-19 2300
15.20 Lac to
34.80 Lac1,2
380 Sqft -
870 Sqft
Navi MumbaiSai World
EmpireKharghar
Paradise
GroupDec-18 1600
1 Crore to
2.52 Crore2,3,4
1240 Sqft -
3120 Sqft
ThaneGodrej
Emerald
Ghodbunder
Road
Godrej
Properties
Limited
Jun-19 140075 Lacs to
1.42 Crore1.5,2,3
500 Sqft -
950 Sqft
City Name Area/Locality
Price Q4 2016
Rate Per Sqft
(INR)
% Change
(Q3 vs.
Q4)
1BHK Rental
Range (INR)
2 BHK Rental
Range (INR)
3 BHK Rental
Range (INR)
Mumbai Badlapur East 2,984-3,010 1.03 2,000-6,000 4,000-8,000 6,000-15,000
Mumbai Andheri West 19,648-21,220 0.72 20,000-45,000 36,000-60,000 55,000-100,000
Mumbai Mira Road 5,938-8,859 4.92 9,250-15,000 10,000-25,500 13,000-30,000
Mumbai Borivali West 12,559-16,827 0.42 10,000-15,000 12,200-32,000 25,000-55,000
Mumbai Chembur 15,353-19,053 1.54 14,000-33,000 21,000-59,000 33,000-82,000
Mumbai Dombivli East 4,559-5,364 -5.34 8,200-12,000 12,000-30,000 25,000-95,000
Mumbai Powai 15,433-20,405 -2.07 25,000-35,000 36,000-50,000 52,000-100,000
Navi Mumbai Ulwe 5,059-5,605 -1.17 6,500-10,000 9,000-11,000 9,500-16,000
Navi Mumbai Panvel 4,977-6,327 3.42 8,500-13,000 9,500-20,500 11,000-22,000
Navi Mumbai Taloje 3,668-5,542 -3.03 4,000-6,000 7,500-10,000 8,000-12,000
Navi Mumbai Kharghar 6,488-10,056 2.74 9,500-13,000 11,800-28,000 13,000-37,000
Navi Mumbai Roadpali 5,616-7,546 1.98 6,500-8,500 8,500-14,000 11,000-25,000
Navi Mumbai Nerul 9,225-15,366 3.43 12,500-14,000 16,500-38,000 19,000-43,000
Navi Mumbai Airoli 8,187-12,820 3.00 11,000-16,000 17,000-32,000 20,000-38,000
Navi Mumbai Ulwe 5,059-7,105 2.56 8,000-10,000 8,500-11,000 9,000-14,000
Navi Mumbai Seawoods 8,554-13,361 0.08 11,500-16,000 21,000-44,000 26,000-50,000
Thane Ghodbunder Road 7,453-11,867 0.99 8,000-10,500 11,000-18,000 16,000-25,000
Thane Vartak Nagar 8,498-13,588 0.94 12,000-20,000 22,000-32,000 25,000-40,000
Thane Kasarvadavali 6,822-9,997 0.77 10,500-16,000 12,500-22,000 13,000-25,000
Thane Manpada 9,357-13,450 1.78 9,500-14,000 10,000-22,000 17,000-31,000
Thane Majiwada 9,808-13,887 1.38 14,000-18,000 15,000-24,000 21,000-38,000

INDIA RESIDENTIAL REAL ESTATE I RESEARCH
M A P O F M M R

INDIA RESIDENTIAL REAL ESTATE I RESEARCH
REGULATORY UPDATES
Brihanmumbai Municipal Corporation (BMC) proposed that builders must allocate 30% of every building's
recreational open spaces (ROS) on the ground in its natural state i.e. without pavements, to ensure rain water
percolation and maintenance of the ground water level
Maharashtra Urban Development Department (UDD) has directed Navi Mumbai Municipal Corporation (NMMC) to
ensure that 15% of the plot area meant for residences is kept for open recreational space for public use as per
Development Control Regulations of NMMC
INFRASTRUCTURE UPDATES
Construction of Metro line 2B (From DN Nagar to Mandala) and Metro line 4 (From Wadala to Kasarwadavli) have
been approved which would be operational (tentative) by 2021-22. Other Metro corridors that have been approved
for Mumbai include Dahisar to DN Nagar (Metro-2A), Colaba-Bandra-Seepz (Metro-3) and Dahisar-East to Andheri-
East (Metro-7)
Maharashtra government allowed the use of plastic waste, other than bLack plastic and PVC, in building asphalt roads,
thereby increasing their durability or longevity by three years
MAJOR DEALS
Ajay Piramal's Piramal Fund Management and Shapoorji Pallonji Real Estate Development will pump in about Rs 300
crore in a 1 million sq.ft residential projectTowers launched by Mumbai-based developer Ornate Spaces
Maharashtra government has signed a MoU with Korea Land & Housing Corporation (KLHC) of the Republic of
Korea to build a strategic partnership for smart cities, roads and bridges
R E A LT Y N E W S

INDIA RESIDENTIAL REAL ESTATE I RESEARCH

INDIA RESIDENTIAL REAL ESTATE I RESEARCH
POPULATION
CITY
OVERVIEW
479 km2 2.53 Million
AREA
ABOUT CITY
Third most populous city and fifth most populous urban
agglomeration in India
POPULATION GROWTH RATE
30.34% 7.40%
ECONOMIC GROWTH RATE
*As of year 2008
RESIDENTIAL MARKET GROWTH DRIVERS
Central Pune: Ashok Nagar, Prabhat Road, Shivaji Nagar,Deccan Gymkhana
East Pune: Hadapsar, Kharadi, Wagholi, Koregaon Park, KalyaniNagar
West Pune: Hinjewadi, Aundh, Wakad. North Pune: Talegaon MIDC, Charholi, Pimple Nilakh, Pimple
Saudagar South Pune: Vadgaon Budruk, Kondhwa, Bibvewadi.
INFRASTRUCTURE
Existing: University Flyovers -Pune, Pune Ring Road, Pune – Mumbaihighway (NH-4), Nashik Highway
Upcoming: Outer Ring Road (ORR), Bus Rapid Transit System (BRTS),PCMC Infrastructure
RESIDENTIAL UNITS LAUNCHED
40,420 units
PREDOMINANT BUDGET RANGE
30 Lac - 60 Lac
*Constitutes 49% of total Supply
HIGHEST NUMBER OF LAUNCHES
North Pune(15,247 units)
% CHANGE IN PRICE 2015 vs 2016
% CHANGE IN NEW LAUNCH SUPPLY – 2015 vs 2016
32%
UNSOLD STOCK
97,637 units
CITY INVENTORY OVERHANG
UNDER CONSTRUCTION
UNITS
1,83,540 units
*As per Census 2011
Icons Source: Flaticon
35 Months
2%

INDIA RESIDENTIAL REAL ESTATE I RESEARCH
Z O N E W I S E S P L I T O F R E S I D E N T I A L L A U N C H E S
N E W L A U N C H S U P P L Y T R E N D - 2 0 1 5 V S 2 0 1 6
The year 2016 has seen a downfall in the supply of new
residential launches in Pune by 32 percent when
compared to the previous year. Unlike the residential
supply in the preceding year, the third quarter of 2016 has
seen the highest number of new launches.
On QoQ basis, there has been a drop in the launches
observed in the Q1 (49 percent) and Q2 (33 percent) due
to the increased unsold inventory pressure on the
builders. While Q3 2016 witnessed positive launches
(16%) compared to the previous year attributing to the
developers making a comeback with revival in market
momentum, but the launches in forth quarter of 2016
again slumped by 42 percent.
North Pune has witnessed the highest number of
residential launches (38 percent) in 2016 while the eastern
part of Pune contributed the least number of launches(14
percent). West and South Pune stand in the mid-way with
27 percent and 21 percent of new residential unit launches.
Interestingly, North Pune is the only zone in the city which
has recorded an upsurge in residential properties during
the last quarter of the year in spite of the demonetization
effect. Micro markets such as Chikhali, Ravet and Dhanori
are in high demand among the home buyers.
Chikhali in the North zone stands ahead of the other
localities in Pune in terms of new launch supply. This
micro market turned into a premier residential area with
the advent of the IT/ITeS establishments and multi-
national companies in the proximity, well- laid
infrastructure with excellent connectivity. In addition to
the above, the reason behind high unit launches is that the
micro market is witnessing huge price appreciation in the
recent past.
Undri, Hinjewadi, Wagholi and Wakad are the other top
performing micro-markets in terms of new launch supply
due to the availability of affordable housing units, good
connectivity and employment generating centres.
0 5000 10000 15000 20000
NorthPune
WestPune
SouthPune
EastPune
No of Units
City
Zones
Q1 2016 Q2 2016 Q3 2016 Q4 2016
0 1000 2000 3000 4000
Chikhali
Undri
Hinjewadi
Wagholi
Wakad
No. of Units
Mic
ro M
arke
ts
T O P M I C R O M A R K E T S O F 2 0 1 6 - B A S E D O N N E W L A U N C H S U P P L Y

INDIA RESIDENTIAL REAL ESTATE I RESEARCH
B U D G E T W I S E S P L I T O F N E W L A U N C H E S
All the zones of Pune except Central Pune have good
number of under-construction housing units, because of
high demand for enormous number of housing units by
the students and private sector employees working in
these regions.
The central part of Pune has vey limited land availability
which restricted major residential development.
As expected, North Pune has the maximum unsold
inventory (34 percent) while West and South Pune each
contribute approx. 24% of unsold inventory in 2016.
Central Pune and East Pune have recorded minimal
unsold stock compared to other zones of the city due
to the reduced number of unit launches during the year.
0 5000 10000 15000 20000
East Pune
North Pune
South Pune
West Pune
No. of Units
City
Zones
0 - 30 Lacs 30 - 60 Lacs 60 Lacs - 1 Crore1 Crore - 2 Crore Above 2 Crore
An approximate 49 percent dwelling unit launched
under the budget range of 30 Lacs – 60 Lacs in the
residential market of Pune city, North Pune recorded
nearly 35 percent of dwelling supply under this
budget, followed by South and West Pune, at 26 and
23 percent, respectively.
The price brackets 0-30 Lacs and 30-60 Lacs are the
most preferred ones among the Punekars because of
IT/ITeS employees are in search of affordable housing
units which offer decent amenities rather than luxury
and ultra-luxury properties.
S P L I T O F U N D E R - C O N S T R U C T I O N I N V E N T O R I E S – Z O N E W I S E
S P L I T O F U N S O L D I N V E N T O R I E S – Z O N E W I S E

INDIA RESIDENTIAL REAL ESTATE I RESEARCH
T O P L A U N C H E S O F 2 0 1 6 - B A S E D O N N E W L A U N C H S U P P L Y
P R I C E M O V E M E N T A N D R E N T A L P R I C E S O F K E Y M I C R O M A R K E T S
Project Name Locality Developer NamePossession
Date
No. of Units
(Approx)
Lumpsum
Price (INR)BHK Type
BHK Sizes
(Sqft)
Aishwaryam Hamara Chikhali Essen Group Apr-19 200012.28 Lac to
28 Lacs1,2
351 Sqft -
800 Sqft
Kolte Patil R1 Life
RepublicHinjewadi
Kolte Patil
Developers LtdDec-19 1000
52 Lacs to 77
Lacs2,3
1030 Sqft -
1545 Sqft
Pristine Prolife Phase III Wakad Pristine Builders Dec-18 28261.88 Lac to
69.80 Lac2
935 Sqft -
1069 Sqft
Dynamic Grandeur UndriDynamic Realty
VenturesMay-19 1200
32 Lacs to
69.29 Lac1,2,3
697 Sqft -
1550 Sqft
Gagan Adira WagholiGagan
ConstructionDec-19 345
48.67 Lac to
91.69 Lac2,3
930 Sqft -
2090 Sqft
Area/LocalityPrice Q4 2016
Rate Per Sqft (INR)
% Change
(Q3 vs. Q4)
1BHK Rental Range
(INR)
2 BHK Rental Range
(INR)
3 BHK Rental Range
(INR)
Wagholi 3,520-4,121 0.28 8,500-14,500 11,000-20,000 12,500-21,000
Wakad 5,123-5,574 0.17 7,500-14,000 12,000-22,000 15,000-32,000
Baner 5,667-7,092 1.33 10,500-15,500 12,700-25,000 14,999-30,000
Kharadi 4,732-5,720 -0.69 8,000-13,800 11,250-21,000 17,000-31,800
Undri 3,797-4,025 0.41 7,800-10,000 10,000-14,000 14,000-22,000
Hadapsar 4,544-5,932 3.45 10,000-15,000 16,000-25,000 15,000-30,000
Talegaon 3,127-4,651 0.49 4,000-8,000 6,500-10,000 9,000-12,000
Moshi 3,506-4,839 1.46 6,000-8,500 8,000-13,000 11,000-18,000
Hinjewadi 4,786-5,321 1.95 10,500-15,000 16,000-25,000 22,500-35,000
Kondhwa 4,162-5,371 -3.43 10,000-12,000 15,000-22,000 20,000-25,000
Chakan 2,843-4,093 2.41 8,000-11,000 9,000-12,000 12,000-15,000
Ravet 4,614-6,612 2.96 9,500-11,000 12,000-16,000 15,000-19,000
Dhanori 4,099-6,312 3.39 9,500-12,000 11,000-16,000 15,000-20,000
Lohegaon 3,937-5,489 3.49 8,000-10,000 11,500-15,000 15,000-18,000

INDIA RESIDENTIAL REAL ESTATE I RESEARCH
M A P O F P U N E

INDIA RESIDENTIAL REAL ESTATE I RESEARCH
REGULATORY UPDATES
Rain water harvesting has been made compulsory in Pimpri Chinchwad for all new residential and commercial
buildings with an area of 20,000 sq. m. and a rebate is given in property tax to housing societies where rain water
harvesting is being implemented
Builders of Pune who do not replant the trees they cut during their previous projects will find it hard to get projects
cleared in the future by Pune Municipal Corporation (PMC)
INFRASTRUCTURE UPDATES
A new Greenfield international airport is proposed to come up at Purandar Taluk, which will be spread over 2400
hectares, and the new airport would be named as Chhatrapati Sambhaji Raje International Airport
Pune railway station and adjoining areas are being re-developed by enhancing the passenger amenities, enabling
optimal utilization of land at railway stations and improving of integrated public transport hub as a part of smart city
development program
MAJOR DEALS
Global private equity major KKR's non-banking financial company (NBFC) invested Rs 300 crore in two residential
projects (Abitante and Aldea Espanola) of realty developer Puranik Builders
Realty developer Kumar Urban has raised Rs 300 crore to refinance existing lenders and project construction from
Altico Capital for its township KUL Ecoloch near Hinjewadi
R E A LT Y N E W S

INDIA RESIDENTIAL REAL ESTATE I RESEARCH

INDIA RESIDENTIAL REAL ESTATE I RESEARCH
POPULATION
CITY
OVERVIEW
426 km2 4.34 Million
AREA
ABOUT CITY
Located on the Coromandel Coast off the Bay of Bengal, Chennai is
capital of Tamil Nadu
POPULATION GROWTH RATE
7.7 % 6.20 %
ECONOMIC GROWTH RATE
*As of year 2008
RESIDENTIAL MARKET GROWTH DRIVERS
Central Chennai: Nungambakkam, Anna Salai, Alwarpet ,T.Nagar
West Chennai: Anna Nagar, Ambattur, Sriperumbudur (IndustrialArea), Oragadam (Industrial Area)
North Chennai: Perambur South Chennai: Old Mahabalipuram Road (OMR), Guindy,
Nandambakkam, Perungudi, Thuraipakkam, Sholinganallur,Siruseri, Maraimalai Nagar
INFRASTRUCTURE
Existing: Old Mahabalipuram Road, East Coast Road, Outer RingRoad
Upcoming: Ponneri Smart City, Greenfield Airport, ChennaiBengaluru Industrial Corridor (CBIC)
RESIDENTIAL UNITS LAUNCHED
15,691 units
PREDOMINANT BUDGET RANGE
30 Lac - 60 Lac
*Constitutes 50% of total Supply
HIGHEST NUMBER OF LAUNCHES
South Chennai(9,074 units)
% CHANGE IN PRICE 2015 vs 2016
% CHANGE IN NEW LAUNCH SUPPLY – 2015 vs 2016
36.87 %
UNSOLD STOCK
32,038 units
CITY INVENTORY OVERHANG
UNDER CONSTRUCTION
UNITS
52,145 units
*As per Census 2011
Icons Source: Flaticon
42 Months
6.37 %

INDIA RESIDENTIAL REAL ESTATE I RESEARCH
Chennai has seen a high slump in the supply of new
residential units in the year 2016. Chennai city witnessed
a dip of 38 percent in the new launch supply when
compared to the previous year 2015.
New launches have come down at faster rates as the
market sentiments fell till the third quarter of the year
due to various aspects such as impact of 2015 floods and
RERA.
Residential realty in Q4 2015 has faced tough times due
to the impact of floods and the same quarter in 2016 has
seen a comeback with 57 percent more new residential
dwelling unit launches.
South Chennai is ahead of the other zones of Chennai
in terms of new launch supply in 2016 with 9074 new
unit launches i.e. 58 percent of overall new units supply
in the city.
South Chennai alone contributed more than half to the
new unit launch figure in the first quarter (Q1) and the
fourth quarter (Q4) contributing to whopping 63
percent and 35 percent of the new units. The IT
establishments along the OMR Road and GST Road,
improved physical and social infrastructure along with
the presence of major transportation corridors made
South Chennai the most favoured residential
destination.
The Western zone of Chennai recorded considerable
number (5,277 units i.e. 34 percent) of new residential
launches in 2016 with the advent of numerous global
manufacturing companies and presence of industrial
belts.
While North Chennai has recorded 7 percent of new
launches, Central Chennai, expectedly, recorded mere 1
percent of new dwelling units launch in spite of the huge
demand for residential properties in the region. This is
because the price per square feet is very high and the
shortage of developable land prevents sizeable
development activity
0 2000 4000 6000 8000 10000
Central Chennai
North Chennai
South Chennai
West Chennai
No. of Units
City
Zones
Q1 2016 Q2 2016 Q3 2016 Q4 2016
Z O N E W I S E S P L I T O F R E S I D E N T I A L L A U N C H E S
N E W L A U N C H S U P P L Y T R E N D - 2 0 1 5 V S 2 0 1 6

INDIA RESIDENTIAL REAL ESTATE I RESEARCH
Situated in the heart of the city and located in the
western Chennai, Vadapani has recorded the maximum
unit launch figure of 1,044 units. This is due to the
booming IT development and improved infrastructure
along with availability of huge land bank in this region.
Maramalai Nagar, one of the IT and educational hubs of
Chennai has grabbed a lot of attention with 908 units
launched in 2016, one main reason being its strategic
location on the Grand Southern Trunk (GST) Road. In
addition to these, there are numerous manufacturing and
industrial units which are driving the residential demand
in and around this micro-market.
Ponneri smart city, proposed 400-ft Outer Ring Road and
the upcoming Chennai-Bengaluru Industrial Corridor
(CBIC) are few important aspects which are responsible
for the increasing housing demand in Ponneri.
Vanagaram and Mahindra World City evolved as the top
micro-markets due to existence of industrial parks and
proximity to commercial hubs.0 200 400 600 800 1000 1200
Vadapalani
Maraimalai Nagar
Ponneri
Vanagaram
Mahindra World City
No. of Units
Mic
ro M
arke
ts
0 1000 2000 3000 4000 5000 6000 7000 8000 9000 10000
Central Chennai
North Chennai
South Chennai
West Chennai
No. of Units
City
Zones
0 - 30 Lacs 30 - 60 Lacs 60 Lacs - 1 Crore 1 Crore - 2 Crore Above 2 Crore
B U D G E T W I S E S P L I T O F N E W L A U N C H E S
Chennai's residential market has witnessed half of the new launches in the mid segment, specifically in the price bracket of
30-60 Lacs. Whopping 64 percent of the mid-segment units in the price range of 30-60 Lacs have come up in South Chennai
alone which depicts the demand for these housing units in Chennai. South Chennai also took the lead for the affordable
residential units in the price range of 0-30 Lacs
About 21 percent of the premium dwelling units were launched in the price bracket of 1 crore to 2 crore with West
Chennai taking the lead.
Units with more than 2 core ticket price is the least favoured price bracket , hence the number of new launches was limited
to 3% of overall launches of 2016.
T O P M I C R O M A R K E T S O F 2 0 1 6 - B A S E D O N N E W L A U N C H S U P P L Y

INDIA RESIDENTIAL REAL ESTATE I RESEARCH
S P L I T O F U N D E R - C O N S T R U C T I O N I N V E N T O R I E S – Z O N E W I S E
S P L I T O F U N S O L D I N V E N T O R I E S – Z O N E W I S E
With the surge in new residential units in 2016,
South Chennai has alarming 40,389 units (i.e. 77
percent) which are under-construction.
When compared to Southern Chennai, western
part of Chennai has minimal number of under-
construction dwelling units while Central Chennai
has barely any under-construction housing units.
Out of the total unsold inventory of Chennai,
almost 72 percent of the unsold stock fall under the
southern part of Chennai. The developers of the
city have resorted to giving away innovative finance
schemes, freebies and discounts to the homebuyers
to clear the unsold stocks.
The other factors affecting the sales velocity in the
city are the anticipation of interest rate cuts along
with home buyers expectations on price stability
upon implementation of demonetization and RERA
act.West Chennai

INDIA RESIDENTIAL REAL ESTATE I RESEARCH
T O P L A U N C H E S O F 2 0 1 6 - B A S E D O N N E W L A U N C H S U P P L Y
P R I C E M O V E M E N T A N D R E N T A L P R I C E S O F K E Y M I C R O M A R K E T S
Project Name Locality Developer NamePossession
Date
No. of Units
(Approx.)
Lump sum
Price (INR)BHK Type BHK Sizes (Sqft)
Ashiana SumbhamMaraimalai
NagarAshiana Housing May-18 872
19.52 Lac to
51.54 Lac1,2,3
581 Sqft -1534
Sqft
Mahindra Aqualily
Flexi
Mahindra
World City
Mahindra Lifespace
Developers LimitedDec-18 415
25.04 Lac to
26.64 Lac1
581 Sqft - 624
Sqft
Asta AVM Vadapalani Asta Properties Dec-19 66059.97 Lac to
2.31 Crore1,2,3,4
628 Sqft - 2467
Sqft
RWD Grand
CorridorVanagaram
Ramky Wavoo
DevelopersAug-18 420
29.74 Lac to
1.27 Crore1,2,3,4
595 Sqft - 2555
Sqft
Prime Arete
HomesPonneri Prime LifeSpace Dec-18 744
23.13 Lac to
57.71 Lac1,2,2.5,3
651 Sqft - 1668
Sqft
Area/LocalityPrice Q4 2016
Rate Per Sqft (INR)
% Change
(Q3 vs.
Q4)
1BHK Rental Range
(INR)
2 BHK Rental Range
(INR)
3 BHK Rental Range
(INR)
Perumbakkam 3,402-4,745 2.79 7,500-10,000 8,000-16,000 10,000-19,000
Porur 4,712-7,392 0.40 9,000-11,000 10,000-17,500 12,000-20,000
East Coast Road - ECR 4,648-8,838 0.70 9,200-12,300 18,000-28,000 25,000-34,000
Madipakkam 4,073-6,073 2.36 7,500-10,000 8,500-15,000 9,600-17,000
Pallikaranai 4,420-6,328 4.86 7,000-9,000 8,000-14,000 11,000-19,000
Sholinganallur 4,077-6,380 -3.28 8,000-11,000 10,000-16,000 11,000-25,000
Medavakkam 3,711-5,585 2.22 5,000-7,500 9,000-16,000 10,000-21,000
Velachery 5,537-9,542 3.91 8,000-10,500 11,000-19,000 15,000-22,000
Poonamallee 3,070-4,273 0.88 6,200-8,000 9,000-14,000 14,000-20,000
Anna Nagar 8,034-13,047 0.67 11,000-12,000 13,000-24,000 17,000-30,000
Thoraipakkam 5,204-8,250 7.29 8,000-10,000 15,000-23,000 21,000-32,000
Ambattur 4,164-6,651 2.84 7,500-9,500 8,000-14,000 12,500-20,000
Kolathur 4,147-6,484 5.29 7,000-10,000 10,500-22,000 12,000-21,000
Oragadam 2,810-4,550 4.74 6,000-10,000 7,500-14,000 10,000-20,500

INDIA RESIDENTIAL REAL ESTATE I RESEARCH
M A P O F C H E N N A I

INDIA RESIDENTIAL REAL ESTATE I RESEARCH
REGULATORY UPDATES
The Greater Chennai Corporation has taken control of the city's industrial estates to carry out civic maintenance
and infrastructure work in the areas such as Perungudi estate,Ambattur and Guindy industrial estates
Madras High Court made it clear that no construction activities will be allowed in the areas declared as Coastal
Regulation Zones
INFRASTRUCTURE UPDATES
Property developer Embassy Group has emerged as the exclusive co-developer for setting up a 30-acre special
economic zone (SEZ) - Embassy SplendidTech Zone located on Thoraipakkam Pallavaram Radial Road
Airport Authority of India to construct a new airport terminal by 2020-21 with a cost of Rs 2,100 crore to reduce
the maintenance issues and also increase the capacity from 23 million to 30 million annually
MAJOR DEALS
Asian Development Bank (ADB) approved $631 million in loan to develop the 2500km stretch along the East Coast
Economic Corridor, which will extend from Kolkata in West Bengal to Tuticorn in Tamil Nadu via Visakhapatnam in
Andhra Pradesh and Chennai in Tamil Nadu
Real estate-focussed private equity Kotak Realty Fund has invested an amount of Rs 155 crore in Chennai based
developer- Alliance Infrastructure’s residential project
R E A LT Y N E W S

INDIA RESIDENTIAL REAL ESTATE I RESEARCH

INDIA RESIDENTIAL REAL ESTATE I RESEARCH
POPULATION
CITY
OVERVIEW
650 km2 6.7 Million
AREA
ABOUT CITY
Fourth most populous city and sixth most populous urban
agglomeration in India
POPULATION GROWTH RATE
2.97 % 7.80 %
ECONOMIC GROWTH RATE
*As of year 2008
RESIDENTIAL MARKET GROWTH DRIVERS
Central Hyderabad: Koti, Abids, Ameerpet, Panjagutta,Himayatnagar, Tolichowki, Mehdipatnam
East Hyderabad: LB Nagar, Habsiguda
West Hyderabad: Gachibowli, Hi tech City, Madhapur, JubileeHills, Kondapur, Attapur
North Hyderabad: Miyapur, ECIL, Alwal
South Hyderabad: Dilsukhnagar, Shamshabad
INFRASTRUCTURE
Existing: Outer Ring Road (ORR), Inner Ring Road (IRR), Multi-ModalTransport System (MMTS)
Upcoming: Multi-Modal Transport System (MMTS) Phase- 2,Hyderabad Metro Rail
RESIDENTIAL UNITS LAUNCHED
14,248 units
PREDOMINANT BUDGET RANGE
60 Lac - 1 Crore
*Constitutes 47% of total Supply
HIGHEST NUMBER OF LAUNCHES
West Hyderabad(11,877 units)
% CHANGE IN PRICE 2015 vs 2016
% CHANGE IN NEW LAUNCH SUPPLY – 2015 vs 2016
4 %
UNSOLD STOCK
29,900 units
CITY INVENTORY OVERHANG
UNDER CONSTRUCTION
UNITS
47,617 units
*As per Census 2011
Icons Source: Flaticon
44 Months
8 %

INDIA RESIDENTIAL REAL ESTATE I RESEARCH
Z O N E W I S E S P L I T O F R E S I D E N T I A L L A U N C H E S
N E W L A U N C H S U P P L Y T R E N D - 2 0 1 5 V S 2 0 1 6
In 2016, Hyderabad has recorded a dip of 9 percent in the
launch of new residential dwelling units in comparison with the
preceding year. The first quarter(Q1) is only phase of the year
where the total number of launches have exceeded the figure of
2015.
The year 2015 has seen both highs and lows in regard to new
unit launches, whereas in 2016, there has been a sharp decline in
the graph of new housing units from 5,496 units (39 percent) in
Q1 to 1337 units (9 percent) in Q4-2016.
The reason behind the decline can be attributed to the
developers focusing on clearing the unsold inventory before
launching new projects.
Out of the 14,248 new dwelling units launched in Hyderabad in
the year 2016, about 83% of them have been launched in
Western part of Hyderabad alone.
West Hyderabad and North-West Hyderabad are the preferred
zones with highest number of new launches. Gachibowli, Hi-
tech city, Manikonda, Kondapur and Miyapur are the prominent
hotspots in these zones due to the proximity to Outer Ring
Road (ORR), presence of IT SEZ's and proposed Information
Technology Investment Region (ITIR) and Hyderabad-Nagpur
Industrial Corridor (HNIC)0 5000 10000 15000
West Hyderabad
North Hyderabad
Central Hyderabad
South Hyderabad
East Hyderabad
No. of Units
City
Zones
Q1 2016 Q2 2016 Q3 2016 Q4 2016
T O P M I C R O M A R K E T S O F 2 0 1 6 - B A S E D O N N E W L A U N C H S U P P L Y
West Hyderabad, expertly, has the top performing micro-
markets in 2016 with Gachibowli taking the lead, followed by Hi
Tech city. These localities have been considered to be one of the
fastest growing micro markets in India due to rapidly expanding
technology hub, world class infrastructure and proximity to the
International Airport
Narsingi, Nallagandla and Manikonda are other top sought after
micro markets in Hyderabad due to proximity to IT clusters,
rapidly developing with improved connectivity
0 1000 2000 3000 4000
Gachibowli
Hi Tech City
Narsingi
Nallagandla
Manikonda
No. of Units
Mic
ro M
arke
ts
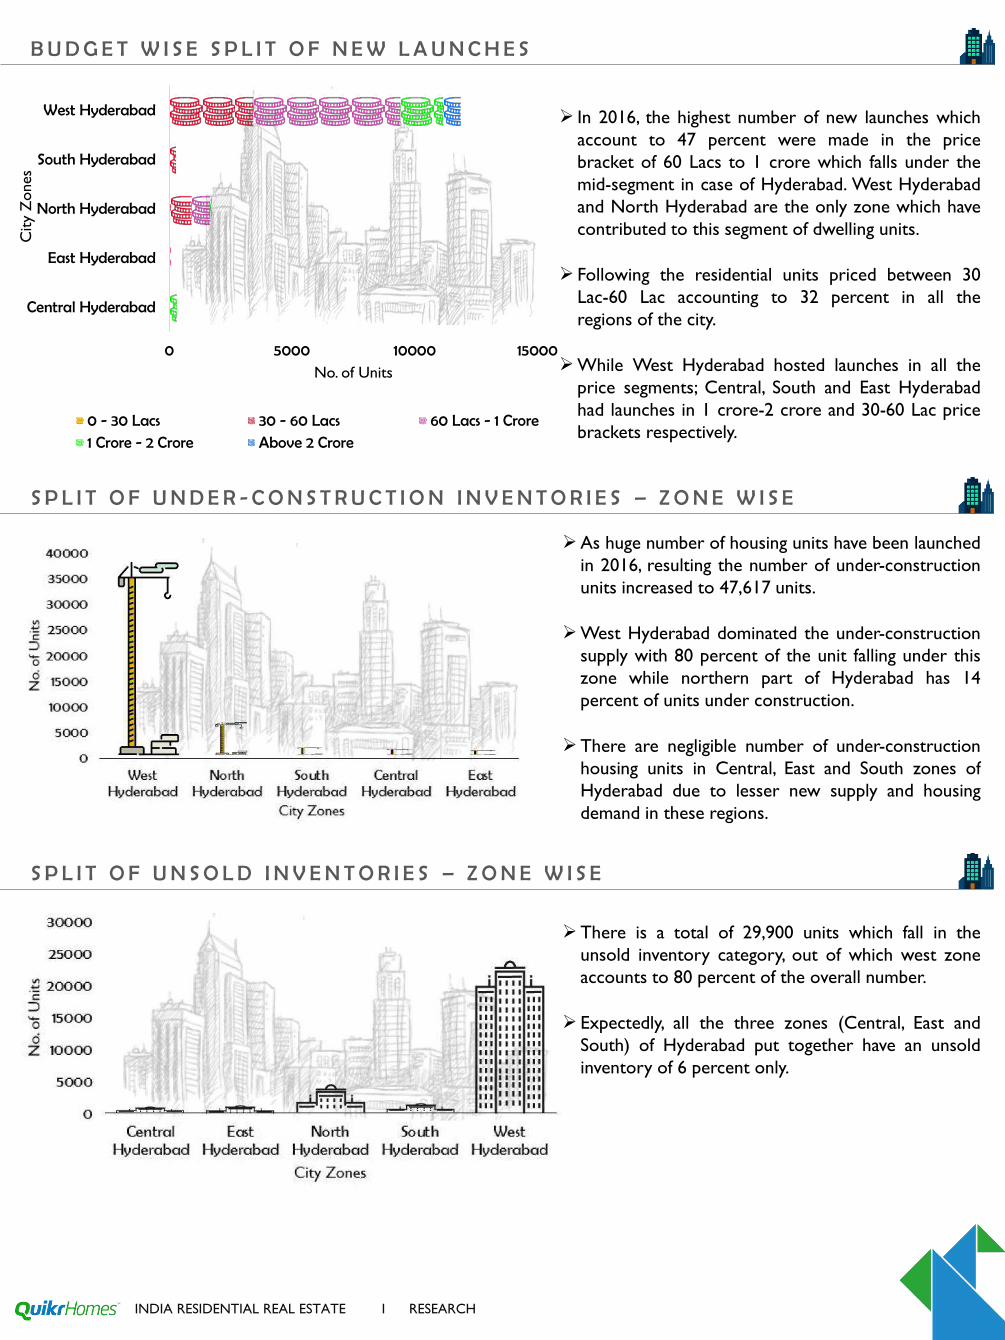
INDIA RESIDENTIAL REAL ESTATE I RESEARCH
0 5000 10000 15000
Central Hyderabad
East Hyderabad
North Hyderabad
South Hyderabad
West Hyderabad
No. of Units
City
Zones
0 - 30 Lacs 30 - 60 Lacs 60 Lacs - 1 Crore
1 Crore - 2 Crore Above 2 Crore
B U D G E T W I S E S P L I T O F N E W L A U N C H E S
In 2016, the highest number of new launches which
account to 47 percent were made in the price
bracket of 60 Lacs to 1 crore which falls under the
mid-segment in case of Hyderabad. West Hyderabad
and North Hyderabad are the only zone which have
contributed to this segment of dwelling units.
Following the residential units priced between 30
Lac-60 Lac accounting to 32 percent in all the
regions of the city.
While West Hyderabad hosted launches in all the
price segments; Central, South and East Hyderabad
had launches in 1 crore-2 crore and 30-60 Lac price
brackets respectively.
As huge number of housing units have been launched
in 2016, resulting the number of under-construction
units increased to 47,617 units.
West Hyderabad dominated the under-construction
supply with 80 percent of the unit falling under this
zone while northern part of Hyderabad has 14
percent of units under construction.
There are negligible number of under-construction
housing units in Central, East and South zones of
Hyderabad due to lesser new supply and housing
demand in these regions.
There is a total of 29,900 units which fall in the
unsold inventory category, out of which west zone
accounts to 80 percent of the overall number.
Expectedly, all the three zones (Central, East and
South) of Hyderabad put together have an unsold
inventory of 6 percent only.
S P L I T O F U N D E R - C O N S T R U C T I O N I N V E N T O R I E S – Z O N E W I S E
S P L I T O F U N S O L D I N V E N T O R I E S – Z O N E W I S E

INDIA RESIDENTIAL REAL ESTATE I RESEARCH
T O P L A U N C H E S O F 2 0 1 6 - B A S E D O N N E W L A U N C H S U P P L Y
P R I C E M O V E M E N T A N D R E N T A L P R I C E S O F K E Y M I C R O M A R K E T S
Project Name Locality Developer Name Possession DateNo. of Units
(Approx)
Lumpsum
Price (INR)BHK Type
BHK Sizes
(Sqft)
My Home Avatar Gachibowli My Home Group Aug-18 1390
53.87 Lac
to 75.19
Lac
2,31314 Sqft -
1834 Sqft
Marina Skies Hi Tech CityCybercity Builders &
Developers Pvt. LtdDec-20 1200
49.86 Lac
to 1 Crore2,3
1160 Sqft -
2340 Sqft
NCC Urban One NarsingiNCC Urban
Infrastructure LimitedDec-19 1317
64.47L to
1.10Cr3,4
1535 Sqft -
2630 Sqft
Ramky One
GalaxiaNallagandla
Ramky Estates &
Farms LtdMar-19 682
54 Lacs to
78 Lacs2,3
1260 Sqft -
1860 Sqft
Area/LocalityPrice Q4 2016
Rate Per Sqft (INR)
% Change
(Q3 vs.
Q4)
1BHK Rental Range
(INR)
2 BHK Rental Range
(INR)
3 BHK Rental Range
(INR)
Manikonda 2,446-3,802 3.62 7,000-8,000 10,000-14,000 16,000-20,000
Kondapur 3,493-5,204 5.09 7,000-9,000 14,000-18,000 20,000-25,000
Gachibowli 3,093-5,211 5.34 8,500-10,500 16,000-20,000 24,000-28,000
Miyapur 2,196-3,661 6.32 8,000-10,000 12,000-16,000 18,000-20,000
Madhapur 3,990-6,314 3.54 9,000-11,500 14,000-18,000 30,000-35,000
Kompally 2,182-3,363 4.13 4,000-6,000 6,500-10,500 12,000-16,000
Attapur 2,783-3,945 6.04 5,000-7,000 9,000-12,000 15,000-18,000
Chanda Nagar 2,617-4,037 2.07 6,000-7,000 10,000-14,000 16,000-20,000
Nizampet 2,011-3,329 4.87 5,000-6,000 8,000-12,000 12,500-18,000
Nallagandla 3,370-5,239 2.98 8,000-10,000 12,500-20,000 21,000-30,000
Bachupally 1,808-2,902 2.61 5,000-6,500 7,000-15,000 9,500-20,000
Sainikpuri 2,276-3,406 7.96 4,400-5,500 6,000-12,000 10,000-15,000
Tellapur 3,344-5,105 -1.15 5,000-10,000 9,000-15,000 12,000-17,000
Hafeezpet 2,947-4,505 7.13 6,500-7,500 12,000-20,000 11,500-25,000

INDIA RESIDENTIAL REAL ESTATE I RESEARCH
M A P O F H Y D E R A B A D

INDIA RESIDENTIAL REAL ESTATE I RESEARCH
REGULATORY UPDATES
Greater Hyderabad Municipal Corporation (GHMC) enforced Energy Conservation Building Code (ECBC) to ensure
efficient use of power. The new norms include lighting, heating, ventilation and air-conditioning and will apply to all
buildings with built-up area of 2,000 square metres or higher
Telangana government has decided to regularise surplus vacant, encroached land under the Urban Land Ceiling (ULC)
Act to generate revenue
INFRASTRUCTURE UPDATES
Telangana government is setting up a state-of-the-art pharmaceutical city on 12,500 acres of land in Rangareddy and
Mahbubnagar district which constitutes of pharmaceuticals manufacturing companies, biotech and life sciences
companies along with all related activities
Telangana government is planning to develop a second financial district spread over 50 acres to offer facilities to the
BFSI (Banking, Financial Services and Insurance) companies as the existing 75-acre financial district is completely
saturated
MAJOR DEALS
Telangana Government has offered to set up an exclusive investment park for Korean companies such as Posco,
Hyundai, and some electronics companies
Cerestra Advisors Ltd, a real estate-focused private equity firm, has bought Alexandria Knowledge Park at Genome
Valley in Hyderabad for about Rs 400 crore as it plans to build an office portfolio with focus on R&D clients
R E A LT Y N E W S

INDIA RESIDENTIAL REAL ESTATE I RESEARCH

INDIA RESIDENTIAL REAL ESTATE I RESEARCH
POPULATION
CITY
OVERVIEW
185 km2 4.57 Million
AREA
ABOUT CITY
Located on the east bank of Hooghly River, Kolkata is the capital of
West Bengal
POPULATION GROWTH RATE
-1.88 % 6.30 %
ECONOMIC GROWTH RATE
*As of year 2008
RESIDENTIAL MARKET GROWTH DRIVERS
Central Kolkata: Park street, Loudon street, Theatre Road,Camac street, BBD Bagh, Esplanade
East Kolkata: Salt Lake, Rajarhat, E.M. Bypass West Kolkata: Howrah, Batanagar, Behala, Belur, Diamond
Harbour Road, Hooghly, Maheshtala, Uttarpara, Baidyabati North Kolkata: Barrackpore Trunk Road (BT Road), Jessore Road,
Lake Town, Paik Para, VIP Road, Sinthimore South Kolkata: Alipore, New Alipore, Ballygunge, Jodhpur Park,
Tollygunge, Behala, Garia, Kasba, Santoshnagar
INFRASTRUCTURE
Existing: Parama Island Flyover
Upcoming: Kolkata’s longest flyover linking Howrah with EM Bypass,Kolkata metro rail
RESIDENTIAL UNITS LAUNCHED
15,461 units
PREDOMINANT BUDGET RANGE
0 Lac – 30 Lac
*Constitutes 60% of total Supply
HIGHEST NUMBER OF LAUNCHES
North Kolkata (5,487 units)
% CHANGE IN PRICE 2015 vs 2016
% CHANGE IN NEW LAUNCH SUPPLY – 2015 vs 2016
33 %
UNSOLD STOCK
51,404 units
CITY INVENTORY OVERHANG
UNDER CONSTRUCTION
UNITS
97,801 units
*As per Census 2011
Icons Source: Flaticon
39 Months
22 %

INDIA RESIDENTIAL REAL ESTATE I RESEARCH
Z O N E W I S E S P L I T O F R E S I D E N T I A L L A U N C H E S
N E W L A U N C H S U P P L Y T R E N D - 2 0 1 5 V S 2 0 1 6
The new launch supply figure in Kolkata plunged by 35
percent in 2016 when compared to the year 2015.
The first quarter of the year 2016 is the only phase during
which there has been a positive change of 39 percent
(compared to Q1 2015) in the number of new launches.
There has been a gradual declined in the new launches in
the following quarters with Q4 being affected the most in
comparison with the launches in the previous year.
On QoQ basis, Q1 2016 and Q3 2016 have had the
maximum number of new launches with 6,085 units and
4,727 units respectively
North Kolkata has huge housing demand in 2016 with 35
percent of the new launches made in this part of the city.
North Kolkata is gaining popularity due to the upcoming
metro connectivity and proximity to Rajarhat mega city.
While East and South Kolkata witnessed 29 percent and 28
percent of the overall new launch supply, the western and
central parts of the city were lagging behind.
Uttarpara in North Kolkata has emerged as the top
performing micro market with 2377 units launched in
2016. This micro market, which is a part of the Hooghly
region offers good connectivity through Grand Trunk
Road, PWD Road to Howrah and other areas. In addition
to these, the proposed light rail and monorail have
increased the residential real estate demand in Uttarpara.
Located in the East Kolkata adjoining to New Town,
Rajarhat has evolved as the second top micro market
with 1675 new residential launches. Well-equipped
infrastructure, good connectivity and affordable prices are
driving the residential demand in Rajarhat.
The growth drivers for Kalikapur and New Town are Bus
Rapid Transit System (BRTS) along the EM Bypass
corridor and the extension of metro line connecting Salt
Lake to Howrah and Rajarhat.
0 2000 4000 6000
Kolkata North
Kolkata East
Kolkata South
Kolkata West
No. of Units
City
Zones
Q1 2016 Q2 2016 Q3 2016 Q4 2016
0 500 1000 1500 2000 2500
Uttarpara
Rajarhat
Kalikapur
New Town
Baruipur
No. of Units
Mic
ro M
arke
ts
T O P M I C R O M A R K E T S O F 2 0 1 6 - B A S E D O N N E W L A U N C H S U P P L Y

INDIA RESIDENTIAL REAL ESTATE I RESEARCH
B U D G E T W I S E S P L I T O F N E W L A U N C H E S
The predominant budget in which the dwelling
units were launched in 2016 is the affordable
segment in the range of 0-30 Lacs(60 percent of
overall launches) followed by the mid-segment in
the range of 30-60 Lacs (22 percent of overall
launches). The rise in the affordable housing units
can be substantiated with the government's
mission to provide affordable housing under the
'Housing for All' scheme.
While East, North and South Kolkata's housing
unit launches were concentrated in the 0-30 Lacs
price bracket, West Kolkata has majority of its
launches in the price bracket of 30-60 Lacs.
Central Kolkata has made its entry in the 30-60
Lac price bracket alone.
With about 97,801 housing units falls in under-
construction stage in 2016, East Kolkata has about
37 percent of overall number in this category
followed by South Kolkata having 31 percent under
construction housing units.
Interestingly, North Kolkata which had the highest
number of new launches in 2016 has less than a
quarter of its units under construction.
Out of the 51,404 unsold inventory units, 35
percent of the housing units fall in the eastern part
of Kolkata and 33 percent of them are in the south
Kolkata which indicates there is more supply than
demand.
Central Kolkata has negligible number of unsold
units when compared to rest of the zones.
The builders of Kolkata have offered special offers
to the homebuyers such as easy finance and down
payment options to reduce their unsold residential
stock.
0 1000 2000 3000 4000 5000 6000
Kolkata Central
Kolkata East
Kolkata North
Kolkata South
Kolkata West
No. of Units
City
Zones
0 - 30 Lacs 30 - 60 Lacs 60 Lacs - 1 Crore
1 Crore - 2 Crore Above 2 Crore
S P L I T O F U N D E R - C O N S T R U C T I O N I N V E N T O R I E S – Z O N E W I S E
S P L I T O F U N S O L D I N V E N T O R I E S – Z O N E W I S E

INDIA RESIDENTIAL REAL ESTATE I RESEARCH
T O P L A U N C H E S O F 2 0 1 6 - B A S E D O N N E W L A U N C H S U P P L Y
P R I C E M O V E M E N T A N D R E N T A L P R I C E S O F K E Y M I C R O M A R K E T S
Project Name Locality Developer Name Possession DateNo. of Units
(Approx)
Lumpsum Price
(INR)BHK Type
BHK Sizes
(Sqft)
Shriram Grand
CityUttarpara
Shriram Properties
Private LimitedApr-18 2343
12.42 Lac to
29.65 Lac1,2,3
469 Sqft -
1119 Sqft
Dharitri Nakshi
KanthaBaruipur
Dhathri
InfraStructureDec-18 386
14.50 Lac to 24
Lacs2,3
720 Sqft -
1440 Sqft
Freshia
ApartmentsRajarhat Loharuka Group Dec-19 360
32.31 Lac to
47.49 Lac2,3
885 Sqft -
1301 Sqft
Usashi Prince
TownNew Town
Usashi Realstates Pvt
LtdJun-20 800
16.71 Lac to
22.78 Lac2,3
840 Sqft -
1145 Sqft
Aspirina Malabar
ResidencyKalikapur
Aspirana Infraventure
Private LimitedMar-19 1664
6.34 Lac to
13.30 Lac1,2,3
287 Sqft -
602 Sqft
Area/LocalityPrice Q4 2016
Rate Per Sqft (INR)
% Change
(Q3 vs.
Q4)
1BHK Rental Range
(INR)
2 BHK Rental Range
(INR)
3 BHK Rental Range
(INR)
Rajarhat 3,284-5,451 1.84 6,000-10,000 11,000-18,000 14,000-25,000
Garia 2,892-4,782 4.03 5,500-9,000 10,000-13,000 13,000-20,000
EM Bypass 4,696-8,200 2.81 7,500-10,000 10,000-18,000 12,500-21,000
Narendrapur 2,741-4,590 4.30 6,000-7,000 9,000-14,000 12,000-18,000
Madhyamgram 2,235-3,230 2.15 4,500-6,000 5,000-11,000 8,000-15,000
BT Road 3,269-4,746 4.46 6,000-9,500 9,000-15,000 13,000-22,000
New Town 3,772-5,902 2.67 8,000-12,000 10,000-19,000 13,000-25,000
Behala 2,846-4,659 5.14 4,000-8,000 10,000-14,000 12,000-18,000
Tollygunge 3,495-5,953 3.29 6,000-10,000 15,000-22,000 18,000-27,500
Dum Dum 2,455-3,890 1.05 4,000-7,000 8,500-15,500 10,000-19,000
Ballygunge 6,971-12,300 1.59 8,000-12,000 15,000-20,000 20,000-33,000
Kaikhali 2,871-4,373 2.62 6,000-8,500 10,000-16,000 13,500-22,000
Howrah 2,404-4,000 -0.57 4,000-6,000 9,500-14,000 12,000-20,000
Tangra 4,658-6,500 0.89 10,000-12,000 12,000-20,000 22,000-35,000

INDIA RESIDENTIAL REAL ESTATE I RESEARCH
M A P O F K O L K A T A
INDIA RESIDENTIAL REAL ESTATE I RESEARCH
REGULATORY UPDATES
New Town development authority has begun adopting better construction management process such as construction
work in the project sites in phases, use of prefabricated beams and usage of polythene sheets on the ground to avoid
leakage into drains
The 113-year-old ‘Works of Defence Act’ has been amended that restricts construction of buildings within 500
metres of military establishments and modified the limit to only 100 metres for multi-storeyed structures and 50
metres for single-storeyed houses
INFRASTRUCTURE UPDATES
Concept of Global Floor Area Ratio (FAR) for townships has been introduced, which will be calculated on the entire
township area for use anywhere within the project site instead of separate calculations for each component in the
township
Housing Infrastructure Development Corporation (HIDCO) plans to develop New Town as a Green City by including
Namami Gange that has a component of plantation in Eco Park and compensatory forestry
MAJOR DEALS
Trump Organization has partnered with Unimark Group to build a 400,000 sq.ft. residential project with the signature
Trump Tower on the city’s EM Bypass stretch
Kolkata-headquartered Primarc Projects has teamed up with MCK Group to come up with a modern housing
complex at Kankurganchi in North Kolkata
R E A LT Y N E W S

INDIA RESIDENTIAL REAL ESTATE I RESEARCH
2 0 1 7 O U T L O O K
The year 2016 ended on a mixed note with fewer new launches in the residential market, implementation of
major polices & regulations along with the demonetization drive by the central government to curb the
black money. The seed sowed by the central government to make real estate more transparent and viable
will be reaped by the home buyers in the coming years. 2017 would be an interesting year to observe, when
the real estate industry will take a paradigm shift and move towards organized real estate practices. States
will be implementing the long awaited Real Estate Regulatory Act (RERA), will bring back the consumer
confidence in the market and accelerate the market sentiments. Additionally, developers will start focusing
on timely project completion, and complete information on the project and amenities promised.
On the other hand, developers will restrict the new launch supply and will continue to focus on liquidating
the piled up unsold stock. Micro markets such as Yamuna Expressway in NCR, Sarjapur Road in Bengaluru,
Dombivli in MMR, Kharadi and Hinjewadi in Pune will remain the preferred destination to the developers
for their portfolio expansion. Moreover, the residential market of top cities will witness additional supply in
affordable and mid-segment properties.
Execution delay and Litigation issue in the micro market of Greater Noida and Gurgaon will impact the
buyer sentiments and restrict them to enter the highly volatile market (Dwarka Expressway & Noida
Extension). The sales velocity in top cities will continue to remain week in the initial 6 months of 2017, due
to the impact of demonetization as most of the transactions in real estate involved high cash component.
Further, recently concluded Union Budget 2017 will accelerate the real estate growth in the country. An
increase in budget allocation under PMAY from 15,000 Cr to 23,000 Cr, revising the size of carpet low
income group houses, boost in home loan and giving 'Affordable Housing‘ status of 'Infrastructure' are likely
to result in increased participation from private players. With such announcements and government
initiatives, the “Housing for all by 2022” mission by the Modi government is not a distant dream.

INDIA RESIDENTIAL REAL ESTATE I RESEARCH
QuikrHomes is India’s leading digital real estate business. We have the largest and most comprehensive list of detailed
real estate sales and rental options covering all cities and budget categories.
In the highly volatile and scattered Indian real estate market it is quite challenging to understand the dynamics and make
profitable investments.We help investors to take informed decision backed by real time data.
We capture real estate data across India and also update historical data of supply & absorption in top cities. To ensure the
most up-to-date and detailed data availability, our dedicated team/analysts monitor property activity from a number of
sources, including developers and property brokers, real estate forums and property listings, as well as our own intensive
research.
Our research services give clients the tools to review & analyze markets and realty insights that support successful
investment strategies. The solutions we provide always cater to our clients’ needs as we ensure that all captured data and
all customized reports undergo thorough due diligence by our in-house audit team.
Services Provided:
Land Potential Assessment
Customized Reports
Competitive Benchmarking Study
Market Assessment Reports
Feasibility Reports
Quarterly demand Supply Analysis Report
Projects Monitoring Services
Tier 1 Cities Residential Projects Details with historical price & Absorption Trends
For Residential Data Services, Please contact –
Prashant KumarThakur
Head of Research & Data Services
Quikr India Pvt Ltd
Next to Manyata Tech Park,
Back Gate No 5.
Krishnarajapuram Hobli,
Bengaluru-560045
Copyright © 2007-16 QuikrHomes | CommonFloor. All rights reserved.The information provided herein is based on QuikrHomes & CommonFloor data which is collected from various publicly known sources viz, websites, documents and mapsincluding QuikrHomes & CommonFloor's proprietary data model. Projects mentioned in the report are selected solely on basis of various parameters including number ofunits, price range and unique selling point, among others. The selection, omission, or content of items does not imply any endorsement or other position takenby QuikrHomes & CommonFloor.The information is provided on an "as is" and "as available" basis. QuikrHomes & CommonFloor expressly disclaim warranties of any kind, whether express or implied,including, but not limited to, the implied warranties of merchantability, fitness for a particular purpose and non-infringement.
A B O U T Q U I K R H O M E S
Rahul Panwar
Asst. Manager | Research
Pallavi Meruga
Research Associate| Research
Abhai Mani Chaturvedi
Senior Manager | Research & Data Services
Authors:


![Untitled-1 [teja8.kuikr.com] · 2016. 6. 21. · O o O O o o O O O o o O O O o o typical floor plan NO COMMON WALLS highlights 136 flats ranging from 990 sft. to 1395 sft. Grand entry](https://static.fdocuments.in/doc/165x107/603e215466e8bd11985b7374/untitled-1-teja8kuikrcom-2016-6-21-o-o-o-o-o-o-o-o-o-o-o-o-o-o-o-o-typical.jpg)