Residential Mortgages as Financial Assets and Liabilities - National
52
This PDF is a selection from an out-of-print volume from the National Bureau of Economic Research Volume Title: Studies in the National Balance Sheet of the United States, Vol. 1 Volume Author/Editor: Raymond W. Goldsmith and Robert E. Lipsey Volume Publisher: Princeton University Press Volume ISBN: 0-691-04179-2 Volume URL: http://www.nber.org/books/gold63-1 Publication Date: 1963 Chapter Title: Residential Mortgages as Financial Assets and Liabilities Chapter Author: Raymond W. Goldsmith, Robert E. Lipsey Chapter URL: http://www.nber.org/chapters/c3934 Chapter pages in book: (p. 277 - 327)
Transcript of Residential Mortgages as Financial Assets and Liabilities - National
This PDF is a selection from an out-of-print volume from the NationalBureau of Economic Research
Volume Title: Studies in the National Balance Sheet of the United States,Vol. 1
Volume Author/Editor: Raymond W. Goldsmith and Robert E. Lipsey
Volume Publisher: Princeton University Press
Volume ISBN: 0-691-04179-2
Volume URL: http://www.nber.org/books/gold63-1
Publication Date: 1963
Chapter Title: Residential Mortgages as Financial Assets and Liabilities
Chapter Author: Raymond W. Goldsmith, Robert E. Lipsey
Chapter URL: http://www.nber.org/chapters/c3934
Chapter pages in book: (p. 277 - 327)
CHAPTER 11
Residential Mortgages as Financial Assets andLiabilities
Mortgage Debt Outstanding
POSITION OF MORTGAGES AMONG ASSETS AND LIABILITIES
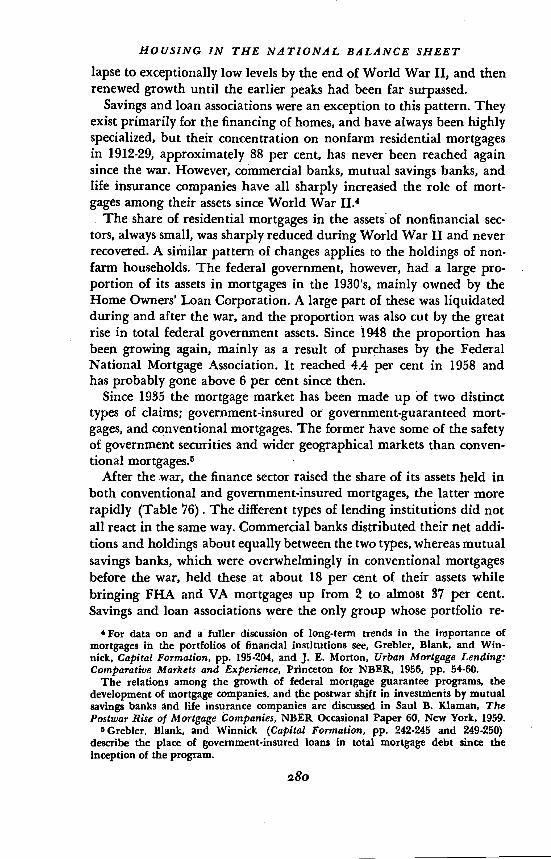
RESIDENTIAL mortgages play a much smaller role among intangibleassets and liabilities than housing among tangible assets. In 1958, attheir highest level in sixty years, nonfarm residential mortgages wereonly 6½ per cent of all financial assets and 9 per cent of liabilities(Table 74). Adding mortgage debt on agricultural residences wouldincrease these figures only very little, because the debt-to-value ratio onagricultural real estate is low, and most of the value of agriculturalreal estate is land, which we assume to be nonresidential.'
In 1929-83 and the late 1950's residential mortgages formed a largerpart of intangible assets and liabilities than in earlier years back to 1900(Table 74). This impression of an upward trend is reinforced by thesuggestion of Grebler, Blank, and Winnick that early mortgage levelswere overstated.2 But the swings in the ratio are so wide that it is diffi-cult to speak confidently of a trend, particularly since the 1933 ratioswere quite similar to all but the highest of those of the 1950's.
If residential mortgages are compared with liabilities other thanthose of the federal government, there is more indication of a long-termrise in importance. The recent levels, in particular, are clearly higherthan those of the 1930's. The trend is still stronger if comparison ismade with corporate debt. The share of residential mortgages in thetotal of mortgage and long-term corporate debt rose from 16 per centin 1900 to over 40 per cent in the early 1950's.3
At the time of the earliest national balance sheet, in 1900, nonfarmresidential mortgage debt accounted for less than half of all mortgages;but by 1958 their share had risen to more than three-quarters. Most ofthis gain was at the expense of farm mortgages, which were mainly onnonresidential property, but residential mortgages also grew faster thannonfarm nonresidential mortgage debt.
'There are no published figures on farm residential mortgage debt because farmmortgages typically cover the farm as a whole. But a rough estimate can be madeby assuming tha•t the ratio of farm residential to total farm. mortgage debt is equalto the ratio of the value of farm residential structures to the value of total farmstructures and land.
Grebler, David M. Blank, and Louis Winnick, Capital Formation in Resi-dential Real Estate, Princeton for NBER, 1956, pp. 168-169.
3lbid., pp. 166-167, 450.
277

HOUSiNG iN THE NATIONAL BALANCE SHEETTABLE 74
SHARE OF NONFARM RESIDENTIAL MORTGAGES IN NATIONALASSETS AND LIABILITIES, 1900-58
(per cent)
Total Total Liabilities TotalIntangible Total cxc. Federal Mortgage
Assets Liabilities Government Debt(1) (2) (3) (4)
1900 4.3 6.6 6.8 43.61912 3.5 5.5 5.6 41.61922 3.4 5.1 5.8 40.41929 4.5 '7.9 8.4 53.61933 5.2 7.7 8.6 55.21939 4.3 6.0 7.2 58.71945A 2.4 3.1 5.0 65.7
1945B 2.4 3.0 4.7 65.51946 2.9 3.6 5.5 67.31947 3.3 4.1 6.1 69.01948 3.7 4.6 6.7 70.51949 4.0 5.1 7.3 71.61950 4.4 5.7 7.9 73.61951 4.7 6.1 8.3 74.61952 4.9 6.4 8.7 75.31953 5.3 6.8 9.1 76.11954 5.5 7.3 9.7 76.71955 5.7 7.9 10.2 77.41956 6.1 8.3 10.6 77.51957 6.4 8.6 10.9 77.41958 6.4 8.9 11.2 77.4
SouRcE: 1900-45A: Vol. II, Table Ia.1945B58: Vol. II, Table I.
The wide fluctuations in the importance of residential mortgagedebt seem to have been related to the rate of building. The share ofresidential mortgages increased in both the postwar building booms, toa much greater extent than the ratio of housing to total tangible assets.As will be seen later, the share of residential mortgages moved similarlyto the debt-to-value ratio for housing, increasing rapidly in the 1920's,reaching a peak in 1933 and a very low point after World War II, andthen rising rapidly and uninterruptedly to the highest recorded level in1958.
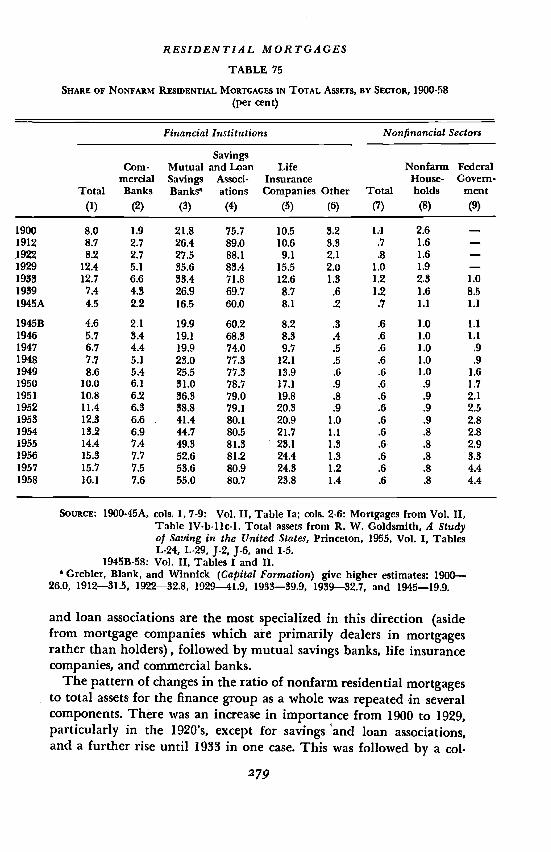
Although mortgages are held by most sectors, they are of major im-portance only to the portfolios of the finance sector where they havemoved from 8 per cent in 1900 to a low of 4.6 per cent in 1945 and toover 16 per cent in 1958 (Table 75). Even within the finance sector,only a few groups hold a large part of their assets in mortgages. Savings
278
RESIDENTIAL MORTGAGES
TABLE 75
SHARE OF NONFARM RESIDENTIAL MORTGAGES IN TOTAL ASSETS, BY SECTOR, 1900-58(per cent)
Financial Institutions Non/inancial Sectors
SavingsCorn- Mutual and Loan Life Nonfarm Federal
mercial Savings Associ- Insurance House- Govern-Total Banks Banksa ations Companies Other Total holds ment
(1) (2) (3) (4) (5) (6) (7) (8) (9)
1900 8.0 1.9 21.8 75.7 10.5 3.2 1.1 2.6 —1912 8.7 2.7 26.4 89.0 10.6 8.3 .7 1.6 —1922 8.2 2.7 27.5 88.1 9.1 2.1 .8 1.6 —1929 12.4 5.1 35.6 83.4 15.5 2.0 1.0 1.9 —1933 12.7 6.6 38.4 71.8 12.6 1.3 1.2 2.8 1.01939 7.4 4.3 26.9 69.7 8.7 .6 1.2 1.6 8.51945A 4.5 2.2 16.5 60.0 8.1 .2 .7 1.1 1.1
1945B 4.6 2.1 19.9 60.2 8.2 .3 .6 1.0 1.11946 5.7 3.4 19.1 68.3 8.3 .4 .6 1.0 1.11947 6.7 4.4 19.9 74.0 9.7 .5 .6 1.0 .91948 7.7 5.1 23.0 77.3 12.1 .5 .6 1.0 .91949 8.6 5.4 25.5 77.3 13.9 .6 .6 1.0 1.61950 10.0 6.1 31.0 78.7 17.1 .9 .6 .9 1.71951 10.8 6.2 36.3 79.0 19.8 .8 .6 .9 2.11952 11.4 6.3 38.8 79.1 20.3 .9 .6 .9 2.51953 12.3 6.6 41.4 80.1 20.9 1.0 .6 .9 2.81954 13.2 6.9 44.7 .80.5 21.7 1.1 .6 .8 2.81955 14.4 7.4 49.3 81.3 23.1 1.3 .6 .8 2.91956 15.3 7.7 52.6 81.2 24.4 1.3 .6 .8 3.31957 15.7 7.5 53.6 80.9 24.3 1.2 .6 .8 4.41959 16.1 7.6 55.0 80.7 23.8 1.4 .6 .8 4.4
SOURCE: 1900.45A, cols. 1, 7-9: Vol. II, Table Ia; cols. 2-6: Mortgages from Vol. II,Table IV-b-llc-1. Total assets from R. W. Goldsmith, A Studyof Saving in the United States, Princeton, 1955, Vol. I, TablesL-24, L-29, J-2, j-6, and I-S.
1945B-58: Vol. II, Tables I and II.Grebler, Blank, and Winnick (Capital Formation) give higher estimates: 1900—.
26.0, 1912—31.5, 1922—32.8, 1929—41.9, 1933—39.9, 1939—32.7, and 1945—19.9.
and loan associations are the most specialized in this direction (asidefrom mortgage companies which are primarily dealers in mortgagesrather than holders), followed by mutual savings banks, life insurancecompanies, and commercial banks.
The pattern of changes in the ratio of nonfarm residential mortgagesto total assets for the finance group as a whole was repeated in severalcomponents. There was an increase in importance from 1900 to 1929,particularly in the 1920's, except for savings and loan associations,and a further rise until 1933 in one case. This was followed by a col-
279
HOUSING IN THE NATIONAL BALANCE SHEET
lapse to exceptionally low levels by the end of World War II, and thenrenewed growth until the earlier peaks had been far surpassed.
Savings and loan associations were an exception to this pattern. Theyexist primarily for the financing of homes, and have always been highlyspecialized, but their concentration on nonfarm residential mortgagesin 1912-29, approximately 88 per cent, has never been reached againsince the war. However, commercial banks, mutual savings banks, andlife insurance companies have all sharply increased the role of mort-gages among their assets since World War
The share of residential mortgages in the assets of nonfinancial sec-tors, always small, was sharply reduced during World War II and neverrecovered. A similar pattern of changes applies to the holdings of non-farm households. The federal government, however, had a large pro-portion of its 'assets in mortgages in the 1930's, mainly owned by theHome Owners' Loan Corporation. A large part of these was liquidatedduring and after the war, and the proportion was also cut by the greatrise in total federal government assets. Since 1948 the proportion hasbeen growing again, mainly as a result of purchases by the FederalNational Mortgage Association. It reached 4.4 per cent in 1958 andhas probably gone above 6 per cent since then.
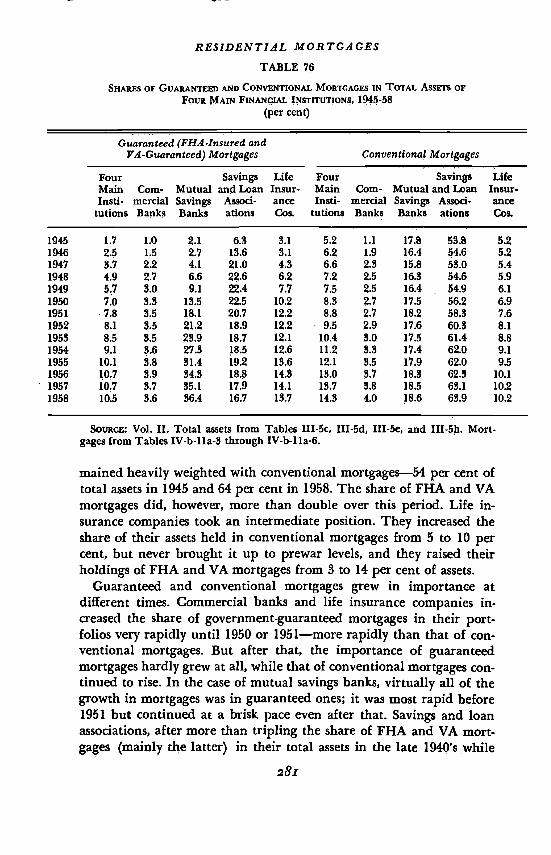
Since 1935 the mortgage market has been made up of two distincttypes of claims; government-insured or government-guaranteed mort-gages, and conventional mortgages. The former have some of the safetyof government securities and wider geographical markets than conven-tional mortgages.5
After the war, the finance sector raised the share of its assets held inboth conventional and government-insured mortgages, the latter morerapidly (Table 76). The different types of lending institutions did notall react in the same way. Commercial banks distributed their net addi-tions and holdings about equally between the two types, whereas mutualsavings banks, which were overwhelmingly in conventional mortgagesbefore the war, held these at about 18 per cent of their assets whilebringing FHA and VA mortgages up from 2 to almost 37 per cent.Savings and loan associations were the only group whose portfolio re-
'For data on and a fuller discussion of long-term trends in the importance ofmortgages in the portfolios of financial institutions see, Grebler, Blank, and Win-nick, Capital Formation, pp. 195-204, arid J. E. Mortori, Urban Mortgage Lending:Comparative Markets and Experience, Princeton for NBER, 1956, pp. 54-60.
The relations among the growth of federal mortgage guarantee programs, thedevelopment of mortgage companies, and the postwar shift in investments by mutualsavings banks and life insurance companies are discussed in Saul B. lUaman, ThePostwar Rise of Mortgage Companies, NBER Occasional Paper 60, New York, 1959.
5Grebler, Blank, and Winnick (Capital Formation, pp. 242-245 and 249-250)describe the place of government-insured loans in total mortgage, debt since theinception of the program.
280
RESIDENTIAL MORTGAGES
TABLE 76
SHARES OF GUARANTEED AND MORTGAGES IN TOTAL AssErs OFFouR MAIN FINANCIAL INSTITUTIONS, 1945-58
(per cent)
Vol. II. Total assets from Tables III-5c, III5d, III-5e, and III-5h. Mort-gages from Tables IV-blla-3 through IV-b-lla-6.
mained heavily weighted with conventional mortgages—54 per cent oftotal assets in 1945 and 64 per cent in 1958. The share of FHA and VAmortgages did, however, more than double over this period. Life in-surance companies took an intermediate position. They increased theshare of their assets held in conventional mortgages from 5 to 10 percent, but never brought it up to prewar levels, and they raised theirholdings of FHA and VA mortgages from to 14 per cent of assets.
Guaranteed and conventional mortgages grew in importance atdifferent times. Commercial banks and life insurance companies in-creased the share of government-guaranteed mortgages in their port-folios very rapidly until 1950 or 1951—more rapidly than that of con-ventional mortgages. But after that, the importance of guaranteedmortgages hardly grew at all, while that of conventional mortgages con-tinued to rise. In the case of mutual savings banks, virtually all of thegrowth in mortgages was in guaranteed ones; it was most rapid before1951 but continued at a brisk pace even after that. Savings and loanassociations, after more than tripling the share of FHA and VA mort-gages (mairdy the latter) in their total assets in the late 194Q's while
281
Guaranteed -Insured andVA -Guaranteed) Mortgages Conventional Mortgages
Four Savings Life Four Savings LifeMain Corn- Mutual and Loan Insur- Main Corn- Mutual and Loan Insur-Insti- mercial Savings Assod- ance Insti- merdal Savings Assod. ance
tutions Banks Banks ations Cos. tutions Banks Banks ations Cos.
1945 1.7 1.0 2.1 6.3 3.1 5.2 1.1 17.8 53.8 5.21946 2.5 1.5 2.7 13.6 3.1 6.2 1.9 16.4 54.6 5.21947 3.7 2.2 4.1 21.0 4.3 6.6 2.3 15.8 53.0 5.41948 4.9 2.7 6.6 22.6 6.2 7.2 2.5 16.3 54.6 5.91949 5.7 3.0 9.1 22.4 7.7 7.5 2.5 16.4 54.9 6.11950 7.0 3.8 13.5 22.5 10.2 8.3 2.7 17.5 56.2 6.91951 7.8 3.5 18.1 20.7 12.2 8.8 2.7 18.2 58.3 7.61952 8.1 3.5 21.2 18.9 12.2 9.5 2.9 17.6 60.3 8.11953 8.5 33 23.9 18.7 12.1 10.4 3.0 17.5 61.4 8.81954 9.1 8.6 27.3 18.5 12,6 11.2 3.3 17.4 62.0 9.11955 10.1 3.8 31.4 19.2 13.6 12.1 8.5 17.9 62.0 931956 10.7 3.9 34.3 18.8 14.3 13.0 8.7 18.3 62.3 10.11957 10.7 3.7 35.1 17.9 14.1 13.7 3.8 18.5 63.1 10.21958 10.5 3.6 36.4 16.7 18.7 14.3 4.0 18.6 65.9 10.2
HOUSING IN THE NATIONAL BALANCE SHEET
keeping the share of conventional mortgages constant, shifted back tothe latter in the 1950's.
On the whole it can be said that the increase in importance of guar-anteed mortgages had almost stopped by 1951. Only mutual savingsbanks, which had previously been prevented from satisfying theirappetite for them, continued to raise the share of guaranteed mort-gages in their total assets.0
The sectoral breakdown of mortgage liabilities, like that of housingdescribed in Chapter 10, is based on slight evidence and must thereforebe used with caution. The levels of the postwar data are based on thesingle benchmark of the 1950 Housing Census and upon the fact thatone- to four-family housing is very largely owned by households.
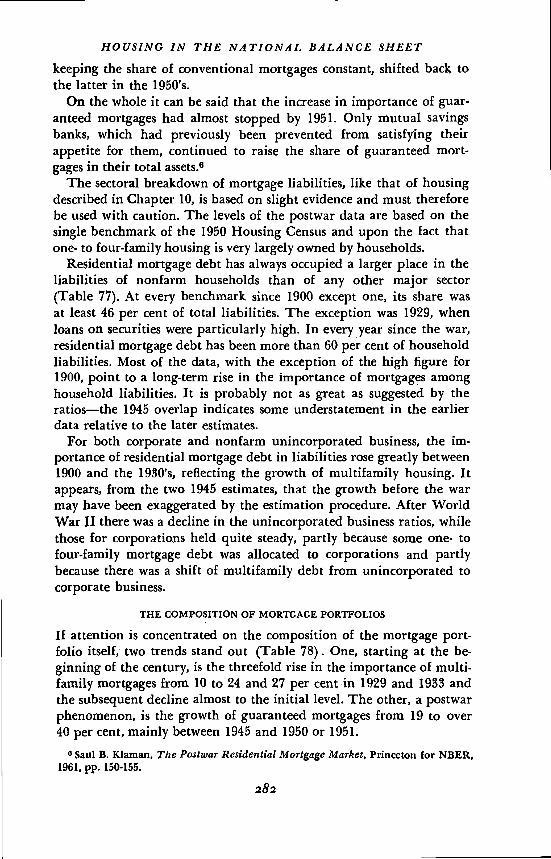
Residential mortgage debt has always occupied a larger place in theliabilities of nonfarm households than of any other major sector(Table 77). At every benchmark since 1900 except one, its share wasat least 46 per cent of total liabilities. The exception was 1929, whenloans on securities were particularly high. In every year since the war,residential mortgage debt has been more than 60 per cent of householdliabilities. Most of the data, with the exception of the high figure for1900, point to a long-term rise in the importance of mortgages amonghousehold liabilities. It is probably not as great as suggested by theratios—--the 1945 overlap indicates some understatement in the earlierdata relative to the later estimates.
For both corporate and nonfarm unincorporated business, the im-portance of residential mortgage debt in liabilities rose greatly between1900 and the 19S0's, reflecting the growth of multifamily housing. Itappears, from the two 1945 estimates, that the growth before the warmay have been exaggerated by the estimation procedure. After WorldWar II there was a decline in the unincorporated business ratios, whilethose for corporations held quite steady, partly because some one- tofour-family mortgage debt was allocated to corporations and partlybecause there was a shift of multifamily debt from unincorporated tocorporate business.
THE COMPOSITION OF MORTGAGE PORTFOLIOS
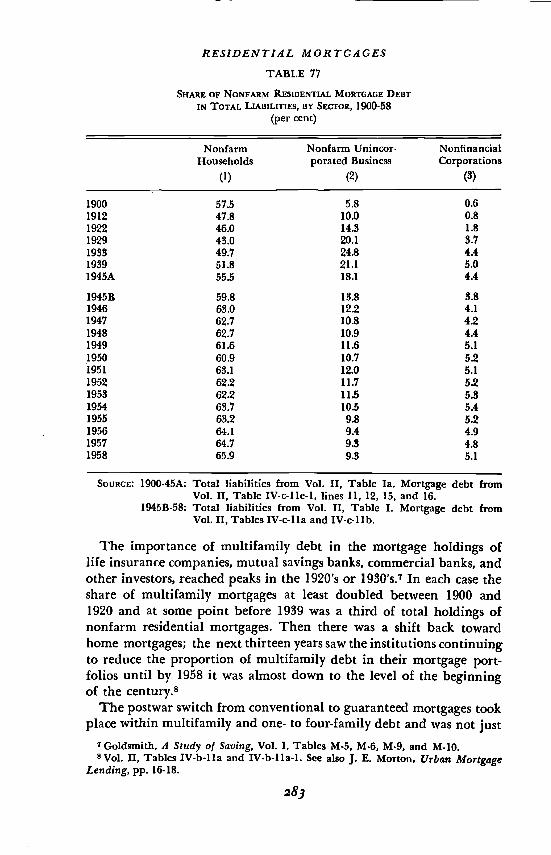
If attention is concentrated on the composition of the mortgage port-folio itself, two trends stand out (Table 78). One, starting at the be-ginning of the century, is the threefold rise in the importance of multi-family mortgages from 10 to 24 and 27 per cent in 1929 and 1933 andthe subsequent decline almost to the initial level. The other, a postwarphenomenon, is the growth of guaranteed mortgages from 19 to over40 per cent, mainly between 1945 and 1950 or 1951.
°Saul B Kiaman, The Postwar Residential Mortgage Market, Princeton for NBER,1961, pp. 150-155.
282
RESIDENTIAL MORTGAGES
TABLE 77
SHARE OF NONFARM RESIDENTIAL MORTGAGE DEBTIN TOTAL LIABILITIES, BY SECTOR, 1900-58
(per cent)
NonfarmHouseholds
(1)
Nonfarm Unincor-porated Business
(2)
NonfinancialCorporations
(3)
1900 57.5 5.8 0.61912 47.8 10.0 0.81922 46.0 14.3 1.81929 43.0 20.1 8.71933 49.7 24.8 4.41989 51.8 21.1 5.01945A 55.5 18.1 4.4
1945B 59.8 13.8 8.81946 63.0 12.2 4.11947 62.7 10.8 4.21948 62.7 10.9 4.41949 61.6 11.6 5.11950 60.9 10.7 5.21951 63.1 12.0 5.11952 62.2 11.7 5.21953 62.2 113 5.31954 63.7 10.5 5.41955 63.2 9.8 5.21956 64.1 9.4 4.91957 64.7 9.3. 4.81958 65.9 9.3 5.1
SOURCE: 1900-45A: Total liabilities from Vol. II, Table Ia. Mortgage debt fromVol. II, Table IV-c.lle-1, lines 11, 12, 15, and 16.
1945B-58: Total liabilities from Vol. II, Table I. Mortgage debt fromVol. II, Tables IV-c-lla and IV-c-lIb.
The importance of multifamily debt in the mortgage holdings oflife insurance companies, mutual savings banks, commercial banks, andother investors, reached peaks in the 1920's or 1930's.7 In each case theshare of multifamily mortgages at least doubled between 1900 and1920 and at some point before 1939 was a third of total holdings ofnonf arm residential mortgages. Then there was a shift back towardhome mortgages; the next thirteen years saw the institutions continuingto reduce the proportion of multifamily debt in their mortgage port-folios until by 1958 it was almost down to the level of the beginningof the century.8
The postwar switch from conventional to guaranteed mortgages tookplace within multifamilyand one- to four-family debt and was not just
Goldsmith, A Study of Saving, Vol. I, Tables M-5, M-6, M-9, and M-10.8Vol. II, Tables IV-blla and IV-b-lla-l. See also J. E. Morton, Urban Mortgage
Lending, pp. 16-18.
283
HOUSING iN THE NATIONAL BALANCE SHEETTABLE 78
PERCENTAGE DisriurniTloN RESIDENTIAL MORTGAGES OUTSTANDING, BY TYPE, 1900-60
Multifamily Mortgages.
1- to 4-Family MortgagesAll Nonf arm
Residential Mortgages
Total TotalConven- Conven- FHA Conven- FHA
Total tional FHA Total tional and VA tional and VA
1900 10.0 10.0 90.0 90.0 100.01912 16.0 16.0 84.0 84.0 100.01922 21.8 21.8 78.2 78.2 ioo.o1929 24.1 24.1 75.9 75.9 100.01933 271 27.1 72.9 72.9 100.01939 21.6 21.1 0.5 78.4 70.0 8.4 91.1 8.91945A 20.2 19.1 1.1 79.8 61.4 18.4 80.5 19.5
1945B 20.1 19.1 1.0 79.9 61.5 18.4 80.6 19.41946 18.0 17.3 0.8 82.0 60.3 21.7 77.5 22.51947 16.5 14.8 1.6 83.5 56.0 273 70.8 29.11948 16.0 13.1 2.9 84.0 52.5 31.5 65.6 34.41949 16.2 11.4 4.8 83.8 50.4 33.4 61.8 38.21950 15.7 9.7 6.0 84.3 49.1 35.2 58.8 41.21951 15.8 9.7 6.0 84.2 47.0 37.3 56.7 43.31952 15.1 9.4 5.7 84.9 48.1 36.8 57.5 42.51953 14.3 9.1 5.2 85.7 49.8 36.4 58.4 41.61954 13.2 83 4.7 86.8 50.0 36.8 58.5 41.51955 12.3 8.3 4.0 87.7 49.0 38.7 57.8 42.71956 11.7 8.2 8.5 88.3 49.2 39.2 57.4 42.71957 11.3 7.7 8.6 88.7 49.8 38.9 57.5 42.51958 113 7.8 3.8 88.5 50.8 37.7 58.6 41.51959 11.6 7.9 3.7 88.4 52.0 36.4 60.0 40.11960 11.8 8.2 3.7 88.2 52.9 35.2 61.1 38.9
SOURCE: 1900-45A: FHA mortgages, Grebler, Blank, and Winnick, Capital Forma-tion, p. 243. VA mortgages, Housing Statistics, April 1962, p. 60.Total mortgages, Vol. II, Tables IV-b-llc-1 through IV-b-llc-5.
1945B-60: Vol. II, Tables IVb-lIa through IV-b.lla-6. These were basedmainly on estimates by Kiaman (Volume of Mortgage Debt)and have been carried through 1960 using the methods de-scribed there.
a reflection of the decline in the former. Even while total multifamilymortgages were falling from 20 to 16 per cent of all mortgages between1945 and 1951, FHA-insured multifamily mortgages rose from 1 to 6per cent. After that they declined even faster than conventional mort-gages but were still almost a third of all multifamily mortgages in 1960.
The rise from 80 to 84 per cent between 1945 and 1951 in the shareof one- to four-family mortgages in the total nonf arm residential mort-gage debt was made up of a fall in the conventional share from 61.5 to47 per cent and a doubling of the guaranteed share which began at
284
RESIDENTIAL MORTGAGES
18.4 per cent. Thereafter the conventional mortgages regained someof the lost ground and again reached more than half of outstandinghome mortgages.
Switching into guaranteed mortgages took place mainly before 1951for every institution except the mutual savings banks. With the sameexception, there was then some shifting back into conventional mort-gages.9 All three of the institutions holding substantial portions oftheir mortgage portfolios in multifamily debt reduced that share.Only during the first few years, and only partially even then, were re-ductions in the share of conventional mortgages offset by increases inguaranteed multifamily mortgages.
Savings and loan associations owned virtually no multifamily mort-gages. The most marked feature of their distribution, aside from thefact that they have remained heavily concentrated in conventionalmortgages, was the sharp shift from conventional to guaranteed mort-gages in 1945-47 and the drift back to conventional since 1948.
Commercial banks increased the share of one- to four-family guaran-teed mortgages rapidly between 1945 and 1949, mainly by reducingthe importance of multifamily holdings. After 1951, however, theybegan shifting back to conventional home mortgages, first by reducingthe share of FHA multifamily and then, after 1956, by sharply cuttingdown the share of guaranteed home mortgages.
Life insurance companies raised their guaranteed one- to four-family mortgages from 34 to more than 50 per cent between 1945 and1951, decreasing the share of conventional home mortgages slightly,but reducing that of conventional multifamily debt from 34 to about15 per cent. Since 1951 they have substituted conventional home mort-gages for multifamily debt.
Mutual savings banks were the only group that increased its empha-sis on guaranteed mortgages constantly throughout the period. Theydid this through parallel reductions in conventional home and multi-family mortgages from a total of 90 per cent of their mortgage port-folio in 1945 to only a third in 1960. Until 1952 both home andmultifamily guaranteed mortgages increased their share in total hold-ings; after that, multifamily guaranteed and conventional mortgagesreceded. The rate of change in the composition of mortgage holdingshas slowed greatly since 1956.
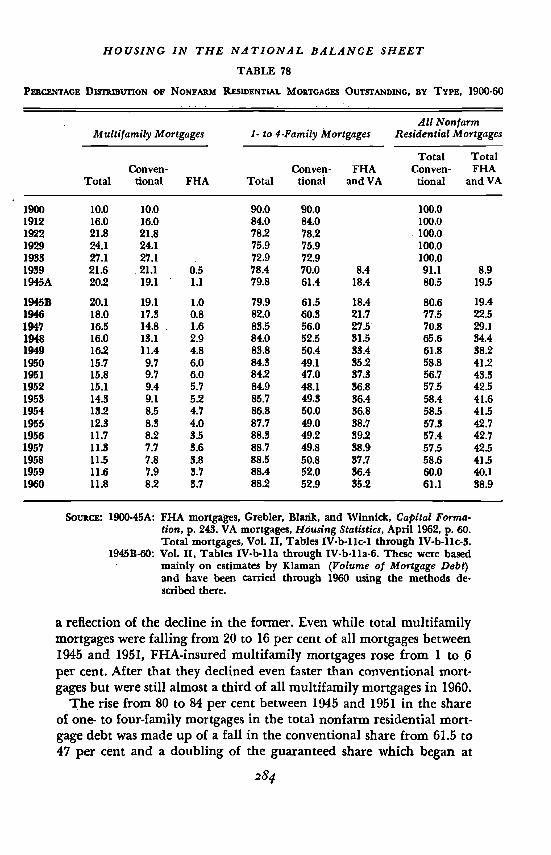
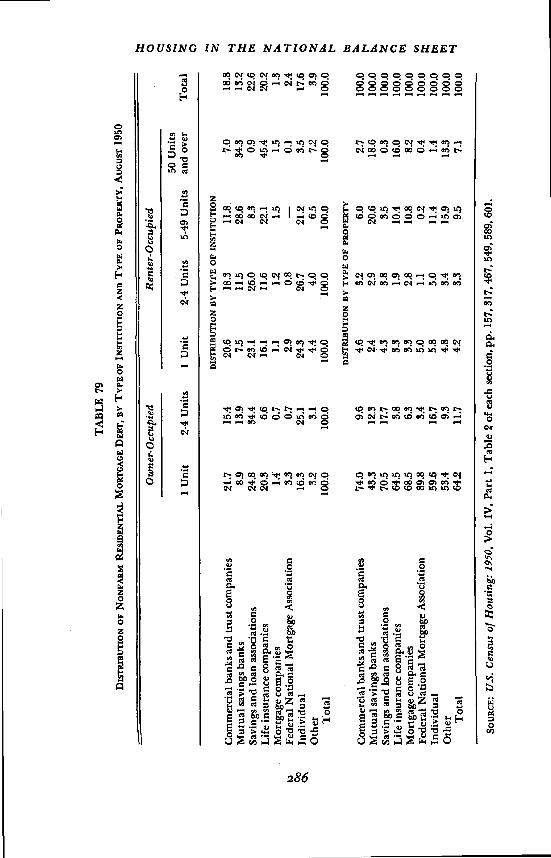
For one date, August 1950, some further information is availablefrom the Housing Census on the composition of mortgage portfolios(Table 79). The division between one- to four-family and multifamily
° Mortgage investment policies of the various financial institutions during thepostwar years are discussed more thoroughly in Chapter 6 of Kiaman's PostwarResidential Mortgage Market.
285
TA
BL
E 7
9
DIS
TR
IBU
TIO
N O
F N
ON
FAR
M K
MO
RT
GA
GE
DE
BT
, BY
TY
PE O
F IN
STIT
UT
ION
AN
D T
YPE
OF
PRoP
irry
, AU
GU
ST 1
950
0 C,, 0 N N t,1 C.,
t'*i
Ow
ner-
Occ
upie
dR
ente
r-O
ccup
ied
.
50 U
nits
1 U
nit
2-4
Uni
ts1
Uni
t2-
4 U
nits
5-49
Uni
tsan
d ov
erT
otal
DIS
TR
IBU
TIO
N B
Y T
YPE
OF
INST
ITU
TIO
N
Com
mer
cial
ban
ks a
nd tr
ust c
ompa
nies
21.7
15.4
20.6
18.3
11.8
.7.
018
.8
Mut
ual s
avin
gs b
anks
8.9
13.9
7.5
11.5
28.6
34.3
13.2
Savi
ngs
and
loan
ass
ocia
tions
24.8
34.4
23.1
26.0
8.3
0.9
22.6
Lif
e in
sura
nce
com
pani
es20
.36.
616
.111
.622
.145
.420
.2M
ortg
age
com
pani
es1.
40.
71.
11.
21.
51.
51.
3Fe
dera
l Nat
iona
l Mor
tgag
e A
ssoc
iatio
n3.
30.
72.
90.
8—
0.1
2.4
Indi
vidu
al16
.325
.124
.326
.721
.23.
517
.6O
ther
3.2
3.1
4.4
4.0
6.5
7.2
3.9
Tot
al10
0.0
100.
010
0.0
100.
010
0.0
100.
010
0.0
DIS
TR
IBU
11O
N B
Y T
YPE
OF
PRO
PER
TY
Com
mer
cial
ban
ks a
nd tr
ust c
ompa
nies
'74.
09.
64.
63.
26.
02.
710
0.0
Mut
ual s
avin
gs b
anks
43.3
12.3
2.4
2.9
20.6
18.6
100.
0Sa
ving
s an
d lo
an a
ssoc
iatio
ns70
317
.74.
33.
83.
50.
310
0.0
Lif
e in
sura
nce
com
pani
es64
.53.
83.
31.
910
.416
.010
0.0
Mor
tgag
e co
mpa
nies
68.5
6.3
3.3
2.8
10.8
8.2
100.
0Fe
dera
l Nat
iona
l Mor
tgag
e A
ssoc
iatio
n89
.83.
45.
01.
10.
20.
410
0.0
Indi
vidu
al59
.616
.75.
85.
011
.41.
410
0.0
Oth
er53
.49.
34.
88.
415
.919
.310
0.0
Tot
al64
.211
.74.
23.
393
7.1
100.
0
SouR
cE: U
.S. C
ensu
s of
Hou
sing
: 195
0, V
ol. I
V, P
art 1
, Tab
le 2
of
each
sec
tion,
pp.
157
, 317
, 467
, 549
, 589
, 601
.
RESIDENTIAL MORTGAGES
mortgages in this source agrees fairly well, although not perfectly, withthat shown in Table 78.
Of the 83 per cent of nonfarm residential mortgages which were onone- to four-family properties (84 per cent in Table 78), 76 per centwere on owner-occupied and 7.5 per cent were on rental properties.Slightly less than 70 per cent of total nonfarm residential mortgagedebt is on owner-occupied housing (or dwelling units), if account istaken of the fact that owner-occupied two- to four-unit properties arepartly rented. Despite the fact that one- to four-family structures ac-counted for more than two-thirds of the value of rental units (Table69), multifamily properties carried more than two-thirds of the rentalhousing mortgage debt.
Since most of rental housing debt is on multifamily properties, theinstitutions which invested heavily in the latter, such as mutual savingsbanks and life insurance companies, were the ones with a high pro-portion of their mortgage investments in rental properties. But therewas considerable variation within the structure and tenure types.Within one- to four-family mortgages, for example, mutual savingsbanks, savings and loan associations, and individuals put between afifth and a quarter of their investment into mortgages on two- to four-unit properties while life insurance companies and the FNMA con-fined themselves almost entirely to single-family structures. Individualsalso had a much larger part of their one- to four-family mortgage hold-ings in rental property mortgages than any of the other investors exceptthe "other" dass.
The distribution of rental property mortgages differed very widelyamong institutions. Mutual savings banks, life insurance companies,and mortgage companies concentrated more than three-quarters oftheir holdings on multifamily properties while savings and loan associ-ations and especially the FNMA held mortgages mainly on small rentalproperties. Individuals had almost half their rental housing mortgagesin five- to forty-nine-unit properties but virtually none in the largerstructures.10
DISTRIBUTION OF RESIDENTIAL MORTGAGES AMONG INVESTORS
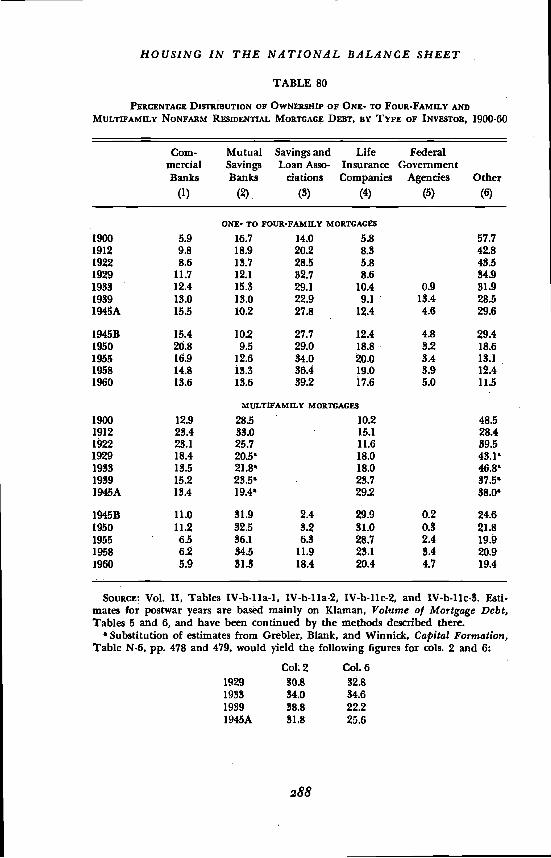
The outstanding trend in the ownership of mortgage debt over thepast sixty years has been its institutionalization. In 1900 more thanhalf of the outstanding one- to four-family residential mortgage debtwas held outside of the main lending institutions, almost entirely byindividuals (Table 80). By 1958 the holdings of the nonfarm house-
on other aspects of the composition of mortgage holdings by type, from theNBER survey of urban mortgage lending, appear in Morton, Urban MortgageLending. pp. 73-75.
287
HOUSiNG IN THE NATiONAL BALANCE SHEET
TABLE 80
PERCENTAGE DISTRIBUTION OF OWNERSHIP OF ONE- TO FOUR-FAMILY ANDMULTIFAMILY NONFARM RESIDENTIAL MORTGAGE DEBT, BY TYPE OF INVESTOR, 1900-60
Corn- Mutual Savings and Life Federalmercial Savings Loan Asso- Insurance GovernmentBanks Banks ciations Companies Agencies Other
(1) (2) (3) (4) (5) (6)
ONE- TO FOUR-FAMILY MORTGAGES
1900 5.9 16.7 14.0 5.8 57.71912 9.8 18.9 20.2 8.3 42.81922 8.6 13.7 28.5 5.8 48.51929 11.7 12.1 32.7 84.91933 12.4 15.3 29.1 10.4 0.9 31.91989 13.0 13.0 22.9 9.1 13.4 28.51945A 15.5 10.2 27.8 12.4 4.6 29.6
1945B 15.4 10.2 27.7 12.4 4.8 29.41950 2O.8 9.5 29.0 18.8 8.2 18.61955 16.9 12.6 34.0 0.0 3.4 13.11958 14.8 18.3 36.4 19.0 3.9 12.41960 13.6 13.6 39.2 17.6 5.0 11.5
MULTIFAMILY MORTGAGES
1900 12.9 28.5 10.2 48.51912 23.4 83.0 15.1 28.41922 23.1 25.7 11.6 89.51929 18.4 20.5' 18.0 43.1'1933 13.5 21.8' 18.0 46.8'1939 15.2 23.5' 23.7 37.5'1945A 13.4 19.4' 29.2 88.0'
1945B 11.0 31.9 2.4 29.9 0.2 24.61950 11.2 32.5 8.2 81.0 0.8 21.81955 6.5 36.1 6.3 28.7 2.4 19.91958 6.2 34.5 11.9 23.1 3.4 20.91960 5.9 31.8 18.4 20.4 4.7 19.4
SOURCE: Vol. II, Tables IV-b-lla-1, IV-b-Ila-2, IV-b-llc-2, and IV-b-lIc-8, Esti-mates for postwar years are based mainly on Kiaman, Volume of Mortgage Debt,Tables 5 and 6, and have been continued by the methods described there.
'Substitution of estimates from Grebler, Blank, and Winnick, Capital Formation,Table N-6, pp. 478 and 479, would yield the following figures for cols. 2 and 6:
Col 2 Cot. 61929 30.8 32.81933 34.0 34.61939 38.8 22.21945A 31.8 25.6
288

RESIDENTIAL MORTGAGES
hold sector had dwindled to less than 10 per cent.'1 The four majormortgage lenders—commercial and mutual savings banks, savings andloan associations, and life insurance companies—increased their sharefrom 42 per cent in 1900 to 84 per cent in 1960.12
Within the growing institutional share of home mortgage holdings,there were substantial shifts among the four main lenders. All exceptmutual savings banks increased their shares between 1900 and 1960.Commercial banis went into one- to four-family mortgages vigorouslybefore the war and for a few years after, their share growing throughthe late 1940's and then falling. The share of life insurance companiesrose steadily to a peak of 20 per cent in the early 1950's and has de-dined since then. The mutual savings banks' proportion, highest of allthe lenders' in 1900, fell to less than 10 per cent for several years afterthe war and then started to rise just when the commercial banks' sharebegan declining. Savings and loan associations have been the leading
frequently owning twice the share of any other type of institu-tion. By 1960 they held almost 40 per cent of the home mortgage debt.
The history of the financing of multifamily mortgage debt is not asdear because there are considerable differences among estimates of in-stitutions' holdings. But both the sources mentioned in Table 80agree that noninstitutional holdings dwindled in importance between1988 and 1960.18 The role of commercial banks was at .its peak veryearly, just before and after World War I, when they held almost aquarter of the multifamily debt; now their share is below 6 per cent.Life insurance companies increased their share until 1950 and thencut it back. The postwar years have seen the growth of two newsources of financing: savings and loan associations, whose share jumpedfrom 2 to 18 per cent,'4 and the federal government, which rose to 5per cent.
For both types of mortgages, the early 1950's were a turning point,marking the beginning of a decline in participation by commercialbanks and insurance companies and a rise in the importance of thetwo main savings
11Vo1. II, Table IV-b-lla-2.12 See Grebler, Blank, and Winnick, Capital Formation, pp. 192 if., for a discu8-
sion of some of the reasons for this shift in ownership. One of these, the ineligi-bility of noninstitutional lenders under the FHA program, has since been removed.
13Grebler,. Blank, and Winnick suggest, furthermore, that the estimating pro-cedure understates the shift to institutional ownership of mortgages (CapitalFormation, p. 192).
14 rise in the value of savings and loan association holdings of multifamilymortgages appears suspiciously rapid. Since the method of estimation is indirect, itis possible that part of the rise may result from an understatement of the growthof nonresidential mortgages, which have been assumed to form a constant part ofthe mortgage portfolio. See Kiaman, Volume of Mortgage Debt, Table 16.
The history of participation in the nonfarm residential mortgage market byseveral types of financial institutions is reviewed in Grebler, Blank, and Winnick,
HOUSING IN TEE NATIONAL BALANCE SHEET
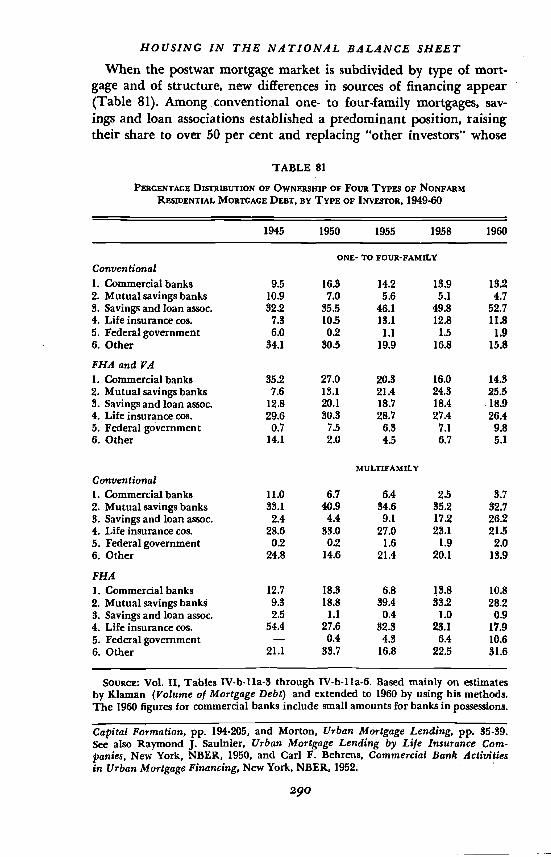
When the postwar mortgage market is subdivided by type of mort-gage and of structure, new differences in sources of financing appear(Table 81). Among conventional one- to four-family mortgages, sav-ings and loan associations established a predominant position, raisingtheir share to over 50 per cent and replacing "other investors" whose
TABLE 81
PERCENTAGE DISTRIBUTION OF OWNERSHIP OF FOUR TYPES OF NONFARMRESIDENTIAL MORTGAGE DEBT, BY TYPE OP INVESTOR, 1949-60
1945 1950 1955 1958 1960
ONE- TO FOUR-FAMILYConventional1. Commercial banks 9.5 16.3 14.2 13.9 1322. Mutual savings banks 10.9 7.0 5.6 5.1 4.73. Savings and loan assoc. 32.2 35.5 46.1 49.8 52.74. Life insurance cos. 7.3 10.5 13.1 12.8 11.85. Federal government 6.0 0.2 1.1 1.5 1.96. Other 34.1 30.5 19.9 16.8 15.8
FHA and VA1. Commercial banks 35.2 27.0 20.3 16.0 14.32. Mutualsavingsbanks 7.6 13.1 21.4 24.3 25.53. Savings and loan assoc. 12.8 20.1 18.7 18.4 18.94. Life insurance cos. 29.6 30.8 28.7 27.4 26.45. Federal government 0.7 7.5 6.3 7.1 9.86. Other 14.1 2.0 4.5 6.7 5.1
MULTIFAMILY
Conventional1. Commercial banks 11.0 6.7 6.4 2.5 3.72. Mutual savings banks 33.1 40.9 84.6 35.2 82.73. Savings and loan assoc. 2.4 4.4 9.1 17.2 .26.24. Life insurance cos. 28.6 33.0 27.0 23.1 2135. Federal government 0.2 0.2 1.6 1.9 2.06. Other 24.8 14.6 21.4 20.1 13.9
FHA1. Commercial banks 12.7 18.3 6.8 13.8 10.82. Mutualsavingsbanks 9.3 18.8 39.4 38.2 28.2S. Savings and loan assoc. 2.5 1.1 0.4 1.0 0.94. Life insurance cos. 54.4 27.6 32.3 23.1 17.95. Federal government — 0.4 4.3 6.4 10.66. Other 21.1 83.7 16.8 22.5 31.6
SOURcE: Vol. II, Tables IV-b-lIa-3 through IV-b-lla-6. Based mainly on estimatesby Klaman (Volume of Mortgage Debt) and extended to 1960 by using his methods.The 1960 figures for commercial banks include small amounts for banks in possessions.
Capital Formation, pp. 194-205, and Morton, Urban Mortgage Lending, pp. 35.39.See also Raymond J. Saulnier, Urban Mortgage Lending by Life Insurance Com-panies, New York, NBER, 1950, and Carl F. Behrens, Commercial Bank ActivitIesin Urban Mortgage Financing, New York, NBER, 1952.
290
RESIDENTIAL MORTGAGES
share was cut by half. Less important declines in mutual savings banks'and the federal government's shares were taken up by commercialbanks and life insurance companies. Among guaranteed home mort-gages, it was mainly the commercial banks whose share was cut sharplywhile mutual savings banks tripled theirs. Increases were registeredalso by savings and loan associations and the federal government,while "other investors," as in the case of conventional mortgages, lostground.
Both commercial banks and other investors declined as holders ofmultifamily conventional loans and their places were taken by savingsand loan associations and the federal government. The less importantcategory of insured multifamily mortgages, of which more than halfwas held by life insurance companies in 1945 and less than a quarter in1958, shifted to a considerable extent to mutual savings banks and thefederal government.
Table 79 again supplies additional information on the structure offinancing. Life insurance companies (45.4 per cent) and mutual sav-ings banks per cent) almost monopolized mortgages on proper-ties of fifty or more units. Individuals and savings and loan associationsheld 29.5 per cent of loans on properties of five to forty-nine units butonly 4.4 per cent of those on the larger ones.
Debt-to-Asset Ratios for Housing
AGGREGATE DEBT-TO-VALUE RATIOS
Mortgages, unlike most forms of debt, are tied not only to the sectorswhose liabilities they are but also to specific tangible assets. It is truethat funds raised through mortgage debt can be used for purposesother than housing and that forms of borrowing other than mortgagescan be used for the purchase of houses. But a residential mortgage can-not be secured without the existence of housing assets and the majorityof real estate transfers involve a flow of mortgage funds. Thus thematching of housing assets with mortgage liabilities is a more meaning-ful procedure than most comparisons of assets with specific liabilities.
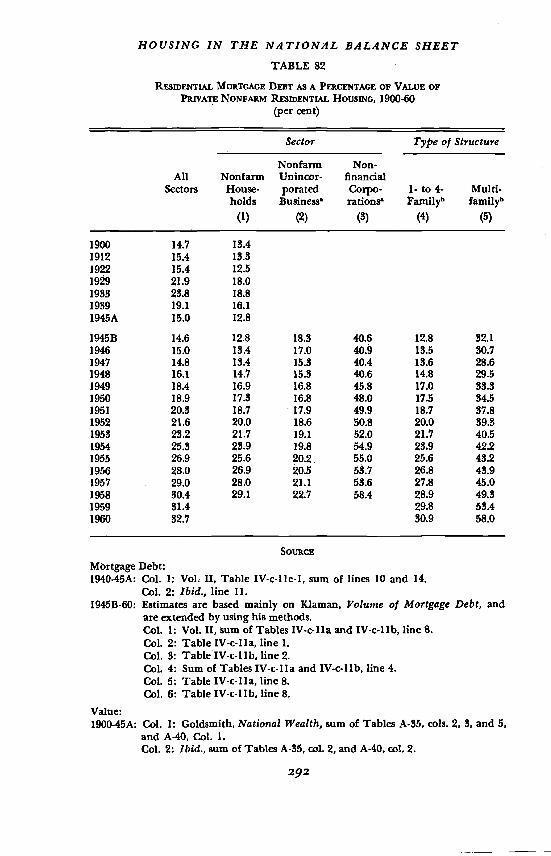
The proportion of the value of housing covered by mortgage debthas been higher in the last few years than at any previous time in ourrecords (Table 82). Similar calculations by Grebler, Blank, andWinnick1° indicate that they are the highest in a seventy-year periodextending back to 1890, and that even the low point in the ratio afterWorld War II was considerably higher than some of those beforeWorld War I. Despite the very wide fluctuations, then, there are mdi.cations of a rising trend in the extent to which housing is mortgaged.
'° Capital Formation, pp. 167-169 and Appendix Table L-6.
29%
HOUSING IN THE NATIONAL BALANCE SHEET
TABLE 82
RESIDENTIAL MORTGAGE AS A PERCENTAGE OF VALUE OFPRIVATE NONFARM RESIDENTIAL HOUSING. 1900-60
(per cent)
Sector Type of Structure
Nonfarm Non-All Nonfarm Unincor- financial
Sectors House- porated Corpo- 1- to 4- Multi-holds Businessa Familyb familyb
(1) (2) (5) (4) (5)
1900 14.7 13.41912 15.4 13.31922 15.4 12.51929 21.9 18.01933 23.8 18.81939 19.1 1611945A 15.0 12.8
1945B 14.6 12.8 18.3 40.6 12.8 32.11946 15.0 13.4 17.0 40.9 13.5 30.71947 14.8 13.4 15.3 40.4 13.6 28.61948 16.1 14.7 15.3 40.6 14.8 29.51949 18.4 16.9 16.8 45.8 17.0 33.31950 18.9 17.3 16.8 48.0 17.5 34.51951 20.3 18.7 17.9 49.9 18.7 37.81952 21.6 20.0 18.6 50.8 20.0 39.51953 23.2 21.7 19.1 52.0 21.7 40.51954 25.3 23.9 19.8 54.9 23.9 42.21955 26.9 25.6 20.2. 55.0 25.6 43.21956 28.0 26.9 20.5 53.7 26.8 43.91957 . 29.0 28,0 21.1 53.6 27.8 45.01958 80.4 29.1 22.7 58.4 28.9 49.31959 31.4 29.8 53.41960 32.7 30.9 58.0
SOURcE
Mortgage Debt:1940-45A: Col. 1: Vol II, Table IV-c-lle-1, sum of lines 10 and 14.
Col. 2: Ibid., line 11.1945B-60: Estimates are based mainly on Kiaman, Volume of Mortgage Debt, and
are extended by using his methods.Col. 1: Vol. II, Sum of Tables IV-c-Ila and line 8.Col. 2: Table IV-c-lIa, line 1.Col. 3: Table IV-c-llb, line 2.Col. 4: Sum of Tables IV-c-lla and IV-c-llb, line 4.Col. 5: Table LV-c-lla, line 8.Col. 6: Table IV-c-llb, line 8.
Value:1900-45A: Col. 1: Goldsmith, National Wealth, sum of Tables A-35, cols. 2. 3, and 5,
and A-40, Col. 1.Col. 2: Ibid., sum of Tables A-35, col. 2, and A-40, col. 2.
292

RESIDENTIAL MORTGAGES
SOURCE TO 82 (concluded)1945B-58: Table 67.
Cal. 1: Lines 1 and 8.Col. 2: Lines 4 and 5.Col. 3: Lines 13 and 14.Col. 4: Lines 6, 7, 11, and 12.Col. 5: Line 1.Col. 6: Line 8.
These ratios were not computed for 1900-45A because the estimated distributionof mortgage debt between corporate and unincorporated business, based on Gold-smith, A Study of Saving, Vol. 1, Table does not appear to be compatible withthe distribution of residential structures from Goldsmith, The National Wealth ofthe United States in the Postwar Period, Princeton for NBER, 1962, Table A-39.
b Not available for 1900-45A.
Swings in the debt-to-value ratio have appeared to follow the mover.ments of long building cycles, rising rapidly in the 1920's and thepostwar period and falling during the 1930's and early 1940's. Themovements of the series are quite similar to those of the share. of mort-gages in total liabilities (Table 74).
It is apparent that high rates of building tend to raise the aggregatedebt-to-value ratio. This is presumably because they add to the housingstock a large number of new units, of which a high proportion aremortgaged and on which the debt-to-value ratios are much higherthan on old houses. But it is also clear that the building rate is not theonly influence, for the debt ratio rose sharply from 1929 to 1933 whenthere was little new construction. In that period the rise was a result ofa decline in house prices—the only substantial decline in our record.
Grebler, Blank, and Winnick note that a puzzling feature of thetrend is the failure of the debt ratio to rise in the long period beforeWorld War I. There was a considerable increase in the proportion ofowner-occupied houses mortgaged and, at least between 1890 and1920, a small rise in the debt ratio for mortgaged houses. It is con-ceivable that there were offsetting changes in rental housing. Or, as theauthors suggest,'7 this may be a statistical The 1890 mortgagelevel, and thus the 1890 debt-to-value ratio, may have been overstated.And an overestimate of the 1920 housing stock may have caused anunderstatement of the 1920 debt ratio. If their suggestions are correct,there has been an even greater long-term upward trend in the debtratios than the data show.
The postwar rise in the ratio of mortgage debt to value took placein the face of roughly a doubling of construction costs. The previouslarge increases in the debt ratio had been in 1922-29, when prices roseoriiy moderately while the building rate was high, and in 1929-33 whenprices fell.
pp. 168-169.
293
HOUSING IN THE NATIONAL BALANCE SHEET
Part of the explanation for the postwar increase is that the effect ofprice changes and repayments, which tend to reduce the debt ratio onexisting houses, was swamped by the effect of the high rate of new con-struction, which tends to raise it. The other factor was that owners ofold houses, as a group, realized some of the capital gains arising fromprice increase by raising their mortgage indebtedness.
The evidence on this point is fragmentary because little is knownabout the proportion of gross mortgage flows which are for newhouses. Using any of the estimates quoted later in this paper, it isclear that in two of the years of large capital gains, 1946 and thenet increase in nonfarm residential debt on one- to four-family struc-turés was greater than gross lending on new construction. Thus, inthese two years at least, owners of existing houses were increasing theirmortgage In later years the picture is obscured by differencesamong the estimates of mortgage lending on new construction. Butthere were always large gross additions to debt on existing houses andthese always exceeded partial—presumably voluntary—prepayments.However, they were rarely greater than the sum of prepayments andamortization.
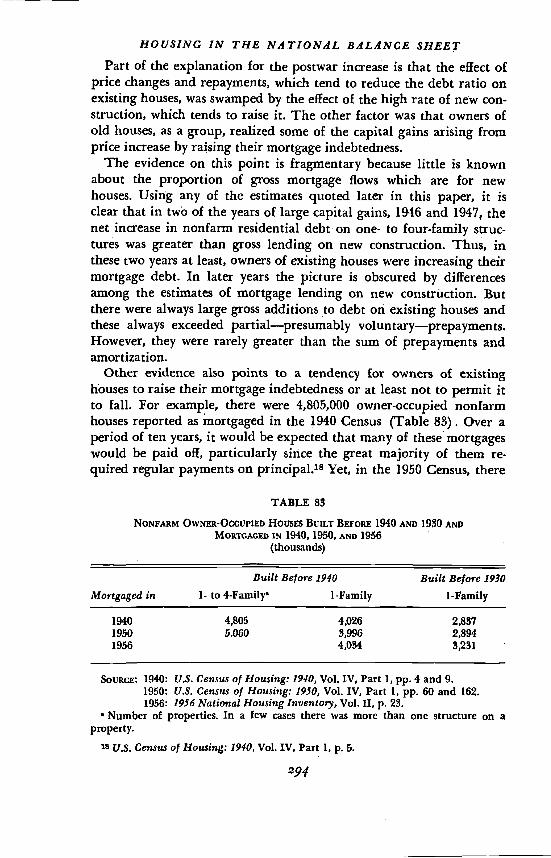
Other evidence also points to a tendency for owners of existinghouses to raise their mortgage indebtedness or at least not to permit itto fall. For example, there were 4,805,000 owner-occupied nonfarmhouses reported as mortgaged in the 1940 Census (Table 83). Over aperiod of ten years, it would be expected that many of these' mortgageswould be paid off, particularly since the great majority of them re-quired regular payments on principal.'8 Yet, in the 1950 Census, there
TABLE 85
NONFARM OWNZR-OCCUPIED HousEs BUILT 1940 AND 1930 ANDMOKTGAGED IN 1940, 1950, AND 1956
(thousands)
Mortgaged in 1- to
Built Before 1910
iFamilyBuilt Before 1930
1-Family
1940 4,805 4,026 2,8371950 5.060 S,996 2,8941956 4,034 3,231 '
1940: U.S. Census of Housing: 1940, Vol. IV, Part 1, pp. 4 and 9.1950: U.S. Census of Housing: 1950, Vol. IV, Part 1, pp. 60 and 162.1956: 1956 National Housing Inventory, Vol. II, p. 23.
Number of properties. In a few cases there was more than one structure on aproperty.
18 U.S. Census of Housing: 1910, Vol. IV, Part 1, p. 5.
294
RESiDENTIAL MORTGAGES
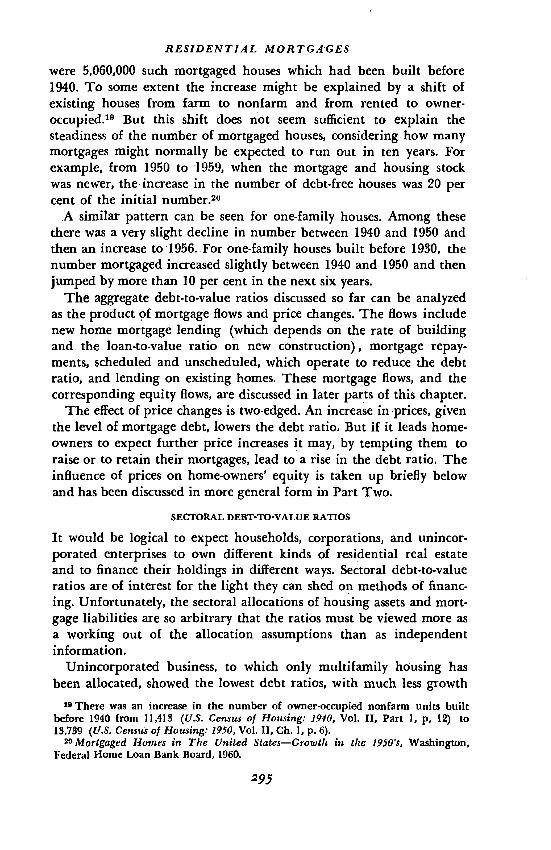
were 5,060,000 such mortgaged houses which had been built before1940. To some extent the increase might be explained by a shift ofexisting houses from farm to nonfarm and from rented to owner-occupied.'9 But this shift does not seem sufficient to explain thesteadiness of the number of mortgaged houses, considering, how manymortgages might normally be expected to run out in ten years. Forexample, from 1950 to 1959, when the mortgage and housing stockwas newer, the increase in the number of debt-free houses was 20 percent of the initial number.2°
A similar pattern can be seen for one-family houses. Among thesethere was a very slight decline in number between 1940 and 1950 andthen an increase to '1956. For one-family houses built before 1930, thenumber mortgaged increased slightly between 1940 and 1950 and thenjumped by more than 10 per cent in the next six years.
The aggregate debt-to-value ratios discussed so far can be analyzedas the product of mortgage flows and price changes. The flows includenew home mortgage lending (which depends on the rate of buildingand the loan-to-value ratio on new construction), mortgage repay-ments, scheduled and unscheduled, which operate to reduce the debtratio, and lending on existing homes. These mortgage flows, and thecorresponding equity flows, are discussed in later parts of this chapter.
The effect of price changes is two-edged. An increase in prices, giventhe level of mortgage debt, lowers the debt ratios But if it leads home-owners to expect further price increases it may, by tempting them toraise or to retain their mortgages, lead to a rise in the debt ratio. Theinfluence of prices on home-owners' equity is taken up briefly belowand has been discussed in more general form in Part Two.
SECTORAL DEBT-TO-VALUE RATIOS
It would be logical to expect households, corporations, and unincor-porated enterprises to own different kinds of residential real estateand to finance their holdings in different ways. Sectoral debt-to-valueratios are of interest for the light they can shed on methods of financ-ing. Unfortunately, the sectoral allocations of housing assets and mort-gage liabilities are so arbitrary that the ratios must be viewed more asa working out of the allocation assumptions than as independentinformation.
Unincorporated business, to which only multifamily housing hasbeen allocated, showed the lowest debt ratios, with much less growth
was an increase in the number of owner-occupied nonfarm units builtbefore 1940 from 11,413 (U.S. Census of Housing: 1910, Vol. II, Part 1, p. 12) to13,739 (U.S. Census of Housing: 1950, Vol. H, Ch. 1, p. 6).
20Mortgaged Homes in The United States—Growth in the 1950's, Washington,Federal Home Loan Bank Board, 1960.
295

HOUSING IN THE NATIONAL BALANCE SHEET
in the ratio than households, and, in fact, a decline for several years.Corporate-owned real estate, including both homes and multifamilystructures, carried the heaviest debt, .but the increase was fairly slowexcept during the 1948-50 spurt in multifamily construction. Theseyears were characterized by very high debt ratios on some new apart-ment buildings including, according to later charges, cases where thedebt was greater than the cost. The low rate of increase in the debtratio for noncorporate housing compared to corporate may be due tothe fact that the additions to multifamily housing tended to be in thecorporate sector, increasing the proportion of new housing there.
On the whole, the sectoral debt-to-value ratios seem to bear a sensiblerelationship to those by type of housing in the same table. Nonfärmhouseholds follow the ratios for one- to four-family housing very closelyand corporations' ratios are similar to, but somewhat higher than,those for multifamily housing. Only the noncorporate ratio appearssuspiciously low, considering that this sector holds only multifamilyproperties. The age of the houses in this sector and the fact that non-corporate holdings tend to be in the five- to forty-nine-unit dass andcorporation properties in the class •of fifty units and over can becited as possible reasons for the low ratios.: As will be seen later, it is thestructures of fifty units and over which pull up the debt ratios formultifamily housing. Structures of five to forty-nine units have debtratios much like those of one to four units.
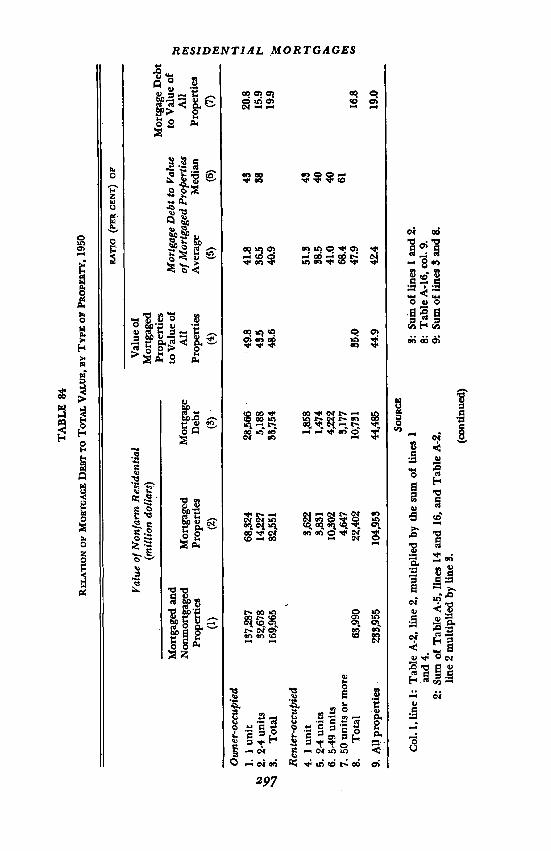
Debt-to-value ratios for various types of owner-occupied and rentalhousing can be derived only for 1950 (Table 84). The debt burden(the ratio of debt to the total value of properties) is heaviest on owner-occupied one-family houses and lightest on owner-occupied two- tofour-family structures, with rental property in between.21
These ratios are the outcome of two opposing factors. On mortgagedproperties alone, the debt burden is higher on rental than on owner-occupied properties, mainly because mortgaged properties of fifty unitsor more carry such a high rate of indebtedness. What lifts the debtratio for owner-occupied properties in the aggregate is the large propor-tion of them which are mOrtgaged—almost 50 per cent in value termscompared to per cent Of rental properties. Since one would expecta greater proportion mortgaged among multifamily properties thanamong smaller rental properties, these findings suggest that only a
21 debt-to-value ratios in Table 84 are not strictly comparable with those inTable 82 because the census values of tangible assets used here differ from theperpetual inventory values used elsewhere in thiS volume (see Table 66). Theperpetual inventory estimates are relatively higher for multifamily structures, im-plying even lower debt-to-value ratios for rental housing than those shown inTable 84.
296
TA
BL
E 8
4
RE
LA
TIO
N O
F M
OR
TG
AG
E D
EB
T T
O T
OT
AL
VA
LU
E, B
YO
F PR
OPE
RT
Y, 1
950
CoL
1, l
ine
1: T
able
A-2
, lin
e 2,
mul
tiplie
d by
the
sum
of
lines
1an
d 4.
2: S
um o
f T
able
A-5
, lin
es 1
4 an
d 16
, and
Tab
le A
-2,
line
2 m
ultip
lied
by li
ne 3
.(c
ontin
ued)
3: S
um o
f lin
es I
and
2.
8: T
able
A-1
6, a
ol. 9
.9:
Sum
of l
ines
3 an
d 8.
of N
onfa
rm R
esid
entia
l
RA
TIO
(pe
a C
EN
T)
OF
Val
ueV
alue
of
(mill
ion
dolla
rs)
Mor
tgag
edPr
oper
ties
to V
alue
of
Mor
tgag
e D
ebt t
o V
alue
Mor
tgag
e D
ebt
to V
alue
of
Mor
tgag
ed a
ndN
onm
orig
aged
Mor
tgag
edM
ortg
age
All
of M
ortg
aged
Pro
pert
ies
All
Prop
ertie
sPr
oper
ties
Deb
tPr
oper
ties
Ave
rage
Med
ian
Prop
ertie
s(1
)(2
)(8
)(4
)(5
)(6
)(7
)
Ow
ner-
occu
pied
1.1
unit
2. 2
-4 u
nits
3.T
otal
Ren
ter-
occu
pied
4.1
unit
5. 2
-4 u
nits
6. 5
-49
units
7. 5
0 un
its o
r m
ore
8.T
otal
9. A
l pro
pert
ies.
137,
287
32,6
7816
9,96
5
63,9
90
233,
955
68,3
2414
,227
82,5
51
3,62
23,
831
10,8
024,
647
22,4
02
104,
953
28,5
665,
188
33,7
54
1,85
81,
474
4,22
23,
177
10,7
31
44,4
85
49.8
43.5
48.6
85.0
44.9
20.8
15.9
N19
.9
0 0 C,
16.8
41.8
86.5
40.9
51.3
383
41.0
68.4
47.9
42.4
48 88 43 40 40 61
SO
UR
CE
19.0

HOUSING IN THE NATIONAL BALANCE SHEETSOURCE TO TABLE 84 (concluded)
Col. 2, line 1: Table B-i, line 1.2: Table A-5, line 4.3: Sum of lines 1 and 2.
4-8: These values are estimated in several steps: (a) Number of dwellingunits, by size of property, from various tables in U.S. Census of Hous-ing: 1950, Vol. IV, Part 1. (Total, p. XVI, Table A; 1 unit, p.. 467; 2-4units, p. 554; 5 units and over, total above minus units in 1- to 4.unitproperties.) The distribution by property size (number of units in prop-erty) of the units in properties of 5 units and over was estimated bymultiplying the number of properties in each size class by the midpointof the class and then adjusting these figures to add to the Census totalfor properties of 5 units and over (above). (b) &ent per unit,: medianrents, from U.S. Census of Housing: 1950 (Vol. IV, Part 1, pp. 474, 557,596, and 607) multiplied by the mean-to-median ratio (1.10335) fromTable A-Il. (c) Total value: the total rent in each size class (numberof units multiplied by rent per unit) is multiplied by the ratio of valueto rent for that class (Table A-16, notes to cots. S and 7).
9: Sum of lines 3 and 8.Col. 3: US. Census of Housing: 1950, Vol. IV, Part 1, from Table 1 of each section.Col. 4: Col. 2 divided by col. 1.Col. 5.: Col. 3 divided by col. 2.Col. 6: U.S. Census of Housing: 1950, Vol. IV, Part I, from Table 3 of each section.Col. 7: Col. 3 divided by col. 1.
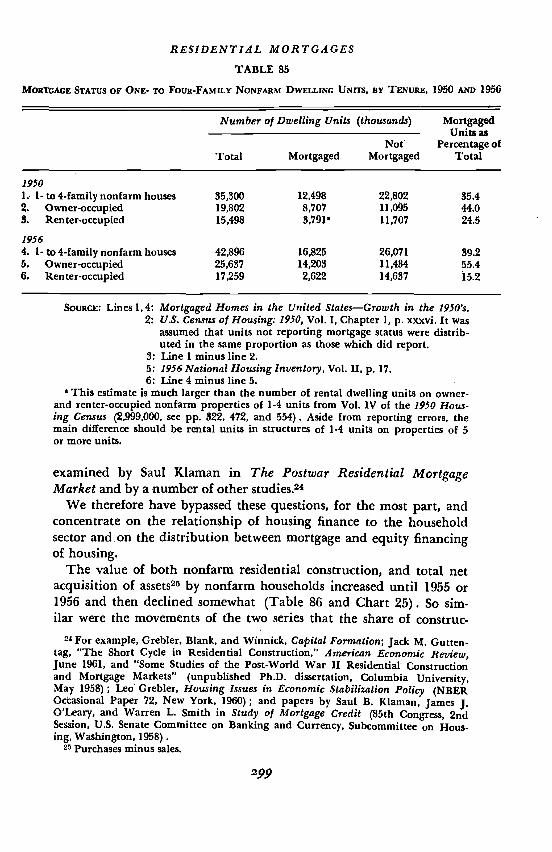
small proportion of one- to four-unit rental properties are mortgaged.Some data on number of units by mortgage status confirm the im-
pression that a high proportion of one- to four-unit rental propertiesare debt free (Table 85). Less than a quarter of such units had mort-gage debts in 1950, compared with almost 44 per cent of owner-occupiedunits. In 1956 the difference was even greater: 15 per cent on rentalproperties against 55 per cent on owner-occupied units.
An annual . series for mortgage debt on owner-occupied nonfarmhomes is estimated in Appendix Table B-3, col. 2. Compared with thecorresponding home values,22 it shows a gradual rise in the debt ratiofrom 13 per cent in 1945 to 33 per cent in 1960. The ratio for one- tofour-family rental properties plus vacant units23 is lower in everyyear and rises more slowly, from 12 per cent in 1945 to 21 per cent in1960.
Net Flows of Housing Funds in the Postwar Period
Many aspects of postwar residential housing finance, such as the effectsof government policy on the flow of mortgage funds, the distributionof financing among fund supplying institutions, and changes in theinvestment policies of banks and other financing agencies, have been
Table 69, lines 1 and 5.Debt from Table B-S. col. 1 minus col. 2; value from Table 69, lines 6, 7, and 8.
298
RESIDENTIAL MORTGAGES
TABLE 85
MORTGAGE STATUS OF ONE- TO FOUR-FAMILY NONFARM DWELLING UNITS, BY 1950 AND 1956
Number of Dwelling Units (thousands) MortgagedUmtsas
Percentage ofNotTotal Mortgaged Mortgaged Total
19501.. 1- to 4-family nonfarin houses 35,300 12,498 22,802 35.42. Owner-occupied 19,802 8,707 11,095 4403. Renter-occupied 15,498 3,79j* 11,707 24.5
19564. 1- to 4-family nonfarm houses 42,896 16,825 26,071 39.25. Owner-occupied6. Renter-occupied
25,63717,259
14,2032,622
11,43414,637
55.415.2
SouRcE: Lines 1,4: Mortgaged Homes in the United States—Growth in the 1950's.2: U.S. Census of Housing: 1950, Vol. 1, Chapter 1, p. xxxvi. It was
assumed that units not reporting mortgage status were distrib-uted in the same proportion as those which did report.
3: Line 1 minus line 2.5: 1956 National Housing Inventory, Vol. II, p. 17.6: Line 4 minus line 5.
1 This estimate is much larger than the number of rental dwelling units on owner-and renter-occupied nonfarm properties of 1-4 units from Vol. IV of the 1950 Hous-ing Census (2,999,000, see pp. 322, 472, and 554). Aside from reporting errors, themain difference should be rental Units in structures of 1-4 units on properties of 5or more units.
examined by Saul Kiaman in The Postwar Residential MortgageMarket and by a number of other studies.24
We therefore have bypassed these questions, for the most part, andconcentrate on the relationship of housing finance to the householdsector andon the distribution between mortgage and equity financingof housing.
The value of both nonfarm residential construction, and total netacquisition of assets25 by nonfarm households increased until 1955 or1956 and then declined somewhat (Table 86 and Chart 25). So sim-ilar were the movements of the two series that the share of construc-
24 For example, Grebler, Blank, and Winnick, Capital Formation; Jack M. Gutten-tag, "The Short Cycle in Residential Construction," American Economic Review,June 1961, and "Some Studies of the Post-World War II Residential Constructionand Mortgage Markets" (unpublished Ph.D. dissertation, Columbia University,May 1958); Leo Grebler, Housing Issues in Economic Stabilization Policy (NBEROccasional Paper 72, New York, 1960); and papers by Saul B. Kiaman, James J.O'Leary, and Warren L. Smith in Study of Mortgage Credit (85th Congress, 2ndSession, U.S. Senate Committee on Banking and Currency, Subcommittee on Hous-ing, Washington, 1958).
25 Purchases minus sales.

HOUSING iN THE NATIONAL BALANCE SHEETTABLE 86
FLOW OF FUNDS INTO NÔNPARM RESIDENTIAL 1946-60(billion dollars)
Net Mortgage
Net EquiEy Flows
Excluding IncludingTotal Flows Land Land
(1) (2) (8) (4)
1946 5.06 4.82 .24 1.001947 7.84 5.66 2.18 8.361948 11.44 5.86 5.58 7.301949 10.55 5.27 5.28 6.861950 14.29 8.73 5.56 7,711951 14.57 7.77 6.80 8.991952 14.79 7.48 7.81 9.521953 16.10 8.24 7.86 10.281954 16.65 10.09 6.56 9.061955 20.89 13.42 7.47 10.601956 20.26 11.50 8.76 11.801957 19.20 9.17 10.03 12.911958 19.45 11.74 7.71 10.631959 27.41 15.08 12.33 16.441960 25.19 12.16 13.03 16.80
1946-60 243.69 136.99 106.70 148.26
SouRcE
Col. 1: Table 72, line 13.2: Klaman, Volume of Mortgage Del't. Table 4, col. 1, corrected and extended to
1960 using his methods and sources.3: Col. 1 minus col. 2. This is a rough estimate, assuming that all, financing of
new construction other than mortgages is equity, and omitting investment inresidential land.
4: Col. S plus 15 per cent of col. I. See Goldsmith, National Wealth, Table A-b,note to col. 2.
'Excluding government.
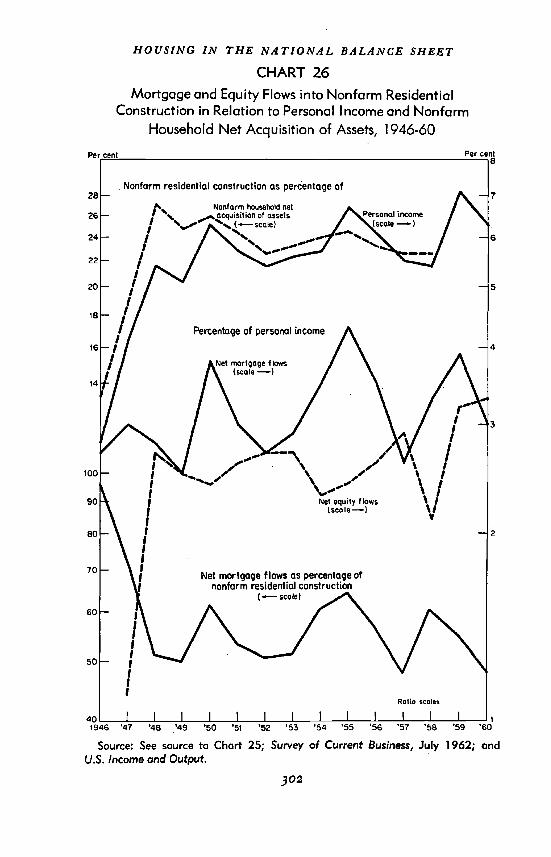
tion varied only between 23 and 27 per cent of asset acquisitions inall the years from 1948 through 1958 (Chart 26).
Mortgage flows contrasted with construction and asset acquisitionby undergoing large fluctuations, particularly sharp peaks in 1950,1955, and 1959. Equity financing of new houses2° also fluctuated con-siderably, but with quite different timing. Unlike the three series men-tioned previously and unlike even the annual series on personal in-come, it moved up and down in complete conformity with postwar
Measured here by the difference between construction value and net mortgageflows. This is a crude measure, including any miscellaneous financing such as non-mortgage borrowing.
300

RESIDENTIAL MORTGAGES
80
70
60
50
40
30
CHART 25
F!ow of Funds into Total Net Acquisition of Assetsby Nonfarm Households and into Nonfarm Residential
Construction, 1946-60
Source: Table 86 and Vol. Il, Table VlI-1, line V.
301
Btllion dollars
25
20
15
l0
•59 60
9
8
7
6
Billion90
30
1946 '47 '48 '49 '50 '51 '52 '53 '54 '55 '56 '57 '58
5
HOUSING IN THE NATIONAL BALANCE SHEET
CHART 26
Mortgage and Equity Flows into Nonfarm ResidentialConstruction in Relation to Personal Income and Nonfarm
Household Net Acquisition of Assets, 1946-60
302
1946
Source: See source to Chart 25; Survey of Current Business, July 1962; andU.S. Income and Output.
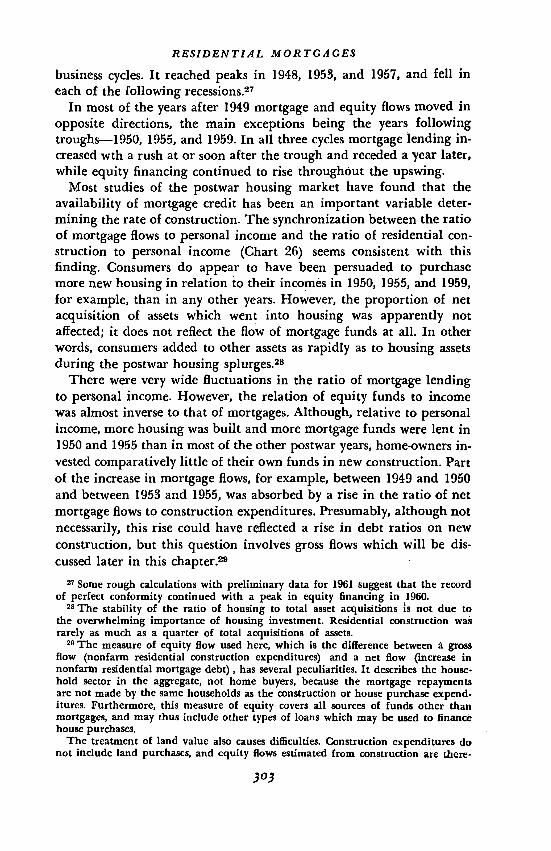
RESIDENTIAL MORTGAGES
business cycles. It reached peaks in 1948, 1953, and 1957, and fell ineach of the following recessions.27
In most of the years after 1949 mortgage and equity flows moved inopposite directions, the main exceptions being the years followingtroughs—1950, 1955, and 1959. In all three cycles mortgage lending in-creased wth a rush at or soon after the trough and receded a year later,while equity financing continued to rise throughout the upswing.
Most studies of the postwar housing market have found that theavailability of mortgage credit has been an important variable deter-mining the rate of construction. The synchronization between the ratioof mortgage flows to personal income and the ratio of residential con-struction to personal income (Chart 26) seems consistent with thisfinding. Consumers do appear to have been persuaded to purchasemore new housing in relation to their incomes in 1950, 1955, and 1959,for example, than in any other years. However, the proportion of netacquisition of assets which went into housing was apparently notaffected; it does not reflect the flow of mortgage funds at all. In otherwords, consumers added to other assets as rapidly as to housing assetsduring the postwar housing splurges.28
There were very wide fluctuations in the ratio of mortgage lendingto personal income. However, the relation of equity funds to incomewas almost inverse to that of mortgages. Although, relative to personalincome, more housing was built and more mortgage funds were lent in1950 and 1955 than in most of the other postwar years, home-owners in-vested comparatively little of their own funds in new construction. Partof the increase in mortgage flows, for example, between 1949 and 1950and between 1953 and 1955, was absorbed by a rise in the ratio of netmortgage flows to construction expenditures. Presumably, although notnecessarily, this rise could have reflected a rise in debt ratios on newconstruction, but this question involves gross flows which will be dis-cussed later in this chapter.29
27 Some rough calculations with preliminary data for 1961 suggest that the recordof perfect conformity continued with a peak in equity financing in 1960.
28 The stability of the ratio of housing to total asset acquisitions is not due tothe overwhelming importance of housing investment. Residential construction wasrarely as much as a quarter of total acquisitions of assets.
The measure of equity flow used here, which is the difference between a grossflow (nonfarm residential construction expenditures) and a net flow (increase innonfarm residential mortgage debt), has several peculiarities. It describes the house-hold sector in the aggregate, not home buyers, because the mortgage repaymentsare not made by the same households as the Construction or house purchase expend-itures. Furthermore, this measure of equity covers all sources of funds other thanmortgages, and may thus include other types of loans which may be used to financehouse purchases.
The treatment of land value also causes difficulties. Construction expenditures donot include land purchases, and equity flows estimated from construction are there.
303
HOUSING IN THE NATIONAL BALANCE SHEET
Gross Flows of Housing Funds in the Postwar Period
SOURCES AND TYPES OF GROSS FLOW DATA
Net flows of. funds are only a step away from the national and sectoralbalance sheets. from which they are derived. From this closeness theygain . reliability, but at the price of hiding many important features ofthe movement of funds through the housing market. Funds are usednot only for the purchase of newly built houses but also for the pur-chase of used houses, for repairs and alterations on existing houses, formortgage amortization and prepayments, and, to some extent, for pur-poses entirely unconnected with the financing of residential real estate.Funds enter the market not only via new house mortgages and equityflows but also through mortgages on existing houses, both for refinanc-ing and as additions to mortgages, and through equity• flows on andsales of existing houses. To examine these relationships, one must lookbehind the net flows to the gross flows which give rise to them.
The data on gross flows, which are described in Appendix C, areless reliable than the balance sheets and net flows, but they were con-structed in such a way as to fit together with them and to reconcile thenet flOws with, in most cases, the regularly published series on mort-gage recordings of $20,000 or less. The recordings are assumed torepresent gross extensions of nonfarm residential one- to four-familymortgage debt. These mortgage recordings are based on reports bymortgage lenders and to that extent are fairly reliable, but they includesome nonresidential real estate and exclude some higher-pricedresidences.3°
Gross mortgage repayments can be calculated from gross lending and
fore understated by the cost of land purchased by households from other sectors.The other equity estimate, including land costs, probably is an overstatement, be-cause the figure of 15 per cent represents all land purchases rather than only thosefrom other sectors.
80 The Savings and Home Financing Source Book, Federal Home Loan BankBoard. (Washington,, 1960, p. 46) gives a more detailed discussion of the series. Amore thorough. examination of gross flow data and the problems involved in meas-unng them can be found in Saul B. Klaman. Flow Data for. currentMarket Analysis," 1959 Proceedings of the Business and Economic Statistics Sectionof the American Statistical Association. Appendix C of this paper describes some ofthe gross flow data for types of mortgages and institutions on which these aggre-gates are based.
Another. series on mortgage loans made on one- to four-family nonfarm homes,covering 1925-50, was published by the Federal Home Loan Bank Board in Esti-mated Home Mortgage Debt and Financing Activity, 1950 (Washington,. 1951). Theseries was discontinued after that date.
Grebler, Blank, and Winnick (Capital Formation, Table M.1) estimated thegross flow of mortgage and equity funds into all residential real estate for 1911-52.
304
RESIDENTIAL MORTGAGES
net changes in mortgage debt outstanding. The breakdown of repay-ments by the FHLBB into amortization, partial prepayments, and pre-payments in full is less reliable than the total
Figures for tangible uses of funds are NBER estimates based mainlyon official data for new construction, repairs, and alterations.31 If, asnow seems likely, these are substantially understated, we have probablycorrespondingly underestimated net equity flows into housing andoverstated the relative role of mortgages in housing finance.
Transactions, in existing houses are taken from a roughly estimatedseries formerly published by the Federal Reserve Board as part of itsflOw-of-funds accounts but since discontinued. We have extrapolatedthem to 1958 on the basis of FRB estimates of the number of purchasesof existing houses and average values of one-family houses insured bythe FHA under Section 203, and to '1960 by a FHLBB series for mort-gage lending on existing houses and FHA data on loan-to-value ratiosfor existing house loans under Section 203.
Both the Federal Reserve Board and the Federal Home Loan BankBoard have made estimates of 'the division between lending on newhouses and lending on existing houses. The FRB figures have. not beenpublished officially but most of them appear in Kiaman's monograph.32There is some foundation for the breakdown in data published forsavings and loan association lending38 and for FHA and VA mortgageextensions. The FHLBB gives consistently lower figures for extensionof mortgages' on new homes and therefore implies greater equityfinancing of them. The two series differ more in level than in movementwhich is close to being parallel except in a couple of years.
Mortgage loans, other than oh new houses, among sources of funds,are broken down by the FHLBB into refinancing, which is estimatedas being equal to the item on the uses side called "prepayments infull," and "additional financing." The FRB estimates are divided intomortgage credit for "existing house purchases" and for "other pur-poses." This classification is based on, and estimated from, the datafor savings and loan associations 'mentioned above. The "other" categorypresumably includes, therefore, loans for repairs, additions and altera-tions, and refinancing.84. The FRB totals for "other purposes," however,
81 Goldsmith, National Wealth, Appendix..B.82 Klaman, Postwar Residential Mortgage Market, Chart 22 and Table A-b.83 discussion by Kiaman (ibid., pp. 159-168) suggests that the savings and
loan data contain many defects. "Loans classified as for construction of homesinclude temporary loans to builders as well as permanent loans to individuals.Loans classified as for purchase of homes include, loans for purchase of both newand existing houses. Moreover, the figures. given are confused by a significantdegree of duplication; loans reported once• under the construction category arereported again under the purchase category."
See, for example, note in Federal Reserve Bulletin, August 1960, p. 908.
305

TA
BL
E 8
7
GR
OSS
SO
UR
CE
S O
F FU
ND
S, O
NE
- T
O F
OU
R-F
AM
ILY
NO
NFA
RM
HoU
SIN
G, 1
946-
60(b
illio
n do
llars
)
SOU
RC
E
Lin
es 1
,2, 3
, 195
0-60
: Sav
ings
and
Rom
e Fi
nanc
ing
Cha
rt B
ook:
1962
, FH
LB
B, p
p. 2
5a a
nd 2
6a.
1, 1
946-
49: E
xtra
pola
ted
back
fro
m 1
950
by e
stim
ate
ofm
ortg
age
loan
s on
tota
l new
res
iden
tial c
onst
ruct
ion
from
Gre
bler
, Bla
nk, a
nd W
inni
ck, C
apita
l For
ma-
tion,
p. 4
55, c
ol. 1
2, a
djus
ted
to e
xclu
de m
ultif
amily
cons
truc
tion.
Thi
s w
as d
one
on th
e ba
sis
of th
e ra
tioof
1-
to 4
-fam
ily to
tota
l hou
seke
epin
g co
nstr
uctio
nex
pend
iture
s (T
able
72)
.
2, 1
946-
49: L
ine
4 m
inus
the
sum
of
lines
1 a
nd 3
.3,
194
6-49
: Tab
le 8
8, li
ne 1
2.4:
Est
imat
ed H
ome
Mor
tgag
e D
ebt a
nd F
inan
cing
Act
iv-
ity, 1
961,
FH
LB
B, 1
962.
5: T
able
88,
line
4.
6: T
able
88,
line
3, m
inus
line
1 o
f th
is ta
ble.
7: T
able
88,
line
s 8
and
13, m
inus
the
sum
of
lines
2, 3
,an
d 5
of th
is ta
ble.
8: S
um o
f lin
es 4
-7.
0
1946
1947
1948
1949
1950
195
119
5219
5319
5419
5519
5619
5719
5819
5919
60
1. E
xten
sion
of
mor
tgag
es o
n ne
w h
ouse
s2.
43.
95.
45.
38.
67.
77.
58.
59.
613
.312
.110
.510
.614
.813
.9
2. A
dditi
onal
fin
anci
ng o
n ex
istin
g ho
uses
4.0
3.4
2.3
2.0
2.3
3.0
4.0
4.2
5.4
5.1
5.4
5.6
7.6
7.0
5.9
3. R
efin
anci
ng o
n ex
istin
g ho
uses
4.G
ross
mor
tgag
e lo
ans
4.2
10.6
4.4
11.7
4.2
11.9
4.5
11.8
5.2
5.6
16.2
16.4
6.5
18.0
7.1
19.7
8.0
23.0
10.1
28.5
9.6
27.1
8.1
24.2
9.2
27.4
10.4
82.2
9.5
29.3
5. R
ecei
pts
from
sal
e of
exi
stin
g ho
uses
6. E
quity
flo
w f
or n
ew h
ouse
pur
chas
es7.
Net
equ
ity f
low
for
exi
stin
g ho
uses
8.G
ross
sou
rces
of
fund
s.
9.5 .8 0 20.9
8.6
1.5
1.5
23.3
8.1
3.2
3.5
26.7
9.0
2.3
3.9
27.0
11.6
12.4
2.9
4.2
4.4
4.7
35.1
37.7
17.0
4.5
4.5
44.0
17.4 4.5
4.9
46.5
20.2 4.1
4.1
51.4
21.4 4.6
5.3
59.8
22.2 4.8
6.2
60.3
20.7 5.2
7.0
57.1
23.0 5.7
5.4
61.5
23.3 9.2
7.9
72.6
20.4 7.6
9.8
67.1
0 0 N

RESIDENTIAL MORTGAGES
are much lower than the FHLBB figures for refinancing alone and ittherefore seems likely that the FRB excludes refinancing in connectionwith house sales.
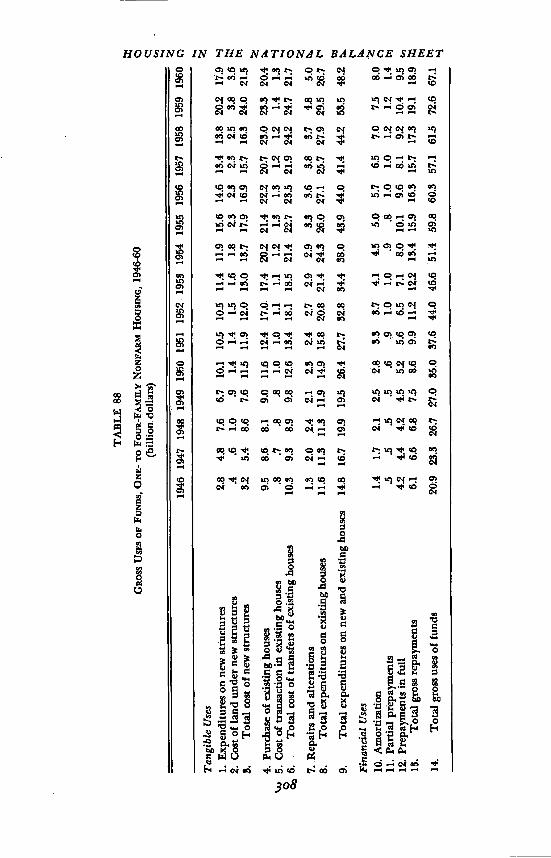
Tables 87 and 88 summarize the available data on total gross flowsof funds through the one- to four-family housing market. The tangibleuses represent, for the purchasers, real investment in housing. Thisincludes a small amount of dealers' margins on sales of existing housesand land costs on new homes. All of the tangible uses, excluding thepurchase of existing houses but including the cost of the transactionsin them, are the real components of the changes in the stock of housingin the national balance sheets. The intangible uses involve the repay-ment of housing debt out of equity funds or out of the item "additionalfinancing of existing homes."
CHANGES IN THE LEVEL OF GROSS MORTGAGE FLOWS
One feature common to almost all the absolute series on tangiblehousing expenditures and gross flows of mortgage credit is their lackof synchronization with the cyclical fluctuations of the economy as awhole. They did undergo cycles, but the peaks and troughs did not, ingeneral, coincide with those marked out by National Bureau referencedates. There is, in fact, some evidence that mortgage flows movedcountercyclically.36 Among the uses of funds, prepayments and pur-chases of new houses were at their peak in 1955 (Chart 27) and pur-chases of existing houses in 1956. All three of the series showedtroughs in 1957—a reference peak. Prepayments and existing homepurchases hit their troughs in 1948, and only new construction coin-cided with the reference trough in 1949. None of the three, at least inthese annual data, was marked by the 1953-54 business cycle. The onlyarea of gross uses which followed the reference dates was repairs andalterations which increased in every year except 1949, 1954, and 1958,declining in the first and third recessions and remaining steady in theother. Amortization payments rose in every year without regard tocyclical phase.
Among the sources of funds, refinancing and sales of existing housesare entirely or mainly the obverse of prepayments and existing housepurchases and therefore need no additional description. The extensionof mortgages on new homes exhibited the familiar sharp peaks in 1950,1955, and 1959, and troughs in 1952 and 1957. "Additional financing"on existing homes, after falling for several years, rose rapidly from1949 to 1958. It reached peaks in two trough years, 1954 and 1958.
It is, of course, not correct to say that the housing and mortgageseries are unaffected by the business cycle; the apparent dependence of
See, for example, Gutten tag, 'Some Studies of the Post-World War II ResidentialConstruction and Mortgage Market."
307
TA
BLE
88
Gp.
oss
USJ
?SO
FFU
ND
S. O
NE
TO
FO
UR
-FA
MIL
Y N
ON
FAR
M H
ousi
NG
, 194
6-60
(bill
ion.
dolla
rs)
1946
194
7 19
48 1
949
1950
195
119
52 1
953
1954
195
5 19
56 1
957
1958
195
9 19
60
Tan
gibl
e U
ses
1. E
xpen
ditu
res
on n
ew s
truc
ture
s2.
84.
87.
66.
710
.110
310
311
.411
.915
;614
.613
.413
.820
.217
.9
2. C
ost o
f la
nd u
nder
new
str
uctu
res
.4.6
1.0
.91.
41.
41.
51.
61.
82.
32.
32.
32.
53.
83.
6
3.T
otal
cos
t of
new
str
uctu
res
8.2
5.4
8.6
7.6
11.5
11.9
12.0
13.0
13.7
17.9
16.9
l5.7
16.3
24.0
21.5
4. P
urch
ase
of e
xist
ing
hous
es9.
58.
68.
19.
011
.612
.417
.0.
17.4
20.2
21.4
22.2
20.7
23.0
23.3
20.4
'i.'
5. C
ost o
f tr
ansa
ctio
n in
exi
stin
ghou
ses
.8.7
.8.8
1.0
1.0
1.1
1.1
1.2
1.5
1.3
1.2
1.2
1.4
1.3
6..
Tot
al c
ost o
f tr
ansf
ers
of e
xist
ing
hous
es10
.39.
38.
99.
812
.613
.418
.118
.521
.422
.723
.521
.924
.224
.72L
7
7. R
epai
rs a
nd a
ltera
tions
1.3
2.0
.2.4
2.1
2.3
2.4
2.7
2.9
2.9
3.3
3.6
3.8
8.7
4.8
5.0
8.T
otal
exp
endi
ture
s on
exi
stin
g ho
uses
11.6
11.3
11.3
11.9
14.9
15.8
20.8
21.4
24.3
26.0
27.1
25.7
27.9
29.5
26.7
N
9.T
otal
exp
endi
ture
s on
new
and
exi
stin
g ho
uses
14.8
16.7
19.9
19.5
26.4
27.7
32.8
34.4
58.0
48.9
440
41.4
44.2
53.5
48.2
NFi
nanc
ial U
ses
10. A
mor
tizat
ion
1.4
1.7
2.1
2.5
2.8
9.3
3.7
4.1
455.
05.
763
7.0
7.5
8.0
11. P
artia
l pre
paym
ents
.5.5
.5.5
.69
1.0
1.0
.9.8
1.0
1.0
1.2
1.2
1.4
12; P
repa
ymen
ts in
ful
l4.
24.
44.
24.
55.
25.
66.
57.
18.
010
.19.
68.
19.
210
.49.
5
13.
Tot
al g
ross
rep
aym
ents
6.1
6.6
6.8
7.5
8.6
9.9
11.2
12.2
13.4
15.9
16.3
15.7
17.5
19.1
18.9
14.
Tot
al g
ross
use
s of
fun
ds23
.326
.727
.035
.037
.644
.046
.651
.459
.860
.357
.161
.572
.667
.1
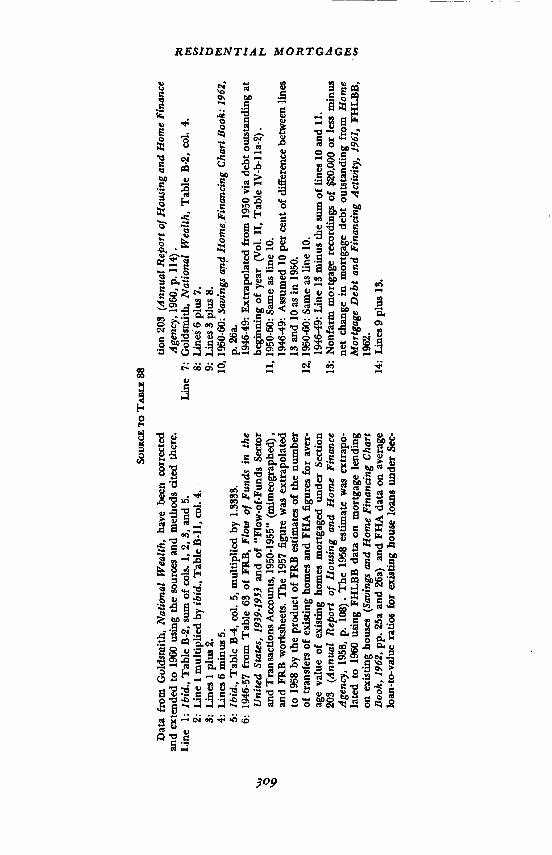
SOU
RC
.E T
O88
Dat
a fr
om G
olds
mith
, Nat
iona
l Wea
lth, h
ave
been
cor
rect
edan
dex
tend
edto
196
0 us
ing
the
sour
ces
and
met
hods
cite
d th
ere.
Lin
e1:
Ibi
d., T
able
B-2
, sum
of
cols
. 1, 2
, 3, a
nd 5
.2:
Lin
e 1
mul
tiplie
d by
ibid
., T
able
B-i
l, co
l. 4.
3: L
ines
lplu
a2.
4: L
ines
6 m
inus
5.
5: I
bid.
, Tab
le B
-4,
col.
5, m
ultip
lied
by 1
.333
3.6:
194
6-57
fro
m T
able
63
of F
RB
, Flo
w o
f Fu
nds
in th
eU
nite
d St
ates
, 193
9-19
53 a
nd o
f "F
low
-of-
Fund
s Se
ctor
and
Tra
nsac
tions
Acc
ount
s, 1
950-
1955
" (m
imeo
grap
hed)
,an
d FR
B w
orks
heet
s. T
he 1
957
figu
re w
as e
xtra
pola
ted
to 1
958
by th
e pr
oduc
t of
FRB
est
imat
es o
f th
e nu
mbe
rof
tran
sfer
s of
exi
stin
g ho
mes
and
FH
A f
igur
es f
or a
ver-
age
valu
e of
exi
stin
g ho
mes
mor
tgag
ed u
nder
Sec
tion
203
(Ann
ual R
epor
t of
Hou
sing
and
Hom
e Fi
nanc
eA
genc
y, 1
958,
p. 1
08).
The
195
8 es
timat
e w
as e
xtra
po-
late
d to
196
0 us
ing
FHL
BB
dat
a on
mor
tgag
e le
ndin
gon
exi
stin
g ho
uses
(Sa
ving
s an
d H
ome
Fina
ncin
g C
hart
Boo
k, 1
962,
pp.
25a
and
26a
) an
d FH
A d
ata
on a
vera
gelo
an-t
o-va
lue
ratio
s fo
r ex
istin
g ho
use
loan
s un
der
Sec-
tion
203
(Ann
ual R
epor
t of
Hou
sing
and
Hom
e Fi
nanc
eA
genc
y, 1
960,
p. 1
14).
Lin
e 7:
Gol
dsm
ith, N
atio
nal W
ealth
, Tab
le B
-2, c
ol. 4
.8:
Lin
es 6
plu
s 7.
9: L
ines
3plu
s8.
10, 1
950-
60: S
avin
gs a
nçl H
ome.
Fina
ncin
g C
hart
Boo
k: 1
962,
p. 2
6a.
1946
-49:
Ext
rapo
late
d fr
om 1
950
via
debt
out
stan
ding
at
begi
nnin
g of
yea
r (V
ol. I
I, T
able
IV
-b-l
la-2
).11
, 195
0-60
: Sam
e as
line
10.
1946
-49:
Ass
umed
10
per
cent
of
diff
eren
ce b
etw
een
lines
13 a
nd lO
as in
195
0.12
, 195
0-60
: Sam
e as
line
10.
1946
-49:
Lin
e 15
min
us th
e su
m o
f lin
es 1
0 an
d 11
.13
: Non
farm
mor
tgag
e re
cord
ings
of
$20,
000
or le
ss m
inus
net c
hang
e in
mor
tgag
e de
bt o
utst
andi
ng f
rom
Hom
eM
ortg
age
Deb
t and
Fin
anci
ng A
ctiv
ity, 1
961,
FH
LB
B,
1962
.14
: Lin
es9p
lusl
3.
La, "-I 0 C)
C)
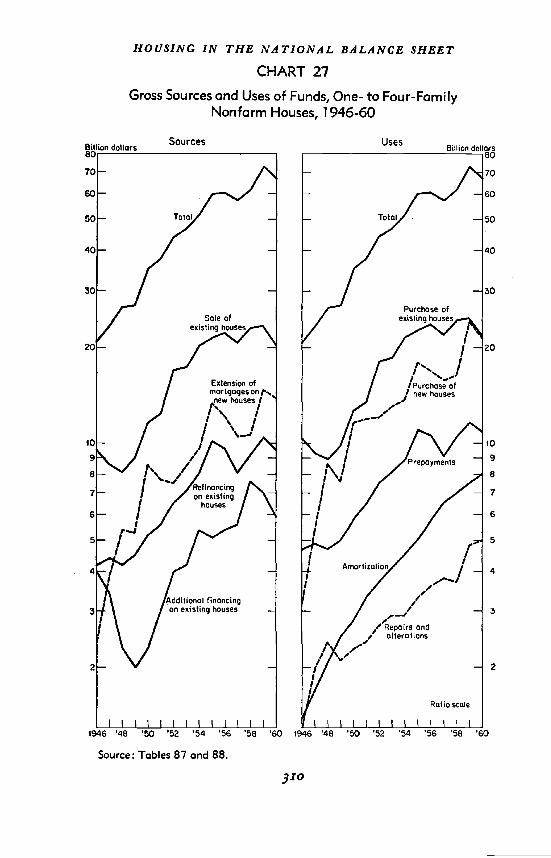
HO USING IN THE NATIONAL BALANCE SHEET
CHART 27
Gross Sources and Uses of Funds, One- to Four-Family
Sources
Source: Tables 87 and 88.
Nonfarm Houses, 1946-60
310
Usesdollars80
Billion dollars80
1946 '48 '50 '52 '54 '56 '58 '60 194€ '48 '50 '52 '54 '56 '58 '60
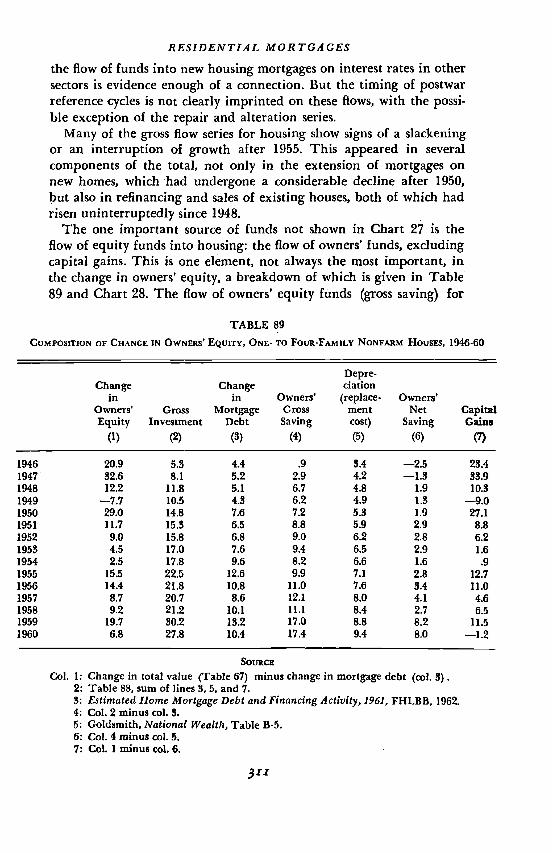
RESIDENTIAL MORTGAGES
the flow of funds into new housing mortgages on interest rates in othersectors is evidence enough of a connection. But the timing of postwarreference cycles is not clearly imprinted on these flows, with the possi-ble exception of the repair and alteration series.
Many of the gross flow series for housing show signs of a slackeningor an interruption of growth after 1955. This appeared in severalcomponents of the total, not only in the extension of mortgages onnew homes, which had undergone a considerable decline after 1950,but also in refinancing and sales of existing houses, both of which hadrisen uninterruptedly since 1948.
The one important source of funds not shown in Chart 27 is theflow of equity funds into housing: the flow of owners' funds, excludingcapital gains. This is one element, not always the most important, inthe change in owners' equity, a breakdown of which is given in Table89 and Chart 28. The flow of owners' equity funds (gross saving) for
TABLE 89
COMPOSITION OF CHANCE IN OwNElts' EQUITY, ONE- TO FOUR-FAMILY NONFARM HousEs, 1946-60
Depre-Change Change ciation
in in Owners' (replace- Owners'Owners' Gross Mortgage Gross ment Net CapitalEquity Investment Debt Saving cost) Saving Gains
(1) (2) (3) (4) (5) (6) (7)
1946 20.9 5.3 4.4 .9 3.4 —2.5 23.41947 32.6 8.1 5.2 2.9 4.2 —1.8 3391948 12.2 11.8 5.1 6.7 4.8 1.9 10.31949 —7.7 105 4.3 6.2 4.9 1.3 —9.01950 29.0 14.8 7.6 7.2 5.3 1.9 27.11951 11.7 15.8 6.5 8.8 5.9 2.9 8.81952 9.0 15.8 6.8 9.0 6.2 2.8 6.21953 4.5 17.0 7.6 9.4 6.5 2.9 1.61954 2.5 17.8 9.6 8.2 6.6 1.6 .91955 15.5 22.5 12.6 9.9 7.1 2.8 12.71956 14.4 21.8 10.8 11.0 7.6 3.4 11.01957 8.7 20.7 8.6 12.1 8.0 4.1 4.61958 9.2 21.2 10.1 11.1 8.4 2.7 6.51959 19.7 80.2 13.2 17.0 8.8 8.2 11.51960 6.8 27.8 10.4 17.4 9.4 8.0 —1.2
SOURCE
Col. 1: Change in total value (Table 67) minus change in mortgage debt (col. 3).2: Table 88, sum of lines 3, 5, and 7.3: Estimated Home Mortgage Debt and Financing Activity, 1961, FHLBB, 1962.4: Col. 2 minus col. 3.5: Goldsmith, National Wealth, Table B-5.6: Col. 4 minus col. 5.7: Col. 1 minus col. 6.
3"
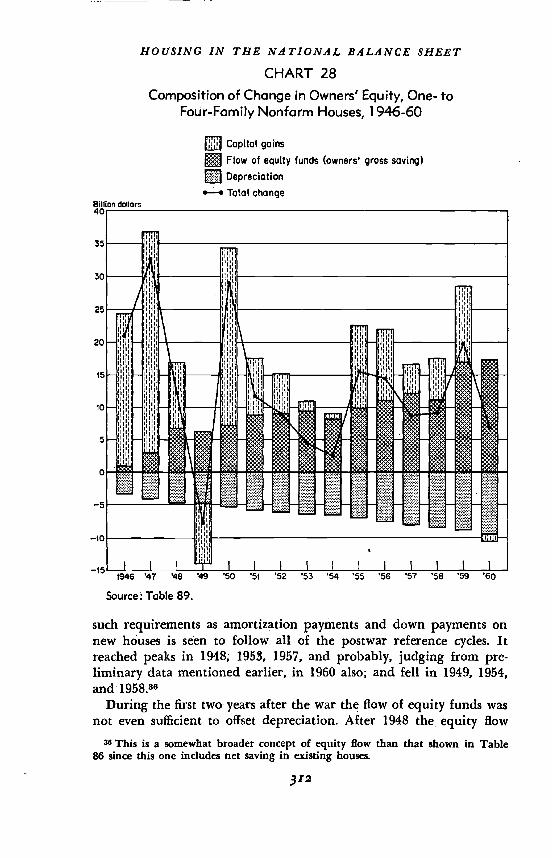
HOUSING IN THE NATIONAL BALANCE SHEET
CHART 28
Composition of Change in Owners' Equity, One- toFour-Family Nonfarm Houses, 1946-60
Capital gains
Flow of equity funds (owners' gross Saving)
Depreciation
Total change8iUion dollars40
____________________
til ii35
11111 liii
30111
III
liii!I 111111
I
I 111111 I
II I I I I I I I I
______________________________
I I
_________________
11111 11111 III hit III I II I I I I I I ItluIl I I I I
11111 111111 liiiI I
I 111111 III 111111 11111III I 111111
11111 11111 III 1111 111111 111111II III II II III II I III111111 11111 111111 I I
IIII
I11111
0 . .,..
—5
Ii
I I I I I
1946 '47 '46 '49 '50 '51 '52 '53 '54 '55 '56 '57 '58 '59 '60
Source. Table 89.
such requirements as amortization payments and down payments onnew houses is seen to follow all of the postwar reference cycles. Itreached peaks in 1948, 1953, 1957, and probably, judging from pre-liminary data mentioned earlier, in 1960 also; and fell in 1949, 1954,and
During the first two.. years after the war the flow of equity funds wasnot even sufficient to offset depreciation. After 1948 the equity flow
36 This is a somewhat broader concept of equity flow than that shown in Table86 since this one includes net saving in existing houses.
312
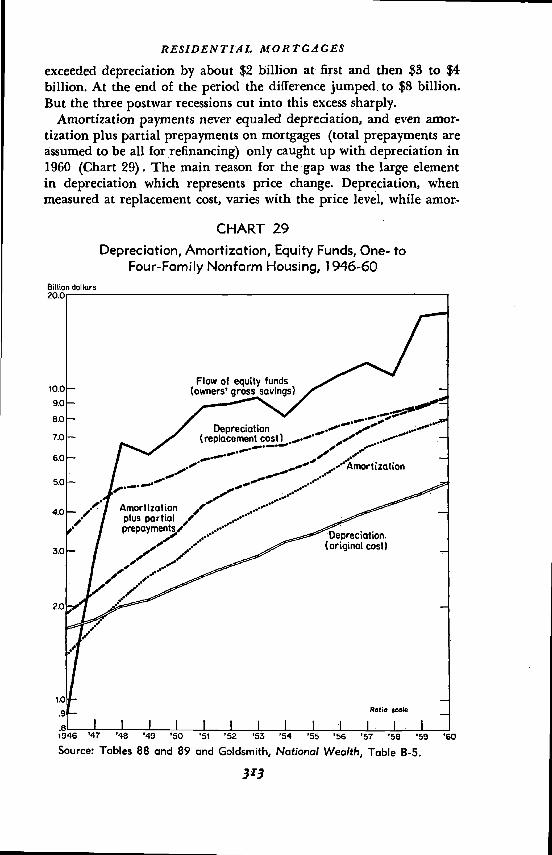
RESiDENTiAL MORTGAGES
exceeded depreciation by about $2 billion at first and then $8 to $4billion. At the end of the period the difference jumped. to $8 billion.But the three postwar recessions cut into this excess sharply.
Amortization payments never equaled depreciation, and even amor-tization plus partial prepayments on mortgages (total prepayments areassumed to be all for refinancing) only caught up with depreciation in1960 (Chart 29). The main reason for the gap was the large elementin depreciation which represents price change. Depreciation, whenmeasured at replacement cost, varies with the price level, while amor-
CHART 29
Depreciation, Amortization, Equity Funds, One- toFour-Family Nonfarm Housing, 1946-60
313
Billion dollars
'48 '49 ,5O 51 '52 '53 '55 '56 '57 '58 '59 '60
Source: Tables 88 and 89 and Goldsmith, National Wealth, Table B-5.
HOUSING IN THE NATIONAL BALANCE SHEET
tization is related to the. original cost of building and is not affectedby subsequent price changes. If the comparison is made with originalcost depreciation, amortization was higher except in the first twoyears, and rose more rapidly.
The low level of gross saving compared to depreciation in the firstfive years after the war did not mean that home-owners' equity was fail-ing to grow. Except in the recession year 1949, there were very largegains in equity, three of them (1946, 1947, 1950) being greater thanany later ones. These were due to large capital gains from increases inhouse prices, represented in these computations by construction costs.Capital gains far outweighed saving as a source of increases in equityin the early postwar years and were still of considerable importancein the 1950's. In a number of ways fluctuations in the level of capitalgains follow those in such series as the ratio of house purchases to thestock of houses (see below).. Both were at a high level just after thewar, fell to troughs in 1949; both bit peaks in 1950, 1955, and 1959,and troughs in 1957, and declined sharply in 1960. The three peaks incapital gains were all in periods of considerable residential construc-tion
RELATIONSHIP OF NEW HOUSE PURCHASES TO TOTAL HOUSE
PURCHASES AND STOCK OF HOUSING
The period of rapid growth (from 2 to 5 per cent) in new house pur-chases relative to the existing stock of housing ends with the 1950 peak(Chart After that no upward. trend is in evidence, although eachof the following peaks was slightly above its predecessor. The distinc-tive cyclical swings observed in insured mortgages and related seriesstand out clearly. Sales of existing houses, on the other hand, were largerelative to the total housing stock just after the war. They saggedquickly, then rose again 1955, more than matching their initialratio to the housing stock, and have declined almost every year sincethen.
The distribution of house purchases reflects these differences in rateof growth. The share of new houses in total purchases was less thanone-quarter in 1946; it rose rapidly to almost a half in 1948, and thenbegan a gradual fluctuating decline which brought it to about 40per cent by 1958. In the last two years, however, it suddenly reachedclose to 50 per cent again. At first, after the war, there were very fewnew houses to buy, and there was probably considerable purchasingof former rental housing of prewar vintage, which accounted for the
87 Grebler, Blank, and Winnick (Capital Formation, pp. 18 1.189) discuss theflow of mortgage and equity funds into new residential construction from 1911to 1952.
314

RESIDENTiAL MORTGAGES
importance of the purchases of existing houses. Then, after the firstpostwar housing boom had built up a considerable reservoir of post-war houses, these began to be sold by their first owners, slowly in-creasing the existing house share of the market until the recentreversal.38
GROSS MORTGAGE FINANCING RATIOS
One of the advantages of gross flow data is that they give a much clearerpicture than net flows of the financing needs and practices of homebuyers. The net financing ratio (the ratio of net mortgage extensionsto purchases of houses) describes the financing of the nonfarm sectoras a whole, but the gross financing ratio describes the financing of thepart of the household sector that is doing the buying. It does not cancelout mortgage repayments by home-owners against mortgage borrowingby home buyers.
There are two sources of gross mortgage flow data, the Federalserve Board and the Federal Home Loan Bank Board. The FRB data,some of which were published by Klaman, diverge substantially fr9mthose of the FHLBB, mainly by showing a lower level of lending onnew homes, despite the fact that the two agencies start from the sameestimates of total gross lending. However, they generally agree well inmovement except for the sharp fluctuations in the FHLBB series in1950 and 1951 (Chart 31).
Gross financing ratios were very high just after the war, declinedto a low point in 1952, and crept up after that but not to anythingnear the 1946 and 1947 levels. At times the two components movedquite differently. The new house financing ratio reached high levels in1946, 1950, and 1955 and has undergone wide swings without anydecided trend, despite the efforts of government guarantee programs.The financing ratio for existing houses reached very high levels—80 to84 per cent—just after the war. Then they fell to approximately 60per cent in the early 1950's and rose to 70 per cent and above in 1958-60, higher, surprisingly, than ratios for new houses.
It seems unlikely that all of the financing on existing houses wasconnected with transactions in them. Even the loan-to-value ratios forFHA-guaranteed mortgages, usually higher than on conventional loans,did not reach the level of the gross financing ratio in 1946 and 1947.
88Estimates of numbers or proportions of new and existing houses purchased in1947-58 were made in Survey of Consumer Finances reports published in theFederal Reserve Bulletin. The share of new houses in numbers was generally belowthe value shares (Chart 30) , an appropriate relationship since average values ofnew houses are considerably higher than those of old ones. But a puzzling featureof the series is that in most years after 1948 it leads the value ratios consistently bya year. The aggregate values of house purchases estimated in these reports were farbelow those in Table 88.
315

CHART 30
Purchases of New and Existing Housing in Relation toStock of Housing, 1946-60
Per cent
Furthermore, only in 1946-48 did the ratios of mortgage extension tovalue of transactions •n existing houses exceed that on new housesuntil. 1958-60. The burst of mortgage financing just after the war seemsto have reflected not only the high level of housing market activity butalso the raising of debt on houses which were not transferred.
316
Per cent
C1946 '47 '48 '49 '50 'SI '52. '53 '54 '55 '56 '57 '58 '59 '60

RESiDENTiAL MORTGA CES
Source: New and existing house purchases are from Table 88. Stock of one- tofour-family housing is from Table 69. Number of new and existing house purchasesis as follows (in millions)
New as PercentageNew Existing of Total
1 947ft 0.6 1 .6 270.8 1.6 33
1949b 0.6 1.0 381950b 0.8 1.4 36195P 0.7 1.7 291952° 0.6 Li 351953° 0.7 1.5 321954° 1.0 1.5 401955° 0.9 1.7 351956d 331957° 301958° 30
36These data are from Federal Reserve Bulletin as follows: S July 1951; b August1955; August 1 956; p. 820; June 1957, pp. 628-629; ° September 1959,p. 1099; and 1960 Survey of Consumer Finances, p. 53.
It is possible that the postwar surge of existing house transfers, al-though it was not as great in comparison to the housing stock as thatoE 1954-56 (Chart 30), required a higher proportion of mortgagefinancing. A larger part of the sales during the 1940's than in the 1950'smay have been to former renters who were entering the market withoutequity from sales of other houses. Such purchasers would be forced torely more heavily on mortgage credit than former home-owners.
Several features of the data on gross financing ratios are reflected. inthe information for FHA-insured loans under Section 203, the mainFHA home mortgage program. The peaks in 1950 and 1955, the troughin 1952, and the rapid fall from 1955 to 1957 all show up in both setsof data for new houses (Chart 32).
The existing house ratios under Section 203 confirm the 1955 peak,but they were fairly steady before 1954 and add to the evidence thatthe high ratios of 1946-48 were not a product of transactions in houses.
The FHA ratios do contain one distinctive feature hardly visible atall in the totals. That is a very rapid rise from 1957 to 1959 in thefinancing ratios for both new and existing house transactions to thehighest levels in the postwar years. The only reflection of such a rise inChart 31 is in lending on existing houses, and even that ratio does notreach a level higher than in the 1940's.
DISTRIBUTION OF GROSS FLOWS AMONG TYPES OF MORTGAGE
AND FINANCING INSTITUTION
Eata on net mortgage flows show how much credit is being supplied tothe mortgage market by each institution or through each type Of mort-gage, after deducting the funds received from mortgage sales and re-payments. But since the mortgagors receiving new credit are typically
317
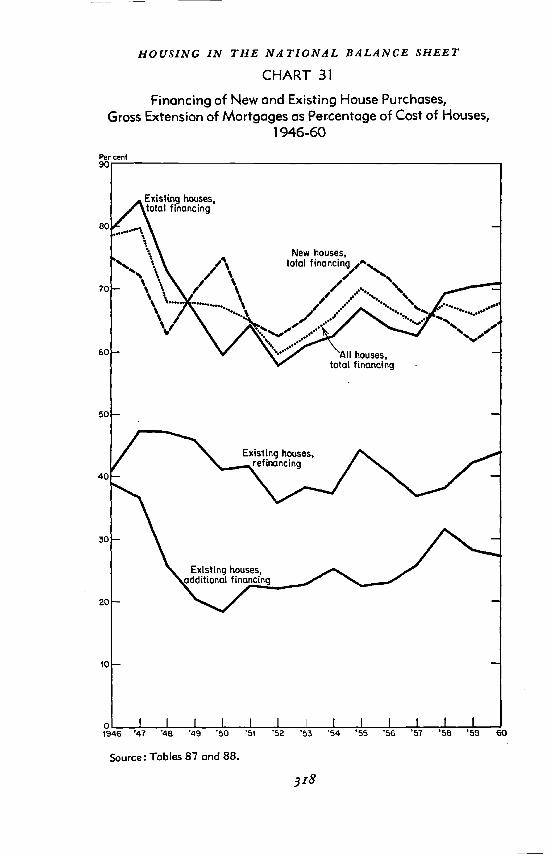
HOUSING IN THE NATIONAL BALANCE SHEET
CHART 31
Financing of New and Existing House Purchases,Gross Extension of Mortgages as Percentage of Cost of Houses,
Source: Tables 87 and 88.
318
60
Per cent90
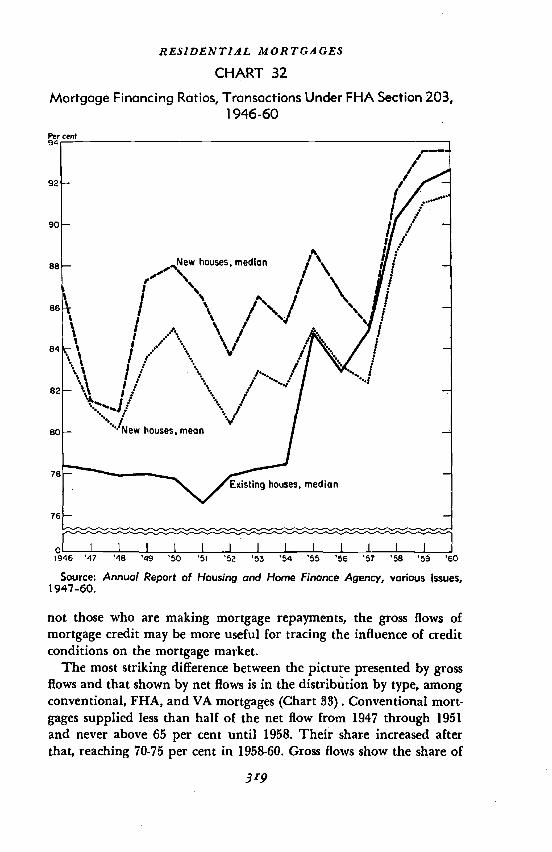
RESIDENTIAL MORTGAGES
CHART 32
Mortgage Financing Ratios, Transactions Under FHA Section 203,1946-60
not those who are making mortgage repayments, the gross flows ofmortgage credit may be more useful for tracing the influence of creditconditions on the mortgage market.
The most striking difference between the picture presented by grossflows and that shown by net flows is in the distribution by type, amongconventional, FHA, and VA mortgages (Chart 33). Conventional mort-gages supplied less than half of the net flow from 1947 through 1951and never above 65 per cent until 1958. Their share increased afterthat, reaching 70-75 per cent in 1958-60. Gross flows show the share of
319
Source: Annual Report of Housing and Home Finance Agency, various issues,1947-60.

HOUSING IN THE NATiONAL BALANCE SHEET
CHART 33
Percentage Distribution of Gross and Net Flows, One- toFour-Family Nonfarm Residential Mortgages,
by Type of Mortgage, 1946-60
Gross Flows Net Flows
Source: Net flows are from Kiamon, Volume of Mortgage Debt, Tables 26, 31,33, and 35, corrected and extended tofrom AppericHx. Table C-2.
Per cent80
Per cent80
-In1946 '48 '50 '52 '56 '58 '60 1946 '48 '50 '52 '54 '56 '58 '60
1960. using his methods. flows are
320
RESIDENTIAL MORTGAGES
conventional mortgages always above 64 per cent of the total, and ris-ing considerably higher in recent. years.
The net flows exhibit violent shifts. from year to year in, the propor-tions supplied in the three forms. The width of the fluctuations isillustrated by their range: from 37 per cent of the net mortgage flowto 75 per cent for conventional mortgages, 60 to —3 per cent forVA mortgages, and from 38 to —9 per cent for FHA mortgages. Notonly were the shifts in net sources large over the period as a whole, butmost of the range was covered in periods of a year or two.
No such radical shifts in the type of mortgage funds.supplied appearin the gross flow data. Here conventional mortgages are of much greaterimportance than in the net flows, supplying 64 to 78 per cent of thegross funds in every year. There was an upward trend in this ratio,imparted mainly by the data for 1957-60. Gross flows of VA loansvaried between 7. and 28 per cent of the total (mostly between 15 and22 per cent) and FHA loans between 4 and 19 per cent.39
In both gross and net flows, conventional loans moved inversely toVA lending very regularly. The net flows of the two types moved inthe same direction only three times in the fourteen years, and the grossflows only twice. FHA and VA loans changed in opposite directionsat times, particularly in 1948-51 and in 1958, but conventional andFHA loans seem much less closely related. These facts suggest theexistence of competitive relationships, perhaps in response to changesin interest rate differentials, between VA and conventional mortgagesmore than between FHA and VA or between conventional and FHAmortgages.
Use of gross instead of net, flows modifies the picture of the institu-tional distribution of mortgage financing also (Chart 34). In everycase, both the extent of year-to-year fluctuations and the total range offluctuation are greatly reduced.
Of more interest is the fact that shifting' to gross flows reduces theshares of several major sectors in mortgage financing. The share of lifeinsurance companies is reduced from 18 to 14 per cent for the postwarperiod as a whole, that of savings and loan associations from 42 to 38per cent, that of mutual savings banks from 14 to 10 per cent for1949-60. Commercial banks and others, mainly individuals, are con-siderably more important in the gross flows, supplying 37 per cent in1949-60 compared to 25 per cent of the net..The whole group of com-mercial and mutual savings banks and others were responsible, for 48per cent of the gross flow of funds in the. postwar years against 41 percent of net flows. The Federal National Mortgage Association played
39 presence of construction loans among conventional mortgiges tends toexaggerate their importance but should not influence the stability of their share.
321

HOUSING ZN THE NATIONAL BALANCESHEET
CHART 34
Percentage Distribution of Gross and Net Flows, One- toFour-Family Nonfarm Residential Mortgages,
by Type of Institution, 1946-60
Savings and loan associations- banks
Mutual savings banksLife insurance companiesFNMA
Gross Flows Net Flows
1946 '48 '50 '52 '54 '56 48'58 '60 1946 '50 '52 54 '56 '5$ '60
RESIDENTIAL MORTGAGES
Source: Net flows ore from Kiamon, Volume of Mortgage Debt, Tables 20 and26, corrected and extended td 1960 using his methods. Gross flows ore fromAppendix Tables C-i, C-1O, C-14, and C-17, and, for FNMA, from Annual Re-ports of Housing and Home Finance Agency, purchases minus sales of VA and FHAhome mortgages (Sections 8, 203, 221, 222, 603, 809, and 903) in secondarymarket operations and special assistance activities.
about the same part in both measures of financing, the main differencebeing the smoothing of fluctuations.
The greater instability of the net flows is not a surprising finding; forthey are the result of subtracting from the fluctuating series on grossacquisitions two much steadier series: a very mildly fluctuating butrising series for repayments in full, and a series for amortization whichshowed a steady upward trend with no fluctuations at all. Therefore,when the gross flow remains constant the net flow falls. The size ofthe difference between the two measures is a function of the size of, andthe trend in, mortgage repayments.
REPAYMENTS RATIOS
Data on repayments appear to be less reliable than those on gross ex-tensions or on holdings of mortgages. All or almost all of the repay-ments estimates are derived by subtracting net changes in holdingsfrom gross or net purchases of mortgages, and they therefore suffer fromthe defects of both series, magnified by the fact that theseries is smaller than that on gross extensions. Among the items thatmay end up in a supposed series on repayments are the effects of timingdifferences in the recording of gross flow and net' flow data and theeffects of differences of concept and coverage between the recordingsdata and those from balance sheets.4°
Despite the ambiguities in the repayments data, two conclusionsstand out clearly. The first is that the ratio of repayments to outstand-ing debt is much higher for conventional mortgages than for guaran-teed mortgages, and among the latter, higher for FHA than for VAmortgages. The second conclusion is that the repayment ratio has beenfalling during the last fifteen years for total mortgages, for each typeof mortgage (except VA mortgages after 1958), and for mortgagesheld by each type of financial institution.
This decline in the repayment rate is apparently not a long-termphenomenon. Grebler, Blank, and found that the rates werequite low before the war. They ranged between 14 and 17 per cent in
40These differences, as well as some other infonnation on gross flows, are discussedby Kiaman in the 1959 Proceedings of the Business and Economic Statistics Sectionof the American Statistical Association, pp. 211-212, and are summarized in Appen-dix C below.
41 Capital Formation, pp. 175-179.
323
HOUSING IN THE NATIONAL BALANCE SHEET
every year but one from 1930 through 194:1. But in the late 1920's theywere above 20 per cent, as in the building boom after World War 11.42
Repayments estimates, for all mortgages or for all of a given type,FHA, VA, or 'conventiOnal, are likely to be more reliable than those forparticular sectors, because the former do not require information onpurchases and of mortgages among sectors. These intersector trans-actions, about which very little information is available, cancel outwhen the' economy as a whole is
The declines in repayment ratios for the majOr types of mortgagesstand, out clearly in Chart 35. Part of the, fall 'in the ratio for all mort-gages arose out of the shift from conventional to guaranteed mortgages,especially in the. firs.t few postwar. years, but the trend was downwithin the FHA and conventional mortgage categories, as well.
Repayment. ratios for VA mortgages have been lower than those forFHA mortgages in all but four years. Conventional mortgage repay-ment rates have been as much as three times as high as FHA rates. Atleast part of the explanation for: this high level rests on the inclusionof construction loans, which have high turnover 'rates, in conventionalmortgages. Many of these are made by savings and loan associations.43In their short-term fluctuations, ratios for guaranteed mortgages partlyreflect cycles in construction, particularly the peaks in 1950, 1955,.and 1959.
Repayment rates can be separated into amortization rates, whichshow a smooth and mild downward trend, and prepayrnents, whichshow an even sharper decline after 1955 than total repayments. Pre-payments' are divided by the source into partial and total. It is thelatter, representing transactions associated with refinancing, which ac-count for this sudden drop from over 14 per cent in 1955 to slightlyover 8 per cent in
There' are some opportunities for testing these findings on what areat least partly independent data for individual types of financial insti-tutions. These' estimates, together with some notes on their construc-tion and their 'many limitations, can be found in' Appendix c.
For 'the most part the dat'a for individual institutions,, crude as theyare, support' the findings for total mortgage debt. Repayment rates onconventional mortgages were higher In every case than those on guaran-teed ruoTtgages and, with the sole ccnventibnal debt heldby 'mutual savings banks, trends in repayment ratios' were downward(Chart 36).
data on the relationship between actual and contract lengths of mortgages,see Morton, 'Urban Mortgage Lending, pp.
See 'I(lãman, Postwar Residential Mortgage Market, pp. 159-163. for a study ofsavings and loan association loans. The higher level of repayment ratios for con-ventional mortgages is confirmed, however, by data for mutual savings banks forwhom temporary construction loans are not important (ibid., p. 155).
324
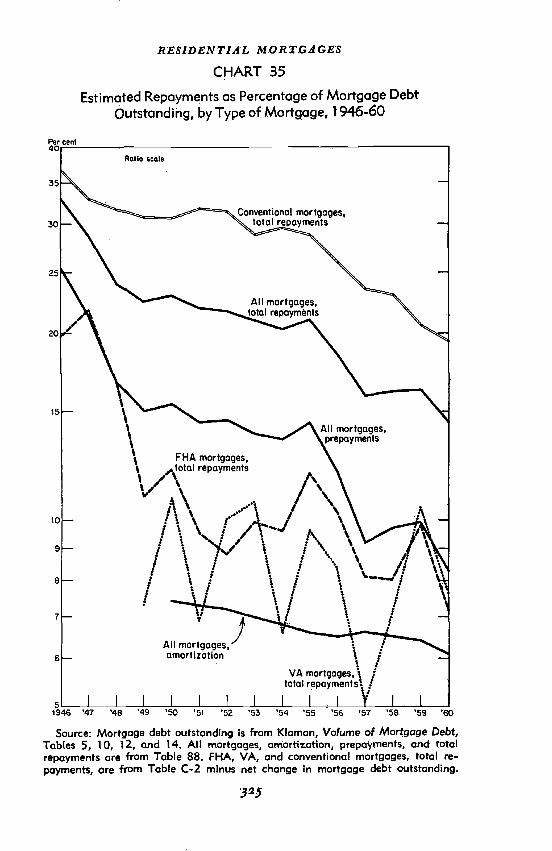
RESiDENTIAL M.ORT.GA GES
CHART 35
Estimated Repayments as Percentage of Mortgage DebtOutstanding, by Type of Mortgage,
Source: Mortgage debt outstanding is from Kiaman, Vofume .of Mortgage Debt,Tables 5, 10, 12, and 14. All mortgages, and totalrepayments are from Table 88. FHA, VA, and conventional mortgages, total re-payments, are from Table C-2 minus net change in mortgage debt outstanding.
3.25
All mortgages,amortization
51946 '47 '48 '49 '50 '51 '52 '54 '55 '56'57 '56. '59 '60
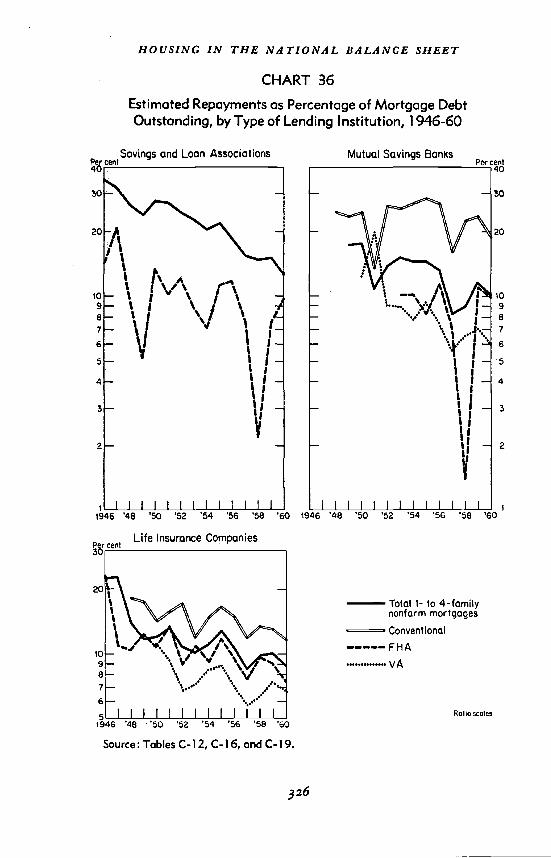
0 a
§1!
3' —I
.03 .<
I- -,'
CD U,
C a r) CD C) 0 0 C
D U,
C)) 0
0"'
to U)
— C" -p
0. o U)
U, 0 2.
•-j3 -p
U)
— -
Ia-
n -4.
—a
(n(D
C—
— --p
(I) o
- —U
)
cD 0 CO
-p
r\) 0
In o
—D
00
0
(0 C)
(71 0 (Il
C) I > —I w
0 0
0 00
00
RESIDENTIAL MORTGAGES
Savings and loan association repayment rates for total home mort-gages, shown here, do not take account of purchases on the open mar-ket. But data for insured associations, in which repayments are givendirectly, confirm both the trend and the fluctuations in this series.
The mortgage investments of life insurance companies are muchmore heavily concentrated in guaranteed debt than those of savings andloan associations. This fact alone is a partial explanation of the lowerrepayment rate for total mortgages held by the insurance sector. But itis not a sufficient explanation because the rate for insurance sector con-ventional mortgages alone is lower than the total repayment rate forsavings and loan associations. It seems likely that temporary construc-tion mortgages in the savings and loan sector must partly account forthe high repayment rates there.
Conventional loan repayment rates fluctuated much. more in theinsurance sector than in the. others and in closer conformity with therates for other types of mortgages. All three types reached peaks inrepayment rates in 1955 and troughs in 1957. The earlier peak wasscattered, VA loans hitting it in 1950 (VA loan rates before 1950 arenot shown because they fluctuated violently and were probably notreliable), FHA loans in 1951, and conventional loans in 1952.
The only other major financial sector for which these gross flows areavailable is mutual savings banks, and the data are fragmentary. Thedecline in repayment ratios is again visible in the total and in VA mort-gages and, for a few years in FHA mortgages. But it is not at all evident inconventional mortgages, and it may be that the fall in total repaymentratios is due more to the shift from conventional to government-insuredmortgages than to the decline within these types. The high repaymentrates for conventional mortgages appear here as in other sectors.
To a considerable extent, the much higher repayment ratio on con-ventional mortgages must be related to their shorter terms. In 1950, forexample, the median term of both FHA and VA mortgages was twentyyears, while that of conventional first mortgages was only eleven yearsand of conventional junior mortgages seven years.44 This fact, however,affects only amortization, which was never as much as half of total re-payments and was usually close to one-third. It does not explain at allthe fluctuations in repayment ratios or the sharp decline which tookplace in the more recent part of the period.
Some part of the decline in repayment ratios can be ascribed to thelengthening of mortgage terms. In 1946, for example, FHA mortgageson new houses insured under Section 203 averaged 21.0 years and thoseon existing houses 18.9 years. By 1960 they had reached 29.2 and 25.8years, respectively.45
"U.S. Census of Housing: 1950, Vol. IV, Part I, p. 42.45 Report of Housing and Home Finance Agency, 1961, p. 104.
327


![[XLS]Financial Planning Worksheet Jan 2004 - WWW ... · Web viewFinancial Planning Worksheet Statement of Net Worth Remarks Assets Liabilities Mortgages-Balance Due Total Assets Total](https://static.fdocuments.in/doc/165x107/5abf8f7d7f8b9ac0598e86fd/xlsfinancial-planning-worksheet-jan-2004-www-viewfinancial-planning-worksheet.jpg)