Distributional Effects of Electricity Subsidies Elimination in Ukraine: A CGE Analysis

THE WORLD BANK
W O R L D B A N K W O R K I N G P A P E R N O . 1 6 0
Residential Electricity Subsidiesin MexicoExploring Options for Reform and for Enhancingthe Impact on the Poor
Kristin KomivesTodd M. JohnsonJonathan D. HalpernJosé Luis AburtoJohn R. Scott
47107P
ublic
Dis
clos
ure
Aut
horiz
edP
ublic
Dis
clos
ure
Aut
horiz
edP
ublic
Dis
clos
ure
Aut
horiz
edP
ublic
Dis
clos
ure
Aut
horiz
edP
ublic
Dis
clos
ure
Aut
horiz
edP
ublic
Dis
clos
ure
Aut
horiz
edP
ublic
Dis
clos
ure
Aut
horiz
edP
ublic
Dis
clos
ure
Aut
horiz
ed

Kristin KomivesTodd M. JohnsonJonathan D. HalpernJosé Luis AburtoJohn R. Scott
W O R L D B A N K W O R K I N G P A P E R N O . 1 6 0
Residential Electricity Subsidiesin MexicoExploring Options for Reform and for Enhancingthe Impact on the Poor
THE WORLD BANK
Washington, D.C.
11503-00a_FM_rev.qxd 1/6/09 9:44 AM Page i

Copyright © 2009The International Bank for Reconstruction and Development / The World Bank1818 H Street, N.W.Washington, D.C. 20433, U.S.A.All rights reservedManufactured in the United States of AmericaFirst Printing: January 2009
printed on recycled paper
1 2 3 4 5 12 11 10 09
World Bank Working Papers are published to communicate the results of the Bank’s work to thedevelopment community with the least possible delay. The manuscript of this paper thereforehas not been prepared in accordance with the procedures appropriate to formally-edited texts.Some sources cited in this paper may be informal documents that are not readily available.
The findings, interpretations, and conclusions expressed herein are those of the author(s)and do not necessarily reflect the views of the International Bank for Reconstruction and Devel-opment/The World Bank and its affiliated organizations, or those of the Executive Directors ofThe World Bank or the governments they represent.
The World Bank does not guarantee the accuracy of the data included in this work. Theboundaries, colors, denominations, and other information shown on any map in this work donot imply any judgment on the part of The World Bank of the legal status of any territory orthe endorsement or acceptance of such boundaries.
The material in this publication is copyrighted. Copying and/or transmitting portions orall of this work without permission may be a violation of applicable law. The International Bankfor Reconstruction and Development/The World Bank encourages dissemination of its workand will normally grant permission promptly to reproduce portions of the work.
For permission to photocopy or reprint any part of this work, please send a request withcomplete information to the Copyright Clearance Center, Inc., 222 Rosewood Drive, Danvers,MA 01923, USA, Tel: 978-750-8400, Fax: 978-750-4470, www.copyright.com.
All other queries on rights and licenses, including subsidiary rights, should be addressedto the Office of the Publisher, The World Bank, 1818 H Street NW, Washington, DC 20433, USA,Fax: 202-522-2422, email: [email protected].
ISBN-13: 978-0-8213-7884-7eISBN: 978-0-8213-7886-1ISSN: 1726-5878 DOI: 10.1596/978-0-8213-7884-7
Library of Congress Cataloging-in-Publication Data
Residential electricity subsidies in Mexico: exploring options for reform and for enhancing theimpact on the poor/Kristin Komives . . . [et al.].
p. cm. — (World Bank working paper; no. 160)Includes bibliographical references and index.ISBN 978-0-8213-7884-7 (alk. paper)—ISBN 978-0-8213-7886-1 (electronic: alk. paper)
1. Electric utilities—Subsidies—Mexico. 2. Electric utilities—Rates—Mexico. 3. Subsidies—Mexico. I. Komives, Kristin.
HD9685.M62R47 2009333.793'23—dc22
2008051806
11503-00a_FM_rev.qxd 1/6/09 9:44 AM Page ii

iii
Contents
Acronyms and Abbreviations . . . . . . . . . . . . . . . . . . . . . . . . . . . . . . . . . . . . . . . . . . . . . . . . v
Executive Summary . . . . . . . . . . . . . . . . . . . . . . . . . . . . . . . . . . . . . . . . . . . . . . . . . . . . . . . vii
1. Introduction . . . . . . . . . . . . . . . . . . . . . . . . . . . . . . . . . . . . . . . . . . . . . . . . . . . . . . . . . . 1
2. Residential Electricity Subsidies and Tariffs in Mexico . . . . . . . . . . . . . . . . . . . . . . 5
3. Distributional Incidence of Residential Electricity Subsidies . . . . . . . . . . . . . . . . 15
4. Assessment of Alternative Subsidy Mechanisms . . . . . . . . . . . . . . . . . . . . . . . . . . . 27
5. Synthesis of Findings and Ways Forward . . . . . . . . . . . . . . . . . . . . . . . . . . . . . . . . . 45
APPENDIXES
A: Evolution of Residential Electricity Subsidies and Tariffs in Mexico . . . . . . . . . . . . 51
B: Residential Electricity Tariffs in 2006 . . . . . . . . . . . . . . . . . . . . . . . . . . . . . . . . . . . . . 53
C: Tariff Reclassifications, 2002–06. . . . . . . . . . . . . . . . . . . . . . . . . . . . . . . . . . . . . . . . . . 57
D: Analysis of Subsidies Using CFE Data . . . . . . . . . . . . . . . . . . . . . . . . . . . . . . . . . . . . . 61
E: Analysis of Subsidies Using ENIGH Data . . . . . . . . . . . . . . . . . . . . . . . . . . . . . . . . . . 65
F: Tariff Reform Scenarios. . . . . . . . . . . . . . . . . . . . . . . . . . . . . . . . . . . . . . . . . . . . . . . . . 71
Bibliography . . . . . . . . . . . . . . . . . . . . . . . . . . . . . . . . . . . . . . . . . . . . . . . . . . . . . . . . . . . . . 75
11503-00a_FM_rev.qxd 1/6/09 9:44 AM Page iii

11503-00a_FM_rev.qxd 1/6/09 9:44 AM Page iv
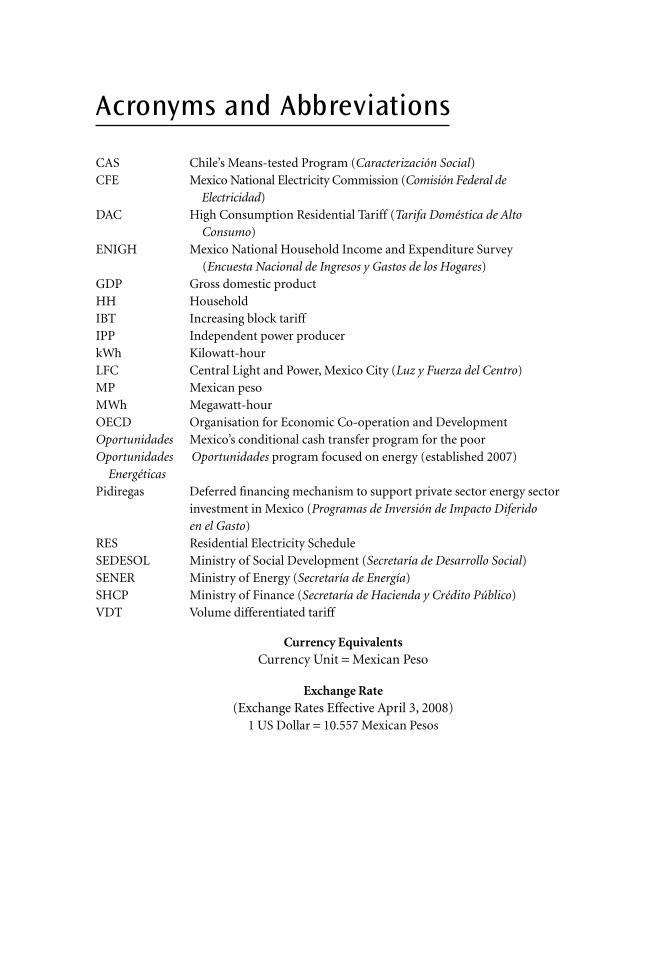
Acronyms and Abbreviations
CAS Chile’s Means-tested Program (Caracterización Social)CFE Mexico National Electricity Commission (Comisión Federal de
Electricidad)DAC High Consumption Residential Tariff (Tarifa Doméstica de Alto
Consumo)ENIGH Mexico National Household Income and Expenditure Survey
(Encuesta Nacional de Ingresos y Gastos de los Hogares)GDP Gross domestic productHH HouseholdIBT Increasing block tariffIPP Independent power producerkWh Kilowatt-hourLFC Central Light and Power, Mexico City (Luz y Fuerza del Centro)MP Mexican pesoMWh Megawatt-hourOECD Organisation for Economic Co-operation and DevelopmentOportunidades Mexico’s conditional cash transfer program for the poorOportunidades Oportunidades program focused on energy (established 2007)
EnergéticasPidiregas Deferred financing mechanism to support private sector energy sector
investment in Mexico (Programas de Inversión de Impacto Diferido en el Gasto)
RES Residential Electricity ScheduleSEDESOL Ministry of Social Development (Secretaría de Desarrollo Social)SENER Ministry of Energy (Secretaría de Energía)SHCP Ministry of Finance (Secretaría de Hacienda y Crédito Público)VDT Volume differentiated tariff
Currency EquivalentsCurrency Unit = Mexican Peso
Exchange Rate(Exchange Rates Effective April 3, 2008)
1 US Dollar = 10.557 Mexican Pesos
11503-00a_FM_rev.qxd 1/6/09 9:44 AM Page v

11503-00a_FM_rev.qxd 1/6/09 9:44 AM Page vi
Executive Summary
This report addresses a pressing issue in Mexico’s electricity sector—the large and growingsubsidies to residential consumers and their regressive incidence across different segmentsof the population. It responds to requests from the Ministry of Energy (SENER) to providea preliminary assessment of alternatives to the current subsidy system, building on priorcollaboration between the Government of Mexico and the World Bank on the distribu-tional impact of public spending, the performance of conditional cash transfer programsand other poverty-targeted programs, and related work on pricing and subsidies for infra-structure services. This study was designed as the first phase of a multiphase program ofcollaborative analytical work. This first phase provides estimates of the distributional andfiscal performance of alternative subsidy targeting mechanisms to help inform discussionand deliberations on feasible goals and practical approaches over the medium term. A sec-ond phase would address transition paths, specific compensatory mechanisms, and deci-sion processes for pursuing the options that the Mexican authorities deem most promising.
Electricity subsidies in Mexico are among the largest in the world (US$9 billion in2006) and have absorbed a significant proportion of public resources. Subsidies in 2006were equivalent to about 1 percent of gross domestic product and were more than one-thirdof total electricity sector revenues. Over two-thirds of electricity subsidies go to residentialconsumers, and the volume of subsidies to residential customers increased by 46 percentbetween 2002 and 2006 in real terms.
Tariff subsidies of this magnitude impact heavily on the performance of the electric-ity sector and on Mexican society more generally.
■ First, the cost of the subsidies needs to be covered in some way—if not by con-sumers, then by government; if not directly by the government, then by reducedspending on system expansion to meet growing demand, on service quality upgrades,and on operations and asset maintenance. Fiscal transfers to the utilities divertresources from priority social and economic programs and reduce fiscal space forfinancing priority investments in the electricity sector. The 2006 federal budget forinvestment in electricity (excluding the Programas de Inversión de Impacto Diferidoen el Gasto [Pidirigas]) was 40 billion pesos, only slightly larger in nominal termsthan it was in 2001 and less than half the total volume of subsidies.
■ Second, subsidies distort price signals, elevating demand above what it would be ifelectricity was priced at marginal or average cost. Massive underpricing also mutesincentives for customers to take energy saving measures, such as replacing oldequipment and appliances. Higher customer demand requires additional powersupply, especially to meet periods of peak demand. Because elevated residentialelectricity demand tends to lower load factors for the power system, it leads toreduced efficiency in the use of generation and transmission facilities and thus to ahigher marginal cost of supplying all customer classes. This has negative implica-tions for economic competitiveness.
■ Subsidies also engender environmental costs. Elevated demand leads to incremen-tal emissions from power plants, including local pollutants responsible for poor
vii
11503-00b_Exec_Sum_rev.qxd 1/6/09 9:46 AM Page vii

air quality (such as particulates and ozone precursors) and global pollutants linkedto climate change. Further, standard merit order dispatch rules exacerbate the ten-dency for marginal generating plants (those with low capital costs, but high fuelcosts, such as small fuel-oil and diesel-fired facilities) to generate higher levels ofpollutants. In rural areas, electricity subsidies for irrigation pumping exacerbateoverexploitation of groundwater resources.
Moreover, the bulk of subsidies go to the non-poor. Numerous reports in the last sexeniohave pointed out the regressive distributional incidence of these subsidies among residen-tial customers. Cognizant of this problem, the Mexican authorities expressed a strong inter-est in evaluating the impact of a shift from quantity-based targeting through the tariffstructure to means testing, building upon the poverty profiling and verification systemsestablished under Oportunidades, Mexico’s well-functioning, means-tested conditionalcash transfer program. The pilot effort for such a system was recently implemented withOportunidades Energéticas, which, with its 3 billion peso annual budget, is small relative toexisting tariff subsidies. This program, begun in 2007, did not replace or modify existingtariff-based subsidies, but rather operates in parallel with them.
Among the alternatives to the current subsidy system, the study examines the use ofmeans testing to allocate subsidies and modifications in electricity tariff structures basedon international experience. It also assesses the impact of achieving lower unit costs of sup-ply on subsidies. Each alternative is assessed in terms of its potential to reduce the overallmagnitude of electricity subsidies and improve distributional outcomes.
Residential Electricity Subsidies and Tariffs in Mexico
Electricity subsidies as reported in Mexico are financial subsidies that result from below-cost pricing, with cost measured as accounting costs. Subsidies are measured as the differ-ence between the price of electricity paid by consumers and the average cost of supply. Thisapproach to measuring subsidies does not capture the economic cost of electricity provi-sion, which could differ significantly from the accounting costs. Accounting costs arereported by the two operating utilities—the Mexico National Electricity Commission(Comisión Federal de Electricidad, CFE) and Central Light and Power (Luz y Fuerza del Cen-tro, LFC)—according to government accounting standards. CFE’s subsidies have largelybeen financed by a bookkeeping transfer. The federal government essentially reimbursesthe CFE for providing subsidies to its customers by discounting the taxes and dividends(aprovechamiento1) that CFE would otherwise have to pay the government. Since 2002, thevolume of subsidies has exceeded the notional amount of aprovechamiento and has there-fore begun to erode CFE’s capital base. For LFC, the electricity provider for the Valle deMexico and surrounding areas, its financial situation has been so dire that the federal gov-ernment provides the company with a direct cash subsidy to cover its mounting operatingdeficits and customer subsidies.
The current system of residential subsidies is not consistent with the basic preceptsprescribed in Mexico’s legal framework for the electricity sector. The legal framework gov-
viii Executive Summary
1. Equal to 9 percent of net fixed assets.
11503-00b_Exec_Sum_rev.qxd 1/6/09 9:46 AM Page viii

erning electricity tariffs in Mexico establishes that tariffs should cover costs and promoteefficient consumption. The tariffs of state-owned enterprises are to be set “in accordancewith economic efficiency and financial health criteria” (Article 26, Reglamento de la Ley deEmpresas Estatales). Electricity tariffs in particular are to be “fixed, adjusted, and restruc-tured in a way that covers financial and public service expansion requirements, and rationalenergy consumption” (Article 31, Ley de Servicio Público de Energía Eléctrica). Current res-idential electricity tariffs are far from meeting these objectives. Because only a tiny pro-portion of residential customers pay the marginal cost of electricity service, current tariffsachieve neither the cost recovery nor the efficient consumption provisions of the currentlegislation.
With respect to subsidies, the legal framework establishes that subsidies “shall be tem-porary” and subject to the criteria of “objectivity, equity, transparency, publicity, and selec-tivity.” The law further states that, “in programs of direct benefit to individuals or socialgroups, amounts [of the subsidy] and percentages shall be determined on the basis of redis-tributive criteria that must privilege the lower income population and aim at equity amongstregions and states” (Article 75, Ley Federal de Presupuesto y Responsabilidad Hacendaria). Inactuality, the regressive nature of residential electricity subsidies in Mexico is widely known,and the situation has deteriorated further since the 2002 tariff revision.
Mexico’s current system of tariff-based subsidies is among the most complex in theworld, and is largely a product of accretion rather than deliberate policy. Electricity subsi-dies were first introduced in Mexico in 1973 in response to persistent inflation, when thesingle electricity tariff was changed into a three-part, increasing block tariff, with sub-sidized rates for the first two blocks. The first “summer subsidy”(Tariff 1A) was introducedin 1974, providing additional subsidized rates to customers living in hotter areas (1A wasdefined as regions with more than four months of average temperatures above 25 degreesCelsius [°C]). Successive climate-based tariffs with increasingly subsidized rates over largervolumes were introduced in 1988 (Tariff 1B > 28 °C; 1C > 30 °C), 1990 (1D > 31 °C), 1995(1E > 32 °C), and 2002 (1F > 33 °C). Today, Mexico has an extremely complex tariff sys-tem with over 112 different billing possibilities for residential consumers.
Among the most important changes undertaken as part of the 2002 tariff revision wasthe introduction of a new tariff schedule for households consuming large volumes of elec-tricity known as the High Consumption Residential Tariff (Tarifa Doméstica de Alto Con-sumo, DAC), which was to raise tariffs slightly above long-run marginal costs for roughly thetop 5 percent of customers in each of the seven tariff categories. The 2002 tariff reform hadno long-lasting impact on subsidy volumes—although residential subsidies dropped slightlyin real terms in 2002, by 2003 they had risen above 2001 levels. The primary reasons for therebound in subsidies were: (a) the introduction of yet a more highly subsidized summer tar-iff category (Tariff 1F), (b) the reclassification of large numbers of consumers (3.4 millionbetween 2002 and 2006) to more highly subsidized tariff schedules, and (c) increasing elec-tricity supply costs.
The unit cost of providing electricity service is a key driver of both the magnitude anddistributional incidence of electricity subsidies. Given the way that subsidies are measured—tariff minus accounting cost—the magnitude of subsidies is directly related to the cost ofsupplying electricity. Reducing costs can offset, at least partly, the need for raising tariffs inan effort to reduce subsidies. Any cost reduction would result in a greater proportion ofsubsidies going to low-income households. Since 2002, CFE’s average cost per Megawatt-hour (MWh) delivered has increased by about 20 percent, while LFC’s costs were over twice
Executive Summary ix
11503-00b_Exec_Sum_rev.qxd 1/6/09 9:46 AM Page ix

as high as CFE’s in 2006. While fuel costs (mainly natural gas and fuel oil) rose by nearly70 percent during this period, other factors contributing to relatively high electricity sup-ply costs in Mexico include high personnel costs (wages, benefits, pensions) and large losses(both technical and commercial). For example, between 2002 and 2006, retirement pay-ments and wages and benefits increased by 35 percent and 24 percent, respectively. Whiletransmission losses have declined in percentage terms for both CFE and LFC in recentyears, distribution losses have been rising and are especially high for LFC—distributionlosses for CFE increased from 11 percent to 11.6 percent between 2000 and 2005, whilethose of LFC have exceeded 30 percent since 2005.
Distributional Incidence of Electricity Subsidies
Estimating electricity consumption and subsidies by income level in Mexico is challengingdue to the lack of comparable data. Data from CFE provide information on the distribu-tion of costs and electricity consumption within each tariff class and can be used to assessthe distribution of subsidies by electricity consumption level. Independent of CFE statis-tics, household survey data from the Mexico National Household Income and ExpenditureSurvey (Encuesta Nacional de Ingresos y Gastos de los Hogares, ENIGH) on electricity expen-ditures by household can be used to estimate the distribution of subsidies by income level.
The level of electricity consumption is often used as a proxy for income; however, inpractice, this correlation is not perfect. Not all poor households consume small amountsof electricity due to a range of factors, such as old and inefficient appliances or because theylive in very hot climates. For different reasons, rich households do not all consume a lot ofelectricity (for example, seldom-used second homes or single professionals who spend longhours away from their home). CFE data show an 80-fold difference in annual consump-tion between average consumption in the 1st consumption decile and the 10th consump-tion decile. By comparison, ENIGH data find that there is only a threefold difference inaverage monthly electricity consumption between the poorest income decile (139 kWh permonth) and the richest income decile (380 kWh per month) during the summer months.There are a number of other differences between these two data sources that lead to somedifferences in the empirical estimates generated with each source. Nonetheless, the over-arching conclusions and general observations about subsidy incidence that emerge fromthe two sets of data are strikingly similar.
The distributional incidence of residential electricity subsidies is highly regressive, ismost pronounced for the climate-based tariff categories (the summer subsidies), and appearsto have worsened over time. In 2005, the bottom three consumption deciles accounted forroughly 16 percent of electricity subsidies while the top three deciles accounted for 39 per-cent. The proportion of subsidies received by the top consumption decile has increased sincethe 2002 tariff review. In 2003, the top consumption decile accounted for 4.4 percent of totalsubsidy benefits, while by 2005 this percentage had increased to 10 percent. Likewise, DACconsumers (those paying the highest rates) accounted for 5 percent of total customers in2002, but by 2005 this figure had dropped to just 2 percent.
Estimates of subsidy distribution by income decile show that residential subsidies dis-proportionately benefit non-poor households, with the subsidies provided through climate-based tariffs (that is, 1A–1F) having the most regressive distributional incidence. While thebottom three income deciles account for about 21 percent of total subsidies, the top three
x Executive Summary
11503-00b_Exec_Sum_rev.qxd 1/6/09 9:46 AM Page x

income deciles account for 38 percent. Among Tariff 1F customers (the most highly subsi-dized customer group), more than one-quarter of total subsidies go to the top incomedecile alone. In contrast, ENIGH data suggest that the pilot program OportunidadesEnergéticas has a very progressive distribution of resources across income classes, withnearly 75 percent of the payments going to the bottom three income deciles.
While the majority of residential electricity subsidies benefit middle- and upper-incomehouseholds, such subsidies also represent a significant proportion of household income forlow-income consumers. Any reform of the current electricity tariff system should thereforeconsider and mitigate the impact that such changes would have on the poor.
Assessment of Alternative Subsidy Mechanisms
What options does Mexico have for reducing the burden of the large and growing electric-ity subsidies on public finances and redressing their highly regressive incidence? Fouroptions were assessed with regard to their impact on distributional incidence and aggre-gate volume—two modifications of the tariff structure, the introduction of means testing,and a reduction in supply costs (alone or in combination with the tariff changes). Theassessment of each option is based on simulations, using the same databases and estima-tion methods as were employed in evaluating the distributional performance of the cur-rent system. The options were chosen to reflect, on the one hand, current thinking inMexico about possible directions for changes in the tariff system and, on the other hand,to evaluate options that have been shown to be promising in other countries.2 This sort ofsimulation-based assessment provides a first-order approximation of possible end states.It does not define specific time horizons or precise transition paths. The purpose is not topresent all feasible options but rather to promote policy discussion by demonstrating fourdistinct alternatives to the current subsidy situation.
Minor Modification of Existing Tariff Structures
Among the electricity tariff reform proposals currently under discussion in Mexico is themodification of the DAC tariff to increase its coverage and slightly lower the rate to reflectlong-run marginal costs. The simulation assumed that the top 10 percent of customers ineach tariff class would pay the new DAC tariff. This option would reduce the overall mag-nitude of subsidies provided to residential customers by a mere 4 percent with little changein the distributional incidence across consumption deciles. Extending the DAC to more cus-tomers has very little impact because it does not modify the subsidies provided to 90 per-cent of electricity consumers. Moreover, the potential revenue gain associated with applyinga DAC tariff to the top decile is less than otherwise expected because consumption in thetop decile would decline in response to the increase in prices for “new” DAC customers.
A National Volume Differentiated Tariff (VDT)
This option involves moving from the current system of multiple increasing block tariffs(IBTs) to a much simpler national VDT system. A VDT preserves the goal of an IBT, which
Executive Summary xi
2. The simulations were specified based on discussions with government officials in January 2008.
11503-00b_Exec_Sum_rev.qxd 1/6/09 9:46 AM Page xi

is to provide greater subsidies to low-volume consumers. The difference is that each cus-tomer class pays one price per kWh consumed and that price is set by the customer’smonthly consumption level (as is now done only with the DAC tariff). The price for allkWhs consumed is thus higher for large-volume consumers than for small-volume con-sumers. Unlike the IBT, however, the VDT’s largest discounts are limited to only the lowest-volume consumers, because large-volume consumers receive no highly subsidized blocksof electricity. The VDT simulation results indicate that the implementation of a VDT sys-tem would reduce the total volume of residential electricity subsidies by about half andwould slightly improve the distributional incidence of subsidies. These results are consis-tent with studies from other countries that show that moving from an IBT to a VDT pro-duces a neutral or slightly progressive subsidy distribution. When the VDT is combinedwith a 20 percent cost reduction (such that those paying the top tariff are no longer sub-sidized), the volume of subsidies could be reduced by more than 80 percent and would dra-matically improve the targeting of remaining subsidies to the poor (Table ES1).
Means Testing
Building on the existence and success of Mexico’s means-tested program, this option assumesthat all Oportunidades participants would receive a discount on electricity consumption(either the first 100 kWh, 200 kWh, or all consumption), while all other consumers wouldpay a uniform volumetric tariff set at 80 percent of CFE average cost (the same level as thetop tariff in the VDT scenario). As with the VDT scenario, the impact of these tariff modifi-cations alone was simulated, as was the impact of the means-tested discount in combinationwith cost reductions. In combination with cost reductions, the tariff with means-tested dis-counts of various sizes yielded by far the most progressive subsidy distribution of all the alter-natives. The simulation of a discount on 100 kWh resulted in 66 percent of total subsidybenefits going to the lowest two income deciles, and would be even larger (82 percent) if allhouseholds in the lowest income quintile were covered by Oportunidades.
Reducing Supply Costs
If the costs of service provision could be reduced, for example through improvements inproductive efficiency, this alone would significantly reduce the magnitude of subsidieswithout raising tariffs or changing the tariff structure. The simulation with ENIGH data
xii Executive Summary
Table ES1. Performance Indicators for VDT Scenarios
Consumption Deciles Income Deciles (CFE data) (ENIGH data)
VDT with 20% VDT with 20%VDT Cost Reduction VDT Cost Reduction
Total volume of subsidies as a 45% 16% 48% 11%percent of current
Percent of subsidies going to 32% 54% 30% 43%first 4 deciles
Ratio of subsidies for deciles 1–3 0.56 4.94 0.53 1.23to subsidies for deciles 8–10
11503-00b_Exec_Sum_rev.qxd 1/6/09 9:46 AM Page xii

indicates that a reduction in average costs of 10 to 20 percent would permit aggregateresidential subsidies to decline by 21 and 42 percent, respectively. Similarly, simulationsusing CFE data found that a 20 percent reduction in costs would reduce subsidies by 35 percent. Moreover, the simulations show that such cost reductions would slightlyimprove the distributional incidence of residential subsidies, by consumption decile andby income decile.
Synthesis of Findings and Ways Forward
The alternatives assessed in this study are stylized illustrations of the many options that exist.They could be employed in combination to enhance their impact: for example, a VDT couldbe combined with a means-tested discount, by offering the most discounted tariff in the VDTonly to those eligible for Oportunidades. Likewise, the coverage of a means-tested discountcould be improved by offering the discount to all households in the country’s most marginalcommunities.3 The simulations do not provide an exhaustive review of possible tariff/sub-sidy options, but rather illustrate how different measures (changes in the DAC, shifting fromIBTs to VDTs, means-targeted discounts, and reduction in supply costs) would perform interms of reducing subsidy volumes and improving distributional incidence.
Six clear findings emerge from the evaluation of alternatives to the current tariff/subsidyscheme for residential consumers of electricity.
There is Relatively Little to be Gained from Minor Tinkering With the CurrentTariff Structure
Mexican electricity tariff structures are among the most complex in the world by designand by natural accretion. The complexity lends itself to reclassification and misclassifica-tion of specific consumer groups seeking to obtain still greater discounts on ever larger vol-umes on consumption. A minor tariff “reform”that centers around reducing the DAC tariffslightly, and expanding its coverage to the 10 percent of highest-volume consumers in eachtariff category, has almost no impact on the distribution of subsidy benefits and has min-imal impact on the total volume of subsidies. Moreover, history suggests that tariff adjust-ments of this type are likely to be followed by intense pressure from those most affected bythe higher tariffs to introduce new, more highly discounted tariff categories, negating theimpact of the change.
Combined With Cost Reductions, the Means-tested Discount Produces the MostProgressive Distribution of Subsidy Benefits, but a National VDT is Also aSignificant Improvement Over the Current Tariff System
The VDT and the means-tested discount scenarios both produce progressive subsidy dis-tributions when combined with 20 percent cost reductions. The VDT does a good job oftargeting subsidies to low-volume consumers, and achieves a slightly-more-progressive-than-neutral distribution of subsidies across income groups. The means-tested discount on
Executive Summary xiii
3. Geographic targeting is also possible, based on the concentration of “marginal” groups.
11503-00b_Exec_Sum_rev.qxd 1/6/09 9:46 AM Page xiii

100 kWh is highly progressive—almost all the benefits flow to the lowest income quintileof the population. Extending the discount to 200 kWh or to all consumption of targetedhouseholds makes the tariff structure even more progressive and reduces errors of exclusion.Improving the targeting performance of Oportunidades itself would also improve distrib-utional incidence.
A means-tested discount has a disadvantage over the VDT: poor households that forsome reason are excluded from the mean-tested discount (for example, because they donot qualify for the Oportunidades program) would receive no discount on their electric-ity bill. With a VDT, by contrast, households have the possibility of obtaining a discountby lowering their consumption. This provides a safety net for all households. On theother hand, the means-tested discount would have the most dramatic impact on the sub-sidy budget, because it effectively excludes non-poor households from subsidies andbecause the subsidy to the targeted poor can be limited to the first 100 kWh or 200 kWhof electricity consumed.
Changes in the Tariff Structure That Do Not Eliminate Subsidies for MostCustomers Will Not Substantially Improve Distributional Incidence
When the VDT and the means-tested discount scenarios are not combined with cost reduc-tions, they leave in place a subsidy of 20 percent per kWh for untargeted customers. Themore these untargeted customers consume, the larger their total subsidy. While the subsidyper kWh is higher for low-volume consumers (VDT) or poor households (means test), thelargest total subsidy still goes to the largest-volume consumers. As a result, while there issome improvement over the current tariff system, the overall distribution of subsidiesremains regressive even with rather significant changes in the tariff structure. To realizemajor improvements in the progressivity of subsidy distribution, it is critical to eliminateor significantly reduce subsidies for the majority of consumers.
Reducing Subsidies Would Entail Significant Increases in Customer Bills,Especially for Those in the Middle-income and Consumption Deciles
For the subsidy options assessed, the largest increases in tariffs are found among those inthe middle-income or consumption deciles. For the poorest, smaller absolute increases arestill significant compared to household income.
Any transition strategy toward an improved tariff and subsidy model needs to addresshow to mitigate the socioeconomic impact of rising utility charges for various strata ofthe population. Reducing supply costs, or reducing consumer bills through end-use effi-ciency improvements, would help to limit the increases in bills that would be needed tosignificantly reduce the magnitude of subsidies to residential customers. Other optionsinclude using some of the funds saved on consumption-based subsidies to compensatemiddle-class customers through tax rebates in the medium term, to increase transfersprovided to the poor through programs like Oportunidades or geographically targetedprograms (Ministry of Social Development, Secretaría de Desarrollo Social, SEDESOLmicro-regiones), or through increased transfers to the most affected states (such as thosewith warm summer climates).
xiv Executive Summary
11503-00b_Exec_Sum_rev.qxd 1/6/09 9:46 AM Page xiv

Reducing Costs Can Offset Part of the Need for Raising Tariffs and Any CostReduction Would Result in a Greater Proportion of Subsidies Going to Low-income Households
Improving supply efficiency and reducing costs would have a slightly progressive effect onsubsidy distribution since total costs (and therefore also the absolute impact of cost reduc-tions) are greatest among the largest-volume consumers. Low-income and low-consumptionhouseholds would see their subsidy shares rise slightly, while the share going to the rich andlarge-volume consumers would decline. Cost reductions would also have a greater impacton reducing the total volume of subsidies compared to minor changes in the existing tariffstructure. The simulation with ENIGH data indicates that a reduction in average costs of10 or 20 percent would permit aggregate residential subsidies to decline by 21 to 42 percent,respectively. Similar results are obtained using a consumption scalar with CFE data.
Better Information About Electricity Consumption Among the Poor is Needed
This study used two different sources of information to assess the performance of alter-native tariff and subsidy instruments—CFE billing data and ENIGH household surveydata. Neither source is ideal for examining the incidence of subsidies or the impact of tar-iff reforms on the poor. Having improved information about electricity consumptionamong the poor would be very useful for calibrating the design of any alternative subsidyprogram.
Mexico’s Electricity Subsidies in a Broader Social and Economic Context
The current electricity subsidy system in Mexico delivers the bulk of subsidy benefits tothe middle and upper-middle classes and to households consuming relatively largeamounts of electricity. One cannot argue that generalized electricity subsidies like theseare justified by positive externalities associated with electricity consumption. To the con-trary, electricity subsidies inflate demand, raise systemwide costs, contribute to the pro-duction of greenhouse gas emissions, and stimulate environmentally unfriendly behaviors,such as overpumping of groundwater. Nor is the “merit good” argument for subsidizingelectricity—the idea that a good should be subsidized because of its importance to well-being—very strong compared to other competing sectors (such as water and sanitation,for example).
Given the pronounced regressivity of the current system of residential subsidies inMexico, one cannot justify the existing subsidies as a pro-poor policy intervention. Sincethe late 1990s, Mexico’s social policy has moved increasingly toward the development oftargeted, means-tested social programs, but the electricity sector has yet to adopt this prin-ciple. It is clear from the simulations presented here that it would be possible to improvethe targeting of electricity subsidies to the poor through significant changes in tariff levelsand structure, and even more so if combined with reductions in the unit cost of service.Using means testing based on the Oportunidades program in any new tariff or subsidystructure would seem to be a logical extension of developments that have been made inother sectors in Mexico.
Executive Summary xv
11503-00b_Exec_Sum_rev.qxd 1/6/09 9:46 AM Page xv

It will be important to consider, however, whether the goal of subsidizing electricityfor the poor is to keep the price of electricity low for the poor (as prices for other customersrise) or whether electricity is to be used as a more general social policy vehicle for augment-ing the purchasing power of the poor. If the latter is the policy goal, then it is important torecognize that electricity service is a suboptimal choice of subsidy delivery instrument. First,some poor households (less than 4 percent of the overall Mexican population) do not haveelectricity connections and are thus excluded from any subsidy delivered through electric-ity tariffs. Second, electricity service does not have all the characteristics of a good targetingmechanism—it is an undifferentiated good that is used by non-poor households as well asthe poor. Third, because there is not a perfect correlation between electricity consumptionand income, it is difficult to use electricity bills to identify the poor and deliver subsidies tothem. Straight quantity-targeted subsidies delivered through the tariff structure will not bewell targeted.
Finally, Mexico has many other social programs that are better targeted to the poorthan electricity subsidies. If the goal is to increase transfers to the poor, it would be betterto use these mechanisms for reaching the poor. The idea that other social transfer programscould do a better job of reaching the poor than electricity subsidies is supported by inter-national experience. One study of the targeting of social policy instruments (Coady, Grosh,and Hoddinott 2003) shows that social funds, cash transfer programs, and work programsare much more likely than electricity subsidies to do a good job of targeting the poor.
xvi Executive Summary
11503-00b_Exec_Sum_rev.qxd 1/6/09 9:46 AM Page xvi
Mexican electricity subsidies are among the largest in the world in absolute terms(Table 1.1). They are equivalent to 1 percent of gross domestic product (GDP),0.8 percent of total federal public expenditure, and 40 percent of sector revenue
(Table 1.2).Large tariff subsidies have important implications for the electricity sector and for
Mexican society more generally. First, the cost of the subsidies needs to be covered insome way—if not by consumers, then by government; if not by the government, then byreduced expenditure on system expansion, service quality upgrading, and on operationsand asset maintenance. Fiscal transfers to the utilities divert resources from prioritysocial and economic programs and reduce fiscal space for financing essential investmentsin the electricity sector. The 2006 federal budget for investment in electricity (excludingthe Programas de Inversión de Impacto Diferido en el Gasto, Pidiregas) was 39,404 millionpesos, only slightly larger in nominal terms than it was in 2001. Investment in areas wherethe Pidiregas scheme is not applicable, such as distribution, has been constrained.
Second, subsidies distort price signals, elevating demand above what would otherwiseprevail if electricity was priced at marginal or average cost. Massive underpricing alsoreduces incentives for customers to take energy saving measures, such as replacing oldequipment and appliances. Higher customer demand requires additional power supply,especially to meet periods of peak demand. Because elevated residential electricity demandtends to lower load factors for the power system, it leads to reduced efficiency in the use ofgeneration and transmission facilities and thus a higher marginal cost of supplying all cus-tomer classes. This has potentially negative implications for economic competitiveness.
Finally, subsidies do not only carry monetary costs. They also impose environmentalcosts. Subsidies result in additional emissions from power plants, as demand for electricity
CHAPTER 1
Introduction
1
11503-01_Ch01.qxd 1/6/09 9:48 AM Page 1

grows in response to the subsidized prices. Further, standard merit order dispatch rules(plants with low capital costs, but high fuel costs, such as small fuel-oil and diesel-firedfacilities) exacerbate the tendency for marginal generating plants to generate higher levels ofpollutants. In rural areas, electricity subsidies for irrigation pumping cause overexploitationof groundwater reservoirs.
In short, there are many reasons to be concerned about the effects of large and grow-ing electricity subsidies. There is broad agreement in Mexico that something must be doneabout this pattern, but also recognition that making a lasting change will be very challeng-ing. Subsidies to residential and agricultural customers are deeply entrenched, and costrecovery levels are very low (Table 1.3). Although subsidies per unit are greater in agricul-ture, the total volume of subsidies going to residential customers is much larger.
Two-thirds of all electricity subsidies in Mexico are directed at residential electricitycustomers, and this share has increased over time. The subsidies provided to residentialcustomers have increased by 46 percent since the last tariff reform in 2002. Time and again,efforts to reduce subsidies have been followed by the creation of new and more highly sub-sidized tariff categories to offset the burden on those residential customers adverselyaffected by the last tariff change.
2 World Bank Working Paper
Table 1.1. Electricity Subsidies as a Percent of GDP and Gross National Expenditure, 2005
Electricity Subsidy 2005 Subsidy as a Subsidy as a Percent of Country name (current US$) Percent of GDP Gross National Expenditure
China 6,000,000,000 0.3% 0.3%
Indonesia 1,500,000,000 0.5 0.5
Mexico 8,876,000,000 1.1 0.8
India 10,000,000,000 1.2 1.2
South Africa 4,000,000,000 1.7 1.6
Saudi Arabia 5,500,000,000 1.8 2.7
Russian Federation 14,000,000,000 1.8 2.1
Iran, Islamic Rep. 3,500,000,000 1.8 2.0
Egypt, Arab Rep. 2,500,000,000 2.8 2.7
Ukraine 3,500,000,000 4.2 4.3
Source: World Bank GDF and World Development Indicators (WDI) Central Database (April 2007);IEA (2006).
Table 1.2. Total Mexican Electricity Subsidies in Relation to other Scalars (2002–06)
Electricity subsidies as a percent of: 2002 2003 2004 2005 2006
Total electricity revenues 44.4% 44.9 43.6 42.9 38.1
Federal investment budget for electricity 173.1% 203.6 237.2 235.1 243.8
GDP 1.0% 1.1 1.1 1.1 1.0
Total federal public expenditure 0.7% 0.8 0.8 0.8 0.7
Source: INEGI, Banco de Información Estadística; SHCP, DGYPT Subsecretaria de Ingresos; SENER“Estadísticas de Electricidad 2000–2006.”
11503-01_Ch01.qxd 1/6/09 9:48 AM Page 2

Numerous studies undertaken during the last sexenio documented the regressive inci-dence of these subsidies to residential customers: the bulk of the subsidies go to the non-poor. Cognizant of this problem, Mexican authorities have expressed a strong interest inevaluating the potential gains and impacts of a shift from quantity-based targeting throughthe tariff structure to means testing, building upon the poverty profiling and verificationsystems established under Oportunidades, Mexico’s well-functioning, means-tested con-ditional cash transfer program. The pilot effort for such a system was recently implementedwith Oportunidades Energéticas, which, with its 2,999-million-pesos annual budget, is smallrelative to existing tariff subsidies. This small program, begun in 2006, did not replace ormodify the existing tariff-based subsidies but rather operates in parallel with it.
This report responds to interest on the part of the Ministry of Social Development(Secretaría de Desarrollo Social, SENER), the Ministry of Finance (Secretaría de Hacienda yCrédito Público, SHCP), the Ministry of Social Development (Secretaría de DesarrolloSocial, SEDESOL), and other federal agencies in assessing the performance of alternativesubsidy mechanisms for residential customers and other options to reduce the magnitudeof subsidies and to improve their distributional impact. In addition to examining theimpact of expanding the use of means testing in the allocation of subsidies, this study alsoassesses the impact of modifying electricity tariff structures to improve distributional out-comes and reduce the overall magnitude of electricity subsidies.
Chapter 2 of the report describes the evolution of residential electricity subsidies andtariffs in Mexico and discusses the main factors that have contributed to the exceptionalgrowth of subsidies in recent years. Chapter 3 provides estimates of the distributional inci-dence of the subsidies among residential customers. Chapter 4 identifies several alternativesto the present subsidy mechanism, and their effects on the total volume and distributionalincidence of subsidies are estimated. Chapter 5 discusses the implications of the analysis anddirections for further work to better inform public policy in this area.
Residential Electricity Subsidies in Mexico 3
Table 1.3. Distribution of Electricity Subsidies, by Customer Class, 2006
Sales Subsidies Sector (Gigawatt hours) (2006 million pesos) Price/Cost Ratios
Residential 44.5 63,369 0.41
Commercial 13.2 5,476 0.92
Public services 6.6 2,887 0.77
Agriculture 8.0 9,211 0.30
General, medium tension 65.3 12,478 0.83
General, high tension 37.9 4,213 0.97
Total 175.4 97,633 0.68
Source: Aburto 2007. Includes LFC and CFE. Sales taken from CFE web page. Subsidies and ratioscompiled from SHCP data. Subsidies to LFC customs computed as LFC costs minus LFC revenues.
11503-01_Ch01.qxd 1/6/09 9:48 AM Page 3

11503-01_Ch01.qxd 1/6/09 9:48 AM Page 4

Defining and Measuring Subsidies
The electricity subsidies reported in Mexico are financial subsidies that result from below-cost pricing, and are measured as the difference between the price of electricity paid by con-sumers and the national average cost of supply.4 Costs are measured as accounting costs asreported by the two operating utilities—the Mexico National Electricity Commission(Comisión Federal de Electricidad, CFE) and Central Light and Power (Luz y Fuerza del Cen-tro, LFC)—according to government accounting standards. The subsidies to CFE havebeen financed by a bookkeeping transfer. The federal government essentially reimbursesCFE for providing subsidies to its customers by discounting the taxes and dividends(aprovechamiento5) that CFE would otherwise have to pay the government. Since 2002, thevolume of subsidies has exceeded the notional amount of aprovechamiento and has thusbegun to erode CFE’s capital base (World Bank 2005). In the case of LFC, the country’ssecond electricity provider covering the Valle de Mexico and surrounding areas, the gov-ernment provides the company with a direct cash subsidy to cover its mounting operatingdeficits and customer subsidies.
It is important to recognize that this accounting approach to measuring subsidiesignores the fact that the economic cost of electricity provision may be significantly higher
CHAPTER 2
Residential Electricity Subsidiesand Tariffs in Mexico
5
4. There are regional differences in costs across Mexico, related to fuel mix and technology in gener-ation and grid density and transmission voltages in transmission. These cost differences are not taken intoaccount in subsidy calculation. Cost differences are lower now than in the past due to the well-developedgrid. The regions with highest average cost are likely southern Baja California and southern Mexico, butthis is difficult to verify because CFE no longer publishes regional cost data.
5. Equal to 9 percent of net fixed assets.
11503-02_Ch02_rev.qxd 1/6/09 9:49 AM Page 5

than the accounting cost. Moreover, although households benefit from financial subsidiesin the form of lower bills, they may not capture the full value of the subsidy. When account-ing costs are unnecessarily high due to supply inefficiencies, utilities, their employees, andsuppliers capture part of the subsidy benefit. This is currently not taken into account inestimating the value of electricity subsidies received by residential electricity customers inMexico—there is an implicit assumption that electricity customers are the sole beneficia-ries of the subsidies.
Legal Framework for Tariffs and Subsidies
The legal framework governing electricity tariffs in Mexico establishes that tariffs shouldcover costs and promote efficient consumption. The tariffs of state-owned enterprises areto be set “in accordance with economic efficiency and financial health criteria” (Article 26,Reglamento de la Ley de Empresas Estatales). Electricity tariffs in particular will be “fixed,adjusted, and restructured in a way that tends to cover financial and public service expan-sion requirements, and rational energy consumption” (Article 31, Ley de Servicio Públicode Energía Eléctrica). Current residential electricity tariffs are far from meeting these objec-tives. Because only a small proportion of residential customers pay the marginal cost ofelectricity service, current tariffs achieve neither the cost recovery nor the efficient con-sumption provisions of the current legislation.
With respect to subsidies, federal law establishes that subsidies “shall be temporary”and shall be subject to criteria of “objectivity, equity, transparency, publicity, and selectiv-ity.” Moreover, “in programs of direct benefit to individuals or social groups, amounts andpercentages [of the subsidy] shall be determined on the basis of redistributive criteria thatmust privilege lower-income population and aim at equity amongst regions and states”(Article 75, Ley Federal de Presupuesto y Responsabilidad Hacendaria). In contrast, numer-ous reports produced during the last sexenio documented that residential electricity sub-sidies are highly regressive, and the analysis presented below confirms that the tariffrevision of 2002 did not redress this.
A Brief History of Tariffs and Subsidies
Explicit subsidies for residential customers were introduced in 1973 when the tariff waschanged into a three-block, increasing block tariff (IBT), with subsidized prices for the firsttwo blocks.6 IBTs provide “quantity-targeted” subsidies, meaning that the discount a cus-tomer receives depends on the quantity consumed. IBTs are the most common tariff struc-ture among electricity utilities in developing countries. One study found that utilities innearly 70 percent of countries applied IBTs, usually with three to four consumption blocks,and a first block of between 50 kWh and 100 kWh per month (Komives and others 2005).
In addition to quantity-targeted electricity subsidies, Mexico also offers “summersubsidies”—extra discounts to residential customers living in warm areas, where the demandfor air-conditioning is high. The first “summer subsidy” (Tariff 1A) was introduced in 1974for customers living in areas where temperatures exceeded 25 degrees Celsius (°C) for fourmonths of the year. Successive climate-based tariffs with increasingly subsidized rates over
6 World Bank Working Paper
6. See Appendix A for a detailed history of residential tariffs over the last four decades.
11503-02_Ch02_rev.qxd 1/6/09 9:49 AM Page 6

larger volumes of consumption were introduced in 1988 (Tariff 1B > 28 °C; 1C > 30 °C),1990 (1D > 31 °C), 1995 (1E > 32 °C), and 2002 (1F > 33 °C).
In 2002, an attempt was made to reduce residential electricity subsidies. Three billingschedules were introduced in each tariff zone—low, moderate, and high. The highest-volume consumers (roughly the top 5 percent of customers in each tariff zone before thetariff change) were charged a High Consumption Residential Tariff (Tarifa Doméstica deAlto Consumo, DAC), which included a fixed fee plus a uniform volumetric consumptioncharge, set slightly above estimated long-run marginal cost. For customers in the moder-ate billing schedule, prices in the top IBT blocks were increased. Even following the 2002tariff review, the entire volume of actual consumption was still subsidized for 75 percentof customers. Another 20 percent of customers were to receive subsidies for the majorityof their consumption. Only the 5 percent of residential customers paying DAC tariffs wereexpected to cover the costs of the service they received.
The 2002 tariff reform measures did not have a lasting impact on residential subsidyvolumes. As Figure 2.1 shows, subsidies to residential customers dropped slightly in realterms in 2002 but by 2003 they had risen above 2001 levels. Part of the reason for this wasthe introduction in 2002 of a yet larger summer subsidy—Tariff 1F. Since 2003, residentialsubsidies have continued to rise. The following Chapter discusses the factors that have con-tributed to the persistent increase in residential subsidies.
The accretion of modifications to the tariff structure introduced since the 1970s(see Appendix A) has created one of the most complex tariff systems in the world, with over112 different billing possibilities for residential customers (see Appendix B). This is certainlymore complex than the tariffs applied in other Latin American countries. For example, Peru,
Residential Electricity Subsidies in Mexico 7
0
10
20
30
40
50
60
70
1997 1998 1999 2000 2001 2002 2003 2004 2005 2006
Con
stan
t 200
6 bi
llion
es o
f pes
os
Figure 2.1. Subsidies to Residential Customers (2006 constant billion pesos)
Source: Aburto 2007, based on data from SHCP.
11503-02_Ch02_rev.qxd 1/6/09 9:49 AM Page 7

where electricity provisionoutside of Lima is suppliedby state-owned companies,has only 1 residential tariffwith three different billingoptions according to con-sumption level. Uruguay hasone national utility provid-ing electricity and only tworesidential tariffs. In otherLatin American countries thathave more than one electric-ity provider, each of the elec-tricity utilities has between 1 and 3 residential tariffs(CIER 2005).
Compared to otherOrganisation for EconomicCo-operation and Develop-ment (OECD) and middle-income countries in LatinAmerica, average residentialelectricity tariffs in Mexicoare very low (Table 2.1).7
Among Latin Americancountries, Mexico’s tariffs sit in the bottom third of the distribution. Among OECD countries,even the highest average tariff paid by consumers in Mexico is among the lowest.
Growth of Residential Electricity Subsidies
The factors responsible for the growth of residential electricity subsidies in recent years aredescribed below.
Summer Subsidies and Tariff Reclassifications
One of the main factors driving the growth of residential subsidies has been the subsidizedtariffs for warm areas—the summer subsidies. Each new tariff category has providedgreater discounts over larger volumes of consumption for customers in a particular cli-matic zone. These new lower tariffs to warm areas are not justified based on lower aver-age costs in warmer regions. The goal rather is simply to extend greater subsidies tohouseholds in areas where air-conditioning and fans are common household fixtures.
The difference between the subsidies provided through Tariff 1 and the most recentsummer subsidy tariff (Tariff 1F) is particularly noteworthy (Table 2.2). Each month, a
8 World Bank Working Paper
Table 2.1. Average Residential Electricity Prices (2006)
Country US$ / kWh
Republic of Korea 0.089
Mexico, all Residential Tariffs (excluding DAC) 0.090**
United States 0.096
Colombia 0.098
Chile 0.109
Mexico, all Residential Tariffs 0.101**
Uruguay 0.117
Turkey 0.119
France 0.137
Brazil 0.143
Spain 0.154*
United Kingdom 0.158
Japan 0.196*
Germany 0.198*
*Last available data.**2006 average.Source: IEA, Key World Energy Statistics 2006; World BankElectricity Benchmarking Database for Latin America and theCaribbean; Mexico, 1 and DAC tariffs, computed from dataon CFE’s web page. Data are for first quarter and includetaxes (except in the United States).
7. A 15 percent VAT is added to the electricity bills in Mexico, but this is not included in the averagetariff figures listed in comparison tables or in the analysis of tariff and subsidies in Mexico.
11503-02_Ch02_rev.qxd 1/6/09 9:49 AM Page 8

customer in the Tariff 1F zone can consume 10 times the amount of electricity as a customerin the Tariff 1 zone (an additional 2,250 kWhs per month) before paying the unsubsidizedDAC tariff. According to CFE estimates, this is equivalent to the energy needed to run threelarge air coolers (aire lavado), or two new 1.5-ton window air-conditioning units 24 hoursa day. Households that run their air-conditioners only at night or that have smaller unitscould run two to three times this many air-conditioners with their extra share of subsidizedelectricity.
The subsidy per kWh provided to customers in Tariff 1F is also much larger than that pro-vided to customers of Tariff 1, even at the same level of consumption. For the first 75 kWhsconsumed, those in Tariff 1 pay one-third more per kWh than those in Tariff 1F. For the next75 kWh, customers in Tariff 1 pay two-thirds more than those in Tariff 1F.
Residential Electricity Subsidies in Mexico 9
The introduction of Tariff 1F resulted in a loss of revenue from all customers located inthis tariff category. But from 2002 to 2006, there were also many other reclassifications of cus-tomers to more subsidized tariffs. Requests for reclassification are ostensibly based on newclimatic information but do not appear to have been subject to independent verification.
Appendix C reports the number of customers reclassified each year since the 2002 tar-iff revision, plus the static cost of that reclassification (in the year of reclassification only).Tables 2.2 and 2.3 summarize this information. The number of reclassifications was espe-cially high (nearly 3 million customers reclassified) during the period immediately followingthe 2002 Tariff Review. The bulk of the reclassifications were from tariff 1E to the new 1Fand from 1B to 1C. Most reclassified communities moved to the next, more highly subsi-dized tariff category (for example, from 1 to 1A or from 1D to 1E), but some communitiesmanaged to jump two or three tariff levels (for example, from 1B to 1D).
The estimation of the cost of these reclassifications (as reported in Table 2.2 andAppendix C) are single-year estimates (that is, in the year of reclassification). Of course,reclassifications represent a permanent loss of revenue to the electricity utilities. Althoughthe pace of reclassifications has slowed in recent years, the cost of these reclassifications willgrow exponentially over time as a greater percentage of total consumption is billed out atmore subsidized rates.
Table 2.2. Comparison of Charges: Tariff 1 and Tariff 1F, 2006 (Mexican pesos)
Billing Schedule Tariff 1 Summer Tariff 1F Summer
Low Range:
Moderate Range:
High Range:
Up to 1200 kWh per month
♦ Minimum charge 13.88♦ 0–300: 0.448 / kWh♦ >175: 0.586 / kWh
1200–2500 kWh per month
♦ 0–300: 0.448 / kWh♦ 300–900: 0.743 / kWh♦ >900: 1.39 / kWh
More than 2500 kWh:
♦ All consumption: DAC
Up to 140 kWh per month
♦ Minimum charge 15.88♦ 0–75: 0.635 / kWh♦ >75: 0.749 / kWh
140–250 kWh per month
♦ 0–75: 0.635 / kWh♦ 75–125: 1.043 / kWh♦ >125: 2.213 / kWh
More than 250 kWh:
♦ All consumption: DAC
11503-02_Ch02_rev.qxd 1/6/09 9:49 AM Page 9

Table 2.4 illustrates this compounding effect for the years 2002–06. While total elec-tricity sales to residential customers have gone up by 14 percent, the increase has not beenevenly distributed across tariff zones (Figure 2.2). Sales in Tariff 1 remained stable dur-ing this period, and sales in 1A and 1B have gone down slightly. Sales in the more sub-sidized 1C, 1D, 1E, and 1F all increased. By 2006, 9 percent of all residential electricitysales were to customers in Tariff 1F, which comprises 3 percent of residential customers.In comparison, the unsubsidized DAC tariff accounted for only 8.4 percent of all elec-tricity sales, and for only 2 percent of customers. After 2002, many of the 5 percent of cus-tomers to whom the DAC tariff was originally applied managed to move into anothertariff category, either as a result of being reclassified or by reducing their consumptionbelow the DAC threshold.
Given this shift in energy sales to more subsidized tariff categories, it is not surprisingthat the average price charged to CFE residential customers has risen more slowly than theaverage price charged to LFC customers (where no reclassification is possible because allcustomers fall under Tariff 1).8 If one attributes this increasing gap in average tariff to thereclassifications, then the cumulative cost of the reclassifications between 2002 and 2006
10 World Bank Working Paper
Table 2.3. Number of Customers Reclassified and the Cost of Reclassification
Cost in additional Subsidies, in Year Customers Reclassified Year of Reclassification Only (million pesos)
2002 1,309,347 524.9
2003 1,648,626 374.4
2004 209981 135.2
2005 243913 66.7
2006 71255 34.5
Source: Aburto, based on data from CFE and Hacienda.
Table 2.4. Number of Residential Customers Reclassified between Tariff Categories,2002–06
2002 2003 2004 2005 2006 Total
1 to 1A 20,577 16,219 77,452 23,775 138,023
1A to 1B 33,991 42,558 2485 25,958 104,992
1B to 1C 639,560 876,783 5990 103,188 40,605 1,666,126
1C to 1D 11,076 275,134 25,084 16,340 421 328,055
1D to 1E 34,882 55,846 161,740 3,246 5,814 261,528
1E to 1F 564,208 14,275 578,483
Note: The table includes most common reclassifications only. The full list of reclassifications isreported in Appendix C.Source: Aburto, based on data from CFE and Hacienda.
8. In 2000 and 2001, LFC and CFE average tariffs were nearly identical.
11503-02_Ch02_rev.qxd 1/6/09 9:49 AM Page 10

Residential Electricity Subsidies in Mexico 11
appears to be around 15 billion pesos (Aburto 2007). To put this figure in perspective, thisis about 23 percent of the total value of residential electricity subsidies in 2006 and 38 per-cent of the 2006 federal investment budget for electricity.
Accounting Costs and Inefficiency
At the same time that CFE has lost potential revenue through tariff reclassifications, costs atCFE and LFC have been rising. Since 2002, CFE’s average cost per Megawatt-hour (MWh)provided to all customer groups has increased by 20 percent in real terms (Table 2.5).
The main factors driving the increase in costs were power purchases and fuel costs,employee retirement payments, and wages and benefits. While the proportion of mainte-nance and depreciation to unit costs, and taxes and financing costs to unit costs, fellbetween 2002 and 2006 in real terms, power purchases and fuel costs increased by 70 per-cent over this five-year period. This was due at least in part to high gas prices in recent yearsand to the policy (since 1994) of expanding generating capacity through natural-gas-firedcombined-cycle plants. Increased purchases of power from independent private providersmay also be driving this increase, in which case one would have expected to see this offsetby cost reductions in CFE operations. Instead, the contributions to retirement paymentsand to wages and benefits at CFE increased by 35 percent and 24 percent, respectively,between 2002 and 2006.
LFC costs per MWh are roughly double those of CFE. Some of this difference is attrib-utable to important structural and functional differences between CFE and LFC—the
0.00
0.05
0.10
0.15
0.20
0.25
0.30
0.35
0.40
0.45
DAC 1 1A 1B 1C 1D 1E 1FTariff category
% o
f en
erg
y sa
les
2002
2006
Figure 2.2. Electricity Sales by Tariff Category, in 2002 and 2006
Source: Based on Aburto 2007, with CFE statistics.
11503-02_Ch02_rev.qxd 1/6/09 9:49 AM Page 11

Examining trends in unit costs is one way of assessing efficiency. Another indicator ofefficiency is statistics on transmission and distribution losses. Transmission losses as a per-centage of received energy have been declining in percentage terms in both CFE and LFCas a result of an ambitious CFE investment program, financed through the Pidiregasscheme. Reported losses are now under 2 percent for CFE, which is an internationally com-petitive standard. They are under 3 percent for LFC, the level achieved by CFE only in 2002.However, distribution losses in both companies have been increasing and are extremelyhigh in the case of LFC. CFE’s distribution losses rose from 11 percent in 2000 to 11.6 per-cent in 2005. As a point of comparison, a good international standard for distributionlosses, for a utility with CFE’s load and geographic characteristics, would be around 8 per-
12 World Bank Working Paper
Table 2.5. CFE Accounting Costs per MWh, 2002–06 (2006 pesos)
Percent Change,Cost Concept 2002 2003 2004 2005 2006 2002–06
Wages and benefits 110 118 135 133 136 24%
Retirement payments 86 99 96 104 116 35
Power purchases and fuels 350 514 535 612 595 70
Maintenance and depreciation 249 265 220 206 208 −16
Taxes and financial cost 327 350 314 294 304 −7
Total cost 1,121 1,345 1,300 1,350 1,359 24
Source: Prepared by Petrelec from CFE sources.
Table 2.6. LFC Accounting Costs per MWh, from 2002 to 2006 (2006 pesos)
Percent Change, Cost Concept 2002 2003 2004 2005 2006 2002–06
Wages and benefits 452 487 522 540 579 28%
Retirement payments 634 461 554 494 548 −14
Power purchases and fuels 808 1,008 1,407 1,337 1,682 108
Maintenance and depreciation 142 149 151 152 147 3
Taxes and financial cost 1.21 1.59 1.20 1.09 1.04 −14
Total cost 2,038 2,107 2,635 2,524 2,956 45
Source: Aburto 2007 from CFE sources.
latter is essentially a distribution utility while the former is a vertically integrated electricityutility handling generation, transmission, and distribution. Moreover, LFC’s customer mixis heavily weighted toward low-tension customers, because there is little industry in its ser-vice area. Nonetheless, even given these differences, LFC has much higher personnel costs.The contribution of wages and benefits and of retirement payments to unit costs in LFC isnearly four times greater than in CFE. Overall, LFC’s unit costs have seen a 45 percentincrease in real terms over the last five years (Table 2.6).
11503-02_Ch02_rev.qxd 1/6/09 9:49 AM Page 12

cent. LFC’s distribution losses have also been increasing and are very high, exceeding 30 per-cent since 2005.
Increasing real unit costs and high and increasing distribution losses are both bad forelectricity subsidy budgets. Unless these are matched by real increases in average tariffs, theincreasing electricity supply costs lead to increasingly higher subsidies. The creation ofsummer subsidy programs and the reclassification of customers to more subsidized tariffswork against efforts to bring prices in line with costs, achieve financial sustainability, andmanage the federation’s fiscal exposure in the sector. The fact that virtually all residentialcustomers of both utilities are subsidized also means that the 3.56 million new customersthat were connected between 2002 and 2006 were an added financial burden to the utili-ties and also increased the overall subsidy budget.
Residential Electricity Subsidies in Mexico 13
11503-02_Ch02_rev.qxd 1/6/09 9:49 AM Page 13

11503-02_Ch02_rev.qxd 1/6/09 9:49 AM Page 14

The failure to halt the growth in subsidies, despite the intentions of the 2002 tariffreview, is troubling and reason to consider serious changes in pricing and subsidypolicies for electricity. Yet, the public policy concern is not just the magnitude of
subsidies but also their distributional incidence:
■ Who benefits from these subsidies and how are they distributed across differentincome groups?
■ Are electricity subsidies delivered through a tariff system dominated by increasingblock tariffs and “summer subsidies” a good way to subsidize the poor and to keeptheir electricity expenditures low?
To address these questions, it is necessary to evaluate the distributional incidence of resi-dential electricity subsidies.
Usually, “distributional incidence” refers to the distribution of subsidies by incomelevel—how pro-poor is the subsidy expenditure? However, evaluating the distributionalincidence of electricity subsidies is complicated by the fact that utility databases—a goodsource of information about electricity consumption—do not contain information aboutthe income level of residential customers: it is not possible to identify which customers arepoor and which are not.
There is generally a strong correlation between income and electricity use becausewealthier households have larger homes with more electricity-consuming appliances. Butthis does not mean that all of the lowest-volume electricity consumers are poor, or that allpoor households consume little electricity. The vacation homes of rich households, forexample, may have low consumption levels during much of the year. The same is true forthe apartments of single professionals who work long hours away from the home. Likewise,
CHAPTER 3
Distributional Incidence ofResidential Electricity Subsidies
15
11503-03_Ch03.qxd 1/6/09 9:50 AM Page 15
consumption by poor households can be higher than expected in some cases, because theyhave old, inefficient appliances, because they have electricity-using home-based businesses,or because multiple poor households share a single electricity connection. In Mexico, withits climatic variations by region, it is also common that poor households in hot areas con-sume more electricity than non-poor households in more temperate zones. For all thesereasons, a strict relationship between income and electricity consumption cannot beassumed.
With this in mind, two kinds of data are used to assess the distributional incidence ofresidential electricity subsidies. The resulting estimates are not directly comparable, butrather can be legitimately used to answer specific questions:
■ CFE data on the distribution of costs and electricity consumption within each tar-iff class are used to examine the distribution of subsidies by consumption level. Whatpercentage of subsidies goes to lower-volume consumers?
■ Information on electricity expenditure from the Mexico National HouseholdIncome and Expenditure Survey (Encuesta Nacional de Ingresos y Gastos de losHogares, ENIGH) household survey is used to estimate the distribution of subsidiesby income quintile. What percentage of the subsidies goes to the poor? And howdoes the distributional incidence of electricity subsidies compare to that of othergovernment expenditures?
Appendixes 4 and 5 describe the methodologies used with each data source.
Do Subsidies Favor Low-volume Consumers?
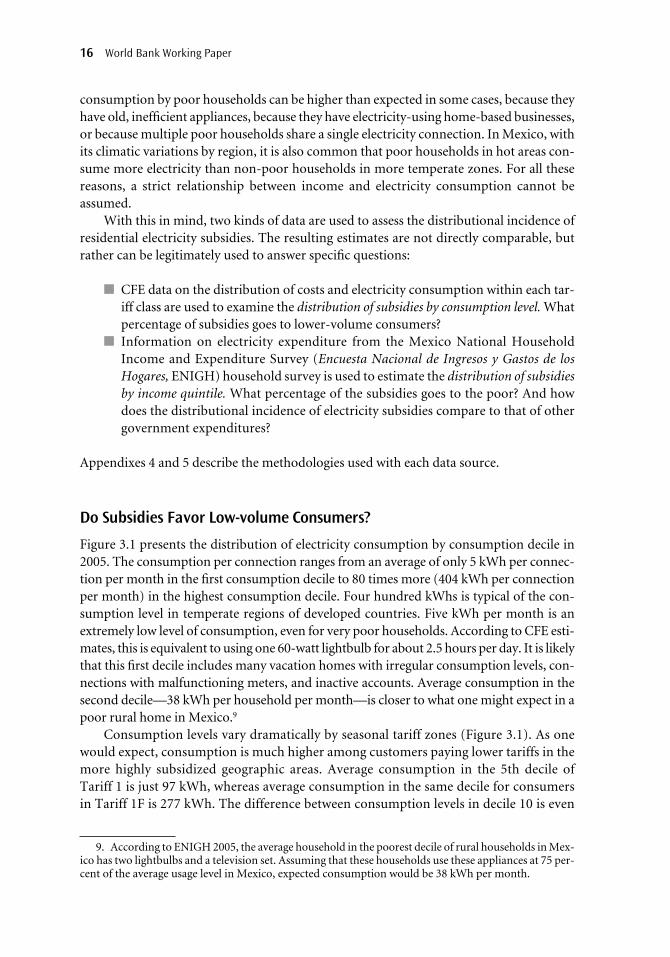
Figure 3.1 presents the distribution of electricity consumption by consumption decile in2005. The consumption per connection ranges from an average of only 5 kWh per connec-tion per month in the first consumption decile to 80 times more (404 kWh per connectionper month) in the highest consumption decile. Four hundred kWhs is typical of the con-sumption level in temperate regions of developed countries. Five kWh per month is anextremely low level of consumption, even for very poor households. According to CFE esti-mates, this is equivalent to using one 60-watt lightbulb for about 2.5 hours per day. It is likelythat this first decile includes many vacation homes with irregular consumption levels, con-nections with malfunctioning meters, and inactive accounts. Average consumption in thesecond decile—38 kWh per household per month—is closer to what one might expect in apoor rural home in Mexico.9
Consumption levels vary dramatically by seasonal tariff zones (Figure 3.1). As onewould expect, consumption is much higher among customers paying lower tariffs in themore highly subsidized geographic areas. Average consumption in the 5th decile of Tariff 1 is just 97 kWh, whereas average consumption in the same decile for consumersin Tariff 1F is 277 kWh. The difference between consumption levels in decile 10 is even
16 World Bank Working Paper
9. According to ENIGH 2005, the average household in the poorest decile of rural households in Mex-ico has two lightbulbs and a television set. Assuming that these households use these appliances at 75 per-cent of the average usage level in Mexico, expected consumption would be 38 kWh per month.
11503-03_Ch03.qxd 1/6/09 9:50 AM Page 16

larger: the largest volume consumers in Tariff 1 use 270 kWh per month on average, com-pared to 1240 in Tariff 1F.
To calculate the subsidies accruing to each electricity connection, electricity bills werecompared to the cost of service received. A two-part cost function (fixed charge per connec-tion plus variable cost per kWh) is derived from CFE data (see Appendix D). CFE costs areused as the standard cost estimate for all customers to help approximate the value of thesubsidy that households receive, rather than the portion of the subsidy that accrues to autility with higher costs (LFC in this case).
Table 3.1 shows the distribution of residential electricity subsidies by consumptiondecile. The distribution of subsidies is heavily skewed toward above-average users ofelectricity. The subsidy received per kWh is highest in the lowest consumption deciles,but the total value of the subsidy received per connection per month is smallest in these low-consumption deciles. The first five consumption deciles receive only 25 percent of thetotal volume of subsidies.
The average monthly subsidy per connection increases through decile 8, then declinessomewhat in deciles 9 and 10. These top two deciles receive 14.2 and 10 percent of the sub-sidies, respectively.
The slightly lower proportion of subsidies in the highest deciles is a result of reformsinstituted in the 2002 tariff review (the introduction of the DAC tariff and the intermediateconsumption schedule). One study (Aburto 2003), conducted just after the tariff reform andusing a similar methodology, found that the top decile of consumers received only 4.4 percent
Residential Electricity Subsidies in Mexico 17
Consumption by tariff Category
3 30 50 66 91 105 113 141 171 2703 27 43 65 87 100 116 139 166
334
4 31 56 80 101 121 145 171209
419
952
86112
137 164 190229
588
856
94126
151184
216266
1375
125161
202249
284
365
17
107
176235
511
286
667
333
895
463
277
348
420
1240
677
0
500
1000
1500
2000
2500
3000
3500
4000
4500
5000
1 2 3 4 5 6 7 8 9 10
Decile
kWh
/ M
on
th
1F1E1D1C1B1A1
Figure 3.1. Monthly Electricity Consumption, by Tariff Category and Consumption Decile
Source: Aburto 2007 using 2005 CFE data.
11503-03_Ch03.qxd 1/6/09 9:50 AM Page 17

of residential electricity subsidies. Their share of the total subsidy appears to have doubledsince then, suggesting that large-volume consumers have gained back some of the subsidyshare they lost in 2002. In the medium term, therefore, the 2002 tariff revision did little toeither shift subsidies to low-volume consumers or to restrain the growth of the overall vol-ume of subsidies.
The very large seasonal subsidies are a major factor contributing to the highly regressivedistribution of the subsidies. From Figure 3.2 it is clear that the more recent the tariff, themore regressive the distribution. The distribution of subsidies across consumption decilesbecomes increasingly regressive going from Tariff 1 to Tariff 1F. Among households subjectto Tariff 1F, the most recently created tariff category, the highest consumption decile receivesan astounding 20 percent of total residential subsidies.
Importantly, the subsidies provided under all tariff categories (even Tariff 1, which doesnot have a special summer subsidy) are skewed toward higher-volume consumers. The com-mon element in each tariff is the use of an increasing block tariff (IBT) structure for two ofthe three consumption schedules. Only those in the top consumption schedule pay a DACtariff, which is a flat volumetric tariff plus a fixed charge. The other two groups are billed withan IBT of either two or three blocks, with a minimum charge.
It is widely believed that IBTs are an effective way of targeting subsidies to the poorand to low-volume consumers. However, a global review of the distributional conse-quences of delivering subsidies through IBTs found that they are almost universallyregressive and usually provide larger subsidies to large-volume and high-income con-sumers (Komives and others 2005). The experiences in Mexico are consistent with thisfinding.
IBTs do deliver the largest subsidy per kWh to the smallest-volume consumers (pro-vided there is no fixed charge). However, the total subsidy per month is higher for larger-volume consumers because they consume so many more subsidized kWhs—a smaller
18 World Bank Working Paper
Table 3.1. Distribution of Residential Electricity Subsidies by Consumption Decile
Average Total Average Average Consumption Subsidy Subsidy Subsidy Subsidy Cumulative
kWh/ Mpesos/ Pesos/ Pesos/ Distribution Subsidy Decile HH-month yr kWh HH-year % %
1 5 1,402 9.03 550 2.6 2.6
2 38 2,980 2.56 1,169 5.6 8.2
3 64 4,003 2.05 1,571 7.5 15.8
4 85 4,801 1.85 1,884 9.0 24.8
5 111 5,737 1.70 2,251 10.8 35.6
6 131 6,463 1.62 2,536 12.2 47.7
7 148 6,981 1.55 2,739 13.1 60.9
8 181 7,961 1.44 3,124 15.0 75.8
9 224 7,529 1.10 2,954 14.2 90.0
10 404 5,314 0.43 2,085 10.0 100
Source: Aburto 2007 using 2005 CFE data.
11503-03_Ch03.qxd 1/6/09 9:50 AM Page 18

subsidy per unit over more units of consumption translates into a larger total subsidy peryear. IBTs become even more regressive when a fixed charge is added to the tariff becausethe lowest-volume consumers then pay the highest price per kWh.
One of the reasons that IBTs produce such a regressive distribution of subsidy ben-efits is that almost all of the consumption of large-volume users remains subsidized.This is the case in Mexico, where very few residential customers pay an unsubsidizedunit price for their electricity consumption. In theory, one could improve the distrib-utional incidence of an IBT by raising the last block of an IBT to a price higher thanaverage cost, such that large-volume consumers “pay back” the subsidy they receive ontheir first units of consumption. In practice, however, this rarely happens because thereis much pressure to retain large blocks with highly subsidized consumption. The recent“summer subsidy” tariffs in Mexico are examples of IBTs with extremely large subsi-dized consumption blocks. Even in other tariff zones, however, the IBT blocks are largeenough that most consumption is subsidized. In Mexico during the summer monthsonly 2 percent of consumers in Tariff 1, 1 percent of those in Tariff 1C, and even fewercustomers in the other tariff categories end up paying more than what it costs to servethem (Aburto 2007).
Residential Electricity Subsidies in Mexico 19
Figure 3.2. Distribution of Electricity Subsidies, by Tariff Zone and Consumption Decile, 2005
12
34
56
78
910
11A
1B1C
1D1E
1F
0.00
5.00
10.00
15.00
20.00
25.00
Subs
idy
shar
e by
dec
ile
DecileTariff Category
Distribution of Electricity Subsidies by Tariff Zone & Consumption Decile (2005)
1 1A 1B 1C 1D 1E 1F
Source: Aburto 2007 using 2005 data from CFE.
11503-03_Ch03.qxd 1/6/09 9:50 AM Page 19
In sum, Mexico’s existing residential tariff structures disproportionately benefit larger-volume consumers, both because of the summer subsidies but also because of the use ofIBT structures for most customers. The modifications instituted through the 2002 tariffreview (the DAC and the higher price in the third block of the IBT for the intermediateconsumption schedule) were insufficient to make any significant difference in the distrib-utional incidence of the subsidies.
Subsidies for the Poor?
The above analysis makes it clear that residential electricity subsidies in Mexico dispro-portionately benefit large-volume consumers and those living in warm regions. This Chap-ter assesses whether the current subsidy system delivers the majority of benefits to thenon-poor. Assessing the distributional incidence of subsidies across income rather thanconsumption deciles also permits comparison of the benefit incidence of electricity subsi-dies to that of other public spending programs in Mexico. For this analysis, the ENIGH2006 household survey was the primary source of information. The methodology used isdescribed in Appendix E.
ENIGH does not collect information on electricity consumption but rather on house-hold expenditures for electricity. To estimate the volume of subsidies received by eachincome decile, it was first necessary to infer the electricity consumption of each house-hold. Two approaches were used: (a) using reported household electricity expenditureand the applicable tariff schedule, and (b) using information about appliance ownership.10
Both estimates suggest that the electricity consumption curve is much flatter acrossincome deciles than across consumption deciles (Figure 3.3).11 When electricity con-sumption is estimated using reported expenditure, there is nearly a threefold differencebetween the poorest decile (139 kWh per month) and the richest (380 kWh per month).Estimates based on appliance ownership suggest that the rich consume four times moreelectricity than the poor. Both approaches generate similar estimates of electricity con-sumption among the poorest groups. As one would expect, at all income levels, con-sumption is higher among households subject to the more subsidized tariffs—those livingin warmer regions (Table 3.2).
20 World Bank Working Paper
10. ENIGH collects information on electricity-using appliances, from lights to air-conditioning.Applying CFE’s estimates of average use of these appliances, we were able to estimate electricity con-sumption in each household.
11. There are several reasons why average consumption derived from household expenditure surveysis higher than average consumption levels derived from CFE histograms. First, estimates using ENIGHdata only include households, not vacation homes, inactive contracts, and so forth. Second, the reportedresults are only for households with non-zero expenditure on electricity. Thus, those with nonfunction-ing meters or illegal connections are not included. Third, the ENIGH sample is not designed to be repre-sentative of the different tariff zones. Fourth, households may mis-report their electricity expenditure (forexample, by reporting bimonthly rather than monthly consumption or systematically understating or over-stating expenditure). It is worth noting, however, that average reported expenditure among the poor inthe ENIGH survey is very similar to average reported expenditure in a recent Oportunidades Energéticassurvey. Moreover, the consumption estimates based on appliance ownership are consistent with reportedexpenditure levels, at least among the poor.
11503-03_Ch03.qxd 1/6/09 9:50 AM Page 20

0
100
200
300
400
500
600
1 2 3 4 5 6 7 8 9 10
household deciles
esti
mat
ed k
Wh
kWh from spending kWh from appliances
Residential Electricity Subsidies in Mexico 21
Figure 3.3. Estimated Electricity Consumption (kWh per month) by Income Decile UsingTwo Different Methodologies
Source: Scott 2007 using ENIGH data.
Table 3.2. Estimated Electricity Consumption (kWh per Month), by Income Decile andTariff Zone
Income Decile Average 1 1A 1B 1C 1D 1E 1F
1 146 115 124 165 222 297 538 345
2 189 129 176 196 309 415 500 804
3 210 146 190 187 360 419 508 640
4 212 143 212 200 329 426 516 545
5 244 159 229 204 372 416 551 791
6 248 167 209 214 380 506 553 806
7 273 167 269 245 411 516 627 1023
8 277 168 245 237 429 606 704 807
9 336 189 262 246 489 581 765 1209
10 391 229 284 349 613 641 901 1405
Average 230 163 221 223 423 506 629 951
Source: Scott 2007 using ENIGH data to estimate consumption based on reported expenditure.Consumption among households reporting non-zero electricity expenditure.
Tariff Zone
11503-03_Ch03.qxd 1/6/09 9:50 AM Page 21

Table 3.3 presents the distribution of electricity subsidies by income decile. It com-pares the distributional incidence of subsidies provided through the tariff structure to thesubsidies provided through the Oportunidades Energéticas program. The subsidies deliv-ered through the tariff structure are regressive, with the poorest 40 percent of householdscapturing only about 30 percent of the subsidies. This is significantly less than they wouldreceive if subsidies were randomly distributed to all utility customers. In contrast, the rich-est 40 percent of households receive 50 percent of the subsidies.
As expected, the subsidized summer tariff schedules are more regressive than Tariff 1.The poorest 10 percent of households in Tariff 1 receive 9.5 percent of the subsidies deliv-ered to households in that tariff group, whereas the poorest 10 percent of households inTariff 1F receive less than 1 percent of the subsidies given to this customer group. The lastrow of Table 3.3 presents a measure of the relative regressivity of the tariffs delivered toeach tariff class. The measure divides the percentage of subsidies delivered to householdsin the first four deciles of each tariff by 40, which is the percentage of subsidies that thepoorest four deciles would receive with a universal or random distribution of subsidies.When the result is greater than 1, the subsidy is progressive and the poor receive more thanthey would with a random distribution of subsidies. Only the means-tested OportunidadesEnergéticas subsidy accomplishes this goal: the poorest 40 percent of households receiveover 85 percent of these subsidies. When the result is less than 1, the subsidy is regressive,and the poor do worse than they would with random distribution. Tariffs 1–1F are allregressive, but Tariffs 1C, 1E, and 1F perform particularly poorly. In these tariff groups,the poorest 40 percent of households receive about half what they would if subsidies weredistributed randomly or equally to all households.
Tariffs 1–1F each consist of a series of IBTs plus a flat volumetric DAC tariff for thehighest-volume consumers. In general, IBTs perform poorly in distributional terms. Table 3.4examines the targeting performance of IBTs in other countries, using the measure ofregressivity presented in Table 3.3. The best performance among the examples listed in thetable is in Hungary, where there is universal access to electricity and little difference in con-sumption between poor and non-poor. The poorest performance is in countries with verylow coverage, like Rwanda and Cape Verde, where many households are excluded fromsubsidies simply because they do not have an electricity connection. Mexico performssomewhere between Cape Verde and India (0.61), even though it has much higher cover-age levels than either of these countries. This is an indication of just how regressive thetariff structure in Mexico is.
When evaluating the significance of subsidies for poor households, one must lookbeyond just the distributional incidence of subsidies. Another important measure is theerror of exclusion, the percentage of poor households that do not receive any subsidy at all(Table 3.4). With IBTs, virtually all connected households generally receive a subsidy, soerrors of exclusion are usually driven by those households that are still unconnected. InMexico, with a 96 percent coverage rate, the error of exclusion is relatively low.
Another consideration in assessing the impact of subsidies is their magnitude relativeto household income. Mexico’s electricity subsidies represent a larger percentage of incomeamong the poor than among the non-poor (Figure 3.4). For the poorest 20 percent ofhouseholds, the subsidies are equivalent to about 5 percent of income, for the richest only1 percent. This means that the subsidies do contribute to reducing inequality in purchasingpower in Mexico. It may seem surprising that even the most regressive tariffs (in absolute
22 World Bank Working Paper
11503-03_Ch03.qxd 1/6/09 9:50 AM Page 22

Residential Electricity Subsidies in Mexico
23
Table 3.3. Distribution of Electricity Subsidies by Income Decile in each Tariff Category (ENIGH 2006)
Oportunidades Cumulative Deciles Energéticas Total Total 1 1A 1B 1C 1D 1E 1F
1 35.0 5.7% 5.7% 9.5% 8.1% 13.7% 2.3% 2.9% 4.6% 0.5%
2 21.1 7.6 13.3 10.1 10.6 12.9 4.8 6.8 6.5 4.4
3 17.6 8.0 21.3 10.0 10.2 9.8 6.5 7.2 8.0 5.8
4 10.1 8.9 30.2 10.4 12.3 10.7 6.8 13.5 6.8 6.9
5 6.6 10.3 40.5 10.8 9.5 9.6 9.8 9.3 12.3 10.7
6 3.8 10.5 51.0 10.9 10.7 9.6 12.3 6.2 10.4 8.7
7 2.9 12.0 62.9 11.6 9.5 9.2 12.2 13.9 12.9 13.4
8 1.7 11.5 74.5 10.2 10.3 9.8 15.2 10.9 12.3 8.3
9 0.7 13.3 87.8 8.9 11.9 10.2 17.0 15.5 15.0 15.8
10 0.6 12.2% 100.0% 7.8% 6.9% 4.6% 13.1% 13.8% 11.1% 25.6%
Subsidy to deciles 1–4/40 2.10 0.61 0.76 0.83 0.84 0.45 0.69 0.53 0.43
Source: Scott 2007.
Subsidies in Tariff Structures
11503-03_Ch03.qxd 1/6/09 9:50 AM Page 23

terms) are less regressive than the distribution of income in Mexico, and are especially sig-nificant for the poor in the warm localities where the most regressive tariffs are applied.This situation arises because of the high electricity consumption of households in hot local-ities, including the poor, and the large subsidies they receive per kWh. Estimated monthlyelectricity consumption among the poor in tariff zones 1D, 1E, and 1F is two to three timesgreater than consumption among the poor in tariff zone 1 or 1A (Table 3.2). As a result,
24 World Bank Working Paper
Table 3.4. Targeting Performance of Subsidies Delivered through IBTs
Country with IBT for Index of Regressivity: Electricity (1.0 = neutral distribution) Error of Exclusion (%)
Rwanda 0.35 87.2
São Tomé and Principe 0.41 76.8
Cape Verde 0.48 75.6
India: Average of state IBTs 0.70 21.0
Peru 0.82 59.9
Hungary 0.98 1.7
Index of Regressivity: Share of subsidies to poorest 40 percent of HHs/40.Error of Exclusion: Percent of poorest 40 percent of households not receiving subsidy.Source: Komives and others 2005.
Figure 3.4. Electricity Subsidies as a Percentage of Household Income, by Income Quintiles
RES = Residential electricity subsidies.Source: Scott 2007 using ENIGH (2006) and CFE tariff data.
0%
2%
4%
6%
8%
10%
12%
14%
16%
18%
20%
22%
24%
1 2 3 4 5
household quintiles
sub
sid
y/cu
rren
t in
com
e
Total RES 1 1A 1B 1C 1D 1E 1F
11503-03_Ch03.qxd 1/6/09 9:50 AM Page 24
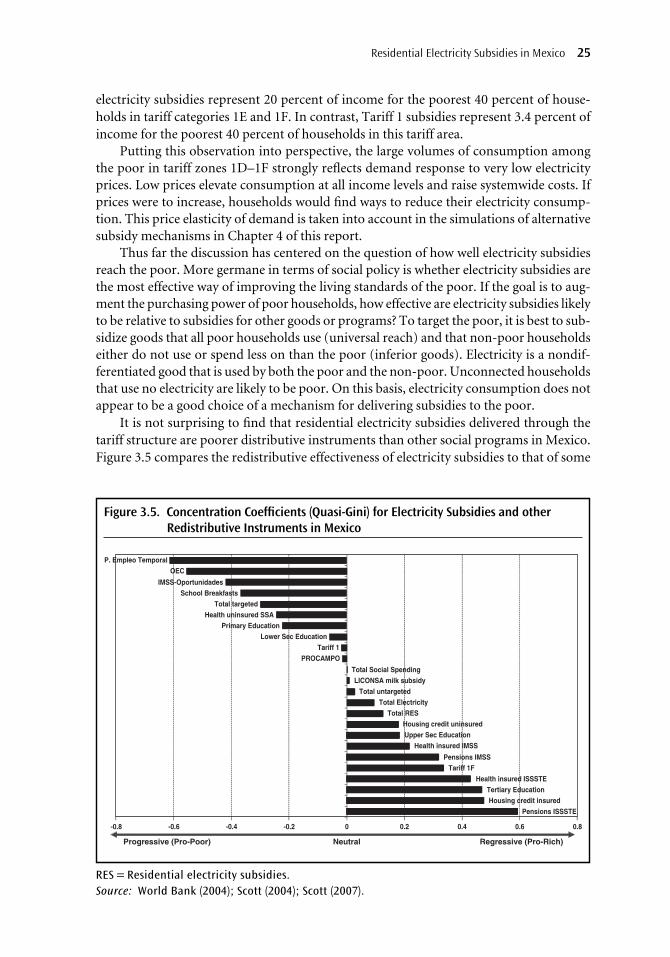
electricity subsidies represent 20 percent of income for the poorest 40 percent of house-holds in tariff categories 1E and 1F. In contrast, Tariff 1 subsidies represent 3.4 percent ofincome for the poorest 40 percent of households in this tariff area.
Putting this observation into perspective, the large volumes of consumption amongthe poor in tariff zones 1D–1F strongly reflects demand response to very low electricityprices. Low prices elevate consumption at all income levels and raise systemwide costs. Ifprices were to increase, households would find ways to reduce their electricity consump-tion. This price elasticity of demand is taken into account in the simulations of alternativesubsidy mechanisms in Chapter 4 of this report.
Thus far the discussion has centered on the question of how well electricity subsidiesreach the poor. More germane in terms of social policy is whether electricity subsidies arethe most effective way of improving the living standards of the poor. If the goal is to aug-ment the purchasing power of poor households, how effective are electricity subsidies likelyto be relative to subsidies for other goods or programs? To target the poor, it is best to sub-sidize goods that all poor households use (universal reach) and that non-poor householdseither do not use or spend less on than the poor (inferior goods). Electricity is a nondif-ferentiated good that is used by both the poor and the non-poor. Unconnected householdsthat use no electricity are likely to be poor. On this basis, electricity consumption does notappear to be a good choice of a mechanism for delivering subsidies to the poor.
It is not surprising to find that residential electricity subsidies delivered through thetariff structure are poorer distributive instruments than other social programs in Mexico.Figure 3.5 compares the redistributive effectiveness of electricity subsidies to that of some
Residential Electricity Subsidies in Mexico 25
Pensions ISSSTE
Housing credit insuredTertiary Education
Health insured ISSSTETariff 1F
Pensions IMSS
Health insured IMSSUpper Sec EducationHousing credit uninsured
Total RESTotal Electricity
Total untargeted
LICONSA milk subsidyTotal Social Spending
PROCAMPOTariff 1
Lower Sec EducationPrimary Education
Health uninsured SSATotal targeted
School BreakfastsIMSS-Oportunidades
OECP. Empleo Temporal
-0.8 -0.6 -0.4 -0.2 0 0.2 0.4 0.6 0.8
Regressive (Pro-Rich)Progressive (Pro-Poor) Neutral
Figure 3.5. Concentration Coefficients (Quasi-Gini) for Electricity Subsidies and otherRedistributive Instruments in Mexico
RES = Residential electricity subsidies.Source: World Bank (2004); Scott (2004); Scott (2007).
11503-03_Ch03.qxd 1/6/09 9:50 AM Page 25

of the principal redistributive programs currently implemented in Mexico. The figurereports the concentration coefficient (or quasi-Gini) for each program. The OportunidadesEnergéticas subsidy is allocated through the most effective (administrative) targeted instru-ment available in Mexico (Oportunidades); this makes it highly progressive. Tariff 1 isslightly more regressive than social spending in general in Mexico. Tariff 1F, on the otherhand, is among the most regressive instruments presented in Figure 3.5. Overall, electric-ity subsidies (subsidies delivered through tariffs plus Oportunidades Energéticas) are mod-erately regressive. This suggests that, if the main goal of electricity subsidies is to serve asan instrument of social policy, there are other better ways to raise the disposable incomesof the poor. As just one example, Figure 3.5 shows that temporary employment programsin Mexico are highly progressive.
Coady, Grosh, and Hoddinott (2003) also found, in a review of targeted programsaround the world, that all of the public works programs in their sample were progressive.These programs are able to successfully target the poor through self-exclusion: the non-poorare not interested in the low-wage jobs these programs provide. The same review showedthat 82 percent of cash transfer programs and 83 percent of social funds produced a pro-gressive distribution of benefits.12 Cash transfer programs performed well because they, likeMexico’s Oportunidades program, were usually targeted with means testing or a proxymeans test. The social fund programs achieved good targeting by directing resources towardgoods and services that disproportionately benefit the poor.
26 World Bank Working Paper
12. See summary of Coady, Grosh, and Hoddinott (2003) results presented in Komives and others(2007).
11503-03_Ch03.qxd 1/6/09 9:50 AM Page 26

As indicated, Mexican residential utility subsidies are large and continue to grow.They constitute a significant burden to public finances and are regressively dis-tributed, benefiting larger-volume consumers and upper-income households dis-
proportionately. Current tariff levels and structures elevate demand and raise the cost ofelectricity provision for all consumers. What options does Mexico have for reducing thesize and regressivity of the electricity subsidies?
Four options are assessed. They were selected to reflect, on the one hand, currentthinking in Mexico about the possible direction of tariff changes and, on the other hand,policies and approaches that have proven promising in other countries. Possible scenarioswere discussed with Mexican government officials in January 2008 and the commentsreceived were used to make the final choice of the scenarios.
The intention is not to present all possible or feasible options. The goal is rather to pro-mote meaningful policy discussion by demonstrating what could be achieved with four dis-tinct alternatives to the current subsidy mechanism in terms of their impact on both themagnitude and distribution of subsidies. The four scenarios are as follows:
1. Modification of the High Consumption Residential Tariff (DAC): The first scenario isa conservative option, similar to efforts that have been made in the past. The DACtariff is expanded to cover the top 10 percent of consumers in each tariff categoryrather than the 2 percent currently paying the DAC rates, while the tariff level is low-ered to 90 percent of its current level.13 Tariffs for other consumers would remainthe same.
CHAPTER 4
Assessment of AlternativeSubsidy Mechanisms
27
13. It is generally believed that the current DAC tariffs are slightly higher than long-run marginal cost.
11503-04_Ch04_rev.qxd 1/6/09 9:52 AM Page 27

2. Volume-differentiated tariff (VDT): A second option is to make a major change in thetariff structure, eliminating the multitude of increasing block tariffs and replacingthem with a unified national tariff system of just three flat volumetric tariffs with dif-ferent levels of discount.
3. Means testing: The third option examined is also a major change to the tariffstructure. Residential customers in Mexico pay the same flat volumetric tariff,with the exception of poor households that are targeted (through qualificationfor the Oportunidades program, or an alternative means-testing mechanism) toreceive a discount.
4. Cost reduction: The last scenario considered is a reduction of supply costs.14 Costreduction (for example, through technical, operational, and management/gover-nance improvements) has the potential to reduce the magnitude of the subsidieswithout altering the tariff structure. Two hypothetical scenarios are analyzed: areduction of average unit cost by 10 percent and by 20 percent.15
Of the four options assessed, the first (the modified DAC) is the most similar to whathas been done in the past and is what some policymakers are considering for the future.The VDT and means-tested discount represent major departures from the current tariffand subsidy system, for consumers and for the utilities, while implementing a cost reduc-tion scenario would likely require significant managerial, labor, and corporate changes anda multiyear investment program. None of these changes could be made overnight, butrather need to be phased in over time, and implementing any one would require a care-fully planned transition. The modeling of transition paths is beyond the scope of thisreport. The purpose of these simulations is to present a first assessment of what might bepossible to achieve with different types of reforms in terms of the overall level of subsidiesand their distributional incidence. Once a decision is made to move in a particular direc-tion, planning and timing of the transition path would become critical.
An important feature of these simulations is the incorporation of price elasticity ofdemand in the analysis. Benefit incidence analysis of policy change often ignores the factthat price changes affect consumer behavior. As a result, these analyses tend to overesti-mate impacts on revenues, subsidies, and distributional incidence. With electricity tariffreform, one would expect electricity consumption to fall if prices rise and to increase ifprices drop. To capture the effect of changes in electricity consumption on the results oftariff reform, one needs to incorporate demand elasticity into the calculations. An estimateof short-run price elasticity of demand that was derived from CFE’s demand model(recently published by SENER): −0.14.16 Over time, of course, price is not the only factoraffecting demand. Incomes may rise or the prices for electrical appliances could fall. Wherepossible, the estimates of consumption levels after a tariff reform also account for possiblechanges in these other components of the demand function over the period of the simula-tion (see Appendix D).
28 World Bank Working Paper
14. Cost reductions are based on CFE costs because, as explained in Chapter 3 and Appendixes 4 and5, CFE costs are used as the basis for calculating electricity subsidies.
15. Because subsidies are measured in this study as the difference between price paid and CFE averagecost (see Appendixes 4 and 5), the cost reduction amounts to a 10 or 20 percent reduction of CFE costs.
16. This estimate is slightly lower than the −0.16 estimate produced by SHCP in 2003.
11503-04_Ch04_rev.qxd 1/6/09 9:52 AM Page 28

Simulations of scenarios are conducted, whenever possible, with both CFE and ENIGHdata. The two analyses are not directly comparable for several reasons. The CFE data arefrom 2005, and the ENIGH data are from 2006.17 The CFE analysis takes into considera-tion annual consumption (and thus the tariffs in both the summer and winter months),whereas the ENIGH data only consider summer consumption levels. The CFE analysisassesses subsidy distribution across consumption deciles, while the ENIGH analysis doesso across income deciles. Moreover, as seen earlier, the two data sets have different esti-mates of the number of CFE customers and of average consumption levels. Despite thesedifferences, the same broad policy messages about the likely effect of different scenarios forsubsidy reform emerge from both analyses. The two data sets complement each other andincrease confidence in the overarching conclusions of the study.
A Modified DAC Tariff
Among the options currently under consideration for reducing electricity subsidies is mod-ifying the DAC tariff, reducing the Kilowatt-hour (kWh) charge to better reflect long-runmarginal cost, and applying it to a larger group of large-volume consumers. It is widely rec-ognized that the DAC tariff is above long-run marginal cost. From an economic perspec-tive this is inefficient; efficient levels of consumption are obtained when customers pay themarginal cost of their consumption for each kWh consumed. From this perspective, cur-rent DAC tariffs are too high, although how much too high is not known.
This simulation (the parameters of which were discussed with SHCP) assumes that theexisting DAC tariffs would be replaced with two new DAC tariffs (Table 4.1).18 The newDAC tariffs would preserve the fixed charge of the existing system, but the volumetric chargewould be reduced by 10 percent.19 The minimum consumption threshold for the DAC tar-iffs is reduced such that the top 10 percent of all customers in each tariff category pay thisnew DAC rate. The combined result of these two changes would be lower prices for thosecurrently paying DAC and higher prices for those just under the current DAC thresholds.
Table 4.2 presents the simulatedresults of this change to the DAC onthe magnitude of subsidies receivedby each household and on the distri-bution of subsidies by consumptiondecile. Compared to the current tar-iff system, the modified DAC wouldreduce the total value of the subsidiesprovided to residential customers byapproximately 2,500,000 pesos peryear, or only about 4.5 percent of the
Residential Electricity Subsidies in Mexico 29
Table 4.1. DAC Tariffs Used in the Simulation
New DAC . . . Winter Summer
For Tariffs 1–1E
Fixed charge 51.024 51.024
Volumetric charge 1.809 1.809
For Tariff 1F
Fixed charge 51.395 50.653
Volumetric charge 1.748 1.856
17. The most recent data available at the time the study was started were used for the analysis.18. The first new tariff is designed to reflect costs in the national interconnected system. The second
reflects costs in Baja California, which is not connected to the rest of the national system. Tariff 1F usersare concentrated in Baja California and Sonora.
19. The new DAC tariffs are modeled on the current DAC for the Baja California and North Eastregions.
11503-04_Ch04_rev.qxd 1/6/09 9:52 AM Page 29

current volume of subsidies. The impact of this tariff modification on the volume of sub-sidies is quite small because it does nothing to modify the subsidies provided to 90 percentof electricity consumers. Moreover, the potential revenue gain associated with applying aDAC tariff in the top decile is less than expected because consumption in the top decilewould drop as a result of the price effect.20 Nor does the modified DAC significantly alterthe distribution of the subsidies across consumption deciles: the only real difference is forthe largest 10 percent of electricity consumers (in decile 10), who in this scenario captureonly 6 percent of the subsidies compared to 10 percent with the current tariff.
The ENIGH analysis confirms that extending a modified DAC tariff to the top 10 per-cent of customers, and making no other changes to the tariff structure would have only amodest impact on the volume and distribution of subsidies. If the wealthiest 10 percent ofhouseholds pay the DAC, subsidies decline by 16 percent, and subsidy distribution wouldremain regressive with the wealthiest 30 percent of households capturing more of the sub-sidies than the poorest 30 percent.21
Two Options for a Unified National Tariff Structure
The modified DAC tariff option discussed above largely preserves the current structure ofresidential tariffs in Mexico—seven distinct tariff structures for different climatic zones,three billing schedules for each tariff, seasonally differentiated tariffs, and increasing block
30 World Bank Working Paper
Table 4.2. Modified DAC Scenario: Subsidy Distribution by Consumption Decile
Avg. Subsidy Avg. Subsidy Subsidy Cumulative Decile (pesos/kWh) (pesos/HH per year) Distribution (%) Distribution (%)
1 9.03 550 2.8 2.8
2 2.56 1,169 5.9 8.6
3 2.05 1,571 7.9 16.5
4 1.85 1,884 9.4 26.0
5 1.70 2,251 11.3 37.2
6 1.62 2,536 12.7 50.0
7 1.55 2,739 13.7 63.7
8 1.44 3,124 15.7 79.4
9 1.10 2,954 14.8 94.2
10 0.26 1,158 5.8 100
Total 1.23 1,994 100
Note: Average consumption is estimated after the price change.
20. In this simulation, the assumption is that average consumption in the top decile would drop from404 kWh per month to 368 kWh per month in response to the price increase.
21. Applying the DAC tariffs to the wealthiest customers (as opposed to the largest-volume consumers)would be challenging in practice. It would require using some form of means testing to identify wealthycustomers.
11503-04_Ch04_rev.qxd 1/6/09 9:52 AM Page 30

tariffs for most customers. One possible direction of change for the future is to movetoward a single national electricity tariff. The next two scenarios assess the performance oftwo different national tariff structures that offer some degree of discount for all customerswhile eliminating specific regressive features of the existing tariff structure, namely theextreme seasonal subsidies and the increasing block tariffs. The first scenario introduces avolume-differentiated tariff (VDT) that targets low-volume consumers for additional dis-counts. The second scenario uses means testing to offer added discounts to the poorest ofcustomers.
Volume Differentiated Tariff
Like an increasing block tariff (IBT), a volume differentiated tariff (VDT), is a quantity-targeted tariff—the discounts given to customers depend on how much electricity a cus-tomer uses. The difference between an IBT and a VDT is that each customer class pays justone price per kWh consumed (as is now the case with the DAC tariffs in Mexico). In thisway, larger-volume consumers are excluded from receiving the deep discounts normallyprovided in the first blocks of an IBT.
Figure 4.1 shows one example of a VDT composed of three tariff schedules, each witha different level of discount. The basic tariff schedule (1.10 pesos per kWh) is for customersconsuming less than 100 kWh per month. The intermediate tariff schedule applies to cus-tomers consuming between 101 kWh and 200 kWh per month. Since they pay 1.40 pesosper kWh for all units of consumption, a customer consuming 200 kWh per month wouldpay a total of 280 pesos per month. The standard tariff schedule (1.75 pesos per kWh)applies to all remaining customers, those consuming more than 200 kWh per month.
Residential Electricity Subsidies in Mexico 31
Figure 4.1. Example of a VDT with Three Tariff/Schedules
0.00
0.20
0.40
0.60
0.80
1.00
1.20
1.40
1.60
1.80
2.00
0 40 80 120
160
200
240
280
320
360
400
440
480
kWh consumed
Pes
os
per
kW
h
Basic Intermediate Standard
11503-04_Ch04_rev.qxd 1/6/09 9:52 AM Page 31
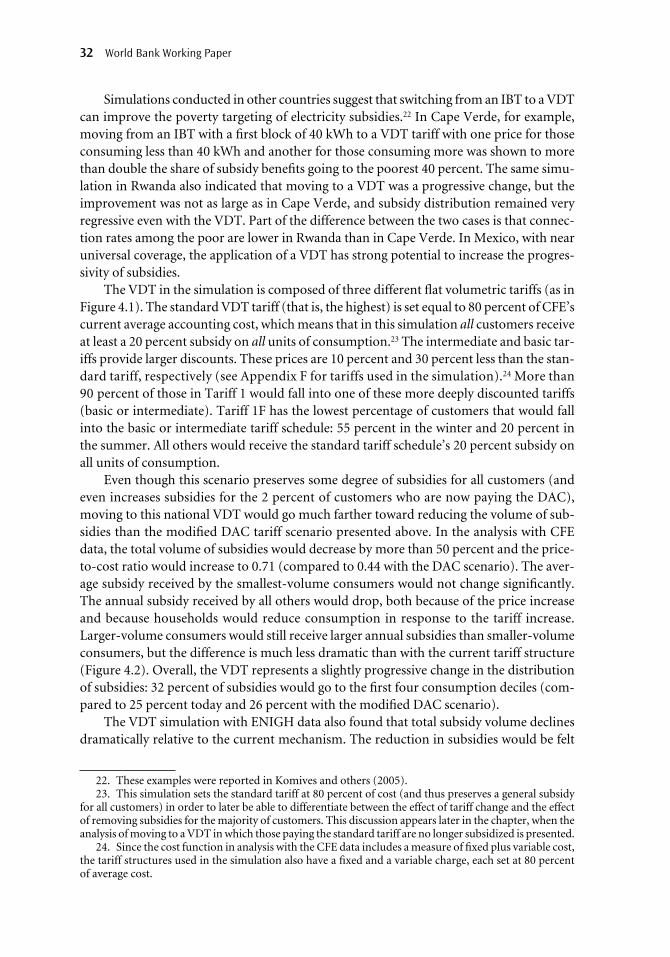
Simulations conducted in other countries suggest that switching from an IBT to a VDTcan improve the poverty targeting of electricity subsidies.22 In Cape Verde, for example,moving from an IBT with a first block of 40 kWh to a VDT tariff with one price for thoseconsuming less than 40 kWh and another for those consuming more was shown to morethan double the share of subsidy benefits going to the poorest 40 percent. The same simu-lation in Rwanda also indicated that moving to a VDT was a progressive change, but theimprovement was not as large as in Cape Verde, and subsidy distribution remained veryregressive even with the VDT. Part of the difference between the two cases is that connec-tion rates among the poor are lower in Rwanda than in Cape Verde. In Mexico, with nearuniversal coverage, the application of a VDT has strong potential to increase the progres-sivity of subsidies.
The VDT in the simulation is composed of three different flat volumetric tariffs (as inFigure 4.1). The standard VDT tariff (that is, the highest) is set equal to 80 percent of CFE’scurrent average accounting cost, which means that in this simulation all customers receiveat least a 20 percent subsidy on all units of consumption.23 The intermediate and basic tar-iffs provide larger discounts. These prices are 10 percent and 30 percent less than the stan-dard tariff, respectively (see Appendix F for tariffs used in the simulation).24 More than90 percent of those in Tariff 1 would fall into one of these more deeply discounted tariffs(basic or intermediate). Tariff 1F has the lowest percentage of customers that would fallinto the basic or intermediate tariff schedule: 55 percent in the winter and 20 percent inthe summer. All others would receive the standard tariff schedule’s 20 percent subsidy onall units of consumption.
Even though this scenario preserves some degree of subsidies for all customers (andeven increases subsidies for the 2 percent of customers who are now paying the DAC),moving to this national VDT would go much farther toward reducing the volume of sub-sidies than the modified DAC tariff scenario presented above. In the analysis with CFEdata, the total volume of subsidies would decrease by more than 50 percent and the price-to-cost ratio would increase to 0.71 (compared to 0.44 with the DAC scenario). The aver-age subsidy received by the smallest-volume consumers would not change significantly.The annual subsidy received by all others would drop, both because of the price increaseand because households would reduce consumption in response to the tariff increase.Larger-volume consumers would still receive larger annual subsidies than smaller-volumeconsumers, but the difference is much less dramatic than with the current tariff structure(Figure 4.2). Overall, the VDT represents a slightly progressive change in the distributionof subsidies: 32 percent of subsidies would go to the first four consumption deciles (com-pared to 25 percent today and 26 percent with the modified DAC scenario).
The VDT simulation with ENIGH data also found that total subsidy volume declinesdramatically relative to the current mechanism. The reduction in subsidies would be felt
32 World Bank Working Paper
22. These examples were reported in Komives and others (2005).23. This simulation sets the standard tariff at 80 percent of cost (and thus preserves a general subsidy
for all customers) in order to later be able to differentiate between the effect of tariff change and the effectof removing subsidies for the majority of customers. This discussion appears later in the chapter, when theanalysis of moving to a VDT in which those paying the standard tariff are no longer subsidized is presented.
24. Since the cost function in analysis with the CFE data includes a measure of fixed plus variable cost,the tariff structures used in the simulation also have a fixed and a variable charge, each set at 80 percentof average cost.
11503-04_Ch04_rev.qxd 1/6/09 9:52 AM Page 32

Residential Electricity Subsidies in Mexico 33
Figure 4.2. Average Subsidy per Household per Year in each Consumption Decile, withThree Different Tariff Structures
0
500
1000
1500
2000
2500
3000
3500
1 2 3 4 5 6 7 8 9 10
Consumption decile
Avg
su
bsi
dy
per
hh
per
yea
r
Current VDT Modified DAC
Source: Based on Aburto 2007 with CFE data.
in all income groups. The average subsidy per household per month in the lowest incomedecile would go down by more than 55 percent, in decile 5 by 62 percent, and in decile 10by 52 percent. The resulting distribution of subsidy benefits across income groups wouldnot be dramatically different from the distribution today.
Means-tested Discounts
With a VDT, like an IBT, the quantity of electricity consumed determines the amount ofsubsidy each consumer receives. An alternative to consumption-based subsidy allocationmechanisms is to use a means test to determine eligibility for subsidies. Means testing cantake many forms, but always involves using some information about households to assesshousehold poverty status. It may be done using income information, or proxies for house-hold income such as information about the quality of housing or socioeconomic charac-teristics of the household. It is a much more labor-intensive approach to determining whois eligible for subsidies than using quantity targeting, because means testing requires anadministrative decision about eligibility for subsidies. With quantity-targeted subsidies,households indirectly decide whether or not to be subsidized when they decide how muchelectricity to use.
One way to reduce the administrative cost of allocating subsidies through means-testingis to piggyback on an existing means-testing program. The Oportunidades Energéticas pro-gram, for example, uses the means-testing system established under Oportunidades to
11503-04_Ch04_rev.qxd 1/6/09 9:52 AM Page 33

determine eligibility for subsidies. In Chile, the national water subsidy,25 which is admin-istered by the water utility through water bills, similarly uses a national means-testinginstrument (the ficha CAS—Caracterización Social) to determine eligibility for the watersubsidy. Using an existing means-tested program to target water or energy subsidies hasthe advantage that it spreads the administrative cost of means testing over a number ofsectors/programs and can therefore be quite cost-effective. In contrast, establishing sector-specific means-testing systems are usually prohibitively expensive because administrativecosts absorb a large proportion of the subsidy “budget.”
Means-tested water and electricity subsidies are much more progressively distributedthan quantity-targeted programs like IBTs or VDTs. Komives and others 2005 found thatthe share of subsidy benefits accruing to the poorest 40 percent was twice as large on aver-age in means-tested programs compared to IBTs or VDTs (Table 4.3). However, a dis-advantage of means testing is the prevalence of errors of exclusion among the poor. In aneffort to exclude the non-poor from receiving subsidies, means-tested programs excludepoor households as well.
34 World Bank Working Paper
25. The program offers a discount for 15 cubic meters of water per eligible household.
Table 4.3. Pro-Poor Targeting Performance of Means-tested Electricity Subsidies
Measure of Progressive Distribution:Percent Subsidies to Poorest Error of Exclusion
40 Percent of HHs / 40 (% of poor HHs not Case (1.0 = neutral distribution) receiving subsidy)
Argentina: Average of provincial-level 1.50 94means-tested subsidies
Tiblisi, Georgia: Limited free 1.20 75electricity allowance for means-tested beneficiaries
Bogotá, Colombia: Combined use of 1.35 17means testing and geographic targeting (simulated)
Cape Verde: Means-tested subsidy on 1.46 93first 40 kWh per month (simulated)
Source: Komives and others 2005.
In Mexico, such errors of exclusion are one risk of relying on the Oportunidades veri-fication systems for determining eligibility for electricity subsidies. Although Oportu-nidades is the best-targeted social program in the country, some poor households areexcluded. As one example, poor households living in communities that lack health centersand schools do not qualify for Oportunidades. This is because to be eligible one must notonly qualify as poor through the proxy means test, but also must send children to schooland make regular visits to health centers. Two targeting approaches are used in the simu-lations of means-tested subsidies presented here. In the first, only Oportunidades recipi-ents qualify for the means-tested subsidy. In the second, the subsidy is provided to all
11503-04_Ch04_rev.qxd 1/6/09 9:52 AM Page 34
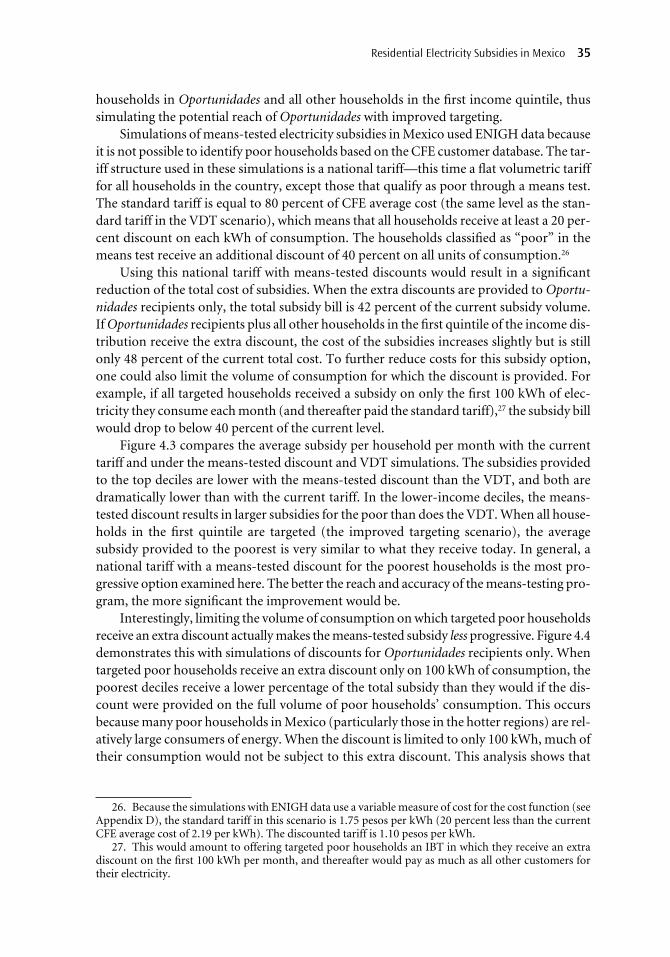
households in Oportunidades and all other households in the first income quintile, thussimulating the potential reach of Oportunidades with improved targeting.
Simulations of means-tested electricity subsidies in Mexico used ENIGH data becauseit is not possible to identify poor households based on the CFE customer database. The tar-iff structure used in these simulations is a national tariff—this time a flat volumetric tarifffor all households in the country, except those that qualify as poor through a means test.The standard tariff is equal to 80 percent of CFE average cost (the same level as the stan-dard tariff in the VDT scenario), which means that all households receive at least a 20 per-cent discount on each kWh of consumption. The households classified as “poor” in themeans test receive an additional discount of 40 percent on all units of consumption.26
Using this national tariff with means-tested discounts would result in a significantreduction of the total cost of subsidies. When the extra discounts are provided to Oportu-nidades recipients only, the total subsidy bill is 42 percent of the current subsidy volume.If Oportunidades recipients plus all other households in the first quintile of the income dis-tribution receive the extra discount, the cost of the subsidies increases slightly but is stillonly 48 percent of the current total cost. To further reduce costs for this subsidy option,one could also limit the volume of consumption for which the discount is provided. Forexample, if all targeted households received a subsidy on only the first 100 kWh of elec-tricity they consume each month (and thereafter paid the standard tariff),27 the subsidy billwould drop to below 40 percent of the current level.
Figure 4.3 compares the average subsidy per household per month with the currenttariff and under the means-tested discount and VDT simulations. The subsidies providedto the top deciles are lower with the means-tested discount than the VDT, and both aredramatically lower than with the current tariff. In the lower-income deciles, the means-tested discount results in larger subsidies for the poor than does the VDT. When all house-holds in the first quintile are targeted (the improved targeting scenario), the averagesubsidy provided to the poorest is very similar to what they receive today. In general, anational tariff with a means-tested discount for the poorest households is the most pro-gressive option examined here. The better the reach and accuracy of the means-testing pro-gram, the more significant the improvement would be.
Interestingly, limiting the volume of consumption on which targeted poor householdsreceive an extra discount actually makes the means-tested subsidy less progressive. Figure 4.4demonstrates this with simulations of discounts for Oportunidades recipients only. Whentargeted poor households receive an extra discount only on 100 kWh of consumption, thepoorest deciles receive a lower percentage of the total subsidy than they would if the dis-count were provided on the full volume of poor households’ consumption. This occursbecause many poor households in Mexico (particularly those in the hotter regions) are rel-atively large consumers of energy. When the discount is limited to only 100 kWh, much oftheir consumption would not be subject to this extra discount. This analysis shows that
Residential Electricity Subsidies in Mexico 35
26. Because the simulations with ENIGH data use a variable measure of cost for the cost function (seeAppendix D), the standard tariff in this scenario is 1.75 pesos per kWh (20 percent less than the currentCFE average cost of 2.19 per kWh). The discounted tariff is 1.10 pesos per kWh.
27. This would amount to offering targeted poor households an IBT in which they receive an extradiscount on the first 100 kWh per month, and thereafter would pay as much as all other customers fortheir electricity.
11503-04_Ch04_rev.qxd 1/6/09 9:52 AM Page 35

there is a tradeoff in designing a means-tested discount of this sort between reducing subsidyvolumes and directing subsidies to the poor. Limiting the subsidy to 100 kWh or 200 kWhwould help bring down the cost of the subsidies, but would also reduce the progressivity ofthe tariff structure.
Cost Reductions
The fourth option for reducing subsidies and improving their progressivity is cost reduc-tions. Rather than reduce subsidies by raising tariffs, an alternative is to reduce them bylowering supply costs. From the analysis in previous Chapters of this report, it is clear thatthere is scope for lowering costs at LFC, but probably also at CFE. No attempt has beenmade to determine what magnitude of cost reductions would be feasible at each utility, orexactly how the cost reductions could be obtained. To examine how cost reductions affectthe magnitude and distribution of subsidies, two hypothetical scenarios are analyzed: areduction of CFE average cost by 10 percent and 20 percent. The tariffs do not change inthese scenarios: Tariffs 1–1F and the DAC tariffs remain at their current levels.
36 World Bank Working Paper
Figure 4.3. Average Subsidy per Household per Year in each Income Decile, with DifferentTariff Structures
0
50
100
150
200
250
300
350
1 2 3 4 5 6 7 8 9 10Income decile
Avg
sub
sidy
per
hh
per
mon
th (
peso
s)
Current
Means-tested discount on all consumption, Oportunidades only
Means-tested discount on all consumption with improved targeting
VDT
Source: Based on Scott 2007—ENIGH data.
11503-04_Ch04_rev.qxd 1/6/09 9:52 AM Page 36
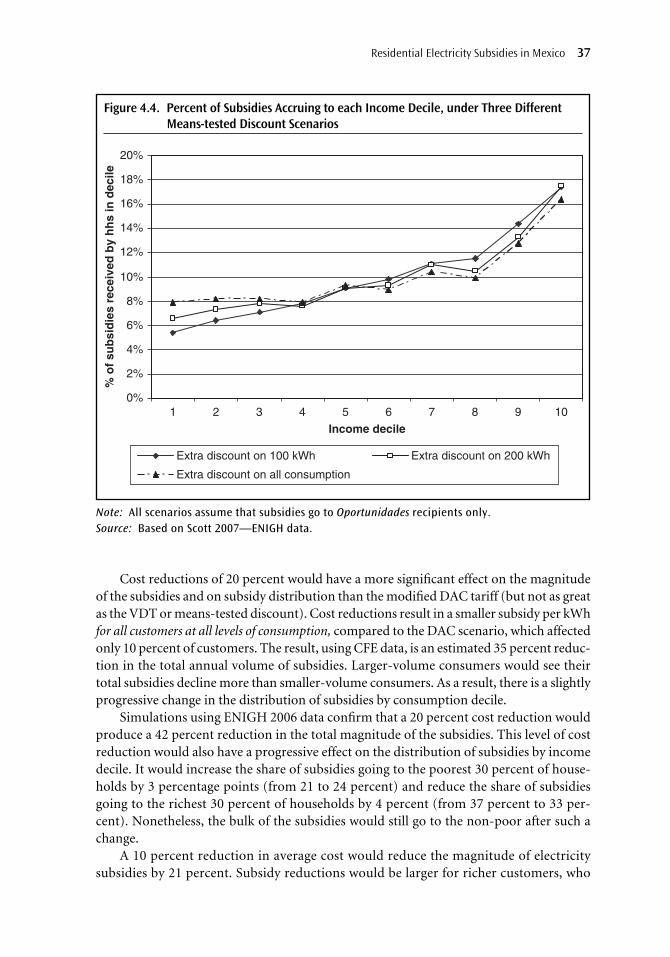
Cost reductions of 20 percent would have a more significant effect on the magnitudeof the subsidies and on subsidy distribution than the modified DAC tariff (but not as greatas the VDT or means-tested discount). Cost reductions result in a smaller subsidy per kWhfor all customers at all levels of consumption, compared to the DAC scenario, which affectedonly 10 percent of customers. The result, using CFE data, is an estimated 35 percent reduc-tion in the total annual volume of subsidies. Larger-volume consumers would see theirtotal subsidies decline more than smaller-volume consumers. As a result, there is a slightlyprogressive change in the distribution of subsidies by consumption decile.
Simulations using ENIGH 2006 data confirm that a 20 percent cost reduction wouldproduce a 42 percent reduction in the total magnitude of the subsidies. This level of costreduction would also have a progressive effect on the distribution of subsidies by incomedecile. It would increase the share of subsidies going to the poorest 30 percent of house-holds by 3 percentage points (from 21 to 24 percent) and reduce the share of subsidiesgoing to the richest 30 percent of households by 4 percent (from 37 percent to 33 per-cent). Nonetheless, the bulk of the subsidies would still go to the non-poor after such achange.
A 10 percent reduction in average cost would reduce the magnitude of electricitysubsidies by 21 percent. Subsidy reductions would be larger for richer customers, who
Residential Electricity Subsidies in Mexico 37
Figure 4.4. Percent of Subsidies Accruing to each Income Decile, under Three DifferentMeans-tested Discount Scenarios
0%
2%
4%
6%
8%
10%
12%
14%
16%
18%
20%
1 2 3 4 5 6 7 8 9 10
Income decile
% o
f su
bsi
die
s re
ceiv
ed b
y h
hs
in d
ecile
Extra discount on 100 kWh Extra discount on 200 kWh
Extra discount on all consumption
Note: All scenarios assume that subsidies go to Oportunidades recipients only.Source: Based on Scott 2007—ENIGH data.
11503-04_Ch04_rev.qxd 1/6/09 9:52 AM Page 37
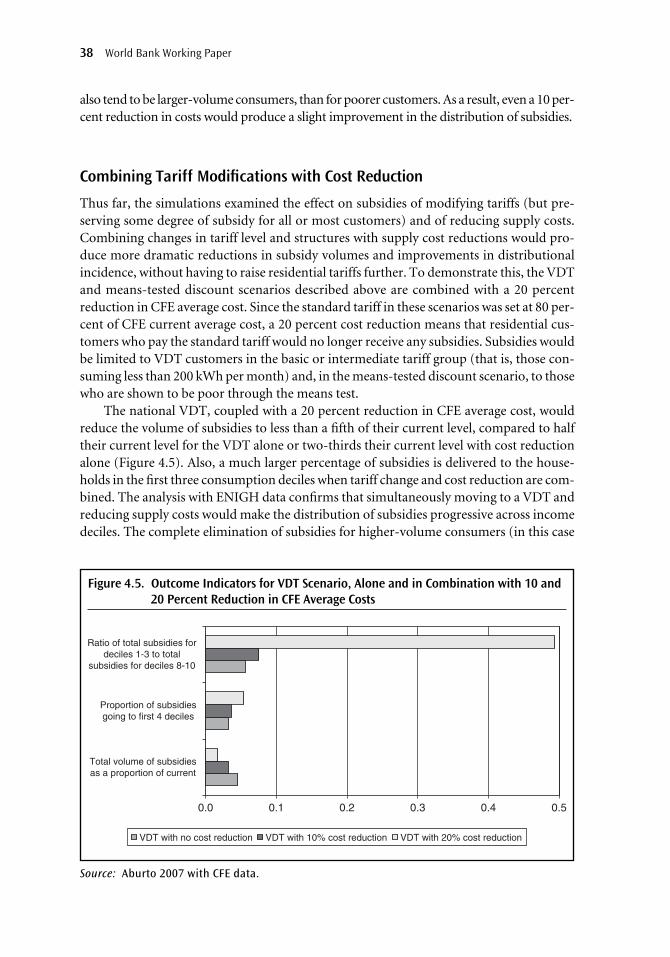
also tend to be larger-volume consumers, than for poorer customers. As a result, even a 10 per-cent reduction in costs would produce a slight improvement in the distribution of subsidies.
Combining Tariff Modifications with Cost Reduction
Thus far, the simulations examined the effect on subsidies of modifying tariffs (but pre-serving some degree of subsidy for all or most customers) and of reducing supply costs.Combining changes in tariff level and structures with supply cost reductions would pro-duce more dramatic reductions in subsidy volumes and improvements in distributionalincidence, without having to raise residential tariffs further. To demonstrate this, the VDTand means-tested discount scenarios described above are combined with a 20 percentreduction in CFE average cost. Since the standard tariff in these scenarios was set at 80 per-cent of CFE current average cost, a 20 percent cost reduction means that residential cus-tomers who pay the standard tariff would no longer receive any subsidies. Subsidies wouldbe limited to VDT customers in the basic or intermediate tariff group (that is, those con-suming less than 200 kWh per month) and, in the means-tested discount scenario, to thosewho are shown to be poor through the means test.
The national VDT, coupled with a 20 percent reduction in CFE average cost, wouldreduce the volume of subsidies to less than a fifth of their current level, compared to halftheir current level for the VDT alone or two-thirds their current level with cost reductionalone (Figure 4.5). Also, a much larger percentage of subsidies is delivered to the house-holds in the first three consumption deciles when tariff change and cost reduction are com-bined. The analysis with ENIGH data confirms that simultaneously moving to a VDT andreducing supply costs would make the distribution of subsidies progressive across incomedeciles. The complete elimination of subsidies for higher-volume consumers (in this case
38 World Bank Working Paper
Figure 4.5. Outcome Indicators for VDT Scenario, Alone and in Combination with 10 and20 Percent Reduction in CFE Average Costs
0.0 0.1 0.2 0.3 0.4 0.5
Total volume of subsidiesas a proportion of current
Proportion of subsidiesgoing to first 4 deciles
Ratio of total subsidies fordeciles 1-3 to total
subsidies for deciles 8-10
VDT with no cost reduction VDT with 10% cost reduction VDT with 20% cost reduction
Source: Aburto 2007 with CFE data.
11503-04_Ch04_rev.qxd 1/6/09 9:52 AM Page 38

through a combination of price increases and cost reductions) is critical to achieving amore progressive distribution of subsidies.
Similar conclusions emerge from the analysis of the means-tested discount in combi-nation with cost reductions: subsidies delivered through a tariff with means-tested dis-counts cost less and are more progressive when subsidies for untargeted consumers areeliminated through cost reductions. Figure 4.6 shows how the magnitude and distribution ofsubsidies across income deciles would change when the means-tested discount on 100 kWhper household per month is combined with 20 percent reductions in average supply cost.The improvement in distributional incidence is dramatic.
These results point to the criticality of (gradually) eliminating subsidies for the majorityof customers if the policy goal is to significantly improve the distribution of electricity sub-sidies. As long as large-volume and richer consumers continue to receive subsidies on everykWh consumed, the total subsidies these groups receive will be larger than those received bythe poorer and smaller-volume consumers. Retaining subsidies for the larger-volume andricher consumers also substantially increases the cost of the subsidy program. There are goodreasons, therefore, to gradually eliminate general subsidies in the residential electricity tariffsand replace them with limited subsidies targeted at a subset of consumers. This could be donethrough price increases alone, but, since tariffs are highly subsidized, the required priceincreases would be very large. In the simulations presented here, general subsidies are elim-inated through a combination of price increases and reductions in the cost of supply, whichmeans that the burden of reducing subsidies is shared by consumers and the utilities.
Residential Electricity Subsidies in Mexico 39
Figure 4.6. Cumulative Distribution of Subsidies across Income Deciles: Means-testedDiscount on 100 kWh (with improved targeting) Alone, and with 20 PercentCost Reduction
0
20
40
60
80
100
102
1 2 3 4 5 6 7 8 9 10
Income decile
Cu
mu
lati
ve %
of
sub
sid
y
Tariff change alone With 20% cost reduction
Source: Scott 2007.
11503-04_Ch04_rev.qxd 1/6/09 9:52 AM Page 39
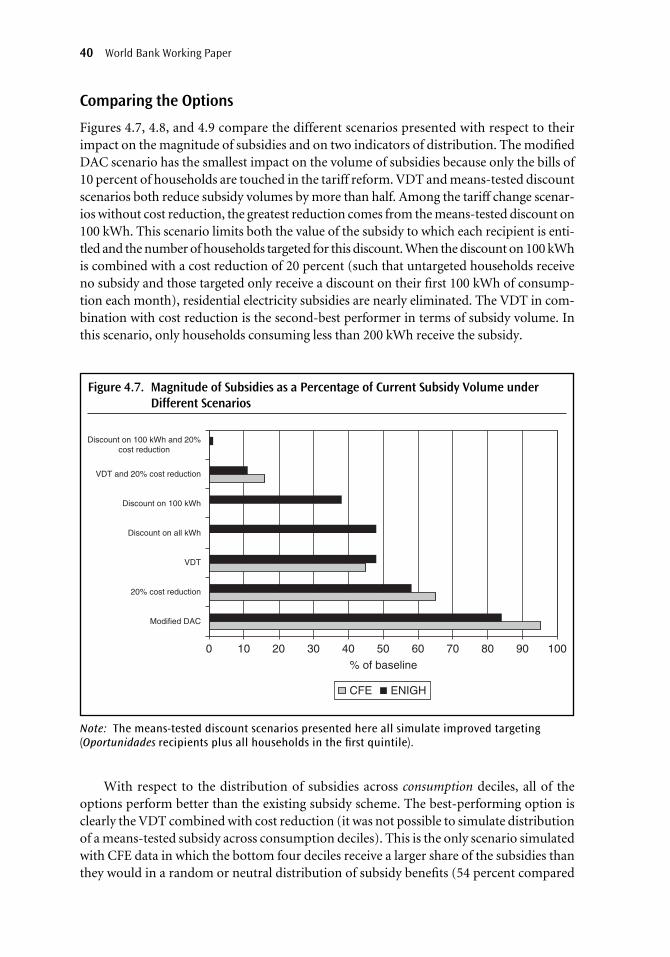
Comparing the Options
Figures 4.7, 4.8, and 4.9 compare the different scenarios presented with respect to theirimpact on the magnitude of subsidies and on two indicators of distribution. The modifiedDAC scenario has the smallest impact on the volume of subsidies because only the bills of10 percent of households are touched in the tariff reform. VDT and means-tested discountscenarios both reduce subsidy volumes by more than half. Among the tariff change scenar-ios without cost reduction, the greatest reduction comes from the means-tested discount on100 kWh. This scenario limits both the value of the subsidy to which each recipient is enti-tled and the number of households targeted for this discount. When the discount on 100 kWhis combined with a cost reduction of 20 percent (such that untargeted households receiveno subsidy and those targeted only receive a discount on their first 100 kWh of consump-tion each month), residential electricity subsidies are nearly eliminated. The VDT in com-bination with cost reduction is the second-best performer in terms of subsidy volume. Inthis scenario, only households consuming less than 200 kWh receive the subsidy.
With respect to the distribution of subsidies across consumption deciles, all of theoptions perform better than the existing subsidy scheme. The best-performing option isclearly the VDT combined with cost reduction (it was not possible to simulate distributionof a means-tested subsidy across consumption deciles). This is the only scenario simulatedwith CFE data in which the bottom four deciles receive a larger share of the subsidies thanthey would in a random or neutral distribution of subsidy benefits (54 percent compared
40 World Bank Working Paper
Figure 4.7. Magnitude of Subsidies as a Percentage of Current Subsidy Volume underDifferent Scenarios
0 10 20 30 40 50 60 70 80 90 100
Modified DAC
20% cost reduction
VDT
Discount on all kWh
Discount on 100 kWh
VDT and 20% cost reduction
Discount on 100 kWh and 20%cost reduction
% of baseline
CFE ENIGH
Note: The means-tested discount scenarios presented here all simulate improved targeting (Oportunidades recipients plus all households in the first quintile).
11503-04_Ch04_rev.qxd 1/6/09 9:52 AM Page 40

to 40 percent of the subsidy benefits). In all other cases, the first four consumption decilesreceive less than 40 percent of the subsidy benefits. Cost reductions and the VDT withoutcost reduction (which preserves a degree of subsidy for all customers on all units of con-sumption) do, nonetheless, represent an improvement over the current tariff structure.The modified DAC scenario hardly changes the existing situation.
With respect to distribution of subsidies across income deciles, one scenario actually per-forms worse than the existing tariff structure—the means-tested discount restricted to onlythe first 100 kWh. This occurs because most of the poor consume much more than 100 kWhper month. For similar reasons, the distribution of subsidies with the VDT alone is not muchdifferent from the distribution achieved under the present tariff/subsidy system. Cost reduc-tions of 20 percent have a larger progressive impact than the VDT, but the only scenarios thatmanage to distribute at least 40 percent of the subsidies to the poorest 40 percent of consumersare those that offer a means-tested discount on all consumption and/or that eliminate subsi-dies to most consumers by combining a tariff change with cost reductions. The means-testeddiscounts combined with cost reductions produce the most progressive distribution.
A risk with the means-tested discounts concerns errors of exclusion. Poor householdsthat are, for some reason, excluded from the targeting scheme will receive no subsidies.Improving targeting and reducing errors of exclusion becomes especially important whenprices are increased and general subsidies are reduced.
Residential Electricity Subsidies in Mexico 41
Figure 4.8. Percent of Subsidies Going to First Four Income (ENIGH) or Consumption (CFE)Deciles under Different Scenarios
0%
10%
20%
30%
40%
50%
60%
70%
80%
90%
100%
% o
f sub
sidi
es g
oing
to fi
rst 4
dec
iles
Means-testdiscount (100
kWh)
Current tariffstructure
Modified DAC VDT 20% costreduction
Means-testdiscount (all
kWh)
VDT and 20%cost reduction
Means-testdiscount (100kWh) and 20%cost reduction
ENIGH CFE
Note: The means-tested discount scenarios presented here all simulate improved targeting (Oportunidades recipients plus all households in the first quintile).
11503-04_Ch04_rev.qxd 1/6/09 9:52 AM Page 41

Toward Transition
These simulations of alternative subsidy options cannot be implemented overnight. With theexception of the conservative tariff reform scenario (the modified DAC), it is likely that a tran-sition period of perhaps 5 to 10 years would be needed to phase in tariff changes. Although itis beyond the scope of this report to consider possible transition paths, it is useful to have anunderstanding of which customers would be most affected by a transition to the subsidy sce-narios presented above and how much their bills would increase. There are important differ-
ences in this regard across scenarios.For the VDT scenarios,
Table 4.4 shows that those leastaffected by the price increaseswould be the smallest-volume con-sumers (who would qualify for thelargest discount in the VDT) andthe largest-volume consumers (whoare already paying high prices).Households in consumption deciles2–8 would see their monthly billsmore than double. The very-small-volume consumers would see theirbills rise by 50 percent. The topdecile of consumers would, onaverage, have smaller bills afterthe change than before.
42 World Bank Working Paper
Figure 4.9. Ratio of Subsidies to First Three Deciles Compared to Last Three Deciles inDifferent Scenarios
0.48
0.56
0.57
0.73
1.01
1.23
153
0.4
0.44
0.53
0.56
4.94
0 1 2 3 4 5 6 7
Discount (100 kWh)
VDT
Current tariff structure
20% cost reduction
Discount (all kWh)
VDT and 20% cost reduction
Discount (100 kWh) and 20% cost reduction
Current tariff structure
Modified DAC
VDT
20% cost reduction
VDT and 20% cost reduction
Income deciles (ENIGH) Consumption deciles (CFE)
Note: The means-tested discount scenarios presented here all simulate improved targeting (Oportunidades recipients plus all other households in the first quintile).
Table 4.4. VDT Scenario: Average Increase in Monthly Bills, by Consumption Decile
Percent of Current PesosConsumption Decile Monthly Bill per Month
1 50% 7
2 132% 29
3 126% 44
4 123% 58
5 124% 72
6 136% 103
7 136% 121
8 115% 136
9 55% 115
10 −11% −66
Source: Aburto 2007 using CFE data.
11503-04_Ch04_rev.qxd 1/6/09 9:52 AM Page 42
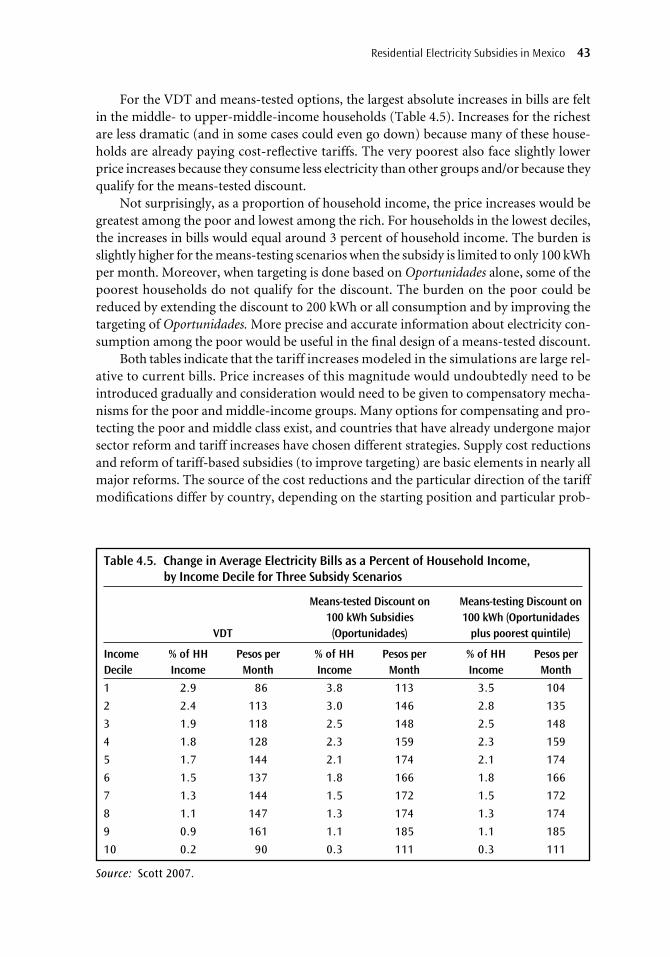
For the VDT and means-tested options, the largest absolute increases in bills are feltin the middle- to upper-middle-income households (Table 4.5). Increases for the richestare less dramatic (and in some cases could even go down) because many of these house-holds are already paying cost-reflective tariffs. The very poorest also face slightly lowerprice increases because they consume less electricity than other groups and/or because theyqualify for the means-tested discount.
Not surprisingly, as a proportion of household income, the price increases would begreatest among the poor and lowest among the rich. For households in the lowest deciles,the increases in bills would equal around 3 percent of household income. The burden isslightly higher for the means-testing scenarios when the subsidy is limited to only 100 kWhper month. Moreover, when targeting is done based on Oportunidades alone, some of thepoorest households do not qualify for the discount. The burden on the poor could bereduced by extending the discount to 200 kWh or all consumption and by improving thetargeting of Oportunidades. More precise and accurate information about electricity con-sumption among the poor would be useful in the final design of a means-tested discount.
Both tables indicate that the tariff increases modeled in the simulations are large rel-ative to current bills. Price increases of this magnitude would undoubtedly need to beintroduced gradually and consideration would need to be given to compensatory mecha-nisms for the poor and middle-income groups. Many options for compensating and pro-tecting the poor and middle class exist, and countries that have already undergone majorsector reform and tariff increases have chosen different strategies. Supply cost reductionsand reform of tariff-based subsidies (to improve targeting) are basic elements in nearly allmajor reforms. The source of the cost reductions and the particular direction of the tariffmodifications differ by country, depending on the starting position and particular prob-
Residential Electricity Subsidies in Mexico 43
Table 4.5. Change in Average Electricity Bills as a Percent of Household Income, by Income Decile for Three Subsidy Scenarios
Means-tested Discount on Means-testing Discount on100 kWh Subsidies 100 kWh (Oportunidades
VDT (Oportunidades) plus poorest quintile)
Income % of HH Pesos per % of HH Pesos per % of HH Pesos perDecile Income Month Income Month Income Month
1 2.9 86 3.8 113 3.5 104
2 2.4 113 3.0 146 2.8 135
3 1.9 118 2.5 148 2.5 148
4 1.8 128 2.3 159 2.3 159
5 1.7 144 2.1 174 2.1 174
6 1.5 137 1.8 166 1.8 166
7 1.3 144 1.5 172 1.5 172
8 1.1 147 1.3 174 1.3 174
9 0.9 161 1.1 185 1.1 185
10 0.2 90 0.3 111 0.3 111
Source: Scott 2007.
11503-04_Ch04_rev.qxd 1/6/09 9:52 AM Page 43

lems and opportunities in each context. Ghana, for example, started with a VDT tariff andthus the decision was made to cut subsidies by moving from five tariff groups to only threeand to focus subsidies only on the tariff applicable to the lowest-volume consumers. Arme-nia, which started with IBTs in the tariff structure, chose to eliminate the blocks and cre-ate a flat volumetric tariff.
A number of countries have also gone beyond these basic reform elements to addressconcerns about the poor and middle class. One option is to help households invest inimproving energy efficiency so that tariff increases coincide with reduction in electricityconsumption. Another option is to combine tariff and subsidy modifications with trans-fer mechanisms outside the electricity sector. In Armenia, for example, compensation forelectricity price increases was provided through a separate targeted cash transfer program(the Poverty Family Benefit Program). In Brazil, electricity tariffs retained some quantity-targeted and means-tested subsidies even after reform, but the poor were also assisted bythe Bolsa Familia cash transfer program. Similarly, in a number of Eastern European coun-tries such as Lithuania and Ukraine, governments established cash transfer programs tohelp households whose expenditures on basic utilities exceeded a set percentage of house-hold income after price reforms in multiple sectors.
The simulations presented in this study are not an exhaustive list of options that theGovernment of Mexico has for reducing subsidies and better targeting them to low-incomehouseholds. The options assessed represent potential elements of what could be a futurereform strategy. There is no reason a VDT could not be combined with a means-tested dis-count, for example, by offering the most discounted tariff in the VDT only to those inOportunidades. Likewise, the coverage of a means-tested discount could be improved byoffering the discount to all households in the country’s most marginal communities.28
Moreover, a complete tariff reform strategy could include additional measures such asthose used in the cases described briefly above. Nonetheless, having a sense of the fiscal anddistributional impacts of possible elements of a reform package is a critical first step toselecting and implementing meaningful reform. The reform options simulations in thisstudy give a first-order assessment of several promising alternatives for residential elec-tricity subsidies reform in Mexico.
44 World Bank Working Paper
28. The intention was to also simulate the impact of using geographic targeting, but this was not fea-sible because not enough of the most marginal communities are included in the ENIGH sample.
11503-04_Ch04_rev.qxd 1/6/09 9:52 AM Page 44

Key Findings
Six clear findings emerge from the evaluation of alternatives to the current tariff/subsidyscheme for residential consumers of electricity.
There is Relatively Little to be Gained From Minor Tinkering With the CurrentTariff Structures
Mexico’s electricity tariff structures are among the most complex in the world, by designand by natural accretion. The complexity lends itself to reclassification and misclassifi-cation of specific consumer groups seeking to obtain still greater discounts on ever largervolumes on consumption. A minor tariff “reform” that revolves around reducing theHigh Consumption Residential Tariff (DAC) tariff slightly and expanding its coverageto the 10 percent of highest-volume consumers in each tariff zone has limited impact onthe distribution of subsidy benefits. Moreover, it has minimal impact on the total vol-ume of subsidies. After the small number of affected customers adjusts consumption inresponse to the new (higher) tariffs, the analysis presented here suggests that the totalsubsidy budget will decline by only 4.5 percent. Moreover, history suggests that tariffadjustments of this type are likely to be followed by intense pressure and lobbying fromthose most affected to introduce new, more highly discounted tariffs, which would ulti-mately reduce the impact of the reform. The most that one can say for this type of con-servative tariff reform is that it would reduce consumption among the largest-volumeconsumers, which would have some limited impact on dampening electricity demand.But to have a significant impact on subsidy volumes or distributional incidence requiresmore far-reaching changes.
CHAPTER 5
Synthesis of Findings and Ways Forward
45
11503-05_Ch05_rev.qxd 1/6/09 9:53 AM Page 45

Combined With Cost Reductions, the Means-tested Discount SimulationProduces the Most Progressive Distribution of Subsidy Benefits, but a NationalVolume Differentiated Tariff (VDT) is Also a Significant Improvement Over theCurrent Tariff System
The VDT and the means-tested discount options produce progressive subsidy distributionswhen combined with 20 percent cost reductions. The VDT does a good job of targeting sub-sidies to low-volume consumers, and achieves a slightly-more-progressive-than-neutral dis-tribution of subsidies across income groups. The means-tested discount on 100 kWh ishighly progressive—almost all the benefits accrue to the lowest-income quintile of the pop-ulation. Extending the discount to 200 kWh or to all consumption of targeted householdsresults in an even more progressive distribution of subsidies while significantly reducingerrors of exclusion. Improving the targeting performance of Oportunidades would furtherimprove the distributional incidence of an electricity subsidy targeted to Oportunidadesbeneficiaries.
A means-tested discount has one disadvantage over the VDT for the poor—poorhouseholds that are for some reason excluded from the mean-tested discount (forexample, because they do not qualify for the Oportunidades program) would receive nodiscount on their electricity bill. They would therefore pay as much as everyone else.With a VDT, by contrast, households have the possibility of obtaining a discount bysimply lowering their consumption level, thus providing some natural safety net for allhouseholds.
Changes in the Tariff Structure That Do Not Eliminate Subsidies for MostCustomers Will Not Substantially Improve Distributional Incidence
In the simulations presented here, when the VDT and the means-tested discount are notcombined with cost reductions, they leave in place a subsidy of at least 20 percent per kWHfor all customers. The more customers consume, the larger their total subsidy. The subsidyper kWh may be higher for low-volume consumers (VDT) or poor households (meanstest), but the largest total subsidy still goes to the largest-volume and richest consumers.As a result, while there is some improvement over the current tariff system, the overall dis-tribution of subsidies remains regressive even with far-reaching changes in tariff structures.The lesson here is that to make major improvements to subsidy distribution it is critical toaim to eventually eliminate subsidies for the majority of consumers.
Reducing Subsidies Will Entail Significant Increases in Customer Bills,Especially for Those in the Middle-income and Consumption Deciles Even theSmaller Increases Among the Poorest Still Represent a Significant Reduction inTheir Disposable Income
Among the subsidy options assessed, the largest increases in tariffs are found among thosein the middle-income and consumption deciles. For the poorest, smaller absolute increasesare still significant in comparison to household income.
Any transition strategy toward an improved tariff and subsidy model needs to addresshow to mitigate the socioeconomic impact of rising electricity charges for various strata of
46 World Bank Working Paper
11503-05_Ch05_rev.qxd 1/6/09 9:53 AM Page 46

the population. Reducing consumer bills through end-use efficiency improvement wouldhelp to limit the increases in charges that would be needed to significantly reduce the mag-nitude of subsidies to residential customers. Other options include using some of the fundssaved on consumption-based subsidies to compensate middle-class customers through taxrebates in the medium term, to increase transfers provided to the poor through programslike Oportunidades or geographically targeted programs (SEDESOL micro-regiones), orthrough increased transfers to the most affected states (such as those with warm summerclimates), which could then decide themselves how to compensate those who would faceincreased charges.
Reducing Costs Can Partially Offset the Need for Raising Tariffs, and Any CostReduction Would Itself Result in a Greater Proportion of Subsidies Accruing toLow-income Households
Improving supply efficiency and reducing costs would have a slightly progressive effect onsubsidy distribution since total costs (and the absolute impact of cost reductions) are greatestamong the largest-volume consumers. Low-income and low-consumption households wouldsee their subsidy shares rise slightly, while the share going to the rich and large-volume con-sumers would decline. Cost reductions would also have a greater impact on reducing thetotal volume of subsidies compared to minor changes in the existing tariff structure. Thesimulation with ENIGH data indicates that a reduction in average costs of 10 or 20 percentwould permit aggregate residential subsidies to decline by 21 or 42 percent, respectively.Simulations by consumption decile indicate that a 20 percent reduction in costs wouldreduce subsidies by 35 percent.
Moreover, unit cost reductions can also moderate the magnitude of tariff increasesthat are needed to eliminate general subsidies. If no progress is made in reducing supplycosts, eliminating general subsidies would require greater increases in prices for customersnot targeted for subsidies. Politically, it could be more difficult for consumers to supportmajor tariff increases if they were not accompanied by meaningful efforts to reduce utilitysupply costs.
Better Information About Electricity Consumption Among the Poor is Needed
This study used two different sources of information to assess the performance of alterna-tive tariff and subsidy instruments—CFE billing data and ENIGH household survey data.Neither source is ideal for examining the incidence of subsidies or the impact of tariffreforms on the poor. CFE databases have no information on household income levels. TheENIGH survey asks households to recall their electricity expenditure but does not recordelectricity consumption levels from household electricity bills. Both problems could beremedied. CFE could presumably identify Oportunidades recipients in its customer data-base. The ENIGH survey (and other household surveys) could improve information onelectricity consumption by asking to see customer bills and recording one or severalmonths of consumption. Having this improved information about electricity consump-tion among the poor would be very useful for calibrating the design of any alternative sub-sidy program.
Residential Electricity Subsidies in Mexico 47
11503-05_Ch05_rev.qxd 1/6/09 9:53 AM Page 47

Electricity Subsidies in a Broader Social and Economic Context
The current electricity subsidy system in Mexico delivers the bulk of subsidy benefits to themiddle and upper-middle classes and to households consuming relatively large amountsof electricity. One cannot argue that general electricity subsidies like these are justified bypositive externalities associated with electricity consumption. To the contrary, electricitysubsidies inflate demand, raise systemwide costs, contribute to the emission of local pol-lutants and greenhouse gases, and stimulate environmentally damaging behaviors, suchas overpumping of groundwater. Nor is the “merit good” argument for subsidizingelectricity—that a good should be subsidized because of its importance to individualwell-being—very strong in comparison to other competing sectors (such as water andsanitation, health, and education, for example).
Given the regressivity of residential subsidies in Mexico at present, one cannot justifythe existing system as a pro-poor policy intervention. Since the late 1990s, Mexico’s socialpolicy has moved more and more toward reliance on targeted, means-tested programs, butthe electricity sector has yet to adopt this approach. It is clear from the simulations pre-sented here that it would be possible to improve the targeting of electricity subsidies to thepoor through tariff structure changes, possibly in combination with cost reduction. Usingmeans testing based on the Oportunidades program in any new tariff or subsidy structurewould seem to be a logical extension of developments in other sectors in Mexico.
It is important to consider whether the goal of subsidizing electricity for the poor is tokeep the price of electricity low for the poor (as prices for other customers rise) or whetherelectricity is to be used as a more general social policy vehicle for delivering subsidies to thepoor. If the latter is the policy goal, then it is important to recognize that electricity serviceis a suboptimal choice of subsidy delivery instrument. First, some poor households (lessthan 4 percent of the overall Mexican population) do not have electricity connections andare thus excluded from any subsidy delivered through electricity utilities. Second, electric-ity service does not have all the characteristics of a good targeting mechanism—it is anundifferentiated good that is used by non-poor households as well as the poor. Third,because there is not a perfect correlation between electricity consumption and income, itis difficult to use electricity bills alone to identify the poor and deliver subsidies. Straightquantity-targeted subsidies delivered through the tariff structure will not be well targeted.
Finally, Mexico has many other social programs that are better targeted to the poorthan electricity subsidies. If the goal is to increase transfers to the poor, it would be betterto use these mechanisms for reaching the poor. The idea that other social transfer programscould do a better job of reaching the poor than electricity subsidies is supported by inter-national experience. The Coady, Grosh, and Hoddinott (2003) study of the targeting ofsocial policy instruments, cited above, shows that social funds, cash transfer programs, andwork programs are much more likely than electricity subsidies to do a good job of target-ing the poor.
48 World Bank Working Paper
11503-05_Ch05_rev.qxd 1/6/09 9:53 AM Page 48

APPENDIXES
11503-06_AppA.qxd 1/6/09 9:54 AM Page 49

11503-06_AppA.qxd 1/6/09 9:54 AM Page 50
APPENDIX A
Evolution of ResidentialElectricity Subsidies
and Tariffs in Mexico
51
11503-06_AppA.qxd 1/6/09 9:54 AM Page 51

52 World Bank Working Paper
Period Subsidies Tariff Structures
1964–70
1971–73
1973
1974
1988
1990
1995
Feb 2002
April 2002
Tariff set to cover costs. Increased effi-ciency in the sector cancels out lowlevels of inflation.
Subsidies begin, as pace of inflationincreases.
Subsidies formally introduced into thetariff structure.
Summer subsidies introduced.
Additional summer subsidies introduced.
Tariffs adjusted, new summer subsidyintroduced.
New summer subsidy introduced.
Tariff review.
New summer subsidy introduced.
Tariff 1: Fixed charge + single consump-tion charge.
Tariff 1:♦ Fixed charge eliminated and
replaced by small minimum charge.♦ Three block IBTs introduced with
subsidies in first two blocks (0–50,50–100, 100+).
Tariff 1A:♦ Extended second subsidized block
of Tariff 1 for areas where the tem-perature is > 25 °C for four monthsof the year.
Tariffs 1B–1C♦ Extensions of Tariff 1A for zones
with temps > 28 °C and > 30 °C,respectively.
Tariffs 1, 1A, 1B, 1C changed:♦ Blocks of IBT extended.♦ Prices of last block increased.Tariff 1D introduced for zones with
temps > 31 °C.
Tariff 1E introduced for zones withtemps > 32 °C.
Three billing schedules introduced for each tariff area: low (75 percentof customers), moderate (25 percentof customers), and excessive con-sumption (5 percent of customers).
♦ Those with moderate consumptionpay more than cost in the thirdblock of the IBT.
♦ Those with excessive consumptionpay a flat DAC tariff, which is abovelong-run marginal cost.
Tariff 1F introduced for zones withtemps > 33 °C.
11503-06_AppA.qxd 1/6/09 9:54 AM Page 52
APPENDIX B
Residential Electricity Tariffs in 2006
53
11503-06_AppB.qxd 1/6/09 9:55 AM Page 53

54 World Bank Working Paper
Domestic Electricity Tariffs (Average May–October 2006)
Season:Tariff Summer/ Range Tariff Type Non-summer Tariff Blocks kWh per kWh
<140Básico 1–75 0.610
Intermedio 76–140 0.724
1 Básico 1–75 0.610
>140 Intermedio 76–125 1.006
Excedente 126– 2.126
<150Básico 1–100 0.530
Intermedio 101–150 0.631
S Básico 1–100 0.530
>150 Intermedio 101–150 0.796
1AExcedente 151– 2.126
<150Básico 1–75 0.610
Intermedio 76–150 0.724
NS Básico 1–75 0.610
>150 Intermedio 76–125 1.006
Excedente 126– 2.126
<225Básico 1–125 0.530
Intermedio 126–225 0.631
S Básico 1–125 0.530
>225 Intermedio 126–200 0.796
BExcedente 201– 2.126
<175Básico 1–75 0.610
Intermedio 76–175 0.724
NS Básico 1–75 0.610
>175 Intermedio 76–150 1.006
Excedente 151– 2.126
<300Básico 1–150 0.530
Intermedio 151–300 0.631
S Básico 1–150 0.530
>300 Intermedio 151–450 0.796
CExcedente 451– 2.126
<175Básico 1–75 0.610
Intermedio 76–175 0.724
NS Básico 1–75 0.610
>175 Intermedio 76–150 1.006
Excedente 151– 2.126
11503-06_AppB.qxd 1/6/09 9:55 AM Page 54
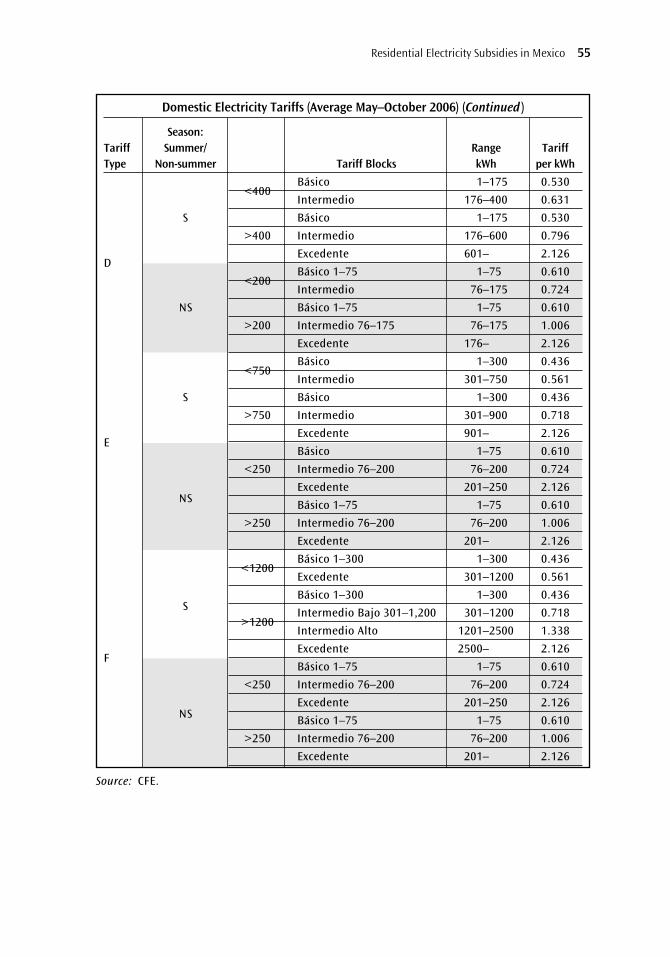
Residential Electricity Subsidies in Mexico 55
Domestic Electricity Tariffs (Average May–October 2006) (Continued )
Season:Tariff Summer/ Range Tariff Type Non-summer Tariff Blocks kWh per kWh
<400Básico 1–175 0.530
Intermedio 176–400 0.631
S Básico 1–175 0.530
>400 Intermedio 176–600 0.796
DExcedente 601– 2.126
<200Básico 1–75 1–75 0.610
Intermedio 76–175 0.724
NS Básico 1–75 1–75 0.610
>200 Intermedio 76–175 76–175 1.006
Excedente 176– 2.126
<750Básico 1–300 0.436
Intermedio 301–750 0.561
S Básico 1–300 0.436
>750 Intermedio 301–900 0.718
EExcedente 901– 2.126
Básico 1–75 0.610
<250 Intermedio 76–200 76–200 0.724
Excedente 201–250 2.126NS Básico 1–75 1–75 0.610
>250 Intermedio 76–200 76–200 1.006
Excedente 201– 2.126
<1200Básico 1–300 1–300 0.436
Excedente 301–1200 0.561
Básico 1–300 1–300 0.436S
>1200Intermedio Bajo 301–1,200 301–1200 0.718
Intermedio Alto 1201–2500 1.338
FExcedente 2500– 2.126
Básico 1–75 1–75 0.610
<250 Intermedio 76–200 76–200 0.724
Excedente 201–250 2.126NS Básico 1–75 1–75 0.610
>250 Intermedio 76–200 76–200 1.006
Excedente 201– 2.126
Source: CFE.
11503-06_AppB.qxd 1/6/09 9:55 AM Page 55

11503-06_AppB.qxd 1/6/09 9:55 AM Page 56
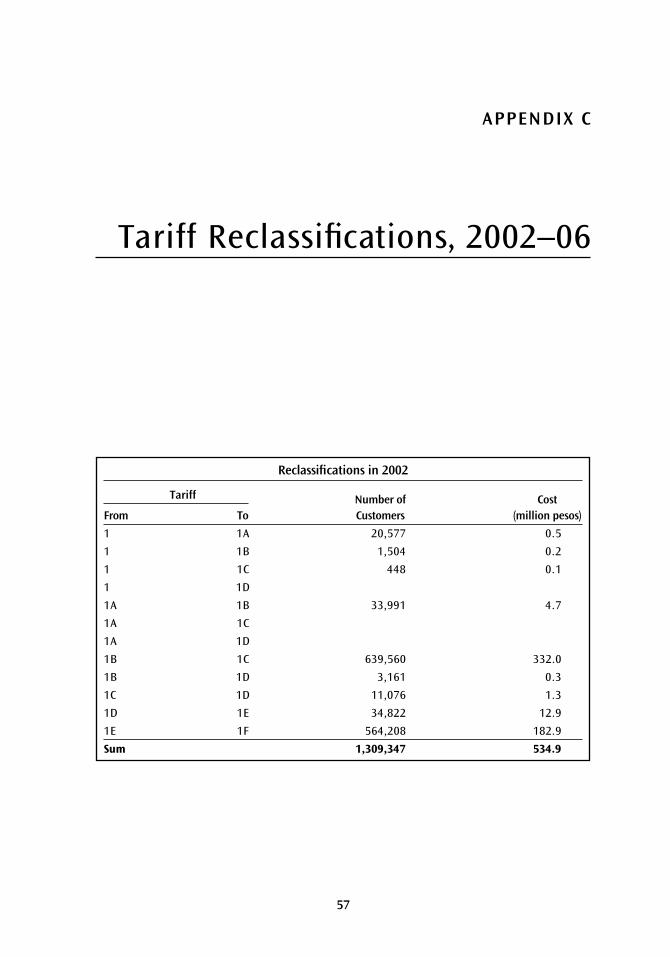
APPENDIX C
Tariff Reclassifications, 2002–06
57
Reclassifications in 2002
Tariff Number of Cost From To Customers (million pesos)
1 1A 20,577 0.5
1 1B 1,504 0.2
1 1C 448 0.1
1 1D
1A 1B 33,991 4.7
1A 1C
1A 1D
1B 1C 639,560 332.0
1B 1D 3,161 0.3
1C 1D 11,076 1.3
1D 1E 34,822 12.9
1E 1F 564,208 182.9
Sum 1,309,347 534.9
11503-07_AppC.qxd 1/6/09 9:56 AM Page 57

58 World Bank Working Paper
Reclassifications in 2003
Tariff Number of Cost From To Customers (million pesos)
1 1A 16,219 0.2
1 1B
1 1C
1 1D
1A 1B 421,558 70.4
1A 1C 3,086 0.2
1A 1D
1B 1C 876,783 220.0
1B 1D
1C 1D 275,134 63.4
1D 1E 55,846 20.2
1E 1F
Sum 1,648,626 374.4
Reclassifications in 2004
Tariff Number of Cost From To Customers (million pesos)
1 1A
1 1B
1 1C
1 1D
1A 1B 2,485 0.4
1A 1C
1A 1D
1B 1C 5,990 2.0
1B 1D 407 0.1
1C 1D 25,084 5.4
1D 1E 161,740 100.0
1E 1F 14,275 27.3
Sum 209,981 135.2
11503-07_AppC.qxd 1/6/09 9:56 AM Page 58

Residential Electricity Subsidies in Mexico 59
Reclassifications in 2005
Tariff Number of Cost From To Customers (million pesos)
1 1A 77,452 8.9
1 1B 9,390 1.7
1 1C 956 0.1
1 1D 4,985 0.9
1A 1B 25,958 7.5
1A 1C
1A 1D 2,398 0.7
1B 1C 103,188 42.2
1B 1D
1C 1D 16,340 3.6
1D 1E 3,246 1.1
1E 1F
Sum 243,913 66.7
Reclassifications in 2006
Tariff Number of Cost From To Customers (million pesos)
1 1A 23,775 5.0
1 1B
1 1C
1 1D
1A 1B
1A 1C
1A 1D
1B 1C 40,605 25.0
1B 1D 640 0.4
1C 1D 421 0.1
1D 1E 5,814 4.0
1E 1F
Sum 71,255 34.5
11503-07_AppC.qxd 1/6/09 9:56 AM Page 59

60 World Bank Working Paper
Reclassifications in 2002–06
Tariff Number of Cost From To Customers (million pesos)
1 1A 138,023 14.6
1 1B 10,894 1.9
1 1C 1,404 0.2
1 1D 4,985 0.9
1A 1B 483,992 83.0
1A 1C 3,086 0.2
1A 1D 2,398 0.7
1B 1C 1,666,126 621.2
1B 1D 4,208 0.8
1C 1D 328,055 73.8
1D 1E 261,468 138.2
1E 1F 578,483 210.2
Sum 3,483,122 1,145.7
Source: Aburto 2007, using data provided by CFE.
11503-07_AppC.qxd 1/6/09 9:56 AM Page 60

Methodology for Measuring Subsidies and Subsidy Distribution
The methodology used to measure subsidies and to estimate subsidy distribution acrossconsumption deciles is, with minor exceptions,29 the same as was used in the 2003 analy-sis of Mexican residential electricity subsidies commissioned by the World Bank.
Data
The following data from 2005 were used for this study:
■ The 32 residential tariff schedules (from the Mexico National Electricity Commission[CFE] web page);
■ Aggregate annual data on the number of customers, sales, revenues (minus taxesand fees), and subsidies for each of the seven basic tariffs (1, 1A, 1B, 1C, 1D, 1E, 1F)and for the six High Consumption Residential Tariffs (DAC) grouped together(provided by the Finance Ministry);
■ Histograms of electricity consumers for each basic tariff, with interval distributionsof customers and sales (provided by the Finance Ministry); and
■ Monthly sales and revenues by tariff (from the CFE web page).
APPENDIX D
Analysis of Subsidies Using CFE Data
61
29. In 2003, Tariff 1F and the DAC tariffs had just been established and there was insufficient informa-tion on them to represent them adequately. Therefore, Tariffs 1E and 1F were worked together as a singletariff. For the DAC tariffs, estimators were used to infer their impact upon each basic tariff. In the currentstudy Tariff 1F and the DAC tariffs are fully analyzed. A second difference between the previous study andthis study is that the 2003 study included households without electricity in the first consumption decile. Thecurrent study examines only the distribution of subsidies among customers with electricity connections.
11503-08_AppD.qxd 1/6/09 9:57 AM Page 61
The monthly sales and revenue information was used to turn the annual histograms for allof the basic tariffs except Tariff 1 into seasonal histograms (summer and winter season).30 Thebasis for the subsidy analysis was, thus, 13 histograms corresponding to the seven basic tariffs.
No separate histogram for Central Light and Power (LFC) customers was available.However, since consumption and price statistics for LFC customers are very similar to Tar-iff 1 customers from CFE, the assumption was made that CFE’s histogram for Tariff 1 couldbe used for LFC customers as well.
These sources of information are not entirely consistent. There are several reasons forthis, including nontechnical losses, billing cycles, and errors. Nevertheless, differences arevery small and have no significant effect on the analysis.
Building Subsidy Histograms
The histograms provided by the Finance Ministry had information on only the number ofcustomers and sales for each histogram interval. To estimate consumption, revenues, andsubsidies by interval in each of the 13 histograms, the following steps were performed:
1. Interval consumption midpoints were used to compute total annual sales from thebottom up. These sales estimates differed somewhat from true sales, due to the skew-ness of the customers and sales distributions in the histogram. An adjustment coef-ficient was therefore applied to the midpoints in order to reproduce actual sales(which are known). These new interval “midpoints” are good estimates of actualaverage consumption per interval.
2. Average monthly bills per season were determined for each interval based on thisestimate of average consumption and the known tariff schedules.
3. Average customer bills multiplied by the number of customers per interval yields (sea-sonal) revenues for that particular interval. The sum of all intervals equals total rev-enues for that histogram. This total was compared with the official statistic for revenuesand, again, a skewness adjustment factor was applied to make them coincide.
4. The last step was to estimate subsidies by interval in each histogram. Subsidies weredefined as the difference between cost and revenue.31 It is generally accepted that thecost functions for residential electricity follow the structure of the DAC tariffs (thatis, consist of a fixed cost plus a volumetric cost component), but that the DAC tar-iffs are above cost. To estimate the cost function for each tariff group, first, the DACfixed charge was adopted as the estimate of fixed cost. The energy cost (the variableportion of the cost function) was then independently estimated for each of the 13histograms. The DAC volumetric charge was used as the initial estimate of variablecost. This charge was then lowered until the histogram reproduced the known totalvalue for subsidies for each particular tariff and season.32
62 World Bank Working Paper
30. Tariff 1 does not vary by season and the consumption pattern is fairly consistent across the year.31. CFE accounting costs were used as costs for both CFE and LFC customers, because LFC account-
ing costs are elevated by inefficiency.32. The energy costs that make histogram-generated subsidies match total reported subsidies for the
seven basic tariffs were found to be 70 percent to 80 percent of the energy charges for the DAC tariffs. Thisis consistent with estimates from the Treasury Department regarding the relationship between actual costsand the levels of the DAC tariffs’ charges.
11503-08_AppD.qxd 1/6/09 9:57 AM Page 62

Adding DAC Customers
These histograms did not include DAC customers; they only included customers in thebasic and intermediate consumption schedules of each tariff. Information on revenue andsubsidies was not available for DAC customers by tariff, but rather for all DAC customersas a group. It was thus necessary to add DAC customers to the histograms for each tariff.
To do this, assumptions had to be made about the distribution of DAC customersacross basic tariff classes: the numbers of households paying DAC tariffs in each basic tar-iff group was estimated in proportion to the overall number of households and the aver-age consumption per customer, for each basic tariff. The estimates range from 2.3 percentof customers paying DAC in the Tariff 1 zone to 0.81 percent of customers for Tariff 1F.
Next, since there are six regional DAC tariffs, and these regions do not correspondcompletely with the basic tariff zones, it was necessary to produce an estimate of the aver-age DAC tariff applied to customers in each tariff group. To do this, the largest 50 cities inthe country were examined, and their basic tariffs specified. They were then grouped bybasic tariff and the applicable DAC tariffs weighted by population for those large citiesinvolved. This generated the average DAC tariff to be applied for each basic tariff group.With this information, it was possible to compute aggregate variables (sales, revenues) forDAC customers in each basic tariff and to create “basic tariff + DAC” histograms for eachtariff and each season.
Throughout this process, statistical tests were performed to assess the accuracy of theinformation in the resulting histograms. Tests consisted of computing average consump-tion, and annual revenues and subsidies, and comparing these partial results with actualfigures available from CFE’s annual statistics. The statistical errors for global statistics were0.2 percent for annual revenues, 0.3 percent for annual subsidies, and less than 0.1 percentboth for annual sales and annual costs.
Determining Deciles and Subsidies Accruing to Each Decile
The histograms provided by the Finance Ministry had variable numbers of intervals. Topermit the analysis of subsidy by consumption decile, the original histograms had to bemodified into histograms with only 10 intervals, one per decile.
For Tariffs 1A to 1F, the summer and winter “basic tariff + DAC” histograms wereadded (a weighted sum) to establish annual histograms. These histograms together withthe Tariff 1 histogram constitute the seven annual histograms over which deciles of cus-tomers were identified. The consumption intervals so defined were then applied back toseasonal histograms for each basic tariff.
In most cases it was necessary to interpolate the Kilowatt-hour (kWh) breakpoints foreach decile, because the intervals in the original histograms did not necessarily correspondto the decile breakpoints. Linear interpolation was used to establish the boundaries.
For each decile, interval average values were computed for households and sales. Thiswas followed by the computation of revenues, costs, and subsidies for each interval. In eachcase the end result was an abbreviated histogram with only 10 intervals corresponding tocustomer deciles.
Residential Electricity Subsidies in Mexico 63
11503-08_AppD.qxd 1/6/09 9:57 AM Page 63

11503-08_AppD.qxd 1/6/09 9:57 AM Page 64
Sixty-five percent of households surveyed answered a survey question about electric-ity expenditure; most of the other 35 percent have electricity connections but eitherfailed to report the data or are not paying for the electricity they receive. For the
65 percent of households that reported electricity expenditures, electricity consumptionwas estimated by applying the tariff applicable to each household (based on informationreceived from the Mexico National Electricity Commission [CFE]). It was necessary toeliminate 7 percent of the Mexico National Household Income and Expenditure Survey[ENIGH] households from this analysis because CFE listed two tariffs for their localitiesand it was unclear which applied to the surveyed households. In the analysis of the remain-ing households, the value-added tax was subtracted from reported expenditure beforecalculating electricity use.
A benefit incidence analysis of the Residential Electricity Schedule (RES) entails anumber of methodological and data difficulties, which include the following.
How Much of the Subsidy Benefits Paying Consumers Compared to NonpayingConsumers and Producers?
It is not clear what proportion of the residential electricity subsidy should be imputed asbenefits to paying electricity consumers. The subsidy compensates consumers for the com-paratively high costs of electricity production and distribution in Mexico (Tables 2.5 and2.6). There is evidence that these excess costs derive in part from production inefficiencies,electricity leakages, and high labor costs associated with low productivity and generousworker benefits (Hernández 2007; Guerrero and others 2007; Carreón-Rodríguez, Jimenez,and Rosellon 2007; World Bank 2005). Part of the subsidy thus benefits consumers who are
APPENDIX E
Analysis of Subsidies Using ENIGH Data
65
11503-09_AppE_rev.qxd 1/6/09 9:58 AM Page 65

illegally connected to the network, not paying for all or any of their electricity consumption,and electricity sector workers and pensioners. Unfortunately, the sector is opaque in its coststructure, and the total RES is reported in official documents without any disaggregation orexplanation of estimation methods and sources, so the estimate of the incidence of resi-dential electricity subsidy is based on full costs.
Tariff Structure
The RES tariff structure is complex, varying by consumption level, locality (temperature),and season (summer/non-summer), with a wide range of cost per kWh (0.4 to 2.7 Mexicanpesos [MP] on average in 2006, Appendix B). There are currently seven residential elec-tricity subsidy tariff types, each structured into three to five increasing block tariff (IBTs),plus a volume differentiated tariff (VDT) for high-volume electricity consumers: HighConsumption Residential Tariff (DAC).
1. Tariff 1 is the principal tariff type (largest coverage), and has no seasonal variation.The other six tariffs, 1A to 1F, allocate subsidies for localities with high summer tem-peratures, increasing by alphabetic order both in temperature and subsidy rates.Each of the latter has different summer and non-summer schedules. Non-summertariffs per Kilowatt-hour (kWh) in Tariffs 1A to 1F coincide with Tariff 1, but theceilings of the intermediate and upper blocks increase for higher-temperature tar-iffs (from 140 kWh per month in Tariff 1, up to 250 kWh in Tariff 1F). In the caseof summer tariffs, the tariffs per kWh are lower for the basic and intermediate blocks,and the ceilings increase much more sharply, especially for the four higher-temperaturetariffs (1C to 1F), with a subsidized upper-intermediate block reaching 2500 kWh permonth in 1F.
2. For each of the seven tariff types, the DAC tariff comes into force when a movingaverage of consumption over the previous year reaches beyond a specific threshold,which increases from 250 for Tariff 1 to 2500 for Tariff 1F (Appendix B). This tariffhas a small fixed charge (about 60 MP in 2006), plus a constant tariff per kWh (2.1to 2.7 MP per kWh), which varies regionally (Baja California, Baja California Sur,North West, North-North East, South & Peninsula, and Center),33 and for thetwo Baja California peninsula states, also seasonally (with higher rather thanlower summer tariffs). These tariffs exceed full marginal production costs by at least20 percent on Ministry of Finance (SHCP) estimates, and are reported in house-hold electricity bills as fully unsubsidized.
Household-level Data on Electricity Spending and Estimation of Consumption
The only available source of household data to analyze the incidence of the RES by incomegroups is the ENIGH income and expenditure survey. We use the most recent availableENIGH survey, for 2006. This reports high-quality household income data, and household
66 World Bank Working Paper
33. The classification of some localities into regions does not appear to be determined by their geographiclocations.
11503-09_AppE_rev.qxd 1/6/09 9:58 AM Page 66

expenditures on electricity, but does not report kWh consumption. We have used thetariff structure to deduce the latter from the former, using the algorithm presented inAppendix C. In this imputation we make the following assumptions and information:
1. It is only possible to use the households in ENIGH that report electricity spending,representing 65 percent of the total ENIGH sample. Most of the other 35 percenthave electricity connections, but it is not known how many of these fail to reportbecause they are connected illegally (and thus fully, but illegally subsidized), and howmany where paying consumers who failed to report this data.
2. It is assumed that households correctly report monthly electricity spending toENIGH interviewers, despite the fact that most households are billed bimonthly.
3. Since electricity bills include a 15 percent value-added tax, this tax is subtracted fromelectricity spending reported by households so that pretax expenditures are used inthe noted imputation algorithms.
4. It is assumed that electricity spending reported in ENIGH corresponds to summertariffs. ENIGH interviews during August–November. Households are asked aboutconsumption in the previous month (July–October), and since they mostly paytheir bills bimonthly and with a monthly lag, we assume that households arereporting consumption for May/June–August/September, which corresponds tothe summer months used by CFE in the definition of tariffs. Average tariffs asreported by CFE for May–October 2006 are used.
5. Tariff types are defined at the locality level, so to assign households to their corre-sponding tariff type we obtained from INEGI the locality codes corresponding to allENIGH households, and from CFE (through Hacienda) the tariff types corre-sponding to each of these localities. For some unexplained reason, the CFE listreported multiple tariffs for some localities, corresponding to 7 percent of ENIGHhouseholds. These were eliminated from the analysis.
6. For each tariff type, we assume households are paying DAC tariffs when reportedspending is above the spending threshold implied by the DAC kWh threshold pricedaccording to the corresponding DAC tariff (average May–October 2006).
7. ENIGH is also used to estimate the incidence of the Oportunidades Energéticas pay-ments, because this source reports Oportunidades transfers.
Distribution by Income-ordered Household Deciles and Quintiles
We present the results of the distributive analysis by household deciles and quintilesordered by total current income per capita. Even by quintiles, the averages reported forTariffs 1E and 1F for the first quintile should be interpreted with care because they arebased on small numbers of cases.
Cost per kWh
To estimate per-household subsidies, an average cost per kWh of 2.19 pesos is assumed,derived from official (SHCP and CFE) reports of the total residential electricity subsidyby CFE, electricity sales for domestic use, and average electricity price to domestic users(Table E.1). For consistency, this cost is applied to all households, despite the fact that
Residential Electricity Subsidies in Mexico 67
11503-09_AppE_rev.qxd 1/6/09 9:58 AM Page 67

reported average cost perkWh for LFC is significantlyhigher (3.82 pesos). This costper kWh is applied for allhouseholds independently oftariff type, geographic loca-tion, size of locality, season,or level of consumption. Ofthese variables, geography andsize of localities must implysignificant cost differences,but the cost data are lackingto take these into account.
Given the strong correlation of poverty and population dispersion in Mexico, ignoring theimplicit subsidy to small and remote localities leaves out an important source of progressiv-ity (pro-poor) in the electricity subsidy. On the other hand, ignoring geographic cost differ-ences in the incidence analysis might be justified if the equity objective of electricity subsidiesis defined in terms of equal access to electricity, rather than equal financing per kWh.
Table E.2 compares aggregate electricity subsidy, consumption, and spending databy tariff type obtained from the ENIGH survey with the corresponding data fromadministrative records for all households served by the national electricity network,reported by CFE.
The distribution of the subsidy, consumption, and spending by tariff types of ENIGH isbroadly consistent with administrative data. There is a very significant difference, however,in average spending (and thus consumption and subsidy) levels per household. (Note alsothat the average DAC price is slightly below cost according to administrative data, but abovecost in ENIGH). This may reflect misreporting by households in ENIGH of bimonthly billsas monthly spending, but it may also reflect non-revenue consumption, reported in ENIGHbut not in the administrative records.
68 World Bank Working Paper
Table E.1. Cost per KWh (2006)
CFE LFC Total
Average Cost per kWh (MP) 2.19 3.82 2.42
Average Price per kWh (MP) 0.96 1.11 0.98
Price/Cost ratio 44% 29% 41%
Total Subsidy (million MP) 46,683 17,288 63,971
Total Revenue (million MP) 36,637 7,082 43,719
Total Cost (million MP) 83,320 24,370 107,690
Total Sales (MWh million) 38,072 6,381 44,452
Source: CFE, SHCP.
11503-09_AppE_rev.qxd 1/6/09 9:58 AM Page 68

Table E.2. Residential Electricity Subsidies, Consumption, and Spending by Tariff Type: Administrative and Household Survey Data
AverageSubsidy Electricity Consumption Electricity Spending Users Price
Tariff/ Million MP/HH kWh/HH Million MP/HH Million MP per Subsidy MP Distribution (monthly) MWh Distribution (monthly) MP Distribution (monthly) Households Distribution KWh
Administrative Data (CFE 2006)
Total RES 63,971 100.0% 202 44,452,408 100.0% 141 43,719 100.0% 138 26.348 100.0% 0.984
1 24,893 38.9% 143 16,146,697 36.3% 93 14,224 32.5% 82 14.493 55.0% 0.881
1A 2,896 4.5% 160 1,811,376 4.1% 100 1,493 3.4% 82 1.508 5.7% 0.824
1B 7,404 11.6% 195 4,709,015 10.6% 124 4,004 9.2% 106 3.158 12.0% 0.850
1C 13,332 20.8% 277 8,709,386 19.6% 181 7,767 17.8% 161 4.018 15.3% 0.892
1D 3,227 5.0% 331 2,038,791 4.6% 209 1,713 3.9% 176 0.813 3.1% 0.840
1E 5,659 8.8% 470 3,430,456 7.7% 285 2,651 6.1% 220 1.004 3.8% 0.773
1F 6,423 10.0% 680 3,862,778 8.7% 409 2,935 6.7% 311 0.787 3.0% 0.760
DAC 137 0.2% 20 3,743,909 8.4% 550 8,933 20.4% 1312 0.568 2.2% 2.386
OEC (2007) 2,919 4.4%* 50 4.864
Survey Data (ENIGH 2006)
Total RES 62,007 100.0% 319 48,393,315 100.0% 249 55,230 100.0% 285 16.173 100.0% 1.141
1 20,046 32.3% 176 17,005,975 35.1% 149 21,153 38.3% 186 9.494 58.7% 1.244
1A 1,972 3.2% 273 1,468,338 3.0% 203 1,585 2.9% 219 0.603 3.7% 1.080
1B 6,779 10.9% 279 4,981,331 10.3% 205 5,289 9.6% 217 2.027 12.5% 1.062
1C 17,287 27.9% 644 11,082,745 22.9% 413 9,562 17.3% 356 2.238 13.8% 0.863
1D 4,153 6.7% 786 2,593,447 5.4% 491 2,130 3.9% 403 0.440 2.7% 0.821
1E 4,021 6.5% 1098 2,268,973 4.7% 620 1,475 2.7% 403 0.305 1.9% 0.650
1F 8,669 14.0% 1618 5,094,962 10.5% 951 3,674 6.7% 686 0.446 2.8% 0.721
DAC −919 −1.4% −124 3,897,543 8.1% 524 10,361 18.8% 1393 0.620 3.8% 2.658
OEC (2007) 2,348 3.6%* 50 3.914
*Of total domestic electricity subsidies.Source: CFE, ENIGH (2006).
11503-09_AppE_rev.qxd 1/6/09 9:58 AM Page 69

11503-09_AppE_rev.qxd 1/6/09 9:58 AM Page 70

Part 1. Methodology Used for the Simulations (CFE Data)
Predicting Changes in Electricity Consumption
An important part of the simulation methodology is predicting the change in electricityconsumption that will result when prices are increased. To calculate price elasticity ofdemand, the Mexico National Electricity Commission (CFE) demand model for residen-tial electricity was used. This model structure (without coefficients) was published by theMinistry of Energy (SENER) in December 2007.34 The demand model has two compo-nents. The first estimates the percentage of homes in Mexico that have electricity—thenumber of residential users. The second model estimates the energy demand per user:
VUt = F (VUt−1, SATt, CP/Vt, Pt, PREDt, T, VIVUR)
Where:
VUt−1 = sales per residential users in the period t−1SATt = coefficient of saturation of users (residential users / homes)
CP/Vt = private consumption per household (indicator of disposable income)Pt = average real price for residential electricity
PREDt = relative price of electrical appliancesT = time
VIVUR = variable that measures increases in nontechnical losses in Central Light andPower (LFC) (0 in 2001 with gradual increases up to 1 in 2007).
APPENDIX F
Tariff Reform Scenarios
71
34. Secretaría de Energía, “Prospectiva del Sector Eléctrico 2007–2016,” pp. 167–9.
11503-10_AppF_rev.qxd 1/6/09 9:59 AM Page 71
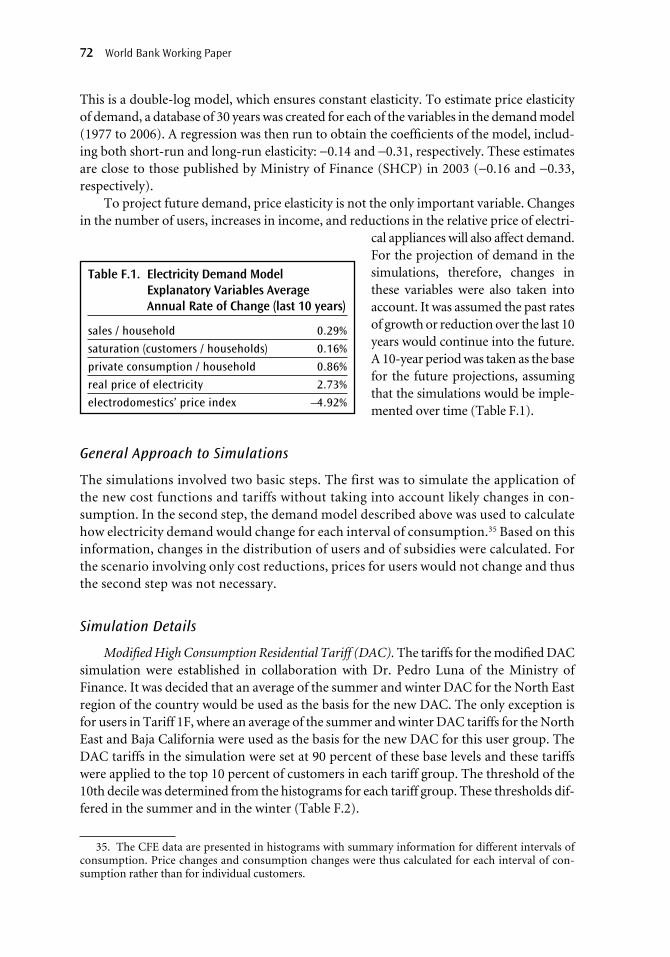
This is a double-log model, which ensures constant elasticity. To estimate price elasticityof demand, a database of 30 years was created for each of the variables in the demand model(1977 to 2006). A regression was then run to obtain the coefficients of the model, includ-ing both short-run and long-run elasticity: −0.14 and −0.31, respectively. These estimatesare close to those published by Ministry of Finance (SHCP) in 2003 (−0.16 and −0.33,respectively).
To project future demand, price elasticity is not the only important variable. Changesin the number of users, increases in income, and reductions in the relative price of electri-
cal appliances will also affect demand.For the projection of demand in thesimulations, therefore, changes inthese variables were also taken intoaccount. It was assumed the past ratesof growth or reduction over the last 10years would continue into the future.A 10-year period was taken as the basefor the future projections, assumingthat the simulations would be imple-mented over time (Table F.1).
General Approach to Simulations
The simulations involved two basic steps. The first was to simulate the application ofthe new cost functions and tariffs without taking into account likely changes in con-sumption. In the second step, the demand model described above was used to calculatehow electricity demand would change for each interval of consumption.35 Based on thisinformation, changes in the distribution of users and of subsidies were calculated. Forthe scenario involving only cost reductions, prices for users would not change and thusthe second step was not necessary.
Simulation Details
Modified High Consumption Residential Tariff (DAC). The tariffs for the modified DACsimulation were established in collaboration with Dr. Pedro Luna of the Ministry ofFinance. It was decided that an average of the summer and winter DAC for the North Eastregion of the country would be used as the basis for the new DAC. The only exception isfor users in Tariff 1F, where an average of the summer and winter DAC tariffs for the NorthEast and Baja California were used as the basis for the new DAC for this user group. TheDAC tariffs in the simulation were set at 90 percent of these base levels and these tariffswere applied to the top 10 percent of customers in each tariff group. The threshold of the10th decile was determined from the histograms for each tariff group. These thresholds dif-fered in the summer and in the winter (Table F.2).
72 World Bank Working Paper
Table F.1. Electricity Demand ModelExplanatory Variables AverageAnnual Rate of Change (last 10 years)
sales / household 0.29%
saturation (customers / households) 0.16%
private consumption / household 0.86%
real price of electricity 2.73%
electrodomestics’ price index −4.92%
35. The CFE data are presented in histograms with summary information for different intervals ofconsumption. Price changes and consumption changes were thus calculated for each interval of con-sumption rather than for individual customers.
11503-10_AppF_rev.qxd 1/6/09 9:59 AM Page 72

Volume Differentiated Tariff(VDT). The VDT tariff structure wasproposed by the authors. It includesthree different tariffs for consumerswith different levels of consumption.The first tariff subsidizes consumptionof those consuming less than 100 Kilo-watt-hours (kWh) per month. Thesecond subsidizes consumption forthose consuming between 100 kWhand 200 kWh. Table F.3 displays the exact tariffs and level of discountapplied for each tariff.
Tariff Reform Scenarios 73
Table F.2. Threshold of 10th Decile in kWh perConnection per Month, for EachTariff Group
Tariff Summer Winter
1 190 190
1A 200 200
1B 250 225
1C 450 300
1D 600 300
1E 850 400
1F 1200 400
Table F.3. VDT Simulation Tariff, for Analysis with CFE Data
Tariff For Consumers Using Fixed Charge Variable Charge per kWh
Basic consumption 0–100 kWh 16.328 1.013 pesos tariff (40% of std tariff) (70% of standard tariff)
Intermediate tariff 100–200 kWh 36.737 1.302 pesos (90% of std tariff) (90% of standard tariff)
Standard tariff Above 200 kWh 40.819 1.447 pesos
Cost Reduction. For the reduced cost scenario, and for the modified DAC plus costreduction scenario, the fixed and variable components of the tariff and season-specific costfunctions were each reduced by 20 percent. For the VDT with cost reduction scenario,however, it was necessary to create a new systemwide cost function because the existingtariff groups disappear in this simulation. The cost function for Tariff 1 was used as thebase. That function is: C = 51.024 + 1.809*Q. After applying the 20 percent cost reduction,the cost function became: C = 40.819 + 1.447*Q.
Part 2. Methodology Used for the Simulations (ENIGH Data)
Predicting Changes in Electricity Consumption
To predict the changes in electricity consumption as a result of the simulated tariff changes,the short-run price elasticity estimates are derived from the CFE demand model (see Scott2007, Annex 40).
Details of the Simulations
Modified DAC Tariff. For the simulation of the modified DAC tariff, the tariff andthreshold for the 10th decile that were used in the simulation with CFE data (see Appen-dix D) where applied to the ENIGH data. Those customers consuming more than thethresholds indicated in Appendix D were spread among different income deciles.
11503-10_AppF_rev.qxd 1/6/09 9:59 AM Page 73

Cost Reduction. In the analysis with ENIGH data, the cost function applied only has avariable component (no fixed cost). A 20 percent reduction on CFE’s official estimate ofaverage cost (2.19 pesos) is assumed. The resulting average cost is 1.75 pesos per kWh.
VDT Tariff with Cost Reduction. The following VDT tariff was applied for this scenario.To the effect of a VDT without cost reductions, the same tariff was applied, but with thestandard tariff equal to 2.19 pesos and then the same 80 percent and 63 percent discountsapplied to the basic and intermediate tariffs (Table F.4).
74 World Bank Working Paper
Table F.4. Assumptions for VDT Tariff
Tariff For consumers using Fixed charge Variable charge per kWh
Basic consumption tariff 0–100 kWh None 1.10 pesos (63% of standard tariff)
Intermediate tariff 100–200 kWh None 1.45 pesos (80% of standard tariff)
Standard tariff Above 200 kWh None 1.75 pesos
Means-tested Discount with Cost Reduction. For the means-tested discount scenario,most households receive no discount—they pay either 1.75 pesos (in cost reduction sce-nario) or 2.19 pesos per kWh (without cost reduction). Those who qualify for the dis-count receive a discount only on the first 100 kWh of consumption (Table F.5). Twoscenarios for discount recipients were tested. In the first, only those households that qual-ify for Oportunidades receive a discount. In the second, all households in the first incomedecile of ENIGH are also included in the discount recipient group to simulate an improve-ment in the targeting of this means-tested program.
Table F.5. Assumptions for Means-tested Discount
For consumers Fixed charge Variable charge per kWh
Oportunidades 0–100 kWh None 1.10 pesos(or Oportunidades + 100 + None 1.75 pesosfirst income quintile)
Standard tariff All others None 1.75 pesos
11503-10_AppF_rev.qxd 1/6/09 9:59 AM Page 74
Bibliography
75
Aburto, José Luis. 2003.“Mexico Power Sector Subsidies.” Consulting Report for the WorldBank.
———. 2007. “Mexico: Electricity Subsidies—Options for Enhancing the Impact on thePoor.” Consulting Report for the World Bank.
Carreón-Rodriguez, V. G., Armando Jimenez, and Juan Rosellon. 2007. “The Mexican Elec-tricity Sector: Economic, Legal and Political Issues.” In David G. Victor, ed., The PoliticalEconomy of Power Sector Reform: The Experiences of Five Major Developing Countries.Cambridge University Press.
Comisón de Integración Energetica Regional (CIER). 2005.“Tarifas Eléctricas en los Paísesde la CIER 2005.” Montevideo, Uruguay. http://www.cier.org.uy.
Coady, D., M. Grosh, and J. Hoddinott. 2003. “The Targeting of Transfers in DevelopingCountries: Review of Experience and Lessons.”Social Protection Discussion Paper, TheWorld Bank, Washington, D.C.
Guerrero, I., L. F. López-Calva, and M. Walton. 2007.“The Inequality Trap and its Links toLow Growth in Mexico.” Paper presented at World Bank-Harvard Rockefeller CenterConference on Equity and Growth in Mexico. Mexico City, November 27–28, 2006.
Hernández, C. 2007.“La Reforma Cautiva: Inversión, Trabajo y Empresa en el Sector EléctricoMexicano.” Centro de Investigación para el Desarrollo, AC.
International Energy Agency (IEA). 2006.“World Energy Outlook 2006.”Paris: OECD/IEA.Komives, Kristin, Vivien Foster, Jonathan Halpern, and Quentin Wodon. 2005. “Water,
Electricity, and the Poor: Who Benefits from Utility Subsidies?” The World Bank,Washington, D.C.
Ministry of Energy (SENER). 2007.“Estadísticas de Electricidad 2000–2006.” Mexico City,Mexico.
11503-11_Bibliography_rev.qxd 1/6/09 10:00 AM Page 75

Samaniego-Breach, Richard. 2005. “Quality, Efficiency, and Expenditure Review of theElectricity Sector of Mexico.” Revised Final Report. Consulting Report for the MexicoInfrastructure Public Expenditure Review.
Scott, John Roberto. 2004.“Eficiencia redistributiva de los programas contra la pobreza enMéxico.” Documento de Trabajo 307, División de Economía, CIDE, Mexico City.
———. 2007. “Electricity Subsidies—Options for Enhancing the Impact on the Poor.”Background report prepared for the World Bank.
World Bank. 2004. “Mexico Public Expenditure Review.” Report No. 27894—MX. Wash-ington, D.C.
———. 2005.“Mexico: Infrastructure Public Expenditure Review (IPER).”Washington, D.C.———. 2006. “Mexico’s Competitiveness: Reaching Its Potential.” Washington, D.C.———. 2005.“Mexico: Income Generation and Social Protection for the Poor.”Washington,
D.C.———. 2007. GDF & WDI Central Database. Washington, D.C. http://go.worldbank.org/
T9V3X1EL00.
76 World Bank Working Paper
11503-11_Bibliography_rev.qxd 1/6/09 10:00 AM Page 76

11503-11_Bibliography_rev.qxd 1/6/09 10:00 AM Page 77

Eco-AuditEnvironmental Benefits Statement
The World Bank is committed to preserving Endangered Forests and natural resources. Weprint World Bank Working Papers and Country Studies on 100 percent postconsumer recy-cled paper, processed chlorine free. The World Bank has formally agreed to follow the rec-ommended standards for paper usage set by Green Press Initiative—a nonprofit programsupporting publishers in using fiber that is not sourced from Endangered Forests. For moreinformation, visit www.greenpressinitiative.org.
In 2008, the printing of these books on recycled paper saved the following:
Trees*
355*40’ in height and 6-8” in diameter
Total Energy
247 mil.BTUs
Net Greenhouse Gases
31,256Pounds CO
2Equivalent
Water
129,550Gallons
Solid Waste
16,663Pounds
11503-11_Bibliography_rev.qxd 1/6/09 10:00 AM Page 78

THE WORLD BANK1818 H Street, NW
Washington, DC 20433 USA
Telephone: 202 473-1000
Internet: www.worldbank.org
E-mail: [email protected]
Residential Elecricity Subsidies in Mexico is part of the
World Bank Working Paper series. These papers are
published to communicate the results of the Bank’s ongoing
research and to stimulate public discussion.
This report addresses a pressing issue in Mexico’s electricity
sector—the large and growing subsidies to residential
consumers and the highly regressive distribution of these
subsidies across income classes. Today, Mexico’s complex
tariff system includes over 100 different billing possibilities
for residential customers, with many increasing block tariffs
spread over eight climate-based tariff zones. Only the top 2
percent of residential customers cover the cost of the
electricity they receive. Roughly 16 percent of total
residential electricity subsidies go to the smallest
consumers (the bottom three consumption deciles), while
the top three consumption deciles receive 39 percent.
This report explains the growth of subsidies, the current
distributional incidence, and then uses utility and household
survey data to estimate the distributional and fiscal
performance of alternative subsidy mechanisms. The goal is
to help inform discussion in Mexico about how subsidies
might be reduced and redirected toward the poor. The
findings also offer lessons for other countries that are
planning tariff reforms in their electricity sectors.
World Bank Working Papers are available individually or on
standing order. Also available online through the World
Bank e-Library (www.worldbank.org/elibrary).
ISBN 978-0-8213-7884-7
SKU 17884