Resident Student Perceptions of On-Campus Living … · students with hostels (individual...
97
Resident Student Perceptions of On-Campus Living and Study Environments at the University of Namibia and their Relation to Academic Performance by Isak Neema A Project Submitted to the Faculty of the WORCESTER POLYTECHNIC INSTITUTE In partial fulfillment of the requirements of the Degree of Master of Science in APPLIED STATISTICS by _________________________________ May 2003 APPROVED: ___________________________________ Professor Joseph D.Petruccelli ____________________________________ Professor Bogdan Vernescu, Department Head
Transcript of Resident Student Perceptions of On-Campus Living … · students with hostels (individual...
Resident Student Perceptions of On-Campus Living and Study
Environments at the University of Namibia and their Relation
to Academic Performance
by
Isak Neema A Project
Submitted to the Faculty of the
WORCESTER POLYTECHNIC INSTITUTE
In partial fulfillment of the requirements of the
Degree of Master of Science
in
APPLIED STATISTICS
by
_________________________________
May 2003
APPROVED:
___________________________________
Professor Joseph D.Petruccelli
____________________________________
Professor Bogdan Vernescu, Department Head
2
ABSTRACT
This study measures resident student perceptions of on–campus living and study
environments at the University of Namibia campus residence and their relation to student
academic performance. Data were obtained from a stratified random sample of resident
students with hostels (individual dormitory) as strata. Student academic performance was
measured by grade point average obtained from the university registrar. Student
perceptions of living and study environments were obtained from a survey. Inferences
were made from the sample to the population concerning: student perceptions of the
adequacy of the library and campus safety, and differences in perceptions between
students living in old-style and new-style hostels. To relate student perceptions to
academic performance, a model regressing GPA on student perception variables was
constructed. The principal findings of the analyses were that (1) Student perceptions do
not differ between old and new hostels; (2) There is an association between time spent in
the hostel and the type of room, ability to study in room during the day and the type of
room, ability to study in room at night and the type of room, time spent in hostel and
number of times student change blocks, ability to study in room at night and availability
of study desk in room, ability to study in room at night and availability of study lamp in
room, effectiveness of UNAM security personnel and safety studying at classes at night
and also between effectiveness of UNAM security personnel and student perception on
whether security on campus should remain unchanged respectively; (3) Mean GPA
differs with respect to the type of room, ability to study in room during the day, time
spent in hostel, number of times student change blocks, current year of study, time spent
on study, students who are self-catering, sufficiency of water supply in blocks and also
with students who are enrolled in Law and B.Commerce field of study and with students
receiving financial support in the form of loans. (4) The variables found to be significant
in the regression model were Law field of study, double rooms, inability to study in room
during the day and self-catering respectively.
3
ACKNOWLEDGEMENTS
I would first like to thank Professor Joseph D. Petruccelli, my major advisor, for the
guidance and confidence he has given to me. It has been a wonderful experience and I
have learned more than you can imagine.
A great deal of thanks is also extended to my off campus advisor Dr N.O. Ama for his
willingness to work with me during the data collection process of this study. Thank you
for the support and advice that you gave me throughout the course of this great project.
Thank you to Erik Barry Erhardt for his programming and computer wizards and his
willingness to help me when needed. Thanks a lot.
I would also like to thank my friends for their moral support, my mom, dad you have
been there every step of the way and I appreciate you more than you know.
Lastly, I would like to extend a word of thanks to my sponsors, the African American
Institute (AAI) and the University of Namibia (UNAM) for providing the financial
support and the environment from which this study has been conducted. Thank you.
4
TABLE OF CONTENTS 1. PROBLEM DESCRIPTION ---------------------------------------------------------------10
1.1. Introduction --------------------------------------------------------------------------------10
1.2. Goals and objectives of the study ------------------------------------------------------- 10
1.3. Research questions ------------------------------------------------------------------------10
1.3.1. Variables measuring living environments --------------------------------------- 11
1.3.2. Variables measuring study environments ---------------------------------------11
1.4. Characteristics of the studied institution -----------------------------------------------12
1.5. Rationale of the study ---------------------------------------------------------------------13
2. DATA GENERATION ---------------------------------------------------------------------15
2.1. Design Methodology ----------------------------------------------------------------------15
2.1.1. Target population -------------------------------------------------------------------15
2.2. How the survey was conducted ----------------------------------------------------------15
2.3. How data were collected ------------------------------------------------------------------15
2.3.1. Office of the Registrar --------------------------------------------------------------16
2.3.2. From the students residing on campus --------------------------------------------16
2.4. Structure and nature of the campus residence ------------------------------------------16
2.4.1. Characteristics of the hostels ------------------------------------------------------16
2.4.1.1. Old hostels -----------------------------------------------------------------16
2.4.1.2. New hostels ----------------------------------------------------------------17
2.4.2. Hostel management ----------------------------------------------------------------17
2.5. Sample and Sampling procedure ---------------------------------------------------------17
2.5.1. Allocation of sample size ---------------------------------------------------------19
2.5.1.1. Calculation of the total sample size -------------------------------------------20
2.6. Limitation of the study ---------------------------------------------------------------------22
2.7. Quality control ------------------------------------------------------------------------------22
5
3. MATERIALS AND METHODS ------------------------------------------------------------24
3.1. Materials -------------------------------------------------------------------------------------24
3.2. Methods --------------------------------------------------------------------------------------24
3.2.1. Distribution of questionnaire -------------------------------------------------------24
3.2.2. Data entry and analysis -------------------------------------------------------------25
3.2.3. Methods used in analyzing the data ------------------------------------------------25
3.2.3.1. Cross Tabulations -----------------------------------------------------------25
3.2.3.2. Fisher’s Exact Test ----------------------------------------------------------26
3.2.3.3. The Cochran Mantel-Haenszel Test (CMH) ----------------------------27
3.2.3.4. Model selection and fitting ------------------------------------------------28
3.2.3.5. Evaluation of model fits ---------------------------------------------------28
4. ANALYSIS -------------------------------------------------------------------------------------29
4.1. Respondents view as summarized according to the type of hostels -------------------29
4.1.1. Determining whether the responses from the two hostels
differ significantly --------------------------------------------------------------------41
4.2. Test for association ---------------------------------------------------------------------------43
4.3. Students’ opinions on whether the library provides sufficient
study materials in helping them in their studies ------------------------------------------51
4.4. Students’ opinions on the safety of the campus residence ------------------------------52
4.5. Individual correlations between GPA and living and study variables ----------------53
4.6. Regression Model ----------------------------------------------------------------------------57
4.6.1. Model selection -----------------------------------------------------------------------59
4.6.2. Model Validation ---------------------------------------------------------------------64
4.6.3. Interpretations of the fitted model --------------------------------------------------65
5. CONCLUSIONS -------------------------------------------------------------------------------66
APPENDIX I --------------------------------------------------------------------------------------69
6
APPENDIX II ------------------------------------------------------------------------------------77
APPENDIX III ------------------------------------------------------------------------------------93
REFERENCES ------------------------------------------------------------------------------------96
7
LIST OF TABLES Table 1: Distribution of students in the hostels --------------------------------------------18
Table 2: Summary of the sub-sample size to be
drawn from the strata ----------------------------------------------------------------21
Table 3: Cross tabulation of the respondent’s age categories
and the type of hostel ---------------------------------------------------------------29
Table 4: Cross tabulation of the respondent’s current year
of study and the type of hostel -----------------------------------------------------30
Table 5: Cross tabulation of the financial assistance of the
respondents and the type of hostel ------------------------------------------------31
Table 6: Cross tabulation of the time spent in hostel
and type of hostel --------------------------------------------------------------------32
Table 7: Cross tabulation of the type of room
and type of hostel --------------------------------------------------------------------33
Table 8: Cross tabulation of the number of times the respondents
changed blocks and type of hostel -------------------------------------------------33
Table 9: Cross tabulation of the ability to study in room during
the day and type of hostel -----------------------------------------------------------34
Table 10: Cross tabulation of the ability to study in room at night
and type of hostel -------------------------------------------------------------------35
Table 11: Cross tabulation of the time spent on studying
and type of hostel -------------------------------------------------------------------36
Table 12 (a): Cross tabulation of the availability of study desk
in rooms and type of hostel ---------------------------------------------------37
(b): Cross tabulation of the availability of study chair
in rooms and type of hostel ---------------------------------------------------37
(c): Cross tabulation of the availability of study lamp
in rooms and type of hostel ---------------------------------------------------38
Table 13: Classification of student responses by the type of hostel
and sufficient water supply in blocks --------------------------------------------39
8
Table 14: Cross tabulation of safety in rooms and type of hostel -----------------------39
Table 15: Cross tabulation of effectiveness of UNAM security
personnel and type of hostel ------------------------------------------------------40
Table 16: Cross tabulation of the status of security on campus
and type of hostel -------------------------------------------------------------------41
Table 17: Fisher’s Exact Test -----------------------------------------------------------------42
Table 18: Results of the CMH test controlling for block as strata -----------------------45
Table 19: Results of the Multtest procedure ------------------------------------------------47
Table 20: Results of the T-test ----------------------------------------------------------------54
Table 21: Test statistics for regression coefficients using
Extra Sums of Squares -------------------------------------------------------------61
Table 22: Test for Multicollinearity for the full model ------------------------------------62
Table 23: Test for Multicollinearity for the model obtained
using the backward elimination method -----------------------------------------64
9
LIST OF FIGURES
Figure 1: Box and whisker plots ----------------------------------------------------------93
Figure 2: The fitted model using REG Procedure --------------------------------------59
Figure 3: The model fitted using SURVEYREG Procedure --------------------------60
Figure 4: Residual vs predicted plot and normal QQ-plot for
the full model --------------------------------------------------------------------94
Figure 5: Result of the Backward Elimination Method --------------------------------63
Figure 6: Residual vs predicted plot and normal QQ-plot for the model
obtained using the backward elimination method --------------------------95
10
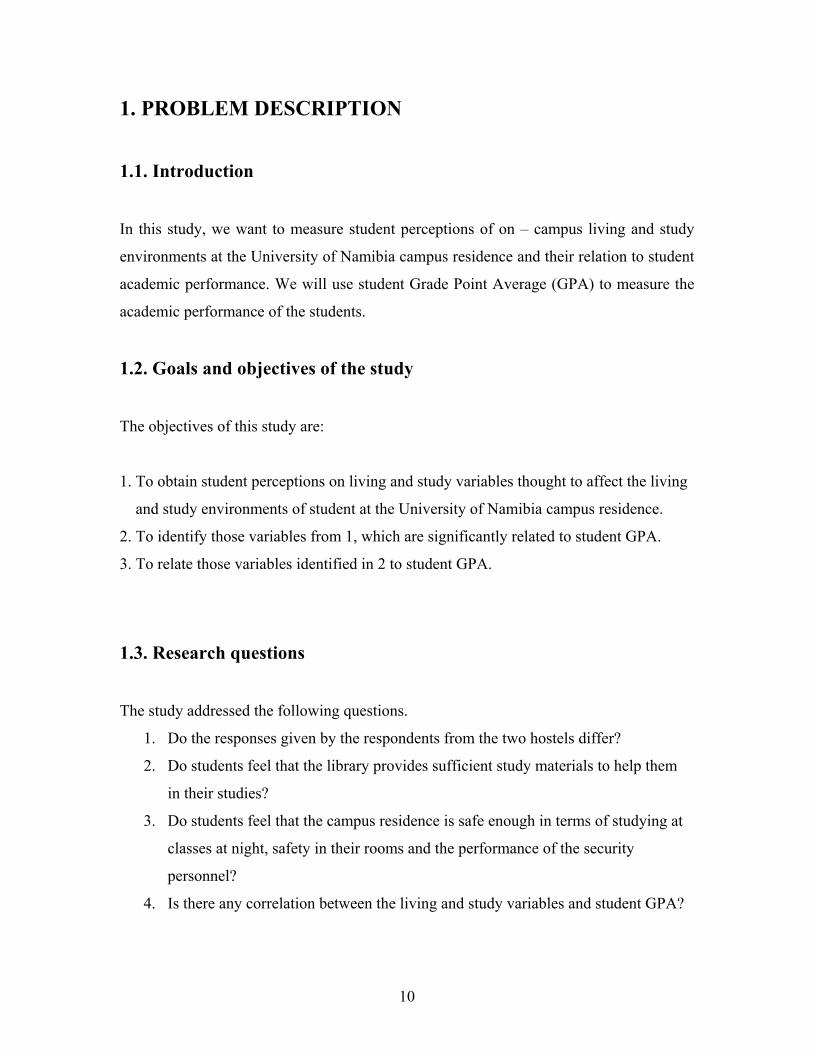
1. PROBLEM DESCRIPTION
1.1. Introduction
In this study, we want to measure student perceptions of on – campus living and study
environments at the University of Namibia campus residence and their relation to student
academic performance. We will use student Grade Point Average (GPA) to measure the
academic performance of the students.
1.2. Goals and objectives of the study
The objectives of this study are:
1. To obtain student perceptions on living and study variables thought to affect the living
and study environments of student at the University of Namibia campus residence.
2. To identify those variables from 1, which are significantly related to student GPA.
3. To relate those variables identified in 2 to student GPA.
1.3. Research questions
The study addressed the following questions.
1. Do the responses given by the respondents from the two hostels differ?
2. Do students feel that the library provides sufficient study materials to help them
in their studies?
3. Do students feel that the campus residence is safe enough in terms of studying at
classes at night, safety in their rooms and the performance of the security
personnel?
4. Is there any correlation between the living and study variables and student GPA?
11
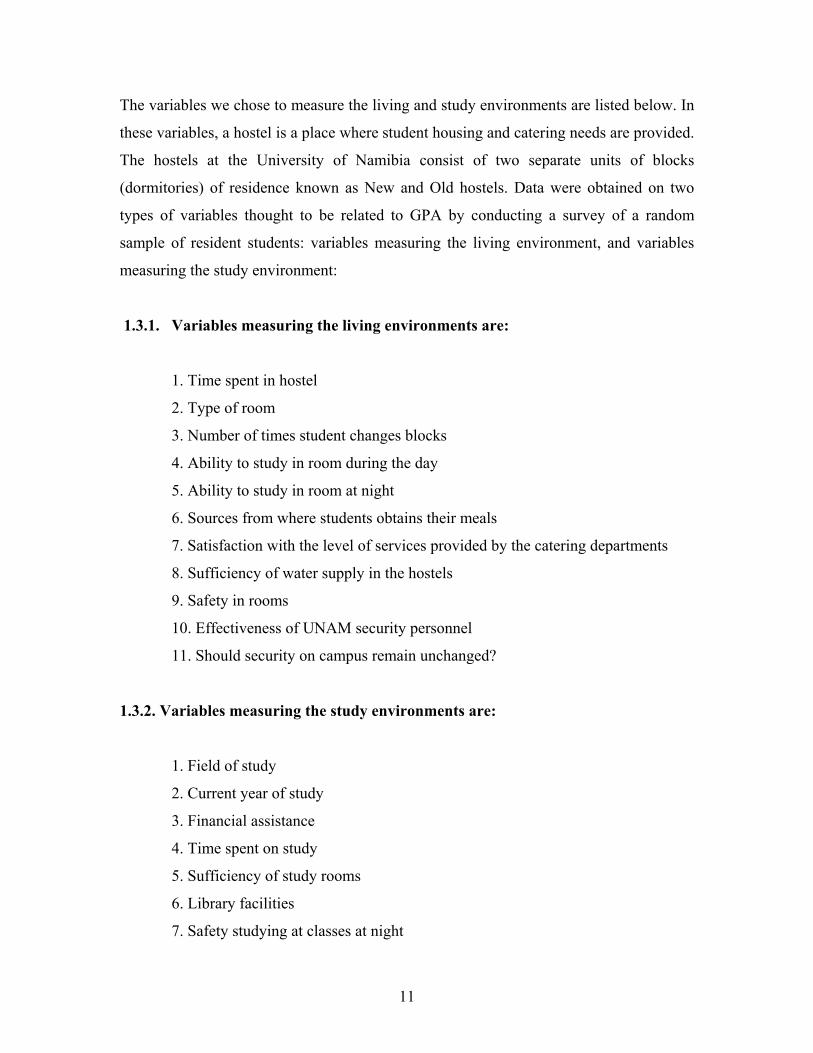
The variables we chose to measure the living and study environments are listed below. In
these variables, a hostel is a place where student housing and catering needs are provided.
The hostels at the University of Namibia consist of two separate units of blocks
(dormitories) of residence known as New and Old hostels. Data were obtained on two
types of variables thought to be related to GPA by conducting a survey of a random
sample of resident students: variables measuring the living environment, and variables
measuring the study environment:
1.3.1. Variables measuring the living environments are:
1. Time spent in hostel
2. Type of room
3. Number of times student changes blocks
4. Ability to study in room during the day
5. Ability to study in room at night
6. Sources from where students obtains their meals
7. Satisfaction with the level of services provided by the catering departments
8. Sufficiency of water supply in the hostels
9. Safety in rooms
10. Effectiveness of UNAM security personnel
11. Should security on campus remain unchanged?
1.3.2. Variables measuring the study environments are:
1. Field of study
2. Current year of study
3. Financial assistance
4. Time spent on study
5. Sufficiency of study rooms
6. Library facilities
7. Safety studying at classes at night
12
8. Availability of study desk in room
9. Availability of study chair in room
10. Availability of study lamp in room
Throughout the course of this study we will refer to the variables measuring the living
environments as living variables and variables measuring the study environments as
study variables. With the help of my advisor and the head of Department of Statistics at
the University of Namibia, we develop and administer the questionnaire that asses
students perceptions on these variables.
1.4. Characteristics of the studied institution
The University of Namibia or as it is commonly called UNAM, was established in 1992,
just two years after the country’s independence. The campus is situated on the outskirts
of the city of Windhoek, about 20 miles from the city center. Before the university was
formed, the campus was mainly used as a higher school known by the name of Academy,
which provided under one management the Technikon and a College (Republic of
Namibia 1991). Today the UNAM student population comprises of a multi-cultural
society, with students coming as far as from such foreign countries as, Zambia,
Zimbabwe, South Africa, Tanzania, Germany, the United States, China, and France. The
chancellor of the University of Namibia is the head of state, president Sam Nuyoma, who
is also one the founding fathers of the institution.
The University of Namibia comprises of the following faculties
• Faculty of Agriculture
• Faculty of Economics and Management Science
• Faculty of Education
• Faculty of Humanity and Social sciences
13
• Faculty of Law
• Faculty of Medical and Health Sciences and
• Faculty of Science
The University is involved in many national and international programs such as student
exchange programs, staff development programs, and staff exchange programs in
collaboration with universities and other institutions outside Namibia. UNAM has three
academic terms: first term that runs February to May, second term that runs June to
September, and third term that runs from the end of September to December.
Nearly half of the students studying at UNAM live on campus, although there are
alternative accommodations provided by the institution outside the campus. For students
living outside the campus, the university provides transport to and from campus.
Apart from gaining education at UNAM, students are also widely involved in other extra
curricular activity such as sport and festivals. Sport is highly regarded on campus as a
means of student interaction and relaxation. The university pleads its support for sports
on campus by sponsoring events like soccer tournaments and athletic meetings.
1.5. Rationale of the study
This study was conducted with the help of the head of the Department of Statistics at the
University of Namibia, Dr. N.O.Ama. Dr. Ama played a major role in reviewing and
amending the questionnaire used in collecting data from students, (see Appendix I) and in
monitoring the data collection process.
This study has provided data on student assessment of the environments where they live
and study, and in addition it has provided information on student assessment of the
availability of library facilities in helping students in their studies, availability of study
14
rooms, the quality of safety on campus and the involvement of government, institution
and parents in providing funds to students. It has further highlighted the relationships
between the living and study variables and student GPA.
We hope that the information collected will be useful to the University management and
the government of Namibia, in defining their priority areas at the University when
preparing and approving the budget of the institution. The information will also help the
University management in determining rules and principles on safety, expansion of
facilities and effective rules in guiding students’ accommodation. Other organizations,
NGO’s (Non-Governmental organizations), Donor Agencies and local investors
interested in helping the University, will find the information obtained useful, as they
would be able to determine areas where they can assist (Dr. N.O. Ama, 2001).
15
2. DATA GENERATION
2.1. Design Methodology
2.1.1. Target population
The survey targets only those students living on campus irrespective of their academic
years of study or background who have been at UNAM for at least a year. Day students
were not part of this study, hence they were not included in any data collection of this
survey. By day student we are referring to those students who are residing off campus
(not living on campus) and only come to UNAM to attend classes.
2.2. How the survey was conducted
The survey was divided into three phases.
Phase 1 was conducted at WPI. The tasks accomplished were the planning of the
study and writing the proposal.
Phase 2 was conducted at the University of Namibia. The task accomplished was
the implementation of the survey.
Phase 3 was conducted at WPI. Tasks accomplished were the analysis of the data
and report writing and compiling.
2.3. How data were collected
The data used in this study were collected from the following sources:
16
2.3.1 Office of the Registrar
The data that were collected from the registrar’s office were student Grade Point
Averages (GPA) from the 2001 – 2002 academic years, which represent the student
performances over the past year.
2.3.2. From the students residing on campus
The data that were collected from the students where the data on variables measuring the
living and study environment of students on campus. These were obtained by filling out a
questionnaire during interviews with the students.
2.4. Structure and nature of the campus residence
The UNAM campus residence consists of two separate units of blocks (dormitories) of
residence normally called New and Old hostels. In the hostels student housing and
catering needs are provided.
2.4.1. Characteristics of the hostels
2.4.1.1. Old hostels
The old hostels are the original student residence erected before the institution
became a university. The old hostels consist of blocks A to C. Each of these
blocks has up to 128 bedding rooms for students.
17
2.4.1.2. New hostels
The new hostels were built primarily with the aim of accommodating the
increasing number of students seeking accommodation each year. They where
built with the purpose of eradicating housing problems on campus, although lack
of accommodation is one of the problems that students still face each year. The
new hostels consist of blocks A to K, with each block consisting of 58 bedding
rooms.
Overall the total population of students residing on campus is 1095.
2.4.2. Hostel management
The management of the hostels is overseen by a top management committee of
accommodation and the housing committee members (HC). The top management
consists of, the head of accommodation, a deputy head, and secretaries.
The HC are students elected annually by the hostel residents to represent and
administer the welfare of their respective blocks. Each block elects its own
housing committee.
2.5. Sample and Sampling procedure
To select our sample, we used a stratified sampling with the 14 strata consisting of the 14
residence blocks. We decided to use stratified sampling, because we felt that the student
experiences might differ from block to block. The strata were as follows:
Stratum 1 is A block (OH)
Stratum 2 is B block (OH)
18
Stratum 3 is C block (OH)
Stratum 4 is A block (NH)
Stratum 5 is B block (NH)
Stratum 6 is C block (NH)
Stratum 7 is D block (NH)
Stratum 8 is E block (NH)
Stratum 9 is F block (NH)
Stratum 10 is G block (NH)
Stratum 11 is H block (NH)
Stratum 12 is I block (NH)
Stratum 13 is J block (NH)
Stratum 14 is K block (NH)
Where OH abbreviates old hostel and NH is new hostel.
The total population of students residing in the hostels in the 2002 academic year was
1095 students, of whom 203 were first year students. Since first year students were not
part of this survey, this brought the total population of students to be surveyed to 892.
Table below represents the distribution of students in each block.
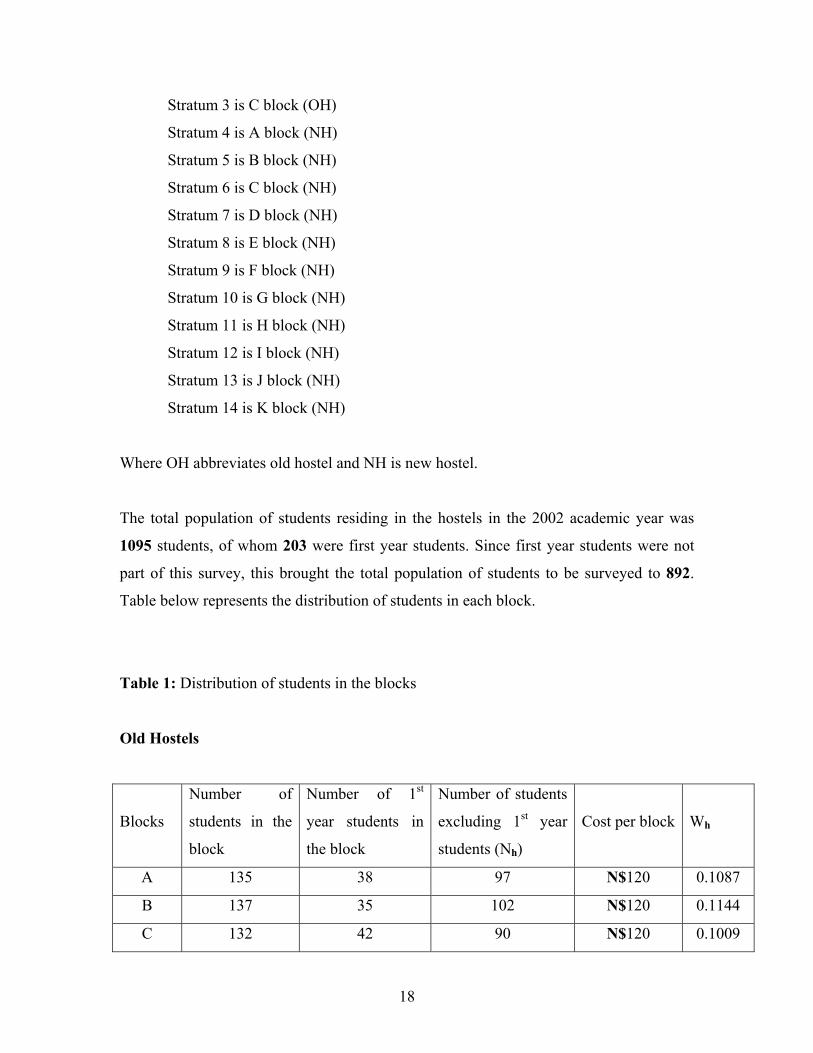
Table 1: Distribution of students in the blocks
Old Hostels
Blocks
Number of
students in the
block
Number of 1st
year students in
the block
Number of students
excluding 1st year
students (Nh)
Cost per block
Wh
A 135 38 97 N$120 0.1087
B 137 35 102 N$120 0.1144
C 132 42 90 N$120 0.1009
19
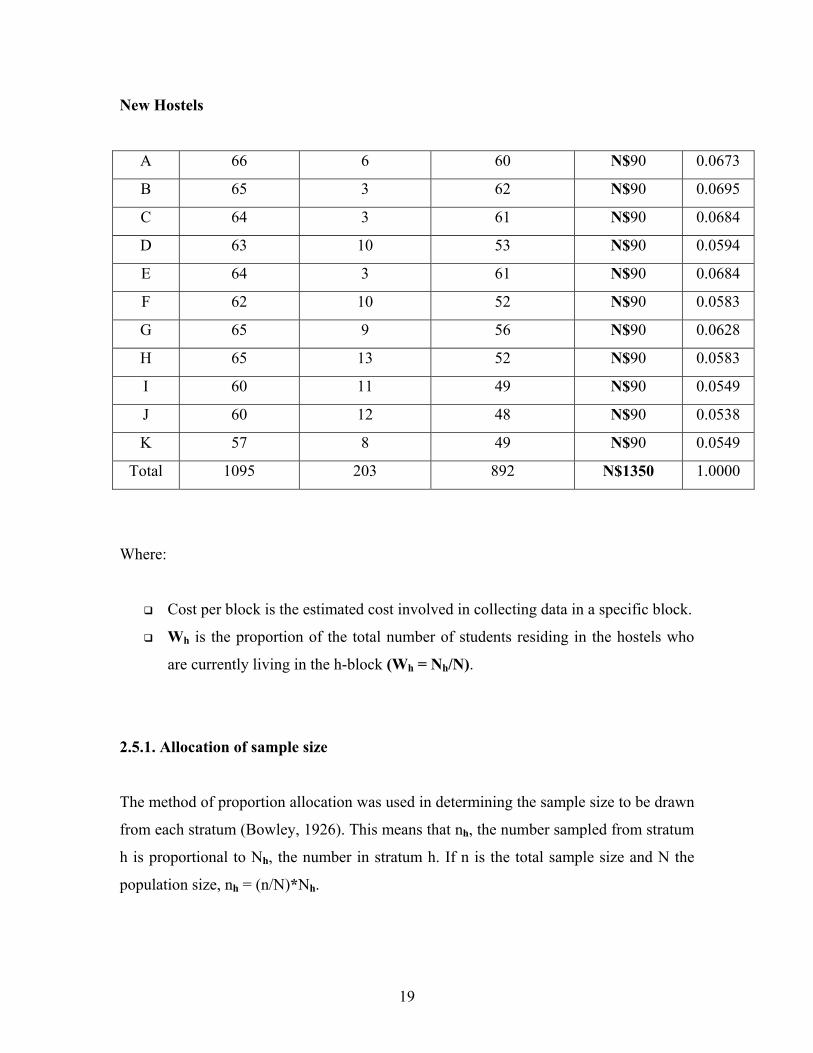
New Hostels
A 66 6 60 N$90 0.0673
B 65 3 62 N$90 0.0695
C 64 3 61 N$90 0.0684
D 63 10 53 N$90 0.0594
E 64 3 61 N$90 0.0684
F 62 10 52 N$90 0.0583
G 65 9 56 N$90 0.0628
H 65 13 52 N$90 0.0583
I 60 11 49 N$90 0.0549
J 60 12 48 N$90 0.0538
K 57 8 49 N$90 0.0549
Total 1095 203 892 N$1350 1.0000
Where:
Cost per block is the estimated cost involved in collecting data in a specific block.
Wh is the proportion of the total number of students residing in the hostels who
are currently living in the h-block (Wh = Nh/N).
2.5.1. Allocation of sample size
The method of proportion allocation was used in determining the sample size to be drawn
from each stratum (Bowley, 1926). This means that nh, the number sampled from stratum
h is proportional to Nh, the number in stratum h. If n is the total sample size and N the
population size, nh = (n/N)*Nh.
20
The cost of sampling must be factored in to the determination of sample size. Suppose
that:
C = Total cost (Fixed total cost)
Co = Overheard cost
Ch = Cost for stratum h.
Then the total sample size for fixed total cost (Total cost), the cost earmarked for the
whole project operation, is given by:
n = [C – Co]/ ∑=
14
1h
WhCh , h=1, 2,……….., 14
2.5.1.1. Calculation of the total sample size
∑=
14
1h
WhCh = 99.72, h = 1, 2, 3, ……., 14
C = N$59240.00
Co = N$13500
Nh = 892
Thus,
n = [C – Co]/ ∑=
14
1h
WhCh
= [59240 - 13500]/ 99.72
= 458.68
Hence, n ≈ 459
21
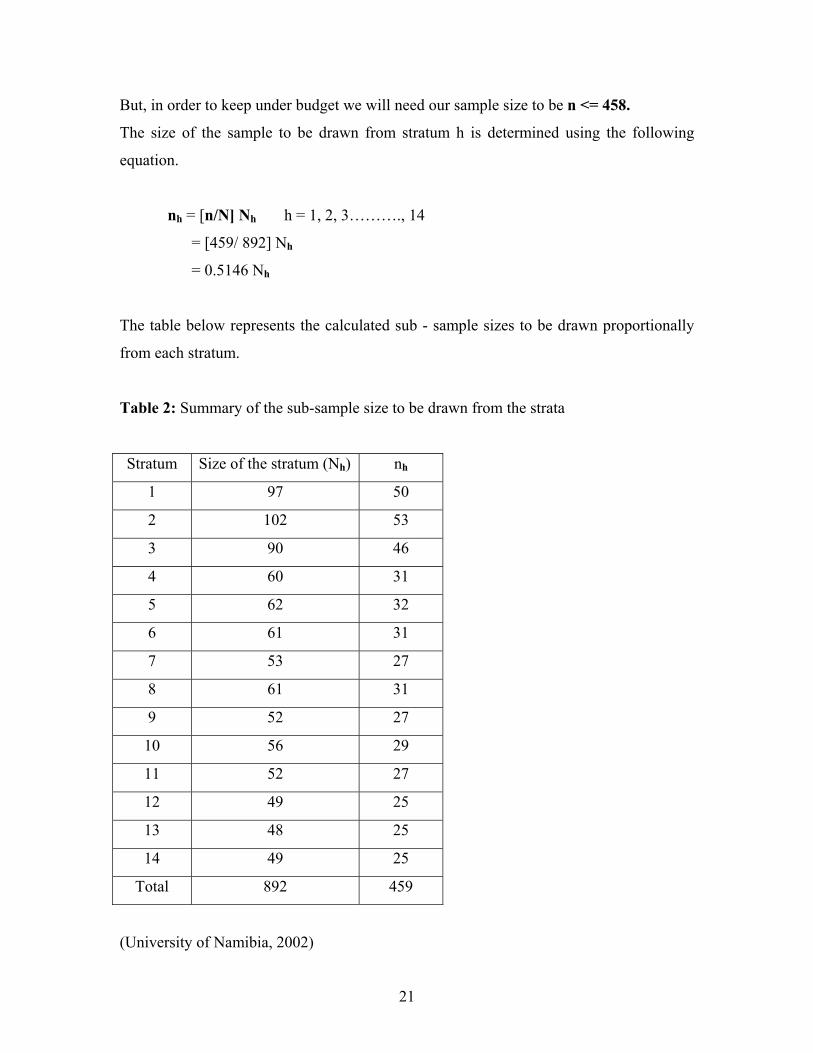
But, in order to keep under budget we will need our sample size to be n <= 458.
The size of the sample to be drawn from stratum h is determined using the following
equation.
nh = [n/N] Nh h = 1, 2, 3………., 14
= [459/ 892] Nh
= 0.5146 Nh
The table below represents the calculated sub - sample sizes to be drawn proportionally
from each stratum.
Table 2: Summary of the sub-sample size to be drawn from the strata
Stratum Size of the stratum (Nh) nh
1 97 50
2 102 53
3 90 46
4 60 31
5 62 32
6 61 31
7 53 27
8 61 31
9 52 27
10 56 29
11 52 27
12 49 25
13 48 25
14 49 25
Total 892 459
(University of Namibia, 2002)
22
Simple random sampling was used to draw the sample from each stratum. That is, in each
stratum, the sample was selected so that all possible units had equal probabilities of being
included in the sample. In this study we used a random number table to select all samples
(Rao et al, 1974).
2.6. Limitation of the study
The study is limited to those students receiving their tertiary education at the University
of Namibia main campus. First year students were not included in the study since it was
decided that the student should have spent at least a year in the institution so as to be able
to give a good appraisal of the prevailing conditions.
A questionnaire was designed to collect data from students. See Appendix I for the
attached sample questionnaire.
2.7. Quality control
A sample survey having a good sample design and a good data form can still yield poor
data if the execution of the survey is poor. An important part of a survey design is to
ensure that the execution of the survey is in accordance with the design. In particular,
there should be some formal quality control procedures instituted on both the data
collection method and the data processing components of the survey.
In ensuring the quality of the data to be collected, a pilot study was conducted. A pilot
study is generally a full-scale dress rehearsal of the survey. It includes testing not only of
the data collection procedures but also the questionnaire and all other components of the
survey, from the sampling to the data processing and analysis. Sometimes a pilot study
(survey) may test two or more forms of data collection procedures, and the final
23
procedures used for the survey may depend on the evaluation of the data collected from
the pilot study. In addition, the pilot study may provide estimates necessary for
determining the size of the sample needed in the actual survey so that final estimates may
be made with stated precision.
24
3. MATERIALS AND METHODS
3.1. Materials
Two Statistical packages that were used in analyzing the data are:
SPSS 10.0
SAS 8.2
3.2. Methods
3.2.1. Distribution of questionnaire
Two persons were used to assist in the data collection process. In order to train them on
how to collect quality data, two sessions (one a day for two days) were conducted. These
personnel were closely monitored during the data collection process and their completed
questionnaires were cross-checked in order to ensure that quality data were collected.
Incomplete questionnaires were returned to the respective interviewers for re-interview.
An interview was conducted in order to get better results. The interview took place late in
the evening, because we believed that during that time students would be in their rooms.
Individuals who were included in the sample were thoroughly briefed on the importance
of the survey.
Provisions for follow-up visits were made for those students not in their rooms at the time
the interview was scheduled. Follow-ups were continued until each interview was
completed. The data collection process took us five weeks to complete successfully.
25
3.2.2. Data entry and analysis
We divide the sample size randomly into two parts, the first part is called the test sample
size and consist of n = 25. The test sample was used to validate the questionnaire (pilot
study). While the second part of the sample is called the training sample and consist of
n = 434, the sample size used in the main study.
Data entry was done in SPSS 10.0, and we have also used the SPSS 10.0 in the first part
of data analysis, to summarize the data in tables with respect to the sex of the respondents
(cross tabulation), to compare how various groups of students responded to each
question, and to calculate cumulative percentages, percentages including non-respondents
and so on. In the second part of the data analysis we use the SAS 8.2 program to regress
the successful learning measures (GPA) on the various variables that we found to affect
the quality of living on campus.
3.2.3. Methods used in analyzing the data
The methods used in analyzing the data were:
3.2.1. Cross Tabulations
Cross Tabulations are frequency tables normally associated with surveys, primarily
used for summarizing the outcome of the survey as perceived by the respondents. A
cross tab may indicate existence of a relationship between two variables at the
nominal/ordinal levels of measurement
26
3.2.2. Fisher’s Exact Test
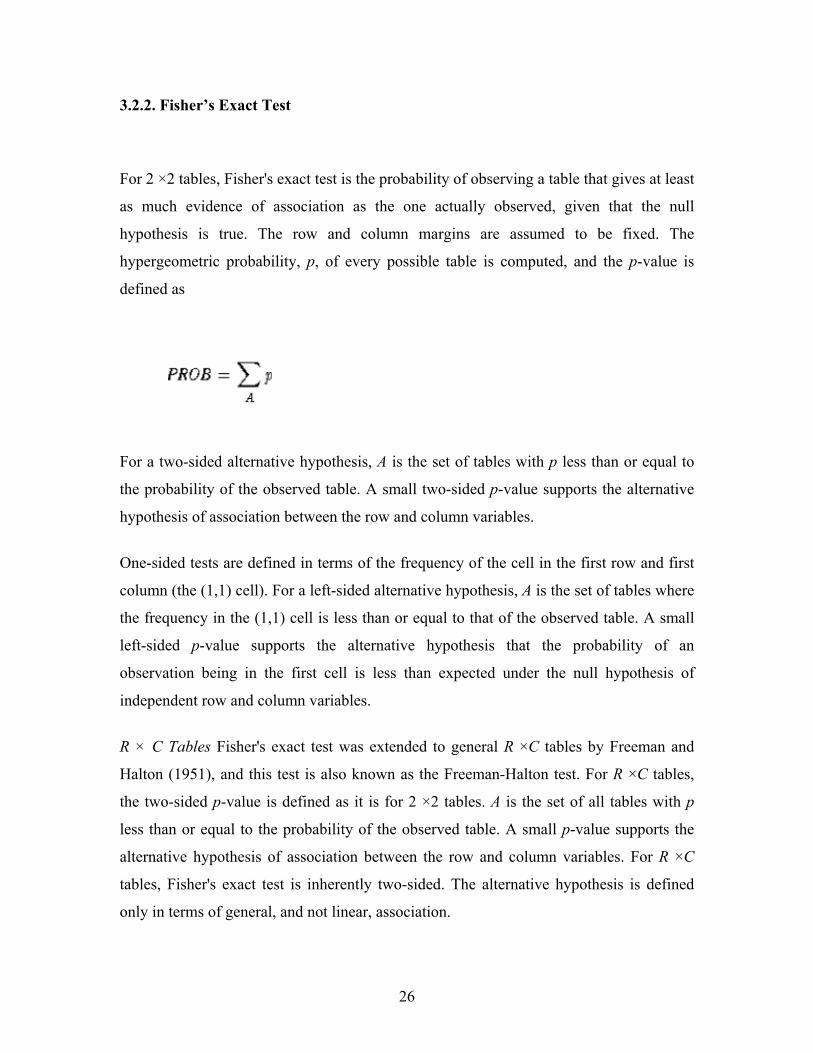
For 2 ×2 tables, Fisher's exact test is the probability of observing a table that gives at least
as much evidence of association as the one actually observed, given that the null
hypothesis is true. The row and column margins are assumed to be fixed. The
hypergeometric probability, p, of every possible table is computed, and the p-value is
defined as
For a two-sided alternative hypothesis, A is the set of tables with p less than or equal to
the probability of the observed table. A small two-sided p-value supports the alternative
hypothesis of association between the row and column variables.
One-sided tests are defined in terms of the frequency of the cell in the first row and first
column (the (1,1) cell). For a left-sided alternative hypothesis, A is the set of tables where
the frequency in the (1,1) cell is less than or equal to that of the observed table. A small
left-sided p-value supports the alternative hypothesis that the probability of an
observation being in the first cell is less than expected under the null hypothesis of
independent row and column variables.
R × C Tables Fisher's exact test was extended to general R ×C tables by Freeman and
Halton (1951), and this test is also known as the Freeman-Halton test. For R ×C tables,
the two-sided p-value is defined as it is for 2 ×2 tables. A is the set of all tables with p
less than or equal to the probability of the observed table. A small p-value supports the
alternative hypothesis of association between the row and column variables. For R ×C
tables, Fisher's exact test is inherently two-sided. The alternative hypothesis is defined
only in terms of general, and not linear, association.
27
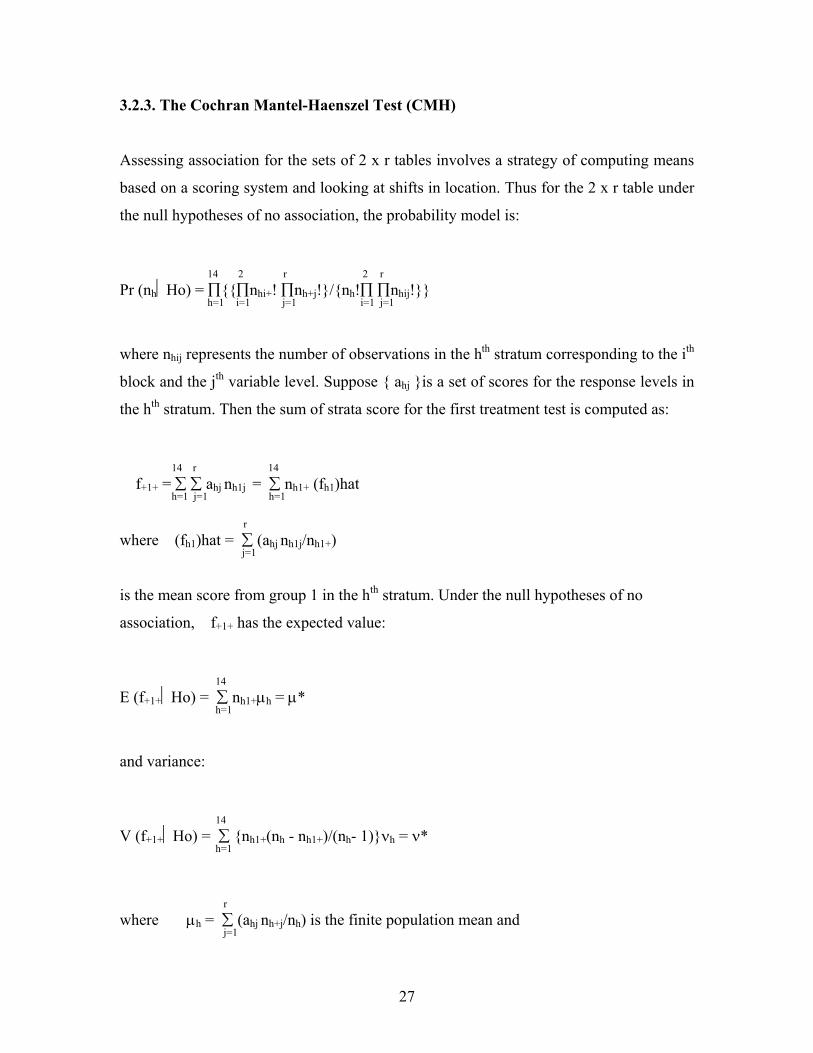
3.2.3. The Cochran Mantel-Haenszel Test (CMH)
Assessing association for the sets of 2 x r tables involves a strategy of computing means
based on a scoring system and looking at shifts in location. Thus for the 2 x r table under
the null hypotheses of no association, the probability model is:
14 2 r 2 r Pr (nhHo) = ∏{{∏nhi+! ∏nh+j!}/{nh!∏ ∏nhij!}} h=1 i=1 j=1 i=1 j=1
where nhij represents the number of observations in the hth stratum corresponding to the ith
block and the jth variable level. Suppose { ahj }is a set of scores for the response levels in
the hth stratum. Then the sum of strata score for the first treatment test is computed as:
14 r 14
f+1+ = ∑ ∑ ahj nh1j = ∑ nh1+ (fh1)hat h=1 j=1 h=1
r where (fh1)hat = ∑ (ahj nh1j/nh1+) j=1
is the mean score from group 1 in the hth stratum. Under the null hypotheses of no
association, f+1+ has the expected value:
14 E (f+1+Ho) = ∑ nh1+µh = µ* h=1
and variance:
14 V (f+1+Ho) = ∑ {nh1+(nh - nh1+)/(nh- 1)}νh = ν* h=1
r where µh = ∑ (ahj nh+j/nh) is the finite population mean and j=1
28
r νh = ∑ (ahj − µh)2(nh+j/nh) is the variance of scores for the hth stratum j=1
14 r If the cross –strata sample size n+i+ = ∑ ∑nhij are sufficiently large, then f+1+ has h=1 j=1
approximately a normal distribution. The extended Mantel-Haenszel correlation statistics
(QCSMH) for the association of two variables that were ordinal in nature for a combined
set of strata, based on assigning scores {a} and {c} to the columns and rows of the table
is:
14 14 QCSMH = {∑nh[(fh)hat − E[(fh)hat | H0]]}2/ {∑n2
h var[(fh)|H0]}
h=1 h=1
14 14
= {∑nh (νhcνha)1/2 rca,h}2/{∑[n2hνhcνha/(nh − 1)]}
h=1 h=1
QCSMH is approximately chi-square distribution with one degrees of freedom when the 14
combined strata sample size are sufficiently large that is ∑nh ≥ 40 h=1
3.2.4. Model selection and fitting
Model selection and fitting (or model building) is a process that we will use to develop
the regression model that relates the living and study variables to student GPA.
3.2.5. Evaluation of model fits
Evaluation of the fitted model is the final step in the model building process, which is
used to validate the selected regression model after remedial measures have been taken
and diagnostics analyzed to make sure that the remedial measures were successful.
29
4. ANALYSIS
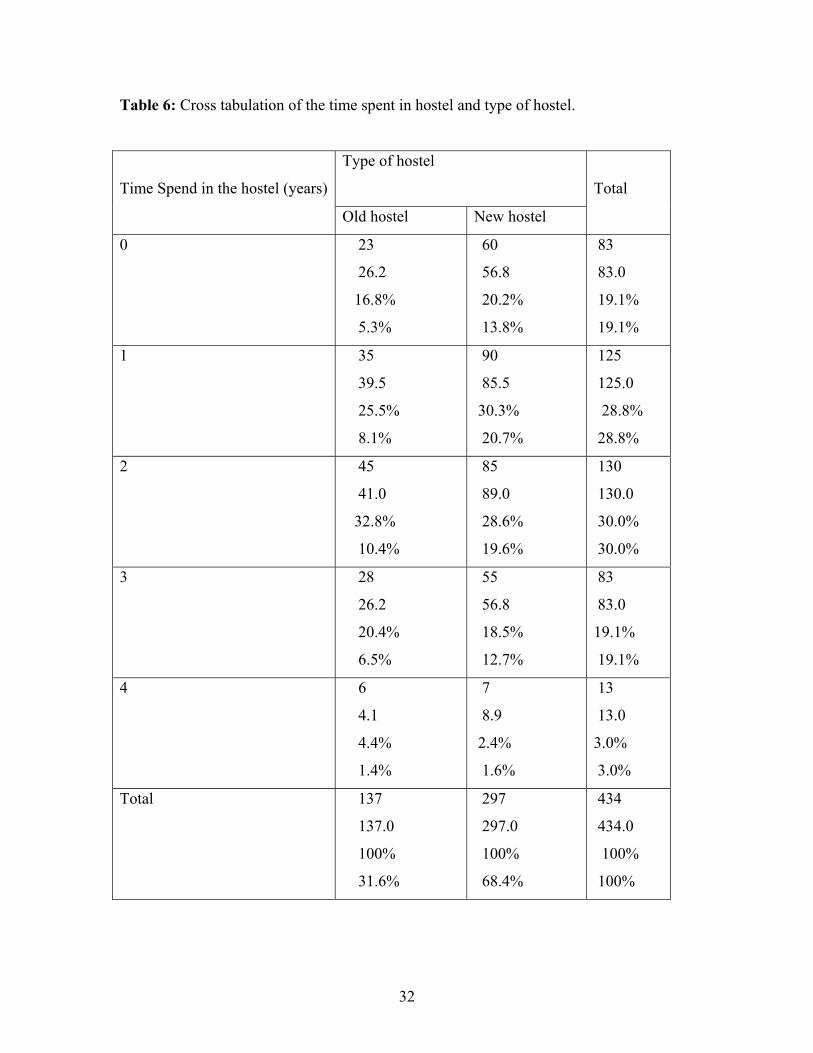
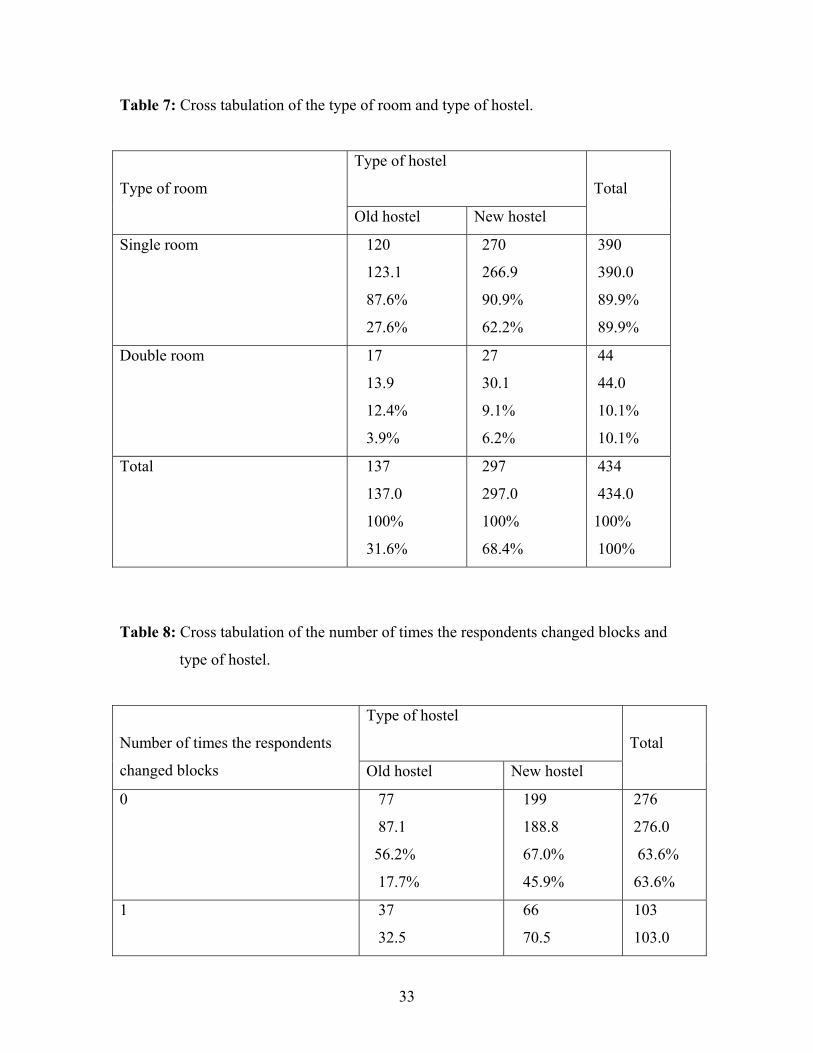
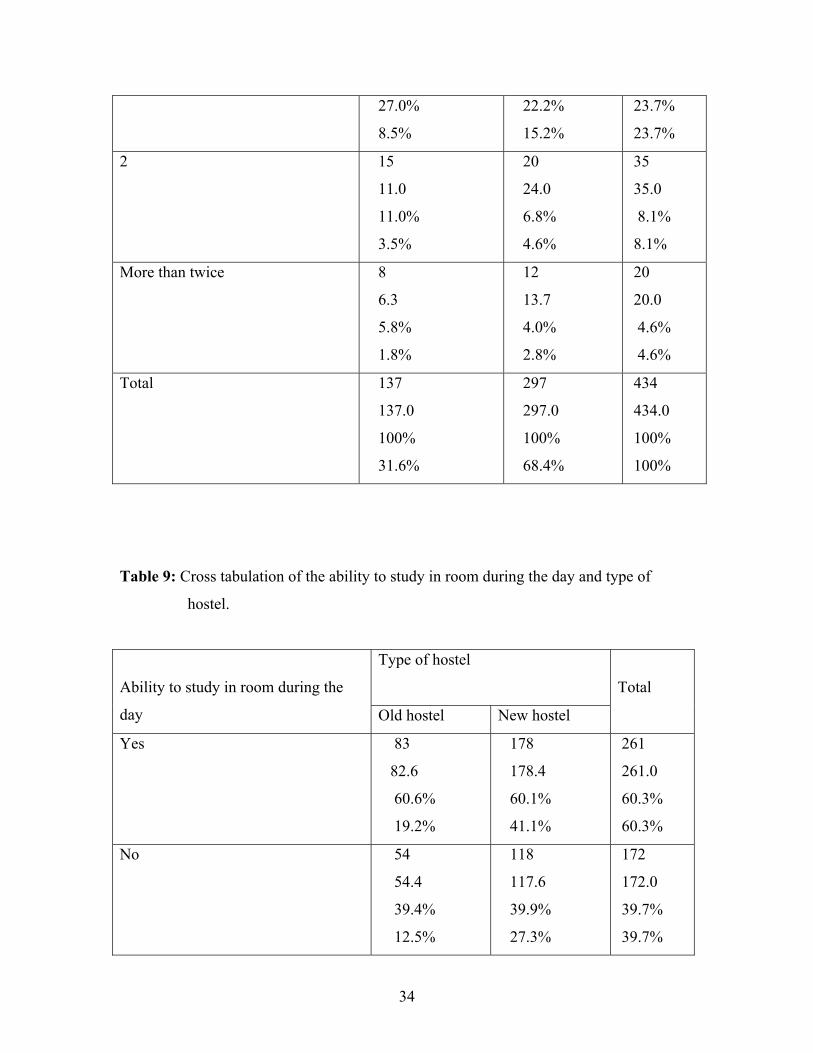
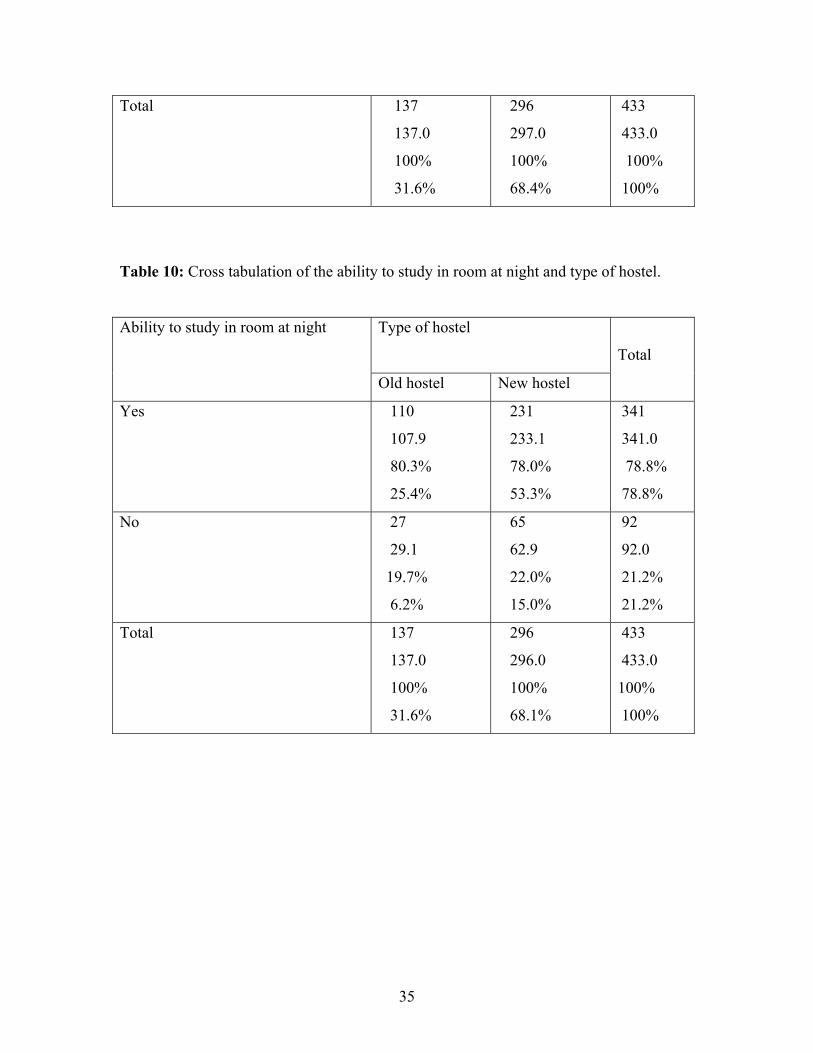
4.1. Respondents view as summarized according to the type of hostels
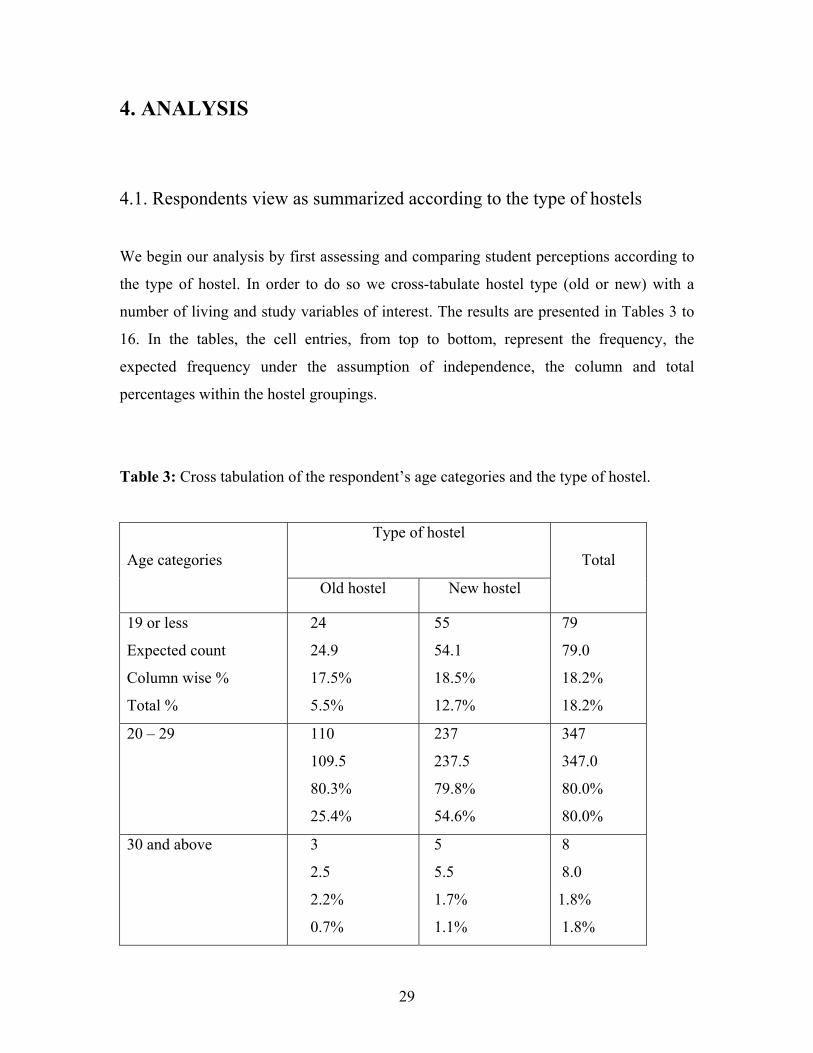
We begin our analysis by first assessing and comparing student perceptions according to
the type of hostel. In order to do so we cross-tabulate hostel type (old or new) with a
number of living and study variables of interest. The results are presented in Tables 3 to
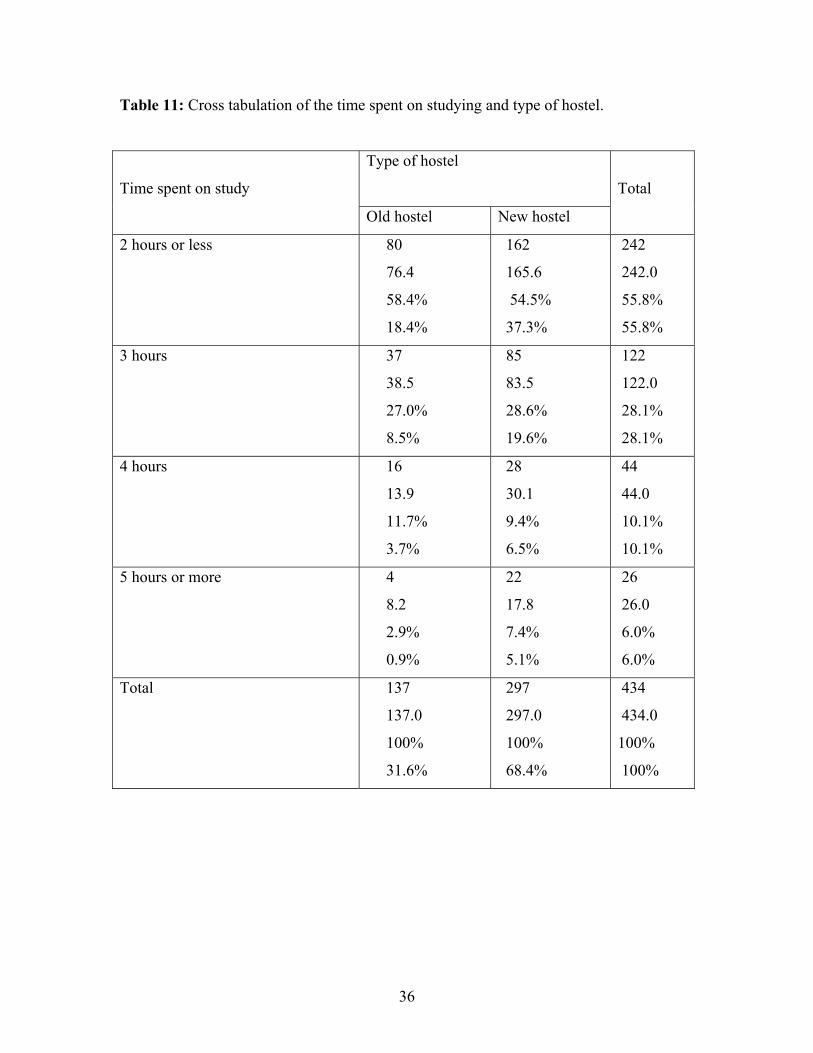
16. In the tables, the cell entries, from top to bottom, represent the frequency, the
expected frequency under the assumption of independence, the column and total
percentages within the hostel groupings.
Table 3: Cross tabulation of the respondent’s age categories and the type of hostel.
Type of hostel
Age categories
Old hostel New hostel
Total
19 or less
Expected count
Column wise %
Total %
24
24.9
17.5%
5.5%
55
54.1
18.5%
12.7%
79
79.0
18.2%
18.2%
20 – 29 110
109.5
80.3%
25.4%
237
237.5
79.8%
54.6%
347
347.0
80.0%
80.0%
30 and above 3
2.5
2.2%
0.7%
5
5.5
1.7%
1.1%
8
8.0
1.8%
1.8%
30
Total 137
137.0
100%
31.6%
297
297.0
100%
68.4%
434
434.0
100%
100%
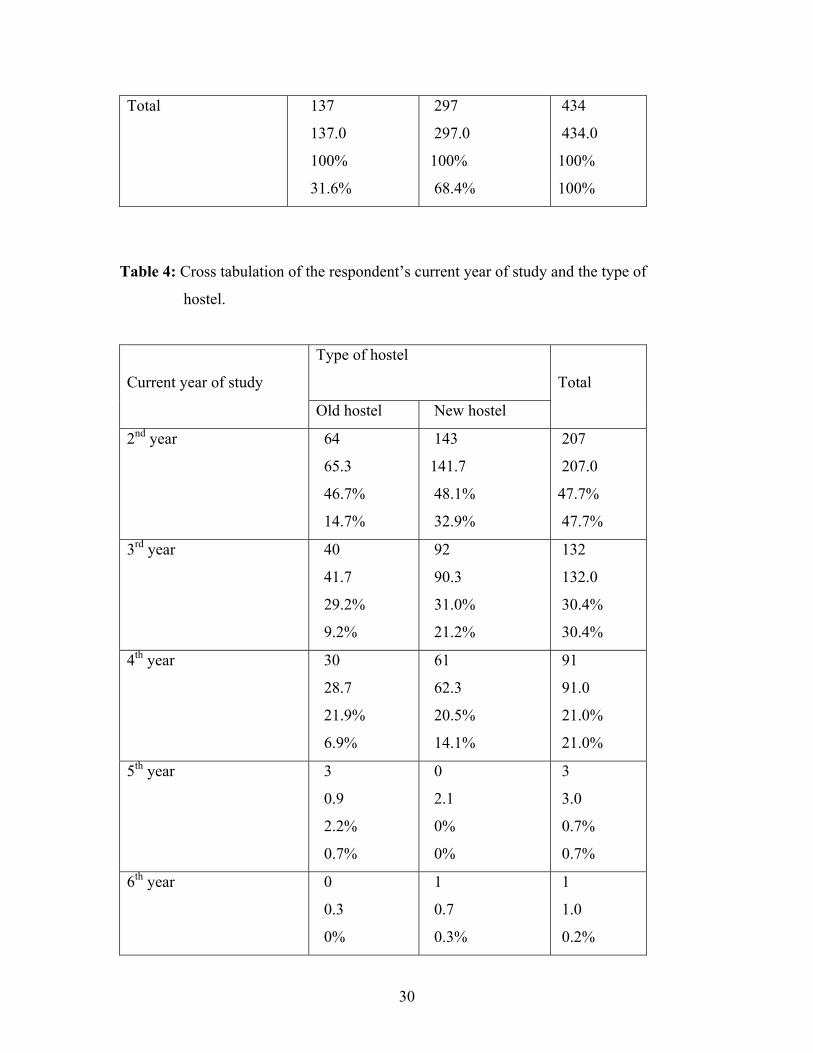
Table 4: Cross tabulation of the respondent’s current year of study and the type of
hostel.
Type of hostel
Current year of study
Old hostel New hostel
Total
2nd year 64
65.3
46.7%
14.7%
143
141.7
48.1%
32.9%
207
207.0
47.7%
47.7%
3rd year
40
41.7
29.2%
9.2%
92
90.3
31.0%
21.2%
132
132.0
30.4%
30.4%
4th year 30
28.7
21.9%
6.9%
61
62.3
20.5%
14.1%
91
91.0
21.0%
21.0%
5th year 3
0.9
2.2%
0.7%
0
2.1
0%
0%
3
3.0
0.7%
0.7%
6th year 0
0.3
0%
1
0.7
0.3%
1
1.0
0.2%
31
0% 0.2% 0.2%
Total 137
137.0
100%
31.6%
297
297.0
100%
68.4%
434
434.0
100%
100%
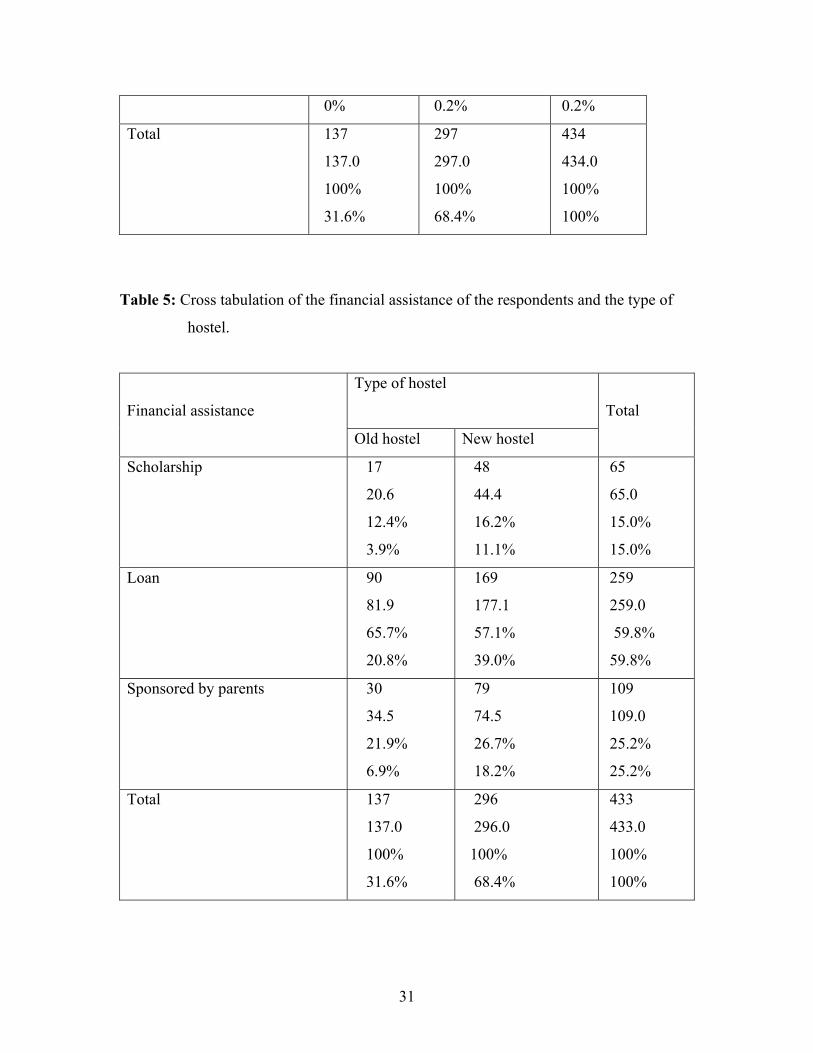
Table 5: Cross tabulation of the financial assistance of the respondents and the type of
hostel.
Type of hostel
Financial assistance
Old hostel New hostel
Total
Scholarship
17
20.6
12.4%
3.9%
48
44.4
16.2%
11.1%
65
65.0
15.0%
15.0%
Loan 90
81.9
65.7%
20.8%
169
177.1
57.1%
39.0%
259
259.0
59.8%
59.8%
Sponsored by parents 30
34.5
21.9%
6.9%
79
74.5
26.7%
18.2%
109
109.0
25.2%
25.2%
Total 137
137.0
100%
31.6%
296
296.0
100%
68.4%
433
433.0
100%
100%
32
Table 6: Cross tabulation of the time spent in hostel and type of hostel.
Type of hostel
Time Spend in the hostel (years)
Old hostel New hostel
Total
0 23
26.2
16.8%
5.3%
60
56.8
20.2%
13.8%
83
83.0
19.1%
19.1%
1 35
39.5
25.5%
8.1%
90
85.5
30.3%
20.7%
125
125.0
28.8%
28.8%
2
45
41.0
32.8%
10.4%
85
89.0
28.6%
19.6%
130
130.0
30.0%
30.0%
3 28
26.2
20.4%
6.5%
55
56.8
18.5%
12.7%
83
83.0
19.1%
19.1%
4 6
4.1
4.4%
1.4%
7
8.9
2.4%
1.6%
13
13.0
3.0%
3.0%
Total 137
137.0
100%
31.6%
297
297.0
100%
68.4%
434
434.0
100%
100%
33
Table 7: Cross tabulation of the type of room and type of hostel.
Type of hostel
Type of room
Old hostel New hostel
Total
Single room
120
123.1
87.6%
27.6%
270
266.9
90.9%
62.2%
390
390.0
89.9%
89.9%
Double room 17
13.9
12.4%
3.9%
27
30.1
9.1%
6.2%
44
44.0
10.1%
10.1%
Total 137
137.0
100%
31.6%
297
297.0
100%
68.4%
434
434.0
100%
100%
Table 8: Cross tabulation of the number of times the respondents changed blocks and
type of hostel.
Type of hostel
Number of times the respondents
changed blocks Old hostel New hostel
Total
0 77
87.1
56.2%
17.7%
199
188.8
67.0%
45.9%
276
276.0
63.6%
63.6%
1 37
32.5
66
70.5
103
103.0
34
27.0%
8.5%
22.2%
15.2%
23.7%
23.7%
2
15
11.0
11.0%
3.5%
20
24.0
6.8%
4.6%
35
35.0
8.1%
8.1%
More than twice 8
6.3
5.8%
1.8%
12
13.7
4.0%
2.8%
20
20.0
4.6%
4.6%
Total 137
137.0
100%
31.6%
297
297.0
100%
68.4%
434
434.0
100%
100%
Table 9: Cross tabulation of the ability to study in room during the day and type of
hostel.
Type of hostel
Ability to study in room during the
day Old hostel New hostel
Total
Yes 83
82.6
60.6%
19.2%
178
178.4
60.1%
41.1%
261
261.0
60.3%
60.3%
No 54
54.4
39.4%
12.5%
118
117.6
39.9%
27.3%
172
172.0
39.7%
39.7%
35
Total 137
137.0
100%
31.6%
296
297.0
100%
68.4%
433
433.0
100%
100%
Table 10: Cross tabulation of the ability to study in room at night and type of hostel.
Type of hostel
Ability to study in room at night
Old hostel New hostel
Total
Yes 110
107.9
80.3%
25.4%
231
233.1
78.0%
53.3%
341
341.0
78.8%
78.8%
No
27
29.1
19.7%
6.2%
65
62.9
22.0%
15.0%
92
92.0
21.2%
21.2%
Total 137
137.0
100%
31.6%
296
296.0
100%
68.1%
433
433.0
100%
100%
36
Table 11: Cross tabulation of the time spent on studying and type of hostel.
Type of hostel
Time spent on study
Old hostel New hostel
Total
2 hours or less 80
76.4
58.4%
18.4%
162
165.6
54.5%
37.3%
242
242.0
55.8%
55.8%
3 hours 37
38.5
27.0%
8.5%
85
83.5
28.6%
19.6%
122
122.0
28.1%
28.1%
4 hours 16
13.9
11.7%
3.7%
28
30.1
9.4%
6.5%
44
44.0
10.1%
10.1%
5 hours or more 4
8.2
2.9%
0.9%
22
17.8
7.4%
5.1%
26
26.0
6.0%
6.0%
Total 137
137.0
100%
31.6%
297
297.0
100%
68.4%
434
434.0
100%
100%
37
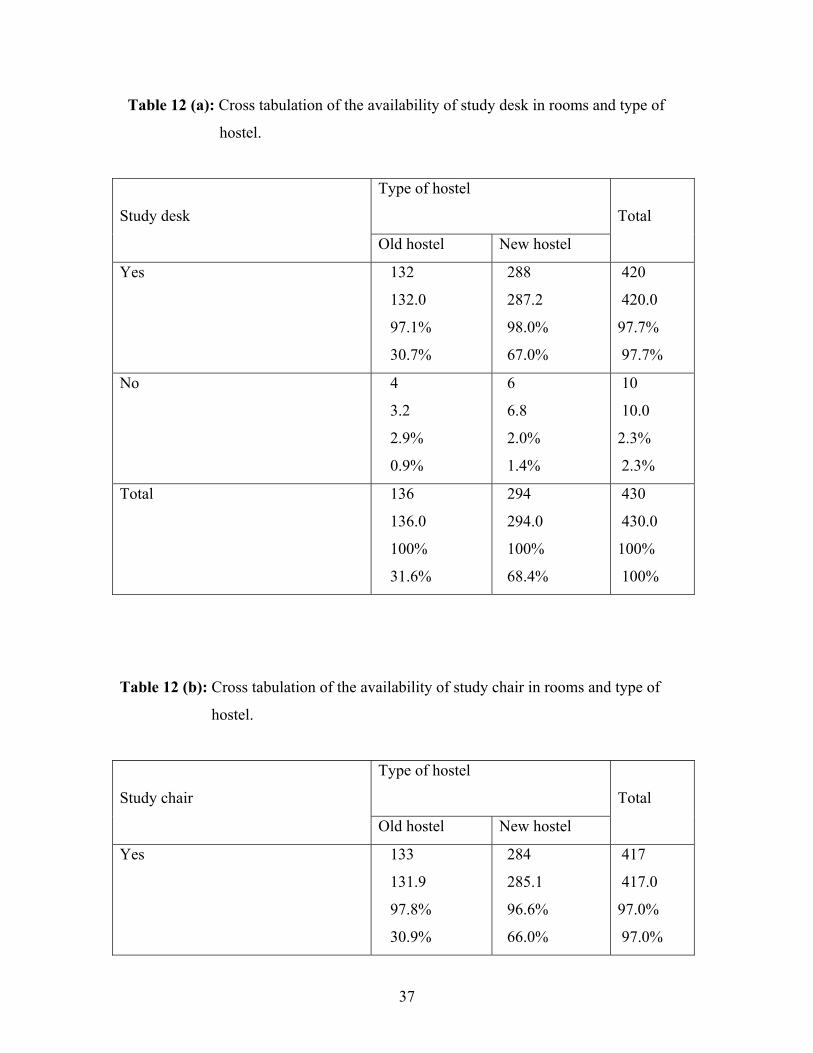
Table 12 (a): Cross tabulation of the availability of study desk in rooms and type of
hostel.
Type of hostel
Study desk
Old hostel New hostel
Total
Yes 132
132.0
97.1%
30.7%
288
287.2
98.0%
67.0%
420
420.0
97.7%
97.7%
No 4
3.2
2.9%
0.9%
6
6.8
2.0%
1.4%
10
10.0
2.3%
2.3%
Total 136
136.0
100%
31.6%
294
294.0
100%
68.4%
430
430.0
100%
100%
Table 12 (b): Cross tabulation of the availability of study chair in rooms and type of
hostel.
Type of hostel
Study chair
Old hostel New hostel
Total
Yes 133
131.9
97.8%
30.9%
284
285.1
96.6%
66.0%
417
417.0
97.0%
97.0%
38
No 3
4.1
2.2%
0.7%
10
8.9
3.4%
2.3%
13
13.0
3.0%
3.0%
Total 136
136.0
100%
31.6%
294
294.0
100%
68.4%
430
430.0
100%
100%
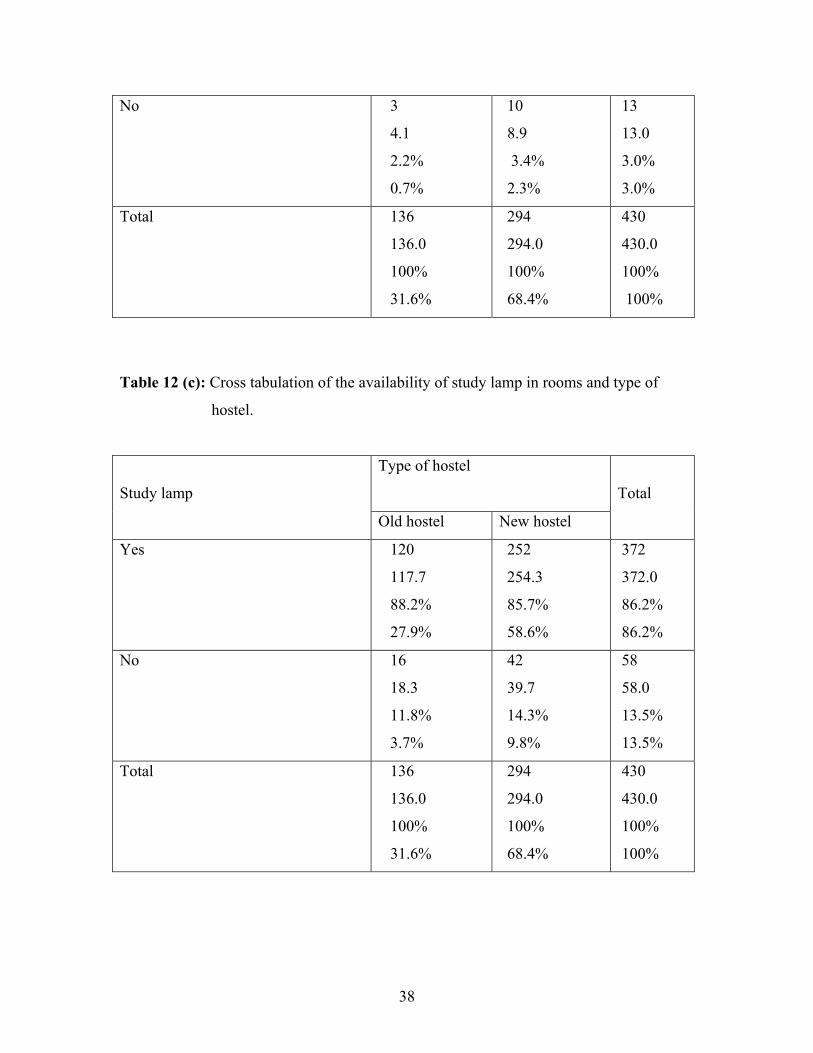
Table 12 (c): Cross tabulation of the availability of study lamp in rooms and type of
hostel.
Type of hostel
Study lamp
Old hostel New hostel
Total
Yes 120
117.7
88.2%
27.9%
252
254.3
85.7%
58.6%
372
372.0
86.2%
86.2%
No 16
18.3
11.8%
3.7%
42
39.7
14.3%
9.8%
58
58.0
13.5%
13.5%
Total 136
136.0
100%
31.6%
294
294.0
100%
68.4%
430
430.0
100%
100%
39
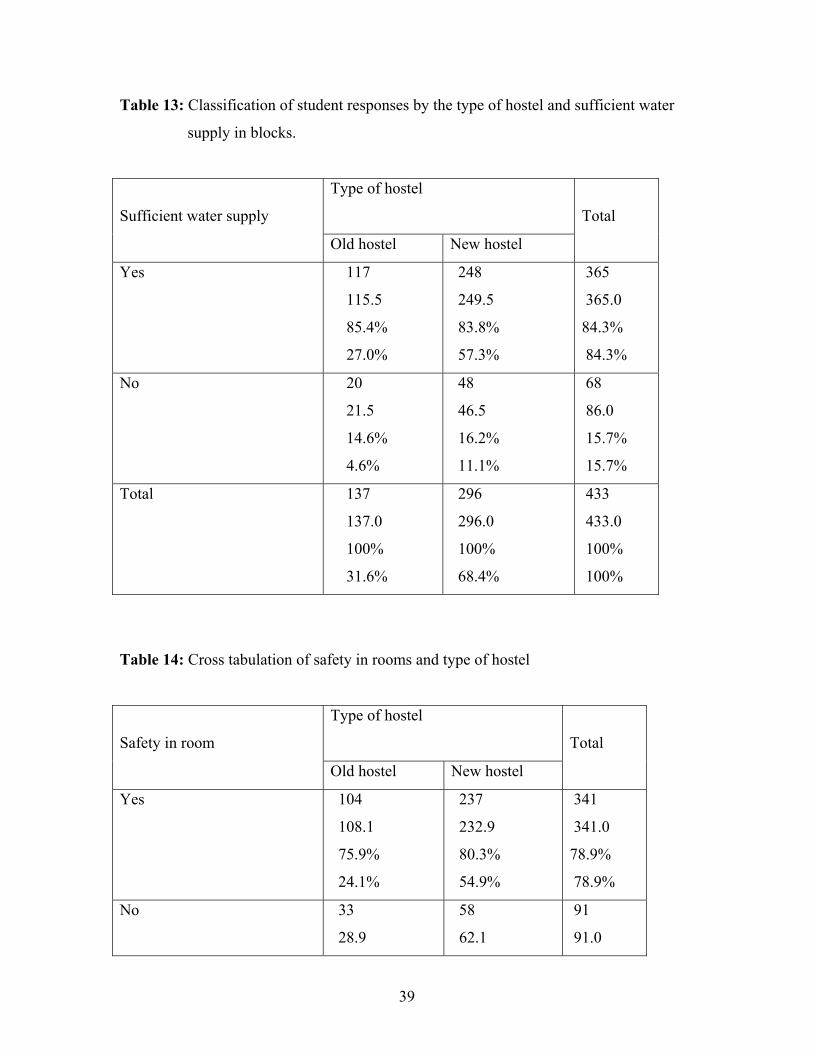
Table 13: Classification of student responses by the type of hostel and sufficient water
supply in blocks.
Type of hostel
Sufficient water supply
Old hostel New hostel
Total
Yes 117
115.5
85.4%
27.0%
248
249.5
83.8%
57.3%
365
365.0
84.3%
84.3%
No 20
21.5
14.6%
4.6%
48
46.5
16.2%
11.1%
68
86.0
15.7%
15.7%
Total 137
137.0
100%
31.6%
296
296.0
100%
68.4%
433
433.0
100%
100%
Table 14: Cross tabulation of safety in rooms and type of hostel
Type of hostel
Safety in room
Old hostel New hostel
Total
Yes 104
108.1
75.9%
24.1%
237
232.9
80.3%
54.9%
341
341.0
78.9%
78.9%
No 33
28.9
58
62.1
91
91.0
40
24.1%
7.6%
19.7%
13.4%
21.1%
21.1%
Total 137
137.0
100%
31.7%
295
295.0
100%
68.3%
433
433.0
100%
100%
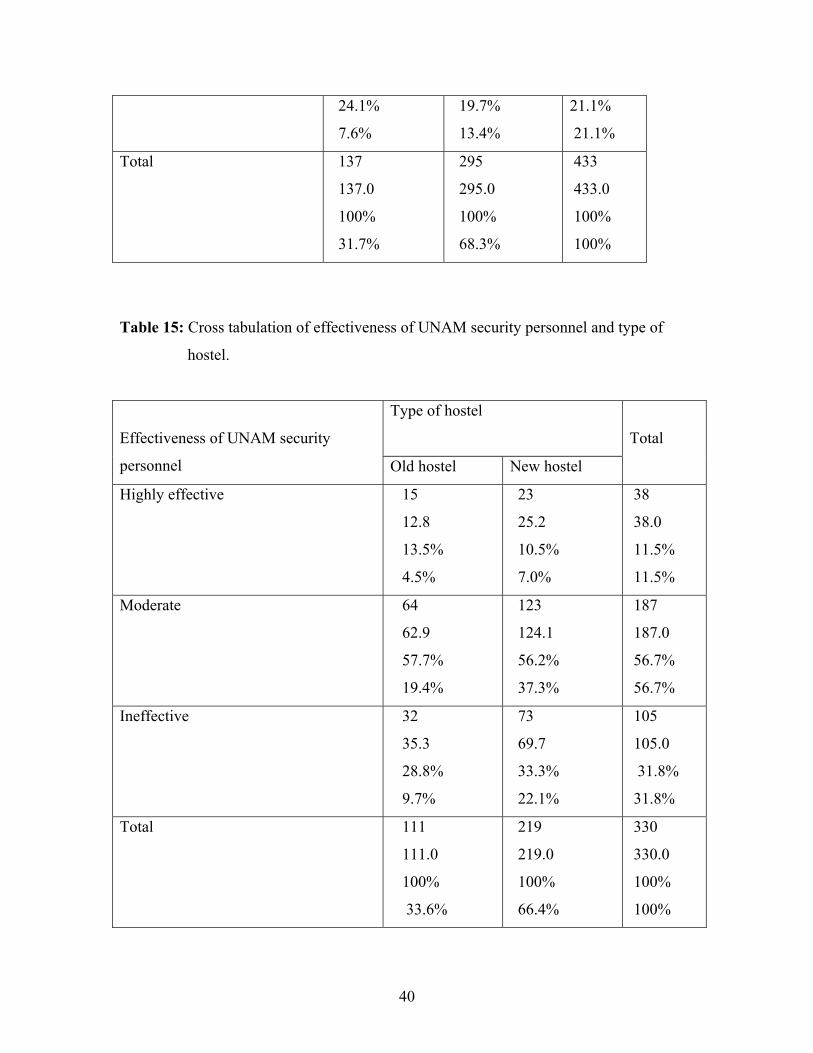
Table 15: Cross tabulation of effectiveness of UNAM security personnel and type of
hostel.
Type of hostel
Effectiveness of UNAM security
personnel Old hostel New hostel
Total
Highly effective 15
12.8
13.5%
4.5%
23
25.2
10.5%
7.0%
38
38.0
11.5%
11.5%
Moderate 64
62.9
57.7%
19.4%
123
124.1
56.2%
37.3%
187
187.0
56.7%
56.7%
Ineffective 32
35.3
28.8%
9.7%
73
69.7
33.3%
22.1%
105
105.0
31.8%
31.8%
Total 111
111.0
100%
33.6%
219
219.0
100%
66.4%
330
330.0
100%
100%
41
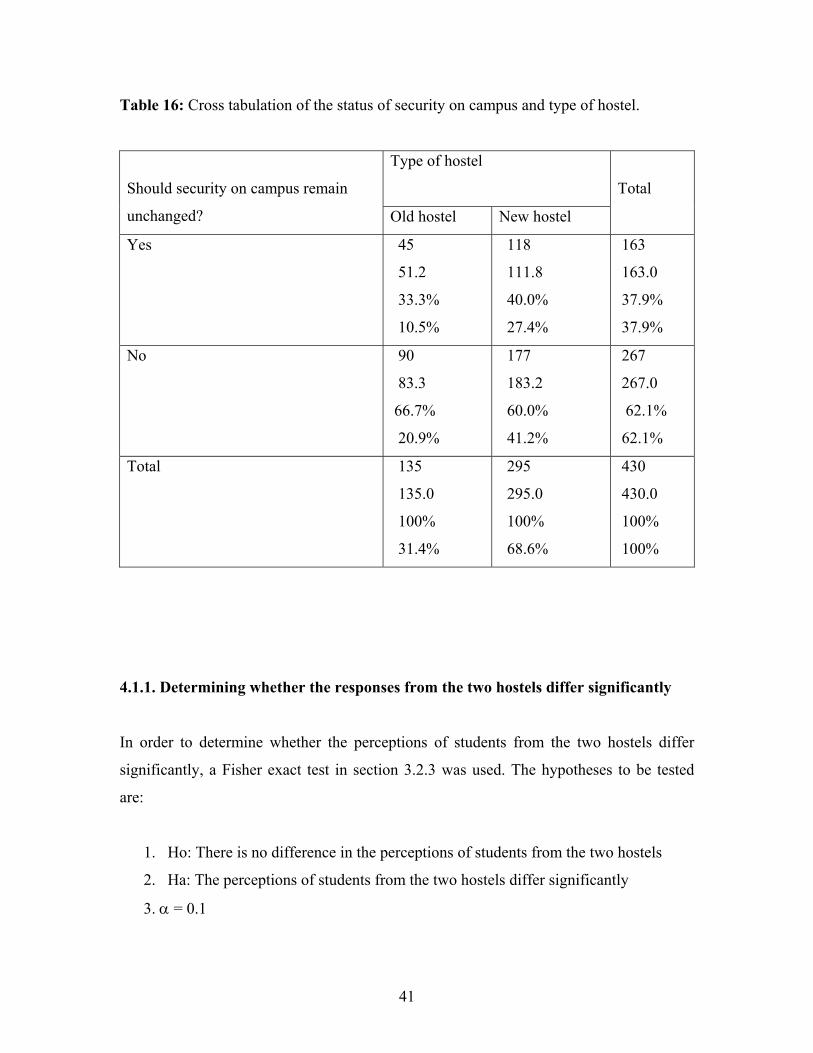
Table 16: Cross tabulation of the status of security on campus and type of hostel.
Type of hostel
Should security on campus remain
unchanged? Old hostel New hostel
Total
Yes 45
51.2
33.3%
10.5%
118
111.8
40.0%
27.4%
163
163.0
37.9%
37.9%
No
90
83.3
66.7%
20.9%
177
183.2
60.0%
41.2%
267
267.0
62.1%
62.1%
Total 135
135.0
100%
31.4%
295
295.0
100%
68.6%
430
430.0
100%
100%
4.1.1. Determining whether the responses from the two hostels differ significantly
In order to determine whether the perceptions of students from the two hostels differ
significantly, a Fisher exact test in section 3.2.3 was used. The hypotheses to be tested
are:
1. Ho: There is no difference in the perceptions of students from the two hostels
2. Ha: The perceptions of students from the two hostels differ significantly
3. α = 0.1
42
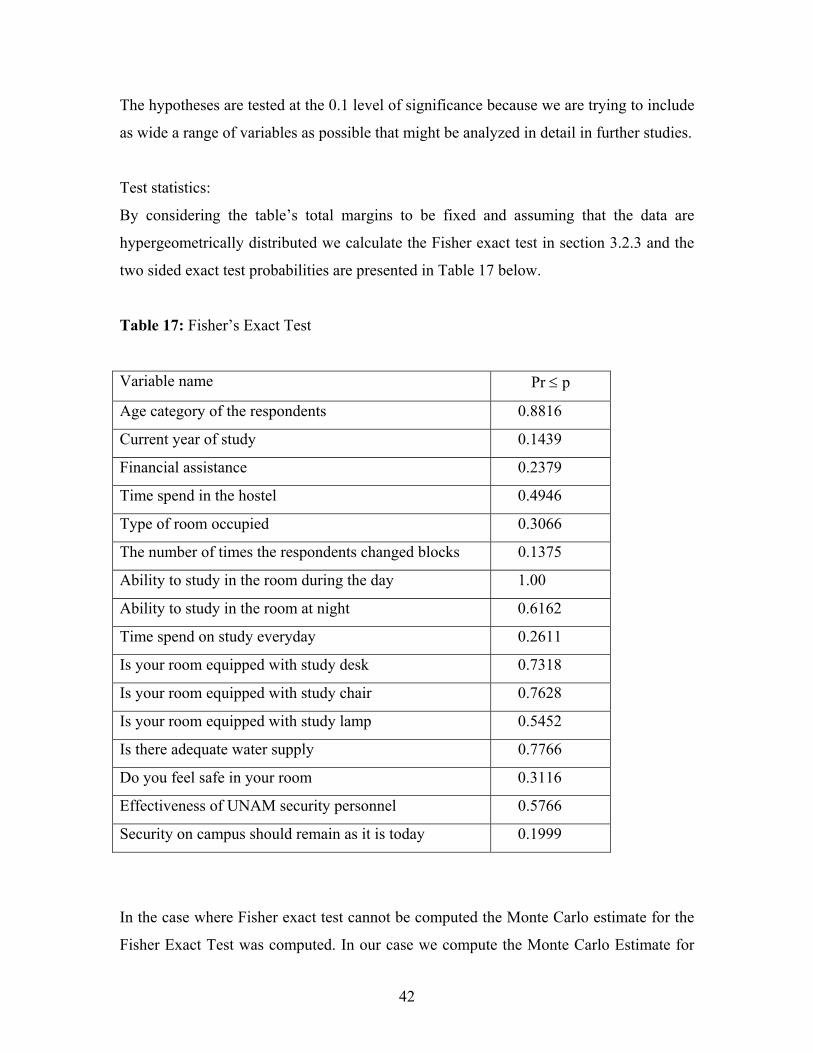
The hypotheses are tested at the 0.1 level of significance because we are trying to include
as wide a range of variables as possible that might be analyzed in detail in further studies.
Test statistics:
By considering the table’s total margins to be fixed and assuming that the data are
hypergeometrically distributed we calculate the Fisher exact test in section 3.2.3 and the
two sided exact test probabilities are presented in Table 17 below.
Table 17: Fisher’s Exact Test
Variable name Pr ≤ p
Age category of the respondents 0.8816
Current year of study 0.1439
Financial assistance 0.2379
Time spend in the hostel 0.4946
Type of room occupied 0.3066
The number of times the respondents changed blocks 0.1375
Ability to study in the room during the day 1.00
Ability to study in the room at night 0.6162
Time spend on study everyday 0.2611
Is your room equipped with study desk 0.7318
Is your room equipped with study chair 0.7628
Is your room equipped with study lamp 0.5452
Is there adequate water supply 0.7766
Do you feel safe in your room 0.3116
Effectiveness of UNAM security personnel 0.5766
Security on campus should remain as it is today 0.1999
In the case where Fisher exact test cannot be computed the Monte Carlo estimate for the
Fisher Exact Test was computed. In our case we compute the Monte Carlo Estimate for
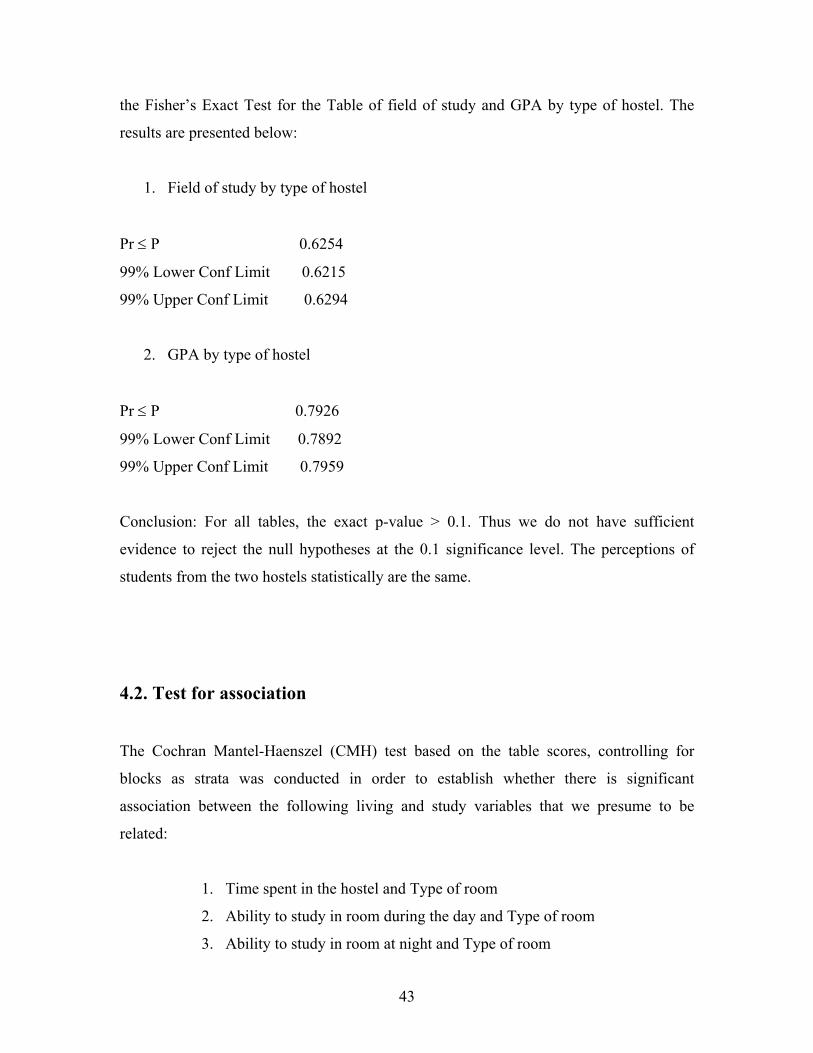
43
the Fisher’s Exact Test for the Table of field of study and GPA by type of hostel. The
results are presented below:
1. Field of study by type of hostel
Pr ≤ P 0.6254
99% Lower Conf Limit 0.6215
99% Upper Conf Limit 0.6294
2. GPA by type of hostel
Pr ≤ P 0.7926
99% Lower Conf Limit 0.7892
99% Upper Conf Limit 0.7959
Conclusion: For all tables, the exact p-value > 0.1. Thus we do not have sufficient
evidence to reject the null hypotheses at the 0.1 significance level. The perceptions of
students from the two hostels statistically are the same.
4.2. Test for association
The Cochran Mantel-Haenszel (CMH) test based on the table scores, controlling for
blocks as strata was conducted in order to establish whether there is significant
association between the following living and study variables that we presume to be
related:
1. Time spent in the hostel and Type of room
2. Ability to study in room during the day and Type of room
3. Ability to study in room at night and Type of room
44
4. Type of room and Safety in room
5. Time spent in hostel and Number of times respondents change blocks
6. Ability to study in room at night and study desk in rooms
7. Ability to study in room at night and study chair in rooms
8. Ability to study in room at night and study lamp in rooms
9. Effectiveness of UNAM security personnel and Safety studying at classes at
night
10. Effectiveness of UNAM security personnel and Should security on campus
remain unchanged?
We regard all these variables as ordinal or interval. Time spent in hostel and number of
times students change blocks are interval variables. Type of room (single/double) is
ordinal, because we consider it as referring to the number of students occupying the
room. Ability to study in room during the day, ability to study in room at night, safety in
room, availability of study desk, chair and lamp in rooms, safety studying at classes at
night, effectiveness of UNAM security personnel and should campus security remain
unchanged? are ordinal since we are considering their level that is yes/no to be ordered
(i.e. yes is better than no).
The CMH test statistic (which is the test for nonzero correlation and general association)
given in section 3.2.3 will be computed. The hypotheses to be tested are as follows:
1. Ho: There is no association between the living and study variables
2. Ha: There exist an association between the living and study variables
3. Significance level of the test is 0.1
The resulting test statistics and the p-values for the CMH test are presented in Table 18
below:
45
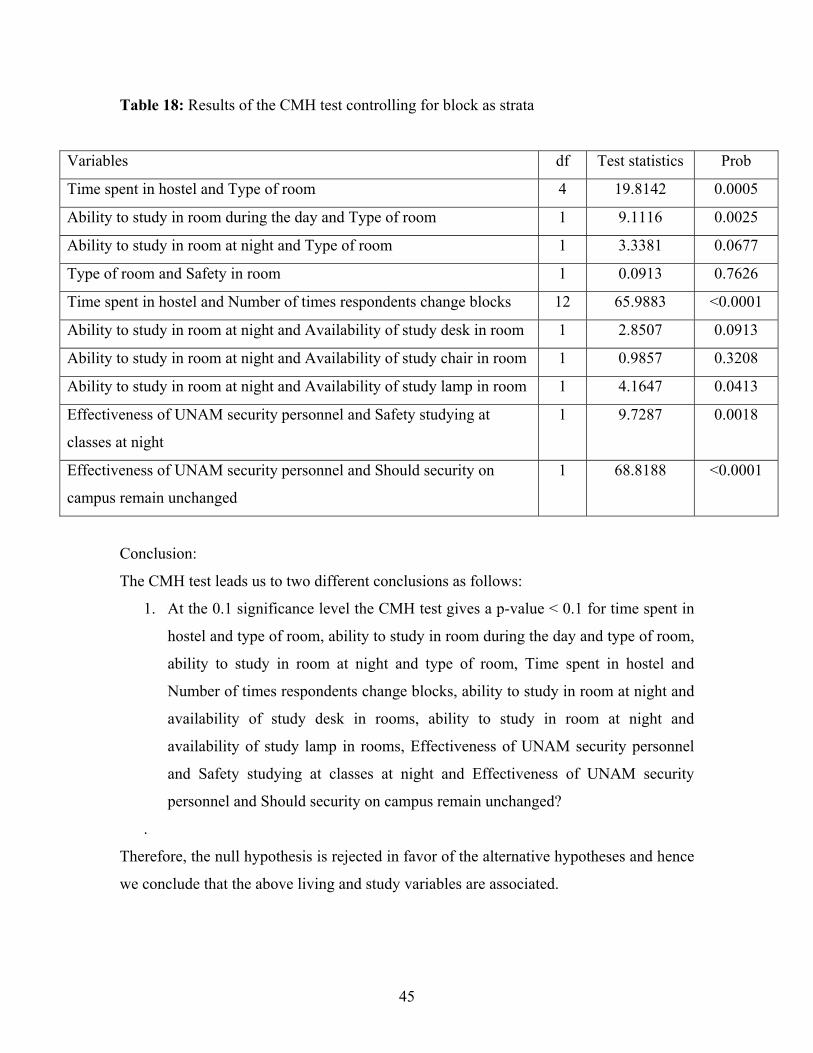
Table 18: Results of the CMH test controlling for block as strata
Variables df Test statistics Prob
Time spent in hostel and Type of room 4 19.8142 0.0005
Ability to study in room during the day and Type of room 1 9.1116 0.0025
Ability to study in room at night and Type of room 1 3.3381 0.0677
Type of room and Safety in room 1 0.0913 0.7626
Time spent in hostel and Number of times respondents change blocks 12 65.9883 <0.0001
Ability to study in room at night and Availability of study desk in room 1 2.8507 0.0913
Ability to study in room at night and Availability of study chair in room 1 0.9857 0.3208
Ability to study in room at night and Availability of study lamp in room 1 4.1647 0.0413
Effectiveness of UNAM security personnel and Safety studying at
classes at night
1 9.7287 0.0018
Effectiveness of UNAM security personnel and Should security on
campus remain unchanged
1 68.8188 <0.0001
Conclusion:
The CMH test leads us to two different conclusions as follows:
1. At the 0.1 significance level the CMH test gives a p-value < 0.1 for time spent in
hostel and type of room, ability to study in room during the day and type of room,
ability to study in room at night and type of room, Time spent in hostel and
Number of times respondents change blocks, ability to study in room at night and
availability of study desk in rooms, ability to study in room at night and
availability of study lamp in rooms, Effectiveness of UNAM security personnel
and Safety studying at classes at night and Effectiveness of UNAM security
personnel and Should security on campus remain unchanged?
.
Therefore, the null hypothesis is rejected in favor of the alternative hypotheses and hence
we conclude that the above living and study variables are associated.
46
The individual Tables indicating the nature of association between the above variables
within the strata is presented in Appendix II (i). The entries in the Tables are the
proportion of students. From the Tables, there is no priorities in allocation bedding rooms
to students while ability to study in room during the day and type of room are positively
associated, also ability to study in room at night and type of room are positively
associated except in stratum 13. There is a negative association between ability to study
in room at night and number of times student change blocks, while ability to study in
room at night and availability of both study desk and lamp in rooms are positively
associated across all strata.
There is a positive association between ability to study in room at night and highly
effectiveness of security personnel except in strata 5, 12 and 13 (where the association is
negative), while ability to study in room at night and moderate effective of security
personnel are negatively associated except in strata 1, 4, 12 and 13, and ability to study in
room at night and ineffectiveness of security personnel are negatively associated except
in strata 2, 5, 9 and 14 respectively. Similarly, should security on campus remain
unchanged is positively associated with highly effectiveness of security personnel, with
moderate effectiveness of security personnel except in strata 5, 10, 11, 12 and 14, while
should security on campus remain unchanged is negatively associated with
ineffectiveness of security personnel.
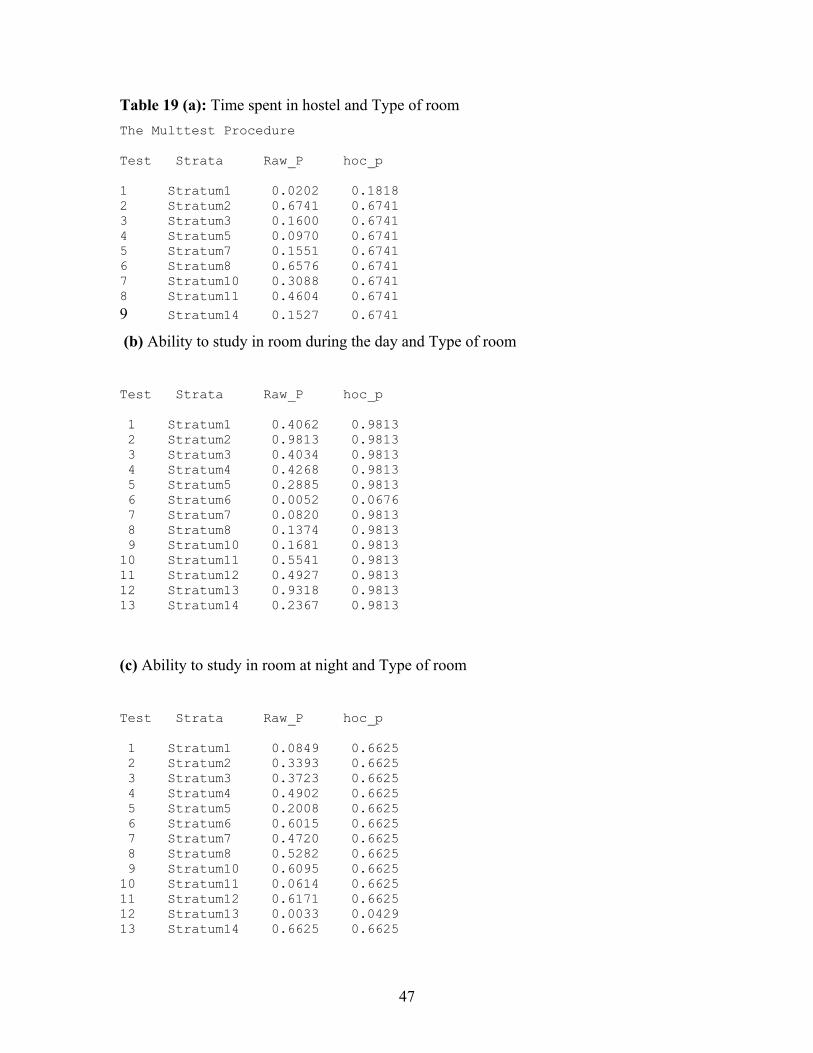
Table 19 (a) - (h) below present the significance of the test for association for the above
variables across the strata and their corresponding adjusted p-values (Hochberg p-values
denoted as hoc_p in tables) produced by the SAS Multtest procedure. The Multtest
procedure approaches the multiple testing problems by adjusting the p-values from a
family of hypotheses tests. The adjusted p-value is the smallest significance level for
which the given hypotheses would be rejected when the entire family test is considered.
The Hochberg method controls the family wise of error rate under the assumption of
independence.
47
Table 19 (a): Time spent in hostel and Type of room The Multtest Procedure Test Strata Raw_P hoc_p 1 Stratum1 0.0202 0.1818 2 Stratum2 0.6741 0.6741 3 Stratum3 0.1600 0.6741 4 Stratum5 0.0970 0.6741 5 Stratum7 0.1551 0.6741 6 Stratum8 0.6576 0.6741 7 Stratum10 0.3088 0.6741 8 Stratum11 0.4604 0.6741 9 Stratum14 0.1527 0.6741
(b) Ability to study in room during the day and Type of room
Test Strata Raw_P hoc_p 1 Stratum1 0.4062 0.9813 2 Stratum2 0.9813 0.9813 3 Stratum3 0.4034 0.9813 4 Stratum4 0.4268 0.9813 5 Stratum5 0.2885 0.9813 6 Stratum6 0.0052 0.0676 7 Stratum7 0.0820 0.9813 8 Stratum8 0.1374 0.9813 9 Stratum10 0.1681 0.9813 10 Stratum11 0.5541 0.9813 11 Stratum12 0.4927 0.9813 12 Stratum13 0.9318 0.9813 13 Stratum14 0.2367 0.9813
(c) Ability to study in room at night and Type of room
Test Strata Raw_P hoc_p 1 Stratum1 0.0849 0.6625 2 Stratum2 0.3393 0.6625 3 Stratum3 0.3723 0.6625 4 Stratum4 0.4902 0.6625 5 Stratum5 0.2008 0.6625 6 Stratum6 0.6015 0.6625 7 Stratum7 0.4720 0.6625 8 Stratum8 0.5282 0.6625 9 Stratum10 0.6095 0.6625 10 Stratum11 0.0614 0.6625 11 Stratum12 0.6171 0.6625 12 Stratum13 0.0033 0.0429 13 Stratum14 0.6625 0.6625
48
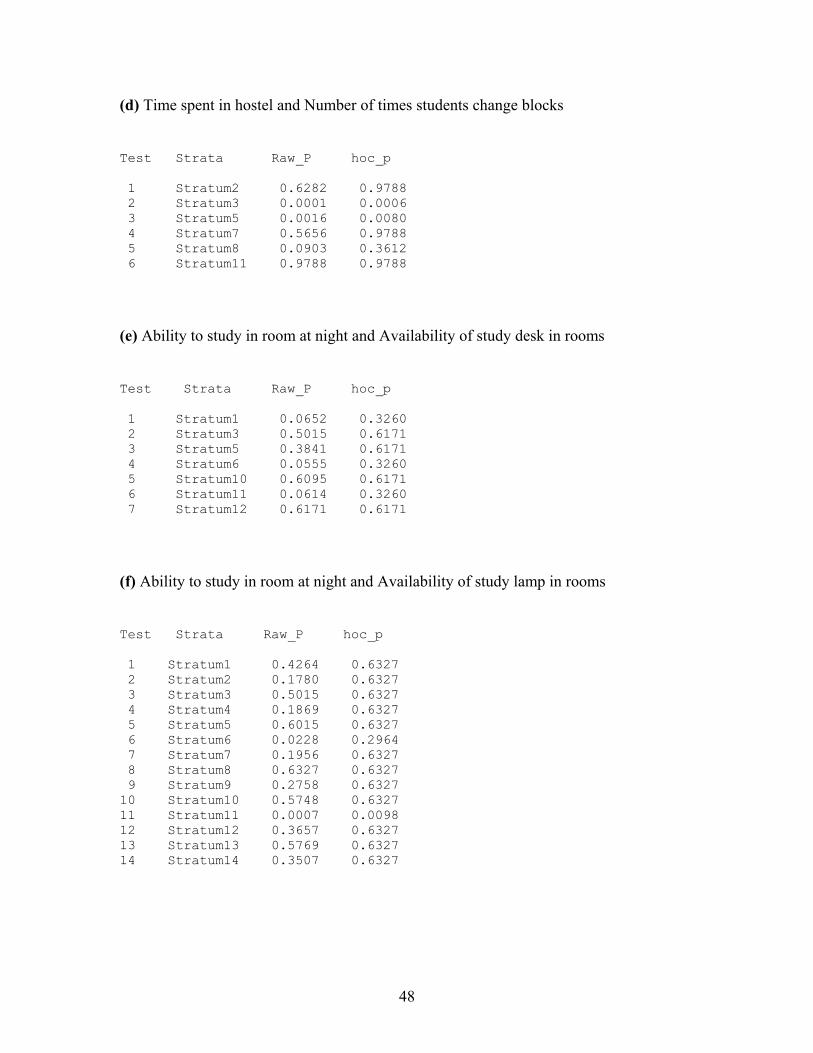
(d) Time spent in hostel and Number of times students change blocks
Test Strata Raw_P hoc_p 1 Stratum2 0.6282 0.9788 2 Stratum3 0.0001 0.0006 3 Stratum5 0.0016 0.0080 4 Stratum7 0.5656 0.9788 5 Stratum8 0.0903 0.3612 6 Stratum11 0.9788 0.9788
(e) Ability to study in room at night and Availability of study desk in rooms
Test Strata Raw_P hoc_p 1 Stratum1 0.0652 0.3260 2 Stratum3 0.5015 0.6171 3 Stratum5 0.3841 0.6171 4 Stratum6 0.0555 0.3260 5 Stratum10 0.6095 0.6171 6 Stratum11 0.0614 0.3260 7 Stratum12 0.6171 0.6171
(f) Ability to study in room at night and Availability of study lamp in rooms
Test Strata Raw_P hoc_p 1 Stratum1 0.4264 0.6327 2 Stratum2 0.1780 0.6327 3 Stratum3 0.5015 0.6327 4 Stratum4 0.1869 0.6327 5 Stratum5 0.6015 0.6327 6 Stratum6 0.0228 0.2964 7 Stratum7 0.1956 0.6327 8 Stratum8 0.6327 0.6327 9 Stratum9 0.2758 0.6327 10 Stratum10 0.5748 0.6327 11 Stratum11 0.0007 0.0098 12 Stratum12 0.3657 0.6327 13 Stratum13 0.5769 0.6327 14 Stratum14 0.3507 0.6327
49
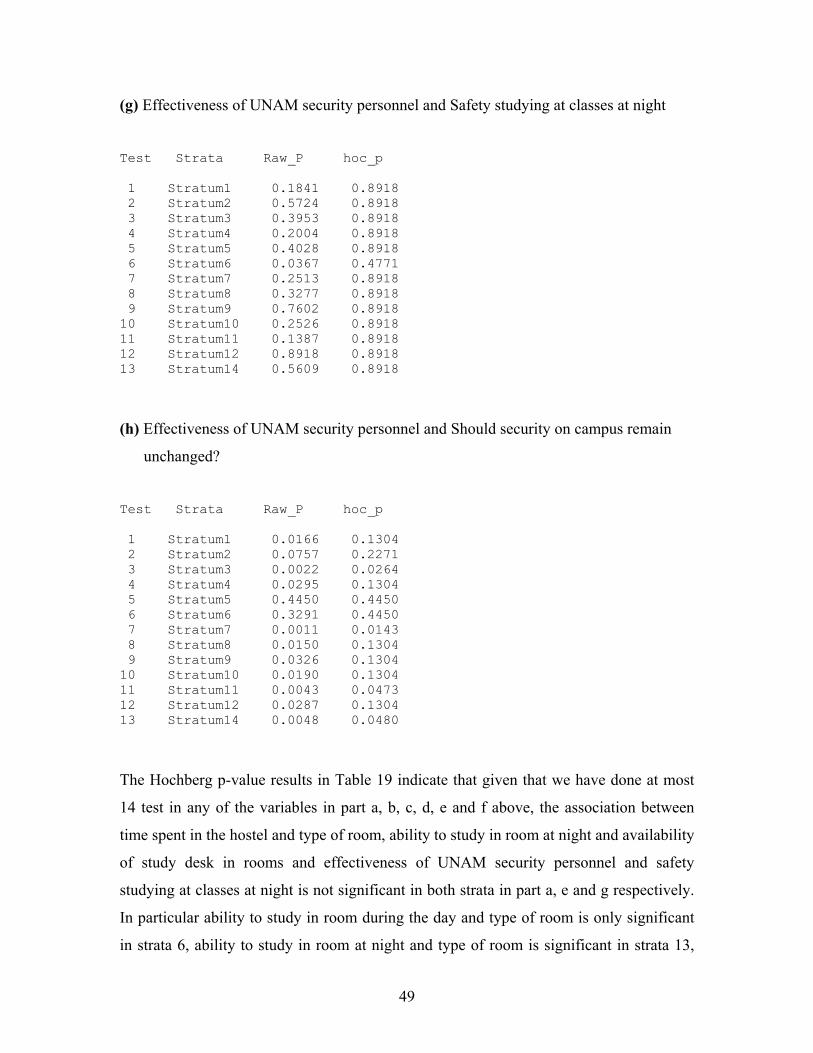
(g) Effectiveness of UNAM security personnel and Safety studying at classes at night
Test Strata Raw_P hoc_p 1 Stratum1 0.1841 0.8918 2 Stratum2 0.5724 0.8918 3 Stratum3 0.3953 0.8918 4 Stratum4 0.2004 0.8918 5 Stratum5 0.4028 0.8918 6 Stratum6 0.0367 0.4771 7 Stratum7 0.2513 0.8918 8 Stratum8 0.3277 0.8918 9 Stratum9 0.7602 0.8918 10 Stratum10 0.2526 0.8918 11 Stratum11 0.1387 0.8918 12 Stratum12 0.8918 0.8918 13 Stratum14 0.5609 0.8918
(h) Effectiveness of UNAM security personnel and Should security on campus remain
unchanged?
Test Strata Raw_P hoc_p 1 Stratum1 0.0166 0.1304 2 Stratum2 0.0757 0.2271 3 Stratum3 0.0022 0.0264 4 Stratum4 0.0295 0.1304 5 Stratum5 0.4450 0.4450 6 Stratum6 0.3291 0.4450 7 Stratum7 0.0011 0.0143 8 Stratum8 0.0150 0.1304 9 Stratum9 0.0326 0.1304 10 Stratum10 0.0190 0.1304 11 Stratum11 0.0043 0.0473 12 Stratum12 0.0287 0.1304 13 Stratum14 0.0048 0.0480
The Hochberg p-value results in Table 19 indicate that given that we have done at most
14 test in any of the variables in part a, b, c, d, e and f above, the association between
time spent in the hostel and type of room, ability to study in room at night and availability
of study desk in rooms and effectiveness of UNAM security personnel and safety
studying at classes at night is not significant in both strata in part a, e and g respectively.
In particular ability to study in room during the day and type of room is only significant
in strata 6, ability to study in room at night and type of room is significant in strata 13,
50
time spent in hostel and number of times students change blocks is significant in strata 3
and 5, ability to study in room at night and availability of study lamp in rooms is only
significant in stratum 11 and effectiveness of UNAM security personnel and should
security on campus remain unchanged is significant in strata 3, 7, 11 and 14.
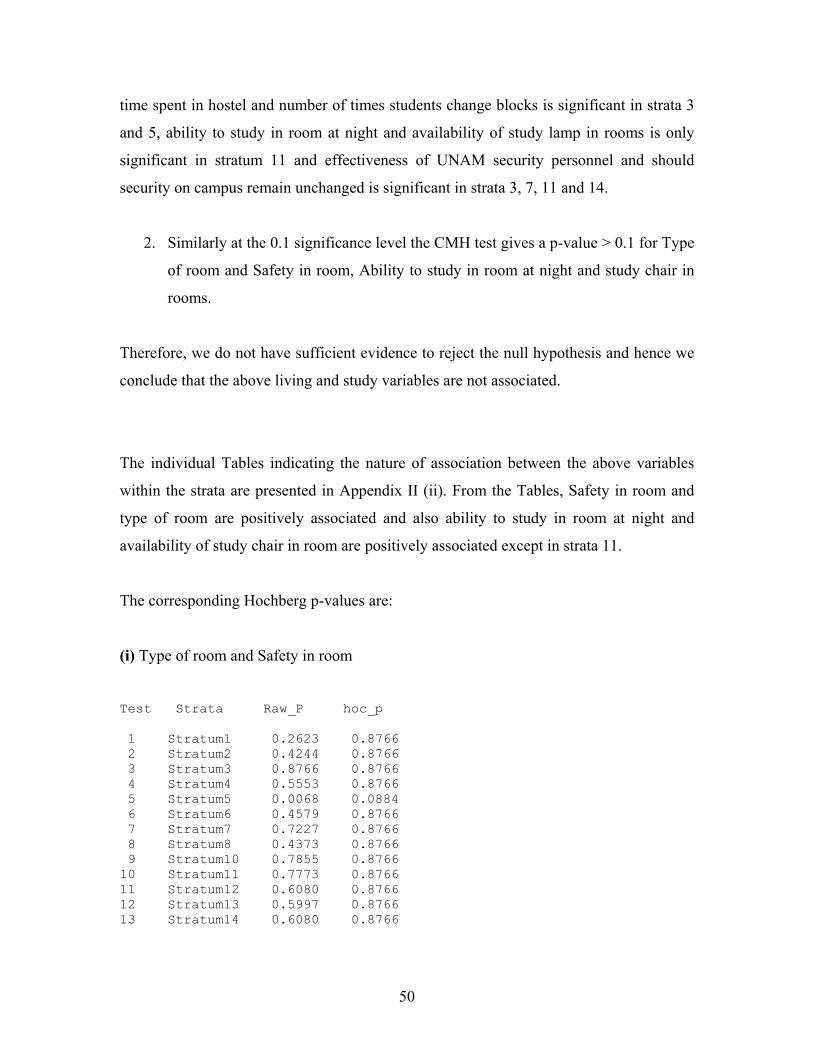
2. Similarly at the 0.1 significance level the CMH test gives a p-value > 0.1 for Type
of room and Safety in room, Ability to study in room at night and study chair in
rooms.
Therefore, we do not have sufficient evidence to reject the null hypothesis and hence we
conclude that the above living and study variables are not associated.
The individual Tables indicating the nature of association between the above variables
within the strata are presented in Appendix II (ii). From the Tables, Safety in room and
type of room are positively associated and also ability to study in room at night and
availability of study chair in room are positively associated except in strata 11.
The corresponding Hochberg p-values are:
(i) Type of room and Safety in room
Test Strata Raw_P hoc_p 1 Stratum1 0.2623 0.8766 2 Stratum2 0.4244 0.8766 3 Stratum3 0.8766 0.8766 4 Stratum4 0.5553 0.8766 5 Stratum5 0.0068 0.0884 6 Stratum6 0.4579 0.8766 7 Stratum7 0.7227 0.8766 8 Stratum8 0.4373 0.8766 9 Stratum10 0.7855 0.8766 10 Stratum11 0.7773 0.8766 11 Stratum12 0.6080 0.8766 12 Stratum13 0.5997 0.8766 13 Stratum14 0.6080 0.8766
51
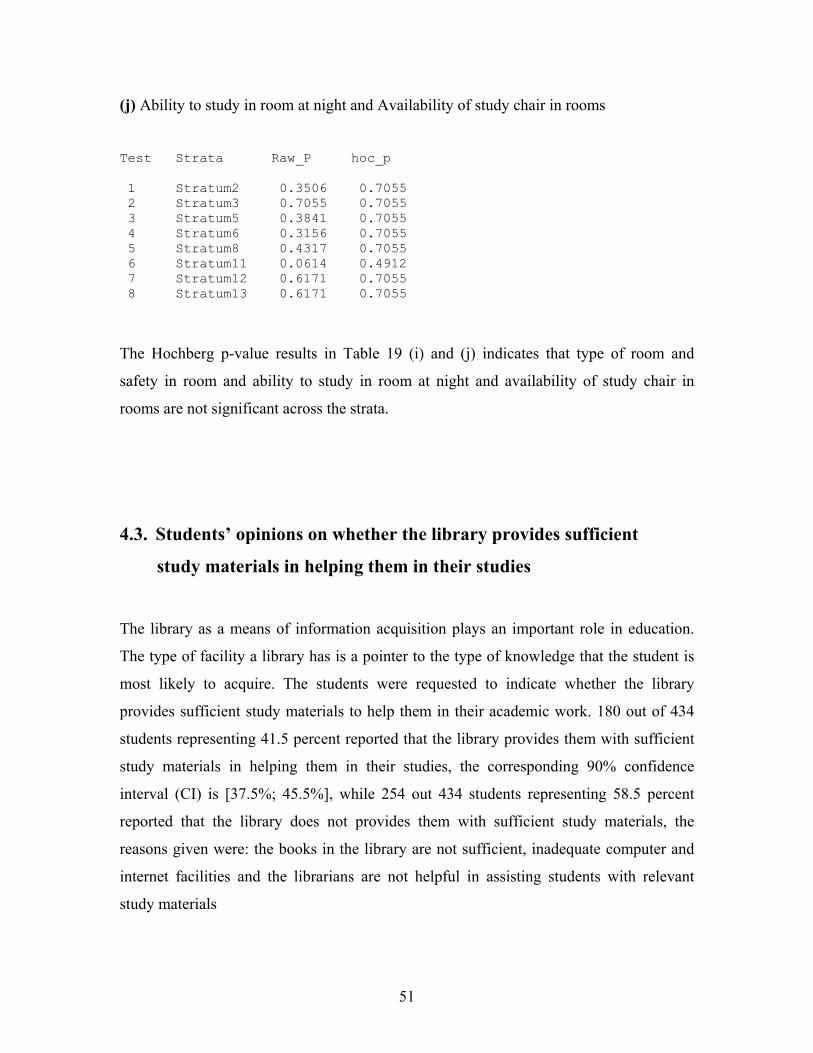
(j) Ability to study in room at night and Availability of study chair in rooms
Test Strata Raw_P hoc_p 1 Stratum2 0.3506 0.7055 2 Stratum3 0.7055 0.7055 3 Stratum5 0.3841 0.7055 4 Stratum6 0.3156 0.7055 5 Stratum8 0.4317 0.7055 6 Stratum11 0.0614 0.4912 7 Stratum12 0.6171 0.7055 8 Stratum13 0.6171 0.7055
The Hochberg p-value results in Table 19 (i) and (j) indicates that type of room and
safety in room and ability to study in room at night and availability of study chair in
rooms are not significant across the strata.
4.3. Students’ opinions on whether the library provides sufficient
study materials in helping them in their studies
The library as a means of information acquisition plays an important role in education.
The type of facility a library has is a pointer to the type of knowledge that the student is
most likely to acquire. The students were requested to indicate whether the library
provides sufficient study materials to help them in their academic work. 180 out of 434
students representing 41.5 percent reported that the library provides them with sufficient
study materials in helping them in their studies, the corresponding 90% confidence
interval (CI) is [37.5%; 45.5%], while 254 out 434 students representing 58.5 percent
reported that the library does not provides them with sufficient study materials, the
reasons given were: the books in the library are not sufficient, inadequate computer and
internet facilities and the librarians are not helpful in assisting students with relevant
study materials
52
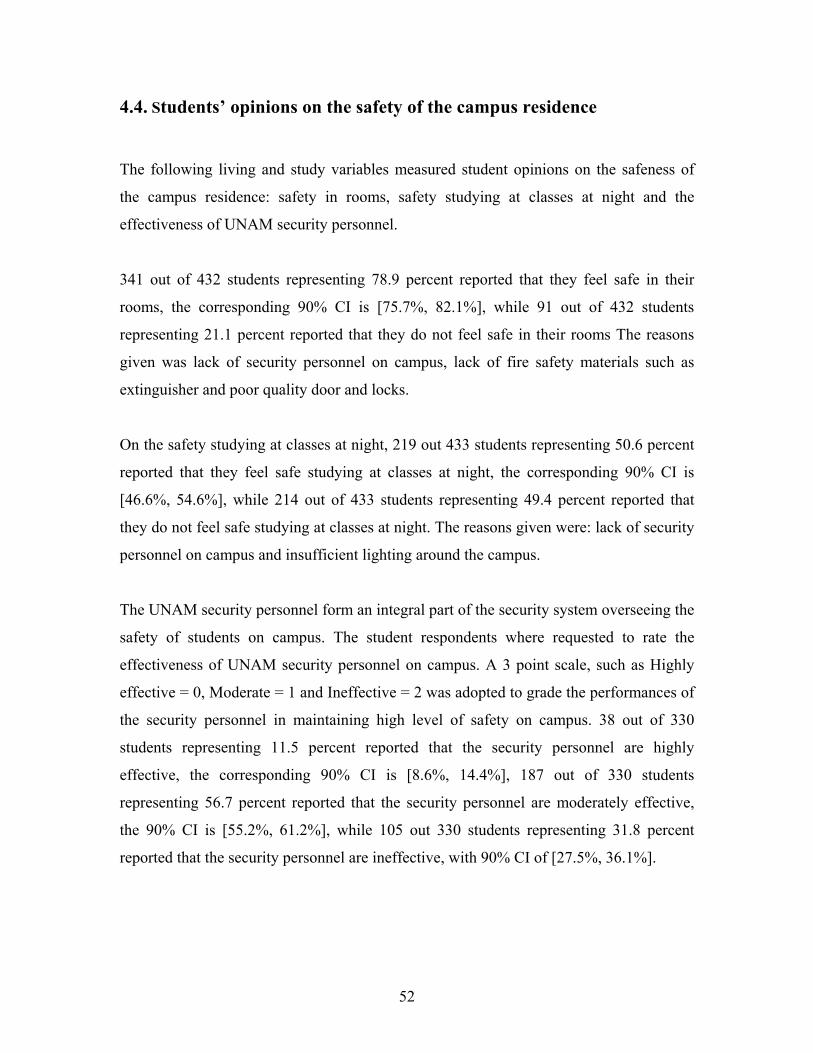
4.4. Students’ opinions on the safety of the campus residence
The following living and study variables measured student opinions on the safeness of
the campus residence: safety in rooms, safety studying at classes at night and the
effectiveness of UNAM security personnel.
341 out of 432 students representing 78.9 percent reported that they feel safe in their
rooms, the corresponding 90% CI is [75.7%, 82.1%], while 91 out of 432 students
representing 21.1 percent reported that they do not feel safe in their rooms The reasons
given was lack of security personnel on campus, lack of fire safety materials such as
extinguisher and poor quality door and locks.
On the safety studying at classes at night, 219 out 433 students representing 50.6 percent
reported that they feel safe studying at classes at night, the corresponding 90% CI is
[46.6%, 54.6%], while 214 out of 433 students representing 49.4 percent reported that
they do not feel safe studying at classes at night. The reasons given were: lack of security
personnel on campus and insufficient lighting around the campus.
The UNAM security personnel form an integral part of the security system overseeing the
safety of students on campus. The student respondents where requested to rate the
effectiveness of UNAM security personnel on campus. A 3 point scale, such as Highly
effective = 0, Moderate = 1 and Ineffective = 2 was adopted to grade the performances of
the security personnel in maintaining high level of safety on campus. 38 out of 330
students representing 11.5 percent reported that the security personnel are highly
effective, the corresponding 90% CI is [8.6%, 14.4%], 187 out of 330 students
representing 56.7 percent reported that the security personnel are moderately effective,
the 90% CI is [55.2%, 61.2%], while 105 out 330 students representing 31.8 percent
reported that the security personnel are ineffective, with 90% CI of [27.5%, 36.1%].
53
4.5. Individual correlations between GPA and living and study variables
In order to assess the strength of the relationship between GPA and the environment and
study variables time spent in the hostel, number of times students change blocks, current
year of study, time spent on study, a set of scatter plots were plotted (Figure 1, Appendix
III). These plots indicates that the mean GPA differs across all levels of time spent in
hostel, number of times students change blocks, current year of study and time spent on
study respectively. In particular these plots exhibit outliers for students who spent less
than a year, one year, two and three years in the hostel, students who do not change
blocks and for those who change blocks only once, students who are in second and third
year of study and students who spent two and three hours on their studies. Furthermore,
the plots indicate no linear association between time spent in hostel, number of times
students change blocks, current year of study, time spent on study and GPA, and the
variation in GPA is not constant across levels of time spent in hostel, number of times
students change blocks, current year of study and time spent on study.
For the following living and study variables:
Living variables
1. Type of room
2. Ability to study in room during the day
3. Ability to study in room at night
4. Do you get meals from the campus dinning hall
5. Do you get meals from the campus cafeteria
6. Self catering
7. Students satisfaction with the level of services provided by the catering
departments
8. Sufficient water supply in hostels
9. Safety in rooms
10. Effectiveness of UNAM security personnel
11. Should security on campus remain unchanged
54
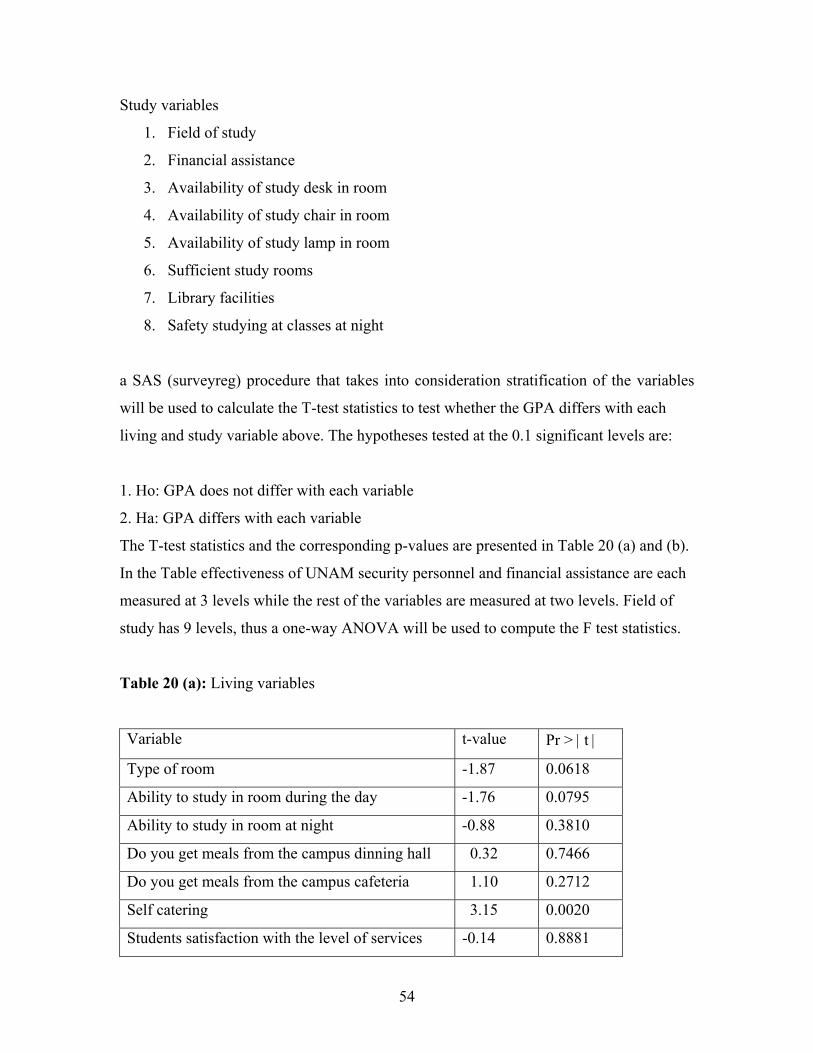
Study variables
1. Field of study
2. Financial assistance
3. Availability of study desk in room
4. Availability of study chair in room
5. Availability of study lamp in room
6. Sufficient study rooms
7. Library facilities
8. Safety studying at classes at night
a SAS (surveyreg) procedure that takes into consideration stratification of the variables
will be used to calculate the T-test statistics to test whether the GPA differs with each
living and study variable above. The hypotheses tested at the 0.1 significant levels are:
1. Ho: GPA does not differ with each variable
2. Ha: GPA differs with each variable
The T-test statistics and the corresponding p-values are presented in Table 20 (a) and (b).
In the Table effectiveness of UNAM security personnel and financial assistance are each
measured at 3 levels while the rest of the variables are measured at two levels. Field of
study has 9 levels, thus a one-way ANOVA will be used to compute the F test statistics.
Table 20 (a): Living variables
Variable t-value Pr > | t |
Type of room -1.87 0.0618
Ability to study in room during the day -1.76 0.0795
Ability to study in room at night -0.88 0.3810
Do you get meals from the campus dinning hall 0.32 0.7466
Do you get meals from the campus cafeteria 1.10 0.2712
Self catering 3.15 0.0020
Students satisfaction with the level of services -0.14 0.8881
55
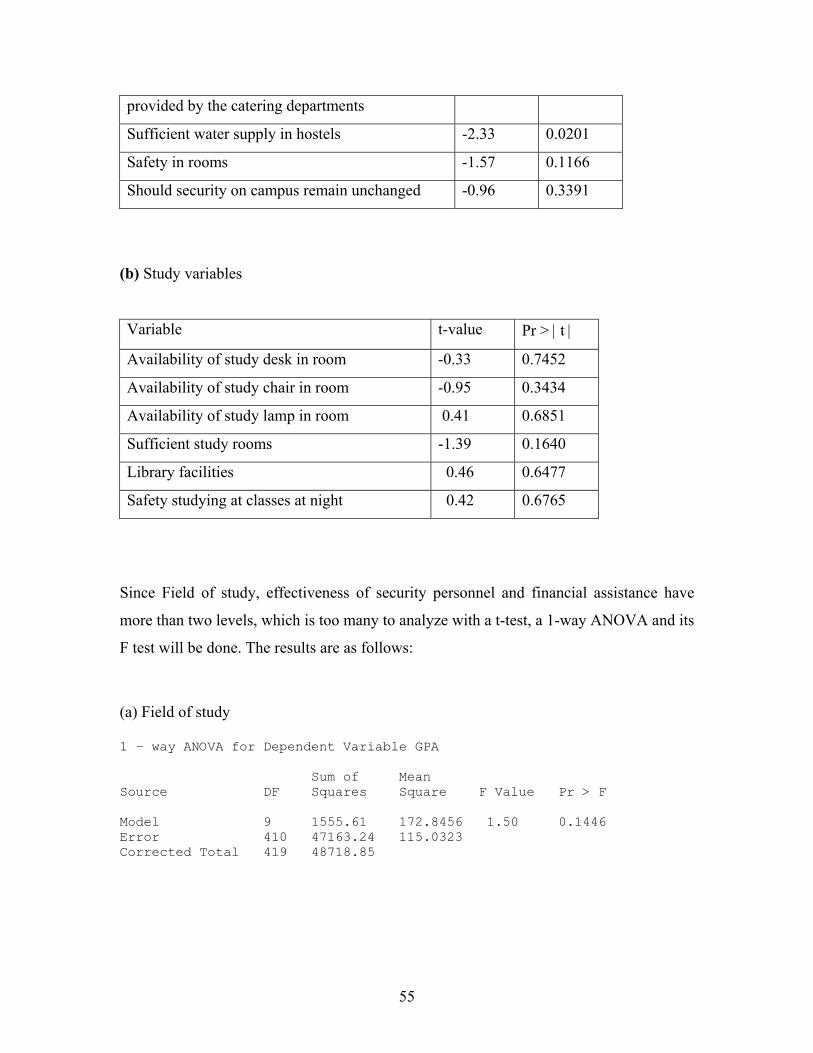
provided by the catering departments
Sufficient water supply in hostels -2.33 0.0201
Safety in rooms -1.57 0.1166
Should security on campus remain unchanged -0.96 0.3391
(b) Study variables Variable t-value Pr > | t |
Availability of study desk in room -0.33 0.7452
Availability of study chair in room -0.95 0.3434
Availability of study lamp in room 0.41 0.6851
Sufficient study rooms -1.39 0.1640
Library facilities 0.46 0.6477
Safety studying at classes at night 0.42 0.6765
Since Field of study, effectiveness of security personnel and financial assistance have
more than two levels, which is too many to analyze with a t-test, a 1-way ANOVA and its
F test will be done. The results are as follows:
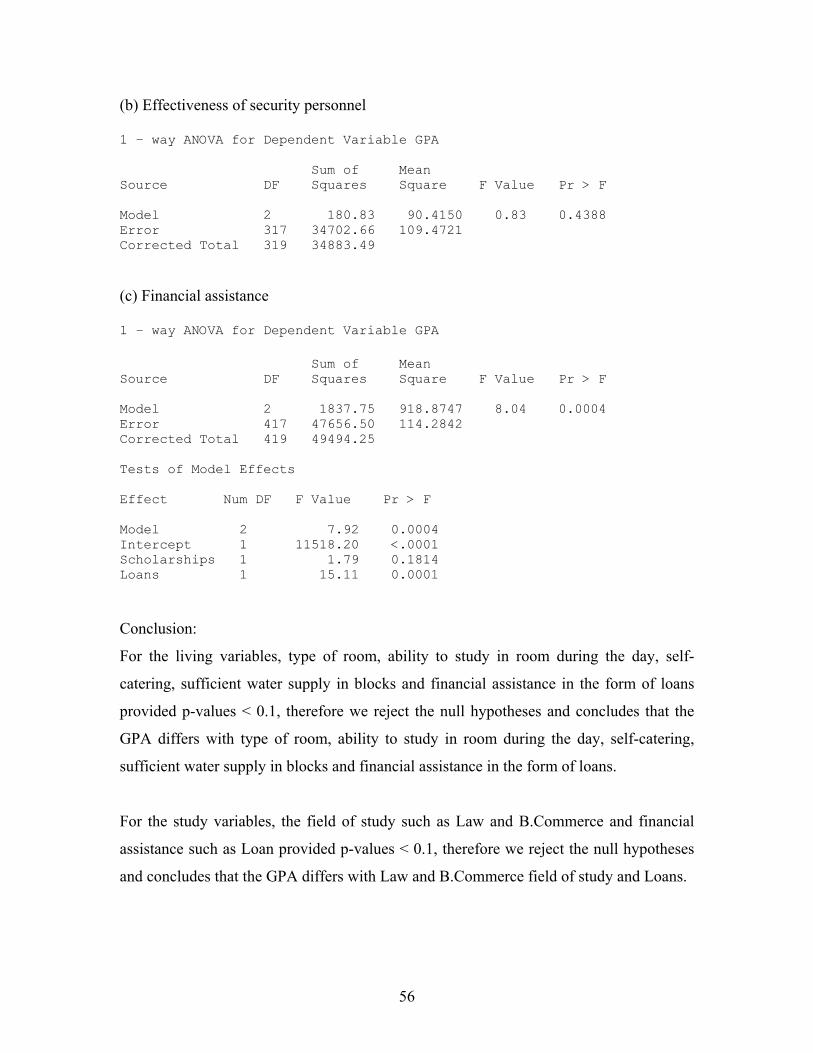
(a) Field of study 1 – way ANOVA for Dependent Variable GPA Sum of Mean Source DF Squares Square F Value Pr > F Model 9 1555.61 172.8456 1.50 0.1446 Error 410 47163.24 115.0323 Corrected Total 419 48718.85
56
(b) Effectiveness of security personnel 1 – way ANOVA for Dependent Variable GPA Sum of Mean Source DF Squares Square F Value Pr > F Model 2 180.83 90.4150 0.83 0.4388 Error 317 34702.66 109.4721 Corrected Total 319 34883.49 (c) Financial assistance 1 – way ANOVA for Dependent Variable GPA Sum of Mean Source DF Squares Square F Value Pr > F Model 2 1837.75 918.8747 8.04 0.0004 Error 417 47656.50 114.2842 Corrected Total 419 49494.25 Tests of Model Effects Effect Num DF F Value Pr > F Model 2 7.92 0.0004 Intercept 1 11518.20 <.0001 Scholarships 1 1.79 0.1814 Loans 1 15.11 0.0001 Conclusion:
For the living variables, type of room, ability to study in room during the day, self-
catering, sufficient water supply in blocks and financial assistance in the form of loans
provided p-values < 0.1, therefore we reject the null hypotheses and concludes that the
GPA differs with type of room, ability to study in room during the day, self-catering,
sufficient water supply in blocks and financial assistance in the form of loans.
For the study variables, the field of study such as Law and B.Commerce and financial
assistance such as Loan provided p-values < 0.1, therefore we reject the null hypotheses
and concludes that the GPA differs with Law and B.Commerce field of study and Loans.
57
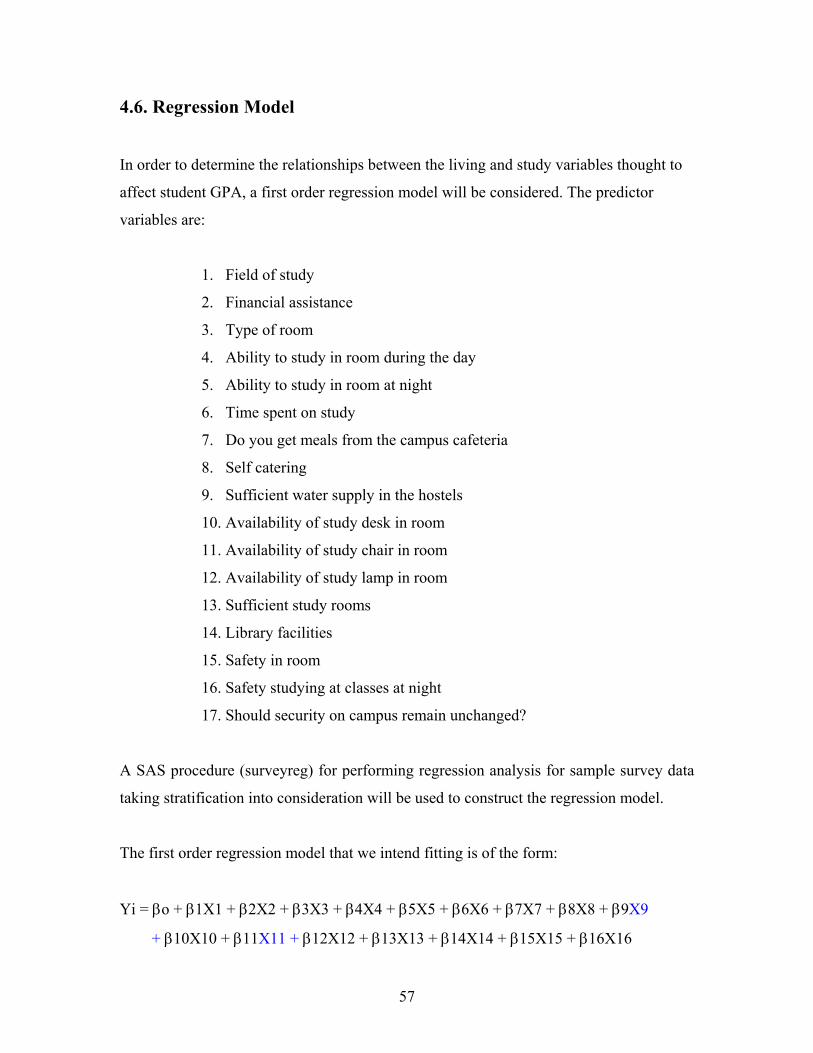
4.6. Regression Model
In order to determine the relationships between the living and study variables thought to
affect student GPA, a first order regression model will be considered. The predictor
variables are:
1. Field of study
2. Financial assistance
3. Type of room
4. Ability to study in room during the day
5. Ability to study in room at night
6. Time spent on study
7. Do you get meals from the campus cafeteria
8. Self catering
9. Sufficient water supply in the hostels
10. Availability of study desk in room
11. Availability of study chair in room
12. Availability of study lamp in room
13. Sufficient study rooms
14. Library facilities
15. Safety in room
16. Safety studying at classes at night
17. Should security on campus remain unchanged?
A SAS procedure (surveyreg) for performing regression analysis for sample survey data
taking stratification into consideration will be used to construct the regression model.
The first order regression model that we intend fitting is of the form:
Yi = βo + β1X1 + β2X2 + β3X3 + β4X4 + β5X5 + β6X6 + β7X7 + β8X8 + β9X9
+ β10X10 + β11X11 + β12X12 + β13X13 + β14X14 + β15X15 + β16X16
58
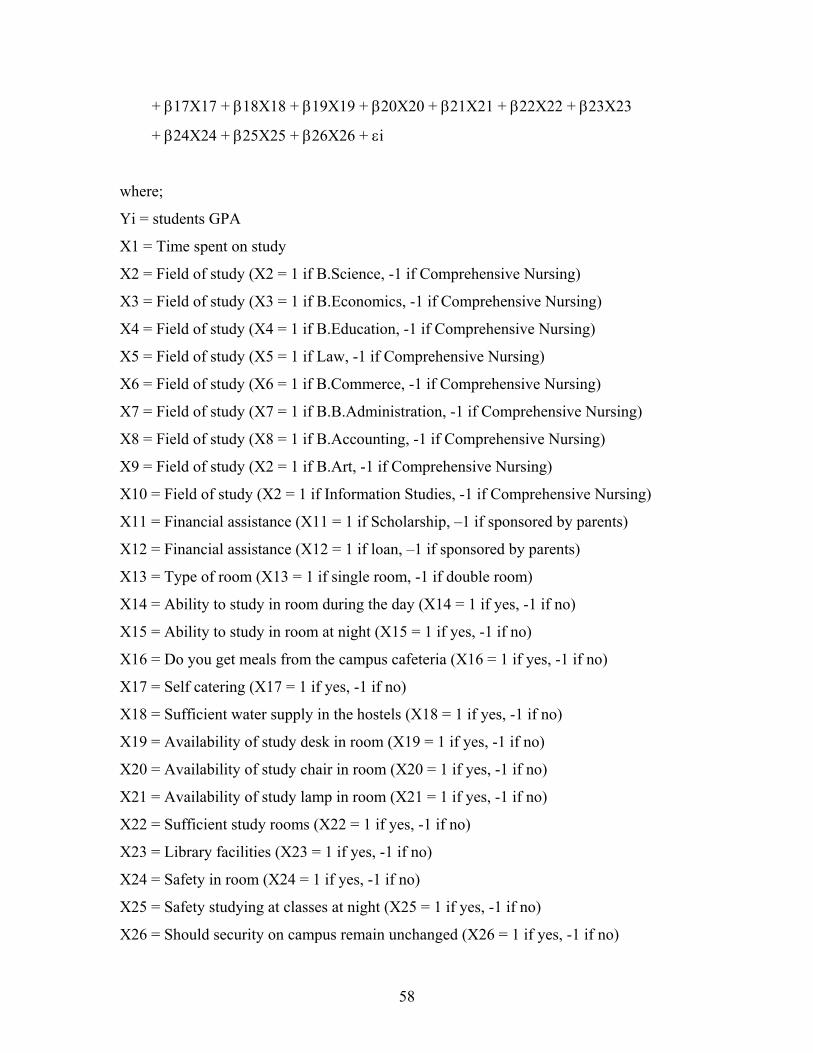
+ β17X17 + β18X18 + β19X19 + β20X20 + β21X21 + β22X22 + β23X23
+ β24X24 + β25X25 + β26X26 + εi
where;
Yi = students GPA
X1 = Time spent on study
X2 = Field of study (X2 = 1 if B.Science, -1 if Comprehensive Nursing)
X3 = Field of study (X3 = 1 if B.Economics, -1 if Comprehensive Nursing)
X4 = Field of study (X4 = 1 if B.Education, -1 if Comprehensive Nursing)
X5 = Field of study (X5 = 1 if Law, -1 if Comprehensive Nursing)
X6 = Field of study (X6 = 1 if B.Commerce, -1 if Comprehensive Nursing)
X7 = Field of study (X7 = 1 if B.B.Administration, -1 if Comprehensive Nursing)
X8 = Field of study (X8 = 1 if B.Accounting, -1 if Comprehensive Nursing)
X9 = Field of study (X2 = 1 if B.Art, -1 if Comprehensive Nursing)
X10 = Field of study (X2 = 1 if Information Studies, -1 if Comprehensive Nursing)
X11 = Financial assistance (X11 = 1 if Scholarship, –1 if sponsored by parents)
X12 = Financial assistance (X12 = 1 if loan, –1 if sponsored by parents)
X13 = Type of room (X13 = 1 if single room, -1 if double room)
X14 = Ability to study in room during the day (X14 = 1 if yes, -1 if no)
X15 = Ability to study in room at night (X15 = 1 if yes, -1 if no)
X16 = Do you get meals from the campus cafeteria (X16 = 1 if yes, -1 if no)
X17 = Self catering (X17 = 1 if yes, -1 if no)
X18 = Sufficient water supply in the hostels (X18 = 1 if yes, -1 if no)
X19 = Availability of study desk in room (X19 = 1 if yes, -1 if no)
X20 = Availability of study chair in room (X20 = 1 if yes, -1 if no)
X21 = Availability of study lamp in room (X21 = 1 if yes, -1 if no)
X22 = Sufficient study rooms (X22 = 1 if yes, -1 if no)
X23 = Library facilities (X23 = 1 if yes, -1 if no)
X24 = Safety in room (X24 = 1 if yes, -1 if no)
X25 = Safety studying at classes at night (X25 = 1 if yes, -1 if no)
X26 = Should security on campus remain unchanged (X26 = 1 if yes, -1 if no)
59
And;
βo, β1, β2, β3, β4, β5, β6, β7, β8, β9, β10, β11, β12, β13, β14, β15, β16, β17, β18, β19,
β20, β21, β22, β23, β24, β25, β26 are the parameters of the model
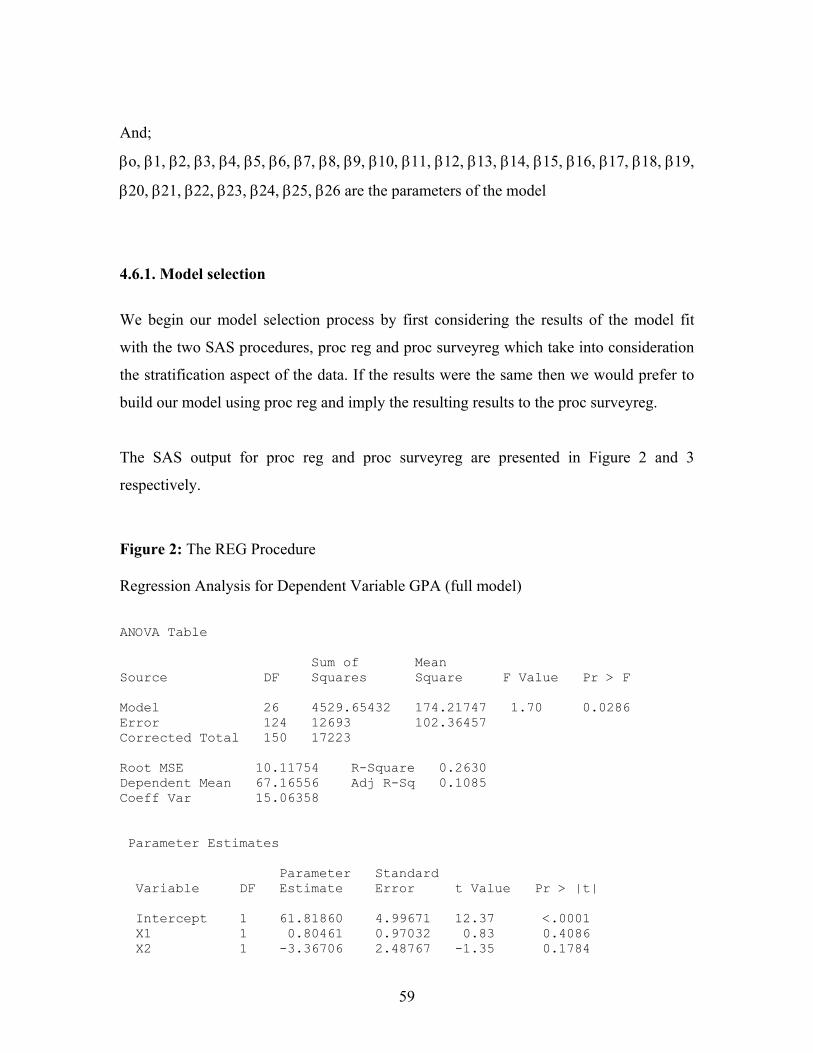
4.6.1. Model selection
We begin our model selection process by first considering the results of the model fit
with the two SAS procedures, proc reg and proc surveyreg which take into consideration
the stratification aspect of the data. If the results were the same then we would prefer to
build our model using proc reg and imply the resulting results to the proc surveyreg.
The SAS output for proc reg and proc surveyreg are presented in Figure 2 and 3
respectively.
Figure 2: The REG Procedure Regression Analysis for Dependent Variable GPA (full model) ANOVA Table Sum of Mean Source DF Squares Square F Value Pr > F Model 26 4529.65432 174.21747 1.70 0.0286 Error 124 12693 102.36457 Corrected Total 150 17223 Root MSE 10.11754 R-Square 0.2630 Dependent Mean 67.16556 Adj R-Sq 0.1085 Coeff Var 15.06358 Parameter Estimates Parameter Standard Variable DF Estimate Error t Value Pr > |t| Intercept 1 61.81860 4.99671 12.37 <.0001 X1 1 0.80461 0.97032 0.83 0.4086 X2 1 -3.36706 2.48767 -1.35 0.1784
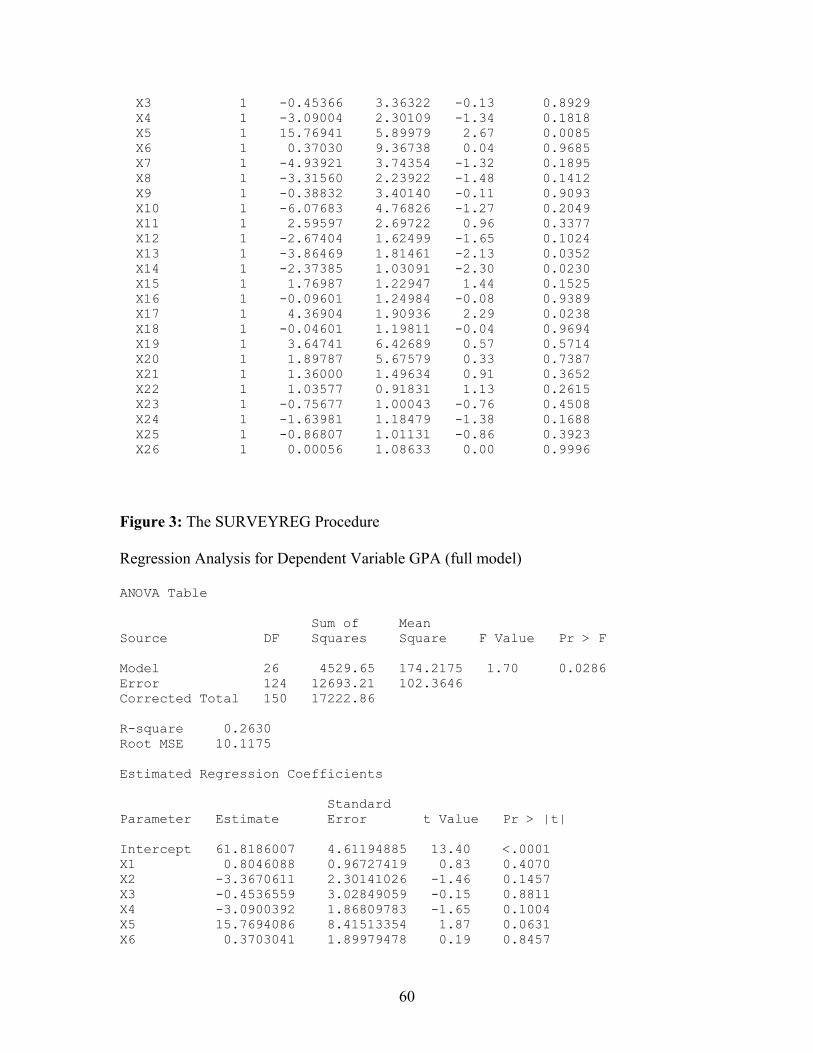
60
X3 1 -0.45366 3.36322 -0.13 0.8929 X4 1 -3.09004 2.30109 -1.34 0.1818 X5 1 15.76941 5.89979 2.67 0.0085 X6 1 0.37030 9.36738 0.04 0.9685 X7 1 -4.93921 3.74354 -1.32 0.1895 X8 1 -3.31560 2.23922 -1.48 0.1412 X9 1 -0.38832 3.40140 -0.11 0.9093 X10 1 -6.07683 4.76826 -1.27 0.2049 X11 1 2.59597 2.69722 0.96 0.3377 X12 1 -2.67404 1.62499 -1.65 0.1024 X13 1 -3.86469 1.81461 -2.13 0.0352 X14 1 -2.37385 1.03091 -2.30 0.0230 X15 1 1.76987 1.22947 1.44 0.1525 X16 1 -0.09601 1.24984 -0.08 0.9389 X17 1 4.36904 1.90936 2.29 0.0238 X18 1 -0.04601 1.19811 -0.04 0.9694 X19 1 3.64741 6.42689 0.57 0.5714 X20 1 1.89787 5.67579 0.33 0.7387 X21 1 1.36000 1.49634 0.91 0.3652 X22 1 1.03577 0.91831 1.13 0.2615 X23 1 -0.75677 1.00043 -0.76 0.4508 X24 1 -1.63981 1.18479 -1.38 0.1688 X25 1 -0.86807 1.01131 -0.86 0.3923 X26 1 0.00056 1.08633 0.00 0.9996 Figure 3: The SURVEYREG Procedure Regression Analysis for Dependent Variable GPA (full model) ANOVA Table Sum of Mean Source DF Squares Square F Value Pr > F Model 26 4529.65 174.2175 1.70 0.0286 Error 124 12693.21 102.3646 Corrected Total 150 17222.86 R-square 0.2630 Root MSE 10.1175 Estimated Regression Coefficients Standard Parameter Estimate Error t Value Pr > |t| Intercept 61.8186007 4.61194885 13.40 <.0001 X1 0.8046088 0.96727419 0.83 0.4070 X2 -3.3670611 2.30141026 -1.46 0.1457 X3 -0.4536559 3.02849059 -0.15 0.8811 X4 -3.0900392 1.86809783 -1.65 0.1004 X5 15.7694086 8.41513354 1.87 0.0631 X6 0.3703041 1.89979478 0.19 0.8457
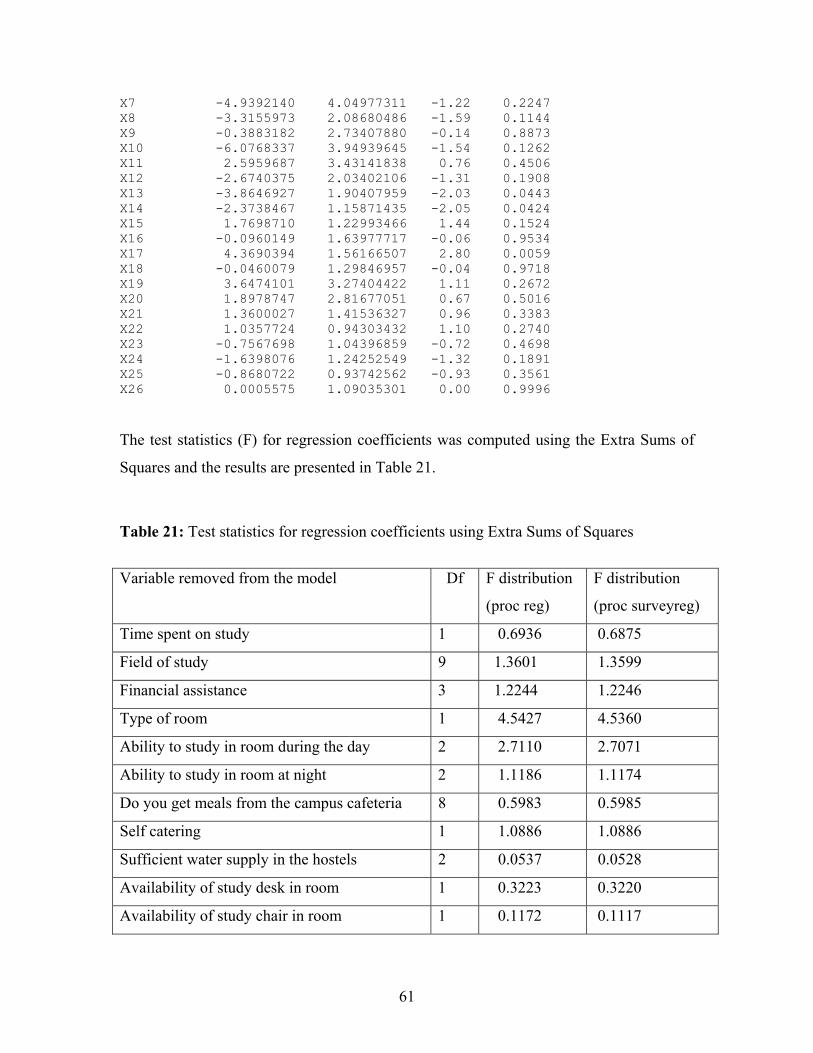
61
X7 -4.9392140 4.04977311 -1.22 0.2247 X8 -3.3155973 2.08680486 -1.59 0.1144 X9 -0.3883182 2.73407880 -0.14 0.8873 X10 -6.0768337 3.94939645 -1.54 0.1262 X11 2.5959687 3.43141838 0.76 0.4506 X12 -2.6740375 2.03402106 -1.31 0.1908 X13 -3.8646927 1.90407959 -2.03 0.0443 X14 -2.3738467 1.15871435 -2.05 0.0424 X15 1.7698710 1.22993466 1.44 0.1524 X16 -0.0960149 1.63977717 -0.06 0.9534 X17 4.3690394 1.56166507 2.80 0.0059 X18 -0.0460079 1.29846957 -0.04 0.9718 X19 3.6474101 3.27404422 1.11 0.2672 X20 1.8978747 2.81677051 0.67 0.5016 X21 1.3600027 1.41536327 0.96 0.3383 X22 1.0357724 0.94303432 1.10 0.2740 X23 -0.7567698 1.04396859 -0.72 0.4698 X24 -1.6398076 1.24252549 -1.32 0.1891 X25 -0.8680722 0.93742562 -0.93 0.3561 X26 0.0005575 1.09035301 0.00 0.9996 The test statistics (F) for regression coefficients was computed using the Extra Sums of
Squares and the results are presented in Table 21.
Table 21: Test statistics for regression coefficients using Extra Sums of Squares
Variable removed from the model Df F distribution
(proc reg)
F distribution
(proc surveyreg)
Time spent on study 1 0.6936 0.6875
Field of study 9 1.3601 1.3599
Financial assistance 3 1.2244 1.2246
Type of room 1 4.5427 4.5360
Ability to study in room during the day 2 2.7110 2.7071
Ability to study in room at night 2 1.1186 1.1174
Do you get meals from the campus cafeteria 8 0.5983 0.5985
Self catering 1 1.0886 1.0886
Sufficient water supply in the hostels 2 0.0537 0.0528
Availability of study desk in room 1 0.3223 0.3220
Availability of study chair in room 1 0.1172 0.1117
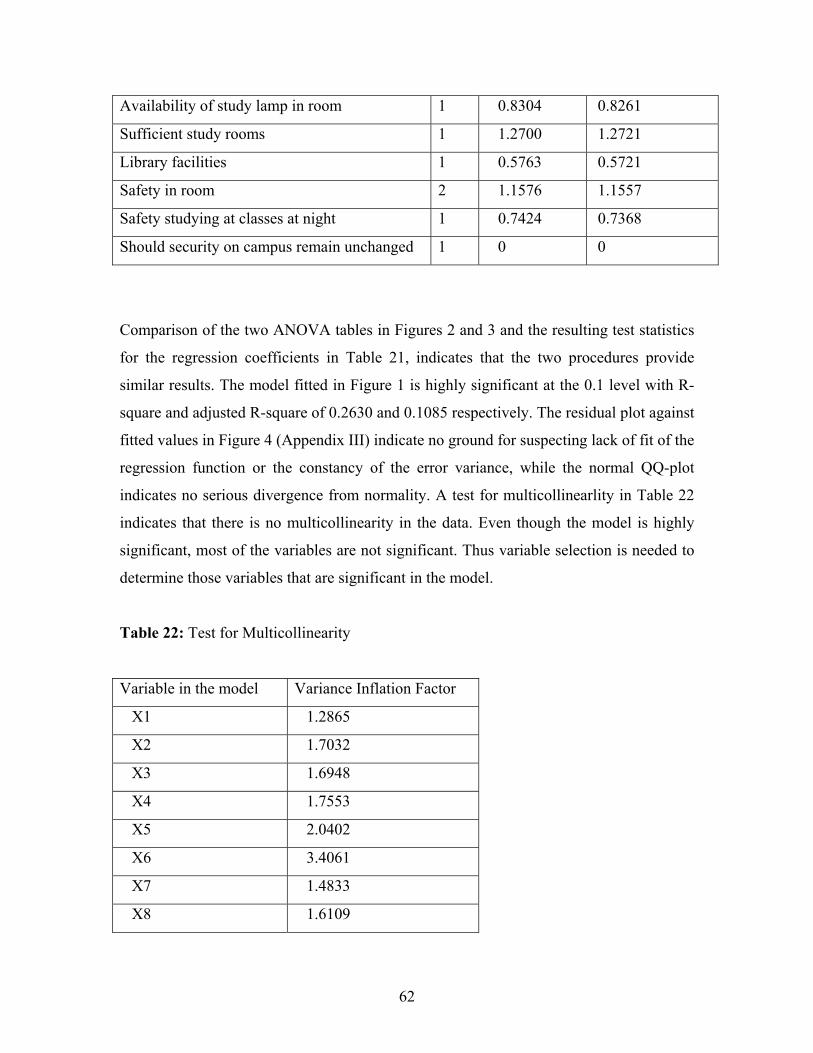
62
Availability of study lamp in room 1 0.8304 0.8261
Sufficient study rooms 1 1.2700 1.2721
Library facilities 1 0.5763 0.5721
Safety in room 2 1.1576 1.1557
Safety studying at classes at night 1 0.7424 0.7368
Should security on campus remain unchanged 1 0 0
Comparison of the two ANOVA tables in Figures 2 and 3 and the resulting test statistics
for the regression coefficients in Table 21, indicates that the two procedures provide
similar results. The model fitted in Figure 1 is highly significant at the 0.1 level with R-
square and adjusted R-square of 0.2630 and 0.1085 respectively. The residual plot against
fitted values in Figure 4 (Appendix III) indicate no ground for suspecting lack of fit of the
regression function or the constancy of the error variance, while the normal QQ-plot
indicates no serious divergence from normality. A test for multicollinearlity in Table 22
indicates that there is no multicollinearity in the data. Even though the model is highly
significant, most of the variables are not significant. Thus variable selection is needed to
determine those variables that are significant in the model.
Table 22: Test for Multicollinearity
Variable in the model Variance Inflation Factor
X1 1.2865
X2 1.7032
X3 1.6948
X4 1.7553
X5 2.0402
X6 3.4061
X7 1.4833
X8 1.6109
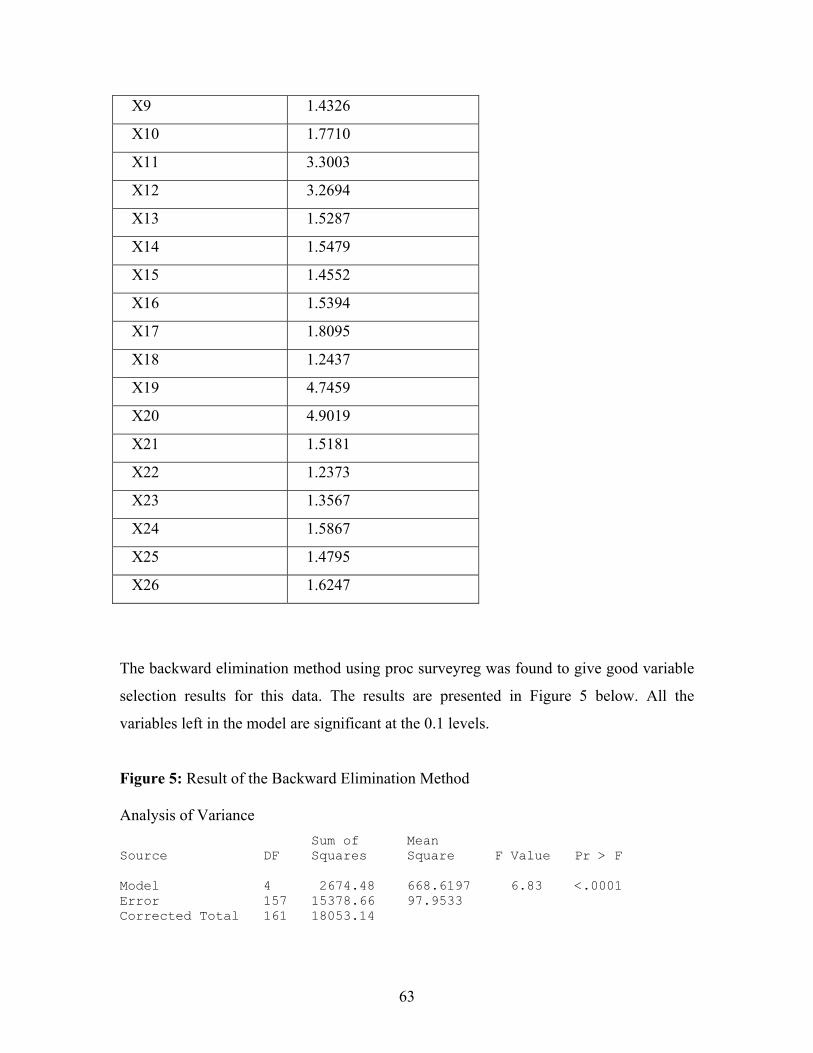
63
X9 1.4326
X10 1.7710
X11 3.3003
X12 3.2694
X13 1.5287
X14 1.5479
X15 1.4552
X16 1.5394
X17 1.8095
X18 1.2437
X19 4.7459
X20 4.9019
X21 1.5181
X22 1.2373
X23 1.3567
X24 1.5867
X25 1.4795
X26 1.6247
The backward elimination method using proc surveyreg was found to give good variable
selection results for this data. The results are presented in Figure 5 below. All the
variables left in the model are significant at the 0.1 levels.
Figure 5: Result of the Backward Elimination Method Analysis of Variance Sum of Mean Source DF Squares Square F Value Pr > F Model 4 2674.48 668.6197 6.83 <.0001 Error 157 15378.66 97.9533 Corrected Total 161 18053.14
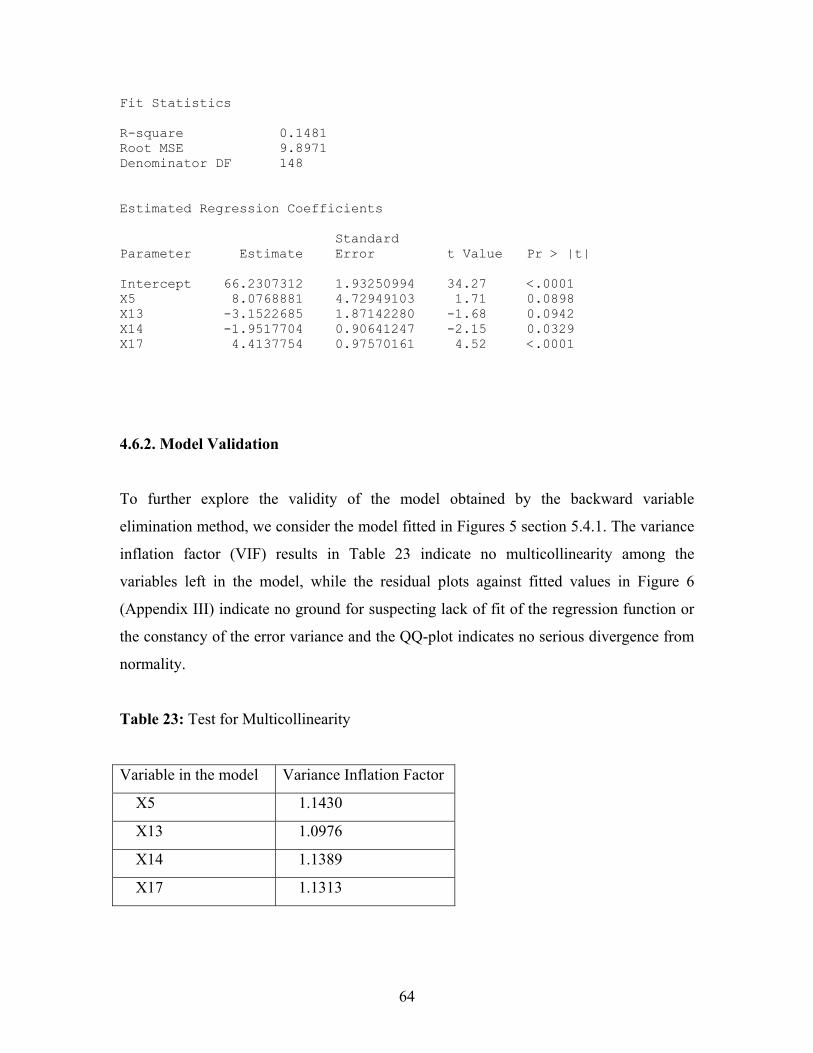
64
Fit Statistics R-square 0.1481 Root MSE 9.8971 Denominator DF 148 Estimated Regression Coefficients Standard Parameter Estimate Error t Value Pr > |t| Intercept 66.2307312 1.93250994 34.27 <.0001 X5 8.0768881 4.72949103 1.71 0.0898 X13 -3.1522685 1.87142280 -1.68 0.0942 X14 -1.9517704 0.90641247 -2.15 0.0329 X17 4.4137754 0.97570161 4.52 <.0001
4.6.2. Model Validation
To further explore the validity of the model obtained by the backward variable
elimination method, we consider the model fitted in Figures 5 section 5.4.1. The variance
inflation factor (VIF) results in Table 23 indicate no multicollinearity among the
variables left in the model, while the residual plots against fitted values in Figure 6
(Appendix III) indicate no ground for suspecting lack of fit of the regression function or
the constancy of the error variance and the QQ-plot indicates no serious divergence from
normality.
Table 23: Test for Multicollinearity
Variable in the model Variance Inflation Factor
X5 1.1430
X13 1.0976
X14 1.1389
X17 1.1313
65
4.6.3. Interpretations of the fitted model
The estimated mean GPA when all predictors in the model are set to zero, is 66.2307.
The estimated mean GPA for all the students enrolled in law field of study is 8.0768
higher compared to the estimated mean GPA of all students enrolled in comprehensive
nursing field of study, keeping all other predictors in the model constant.
The estimated mean GPA of all the students occupying double rooms is 3.1522 lower
compared to the estimated mean GPA of all the students occupying single rooms, keeping
all other predictors in the model constant. Similarly the estimated mean GPA of students
who are not able to study in their rooms during the day is 1.9517 lower compared to the
estimated mean GPA of students who are able to study in their rooms during the day,
keeping all other predictors in the model constant. Finally the estimated mean GPA for
all the students who are self catering is 4.4137 higher compared to the estimated mean
GPA of all students who are receiving their meals either from the campus dinning hall or
campus cafeteria, keeping all other predictors in the model constant.
66
5. CONCLUSIONS
This study has sought to obtain student perceptions of the living and study environments
at the University of Namibia campus residence, and to relate these to student GPA. In
reaching conclusions, we relied mainly on information provided in interviews conducted
with a stratified random sample of students, and GPA data furnished by the University
Registrar.
Statistically, student perceptions do not differ between old and new hostels. However, we
have established an overall association between the time students spent in the hostels and
the type of room the students occupied. Similarly, there is an association between the
students’ perceptions of their ability to study in their rooms during the day and the type of
room, students’ perceptions of their ability to study in their rooms at night and the type of
room, the time the student spent in hostel and the number of times the student changed
blocks, students’ perceptions of their ability to study in their rooms at night and the
availability of study desk in the rooms, students’ perceptions of their ability to study in
their rooms at night and the availability of study lamp in rooms, students’ perceptions of
the effectiveness of UNAM security personnel and students’ perceptions of their safety
studying at classes at night and also students’ perceptions of the effectiveness of UNAM
security personnel and the student opinions on whether the security on campus should
remain unchanged, respectively. Although there is no overall association between type of
room and student perceptions of safety in their room, and student perceptions of ability to
study in room at night and study chair in room, within some strata these variables are
associated.
On the library facilities, 58.5 percent of the students reported that the library does not
provide them with sufficient study materials. In particular these students have highlighted
insufficiency of books pertaining to their courses, inadequate computer and internet
facilities and the lack of assistance from the librarians as their main reasons. The
percentage of students who reported that they feel safe in their rooms is 78.9 percent and
those who have reported that they feel safe studying at classes at night is 50.6 percent.
67
The reasons given by the students who feel unsafe in their rooms or studying at classes at
night was the lack of security personnel and insufficient lighting around the campus, lack
of fire safety materials such as extinguisher and poor quality doors and locks. On the
effectiveness of security personnel in maintaining high level of safety on campus, only
11.5 percent of the students reported that the UNAM security personnel are highly
effective in executing their duties, while 56.8 percent reported that the UNAM security
personnel are moderately effective, and the percentage of the students who reported that
the UNAM security personnel are ineffective in maintaining high level of safety on
campus is 31.8 percent.
We have also established that the mean GPA differs with respect to the time students
spent in hostel, number of times students change blocks, students’ current year of study,
time spent on study, type of room a student occupies, the students’ reported ability to
study in their rooms during the day, students who are self catering, student perception of
sufficiency of water supply in blocks, students enrolled in Law and B.Commerce field of
study and with students receiving financial support in the form of loans.
The regression model presented in Figure 5 was found to explain the relationship
between student GPA and students enrolled in law field of study, students occupying
double rooms, students who are not able to study in their rooms during the day and
students who are self catering. The total variation in student GPA is reduced by 14.81
percent when the students enrolled in law field of study, students occupying double
rooms, students who are not able to study in their rooms during the day and students who
are self catering are considered. The interpretation given to this model is that, the
estimated mean GPA when all predictors in the model are set to zero, is 66.2307. The
estimated mean GPA for all the students enrolled in law field of study is 8.0768 higher
compared to the estimated mean GPA of all students enrolled in comprehensive nursing
field of study, keeping all other predictors in the model constant.
The estimated mean GPA of all the students occupying double rooms is 3.1522 lower
compared to the estimated mean GPA of all the students occupying single rooms, keeping
68
all other predictors in the model constant. Similarly the estimated mean GPA of students
who are not able to study in their rooms during the day is 1.9517 lower compared to the
estimated mean GPA of students who are able to study in their rooms during the day,
keeping all other predictors in the model constant. Finally the estimated mean GPA for
all the students who are self catering is 4.4137 higher compared to the estimated mean
GPA of all students who are receiving their meals either from the campus dinning hall or
campus cafeteria, keeping all other predictors in the model constant.

69
Appendix I
A QUESTIONNAIRE ON
Resident Student Perceptions of On-Campus Living and Study
Environments at the University of Namibia and their Relation
to Academic Performance
This study is being conducted in conjunction with the Department of Statistics at the
University of Namibia
For inquiries conduct:
Isak Neema
Department of Statistics
Office number: W254
Tel: 206 – 3495
Email: [email protected]
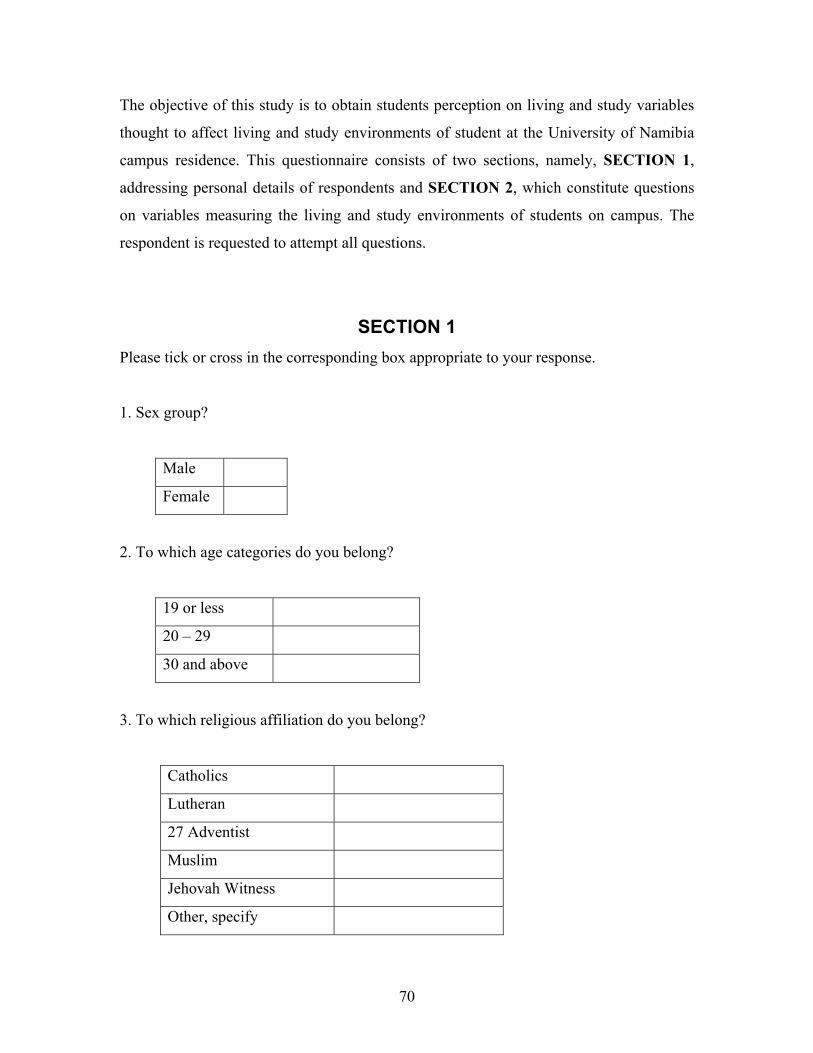
70
The objective of this study is to obtain students perception on living and study variables
thought to affect living and study environments of student at the University of Namibia
campus residence. This questionnaire consists of two sections, namely, SECTION 1,
addressing personal details of respondents and SECTION 2, which constitute questions
on variables measuring the living and study environments of students on campus. The
respondent is requested to attempt all questions.
SECTION 1 Please tick or cross in the corresponding box appropriate to your response.
1. Sex group?
Male
Female
2. To which age categories do you belong?
19 or less
20 – 29
30 and above
3. To which religious affiliation do you belong?
Catholics
Lutheran
27 Adventist
Muslim
Jehovah Witness
Other, specify
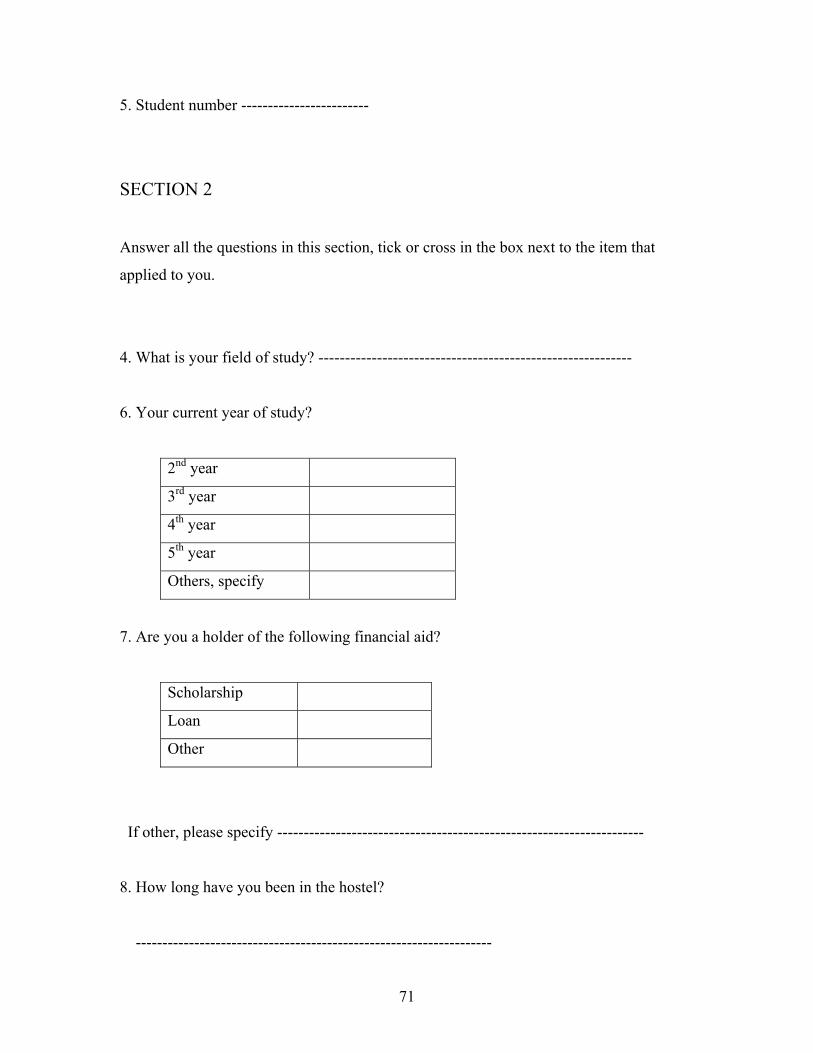
71
5. Student number ------------------------
SECTION 2
Answer all the questions in this section, tick or cross in the box next to the item that
applied to you.
4. What is your field of study? -----------------------------------------------------------
6. Your current year of study?
2nd year
3rd year
4th year
5th year
Others, specify
7. Are you a holder of the following financial aid?
Scholarship
Loan
Other
If other, please specify ---------------------------------------------------------------------
8. How long have you been in the hostel?
-------------------------------------------------------------------
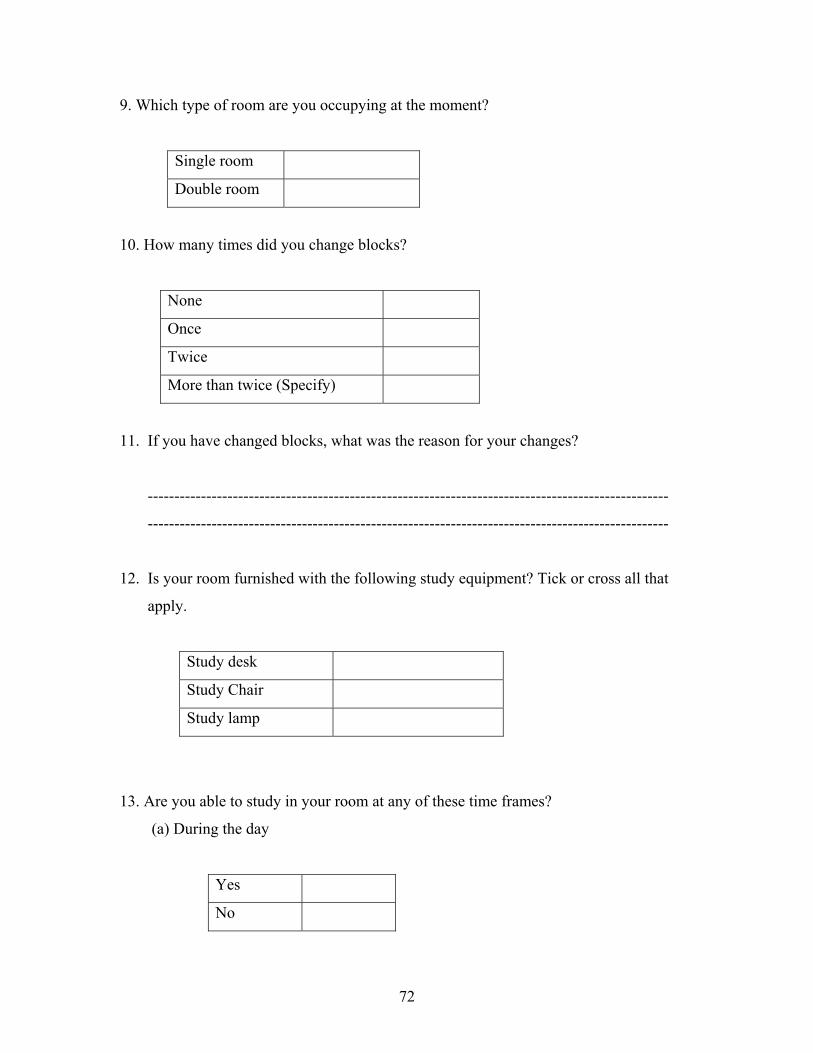
72
9. Which type of room are you occupying at the moment?
Single room
Double room
10. How many times did you change blocks?
None
Once
Twice
More than twice (Specify)
11. If you have changed blocks, what was the reason for your changes?
--------------------------------------------------------------------------------------------------
--------------------------------------------------------------------------------------------------
12. Is your room furnished with the following study equipment? Tick or cross all that
apply.
Study desk
Study Chair
Study lamp
13. Are you able to study in your room at any of these time frames?
(a) During the day
Yes
No
73
If No, why?
--------------------------------------------------------------------------------------------------
--------------------------------------------------------------------------------------------------
(b) At night
Yes
No
If No, why?
---------------------------------------------------------------------------------------------------
---------------------------------------------------------------------------------------------------
14. How many hours do you spend on your studies each day, after the normal lectures?
2 hours or less
3 hours
4 hours
5 or more
15. Do you get your meals from any of the following catering departments? Tick all that
applies to you.
Campus Dinning hall
Campus cafeteria
Others
If others, please specify --------------------------------------------------------------------------
16. If you get your meals from the campus dinning hall or cafeteria, is the food,
(a) Properly prepared?
74
Yes
No
(b) Is it adequate?
Yes
No
17. Are you satisfied with the level of services this two catering departments provides?
Yes
No
If No, why
--------------------------------------------------------------------------------------------------
18. Is there enough study rooms apart from students bedding room, available on campus
that one can make use of?
Yes
No
19. If Yes, are this study rooms adequately well equipped in terms of study desk, chairs,
light and noise free?
-------------------------------------------------------------------------------------------------------
-------------------------------------------------------------------------------------------------------
20. Does the Library provide you with adequate study materials and internet facilities to
help you in your academic work?
75
Yes
No
If no, why?
----------------------------------------------------------------------------------------------------
------------------------------------------------------------------------------------------------------
21. Is there adequate water supply in your block?
Yes
No
22. Do you feel safe in your room?
Yes
No
If no, why?
------------------------------------------------------------------------------------------------
------------------------------------------------------------------------------------------------
23. Do you feel safe studying at classes at night?
Yes
No
If no, why?
------------------------------------------------------------------------------------------------
------------------------------------------------------------------------------------------------
76
24. How effective do you think UNAM Security personnel are?
Highly effective
Moderate
Completely ineffective
Don’t know
25. Do you think security on campus needs considerable improvement? If yes, what kind
of improvement is needed in order to guarantee tight safety on campus?
---------------------------------------------------------------------------------------------------
---------------------------------------------------------------------------------------------------
---------------------------------------------------------------------------------------------------
26. In your opinion, what should be done to improve learning environment on campus?
---------------------------------------------------------------------------------------------------
---------------------------------------------------------------------------------------------------
---------------------------------------------------------------------------------------------------
---------------------------------------------------------------------------------------------------
We recognize how busy you must be and greatly appreciate you taking time to complete
this questionnaire.
THANK YOU!
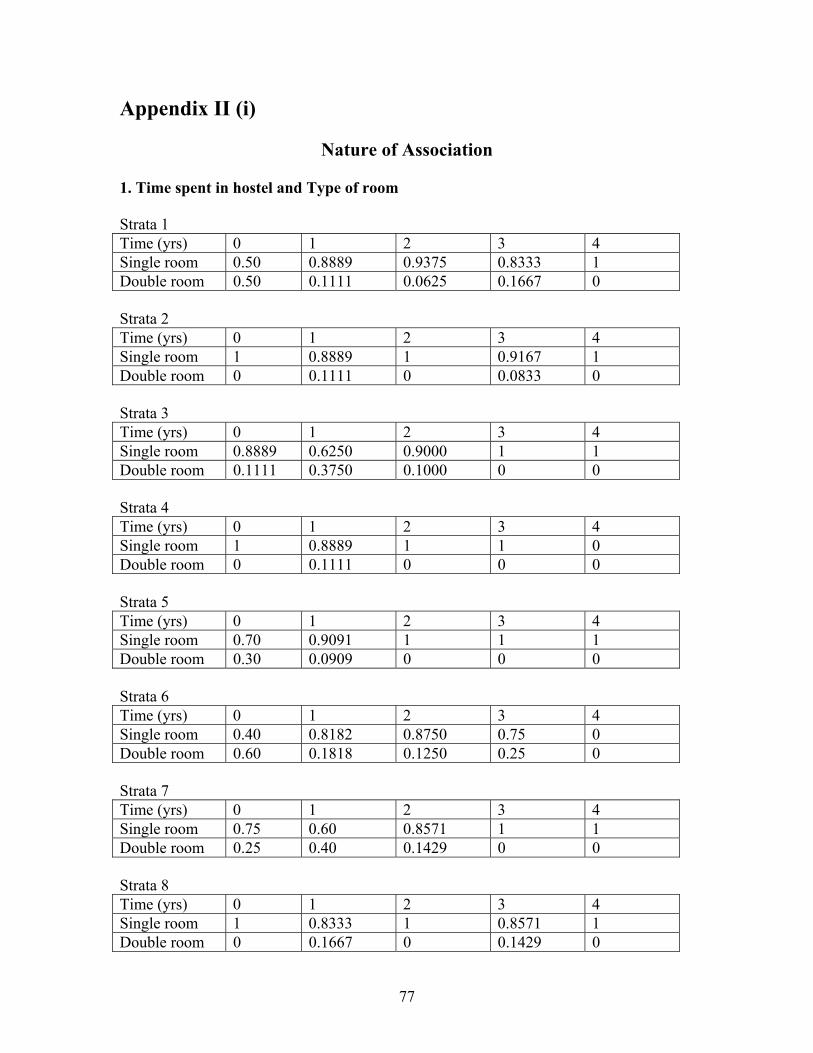
77
Appendix II (i)
Nature of Association 1. Time spent in hostel and Type of room Strata 1 Time (yrs) 0 1 2 3 4 Single room 0.50 0.8889 0.9375 0.8333 1 Double room 0.50 0.1111 0.0625 0.1667 0 Strata 2 Time (yrs) 0 1 2 3 4 Single room 1 0.8889 1 0.9167 1 Double room 0 0.1111 0 0.0833 0 Strata 3 Time (yrs) 0 1 2 3 4 Single room 0.8889 0.6250 0.9000 1 1 Double room 0.1111 0.3750 0.1000 0 0 Strata 4 Time (yrs) 0 1 2 3 4 Single room 1 0.8889 1 1 0 Double room 0 0.1111 0 0 0 Strata 5 Time (yrs) 0 1 2 3 4 Single room 0.70 0.9091 1 1 1 Double room 0.30 0.0909 0 0 0 Strata 6 Time (yrs) 0 1 2 3 4 Single room 0.40 0.8182 0.8750 0.75 0 Double room 0.60 0.1818 0.1250 0.25 0 Strata 7 Time (yrs) 0 1 2 3 4 Single room 0.75 0.60 0.8571 1 1 Double room 0.25 0.40 0.1429 0 0 Strata 8 Time (yrs) 0 1 2 3 4 Single room 1 0.8333 1 0.8571 1 Double room 0 0.1667 0 0.1429 0
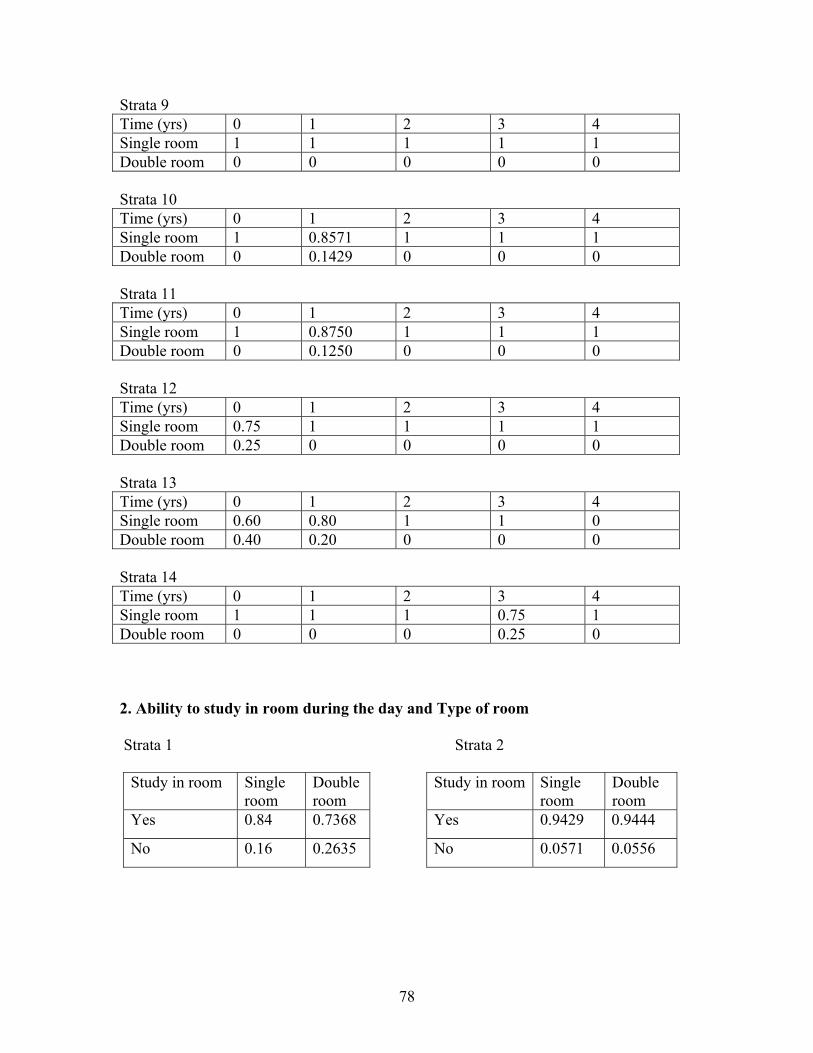
78
Strata 9 Time (yrs) 0 1 2 3 4 Single room 1 1 1 1 1 Double room 0 0 0 0 0 Strata 10 Time (yrs) 0 1 2 3 4 Single room 1 0.8571 1 1 1 Double room 0 0.1429 0 0 0 Strata 11 Time (yrs) 0 1 2 3 4 Single room 1 0.8750 1 1 1 Double room 0 0.1250 0 0 0 Strata 12 Time (yrs) 0 1 2 3 4 Single room 0.75 1 1 1 1 Double room 0.25 0 0 0 0 Strata 13 Time (yrs) 0 1 2 3 4 Single room 0.60 0.80 1 1 0 Double room 0.40 0.20 0 0 0 Strata 14 Time (yrs) 0 1 2 3 4 Single room 1 1 1 0.75 1 Double room 0 0 0 0.25 0 2. Ability to study in room during the day and Type of room Strata 1 Strata 2
Study in room Single room
Double room
Study in room Single room
Double room
Yes 0.84 0.7368 Yes 0.9429 0.9444
No 0.16 0.2635 No 0.0571 0.0556
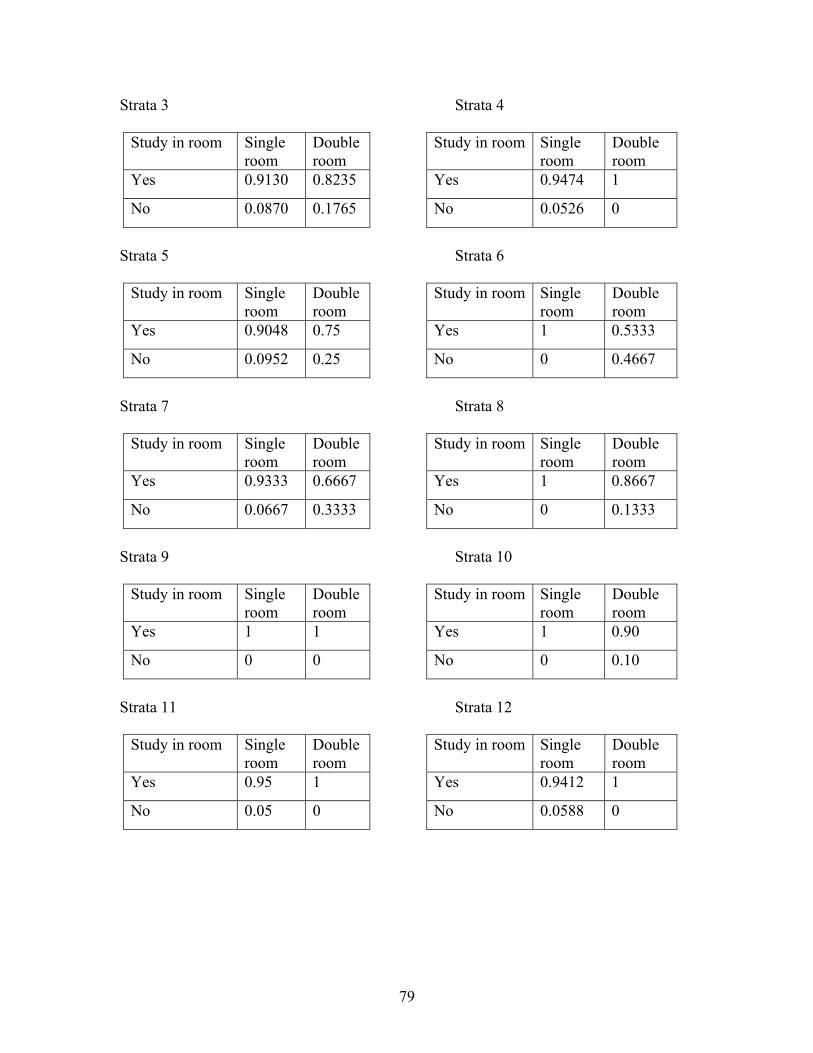
79
Strata 3 Strata 4
Study in room Single room
Double room
Study in room Single room
Double room
Yes 0.9130 0.8235 Yes 0.9474 1
No 0.0870 0.1765 No 0.0526 0
Strata 5 Strata 6
Study in room Single room
Double room
Study in room Single room
Double room
Yes 0.9048 0.75 Yes 1 0.5333
No 0.0952 0.25 No 0 0.4667
Strata 7 Strata 8
Study in room Single room
Double room
Study in room Single room
Double room
Yes 0.9333 0.6667 Yes 1 0.8667
No 0.0667 0.3333 No 0 0.1333
Strata 9 Strata 10
Study in room Single room
Double room
Study in room Single room
Double room
Yes 1 1 Yes 1 0.90
No 0 0 No 0 0.10
Strata 11 Strata 12
Study in room Single room
Double room
Study in room Single room
Double room
Yes 0.95 1 Yes 0.9412 1
No 0.05 0 No 0.0588 0
80
Strata 13 Strata 14
Study in room Single room
Double room
Study in room Single room
Double room
Yes 0.8333 0.8462 Yes 1 0.90
No 0.1667 0.1538 No 0 0.10
3. Ability to study in room at night and Type of room Strata 1 Strata 2
Study in room Single room
Double room
Study in room Single room
Double room
Yes 0.8529 0.60 Yes 0.9268 1
No 0.1471 0.40 No 0.0732 0
Strata 3 Strata 4
Study in room Single room
Double room
Study in room Single room
Double room
Yes 0.8571 1 Yes 0.9524 1
No 0.1429 0 No 0.0476 0
Strata 5 Strata 6
Study in room Single room
Double room
Study in room Single room
Double room
Yes 0.9091 0.7145 Yes 0.7727 0.6667
No 0.0909 0.2857 No 0.2273 0.3333
Strata 7 Strata 8
Study in room Single room
Double room
Study in room Single room
Double room
Yes 0.8421 0.7143 Yes 0.9231 1
No 0.1579 0.2857 No 0.0769 0
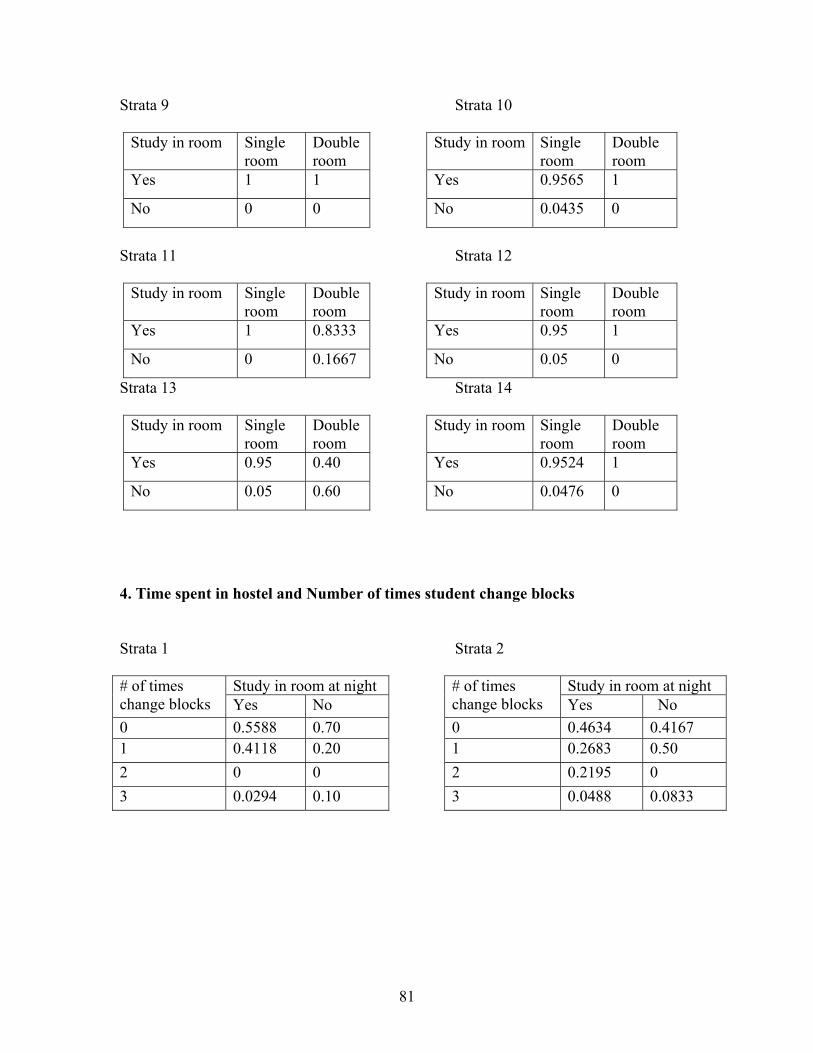
81
Strata 9 Strata 10
Study in room Single room
Double room
Study in room Single room
Double room
Yes 1 1 Yes 0.9565 1
No 0 0 No 0.0435 0
Strata 11 Strata 12
Study in room Single room
Double room
Study in room Single room
Double room
Yes 1 0.8333 Yes 0.95 1
No 0 0.1667 No 0.05 0
Strata 13 Strata 14
Study in room Single room
Double room
Study in room Single room
Double room
Yes 0.95 0.40 Yes 0.9524 1
No 0.05 0.60 No 0.0476 0
4. Time spent in hostel and Number of times student change blocks Strata 1 Strata 2
Study in room at night Study in room at night # of times change blocks Yes No
# of times change blocks Yes No
0 0.5588 0.70 0 0.4634 0.4167 1 0.4118 0.20 1 0.2683 0.50 2 0 0 2 0.2195 0 3 0.0294 0.10 3 0.0488 0.0833
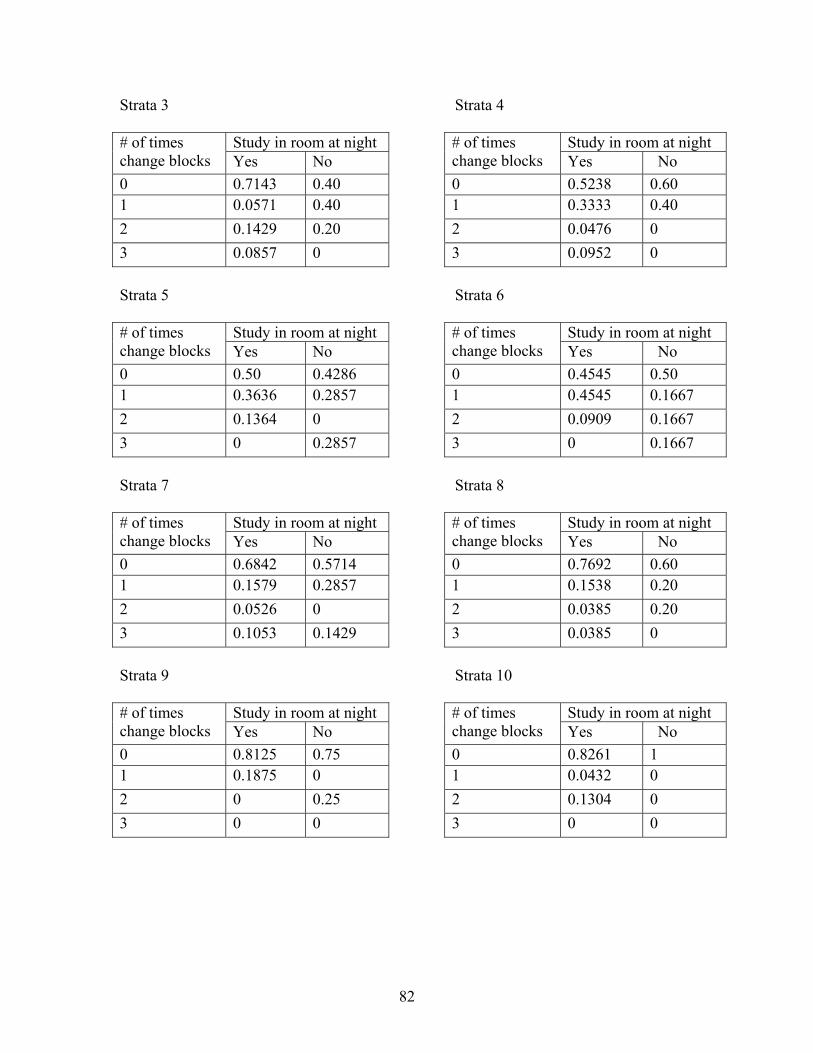
82
Strata 3 Strata 4
Study in room at night Study in room at night # of times change blocks Yes No
# of times change blocks Yes No
0 0.7143 0.40 0 0.5238 0.60 1 0.0571 0.40 1 0.3333 0.40 2 0.1429 0.20 2 0.0476 0 3 0.0857 0 3 0.0952 0 Strata 5 Strata 6
Study in room at night Study in room at night # of times change blocks Yes No
# of times change blocks Yes No
0 0.50 0.4286 0 0.4545 0.50 1 0.3636 0.2857 1 0.4545 0.1667 2 0.1364 0 2 0.0909 0.1667 3 0 0.2857 3 0 0.1667 Strata 7 Strata 8
Study in room at night Study in room at night # of times change blocks Yes No
# of times change blocks Yes No
0 0.6842 0.5714 0 0.7692 0.60 1 0.1579 0.2857 1 0.1538 0.20 2 0.0526 0 2 0.0385 0.20 3 0.1053 0.1429 3 0.0385 0 Strata 9 Strata 10
Study in room at night Study in room at night # of times change blocks Yes No
# of times change blocks Yes No
0 0.8125 0.75 0 0.8261 1 1 0.1875 0 1 0.0432 0 2 0 0.25 2 0.1304 0 3 0 0 3 0 0
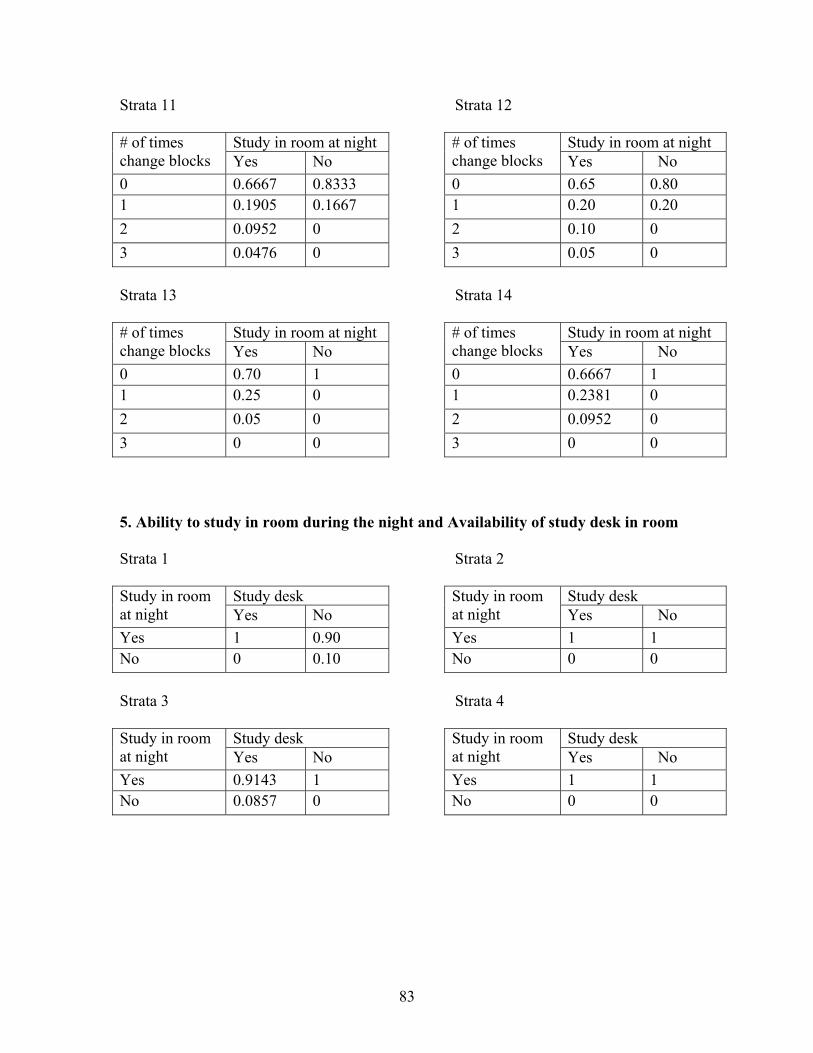
83
Strata 11 Strata 12
Study in room at night Study in room at night # of times change blocks Yes No
# of times change blocks Yes No
0 0.6667 0.8333 0 0.65 0.80 1 0.1905 0.1667 1 0.20 0.20 2 0.0952 0 2 0.10 0 3 0.0476 0 3 0.05 0 Strata 13 Strata 14
Study in room at night Study in room at night # of times change blocks Yes No
# of times change blocks Yes No
0 0.70 1 0 0.6667 1 1 0.25 0 1 0.2381 0 2 0.05 0 2 0.0952 0 3 0 0 3 0 0 5. Ability to study in room during the night and Availability of study desk in room Strata 1 Strata 2
Study desk Study desk Study in room at night Yes No
Study in room at night Yes No
Yes 1 0.90 Yes 1 1 No 0 0.10 No 0 0 Strata 3 Strata 4
Study desk Study desk Study in room at night Yes No
Study in room at night Yes No
Yes 0.9143 1 Yes 1 1 No 0.0857 0 No 0 0
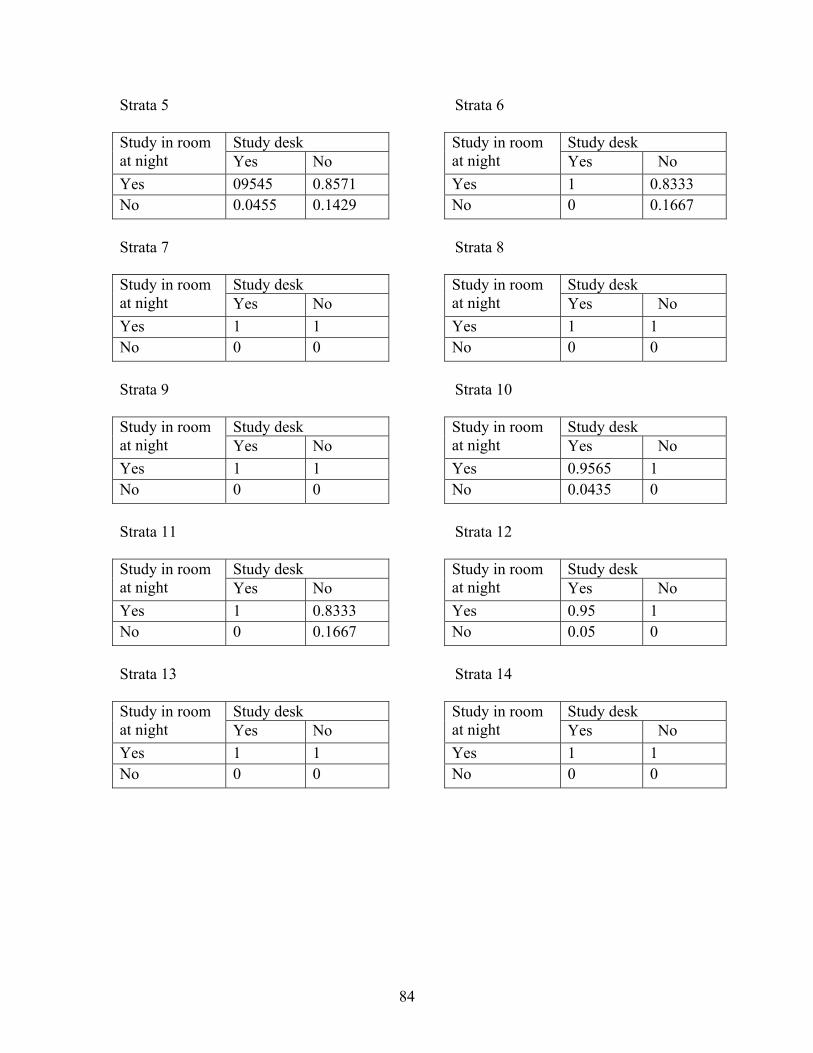
84
Strata 5 Strata 6
Study desk Study desk Study in room at night Yes No
Study in room at night Yes No
Yes 09545 0.8571 Yes 1 0.8333 No 0.0455 0.1429 No 0 0.1667 Strata 7 Strata 8
Study desk Study desk Study in room at night Yes No
Study in room at night Yes No
Yes 1 1 Yes 1 1 No 0 0 No 0 0 Strata 9 Strata 10
Study desk Study desk Study in room at night Yes No
Study in room at night Yes No
Yes 1 1 Yes 0.9565 1 No 0 0 No 0.0435 0 Strata 11 Strata 12
Study desk Study desk Study in room at night Yes No
Study in room at night Yes No
Yes 1 0.8333 Yes 0.95 1 No 0 0.1667 No 0.05 0 Strata 13 Strata 14
Study desk Study desk Study in room at night Yes No
Study in room at night Yes No
Yes 1 1 Yes 1 1 No 0 0 No 0 0
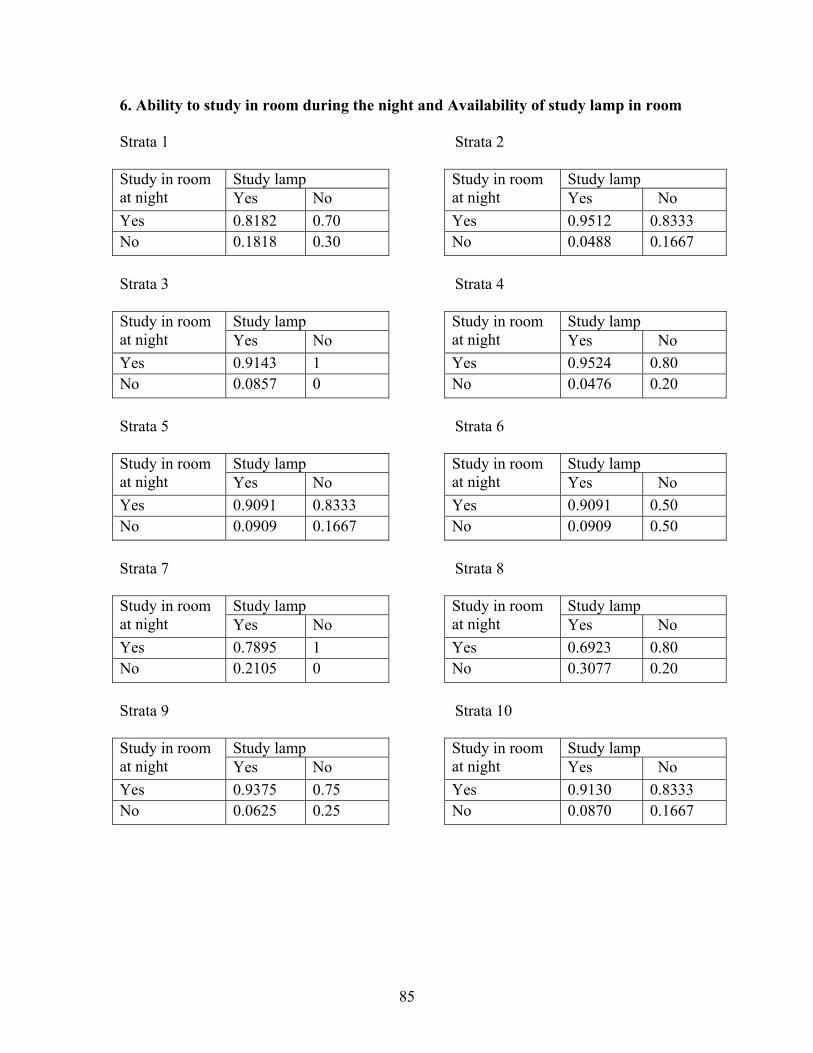
85
6. Ability to study in room during the night and Availability of study lamp in room Strata 1 Strata 2
Study lamp Study lamp Study in room at night Yes No
Study in room at night Yes No
Yes 0.8182 0.70 Yes 0.9512 0.8333 No 0.1818 0.30 No 0.0488 0.1667 Strata 3 Strata 4
Study lamp Study lamp Study in room at night Yes No
Study in room at night Yes No
Yes 0.9143 1 Yes 0.9524 0.80 No 0.0857 0 No 0.0476 0.20 Strata 5 Strata 6
Study lamp Study lamp Study in room at night Yes No
Study in room at night Yes No
Yes 0.9091 0.8333 Yes 0.9091 0.50 No 0.0909 0.1667 No 0.0909 0.50 Strata 7 Strata 8
Study lamp Study lamp Study in room at night Yes No
Study in room at night Yes No
Yes 0.7895 1 Yes 0.6923 0.80 No 0.2105 0 No 0.3077 0.20 Strata 9 Strata 10
Study lamp Study lamp Study in room at night Yes No
Study in room at night Yes No
Yes 0.9375 0.75 Yes 0.9130 0.8333 No 0.0625 0.25 No 0.0870 0.1667
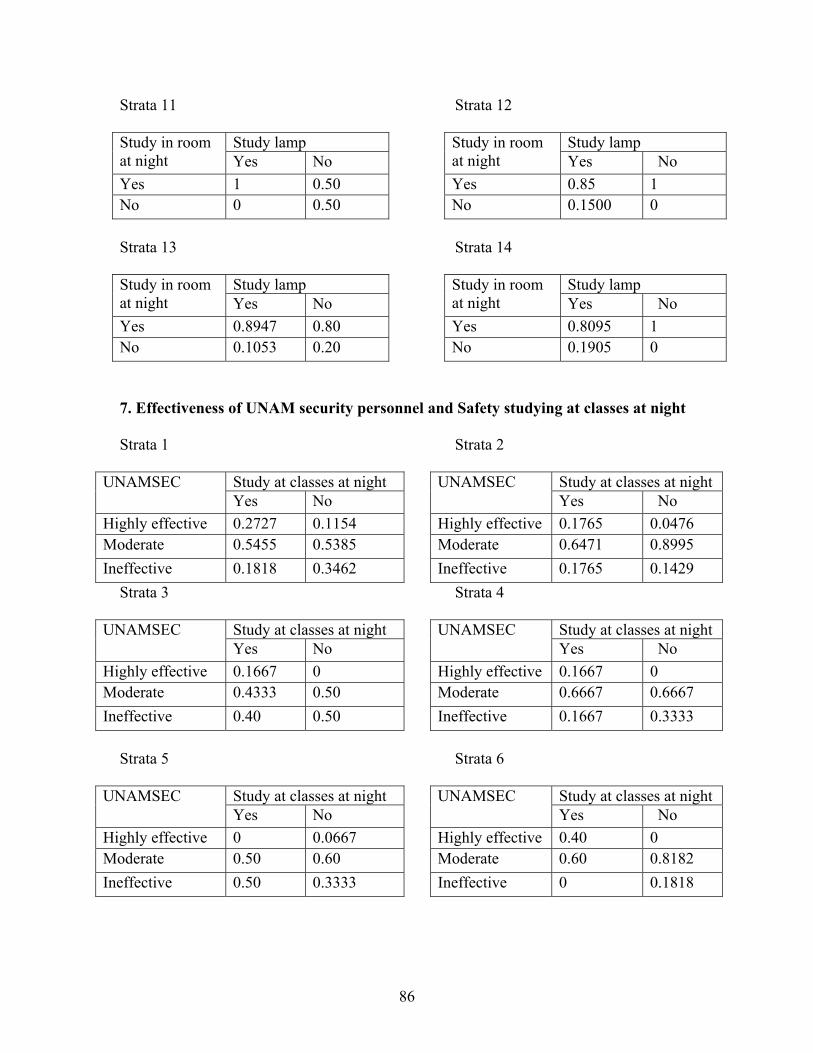
86
Strata 11 Strata 12
Study lamp Study lamp Study in room at night Yes No
Study in room at night Yes No
Yes 1 0.50 Yes 0.85 1 No 0 0.50 No 0.1500 0 Strata 13 Strata 14
Study lamp Study lamp Study in room at night Yes No
Study in room at night Yes No
Yes 0.8947 0.80 Yes 0.8095 1 No 0.1053 0.20 No 0.1905 0 7. Effectiveness of UNAM security personnel and Safety studying at classes at night Strata 1 Strata 2
Study at classes at night Study at classes at night UNAMSEC Yes No
UNAMSEC Yes No
Highly effective 0.2727 0.1154 Highly effective 0.1765 0.0476 Moderate 0.5455 0.5385 Moderate 0.6471 0.8995 Ineffective 0.1818 0.3462 Ineffective 0.1765 0.1429
Strata 3 Strata 4
Study at classes at night Study at classes at night UNAMSEC Yes No
UNAMSEC Yes No
Highly effective 0.1667 0 Highly effective 0.1667 0 Moderate 0.4333 0.50 Moderate 0.6667 0.6667 Ineffective 0.40 0.50 Ineffective 0.1667 0.3333
Strata 5 Strata 6
Study at classes at night Study at classes at night UNAMSEC Yes No
UNAMSEC Yes No
Highly effective 0 0.0667 Highly effective 0.40 0 Moderate 0.50 0.60 Moderate 0.60 0.8182 Ineffective 0.50 0.3333 Ineffective 0 0.1818
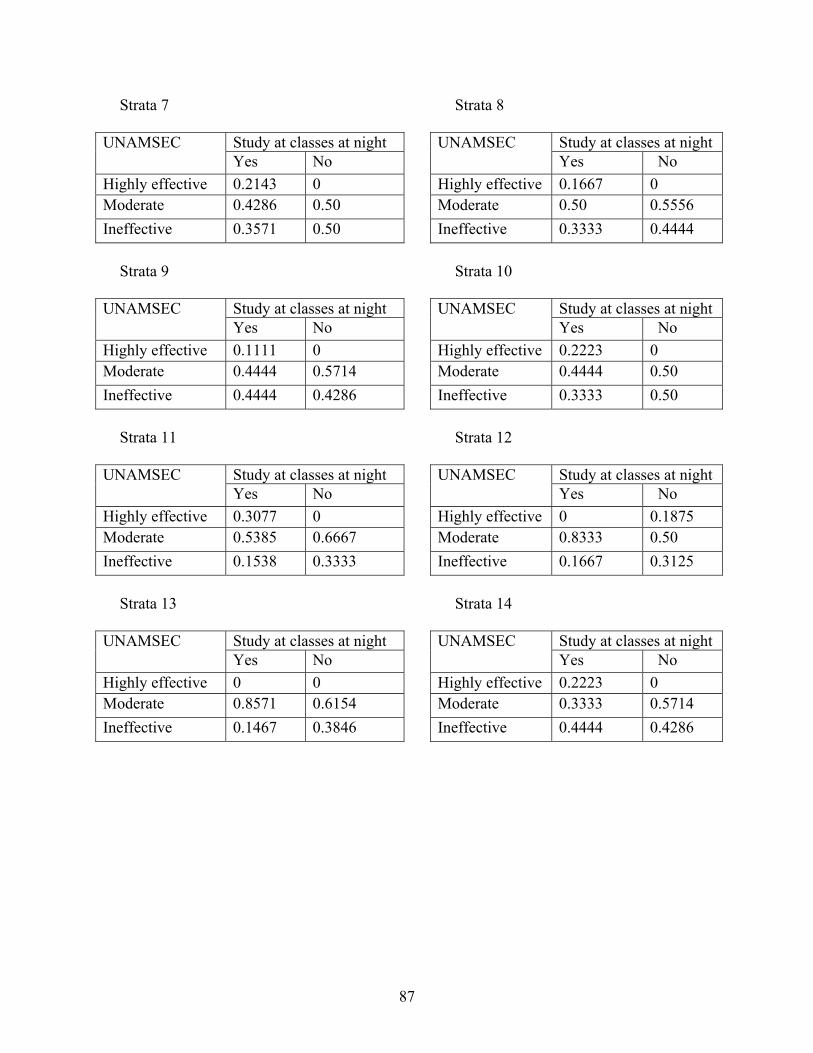
87
Strata 7 Strata 8
Study at classes at night Study at classes at night UNAMSEC Yes No
UNAMSEC Yes No
Highly effective 0.2143 0 Highly effective 0.1667 0 Moderate 0.4286 0.50 Moderate 0.50 0.5556 Ineffective 0.3571 0.50 Ineffective 0.3333 0.4444
Strata 9 Strata 10
Study at classes at night Study at classes at night UNAMSEC Yes No
UNAMSEC Yes No
Highly effective 0.1111 0 Highly effective 0.2223 0 Moderate 0.4444 0.5714 Moderate 0.4444 0.50 Ineffective 0.4444 0.4286 Ineffective 0.3333 0.50
Strata 11 Strata 12
Study at classes at night Study at classes at night UNAMSEC Yes No
UNAMSEC Yes No
Highly effective 0.3077 0 Highly effective 0 0.1875 Moderate 0.5385 0.6667 Moderate 0.8333 0.50 Ineffective 0.1538 0.3333 Ineffective 0.1667 0.3125
Strata 13 Strata 14
Study at classes at night Study at classes at night UNAMSEC Yes No
UNAMSEC Yes No
Highly effective 0 0 Highly effective 0.2223 0 Moderate 0.8571 0.6154 Moderate 0.3333 0.5714 Ineffective 0.1467 0.3846 Ineffective 0.4444 0.4286
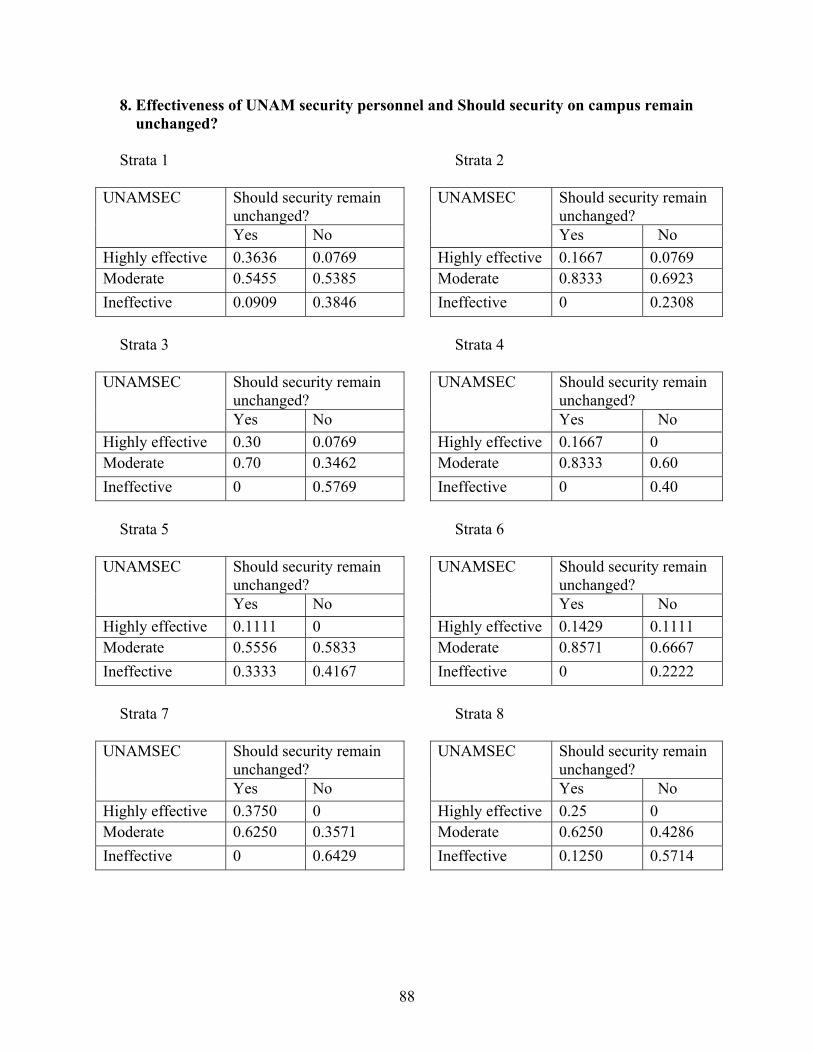
88
8. Effectiveness of UNAM security personnel and Should security on campus remain unchanged? Strata 1 Strata 2
Should security remain unchanged?
Should security remain unchanged?
UNAMSEC
Yes No
UNAMSEC
Yes No Highly effective 0.3636 0.0769 Highly effective 0.1667 0.0769 Moderate 0.5455 0.5385 Moderate 0.8333 0.6923 Ineffective 0.0909 0.3846 Ineffective 0 0.2308
Strata 3 Strata 4
Should security remain unchanged?
Should security remain unchanged?
UNAMSEC
Yes No
UNAMSEC
Yes No Highly effective 0.30 0.0769 Highly effective 0.1667 0 Moderate 0.70 0.3462 Moderate 0.8333 0.60 Ineffective 0 0.5769 Ineffective 0 0.40
Strata 5 Strata 6
Should security remain unchanged?
Should security remain unchanged?
UNAMSEC
Yes No
UNAMSEC
Yes No Highly effective 0.1111 0 Highly effective 0.1429 0.1111 Moderate 0.5556 0.5833 Moderate 0.8571 0.6667 Ineffective 0.3333 0.4167 Ineffective 0 0.2222
Strata 7 Strata 8
Should security remain unchanged?
Should security remain unchanged?
UNAMSEC
Yes No
UNAMSEC
Yes No Highly effective 0.3750 0 Highly effective 0.25 0 Moderate 0.6250 0.3571 Moderate 0.6250 0.4286 Ineffective 0 0.6429 Ineffective 0.1250 0.5714
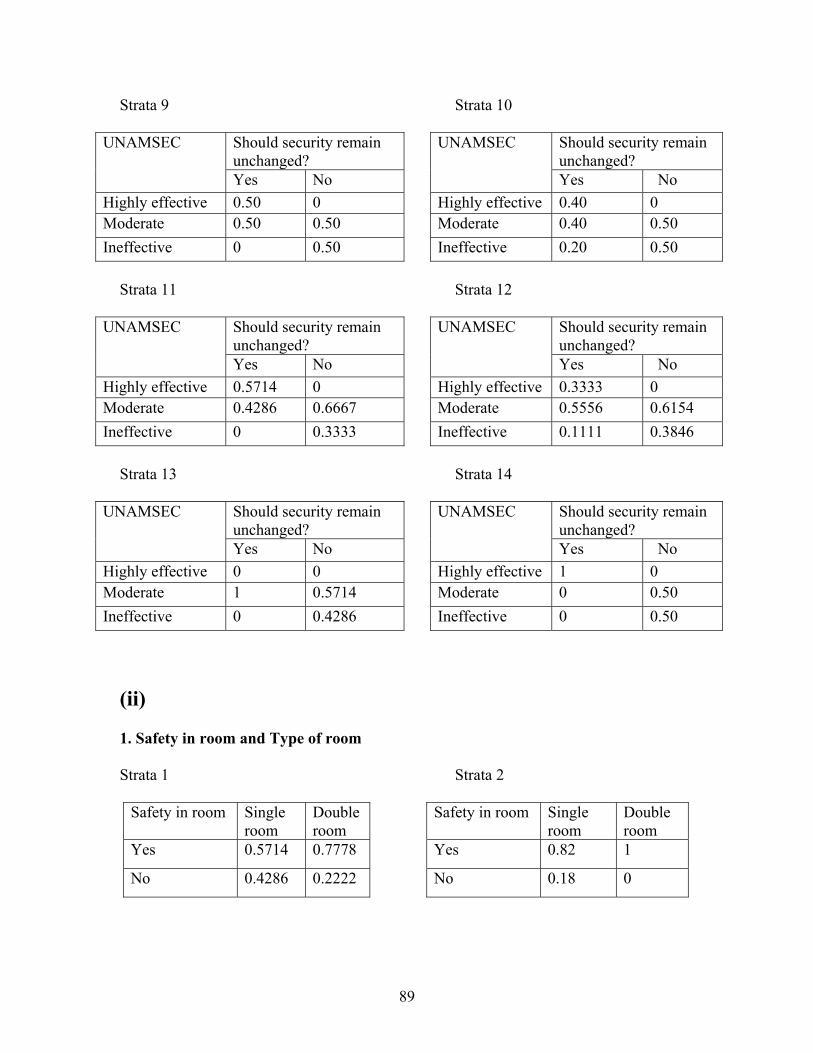
89
Strata 9 Strata 10
Should security remain unchanged?
Should security remain unchanged?
UNAMSEC
Yes No
UNAMSEC
Yes No Highly effective 0.50 0 Highly effective 0.40 0 Moderate 0.50 0.50 Moderate 0.40 0.50 Ineffective 0 0.50 Ineffective 0.20 0.50
Strata 11 Strata 12
Should security remain unchanged?
Should security remain unchanged?
UNAMSEC
Yes No
UNAMSEC
Yes No Highly effective 0.5714 0 Highly effective 0.3333 0 Moderate 0.4286 0.6667 Moderate 0.5556 0.6154 Ineffective 0 0.3333 Ineffective 0.1111 0.3846
Strata 13 Strata 14
Should security remain unchanged?
Should security remain unchanged?
UNAMSEC
Yes No
UNAMSEC
Yes No Highly effective 0 0 Highly effective 1 0 Moderate 1 0.5714 Moderate 0 0.50 Ineffective 0 0.4286 Ineffective 0 0.50
(ii) 1. Safety in room and Type of room Strata 1 Strata 2
Safety in room Single room
Double room
Safety in room Single room
Double room
Yes 0.5714 0.7778 Yes 0.82 1
No 0.4286 0.2222 No 0.18 0
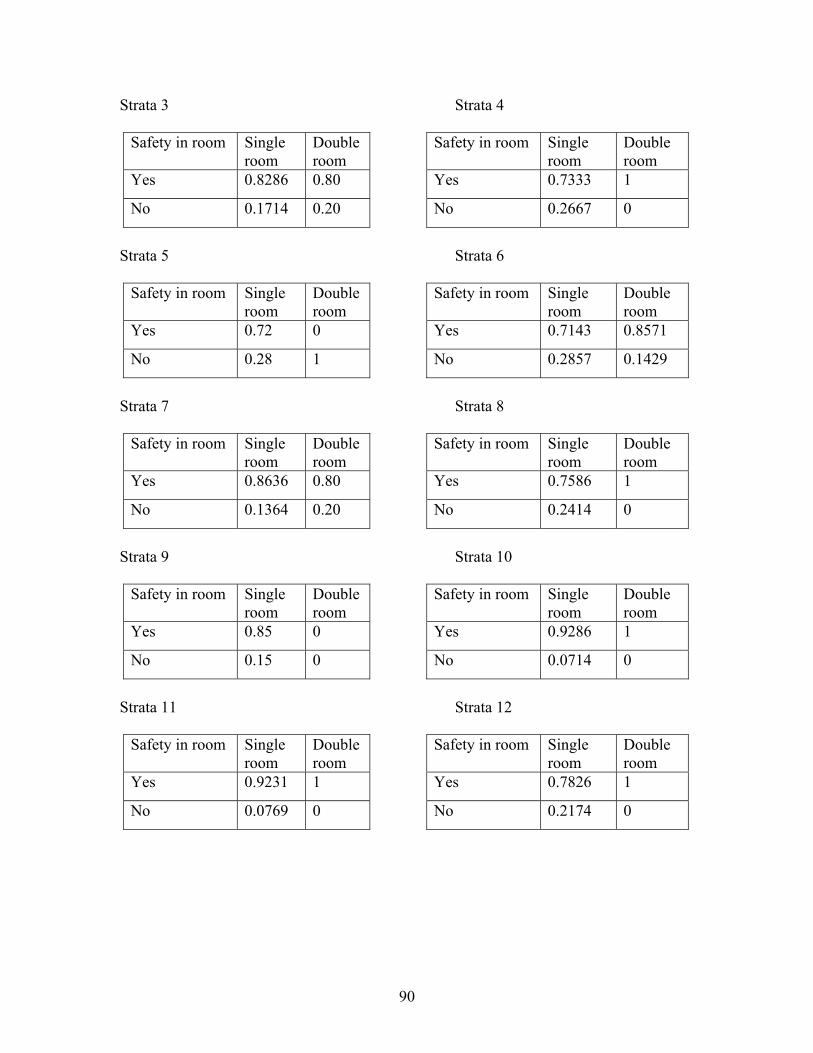
90
Strata 3 Strata 4
Safety in room Single room
Double room
Safety in room Single room
Double room
Yes 0.8286 0.80 Yes 0.7333 1
No 0.1714 0.20 No 0.2667 0
Strata 5 Strata 6
Safety in room Single room
Double room
Safety in room Single room
Double room
Yes 0.72 0 Yes 0.7143 0.8571
No 0.28 1 No 0.2857 0.1429
Strata 7 Strata 8
Safety in room Single room
Double room
Safety in room Single room
Double room
Yes 0.8636 0.80 Yes 0.7586 1
No 0.1364 0.20 No 0.2414 0
Strata 9 Strata 10
Safety in room Single room
Double room
Safety in room Single room
Double room
Yes 0.85 0 Yes 0.9286 1
No 0.15 0 No 0.0714 0
Strata 11 Strata 12
Safety in room Single room
Double room
Safety in room Single room
Double room
Yes 0.9231 1 Yes 0.7826 1
No 0.0769 0 No 0.2174 0
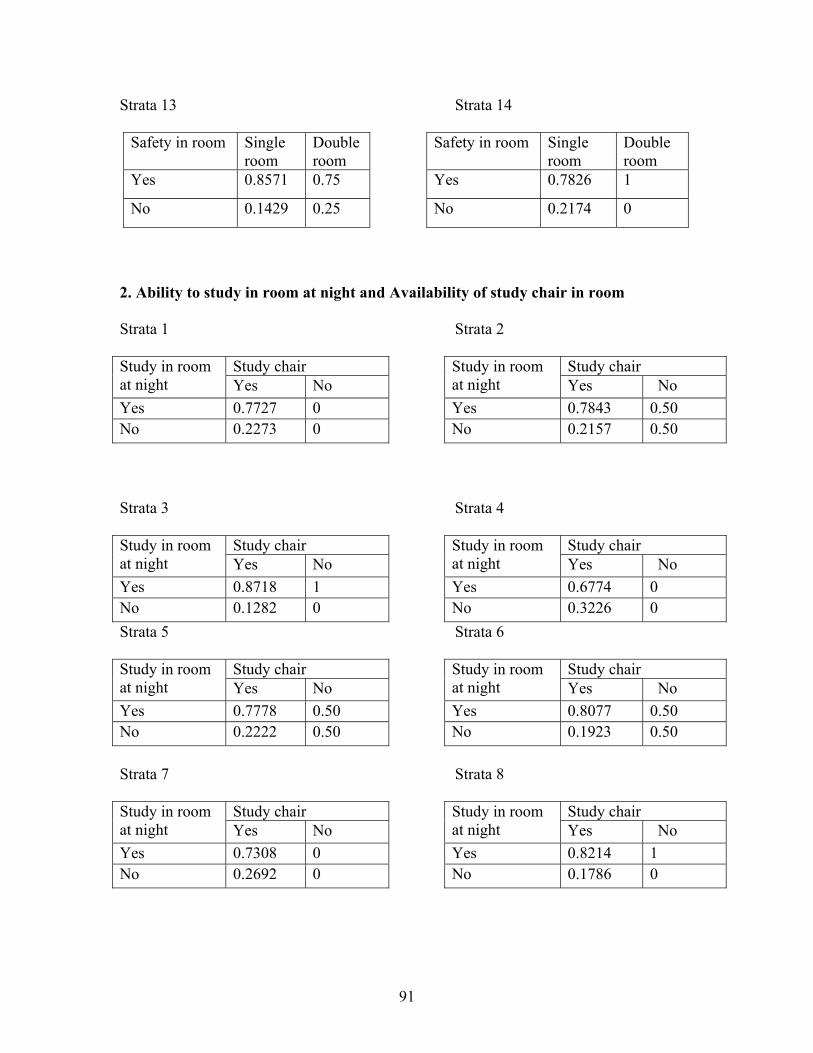
91
Strata 13 Strata 14
Safety in room Single room
Double room
Safety in room Single room
Double room
Yes 0.8571 0.75 Yes 0.7826 1
No 0.1429 0.25 No 0.2174 0
2. Ability to study in room at night and Availability of study chair in room Strata 1 Strata 2
Study chair Study chair Study in room at night Yes No
Study in room at night Yes No
Yes 0.7727 0 Yes 0.7843 0.50 No 0.2273 0 No 0.2157 0.50 Strata 3 Strata 4
Study chair Study chair Study in room at night Yes No
Study in room at night Yes No
Yes 0.8718 1 Yes 0.6774 0 No 0.1282 0 No 0.3226 0 Strata 5 Strata 6
Study chair Study chair Study in room at night Yes No
Study in room at night Yes No
Yes 0.7778 0.50 Yes 0.8077 0.50 No 0.2222 0.50 No 0.1923 0.50 Strata 7 Strata 8
Study chair Study chair Study in room at night Yes No
Study in room at night Yes No
Yes 0.7308 0 Yes 0.8214 1 No 0.2692 0 No 0.1786 0
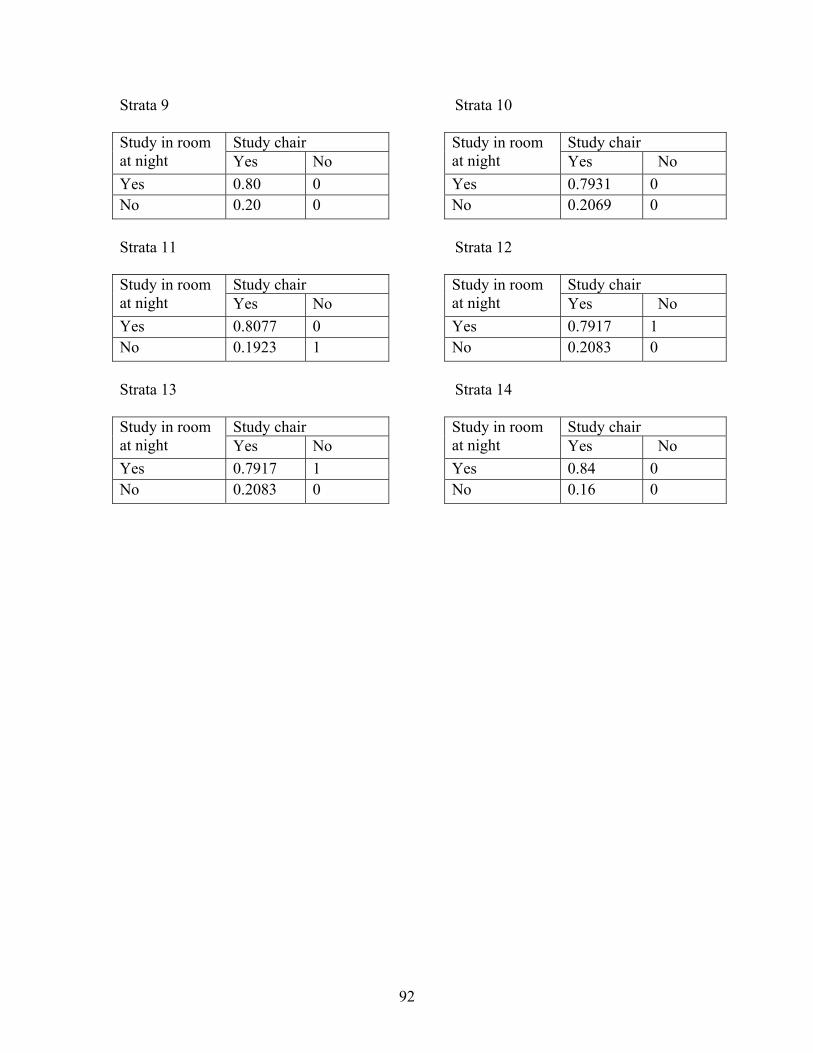
92
Strata 9 Strata 10
Study chair Study chair Study in room at night Yes No
Study in room at night Yes No
Yes 0.80 0 Yes 0.7931 0 No 0.20 0 No 0.2069 0 Strata 11 Strata 12
Study chair Study chair Study in room at night Yes No
Study in room at night Yes No
Yes 0.8077 0 Yes 0.7917 1 No 0.1923 1 No 0.2083 0 Strata 13 Strata 14
Study chair Study chair Study in room at night Yes No
Study in room at night Yes No
Yes 0.7917 1 Yes 0.84 0 No 0.2083 0 No 0.16 0
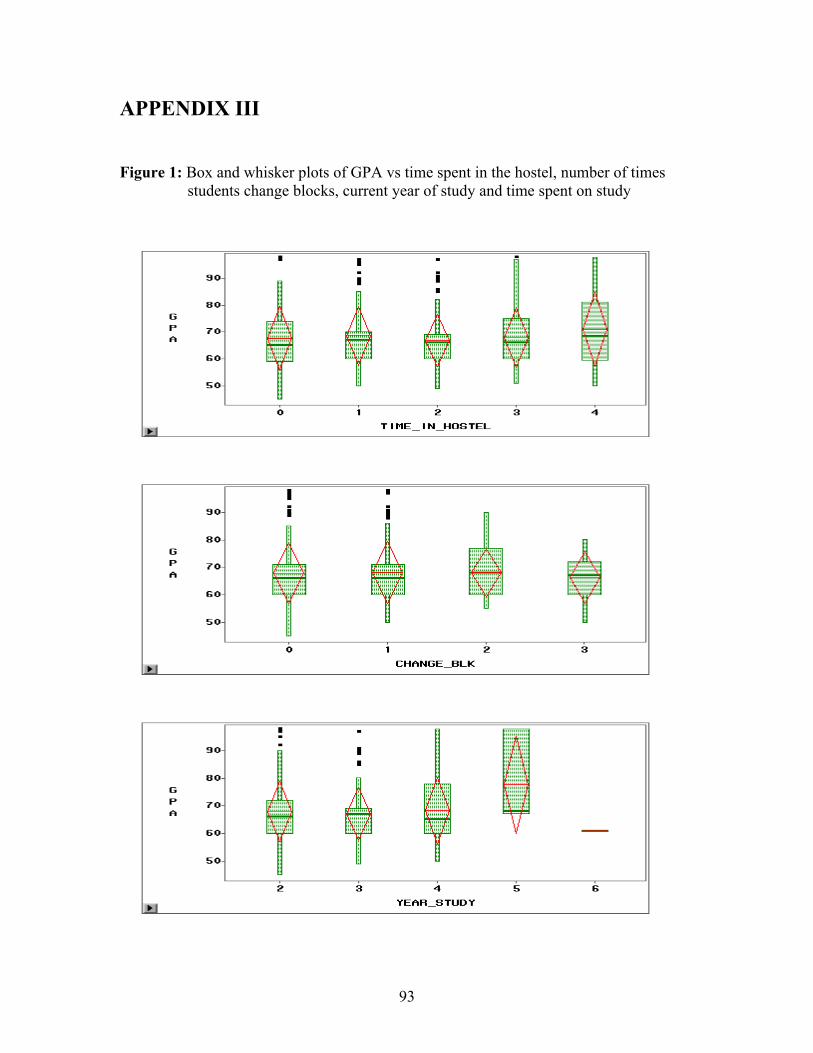
93
APPENDIX III Figure 1: Box and whisker plots of GPA vs time spent in the hostel, number of times students change blocks, current year of study and time spent on study
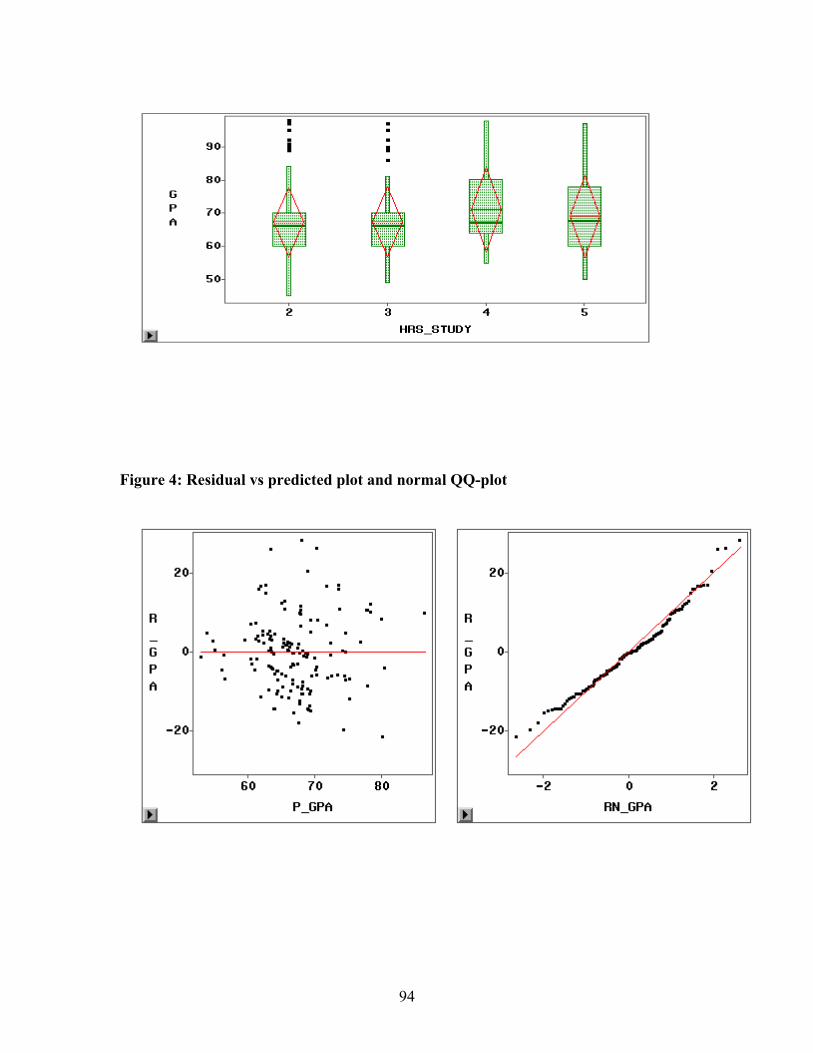
94
Figure 4: Residual vs predicted plot and normal QQ-plot
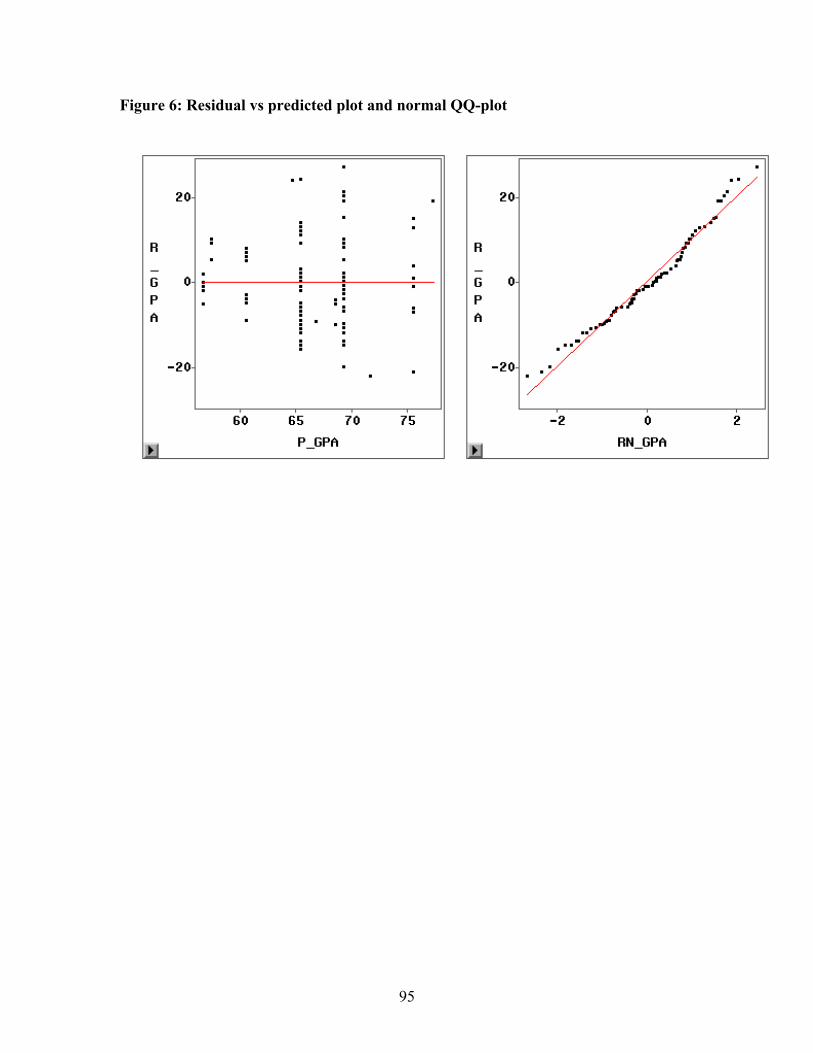
95
Figure 6: Residual vs predicted plot and normal QQ-plot
96
REFERENCES Linda B.Bourque and Eve P.Fielder (1995)
How to conduct self – administered and mail surveys; Volume 3
George W.Cobb (1998)
Introduction to Design and Analysis of Experiments
Donald C. Weber and John H. Skilllings (2000)
A first course in the design of experiments (A linear models approach)
What work requires of schools – A SCANS report for America (2000)
Isadore Newman and Keith McNeil (1998)
Conducting Survey Research in the Social Sciences
Rea L.M and Parker R.A (1992)
Designing and conducting survey research: A comprehensive guide. San Fransisco CA.
Josey Bass
Newman I, Benz C.R, Weis D and McNeil K (1997)
Theses and Dissertations: A guide to writing in the Social and Physical Sciences.
Lanham, MD: University Press of America
Alwin D.F (1978).
Survey Design and analysis: Current issues. Beverly Hills CA, Sage Publications
Fowler F.J (1995)
Improving Survey questions, Design and Evaluation. Thousand Oaks, CA, Sage
Publications
97
Maura E Stokes, Charles S Davis and Gary G Koch (1995)
Categorical Data Analysis using the SAS system: Cary, NC, SAS Institute Inc, NC, USA
Alan Agresti (1990)
Categorical Data Analysis: John Wiley & Sons Inc
Sandra D Schlotzhauer and Ramon C Littell, Ph.D (1991)
SAS System for Elementary Statistical Analysis: SAS Institute Inc, Cary, NC, USA
Jay Devore and Roxy Peck (2001)
The Exploration and analysis of data, Fourth edition, Duxbury, CA 93950, USA
John Neter, Michael H. Kutner, Christopher J. Nachtstein and William Wasserman
(1996)
Applied Linear Regression Models, Third edition, The McGraw-Hill Companies, INC