Reservoir modelling by combination of object …geostats2012.nr.no/pdfs/1745118.doc · Web...
11
Reservoir modeling by combination of object model and SGS for the Ketzin CO2 injection pilot Peter Frykman 1 Abstract Reservoirs in fluvial sequences are generally challenging to model for reservoir properties. This is due to the large contrasts between the different facies associations, the distinct architecture, and the different heterogeneity within each facies association. Therefore a combination of different geostatistical methods is necessary to reflect the multitude of variations. This combination is illustrated with a case study on the pilot CO2 injection site at Ketzin, near Berlin, Germany. For this modelling study has been chosen a 2-step process using first an object modelling tool generating stochastic models of sinuous channel belt bodies within a back-ground matrix. Then the heterogeneity within each channel belt is produced by using a Sequential Gaussian Simulation scheme to populate with petrophysical properties of porosity and permeability. The SGS is used to generate variability with a 1 GEUS – Geological Survey of Denmark and Greenland, Øster Voldgade 10, DK-1350 Copenhagen K, Denmark, PFR@geus. dk Ninth International Geostatistics Congress, Oslo, Norway June 11 – 15, 2012
-
Upload
trinhkhanh -
Category
Documents
-
view
226 -
download
0
Transcript of Reservoir modelling by combination of object …geostats2012.nr.no/pdfs/1745118.doc · Web...

Reservoir modeling by combination of object model and SGS for the Ketzin CO2 injection pilot Peter Frykman1
Abstract Reservoirs in fluvial sequences are generally challenging to model
for reservoir properties. This is due to the large contrasts between the different
facies associations, the distinct architecture, and the different heterogeneity within
each facies association. Therefore a combination of different geostatistical
methods is necessary to reflect the multitude of variations. This combination is
illustrated with a case study on the pilot CO2 injection site at Ketzin, near Berlin,
Germany. For this modelling study has been chosen a 2-step process using first an
object modelling tool generating stochastic models of sinuous channel belt bodies
within a back-ground matrix. Then the heterogeneity within each channel belt is
produced by using a Sequential Gaussian Simulation scheme to populate with
petrophysical properties of porosity and permeability. The SGS is used to
generate variability with a geometry/size mimicking the patchy occurrence of
pointbar and channel fill porous sands within the channel-belts.
Introduction
Modeling of CO2 storage sites in deep saline aquifers is usually associated with very low data density. This places weight on prior regional understanding of the depositional setting including a sequence stratigraphic interpretation to support the understanding of the reservoir architecture. This framework is then populated with conceptual models drawing on experience with analogues and inspiration from literature examples. The uncertainty at the medium and small scale can be captured by scenario variations and geostatistical methods for generating plausible patterns and property distributions.
1 GEUS – Geological Survey of Denmark and Greenland, Øster Voldgade 10, DK-1350 Copenhagen K, Denmark, PFR@geus. dk
Ninth International Geostatistics Congress, Oslo, Norway June 11 – 15, 2012

2
As for other reservoir developments the modeling is also an iterative process as observations from the site characterization arrives, and as special monitoring data are retrieved as part of the storage site development.
The Ketzin pilot site in Germany has been through these different stages of development and is still developing. One stage of this history has involved the creation of a probable geomodel to be used for prediction of reservoir behavior. The combination of the available but limited data at the site and two different geostatistical simulation methods is illustrated here. The advantage of the two-step simulation is that the significant contrasts can be reflected with fairly simple methods.
Modeling methods
There are two basic stochastic simulation approaches commonly used to model fluvial reservoirs: object-based algorithms as traditionally applied, e.g. [7, 5, 8, 11]. The first needs relatively simple input for objects shapes and sizes, but has problems in honoring constraints in an efficient computational way; the MPS requires a geologically realistic training-image, preferably in 3D, which is then used as a template to generate the pattern for heterogeneity. For this also the computation time is an issue.
For this particular modelling study has been chosen a 2-step process using first a traditional object modelling tool generating stochastic models of sinuous channel belt bodies within a back-ground matrix. Then the heterogeneity within each channel belt is produced by using a Sequential Gaussian Simulation scheme to populate with petrophysical properties of porosity and permeability.
The Ketzin model
The Ketzin pilot site was initiated in 2004 as the first demonstration project for geological onshore CO2 storage in Europe within the frame of the EU-FP6 CO2SINK project. The pilot site is located about 25 km west of Berlin in the German federal state of Brandenburg. Since the official start of CO2 injection in June 2008, over 59000 tonnes of CO2 (status March 2012) have been injected into an Upper Triassic saline aquifer reservoir at about 630 to 650 m depth.
The injection horizons are sandstones of the Upper Triassic (Keuper) Stuttgart Formation with variable thickness. The Stuttgart Formation is lithologically heterogeneous, consisting of sandy channel-facies rocks with good reservoir properties alternating with muddy flood plain facies rocks of poor reservoir quality [6, 10]. In distinct areas, the channel sandstones are more frequent, reflecting channel belt fairways. The lateral extension of the channel belts, formed
3
by amalgamation of individual fluvial channels, is assumed to be highly variable. The upper seal of the Stuttgart Formation is the Weser Formation, consisting mainly of clayey and sandy siltstones, which alternate with carbonates and evaporites.
For defining input to the object based modeling, the overall geological setting as an intra-continental fluvial plain, assumption of meandering geometry, and a generally North to South transport direction, have directed the input for the object modeling procedure. The width of the channel belts was set as a range from 100 to 1600 m, guided by the analysis of range of thickness for the pointbar deposits of between 1 and 8 m. The relation between channel belt width, w, and channel thickness, t, has been reported as the ratio w/t = 200 [1]. The channel belt widths used in the present model are between 100 and 1600 m based on the channel sand thickness of 1, 4 and 8 m and on the relationship w/t ranging from 100 to 200. This input conforms to the average relation as given by Bridge & Mackey [2],
The sinuosity of the channel belt is described by an amplitude of 400-1000 m and a wave-length of 5000-9000 m. This is not very well supported by data or analogues from literature.
Figure 1. Vertical section through the Ketzin reservoir facies model showing channel-belt objects (yellow) in the flood-plain background. (Model width 5 km, vertical exaggeration 10x).
This uncertainty about establishing input parameters for fluvial system models have been emphasized by Miall [9], and therefore the models must be supplemented by local data if available, and a range of scenarios should be developed to study the effects on the flow behavior investigated.

4
Figure 2. Layer 15 in the model for facies (area 5x5 km).
The interpretation of the well log data has been described separately [10]. For each of the two facies types (channel/floodplain) the data have been analysed for distribution (histogram), which then has been smoothed and used for a target distribution to use in the petrophysical modeling of porosity within each facies separately.
Figure 3. A single layer in the model showing the effective porosity (PHIE) distribution.

5
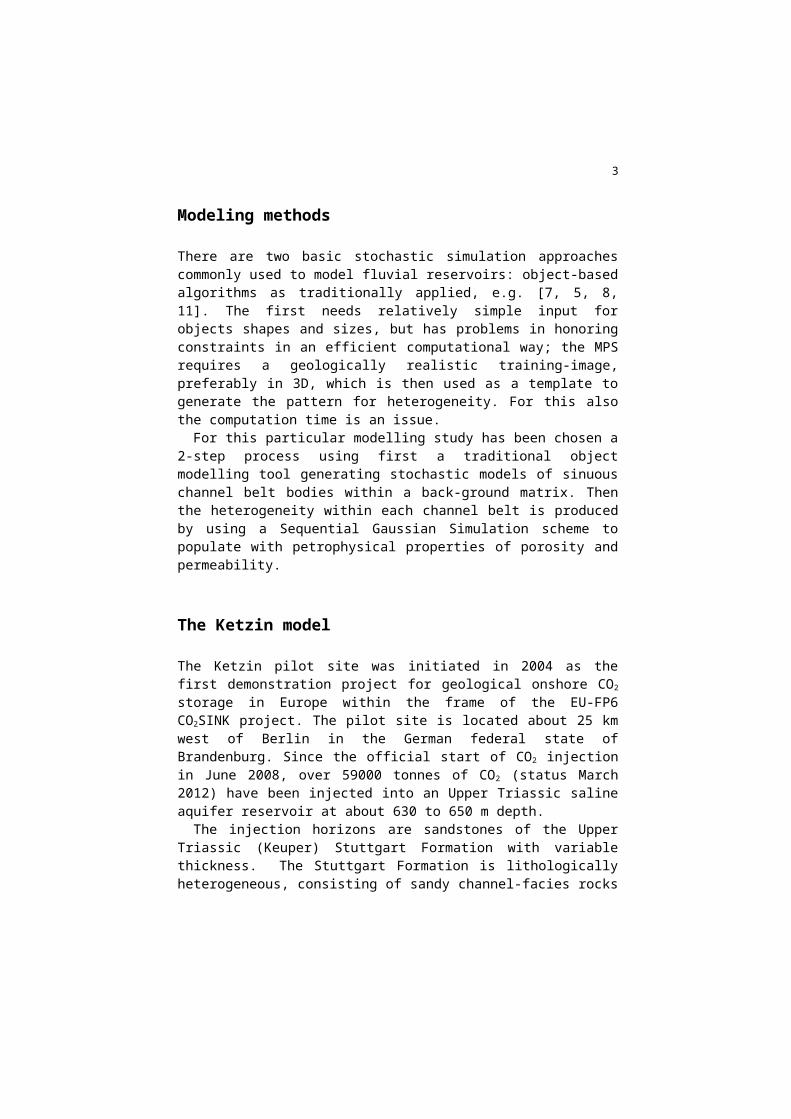
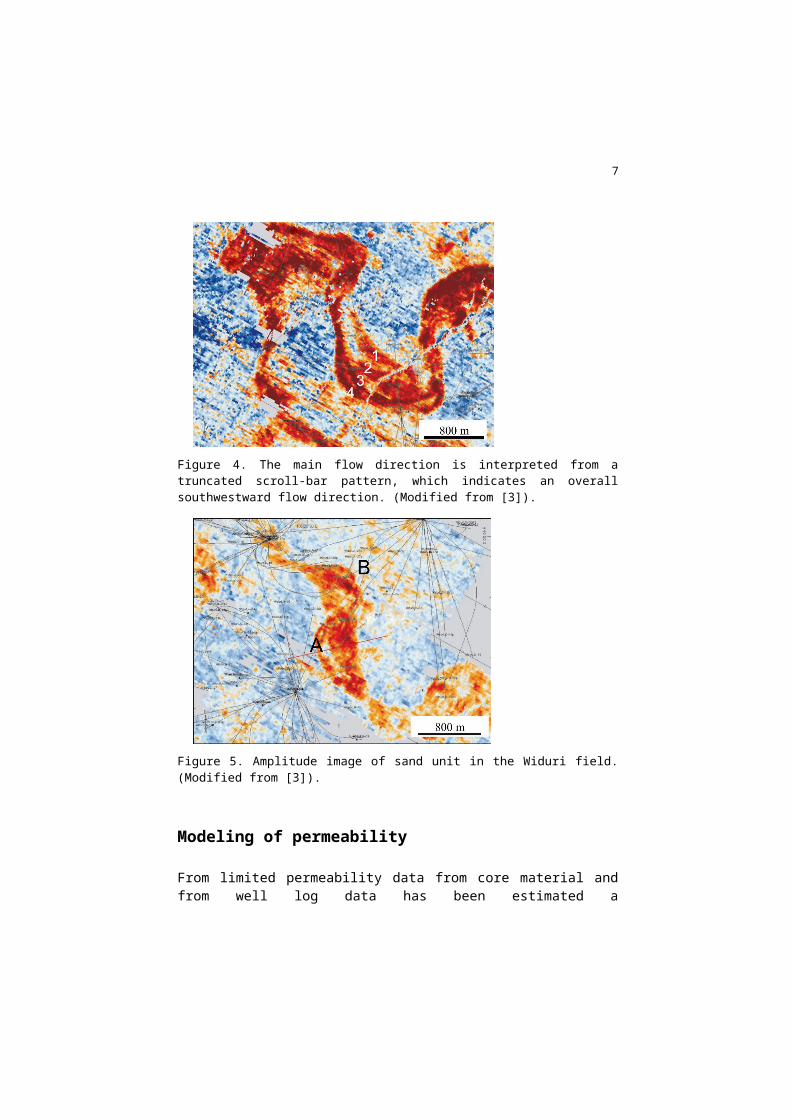
Modeling of the porosity is done with variogram of 400-800 m range to create patches that could mimic the pointbar deposits in the channelbelt interior, and layering thickness of an average of 2 meter. The size range of pointbar deposits have been inspired by mapping of other fluvial system deposits. The illustrated examples originate from the Widuri oil field, Java Sea, where 3D seismic data attributes have been used to delineate high porosity sands [3]. The seismic images show a range of features related to point-bar geometry. The interpreted shapes and dimensions are consistent with observations of modern-day examples [3].
Figure 4. The main flow direction is interpreted from a truncated scroll-bar pattern, which indicates an overall southwestward flow direction. (Modified from [3]).
Figure 5. Amplitude image of sand unit in the Widuri field. (Modified from [3]).

6
Modeling of permeability
From limited permeability data from core material and from well log data has been estimated a porosity/permeability relation. Permeability was estimated by using the Coates equation based on logging data and match to the existing fluid permeability core measurements [10].
Figure 6. A single layer in the model showing only the channelbelts with the fluid permeability (PERMX) distribution.
Geostatistical placebo
Much of the success in the early days of geostatiscal modeling for generating reservoir models that better matched production data, was probably caused by introduction of heterogeneity; independent on the exact pattern that was installed. This could be called a placebo effect, since a totally non-geological pattern with some amount of variability, produced an improved match of the reservoir response when simulating the flow.
The capabilities in geostatistical modeling have much improved since then, and several options for generating look-alikes for different heterogeneities now exist. This has promoted the use of the geostatistical toolbox for exploring the uncertainties in reservoir property distribution. However, it has also moved the focus away from establishing different scenarios that might be less well defined, prior to exploring with the geostatistics and their advanced algorithms. So, a question has been recently asked by Daly [4] - could we substitute the Geological Modeling based on poorly adapted mathematical rules with Modeling Geology? By adapting the model building process to the geoscience work flow, maybe a more rewarding exploration of the uncertainty could be reached.
7
Conclusion
The illustrated 2-step modeling procedure allows the simultaneous incorporation of abrupt contrasts in facies types and the internally continuous variations in properties like porosity and permeability.
Bibliography
[1] Bridge, J.S. and Leeder, M.R. 1979: A simulation model of alluvial stratigraphy. Sedimentology 26, 617-644.
[2] Bridge, J. S., and S. D. Mackey, 1993, A theoretical study of fluvial sandstone body dimensions, in S. S. Flint and I. D. Bryant, eds., Geological modeling of hydrocarbon reservoirs: International Association of Sedimentologists, Special Publication 15, Utrecht, Netherlands, p. 213–236.
[3] Carter, D.C. 2003: 3-D seismic geomorphology: Insights into fluvial reservoir deposition and performance, Widuri field, Java Sea AAPG Bulletin, v. 87, no. 6 (June 2003), pp. 909–934.
[4] Daly, C. 2011. “Geological Modeling or Modeling Geology?” Closing the Gap – 2011 Gussow Geoscience Conference, Banff, Alberta.
[5] Deutsch and Wang, 1996. Deutsch, C. and Wang, L., Hierachical object-based stochastic modeling of fluvial reservoirs, Mathematical Geology, 28(7), (1996), 857-880.
[6] Förster, A., Norden, B., Zinck-Jørgensen, K., Frykman, P., Kulenkampf, J., Spangenberg, E., Erzinger, J., Zimmer, M., Kopp, J., Borm, G., Juhlin, C., Cosma, C., Hurter, S., 2006. Baseline characterization of the CO2SINK geological storage site at Ketzin, Germany. Environmental Geosciences 13 (3), 145-161
[7] Georgsen, F., and Omre, H., 1992, Combining fibre processes and Gaussian random functions for modeling fluvial reservoirs, in Soares, A., ed., Geostatistics Tróia '92: Kluwer Acad. Publ., Dordrecht, The Netherlands, v. 1, p. 425-439.
[8] Holden L, Hauge R, Skare Ø, Skorstad A (1998) Modelling of fluvial reservoirs with object models. Math Geol 30(5):473–496.
[9] Miall A.D. (2006) Reconstructing the architecture and sequencestratigraphy of the preserved fluvial record as a tool for reservoirdevelopment: A reality check, Am. Assoc. Petrol. Geol. Bull. 90, 7,989-1002.
[10] Norden, B., Förster, A., Vu-Hoang, D., Marcelis, F., Springer, N., Nir, I. L., 2010. Lithological and Petrophysical Core-Log Interpretation in

8
CO2SINK, the European CO2 Onshore Research Storage and Verification Project. SPE Res Eval & Eng 13 (2), 179-192.
[11] Strebelle, S. (2002) Conditional Simulation of Complex Geological Structures Using Multiple-Point Statistics. Mathematical Geology 34/1.
.