RESERVE BASE LENDING AND THE OUTLOOK FOR SHALE OIL …...Should it rise to a...
33
By Amir Azar MAY 2017 RESERVE BASE LENDING AND THE OUTLOOK FOR SHALE OIL AND GAS FINANCE
Transcript of RESERVE BASE LENDING AND THE OUTLOOK FOR SHALE OIL …...Should it rise to a...

By Amir Azar
MAY 2017
RESERVE BASE LENDING AND THE OUTLOOK FOR SHALE OIL AND GAS
FINANCE
b | CHAPTER NAME
ABOUT THE CENTER ON GLOBAL ENERGY POLICY
The Center on Global Energy Policy provides independent, balanced, data-driven analysis to help policymakers navigate the complex world of energy. We approach energy as an economic, security, and environmental concern. And we draw on the resources of a world-class institution, faculty with real-world experience, and a location in the world’s finance and media capital. Visit us at energypolicy.columbia.edu
facebook.com/ColumbiaUEnergy twitter.com/ColumbiaUEnergy
ABOUT THE SCHOOL OF INTERNATIONAL AND PUBLIC AFFAIRS
SIPA’s mission is to empower people to serve the global public interest. Our goal is to foster economic growth, sustainable development, social progress, and democratic governance by educating public policy professionals, producing policy-related research, and conveying the results to the world. Based in New York City, with a student body that is 50 percent international and educational partners in cities around the world, SIPA is the most global of public policy schools. For more information, please visit www.sipa.columbia.edu
energypolicy.columbia.edu | MAY 2017 | 1
RESERVE BASE LENDING AND THE OUTLOOK FOR SHALE OIL AND GAS
FINANCE
Columbia University in the City of New York
By Amir Azar*
MAY 2017
*Amir Azar is a Fellow at the Center on Global Energy Policy. In his full time capacity, he is Vice President in Energy at TD Securities. Prior to TD Securities, Dr. Azar served as a Relationship Manager and Assistant Vice President at Sumitomo Mitsui Banking Corporation, leading the development of corporate advisory pitches for Fortune 500 clients. Dr. Azar holds a Ph.D. in engineering from the City University of New York and a Master of International Affairs from Columbia University.
RESERVE BASE LENDING AND THE OUTLOOK FOR SHALE OIL AND GAS FINANCE
2 | CENTER ON GLOBAL ENERGY POLICY | COLUMBIA SIPA
ACKNOWLEDGMENTSThe author would like to thank Antoine Halff, Jason Bordoff, Matt Robinson and two anonymous reviewers for their very helpful comments on earlier drafts of this paper. This paper represents the research of the author. The views expressed are the author’s own and do not reflect the views of TD Securities (USA) LLC, TD Bank Group or any of its affiliates. The paper does not necessarily represent the views of the Center on Global Energy Policy. The paper may be subject to further revision.
This report was made possible, in part, by a grant from the Japan Oil, Gas and Metals National Corporation (JOGMEC).
RESERVE BASE LENDING AND THE OUTLOOK FOR SHALE OIL AND GAS FINANCE
energypolicy.columbia.edu | MAY 2017 | 3
TABLE OF CONTENTSExecutive Summary ................................................................................................................................................................. 4Introduction ......................................................................................................................................................................... 6An Overview of North American E&Ps’ Financial Position Trend Between 2005 and 2015 .................................. 9
Debt and Leverage and the 2014 Crash ................................................................................................................... 9 Decline in Borrowing Cost ........................................................................................................................................ 11 Cash-FlowDeficit,aNewNorm..........................................................................................................................12 The Oil Crash and Its Impact on Book Value of Oil and Gas Reserves ........................................................... 12
Reserve Base Lending (RBL) Structure and Borrowing Base Determination ............................................................ 14 Commodity Derivatives and Hedging .................................................................................................................... 15 RBL Facility and Covenant Structure ................................................................................................................... 16 OCC’s Repayment Analysis Processes ................................................................................................................... 16
RBLs in Practice ................................................................................................................................................................ 17 Organic Growth ...................................................................................................................................................... 17 Acquisition-Driven Growth ................................................................................................................................... 17 Banks’ Price Decks and RBL Resiliency .............................................................................................................. 18 Oil Crash and Access to Capital Markets ............................................................................................................. 19 Adjusting to Low Prices: Low Oil a New Reality ................................................................................................. 20 Covenants and Amendments ................................................................................................................................. 21 Cash Hoardings and Inclusion of Anti-Hoarding Language ............................................................................. 22 Minimum Hedging Requirements ......................................................................................................................... 22 Limitation on Second-Lien and Third-Lien Debt .............................................................................................. 23
Future Challenges ............................................................................................................................................................. 24 OperationalEfficienciesversusHigherInterestExpense..................................................................................24 UpcomingMaturitiesandDebtRefinancings.....................................................................................................25
Conclusion ......................................................................................................................................................................... 26Notes .................................................................................................................................................................................. 27
RESERVE BASE LENDING AND THE OUTLOOK FOR SHALE OIL AND GAS FINANCE
4 | CENTER ON GLOBAL ENERGY POLICY | COLUMBIA SIPA
EXECUTIVE SUMMARYUS oil production rose 74 percent, from 5.4 million barrels per day in 2009 to 9.4 million barrels per day in 2015,1 with shale oil driving more than 92 percent of the growth.2 The rapid expansion of shale oil and gas production in the United States from 2009 to 2014 has been associated with a period of historically low interest rates and sustainedhighoilprices.Overthatfive-yearperiod,easyaccesstolow-costdebthelpedfueltheshalerevolution;North American exploration and production companies (E&Ps) funded their cash-flow deficits with billions insecured and unsecured debt. Since mid-2014, oil prices have dramatically declined, forcing companies to adjust. An extensive body of literature has examined their resilience in the face of lower oil and gas prices and their ingenuity inprotectingprofitmargins through cost savings andproductivity gains.3 Interest rates, however, have remained relatively depressed throughout the price decline, though they have recently started to creep up. Whether the industry, having learned to reduce operating costs in the face of low prices, could overcome the additional challenge of a significant further increase in interest rates remainsanunexaminedquestion.Whilecommentatorshavenoted inbroad terms the risk of an increase in borrowing costs for shale E&P companies, there has not been any notable in-depthstudyof thespecificwaysinwhichhigherinterestrateswouldimpactthesector.Suchaninvestigationisthepurpose of this paper.
Theexposureof shaleoilandgascompaniestointerest-ratefluctuationsistiedtotheirformof financing.Unlikeconventionaloilandgascompanies,whicharetraditionallydeep-pocketedandlargelyself-financed,shalecompaniestend to be deeply leveraged. Many small and midsize shale oil and gas exploration and production companies (E&Ps) are typically rated below investment grade by the rating agencies, Standard & Poor’s (S&P) and Moody’s, which makes their access to debt markets relatively expensive compared with investment-grade companies, especially when low oilpricesputprofitmarginsunderpressure.Inthiscontext,thefinancingstructureknownasReserveBaseLending(RBL) has been particularly instrumental in providing the sector with access to low-cost bank debt financings,allowing the rise and expansion of numerous small and midsize players in shale. While protecting lenders’ collateral, RBL structure provides funds for the drilling and expansion of oil and gas reserves.
Unlike the operational improvement of shale oil and gas companies, which has been the object of many studies sincetheoilpricecrash,efficiencygainsrealizedonthefinancialsideof theindustryhavebeenlesswidelynotedquantitatively. The selloff put the RBL structure to the test in late 2014 and 2015. Although the structure proved generally resilient, the low price of oil and the bankruptcies it triggered in the sector led to a series of improvements inRBLcovenantstructures.Asaresult,thebankingsectorhasbecomemoreefficientandselectiveinE&Plending.In particular, RBL credit agreements have been amended to maintain control of the borrower’s use of funds by adding anti-cash hoarding, which blocks the companies from withdrawing sizable funds without lenders’ approval.
Thehigh-yielddebtmarket’sreactiontotheoildownturnmagnifiedtheimportanceof RBLsasthemostreliablesource of liquidity and funding for small and midsize E&Ps. The yield for non-investment-grade energy bonds increased from 5 percent in September 2014 to 15 percent in December 2014 and later to 25 percent in January 2016. Unlikedebtcapitalmarkets, thebanks remainedcommitted toE&Ps, since theflexiblenatureof RBLstructureallowed them to adjust their commitment and to cushion the impact of the oil crash on borrowing base calculations, particularly since most of the banks had originally used more conservative price decks than WTI NYMEX Futures. The persistence of low interest rates helped maintain the banks’ commitment to the sector.
Thoughshaleoilandgasoperationandproductionhavebecomemoreefficient(withefficiencygainsreachingupto50percentinsomebasins),higherinterestratescouldwipeoutasubstantialportionof thesebenefits.Withinterestexpenses comprising 25 percent to 33 percent of the total cash cost (lifting cost + cash interest expense) of E&Ps

RESERVE BASE LENDING AND THE OUTLOOK FOR SHALE OIL AND GAS FINANCE
energypolicy.columbia.edu | MAY 2017 | 5
rated between B and CCC–, a 2 percent increase in London Interbank Offer Rate (LIBOR), coupled with 1.5 percent highercreditspreads,wouldraisetheirinterestexpenseperdollarborrowedby30percent,eliminatingasignificantportionof thegainsfromoperationalefficiencies. If ratehikescontinueat50basispointsperyear,LIBORwillbeabove2percentbytheendof 2018.Shoulditrisetoapre-financial-crisislevelof above5percent,thecostof unsecured debt for small and even midsize producers could exceed 10–12 percent. Since shale oil production is highly capital intensive, the high cost of debt could drive up total cost of production to an unsustainable level if oil prices furtherfallandremainlow.Thishighcostof capitalwouldbenefitlargerplayerswithdeepfinancialreservesandaccess to debt and equity capital markets at a lower cost. Those in turn might be led to play a much larger role in the shale oil and gas sector.
Whilethedownturninoilpricesservedasanopportunityforshaleproducerstoenhanceefficienciesandimprovetheircoststructure,ahastyriseof interestratestothepre–financialcrisislevelwouldposeachallengetofundingfuture drilling and production during a low oil price environment, particularly for small and midsize companies due to the capital-intensive nature of shale.
RESERVE BASE LENDING AND THE OUTLOOK FOR SHALE OIL AND GAS FINANCE
6 | CENTER ON GLOBAL ENERGY POLICY | COLUMBIA SIPA
INTRODUCTIONAlthough the existence of a vast shale oil resource in the United States has been known for decades, it was the innovation of producing hydrocarbon from the source rock by combining hydraulic fracturing with horizontal drilling that made the oil in nonporous shale technically exploitable.4 The process, however, remains capital-intensive. The realcatalystof theshalerevolutionwasthusthe2008financialcrisisandtheeraof unprecedentedlylowinterestratesit ushered in, driven by the US Federal Reserve Bank’s monetary policy. American entrepreneurship, coupled with low-cost debt, created the conditions for a surge in production that ranks among the biggest oil booms in history.
With the 2008 crisis in the rear-view mirror and oil prices rebounding to above $100 per barrel, markets poured billions of dollars into shale over the next six years. Thus, the oil and gas sector became a major source of growth and employment, which some have argued helped the US economy out of the recession.5
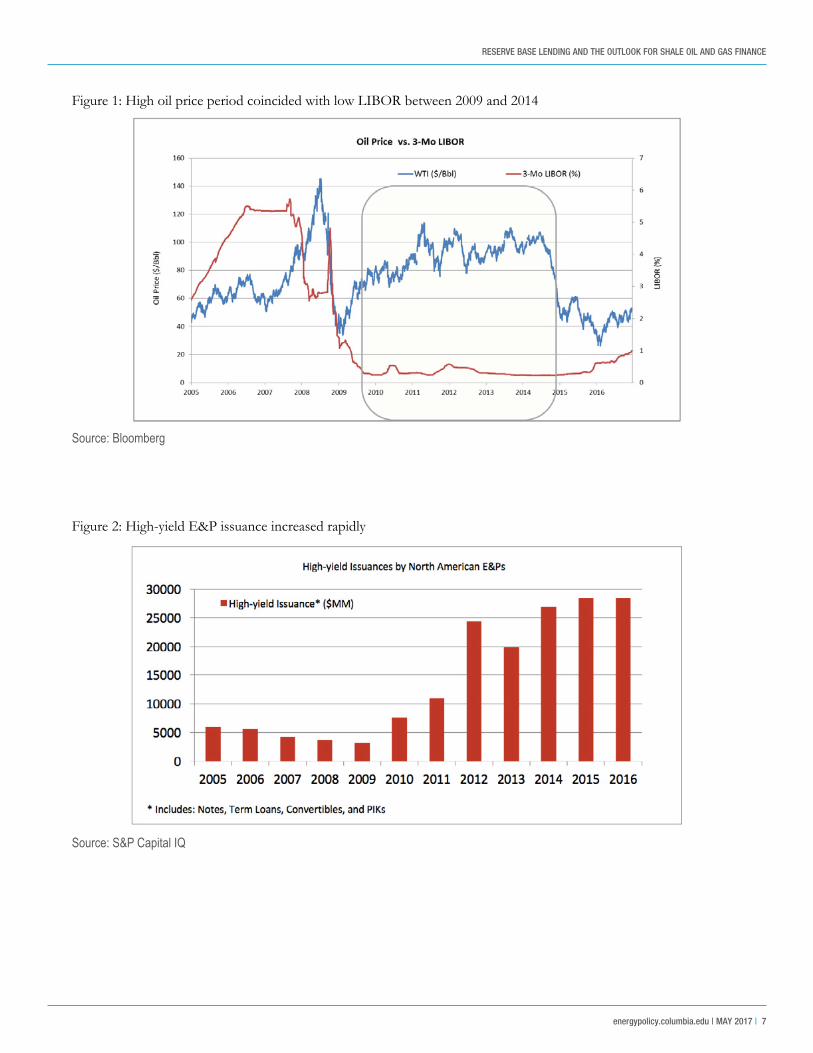
Figure 1 shows the decline in the Intercontinental Exchange London Interbank Offered Rate (LIBOR), a widely used benchmark for interest rates. It highlights how the shale boom coincided with a period in which high oil prices and low interest rates were both persistent. Low-cost debt allowed small and midsize oil companies to access high-yield bondmarketsinanunprecedentedway(figure2).
Starting in June 2014, the oil market suffered what turned out to be the steepest and longest-lasting price correction in its history. The oil price fell from above $90 per barrel in 3rd quarter 2014 to $40 per barrel in 1st quarter 2015 and later to $30 per barrel in 1st quarter 2015. Although the price collapse caused some turmoil in the shale oil patch, the industry managed remarkably well in a lower price environment. Thanks to cost savings and improvement in efficiencyandproductivity,theaveragewell-headbreak-even6 price of the shale oil industry fell from $80 per barrel in 2013 to $35 per barrel in 2016.7 As companies cut spending in response to lower prices, the rig count in shale oil andgasfieldsinitiallyplummeted,reducingUSoilproductionfrom9.4millionbarrelsperdayin2015to8.9millionbarrels per day in 2016. US shale oil production initially fell to 4.2 million barrels per day in 2016 from its peak at 4.9 million barrels per day in 2015, but the pace of decline was mitigated by slowed reductions in cost and improvements in drilling techniques.8
Even as oil prices plummeted, low interest rates, the industry’s other enabler, have persisted through much of the market downturn. But with global economic growth showing signs of life, the outlook for rising interest rates is now improving. Already, US interest rates have started to creep up with Federal Fund Rate rising from a range of zero to 0.25 percent in between 2008 and 2014 to its current level at 0.75 percent. The Federal Reserve expects to raise rates three more times in 2017, to 1.5 percent. It signaled it will raise rates to 2 percent in 2018 and 3 percent in 2019.9 Whether the shale oil and gas industry, having adjusted to a lower price environment, can now also weather higher interest rates and an increase in borrowing costs is unclear.
RESERVE BASE LENDING AND THE OUTLOOK FOR SHALE OIL AND GAS FINANCE
energypolicy.columbia.edu | MAY 2017 | 7
Figure 1: High oil price period coincided with low LIBOR between 2009 and 2014
Figure 2: High-yield E&P issuance increased rapidly
Source: Bloomberg
Source: S&P Capital IQ

RESERVE BASE LENDING AND THE OUTLOOK FOR SHALE OIL AND GAS FINANCE
8 | CENTER ON GLOBAL ENERGY POLICY | COLUMBIA SIPA
This essay aims to assess the general outlook for US shale oil and gas in a higher-interest-rate environment, a topic thathasuntilnowreceivedsurprisingly littleattentioncomparedwithshaleoperationalcostsandefficiencies.Todoso,thepaperexaminesforthefirsttimeNorthAmericanexplorationandproduction(E&P)companiesfromacompiledfinancialperspective,withafocusontheimpactof thecollapseof oilpricestobelow$50perbarrel.Financial data from the top 63 E&Ps with S&P ratings between A and CCC have been compiled in order to identify industry-wide trends and behavior patterns. Financial and credit metrics are considered in aggregate for the purpose of analyzing sectorial trends, not to evaluate individual companies or assess their corporate strategies at the company level.
The analysis begins with debt and leverage ratios as they climbed between 2005 and 2015, driven by ongoing cash-flowdeficitsandlowinterestrates.Thisisfollowedbyadiscussionof theimpactof the2014oilcrashoncorporatereserves and balance sheets.
The study then focuses on the role of the Reserve Base Lending (RBL) structure in creating a structural platform for the growth of small and midsize oil producers. It discusses borrowing-base calculations and analyzes the strengths and weaknesses of various RBL structures, ranging from a “covenant-lite” general working-capital structure, in whichthecompanyenjoysfullflexibilityinwithdrawalsandusageof theborrowedfunds,toahighly“covenanted”structure, where the banks exercise tight control over withdrawal amounts and usage of the funds. This move to morestringentlendingpracticesisdrivenbyconcernsaboutfuturelossesaswellastheOfficeof theComptrollerof theCurrency’s(OCC)regulationsandguidelines,aftermanysmallandmidsizeE&Psalreadyfiledforbankruptcy,andasothersarebarelystayingafloat.
RESERVE BASE LENDING AND THE OUTLOOK FOR SHALE OIL AND GAS FINANCE
energypolicy.columbia.edu | MAY 2017 | 9
AN OVERVIEW OF NORTH AMERICAN E&PS’ FINANCIAL POSITIONS AND TREND This section provides an overview of financial metrics of North American E&Ps on a macro level compiledbasisbetween2005and2015.Theselectedfinancialmetricsprovideaninsightonindustry-widetrendsregardingdebt,leverage,andcashflow.Of the63E&Pswhosedatahavebeencompiledinthispaper,thosedeemedintheinvestment-grade category (graded BBB and above by S&P) generally represent the larger E&Ps, while those in the non-investment-grade category (BB+ to CCC) represent small and midsize E&Ps, which typically use RBLs to fund theirdrillingandproductionactivities.Thefinancialmetricsarefromthecompanies’auditedannualfinancialreports,extracted from Capital IQ.10
Debt and Leverage and the 2014 Crash
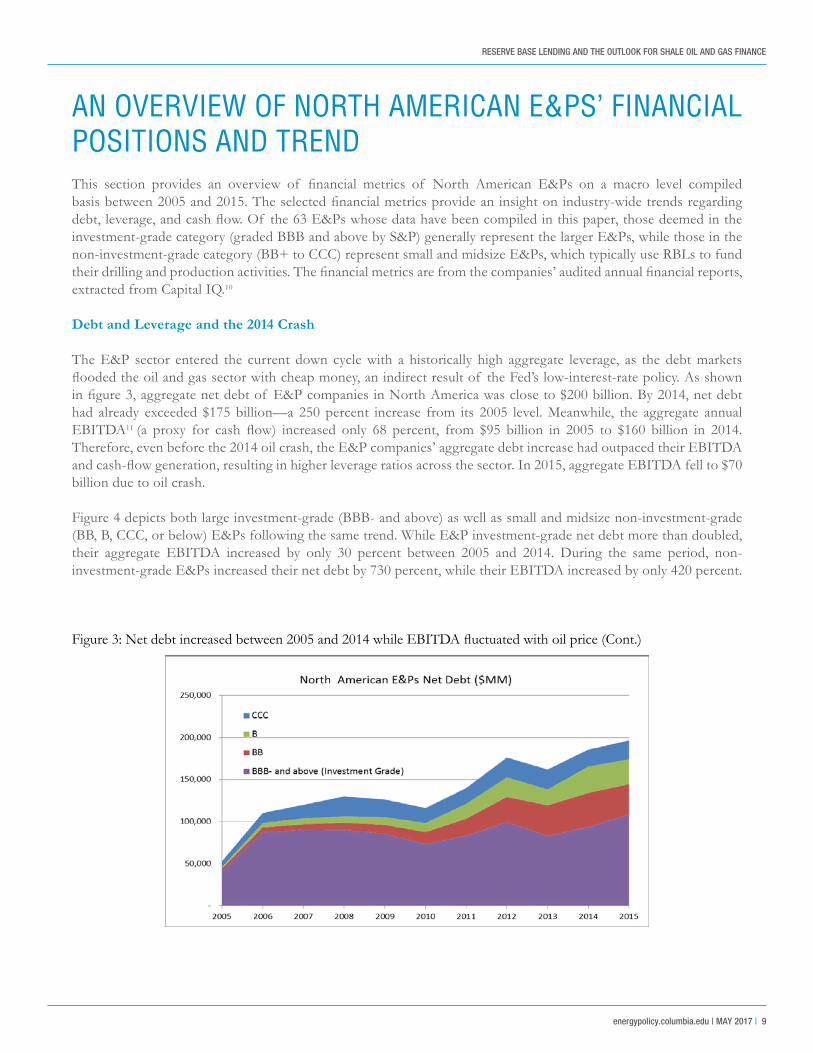
The E&P sector entered the current down cycle with a historically high aggregate leverage, as the debt markets floodedtheoilandgassectorwithcheapmoney,anindirectresultof theFed’slow-interest-ratepolicy.Asshowninfigure3,aggregatenetdebtof E&PcompaniesinNorthAmericawascloseto$200billion.By2014,netdebthad already exceeded $175 billion—a 250 percent increase from its 2005 level. Meanwhile, the aggregate annual EBITDA11 (a proxy for cash flow) increased only 68 percent, from $95 billion in 2005 to $160 billion in 2014.Therefore, even before the 2014 oil crash, the E&P companies’ aggregate debt increase had outpaced their EBITDA andcash-flowgeneration,resultinginhigherleverageratiosacrossthesector.In2015,aggregateEBITDAfellto$70billion due to oil crash.
Figure 4 depicts both large investment-grade (BBB- and above) as well as small and midsize non-investment-grade (BB, B, CCC, or below) E&Ps following the same trend. While E&P investment-grade net debt more than doubled, their aggregate EBITDA increased by only 30 percent between 2005 and 2014. During the same period, non-investment-grade E&Ps increased their net debt by 730 percent, while their EBITDA increased by only 420 percent.
Figure3:Netdebtincreasedbetween2005and2014whileEBITDAfluctuatedwithoilprice(Cont.)

RESERVE BASE LENDING AND THE OUTLOOK FOR SHALE OIL AND GAS FINANCE
10 | CENTER ON GLOBAL ENERGY POLICY | COLUMBIA SIPA
Data Source: Capital IQ, Financial Reporting
Figure 4: Leverages increased for both Investment Grade and Non-Investment-Grade
Data Source: Capital IQ, Financial Reporting

RESERVE BASE LENDING AND THE OUTLOOK FOR SHALE OIL AND GAS FINANCE
energypolicy.columbia.edu | MAY 2017 | 11
Figure 5: E&Ps’ aggregate debt growth outpaced aggregate interest expense
Data Source: Capital IQ, Financial Reporting
Though the small and midsize E&Ps were more aggressive, both investment-grade and non-investment-grade companies increased their debt and leverage ratios between 2005 and 2014. Leverage ratios then spiked across the industry when oil prices began to plummet.
Decline in Borrowing Cost
While E&P debt climbed to a historical high, interest costs in proportion to the amount borrowed declined, driven bythelow-interest-rateenvironment.Asshowninfigure5,between2005and2015,E&Paggregatedebtincreasedby 300 percent, from $50 billion to $200 billion, while interest expense increased only 150 percent, from $4 billion to $10 billion. Therefore, debt increased twice as fast as interest expense, indicating a gradual decline in borrowing cost. Simply put, low interest rates incentivized higher debt to boost the return per share.
RESERVE BASE LENDING AND THE OUTLOOK FOR SHALE OIL AND GAS FINANCE
12 | CENTER ON GLOBAL ENERGY POLICY | COLUMBIA SIPA
Cash-Flow Deficit, a New Norm
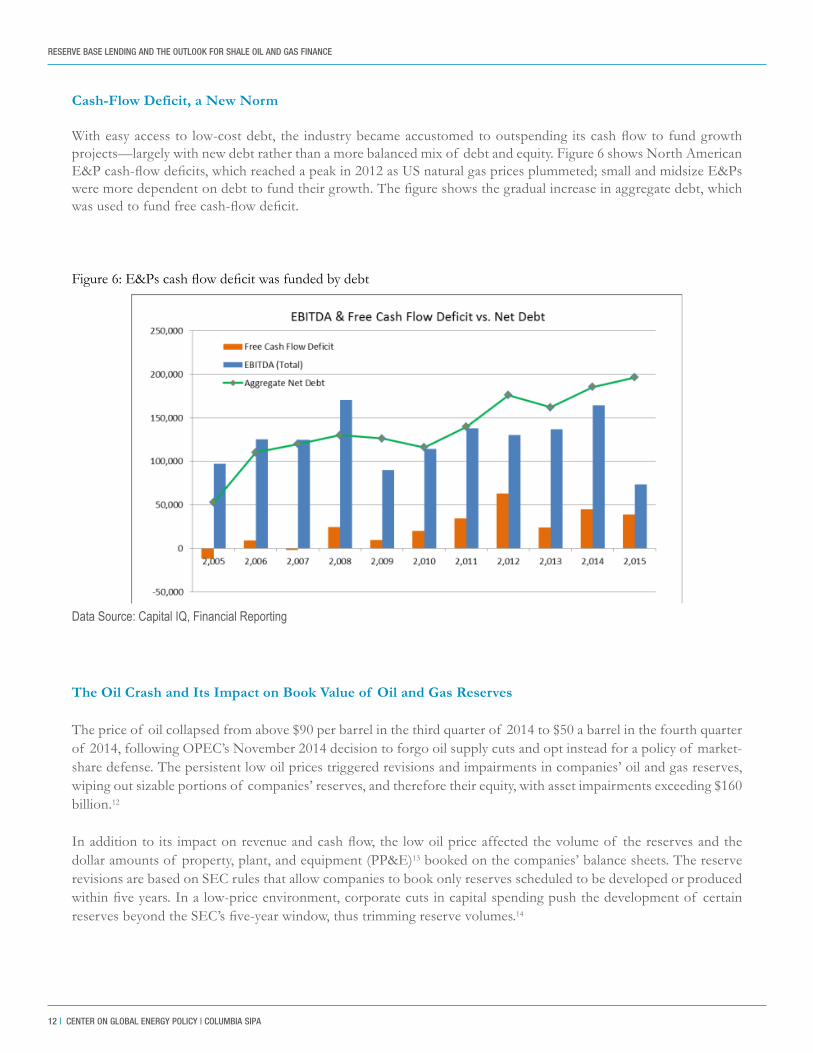
Witheasyaccess to low-costdebt, the industrybecameaccustomedtooutspending itscashflowtofundgrowthprojects—largely with new debt rather than a more balanced mix of debt and equity. Figure 6 shows North American E&Pcash-flowdeficits,whichreachedapeakin2012asUSnaturalgaspricesplummeted;smallandmidsizeE&Psweremoredependentondebttofundtheirgrowth.Thefigureshowsthegradualincreaseinaggregatedebt,whichwasusedtofundfreecash-flowdeficit.
The Oil Crash and Its Impact on Book Value of Oil and Gas Reserves
The price of oil collapsed from above $90 per barrel in the third quarter of 2014 to $50 a barrel in the fourth quarter of 2014, following OPEC’s November 2014 decision to forgo oil supply cuts and opt instead for a policy of market-share defense. The persistent low oil prices triggered revisions and impairments in companies’ oil and gas reserves, wiping out sizable portions of companies’ reserves, and therefore their equity, with asset impairments exceeding $160 billion.12
Inadditiontoits impactonrevenueandcashflow,thelowoilpriceaffectedthevolumeof thereservesandthedollar amounts of property, plant, and equipment (PP&E)13 booked on the companies’ balance sheets. The reserve revisions are based on SEC rules that allow companies to book only reserves scheduled to be developed or produced withinfiveyears.Inalow-priceenvironment,corporatecutsincapitalspendingpushthedevelopmentof certainreservesbeyondtheSEC’sfive-yearwindow,thustrimmingreservevolumes.14
Figure6:E&Pscashflowdeficitwasfundedbydebt
Data Source: Capital IQ, Financial Reporting

RESERVE BASE LENDING AND THE OUTLOOK FOR SHALE OIL AND GAS FINANCE
energypolicy.columbia.edu | MAY 2017 | 13
Figure 7: With collapse of oil prices, more than $160 billion of book equity was wiped out by impairments
Data Source: Capital IQ, Financial Reporting
Impairment charges15 are driven by accounting rules and the ceiling test that requires evaluating the book value of reservesusingadefinedaverageof thecommodity’svalueforthepriortwelve-monthperiod.Althoughanoncashcharge, an impairment could heavily impact companies’ balance sheets, particularly for small and midsize companies that use a full-cost16 method in booking their exploration costs. In many cases, large impairments wiped out the whole bookequityvalueof thecompany.Asshowninfigure7,thesustainedlowoilpriceenvironmentwipedoutmorethan $160 billion of book equity value of E&Ps in North America alone.
RESERVE BASE LENDING AND THE OUTLOOK FOR SHALE OIL AND GAS FINANCE
14 | CENTER ON GLOBAL ENERGY POLICY | COLUMBIA SIPA
The low-oil-price environment heavily impacted non-investment-grade, small and midsize North American oil and gas producers. To better understand the phenomenon, one should take into account the reserve base lending (RBL) structure,themostimportantsourceof debtfinancingandgrowthforthesestakeholders.Unlikelargeinvestment-grade companies that have easy access to debt and equity markets to fund their growth, many non-investment-grade companies need to use a combination of equity and borrowings under RBLs to fund their capital spending. RBL structure is a bank-syndicated revolver credit facility17 secured by the company’s proved oil and gas reserves. Oilandgasreservesareclassifiedintothreecategories:provedreserves,probablereserves,andpossiblereserves.Bank lenders only extend credit against a company’s proved reserves. As the collateral is oil and gas reserves of the company,RBLfinancingrequiresengagementof anindependentreserveandproductionengineertosupportthebank’s calculations in determining the borrowing base, which is the maximum credit that could be made available to the borrower by a lender, calculated based on the company’s reserves.
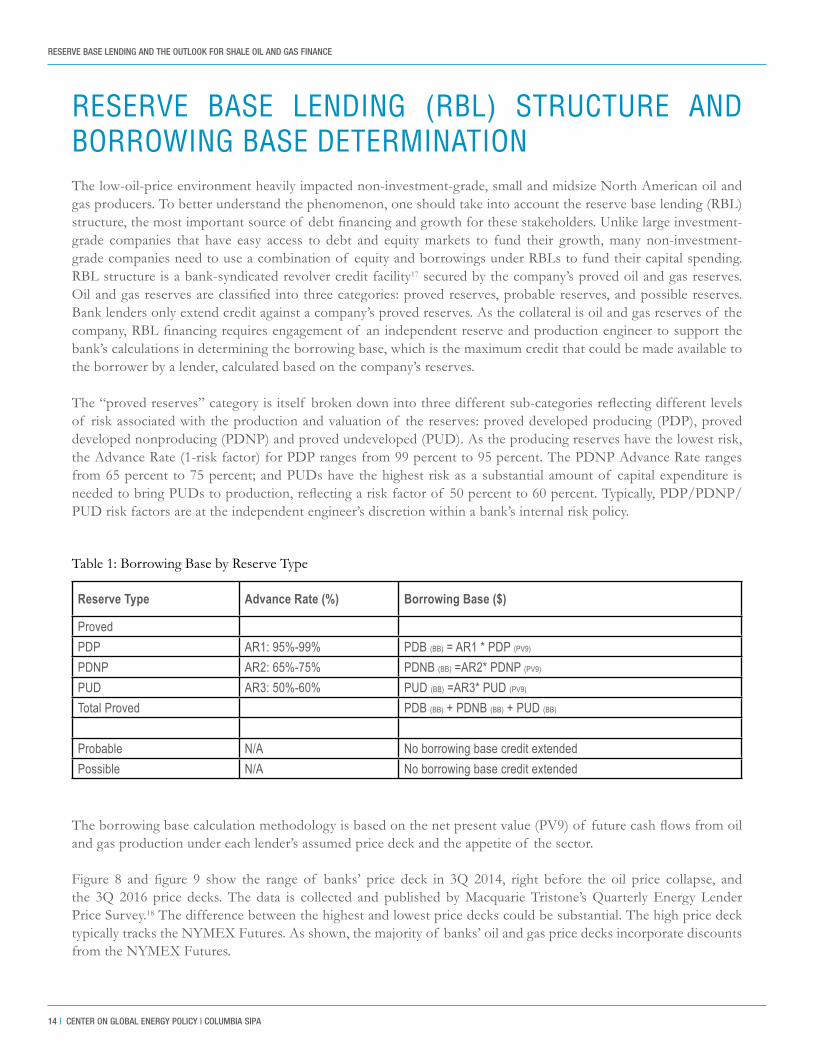
The“provedreserves”categoryisitself brokendownintothreedifferentsub-categoriesreflectingdifferentlevelsof risk associated with the production and valuation of the reserves: proved developed producing (PDP), proved developed nonproducing (PDNP) and proved undeveloped (PUD). As the producing reserves have the lowest risk, the Advance Rate (1-risk factor) for PDP ranges from 99 percent to 95 percent. The PDNP Advance Rate ranges from65percentto75percent;andPUDshavethehighestriskasasubstantialamountof capitalexpenditure isneededtobringPUDstoproduction,reflectingariskfactorof 50percentto60percent.Typically,PDP/PDNP/PUD risk factors are at the independent engineer’s discretion within a bank’s internal risk policy.
Theborrowingbasecalculationmethodologyisbasedonthenetpresentvalue(PV9)of futurecashflowsfromoiland gas production under each lender’s assumed price deck and the appetite of the sector.
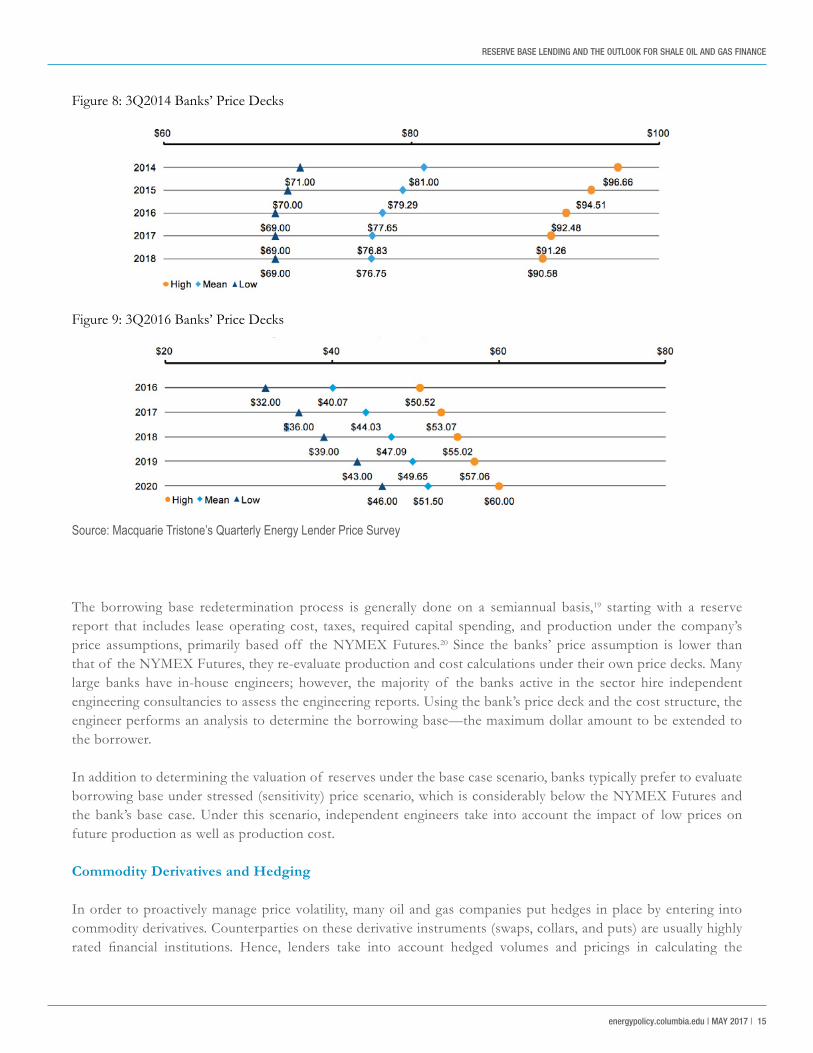
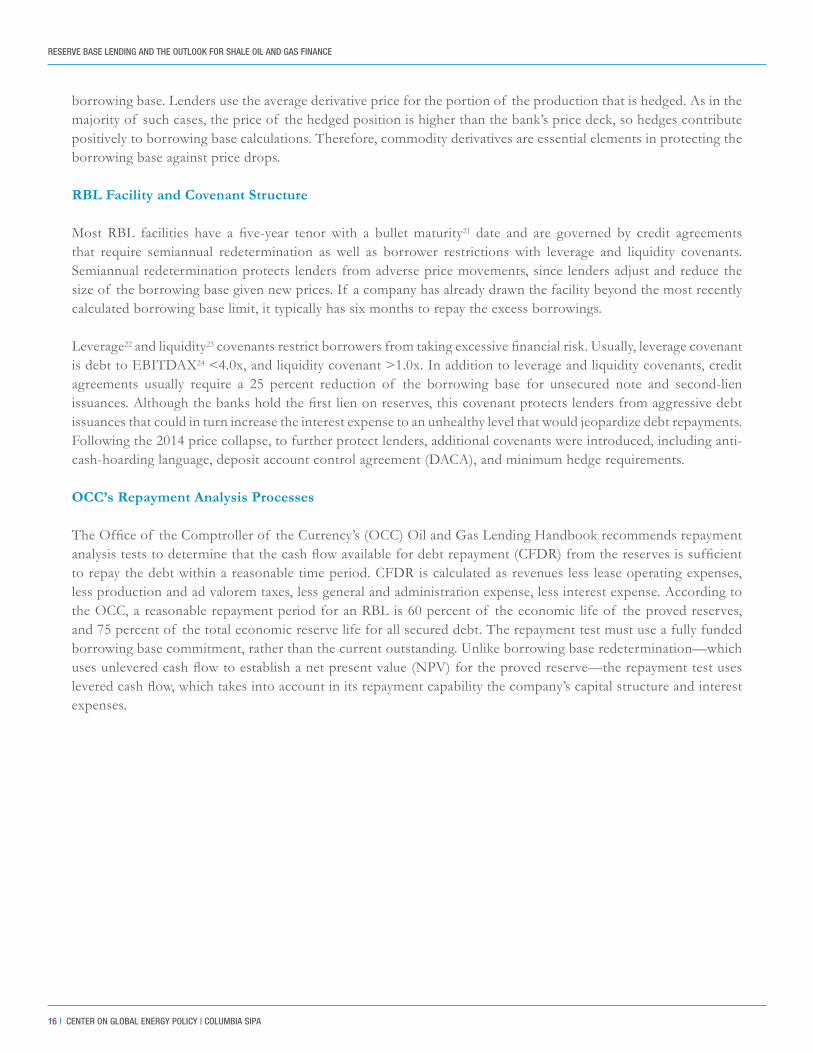
Figure 8 and figure 9 show the range of banks’ price deck in 3Q 2014, right before the oil price collapse, andthe 3Q 2016 price decks. The data is collected and published by Macquarie Tristone’s Quarterly Energy Lender Price Survey.18 The difference between the highest and lowest price decks could be substantial. The high price deck typically tracks the NYMEX Futures. As shown, the majority of banks’ oil and gas price decks incorporate discounts from the NYMEX Futures.
Table 1: Borrowing Base by Reserve Type
Reserve Type Advance Rate (%) Borrowing Base ($)
ProvedPDP AR1: 95%-99% PDB (BB) = AR1 * PDP (PV9)
PDNP AR2: 65%-75% PDNB (BB) =AR2* PDNP (PV9)
PUD AR3: 50%-60% PUD (BB) =AR3* PUD (PV9)
Total Proved PDB (BB) + PDNB (BB) + PUD (BB)
Probable N/A No borrowing base credit extendedPossible N/A No borrowing base credit extended
RESERVE BASE LENDING (RBL) STRUCTURE AND BORROWING BASE DETERMINATION
RESERVE BASE LENDING AND THE OUTLOOK FOR SHALE OIL AND GAS FINANCE
energypolicy.columbia.edu | MAY 2017 | 15
The borrowing base redetermination process is generally done on a semiannual basis,19 starting with a reserve report that includes lease operating cost, taxes, required capital spending, and production under the company’s price assumptions, primarily based off the NYMEX Futures.20 Since the banks’ price assumption is lower than that of the NYMEX Futures, they re-evaluate production and cost calculations under their own price decks. Many large banks have in-house engineers; however, themajority of the banks active in the sector hire independentengineering consultancies to assess the engineering reports. Using the bank’s price deck and the cost structure, the engineer performs an analysis to determine the borrowing base—the maximum dollar amount to be extended to the borrower.
In addition to determining the valuation of reserves under the base case scenario, banks typically prefer to evaluate borrowing base under stressed (sensitivity) price scenario, which is considerably below the NYMEX Futures and the bank’s base case. Under this scenario, independent engineers take into account the impact of low prices on future production as well as production cost.
Commodity Derivatives and Hedging
In order to proactively manage price volatility, many oil and gas companies put hedges in place by entering into commodity derivatives. Counterparties on these derivative instruments (swaps, collars, and puts) are usually highly rated financial institutions. Hence, lenders take into account hedged volumes and pricings in calculating the
Figure 8: 3Q2014 Banks’ Price Decks
Figure 9: 3Q2016 Banks’ Price Decks
Source: Macquarie Tristone’s Quarterly Energy Lender Price Survey
RESERVE BASE LENDING AND THE OUTLOOK FOR SHALE OIL AND GAS FINANCE
16 | CENTER ON GLOBAL ENERGY POLICY | COLUMBIA SIPA
borrowing base. Lenders use the average derivative price for the portion of the production that is hedged. As in the majority of such cases, the price of the hedged position is higher than the bank’s price deck, so hedges contribute positively to borrowing base calculations. Therefore, commodity derivatives are essential elements in protecting the borrowing base against price drops.
RBL Facility and Covenant Structure
Most RBL facilities have a five-year tenorwith a bulletmaturity21 date and are governed by credit agreements that require semiannual redetermination as well as borrower restrictions with leverage and liquidity covenants. Semiannual redetermination protects lenders from adverse price movements, since lenders adjust and reduce the size of the borrowing base given new prices. If a company has already drawn the facility beyond the most recently calculated borrowing base limit, it typically has six months to repay the excess borrowings.
Leverage22 and liquidity23covenantsrestrictborrowersfromtakingexcessivefinancialrisk.Usually,leveragecovenantis debt to EBITDAX24 <4.0x, and liquidity covenant >1.0x. In addition to leverage and liquidity covenants, credit agreements usually require a 25 percent reduction of the borrowing base for unsecured note and second-lien issuances.Althoughthebanksholdthefirstlienonreserves,thiscovenantprotectslendersfromaggressivedebtissuances that could in turn increase the interest expense to an unhealthy level that would jeopardize debt repayments. Following the 2014 price collapse, to further protect lenders, additional covenants were introduced, including anti-cash-hoarding language, deposit account control agreement (DACA), and minimum hedge requirements.
OCC’s Repayment Analysis Processes
TheOfficeof theComptrollerof theCurrency’s(OCC)OilandGasLendingHandbookrecommendsrepaymentanalysisteststodeterminethatthecashflowavailablefordebtrepayment(CFDR)fromthereservesissufficientto repay the debt within a reasonable time period. CFDR is calculated as revenues less lease operating expenses, less production and ad valorem taxes, less general and administration expense, less interest expense. According to the OCC, a reasonable repayment period for an RBL is 60 percent of the economic life of the proved reserves, and 75 percent of the total economic reserve life for all secured debt. The repayment test must use a fully funded borrowing base commitment, rather than the current outstanding. Unlike borrowing base redetermination—which usesunleveredcashflowtoestablishanetpresentvalue(NPV)fortheprovedreserve—therepaymenttestusesleveredcashflow,whichtakesintoaccountinitsrepaymentcapabilitythecompany’scapitalstructureandinterestexpenses.
RESERVE BASE LENDING AND THE OUTLOOK FOR SHALE OIL AND GAS FINANCE
energypolicy.columbia.edu | MAY 2017 | 17
Organic Growth
Under an organic growth scenario, the company already owns the reserves and uses the funds from the revolver facility to drill, develop, and produce the reserves. Through the drilling process, companies generally prove more reserves, thereby allowing the company to replace the produced barrels, and, in many cases, increase the reserve base. The produced barrels generatethecashflowtocoveroperationalandinterestexpensesandtheoreticallyrepaytheborrowingsundertheRBLfacility. However, to fund future capex, the company needs to borrow again under the revolver, and the cycle repeats.
Acquisition-Driven Growth
Amore common use of RBL throughout the oil boom period was acquisition financing. Under this scenario, theacquisition is funded largely by debt in multiple steps. First, the company uses a portion of its RBL to fund the acquiring assets. With the acquired reserve and updated reserve engineering reports, the company upsizes its RBL facility to include the acquired assets. In the second step, the company accesses the high-yield debt market to issue unsecured notes or second-lien term loans. The proceeds repay and lower the balance on the RBL. To protect the banks’ collateral, credit agreements typically require a reduction in borrowing base equal to 25 percent of issued unsecured notes and second-lien term loans. More conservative companies use a combination of debt and equity issuance to maintain lower leverage in order to protect their balance sheet. The third step consists of using the availability under the RBL to fund drilling and production of the acquired and legacy reserves. Under this scenario and similarly in the organic growth scenario, the companyoperateswithnegativefreecashflow,fundingthecapexbyborrowingundertheupsizedRBLfacility.
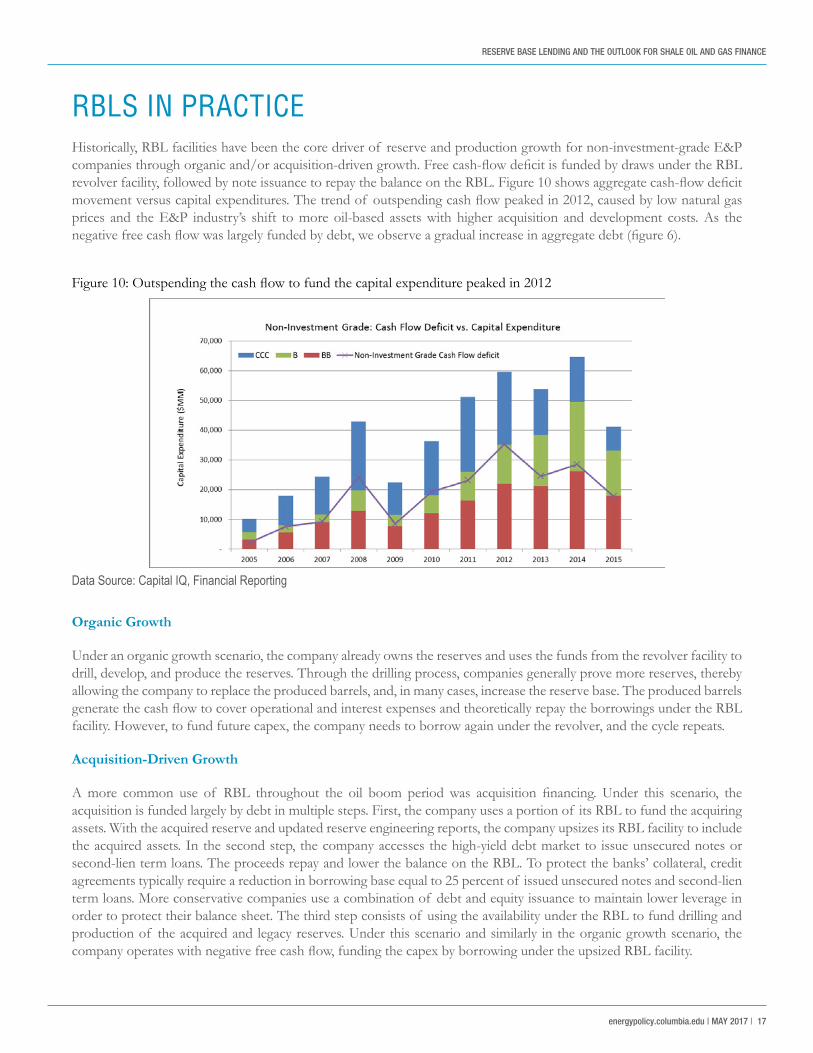
Figure10:Outspendingthecashflowtofundthecapitalexpenditurepeakedin2012
Data Source: Capital IQ, Financial Reporting
RBLS IN PRACTICEHistorically, RBL facilities have been the core driver of reserve and production growth for non-investment-grade E&P companiesthroughorganicand/oracquisition-drivengrowth.Freecash-flowdeficitisfundedbydrawsundertheRBLrevolverfacility,followedbynoteissuancetorepaythebalanceontheRBL.Figure10showsaggregatecash-flowdeficitmovementversuscapitalexpenditures.Thetrendof outspendingcashflowpeakedin2012,causedbylownaturalgasprices and the E&P industry’s shift to more oil-based assets with higher acquisition and development costs. As the negativefreecashflowwaslargelyfundedbydebt,weobserveagradualincreaseinaggregatedebt(figure6).
RESERVE BASE LENDING AND THE OUTLOOK FOR SHALE OIL AND GAS FINANCE
18 | CENTER ON GLOBAL ENERGY POLICY | COLUMBIA SIPA
Banks’ Price Decks and RBL Resiliency
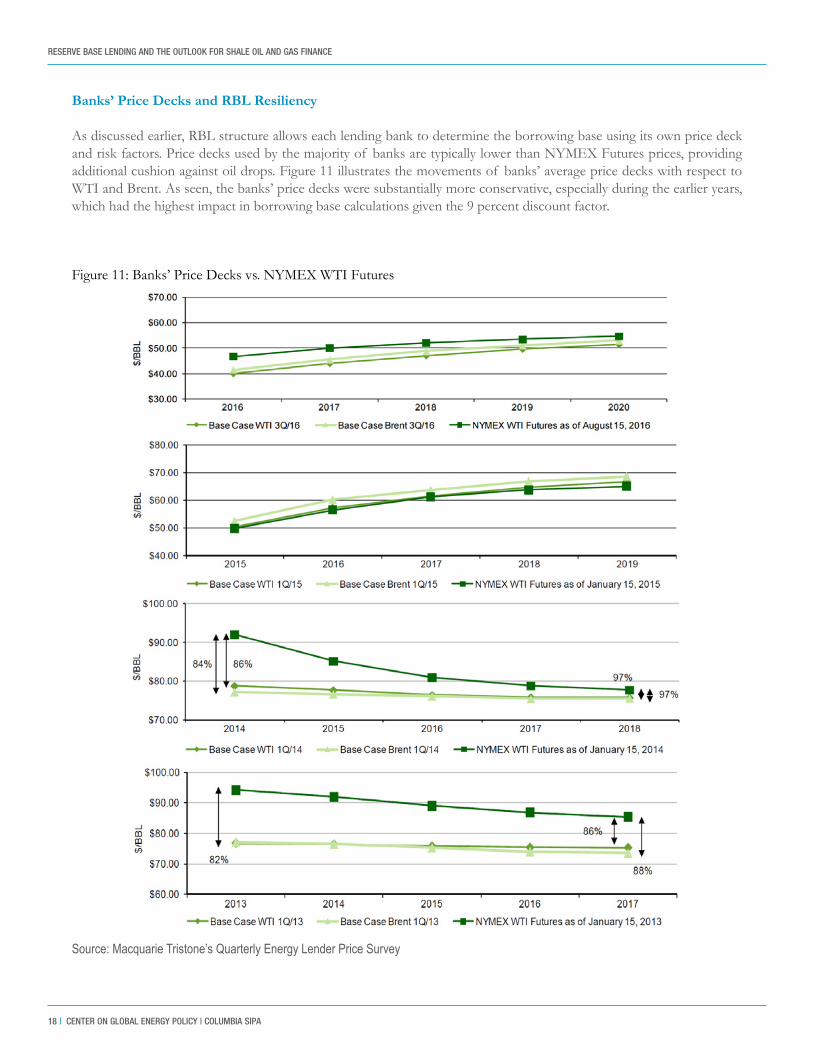
As discussed earlier, RBL structure allows each lending bank to determine the borrowing base using its own price deck and risk factors. Price decks used by the majority of banks are typically lower than NYMEX Futures prices, providing additional cushion against oil drops. Figure 11 illustrates the movements of banks’ average price decks with respect to WTI and Brent. As seen, the banks’ price decks were substantially more conservative, especially during the earlier years, which had the highest impact in borrowing base calculations given the 9 percent discount factor.
Figure 11: Banks’ Price Decks vs. NYMEX WTI Futures
Source: Macquarie Tristone’s Quarterly Energy Lender Price Survey
RESERVE BASE LENDING AND THE OUTLOOK FOR SHALE OIL AND GAS FINANCE
energypolicy.columbia.edu | MAY 2017 | 19
Banks’ conservatism on price decks prior to the oil price crash proved instrumental in supporting their borrowers duringthedowntime.Whenspotoilcollapsedtobelow$40perbarrelandfive-yearfuturestradedbelow$60perbarrel, the banks maintained a price deck that was slightly below the oil futures and occasionally even above the NYMEX Futures prices. By using price decks close to NYMEX Futures, banks showed strong support for their clients in borrowing base redeterminations. As shown above, the current average banks’ price deck is just slightly below the NYMEX Futures.
In addition to pricing, the size of these credit facility revolvers for most small and midsize E&Ps are determined through a borrowing base calculation, which is directly correlated to oil and gas future pricings. In 2014, the majority of lender banks’ price decks were noticeably below the NYMEX Futures at the time, providing a substantial cushion against the fall of oil and gas prices in calculating borrowing base. As shown above, this time around, most of the banks’ price decks were on par with NYMEX Futures, allowing no cushion. Therefore, further declines in oil prices would directly impact the borrowing capacity of oil producers.
Oil Crash and Access to Capital Market
The generosity of debt and equity capital markets toward oil and gas companies ended abruptly in the fourth quarter of 2014, as markets had little appetite for oil and gas issuers. While larger companies could still appease their investors with convertibles and preferred shares, the sky was gloomier for small and midsize E&Ps.
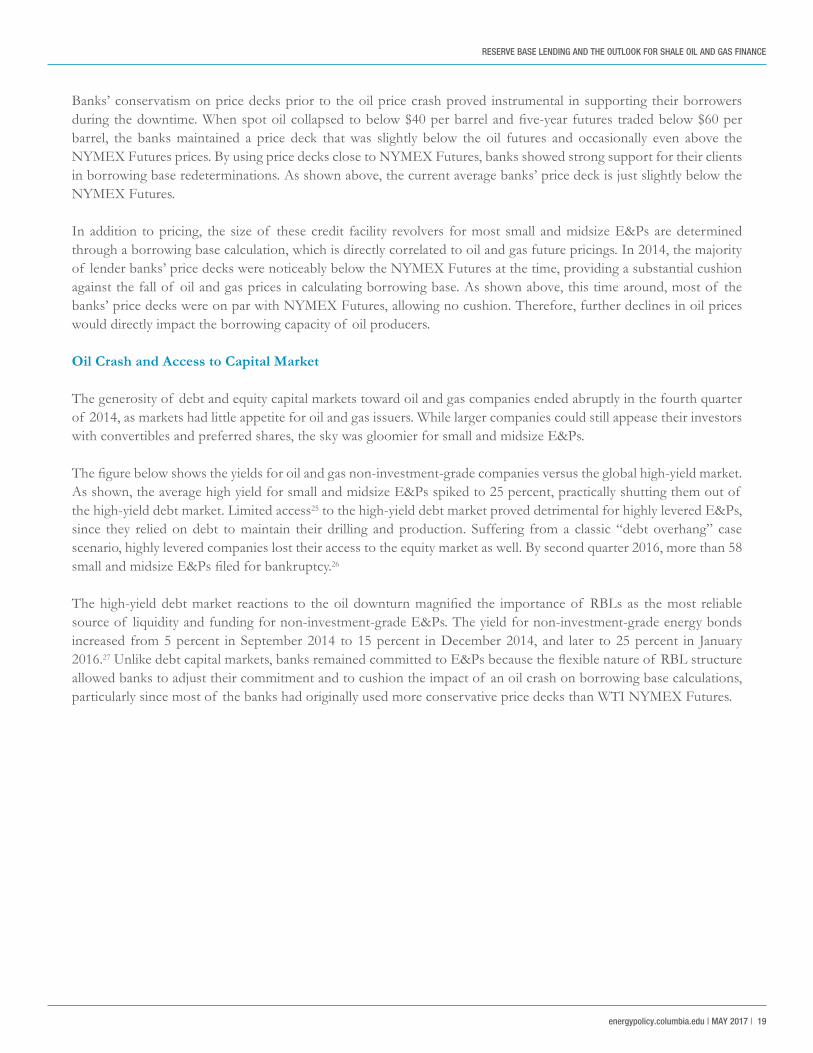
Thefigurebelowshowstheyieldsforoilandgasnon-investment-gradecompaniesversustheglobalhigh-yieldmarket.As shown, the average high yield for small and midsize E&Ps spiked to 25 percent, practically shutting them out of the high-yield debt market. Limited access25 to the high-yield debt market proved detrimental for highly levered E&Ps, since they relied on debt to maintain their drilling and production. Suffering from a classic “debt overhang” case scenario, highly levered companies lost their access to the equity market as well. By second quarter 2016, more than 58 smallandmidsizeE&Psfiledforbankruptcy.26
Thehigh-yielddebtmarket reactions to theoildownturnmagnified the importanceof RBLsas themost reliablesource of liquidity and funding for non-investment-grade E&Ps. The yield for non-investment-grade energy bonds increased from 5 percent in September 2014 to 15 percent in December 2014, and later to 25 percent in January 2016.27Unlikedebtcapitalmarkets,banksremainedcommittedtoE&Psbecausetheflexiblenatureof RBLstructureallowed banks to adjust their commitment and to cushion the impact of an oil crash on borrowing base calculations, particularly since most of the banks had originally used more conservative price decks than WTI NYMEX Futures.
RESERVE BASE LENDING AND THE OUTLOOK FOR SHALE OIL AND GAS FINANCE
20 | CENTER ON GLOBAL ENERGY POLICY | COLUMBIA SIPA
Source: S&P Presentation on Global Oil Market, November 2016
Adjusting to Low Prices: Low Oil a New Reality
The collapse of oil to below $50 per barrel in 4Q 2014 exposed many small and midsize North American companies to a declining reserve base. The large number of those that made acquisitions at the peak found themselves having overpaid for high-cost reserves, largely with debt. With the continued low price environment in 2015, the equity value of manyoilproducerswaswipedout,puttingthemonthevergeof bankruptcy.AsSaudiArabiafloodedthemarketwith oil,28 North American oil companies responded by cutting capital expenditures, canceling future developments, and lowering the operating cost to the extent that they could while maintaining existing production. Although the industry has becomemore efficient with the lowering of cost, due to shale’s sharp decline rate, ongoing capitalspending is required to maintain production at the same level. For many companies, getting funds proved to be impossible,forcingthemintobankruptcy,asshowninfigure13.
Figure12:Followingoildroptobelow$30/Bbl,averageyieldforoilandgasspeculativegradepeaked

RESERVE BASE LENDING AND THE OUTLOOK FOR SHALE OIL AND GAS FINANCE
energypolicy.columbia.edu | MAY 2017 | 21
Data Source: Petroleum Listing Services (PLS)
Covenants and Amendments
Forhighlyleveragedcompanieswithsubstantialfixedproductioncosts,thedisappearanceof half theirEBITDAXas a result of low oil prices meant a breach of leverage covenants. The leverage convents are typically calculated as totaldebtdividedbylasttwelvemonth(LTM)EBITDAX.Consequently,inthefirstandsecondquartersof 2015,alargewaveof amendmentrequestsfromthesecompaniescametowardthebankstowaiveorredefinetheleveragecovenants. Depending on the company’s position, the requests included raising the covenant level from 4.0x to above 5.5x. In many cases, companies that had large unsecured notes outstanding requested their covenants be revised to take into account only secured debt (balance on the revolver) rather than total debt.
These covenant reliefs provided an opportunity for these producers to improve their EBITDAX by lowering the cost andrepayingaportionof theirdebtbydivestingnoncoreassets.Inadditiontoassetsalestofixtheirbalancesheets,manycompaniesofferedunsecuredandjuniornoteholderscashand/orsecond-orthird-liensecureddebtpositionsin exchange for a haircut on the notes. As the unsecured notes were traded at heavy discounts—in some cases below 30 cents on the dollar—exchanging the notes for a secured position below the RBL facility for a moderate haircut seemed a rational decision formany investors. Lowering the debt helped the borrower both on leverage (debt/EBITDAX)andcoveragecovenants(interestexpenses/EBITDAX).
Figure13:Bankruptcyfilingspeakedin2ndquarter2016
RESERVE BASE LENDING AND THE OUTLOOK FOR SHALE OIL AND GAS FINANCE
22 | CENTER ON GLOBAL ENERGY POLICY | COLUMBIA SIPA
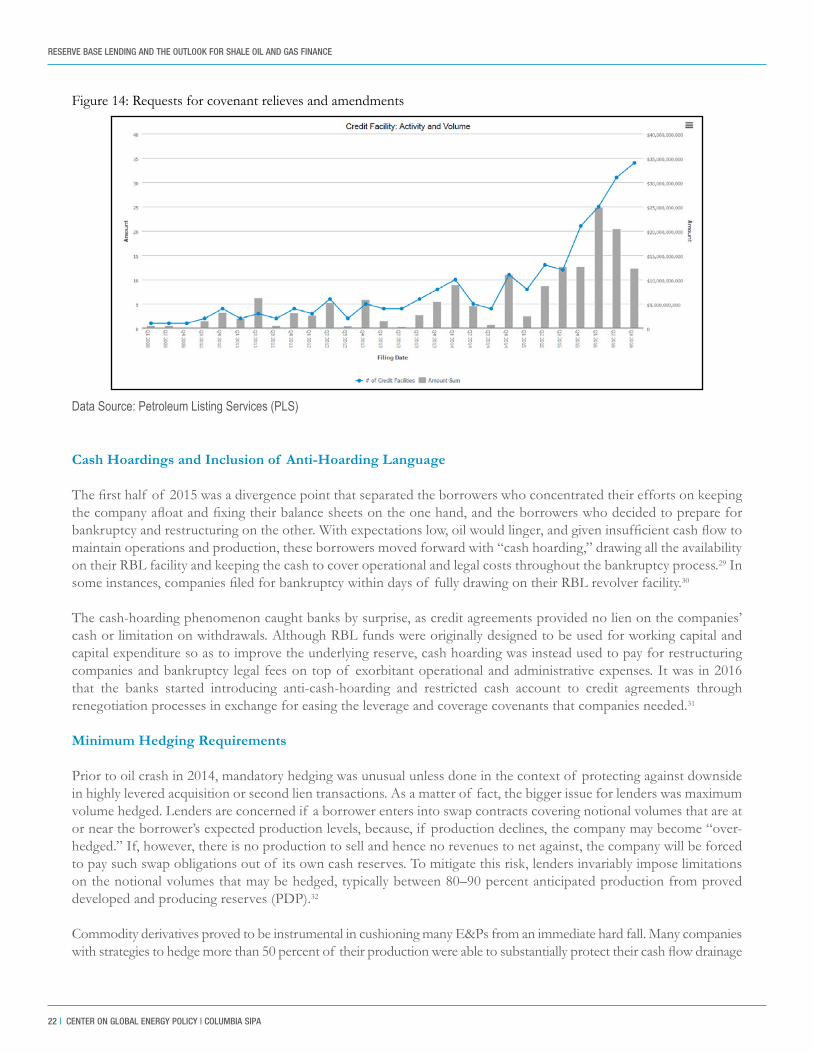
Figure 14: Requests for covenant relieves and amendments
Data Source: Petroleum Listing Services (PLS)
Cash Hoardings and Inclusion of Anti-Hoarding Language Thefirsthalf of 2015wasadivergencepointthatseparatedtheborrowerswhoconcentratedtheireffortsonkeepingthecompanyafloatandfixingtheirbalancesheetsontheonehand,andtheborrowerswhodecidedtoprepareforbankruptcyandrestructuringontheother.Withexpectationslow,oilwouldlinger,andgiveninsufficientcashflowtomaintain operations and production, these borrowers moved forward with “cash hoarding,” drawing all the availability on their RBL facility and keeping the cash to cover operational and legal costs throughout the bankruptcy process.29 In someinstances,companiesfiledforbankruptcywithindaysof fullydrawingontheirRBLrevolverfacility.30
The cash-hoarding phenomenon caught banks by surprise, as credit agreements provided no lien on the companies’ cash or limitation on withdrawals. Although RBL funds were originally designed to be used for working capital and capital expenditure so as to improve the underlying reserve, cash hoarding was instead used to pay for restructuring companies and bankruptcy legal fees on top of exorbitant operational and administrative expenses. It was in 2016 that the banks started introducing anti-cash-hoarding and restricted cash account to credit agreements through renegotiation processes in exchange for easing the leverage and coverage covenants that companies needed.31
Minimum Hedging Requirements
Prior to oil crash in 2014, mandatory hedging was unusual unless done in the context of protecting against downside in highly levered acquisition or second lien transactions. As a matter of fact, the bigger issue for lenders was maximum volume hedged. Lenders are concerned if a borrower enters into swap contracts covering notional volumes that are at or near the borrower’s expected production levels, because, if production declines, the company may become “over-hedged.” If, however, there is no production to sell and hence no revenues to net against, the company will be forced to pay such swap obligations out of its own cash reserves. To mitigate this risk, lenders invariably impose limitations on the notional volumes that may be hedged, typically between 80–90 percent anticipated production from proved developed and producing reserves (PDP).32
Commodity derivatives proved to be instrumental in cushioning many E&Ps from an immediate hard fall. Many companies withstrategiestohedgemorethan50percentof theirproductionwereabletosubstantiallyprotecttheircashflowdrainage
RESERVE BASE LENDING AND THE OUTLOOK FOR SHALE OIL AND GAS FINANCE
energypolicy.columbia.edu | MAY 2017 | 23
from the impact of low oil prices. More importantly, since RBL structure takes into account oil and gas derivatives in calculations of borrowing base capacity, these companies were able to maintain a strong liquidity position. Following the 2014 oil crash, many lenders began to require that portions of production be hedged. Minimum hedge requirements are designed to lower the lenders’ risk against price volatilities, particularly for borrowers with relatively higher operating costs.33
Following the 2014 oil crash, many lenders began to require that portions of production be hedged. Minimum hedge requirements are designed to lower the lenders’ risk against price volatilities, particularly for borrowers with relatively higher operating costs.34
Limitation on Second-Lien and Third-Lien Debt
As discussed earlier, the OCC’s repayment test recommends a reasonable repayment period of 60 percent of the reserve’s economic life for RBL, and 75 percent of the reserve’s economic life for total secured debt. In practice, the testrestrictsexcessiveborrowingbyensuringthattheleveredcashflowisadequatetorepaythedebt.In2011–15,manyE&Psused second- and third-lien debt to fund capital spending and cover their negative free cashflows.35 Althoughthispracticemaynotdirectlyimpactfirst-lienlenders,theadditionaldebtandassociatedinterestexpenseslimit the company’s cash available for debt repayment.
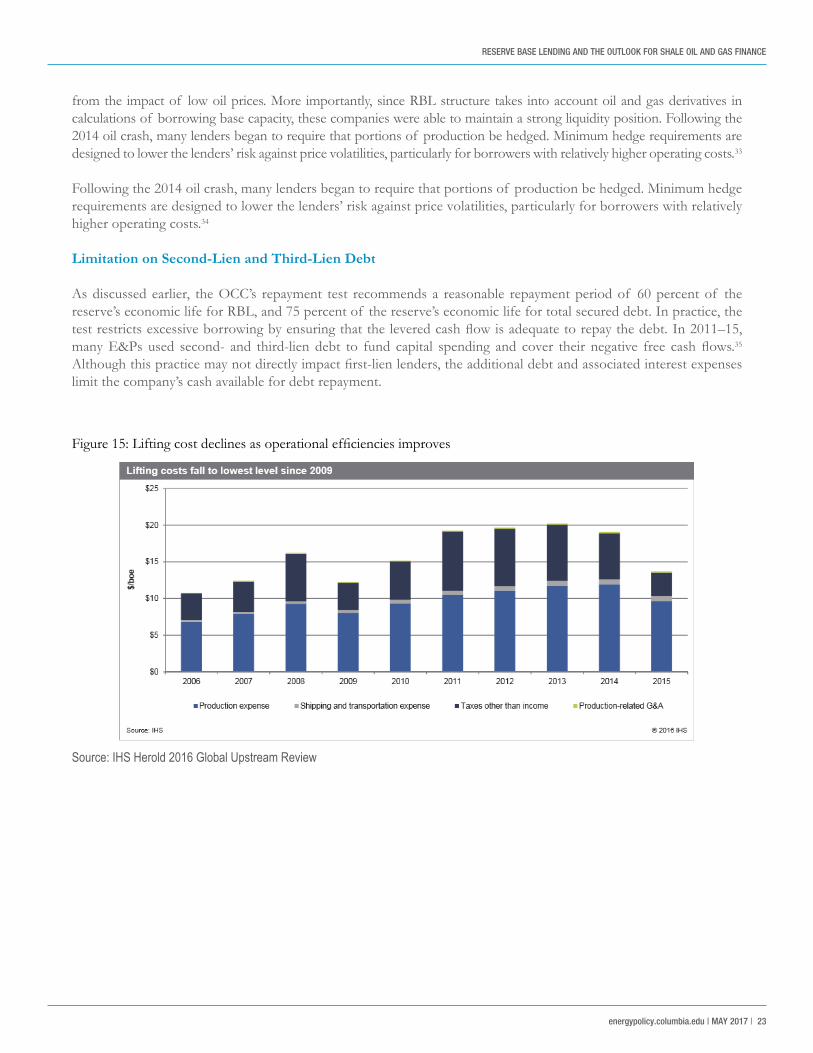
Source: IHS Herold 2016 Global Upstream Review
Figure15:Liftingcostdeclinesasoperationalefficienciesimproves
RESERVE BASE LENDING AND THE OUTLOOK FOR SHALE OIL AND GAS FINANCE
24 | CENTER ON GLOBAL ENERGY POLICY | COLUMBIA SIPA
FUTURE CHALLENGESOperational Efficiencies versus Higher Interest Expense
NorthAmericanE&Ps are significantlymore efficient today than in 2014 in almost all basinswhere share oil isproduced. Lease operating expense (LOE) in production costs has been declining per unit of production.36 Figure 15 shows how average lifting costs declined from the peak of $20 per BOE in 2013 to less than $14 per BOE in 2015. In other words, a 30 percent reduction in lifting cost was the industry’s response to the downturn. The reduction in production costs allowed continued production from shale reserves even at prices below $40 a barrel. Today, with oil around $50 per barrel, many producers maintain healthy cash margins.
However, the current equilibrium could be challenged. With the expectation the Fed will continue to increase rates, oil hovering at $50 a barrel, and higher credit spreads, small and midsize North American E&Ps may face the same oldchallengeof highcostof capital.Asshownearlierinfigure1,in2007,theLIBORrateaveragedabove500bps(5percent) compared with today’s LIBOR rate, which is around 100 bps (1 percent).
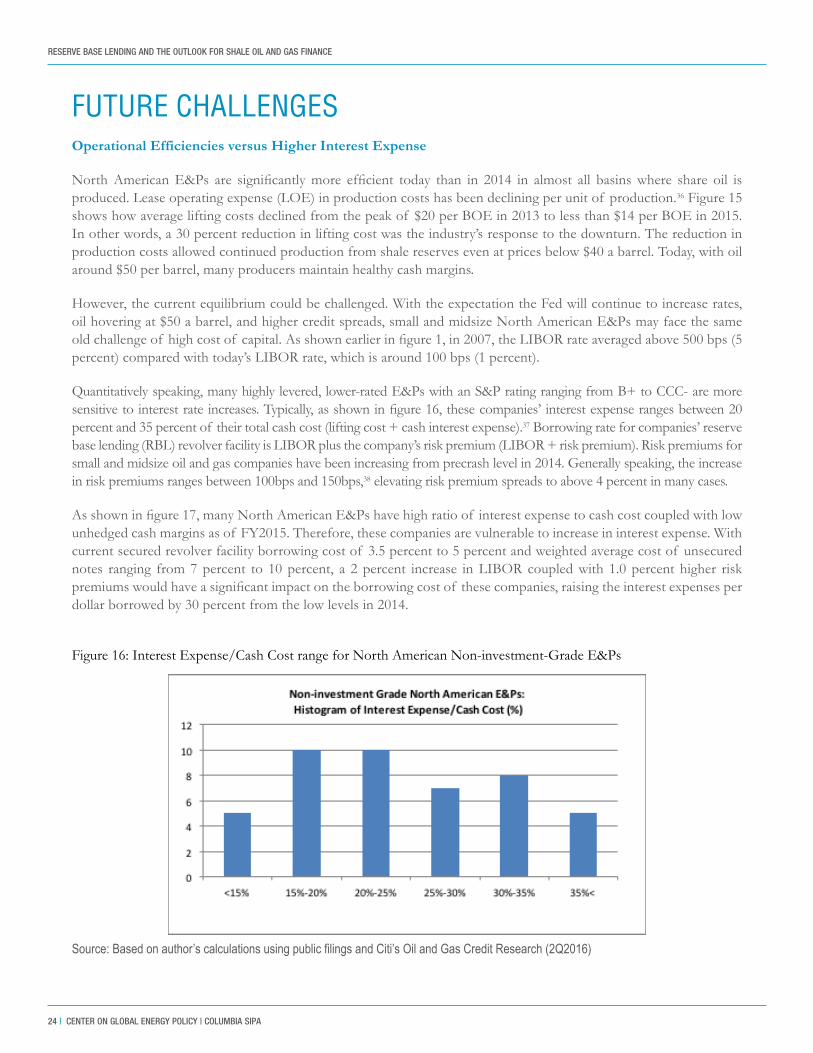
Quantitatively speaking, many highly levered, lower-rated E&Ps with an S&P rating ranging from B+ to CCC- are more sensitivetointerestrateincreases.Typically,asshowninfigure16,thesecompanies’interestexpenserangesbetween20percent and 35 percent of their total cash cost (lifting cost + cash interest expense).37 Borrowing rate for companies’ reserve base lending (RBL) revolver facility is LIBOR plus the company’s risk premium (LIBOR + risk premium). Risk premiums for small and midsize oil and gas companies have been increasing from precrash level in 2014. Generally speaking, the increase in risk premiums ranges between 100bps and 150bps,38 elevating risk premium spreads to above 4 percent in many cases.
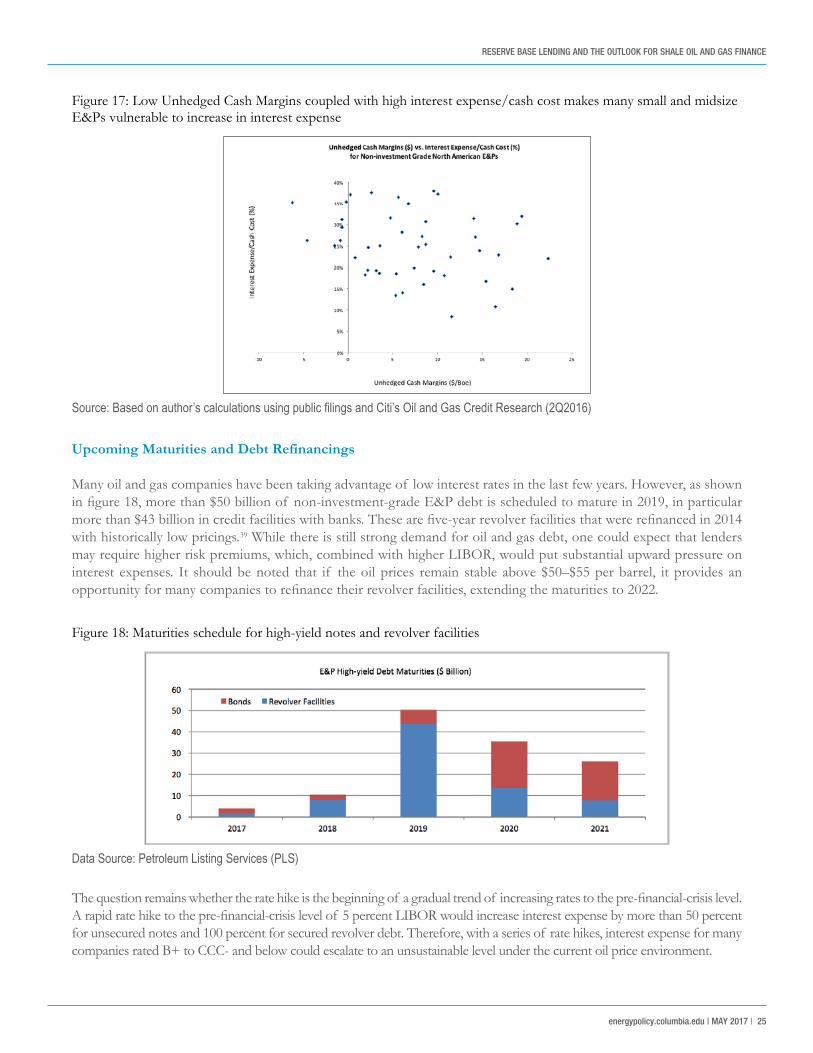
Asshowninfigure17,manyNorthAmericanE&Pshavehighratioof interestexpensetocashcostcoupledwithlowunhedged cash margins as of FY2015. Therefore, these companies are vulnerable to increase in interest expense. With current secured revolver facility borrowing cost of 3.5 percent to 5 percent and weighted average cost of unsecured notes ranging from 7 percent to 10 percent, a 2 percent increase in LIBOR coupled with 1.0 percent higher risk premiumswouldhaveasignificantimpactontheborrowingcostof thesecompanies,raisingtheinterestexpensesperdollar borrowed by 30 percent from the low levels in 2014.
Figure16:InterestExpense/CashCostrangeforNorthAmericanNon-investment-GradeE&Ps
Source: Based on author’s calculations using public filings and Citi’s Oil and Gas Credit Research (2Q2016)
RESERVE BASE LENDING AND THE OUTLOOK FOR SHALE OIL AND GAS FINANCE
energypolicy.columbia.edu | MAY 2017 | 25
Thequestionremainswhethertheratehikeisthebeginningof agradualtrendof increasingratestothepre-financial-crisislevel.Arapidratehiketothepre-financial-crisislevelof 5percentLIBORwouldincreaseinterestexpensebymorethan50percentfor unsecured notes and 100 percent for secured revolver debt. Therefore, with a series of rate hikes, interest expense for many companies rated B+ to CCC- and below could escalate to an unsustainable level under the current oil price environment.
Upcoming Maturities and Debt Refinancings
Many oil and gas companies have been taking advantage of low interest rates in the last few years. However, as shown infigure18,morethan$50billionof non-investment-gradeE&Pdebtisscheduledtomaturein2019,inparticularmorethan$43billionincreditfacilitieswithbanks.Thesearefive-yearrevolverfacilitiesthatwererefinancedin2014with historically low pricings.39 While there is still strong demand for oil and gas debt, one could expect that lenders may require higher risk premiums, which, combined with higher LIBOR, would put substantial upward pressure on interest expenses. It should be noted that if the oil prices remain stable above $50–$55 per barrel, it provides an opportunityformanycompaniestorefinancetheirrevolverfacilities,extendingthematuritiesto2022.
Figure17:LowUnhedgedCashMarginscoupledwithhighinterestexpense/cashcostmakesmanysmallandmidsizeE&Ps vulnerable to increase in interest expense
Source: Based on author’s calculations using public filings and Citi’s Oil and Gas Credit Research (2Q2016)
Figure 18: Maturities schedule for high-yield notes and revolver facilities
Data Source: Petroleum Listing Services (PLS)
RESERVE BASE LENDING AND THE OUTLOOK FOR SHALE OIL AND GAS FINANCE
26 | CENTER ON GLOBAL ENERGY POLICY | COLUMBIA SIPA
CONCLUSIONLow interest rates coupled with high oil prices have been the catalyst for the expansion of shale oil. Low oil prices and the subsequent bankruptcies in theNorth American E&P sectormade banksmore efficient and selective,triggering a series of improvements in RBL covenant structures, including anti-cash hoarding clauses, restricted cash, and minimum hedge requirements as well as limitations on additional liens on reserves. With the volatile nature of the high-yield-debt capital market, RBLs proved to be the most reliable source of liquidity for non-investment-grade oil and gas producers.
With more $25 billion of North American E&P high-yield debt coming due in the next few years and the upward pressure on credit spreads, the ultimate direction of small and midsize E&Ps in North America depends on future interestrates.Whiletechnologicalandoperationalefficiencieshavereducedliftingcostsby50percentinsomebasins,the challenge lies ahead, since access to low-cost debt is essential for many small and midsize oil producers. If rate hikes continue at 50 bps per year, LIBOR will be above 2 percent by the end of 2018. LIBOR at 2 percent, coupled with 150 bps (1.5 percent) higher credit spreads, would result in a more than 30 percent increase in companies’ new debtinterestexpense,wipingoutasignificantportionof gainsmadefromoperationalefficiencies.If LIBORrisestoapre-financial-crisislevelof above5percent,thecostof unsecureddebtforsmallandevenmidsizeproducerscould exceed 10–12 percent. Since shale oil production is highly capital intensive, during low oil price environment, the high cost of debt drives up total cost of exploration and production to an unsustainable level for highly-levered small and midsize E&Ps. This high cost of capital could result in a market environment in favor of larger players with access to debt and equity capital markets at a lower cost.
If oil prices remain above $55–$60 a barrel for a sustained period, improved cash margins would allow small and midsizeproducerstoabsorbtheincreaseinthefundingcost.Theproductionfreeze/cutagreementbetweenOPECand non-OPEC producers has put an upward pressure on prices. A high oil scenario coupled with a slow, gradual increase in rates would be the best-case scenario for North American E&Ps.
The worst-case scenario for North American oil and gas producers would be further drops in oil price coupled withagradual increaseininterestratestothepre-financial-crisis level.ThiscombinationwoulddrivemanymoreNorth American producers out of business. Low oil would shrink borrowing capacities, impeding necessary capital spendingtomaintainproductionwhilehighinterestratesdevourcompanies’cashflows.
In short, the oil downturn has put substantial pressure on non-investment-grade North American E&Ps. While operationalefficiencieshaveloweredcashcosts,manysmallandmidsizeoilproducersarestillsensitivetohighercost of capitalization. With oil hovering around $50 a barrel and credit spreads rising from their pre-oil-crash lows, the fate of small and midsize producers depends heavily on the direction of interest rates and the Fed’s policies over the next few years.

RESERVE BASE LENDING AND THE OUTLOOK FOR SHALE OIL AND GAS FINANCE
energypolicy.columbia.edu | MAY 2017 | 27
NOTES1 EIA, “U.S. Crude Production,” https://www.eia.gov/dnav/pet/hist/LeafHandler.ashx?n=PET&s=MCRFPUS2&f=A.
2 EIA, “Drilling and Productivity Report,”http://www.eia.gov/petroleum/drilling/.
3 IHS Herold 2016 Global Upstream Review.
4 Gregory Zuckerman, The Frackers: The Outrageous Inside Story of the New Billionaire Wildcatters (London: Portfolio, 2013).
5 J.M. Carey, “How Unconventional Oil and Gas Is Supercharging the US Economy,” Forbes,December13,2012.https://www.forbes.com/sites/energysource/2012/12/13/how-unconventional-oil-and-gas-is-transforming-the-u-s-economy/#7040f5fb16fc.
6 Investopedia, “The Price That Must Be Asset Sold to Recover the Cost of Acquiring or Owning It.” http://www.investopedia.com/terms/b/breakeven-price.asp.
7 Rystad, “U.S. Shale Break-Even Prices in 2017,” http://www.worldoil.com/news/2017/2/28/rystad-examines-what-to-expect-from-us-shale-break-even-prices-in-2017.
8 EIA, “Future US Tight Oil and Shale Gas Production Depends On Resources, Technology, Markets,” http://www.eia.gov/todayinenergy/detail.php?id=27612.
9 US Economic Outlook, “The Balance,” https://www.thebalance.com/us-economic-outlook-3305669.
10 S&PCapitalIQGlobalMarketIntelligenceisamultinationalfinancialinformationproviderandisdivisionof S&PGlobalInc.(NYSE: SPGI), headquartered in New York City.
11 EBITDA: Calculated as earnings before interest expense, tax, and depreciation.
12 Paul O’Donnell, IHS-Herold, “Global Upstream Performance Review: Fourth-Quarter 2015 Impairments Reported by North American E&P Group,” https://connectfiles.ihs.com/AkamaiFileDownload.ashx?p=heroldReports&p=RRC160308_20161027061534618.pdf&name=RRC160308.pdf×tamp=1457519614&__gda__=1488078669_d1c5cdb9b6f717d6362f435c3e76119f.
13 OilandGasreservesvalueisbookedunderPP&E,alsocalledfixedassets.
14 Securities and Exchange Commission, “Modernization of Oil and Gas Reporting,” https://www.sec.gov/rules/final/2008/33-8995.pdf.
14 Impairment is the accounting term for a permanent reduction in the value of a company’s asset. In this study it refers to the value of oil and gas reserves.
16 Investopedia, “Accounting for Differences in Oil and Gas Accounting,” http://www.investopedia.com/articles/fundamental-analysis/08/oil-gas.asp.
17 A syndicated loan or credit facility is one that is provided by a party of lenders (a syndicate) that is structured, arranged, and administered by one or more commercial banks or investment banks (known as the lead arrangers).
18 Macquarie, “Energy Lender Price Survey,” http://www.macquarie.com/mgl/com/energy-AD/publications/survey.

RESERVE BASE LENDING AND THE OUTLOOK FOR SHALE OIL AND GAS FINANCE
28 | CENTER ON GLOBAL ENERGY POLICY | COLUMBIA SIPA
19 Officeof ComptrollerCurrency(OCC),Comptroller’s Handbook, Oil and Gas Exploration and Production Lending, https://www.occ.treas.gov/publications/publications-by-type/comptrollers-handbook/pub-ch-og.pdf.
20 Investopedia:Futuresarefinancialcontractsobligatingthebuyertopurchaseanassetorthesellertosellanasset,suchasaphysicalcommodityorafinancial instrument,atapredeterminedfuturedateandprice;seehttp://www.investopedia.com/terms/f/futures.asp.
21 Investopedia: A bullet repayment is a lump sum payment for the entirety of a loan amount paid at maturity. See www.investopedia.com/terms/b/bulletrepayment.asp.
22 Ibid.:LeverageRatio(Debt/EBITDA),Debt/EBITDAisameasureof acompany’sability to pay off its incurred debt. See http://www.investopedia.com/terms/d/debt_edbitda.asp
23 Ibid.: Liquidity ratios attempt to measure a company’s ability to pay off its short-term debt obligations. See http://www.investopedia.com/university/ratios/liquidity-measurement/.
24 EBITDAX: Earnings before interest, taxes, depreciation, depletion, amortization, and exploration expenses.
25 Oil and Gas Investor, “US E&Ps Access to Debt Capital Shrinks,” http://www.oilandgasinvestor.com/us-eps-access-debt-capital-shrinks-811416.
26 Law360, “Oil Price Stability Won’t Eliminate Lenders’ Caution,” https://www.law360.com/texas/articles/840340/oil-price-stability-won-t-eliminate-lenders-caution.
27 S&P’s Presentation on Global Oil Market, November 2016.
28 Foreign Policy,“WhyWouldtheSaudisDeliberatelyCrashtheOilMarkets?”http://foreignpolicy.com/2014/12/18/why-would-the-saudis-crash-oil-markets-iran.
29 Forbes, “Draw First, Ask Questions Later: Why Oil and Gas Companies Are Fully Tapping Their Revolvers before Restructuring,” https://www.forbes.com/sites/maxfrumes/2016/02/16/draw-first-ask-questions-later-why-oil-and-gas-companies-are-fully-tapping-their-revolvers-before-restructuring/#41844884697b.
30 Reuters, “Energy Companies Drain Loans before Banks Clamp Down,” http://www.reuters.com/article/us-energy-loans-idUSKCN0WJ257.
31 Bloomberg, “Wall Street’s Looking for More Ways to Rein in Energy Borrowers,” https://www.bloomberg.com/news/articles/2016-05-19/wall-street-s-looking-for-more-ways-to-rein-in-energy-borrowers.
32 Oil and Gas Financial Journal, “Reserve Based Finance,” April, 2014, http://www.ogfj.com/articles/print/volume-11/issue-1/features/reserve-based-finance.html.
33 “OCC Guidelines for E&P Reserve-Based Loans,” Louisiana Energy Conference, June 2016, http://www.louisianaenergyconference.com/webdocs/2016_presentations/BankingPanelOCC%202016%20E&P%20Guidelines%20-%20June%202016.pdf.
34 Ibid.
35 Deloitte, “The Crude Downturn for Exploration & Production Companies,” https://www2.deloitte.com/content/dam/Deloitte/ro/Documents/energy-resources/us-er-crude-downturn-2016.pdf.

RESERVE BASE LENDING AND THE OUTLOOK FOR SHALE OIL AND GAS FINANCE
energypolicy.columbia.edu | MAY 2017 | 29
36 IHS Herold 2016 Global Upstream Review.
37 Basedontheauthor’scalculationsusingpublicfilingsandCiti’sOilandGasCreditResearch(2Q206).
38 “OCC Guidelines for E&P Reserve-Based Loans,” Louisiana Energy Conference, June 2016, http://www.louisianaenergyconference.com/webdocs/2016_presentations/BankingPanelOCC%202016%20E&P%20Guidelines%20-%20June%202016.pdf.
39 Petroleum Listing Services (PLS).

The Kurdish Regional Government completed the construction and commenced crude exports in an independent export pipeline connecting KRG oilfields with the Turkish port of Ceyhan. The first barrels of crude shipped via the new pipeline were loaded into tankers in May 2014. Threats of legal action by Iraq’s central government have reportedly held back buyers to take delivery of the cargoes so far. The pipeline can currently operate at a capacity of 300,000 b/d, but the Kurdish government plans to eventually ramp-up its capacity to 1 million b/d, as Kurdish oil production increases.
Additionally, the country has two idle export pipelines connecting Iraq with the port city of Banias in Syria and with Saudi Arabia across the Western Desert, but they have been out of operation for well over a decade. The KRG can also export small volumes of crude oil to Tur-key via trucks.