Research scope Material Membrane - SINTEF · Research scope 1. Preparation of highly CO 2 permeable...
54
Transcript of Research scope Material Membrane - SINTEF · Research scope 1. Preparation of highly CO 2 permeable...

1
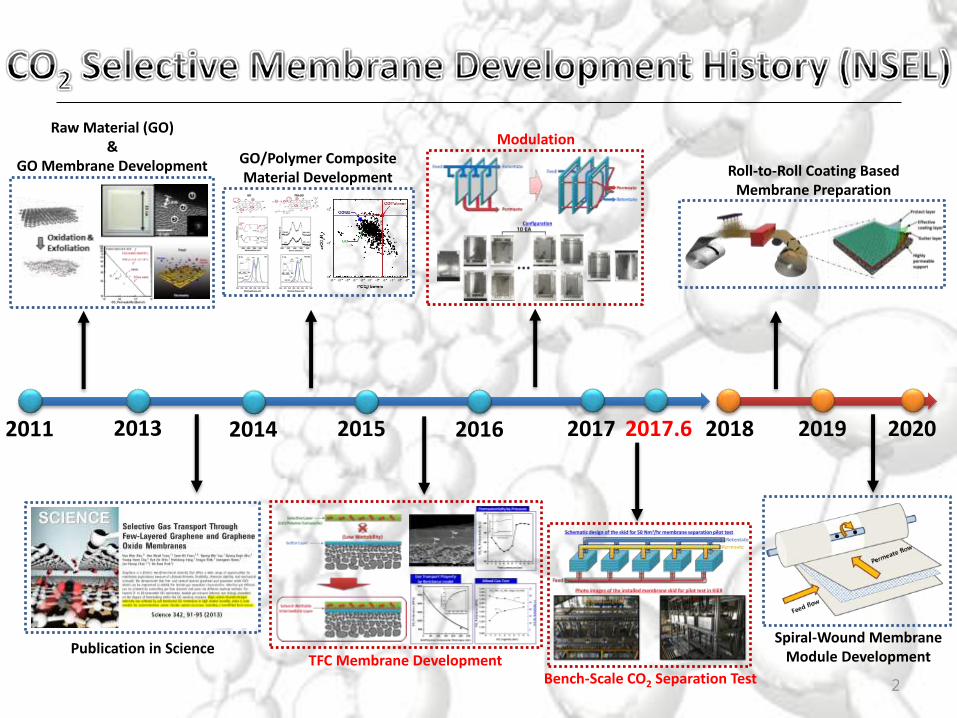
Research scope 1. Preparation of highly CO2 permeable TFC membrane 2. Membrane based bench-scale CO2 separation system development
Raw Material Development Membrane Modulation Process Design
Material Membrane
Modulation Process Design
Integrated Membrane Based CO2 Separation System for Post Combustion Fossil Fuel Power Plant
2
2011 2013 2014 2015 2016 2017 2017.6 2018 2019 2020
Raw Material (GO) &
GO Membrane Development
Publication in Science
GO/Polymer Composite Material Development
Modulation
Bench-Scale CO2 Separation Test TFC Membrane Development
Roll-to-Roll Coating Based Membrane Preparation
Spiral-Wound Membrane Module Development

3
Gas Separation Systems Developed by MTR
CO2/N2 Separation Performance of PolarisTM Membrane
MTR
Membrane Fabrication Devices (Width: 70 cm)
CO2/N2 Separation Performance of PolyactiveTM Membrane
GKSS-HZG
• References: 335 Final Technical Report - MTR, (2009), 24-25 Journal of Membrane Science, 359, (2010), 126-139 Journal of Membrane Science, 489, (2016), 237-247 Chemical Ingenieur Technik, 85, (2013), 1210-1220
4
Membrane Preparation

5
Resistance A
Resistance B
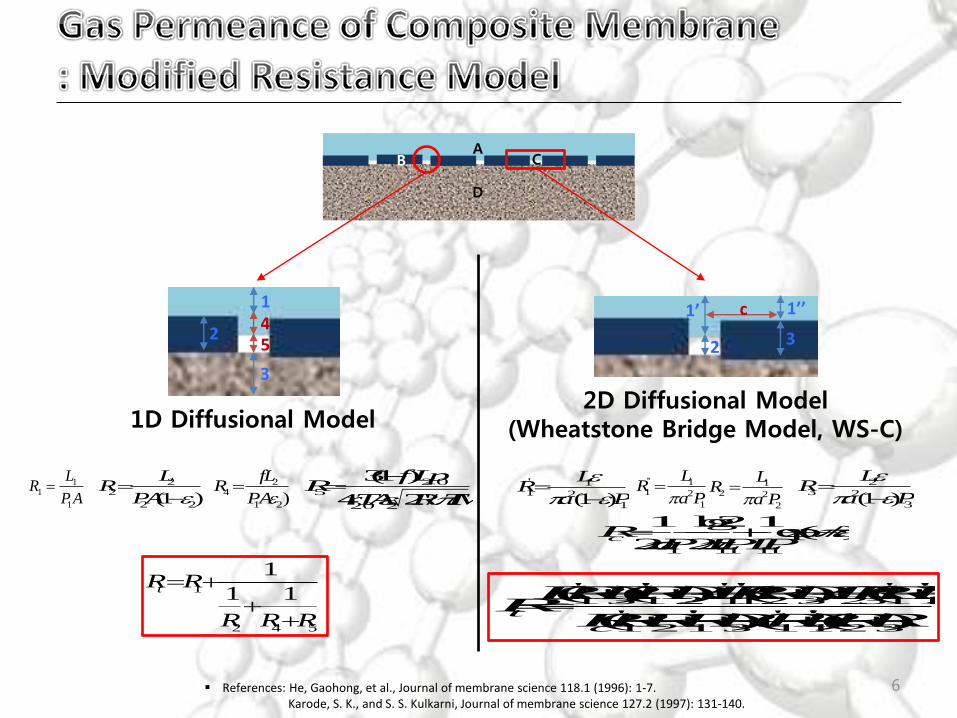
Resistance of Composite membrane
RA RB
-1
A BC
A B
l lJ
P P
P : Permeability , J : Permeance 3
2
cm
cm s cmHg
3
2
cm cm
cm s cmHg
Permeance of Composite membrane
Reference: J.M.S Henis, et al., J. Membr. Sci., 1981, 8,233-246
A
C TABc ABRRRRRR
C A BR RR
B
6
1D Diffusional Model
References: He, Gaohong, et al., Journal of membrane science 118.1 (1996): 1-7. Karode, S. K., and S. S. Kulkarni, Journal of membrane science 127.2 (1997): 131-140.
A C
D
B
1
2
3
4 5
1’ c 1’’
2 3
2D Diffusional Model (Wheatstone Bridge Model, WS-C)
11
1
LR
P A 2
2
2 2(1 )
LR
PA
24
1 2)
fLR
PA 20
5
20 2
3(1 )
4 2'/
fLpR
rTA RTM
1
2 4 5
1
1 1tR R
R R R
' '' ' '' ' ''
1312 1123 2311
' '' ' ''
1213 1123
( )( ) ( ) ( )
( )( )( )
ct
c
RRRRRRRRRRRRRR
RRRRRRRRR
' 11 2
1(1 )
LR
a P
'' 11 2
1
LR
a P 1
2 2
2
LR
a P 2
3 2
3(1 )
LR
a P
1 11 11
1 log21exp(/)
2 2cR
aPLPLP

7
8
2
0
2
01.6
A
q K
0
0
2Br
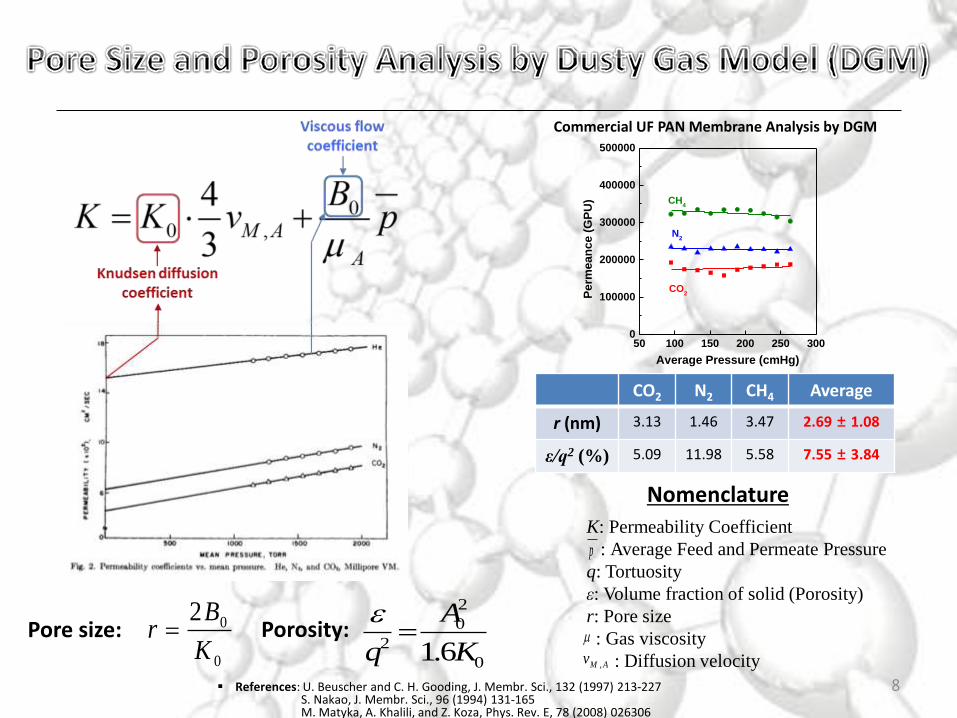
KPore size: Porosity:
K: Permeability Coefficient
: Average Feed and Permeate Pressure
q: Tortuosity
ε: Volume fraction of solid (Porosity)
r: Pore size
: Gas viscosity
: Diffusion velocity
p
,M Av
References: U. Beuscher and C. H. Gooding, J. Membr. Sci., 132 (1997) 213-227 S. Nakao, J. Membr. Sci., 96 (1994) 131-165 M. Matyka, A. Khalili, and Z. Koza, Phys. Rev. E, 78 (2008) 026306
Nomenclature
50 100 150 200 250 3000
100000
200000
300000
400000
500000
Perm
ean
ce
(G
PU
)
Average Pressure (cmHg)
CH4
N2
CO2
Commercial UF PAN Membrane Analysis by DGM
CO2 N2 CH4 Average
r (nm) 3.13 1.46 3.47 2.69 ± 1.08
ε/q2 (%) 5.09 11.98 5.58 7.55 ± 3.84

9
Gutter Layer
Selective Layer
Substrate
Calculation Condition • Selective layer(GO/Polymer): CO2 permeability : 450 Barrer, CO2/N2 : 67 • Gutter layer(Teflon): CO2 permeability : 3900 Barrer, CO2/N2 : 5, Thickness: 100 nm • Substrate permeance: ~130,000 GPU

10
100 200 300 400 5000
1000
2000
3000
4000
5000
6000
7000
8000
50,000 GPU30,000 GPU10,000 GPU
CO
2 P
erm
ean
ce (
GP
U)
Selective Layer Thickness (nm)
5,000 GPU
Calculation Condition • Selective layer properties: CO2 450 barrer, CO2/N2 67
100 200 300 400 50020
25
30
35
40
45
50
55
60
65
7050,000 GPU
30,000 GPU
10,000 GPU
CO
2/N
2 S
ele
cti
vit
y (
-)
Selective Layer Thickness (nm)
5,000 GPU
At least 30,000 GPU of gutter layer is required for 4000 GPU of CO2 permeable membrane
Gutter Layer Permeance

Calculation Condition • Sylgard184 - CO2 permeability : 3800 Barrer, CO2/N2 : 9.5 • AF2400 - CO2 permeability : 3900 Barrer, CO2/N2 : 5 • PAN membrane permeance: ~130,000 GPU
PDMS(Sylgard184) Teflon(AF2400)
• References: Pinnau, I.; Toy, L. G., J. Membr. Sci., 1996, 109, 125 J.M.S Henis, et al., J. Membr. Sci., 1981, 8,233-246

12
Solvent-Wettable Intermediate Layer
Before
Intermediate Layer
Coating
After
Intermediate Layer
Coating
0
10
20
30
40
50
60
70
80
Co
nta
ct
An
gle
(o)
Gutter Layer (Sylgard 184)
(Low Wettability)
Selective Layer
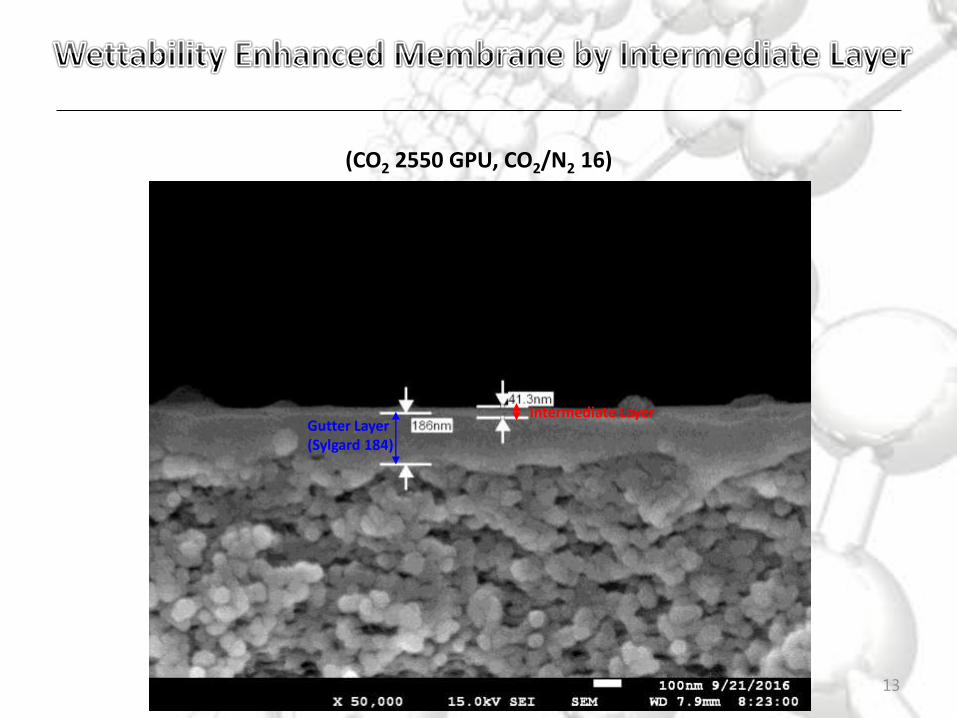
13
(CO2 2550 GPU, CO2/N2 16)
Gutter Layer (Sylgard 184)
Intermediate Layer
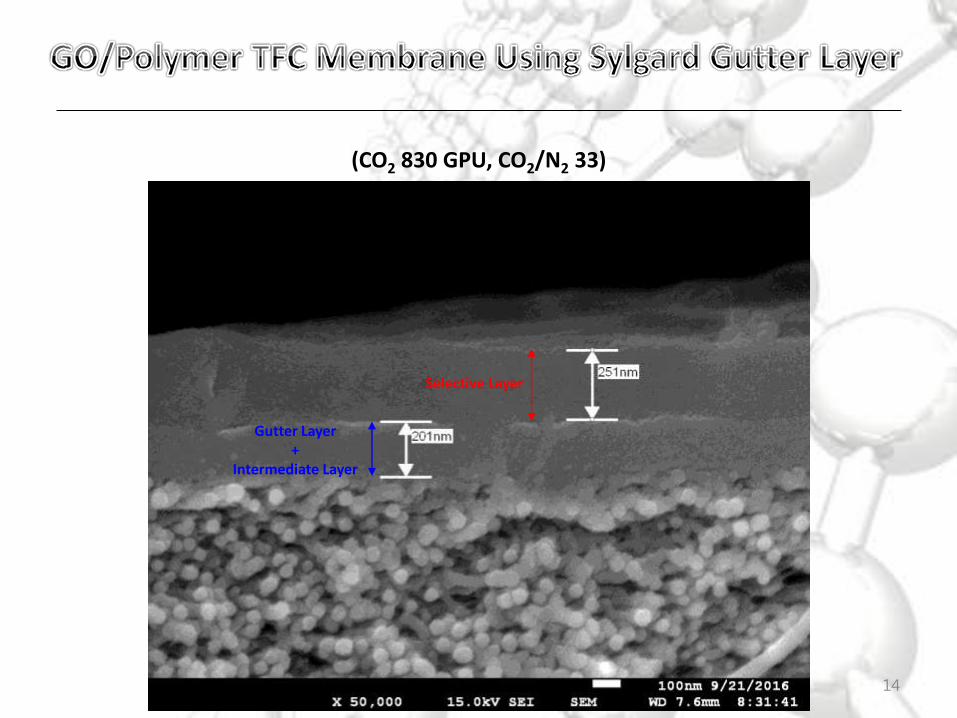
14
(CO2 830 GPU, CO2/N2 33)
Gutter Layer +
Intermediate Layer
Selective Layer
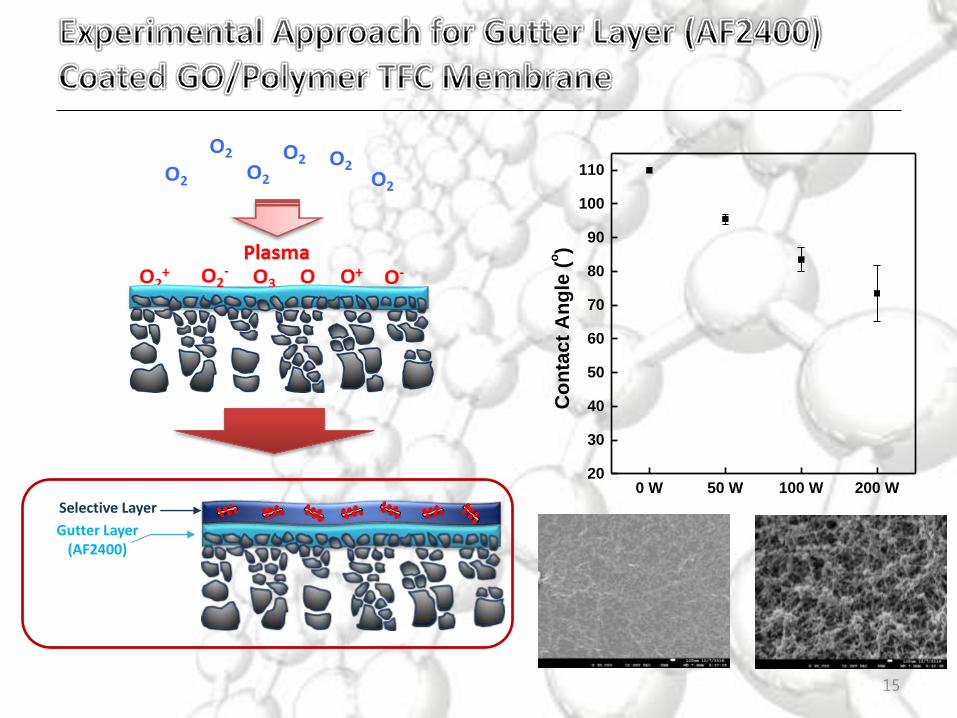
0 W 50 W 100 W 200 W20
30
40
50
60
70
80
90
100
110
Co
nta
ct
An
gle
(o)
15
Gutter Layer (AF2400)
Selective Layer
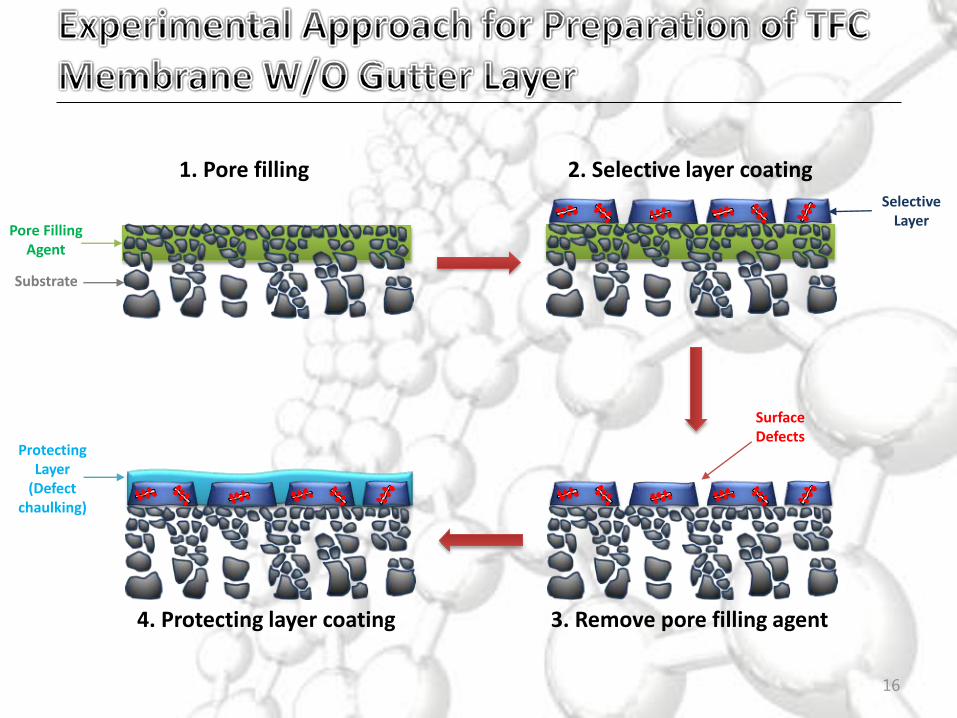
16
Selective Layer
Substrate
Pore Filling Agent
Protecting Layer
(Defect chaulking)
Surface Defects
1. Pore filling 2. Selective layer coating
3. Remove pore filling agent 4. Protecting layer coating

17
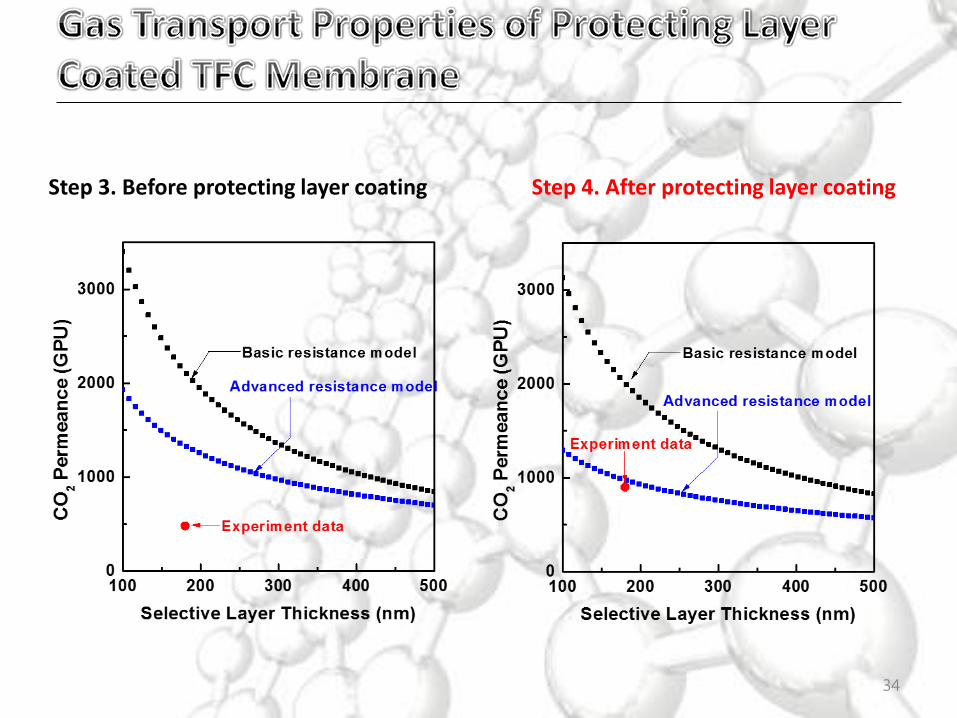
Step 3. Before protecting layer coating Step 4. After protecting layer coating
Selective Layer Protecting Layer
Selective Layer
(CO2 800 GPU, CO2/N2 55)

18
Modulation &
Membrane Process Design
19
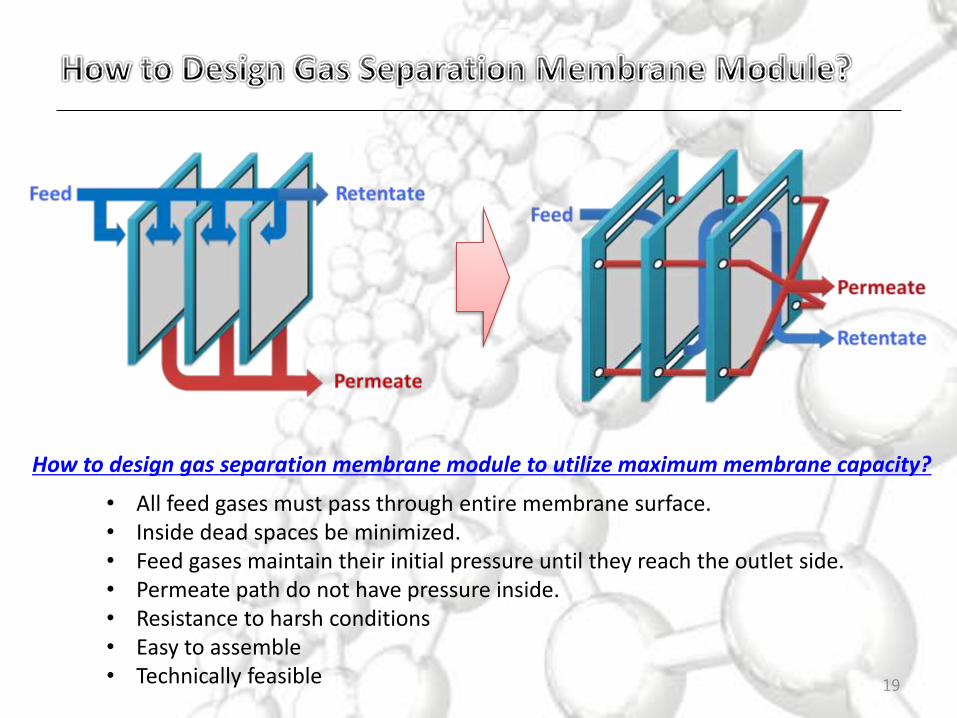
How to design gas separation membrane module to utilize maximum membrane capacity?
• All feed gases must pass through entire membrane surface. • Inside dead spaces be minimized. • Feed gases maintain their initial pressure until they reach the outlet side. • Permeate path do not have pressure inside. • Resistance to harsh conditions • Easy to assemble • Technically feasible
20
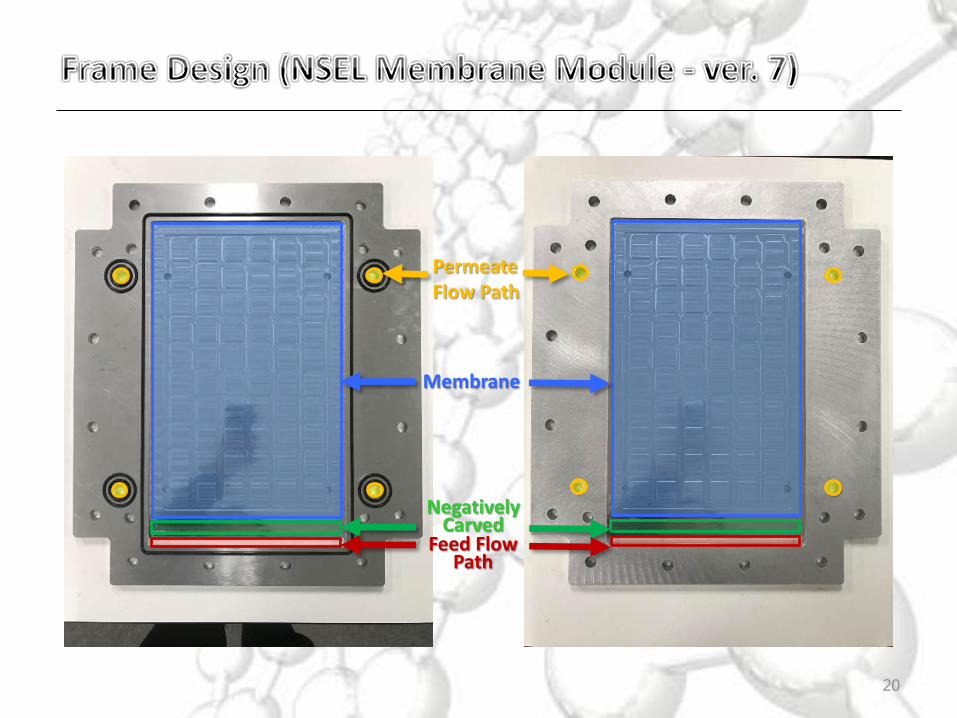
Membrane
Negatively Carved
Feed Flow Path
Permeate Flow Path

21
…
10 EA
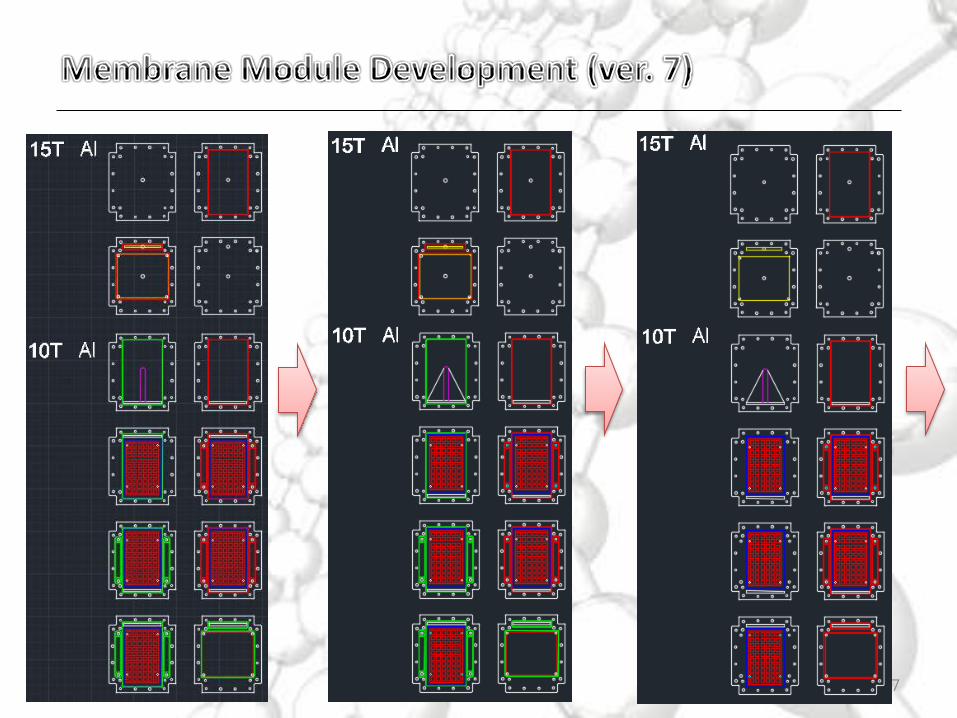
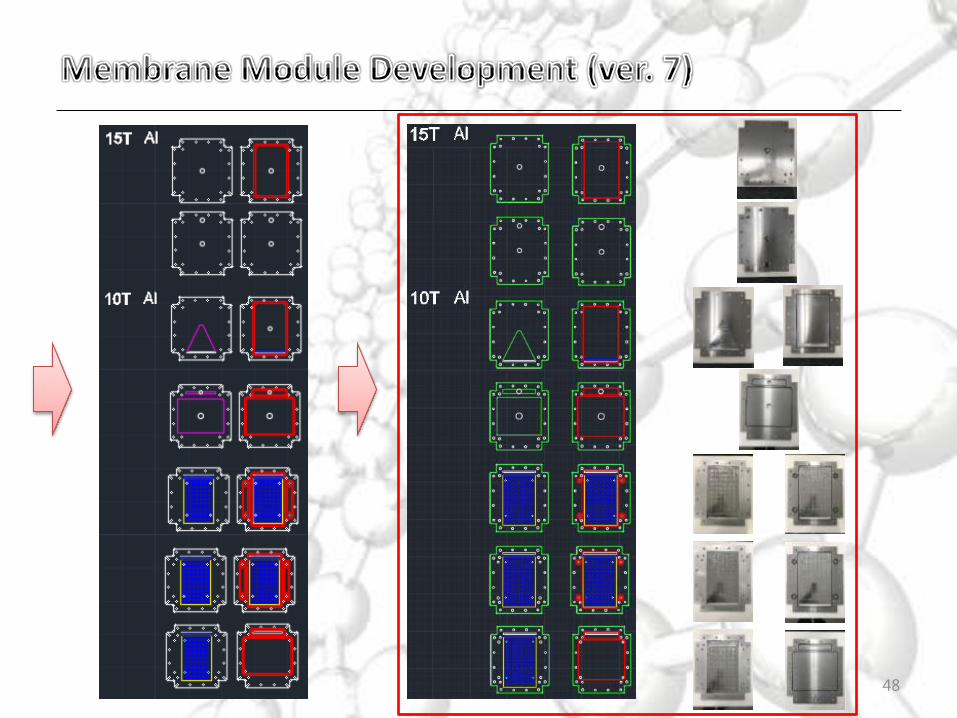
Membrane Module Specifications (ver. 7)
• Dimension: 450 x 390 x 160 mm (for 10 frames) • Membrane size: 340 x 220 mm (active area: 300 x 180 mm = 540 cm2) • Membrane capacity: Not determined (tested with 21 membranes) • Total membrane surface: 11,340 cm2 (for 10 frames) • Feed flow capacity: 10 Nm3/hr (without pressure drop) • Feed, retentate, permeate connection: 1-inch sus fitting
Configuration

22
(10 frames – 11,340 cm2)
2 4 6 8 10 12 14 16 18 20 2210
20
30
40
50
60
70
80
90
100P
feed: 2 bar
Feed flowrate: 9 Nm3/hr
Feed ratio: 14/86 (CO2/Balance)
Co
ncen
trati
on
[vo
l%]
Pressure Ratio (Pfeed
/Pperm
) [θ]
CO2
Balance
2 4 6 8 10 12 14 16 18 20 2210
20
30
40
50
60
70
80
90
100
2 4 6 8 10 12 14 16 18 20 220.00
0.05
0.10
0.15
0.20
0.25
0.30
0.35
0.40 CO
2 purity
Stage-cut ()
Recovery
Pressure Ratio (Pfeed
/Pperm
) [θ]
CO
2 p
uri
ty [
%]
Pfeed
: 2 bar
Feed flowrate: 9 Nm3/hr
Feed ratio: 14/86 (CO2/Balance) S
tag
e-c
ut (
) / CO
2 reco
very
23
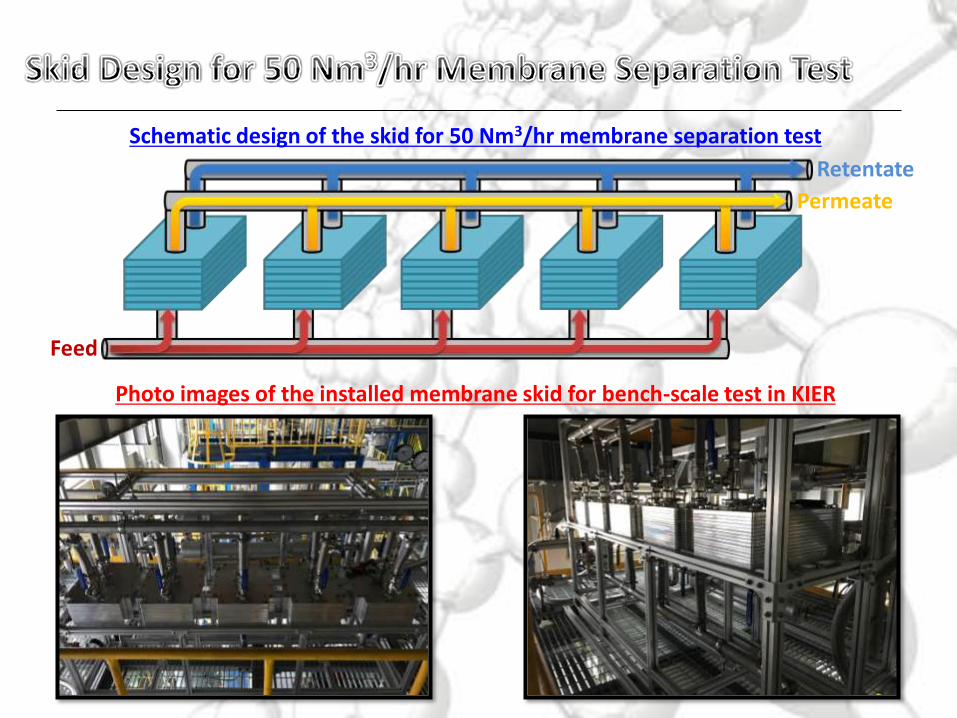
Feed
Permeate
Retentate
Schematic design of the skid for 50 Nm3/hr membrane separation test
Photo images of the installed membrane skid for bench-scale test in KIER
24
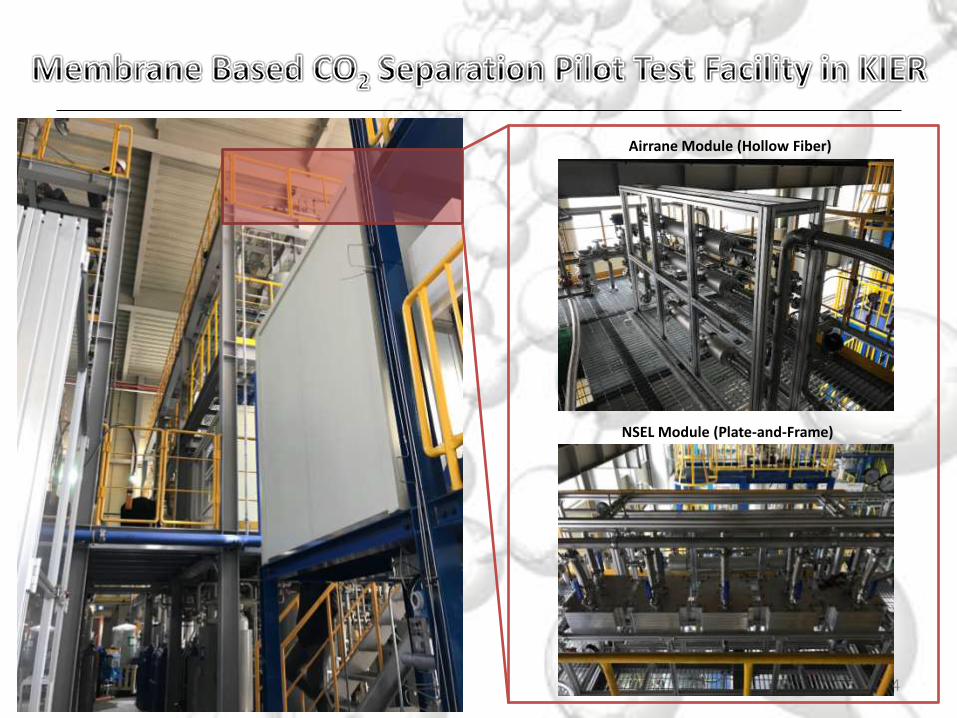
Airrane Module (Hollow Fiber)
NSEL Module (Plate-and-Frame)
25
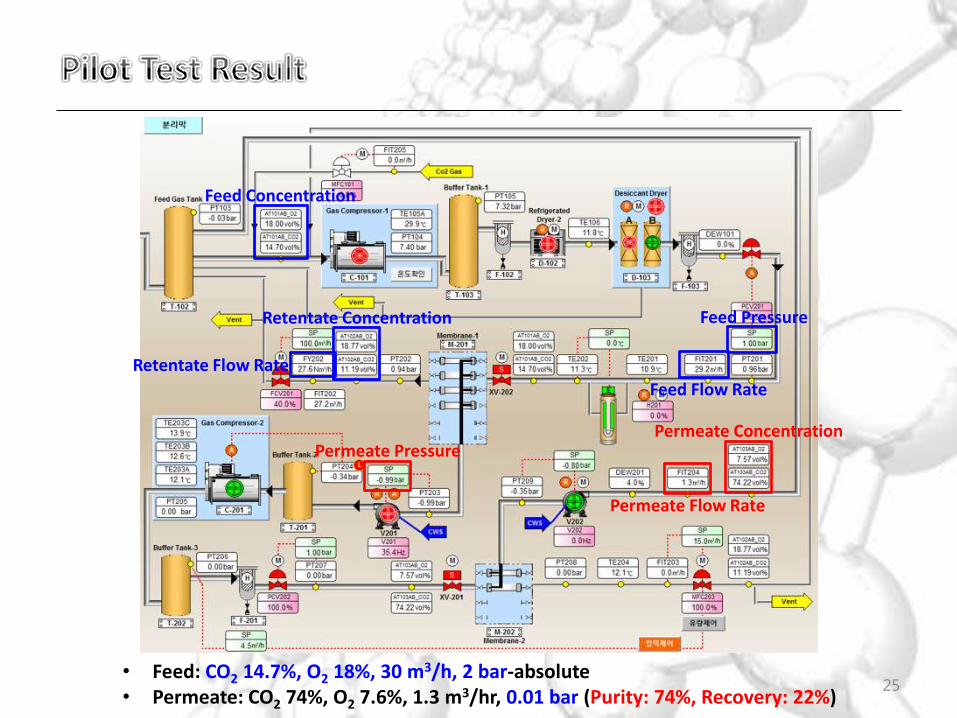
Feed Concentration
Feed Flow Rate
Feed Pressure Retentate Concentration
Retentate Flow Rate
Permeate Concentration
Permeate Flow Rate
Permeate Pressure
• Feed: CO2 14.7%, O2 18%, 30 m3/h, 2 bar-absolute • Permeate: CO2 74%, O2 7.6%, 1.3 m3/hr, 0.01 bar (Purity: 74%, Recovery: 22%)
26
Transport properties of membrane can be estimated by resistant models.
The permeance of support layer is important as well as the material properties.
TFC membranes were prepared by two approaches. (Gutter layer and protecting layer)
The gutter layer’s surface properties were modified by intermediate layer.
The protecting layer was also served as chaulking layer.
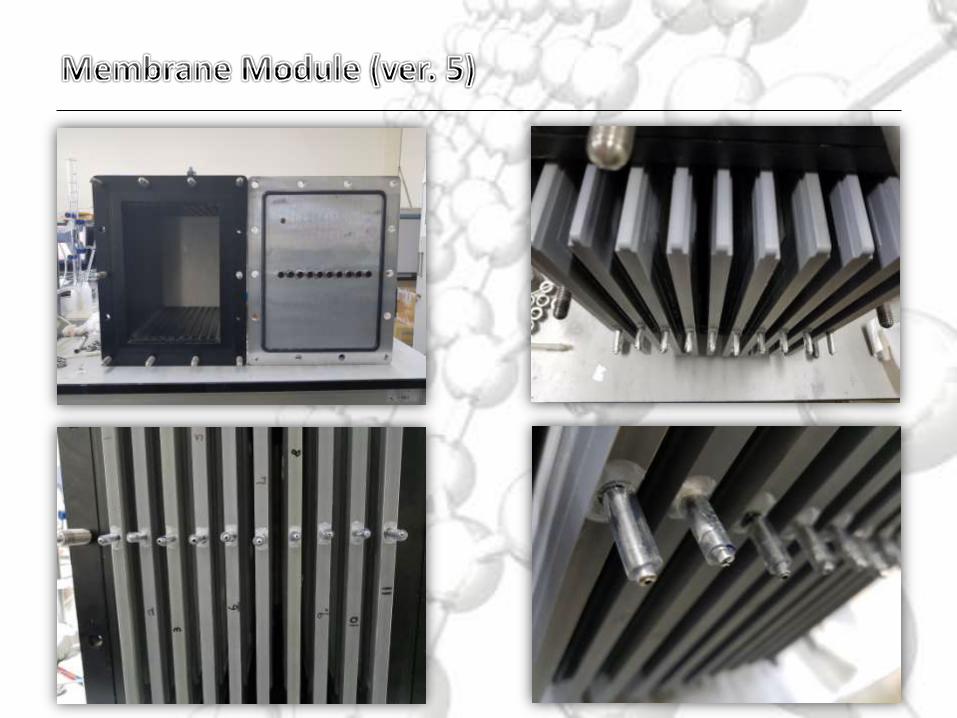
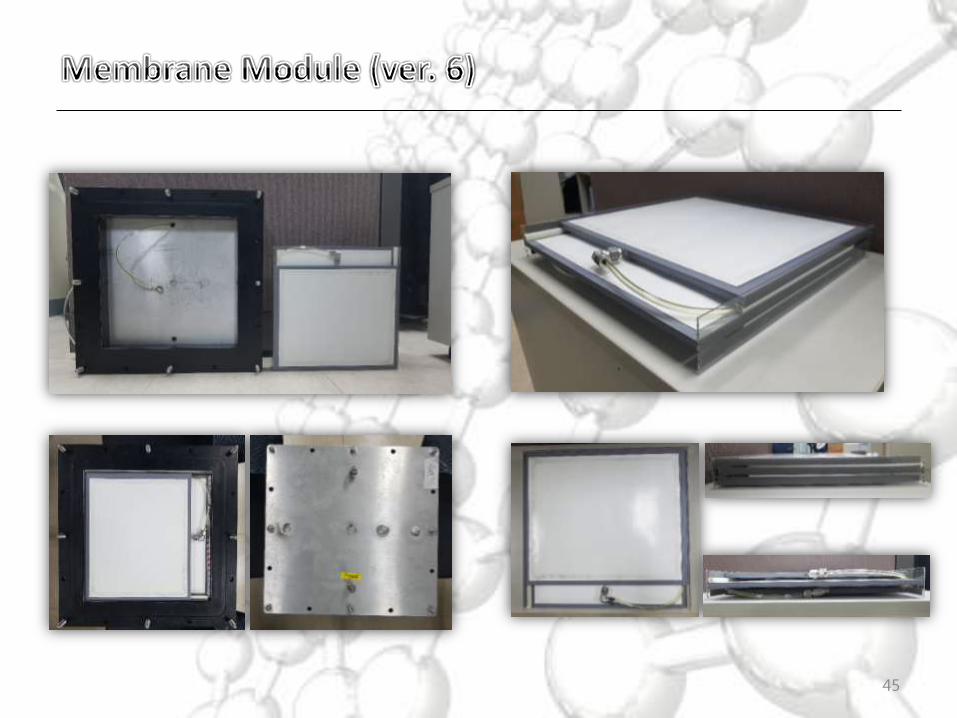
Plate-and-frame module was developed and fabricated with our membranes.
5 modules were connected to complete bench-scale membrane CO2 separation system.
27
Thank you for Professor Park, and all NSEL group members.

28
Backup Slides

29
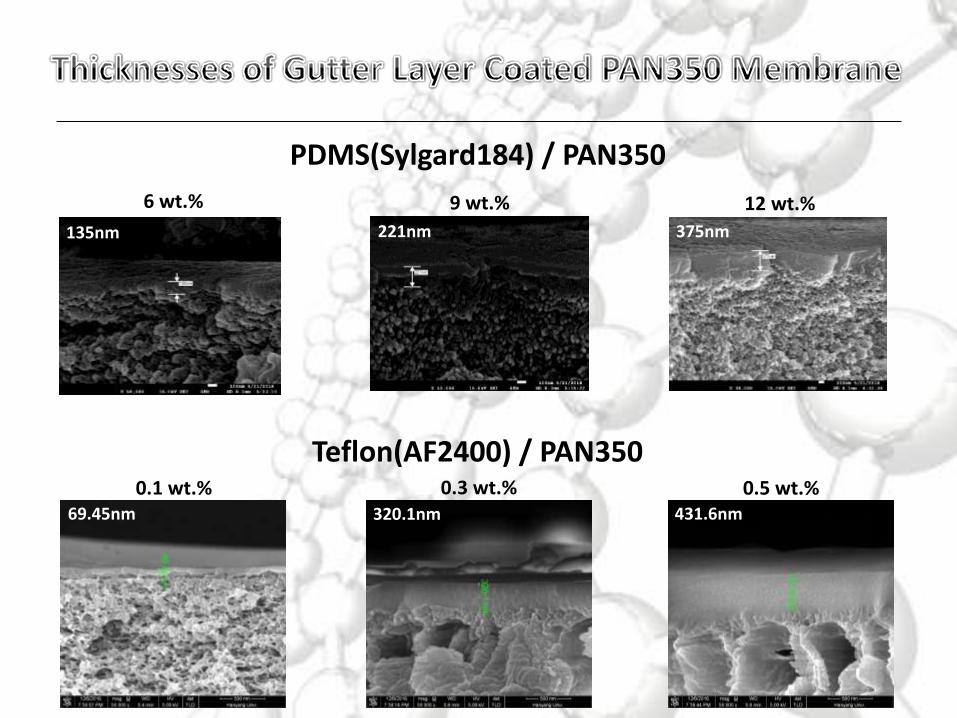
91.9nm 135nm 221nm 375nm
6 wt.% 9 wt.% 12 wt.%
PDMS(Sylgard184) / PAN350
Teflon(AF2400) / PAN350 0.1 wt.% 0.3 wt.% 0.5 wt.%
69.45nm 320.1nm 431.6nm
31
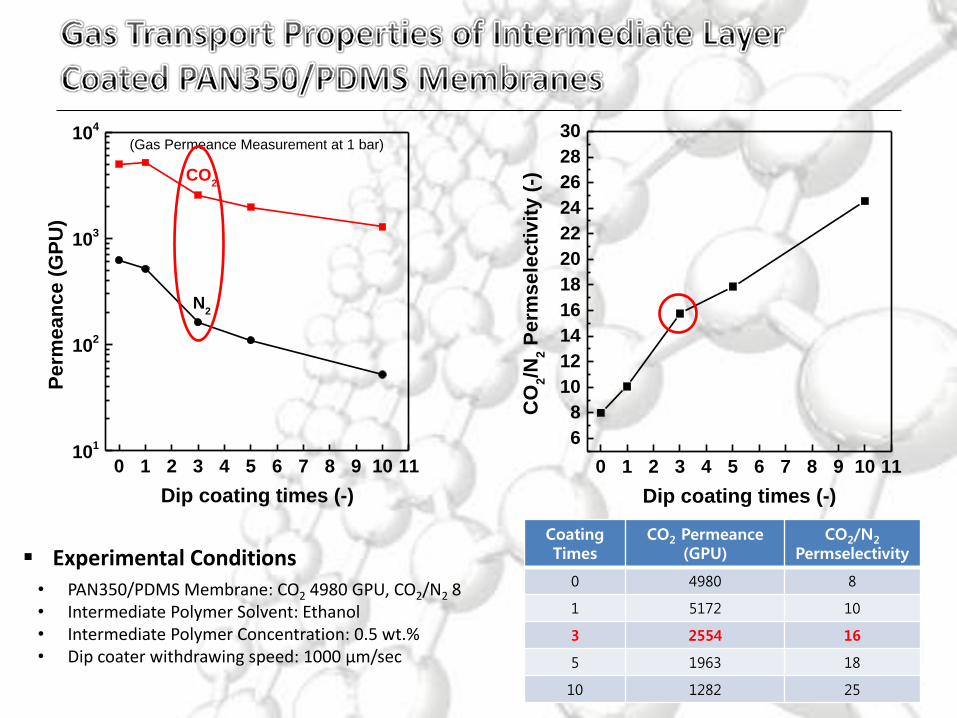
0 1 2 3 4 5 6 7 8 9 10 11
6
8
10
12
14
16
18
20
22
24
26
28
30
CO
2/N
2 P
erm
se
lecti
vit
y (
-)
Dip coating times (-)
0 1 2 3 4 5 6 7 8 9 10 1110
1
102
103
104
Perm
ean
ce
(G
PU
)
Dip coating times (-)
CO2
N2
(Gas Permeance Measurement at 1 bar)
Coating Times
CO2 Permeance (GPU)
CO2/N2
Permselectivity
0 4980 8
1 5172 10
3 2554 16
5 1963 18
10 1282 25
Experimental Conditions
• PAN350/PDMS Membrane: CO2 4980 GPU, CO2/N2 8 • Intermediate Polymer Solvent: Ethanol • Intermediate Polymer Concentration: 0.5 wt.% • Dip coater withdrawing speed: 1000 μm/sec
32
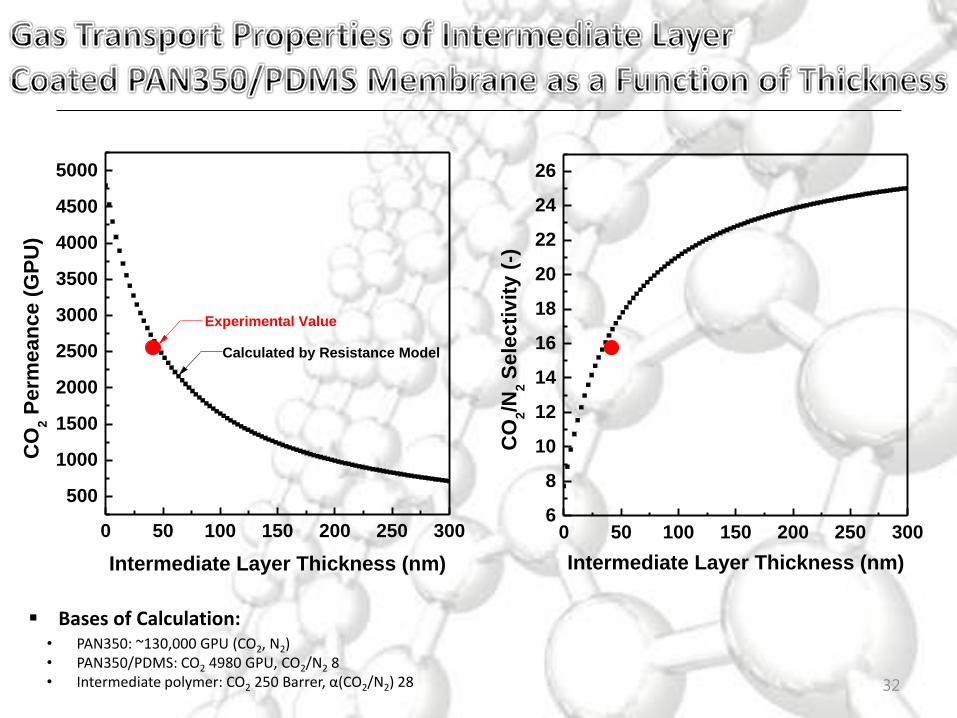
0 50 100 150 200 250 3006
8
10
12
14
16
18
20
22
24
26
CO
2/N
2 S
ele
cti
vit
y (
-)
Intermediate Layer Thickness (nm)
0 50 100 150 200 250 300
500
1000
1500
2000
2500
3000
3500
4000
4500
5000
CO
2 P
erm
ea
nc
e (
GP
U)
Intermediate Layer Thickness (nm)
Calculated by Resistance Model
Experimental Value
Bases of Calculation: • PAN350: ~130,000 GPU (CO2, N2) • PAN350/PDMS: CO2 4980 GPU, CO2/N2 8 • Intermediate polymer: CO2 250 Barrer, α(CO2/N2) 28
33
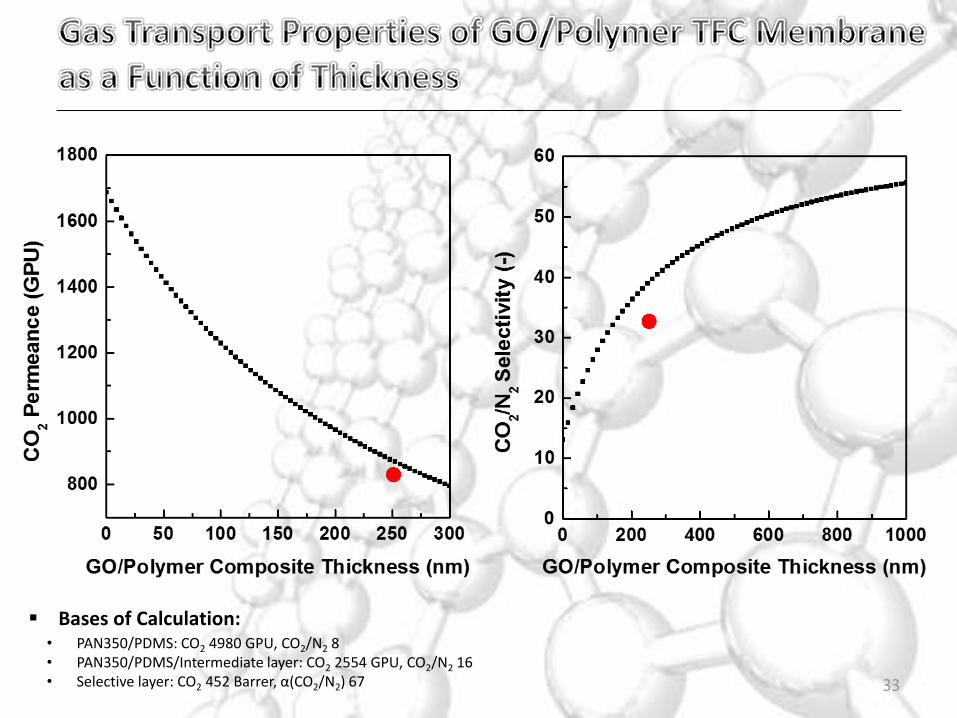
Bases of Calculation: • PAN350/PDMS: CO2 4980 GPU, CO2/N2 8 • PAN350/PDMS/Intermediate layer: CO2 2554 GPU, CO2/N2 16 • Selective layer: CO2 452 Barrer, α(CO2/N2) 67
34
Step 3. Before protecting layer coating Step 4. After protecting layer coating
35
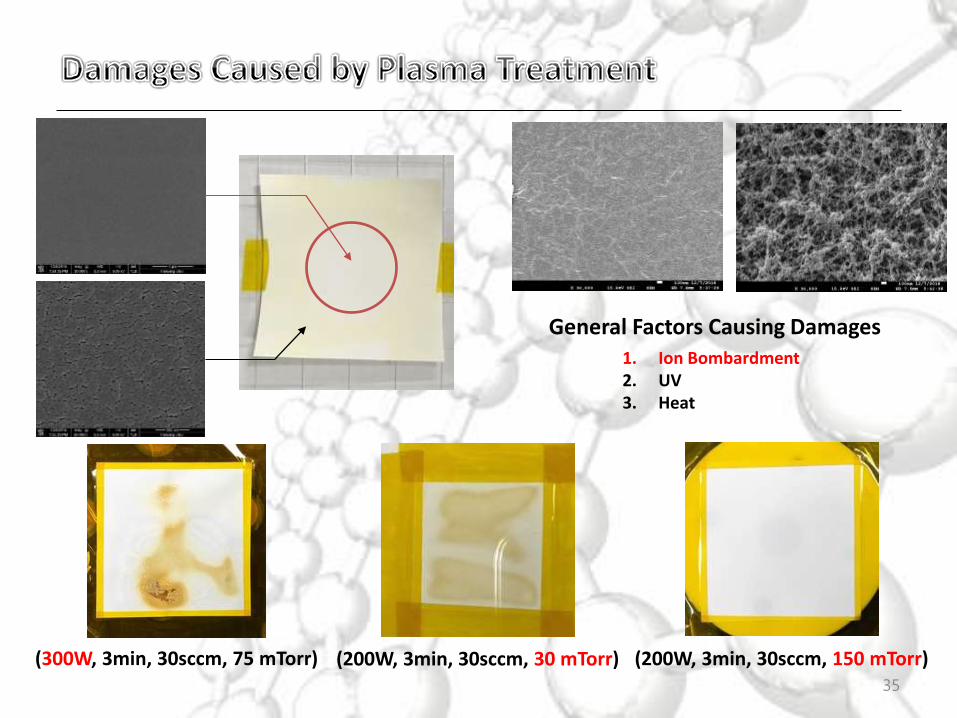
General Factors Causing Damages 1. Ion Bombardment 2. UV 3. Heat
(300W, 3min, 30sccm, 75 mTorr) (200W, 3min, 30sccm, 30 mTorr) (200W, 3min, 30sccm, 150 mTorr)

36
CCP (50W, 1Torr, O2 30sccm)
ICP (100W, 75mTorr, O2 30sccm)
3min 5min 10min
3min 5min 10min

37
• 4-inch spiral wound membrane module (4 envelopes)
Membrane area (m2) 5
Envelop # 4
Feed spacer thickness (mil) 28
Permeate spacer thickness (mm) 0.25
Membrane thickness (µm) 180
Permeate collector diameter (mm) 17
Packing density (m2/m3) 800
Module diameter (in.) 4 6 8 12
Envelop # 4-6 6-10 15-30 30-40
Membrane area (m2) 3-6 6-12 20-40 30-60
Packing density
(m2/m3)
Plate-to-Flame Spiral Wound
100-400 300-1000
Spiral wound module design
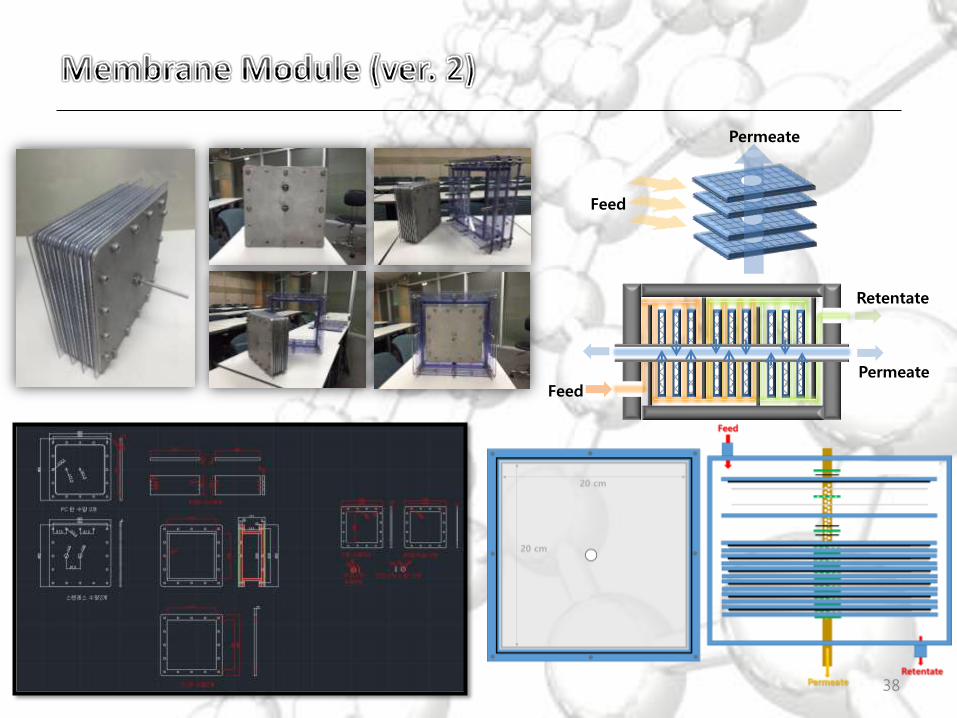
38
Permeate
Feed
Retentate
Permeate Feed
39
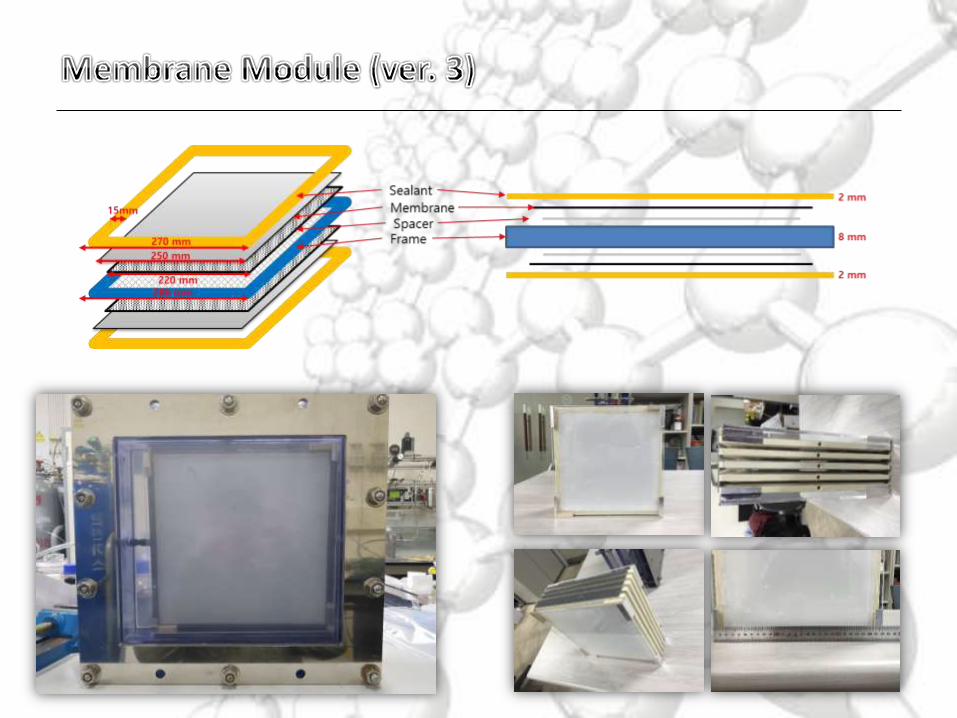
Sealant
Membrane
Frame Spacer
270 mm
250 mm
220 mm
15mm
2 mm
8 mm
2 mm
280 mm
40
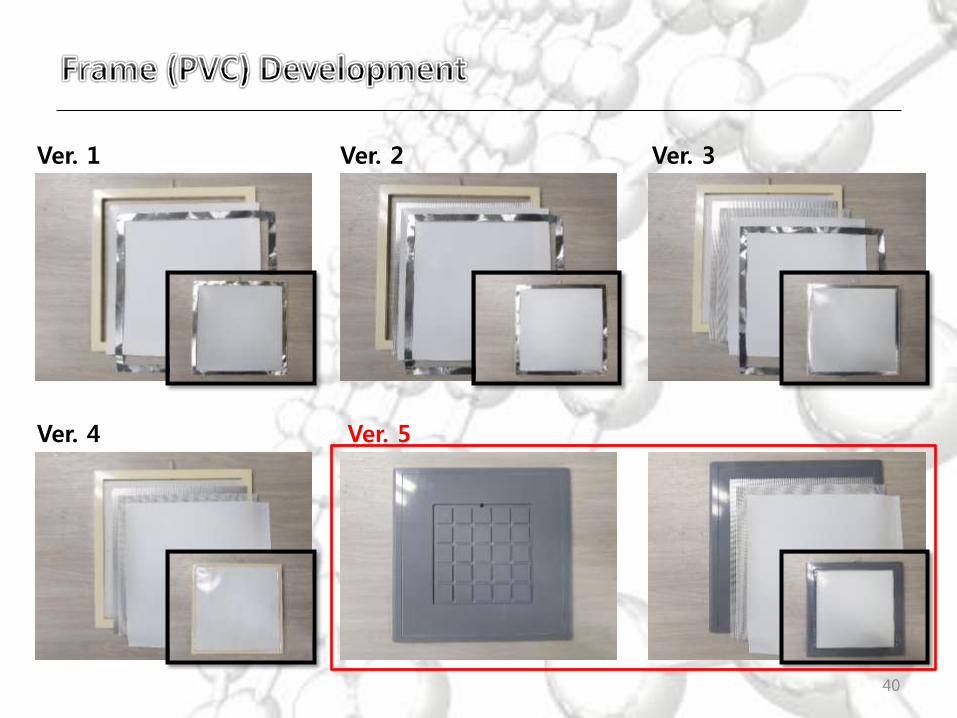
Ver. 1 Ver. 2 Ver. 3
Ver. 4 Ver. 5
41
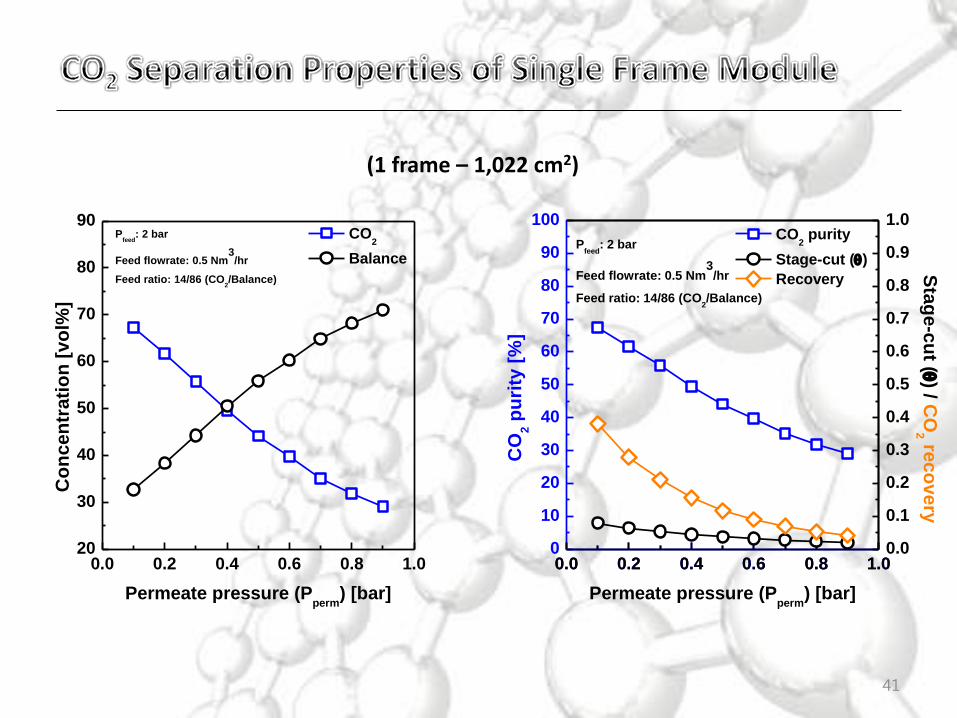
0.0 0.2 0.4 0.6 0.8 1.020
30
40
50
60
70
80
90P
feed: 2 bar
Feed flowrate: 0.5 Nm3/hr
Feed ratio: 14/86 (CO2/Balance)
Co
nc
en
tra
tio
n [
vo
l%]
Permeate pressure (Pperm
) [bar]
CO2
Balance
0.0 0.2 0.4 0.6 0.8 1.00
10
20
30
40
50
60
70
80
90
100
0.0 0.2 0.4 0.6 0.8 1.00.0
0.1
0.2
0.3
0.4
0.5
0.6
0.7
0.8
0.9
1.0 CO
2 purity
Stage-cut ()
Recovery
Permeate pressure (Pperm
) [bar]
CO
2 p
uri
ty [
%]
Pfeed
: 2 bar
Feed flowrate: 0.5 Nm3/hr
Feed ratio: 14/86 (CO2/Balance)
Sta
ge-c
ut (
) / CO
2 reco
very
(1 frame – 1,022 cm2)

42
43
44
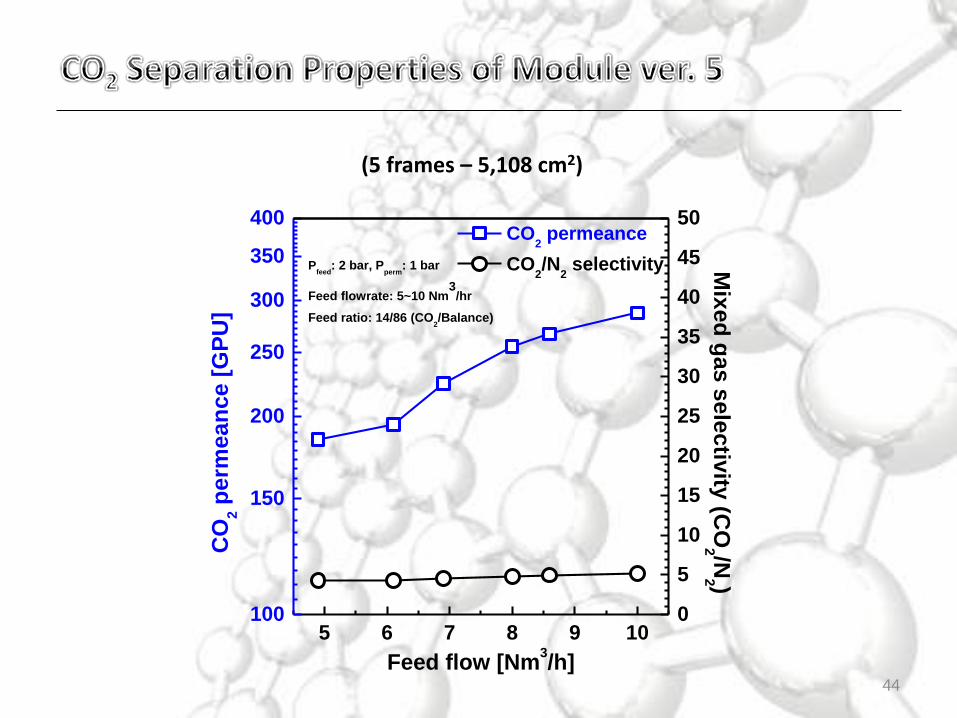
(5 frames – 5,108 cm2)
5 6 7 8 9 10100
150
200
250
300
350
400
0
5
10
15
20
25
30
35
40
45
50 CO
2 permeance
CO2/N
2 selectivity
Feed flow [Nm3/h]
CO
2 p
erm
ea
nce
[G
PU
]
Pfeed
: 2 bar, Pperm
: 1 bar
Feed flowrate: 5~10 Nm3/hr
Feed ratio: 14/86 (CO2/Balance)
Mix
ed
ga
s s
ele
ctiv
ity (C
O2 /N
2 )
45

46
(3 frames – 4,248 cm2)
47
48

49

50
Air Injection Particle Removal & Air Dryer
Air Dryer 2 Air Dryer 3 (Desiccant dryer)

51
Control Panel
Gas Analyzer (I.R.)

52
Vacuum pump 2 (for 2 stage permeate)
Compressor 1 Buffer Tank 1
Vacuum pump 1 (for 1 stage permeate)

53
Airrane Module (Hollow Fiber)
NSEL Module (Plate-and-Frame)