Research Report: Socioeconomic Baseline Studies · Nghia Trung Village, ... Household expenditure...
57
Working Paper No. 03-06 December 2006 Research Report: Socioeconomic Baseline Studies Case Study: Nghia Trung Village, Bu Dang District, Binh Phuoc Province, Vietnam Authors: Dang Thanh Ha, Le Van Du, Duong Thi Kim Lan, Nguyen Thanh Loan, Tran Van My, Nguyen Duc Thanh, Nong Lam University, Ho Chi Minh City, Vietnam Prepared by: Sustainable Agriculture and Natural Resource Management Collaborative Research Support Program (SANREM CRSP) Office of International Research, Education, and Development (OIRED), Virginia Tech E-mail: [email protected] On the Web: www.oired.vt.edu
-
Upload
duongthuan -
Category
Documents
-
view
216 -
download
1
Transcript of Research Report: Socioeconomic Baseline Studies · Nghia Trung Village, ... Household expenditure...

Working Paper No. 03-06 December 2006 Research Report: Socioeconomic Baseline Studies Case Study: Nghia Trung Village, Bu Dang District, Binh Phuoc Province, Vietnam Authors: Dang Thanh Ha, Le Van Du, Duong Thi Kim Lan, Nguyen Thanh Loan, Tran Van My, Nguyen Duc Thanh, Nong Lam University, Ho Chi Minh City, Vietnam Prepared by: Sustainable Agriculture and Natural Resource Management Collaborative Research Support Program (SANREM CRSP) Office of International Research, Education, and Development (OIRED), Virginia Tech E-mail: [email protected] the Web: www.oired.vt.edu

Acknowledgments
This baseline study, as part of the SANREM CRSP “Agroforestry and Sustainable Vegetable Production in Southeast Asia Watersheds” project under the coordination of North Carolina A&T State University, was implemented by the research team of Nong Lam University in Nghia Trung village, Bu Dang district, Binh Phuoc province, Vietnam. More than 306 households took their valuable time to participate in this baseline study, and it is our hope that the information generated will help improve technologies and policies that have positive impacts on their lives. The team would like to thank the leaders of the People’s Committee of Nghia Trung village for their valuable collaboration and support in the survey process. We also would like to give special thanks to all of those who contributed to this baseline study as field supervisors, enumerators, and data enterers.
- ii -

Table of Contents
Acknowledgments ........................................................................................................................... ii List of Tables and Figures ............................................................................................................... v I. Introduction ................................................................................................................................. 1
1. Overview and Objective of the baseline study ........................................................................ 1 2. Methodology............................................................................................................................ 2 3. Scope of the Study................................................................................................................... 3 4. Organization of the Report ...................................................................................................... 3
II. General characteristics of the study area .................................................................................... 4 1. Location of the study area ....................................................................................................... 4 2. Topography, climate, and hydrology....................................................................................... 4 3. Population and ethnicity .......................................................................................................... 5 4. Labor and economic activities................................................................................................. 6 5. Health care and education........................................................................................................ 6 6. Agricultural production ........................................................................................................... 7
III. Characteristics of the households .............................................................................................. 8 1. Household size......................................................................................................................... 9 2. Literacy Level.......................................................................................................................... 9 3. Labor...................................................................................................................................... 10 4. Occupation............................................................................................................................. 10 5. Housing and assets................................................................................................................. 11 6. Income ................................................................................................................................... 14
IV. Household consumption .......................................................................................................... 16 1. Household expenditure .......................................................................................................... 16 2. Vegetable and fruit consumption........................................................................................... 18
V. Characteristics of the farm and farming system ...................................................................... 20 1. Characteristics of the farm..................................................................................................... 20 2. Land ownership ..................................................................................................................... 20 3. Land use................................................................................................................................. 21 4. Cropping pattern .................................................................................................................... 22 5. Vegetable cultivation and constraints.................................................................................... 23
VI. Crop production....................................................................................................................... 26 1. General characteristics of cashew cultivation ....................................................................... 26 2. Input use in cashew production ............................................................................................. 27
- iii -

3. Yield and yield distribution ................................................................................................... 30 4. Cost and return for cashew .................................................................................................... 31
VII. Gender.................................................................................................................................... 33 VIII. Credit and extension ............................................................................................................. 36
1. Credit ..................................................................................................................................... 36 2. Extension ............................................................................................................................... 37 3. Source of information............................................................................................................ 39
IX. Participation in local organizations ......................................................................................... 41 X. Constraints and changes in farming practices ......................................................................... 43
1. Major constraints and priority ............................................................................................... 43 2. Labor shortage ....................................................................................................................... 44 3. Changes in farming practices ................................................................................................ 45
XI. Summary and concluding remarks .......................................................................................... 47 References ..................................................................................................................................... 51
- iv -

List of Tables and Figures
Tables
Table 1. Distribution of sample by wealth status and ethnicity (number of households). .............. 3 Table 2. Education statistics in Nghia Trung village in year 2005.................................................. 6 Table 3. Cultivated area of main crops in Nghia Trung village in 2005. ........................................ 7 Table 4. Basic features of the sample households by wealth status and ethnicity. ........................ 8 Table 5. Percentage distribution of respondent by occupation.................................................... 11 Table 6. Percentage distribution of respondents’ houses by physical attributes. .......................... 12 Table 7. Assets of the sample households. .................................................................................... 13 Table 8. Income of the sample household by sources. ................................................................. 14 Table 9. Income of the sample household from crop production. ................................................. 15 Table 10. Households’ annual expenditure by items..................................................................... 16 Table 11. Percentage of expenditure over income of the sample households. .............................. 17 Table 12. Vegetables consumption per week among sample households. .................................... 18 Table 13. Fruits consumption per week among sample households. ............................................ 19 Table 14. Distribution of sample households by farm size. .......................................................... 20 Table 15. Distribution of farm land by ownership and use types.................................................. 21 Table 16. Distribution of farm land by land use types (% of total farm land) .............................. 22 Table 17. Sources of water for different types of farm land (% of area by land use types). ......... 22 Table 18. Major cropping pattern of the sample households (% of sample households).............. 23 Table 19. Vegetable cultivation among sample households.......................................................... 24 Table 20. Constraints to vegetable cultivation. ............................................................................ 24 Table 21. Distribution of age and density of cashew plantations. ................................................. 26 Table 22. Cashew cropping calendar in Nghia Trung village. ...................................................... 27 Table 23. Input use per hectare of cashew..................................................................................... 28 Table 24. Number of fertilizer and pesticides application for cashew. ......................................... 28 Table 25. Percentage of respondents per category of pesticide application on cashew. ............... 29 Table 26. Quantity of pesticides use among cashew farmers........................................................ 29 Table 27. Yield and yield distribution among cashew farmers. .................................................... 30 Table 28. Production cost per hectare of cashew (‘000VND/ha).................................................. 31 Table 29. Crop budget for one hectare of mature cashew (‘000VND/ha). ................................... 31 Table 30. Percentage of respondents per category of income from one hectare of cashew. ......... 32 Table 31. Participation of men and women by crops and farming activities (%). ........................ 33 Table 32. The role of men and women by activities and major decisions. ................................... 34
- v -

Table 33. Credit loan and utilization of the sample households.................................................... 36 Table 34. Participation in extension and training among sample households............................... 38 Table 35. Perception of the sample households on training and extension activities. .................. 38 Table 36. Major sources of information for local farmers. ........................................................... 39 Table 37. Farmers’ evaluation on information received................................................................ 40 Table 38. Participation of sample households in local organizations............................................ 41 Table 39. Participation of female members of the sample households in local organization. ...... 42 Table 40. Major constraints to local farming and priority level (% of n=306). ............................ 43 Table 41. Labor shortage among sample households.................................................................... 44 Table 42. Monthly distribution of labor shortage among sample households............................... 44 Table 43. Changes in farming practices among sample households over the last three years. ..... 45 Table 44. Changes in cropping pattern among sample households over the last three years........ 46 Table 45. Measures to control soil erosion practiced by the sample households. ......................... 46
Figures
Figure 1. The study site ................................................................................................................... 4 Figure 2. Distribution of the sample households by family size. .................................................... 9 Figure 3. Distribution of household’s weekly expenditure for food items.................................... 17
- vi -

I. Introduction
1. Overview and objective of the baseline study
The SANREM CRSP “Agroforestry and Sustainable Vegetable Production in Southeast Asia Watersheds” or SANREM TMPEGS project is developing sustainable agroforestry-based vegetable production systems for steeply-sloping hillsides in Southeast Asia to alleviate poverty and food scarcity and reduce environmental degradation. By combining economically viable and resource conserving technologies with gender friendly socio-economic policies, economically viable and ecologically sound integrated vegetable-agro forestry systems are being developed to increase farm production and income, thus generating a reliable supply of products for markets and increasing local food security. The project is implemented by a consortium of international and national organizations under the coordination of North Carolina A&T State University.
The overall goal of this project is to demonstrate how steeply-sloping, degraded Southeast Asian watersheds can be converted to vibrant sustainable agroforestry systems with integrated vegetable production. The principal hypothesis is: Integrating vegetable production into agroforestry systems on small farms in steeply-sloping areas will help alleviate poverty and enhance environmental protection, sustainability and economic viability of Southeast Asian watersheds. Watersheds in Vietnam, Indonesia, and the Philippines are targeted specifically, but the developed technologies and knowledge should be transferable to other areas. The TMPEGS acronym is derived from the project objectives, which are:
Technology: Develop economically viable and ecologically-sound integrated vegetable-agroforestry (VAF) systems to increase farm productivity, income, and food security. Markets: Conduct market value chain research at the local, regional, and national levels that builds upon existing marketing strategies and develop interventions to overcome constraints and take advantage of opportunities. Policy: Identify policy options and institutional frameworks that promote sustainable vegetable-agroforestry production and reward provision of environmental services. Environmental and socio-economic impacts: Assess the short and long-term environmental and socio-economic impacts of integrated vegetable-agroforestry systems. Gender: Provide mechanisms to improve the socioeconomic well-being of women engaged in vegetable production and agroforestry enterprises, especially in terms of income and labor share, and to involve women in decisions that concern their welfare. Scaling-up: Build host country capacity in managing integrated vegetable-agroforestry systems and packaging related technical, social/economic and institutional innovations for replication and scaling up to other watersheds in the region.
- 1 -

This baseline study is a part of the SANREM CRSP “Agroforestry and Sustainable Vegetable Production in Southeast Asia Watersheds” project implemented in Vietnam by TMPEGS team at Nong Lam University. The study was conducted in Nghia Trung, an upland village located in the upper part catchments of the Dong Nai and the Be River. The baseline study was conducted to:
- provides a better understanding of the socio-economic conditions of the study area and information for the design of the experiments to be implemented in the study site,
- provides a basis for socio-economic impact assessment of integrated vegetable-agroforestry systems.
2. Methodology
At the beginning of the baseline study, a reconnaissance survey was conducted by the team to generate background information on the study area for the design of the baseline study. The reconnaissance trip has helped the team members to have a good understanding of the farming situation in the survey area and location specific information to design the questionnaire. A survey questionnaire was deigned by the team, revised based on comments from international TMPEGS theme coordinators, and field pre-tested.
Based on the discussion with local officials and team members, “wealth ranking”1 have been proposed to be the criteria for the selection of the sample households. For the baseline survey, stratified random sampling by wealth ranking were adopted. A total number of 306 households (11.4% of the population) were selected in nine hamlets of Nghia Trung village to be interviewed. The distribution of the sample household by wealth status and ethnicity is presented in Table 1. Based on local classification of wealth, the sample representing 11.4% of the wealthy and intermediate households and 11.3% of the poor households in the village. In term of ethnicity, the sample represents 11.6% and 10.8% of the Kinh and other ethnic minority groups, respectively.
The basic socio-economic data collected comprise of demographic data, farm characteristics, households’ income and expenditure, extension, credit, gender roles, labor availability, and inputs used for major crops planted by local farmers. A 24-hour nutrition recall survey as well as a rapid marketing survey with farmers and traders were also conducted at the same time.
1 Three wealth classes ware reported by local official, namely poor, intermediate, and wealthy households. Poor households are those having an income level of less than 200.000 VND/person/month and poor assets and housing. Intermediate households have income from 200,000 - 800,000 VND/person/month and relatively good housing. Wealthy households have an income level of more than 800,000 VND/person/month and having good housing and assets.
- 2 -

Table 1. Distribution of sample by wealth status and ethnicity (number of households).
By wealth status By ethnicity Items
Wealthy Intermediate Poor Kinh Other ethnic Total
Population 1295 1077 310 1987 695 2682
Sample 148 123 35 231 75 306
% 11.4% 11.4% 11.3% 11.6% 10.8% 11.4% Source: Statistic data from Nghia Trung village and survey data.
3. Scope of the Study
The baseline survey explores the characteristics of the farm households and farming practices of 306 households in Nghia Trung village including information on general demographics of the households, literacy levels, income and expenditure of individual households, housing conditions, credit and investment circumstances, land holdings, assets, and food security. Some aspects of household decision making and participation are explored including the role of gender in different farming activities, the role of women in decision-making, and the general workload of males and females. The study also explores farming practices and inputs use and distribution of farm outputs for major crops planted in the village. It also explore the perceptions of the farm households on the general farming practices and priority issues for improvement.
4. Organization of the Report
This report presents results of the baseline survey conducted by NLU research team. The report also includes qualitative results from the participatory field assessment and farmer group discussions. Data analysis was conducted based on the classification of households based on their wealth status and ethnic background (i.e. Kinh and ethnic minority farmers) for comparison. The report is organized so that it follows the main subjects in the household questionnaire. A summary of findings from the baseline survey is provided in the concluding remarks at the end of the report.
- 3 -

II. General characteristics of the study area
1. Location of the study area
Nghia Trung village is located in Bu Dang District of Binh Phuoc Province. The village is about 130 km from Ho Chi Minh City and about 25 km from Dong Xoai town, the center of Binh Phuoc province. Located on the national road Number 14 which connects the provinces in the Central Highland and Ho Chi Minh City, the village has favorable condition for marketing of good and services. The location of the study site is shown in the map bellows.
Figure 1. The study site
2. Topography, climate, and hydrology
Nghia Trung is an upland village with elevation varies from 300 to 500 m. The study area is characterized by a range of hills with gentle to relatively high slopes and small valleys. Most of the land area of the village are sloping land. About 70% of the area in the village are land with medium to high slopes. In many locations, there is high risk of soil erosion, particularly on land
- 4 -

located on hill sides with high slopes. In some hamlets of the village, transportation from fields to farmers’ house is difficult, particularly during rainy season, due to a hilly topography and poor road condition. Flat land and land with low slopes occupy 20% and 10% of the total land area of the village, respectively.
The climate in the area is characterized by a wet and a dry season. The wet season from May to end of October and dry season from November to April, May. Average annual temperature is about 25.60 C with highest temperature about 38.50 C and lowest temperature about 19.40 C. The annual rainfall in the study area is about 2,239 mm with more than 90 percent of the rainfall concentrated in the wet season. Very low rainfall of less than 20 mm was recorded from January to March. During the wet season, heavy rains usually come in July and August. Some times heavy rains cause flash floods, mainly in areas located near streams crossing the village.
The total land area of the village is 13,357 hectare. The village is part of the catchments of the Dong Nai and Song Be Rivers. Two major streams running across the village contribute to both the Dong Nai River in the east and Be River in the north, providing water for two large hydro-electric reservoirs, namely the Tri An and Thac Mo reservoirs.
The village has one irrigation reservoir with a surface water area of 65 ha providing water for agriculture production and also for domestic use. However major source of water for domestic use of local villagers is from open shallow and deep wells. The secondary data at village level shows that about 77.1% of the households in the village have open wells and 5,6% have deep wells. The remaining 17.3% of the households use other sources of water such as natural streams, lakes, and rain water. It was reported that about 82.7% of the households in the village have clean water for domestic use. Drought is a problem during dry season that affect crop yield with about 40% of the agriculture land having problem of water shortage.
Major soil types in the village is the basaltic soil. This soil type is considered by farmers as very fertile soil and has favorable physical characteristics for the cultivation of perennial cash crops such as coffee, rubber, cashew, black pepper, cacao and fruit trees. The largest cultivated area in the village is planted with cashew (3,255 ha or 65% of the total land area of the village in year 2005).
3. Population and ethnicity
In 1975, most area of the village is covered by natural forest. The area is discarded populated. Most people were living mainly based on agriculture and forest activities. After 1980, people from other area arrived from other part of the country to the village to open land for agricultural purpose. Large forest area has been converted to agriculture. The population of the village increased rapidly over the last decades due to free migration from other provinces to this area. At present, free migration is declining, as it is no longer possible to expand cultivation. Currently, the village has a total population of 2,682 households with 12,376 persons.
- 5 -

Nghia Trung village consists of 9 hamlets numbering from hamlet 1 to hamlet 9. The farthest hamlet is about 20 km from the village center. Population distribution among the 9 hamlets of the village are not equals. The hamlet 4, located on the main road and near the village center, has the highest population (18.8%). The hamlets 1, 2, 7, and 9 have also relatively high population (about 10-14% of the total population). Low population (4-7%) are found in the hamlet 5, 6, and 8 located relatively far away from the village center. The poorest hamlets in the village are hamlets number 7 and 9.
There are 11 ethnic groups living in Nghia Trung village. Majority of them (74% of the population) are Kinh people. About 26% of the population belongs to other ethnic minority groups such as (Stieng, Chinese, Tay, Nung, Khmer). Stieng people, a local ethnic minority group, contributes to about 10% of the total population.
4. Labor and economic activities
The secondary data in the village shows that about 42% of the population belongs to the labor age. Female members contributes to about 46% of the population and about 49% of the labor force in the village. Majority of the labor force (85.9%) are working in agriculture. About 12.5% of the labor force is involved in trading business and services and 1.6% in other sector. It was reported that approximately 80% of their total income from agriculture. The poverty level in the village is around 11%. Average income per capita is relatively low, particularly among ethnic households.
5. Health care and education
The village has a health centre with 7 staff (1 doctor and 6 nurses). Village health center is overseen by the District Health Centre. There are 4 schools and 1 kinder garden located in the village with a the total number of 102 class rooms. The total number of pupils in year 2005 is 3340 pupils. However for higher secondary school, village children have to go to the district center. Education statistics of Nghia Trung village in year 2005 is provided in Table 2. The education status of the farmers in the village will be further discussed in the section on household characteristics of the report.
Table 2. Education statistics in Nghia Trung village in year 2005.
Commune Schools Class rooms Classes Number of pupils
Lower secondary school 25 29 1173 Nghia Trung primary school 26 26 856 Trinh Hoai Đuc primary school 13 17 378 Le Van Tam primary school 25 25 546 Sao Mai kinder garden 13 13 387 Total 102 110 3340
Source: Statistic data from Nghia Trung village.
- 6 -

6. Agricultural production
Agricultural production plays the most important role in the economy of Nghia Trung village, contributing the largest share in income of local people. Agricultural production system in the village is characterized by a high mono-culture of perennial crop production system. Most of the cultivated land in the village (95%) is planted with perennial cash crop and only a small land area (5%) is used for the cultivation of annual crops. The main cash crops for local farmers include cashew, coffee, rubber, and black pepper. Currently, most farmers in the village are involved in cashew production. The total area planted with cashew is 3255 ha, about 65% of the total cultivated land area of the village. Coffee is the crop having the second largest cultivated area in the village. In the past five years, as coffee price was falling down at low level, some farmers have shifted from coffee to cashew, rubber and more recently to cacao. The cultivated area of main crops in the village is presented in Table 3.
Table 3. Cultivated area of main crops in Nghia Trung village in 2005.
Cultivated area Crops (ha) (%)
Annual crops 243.3 5% Perennial crops: 4726.4 95%
Cashew 3255.0 65%
Rubber 275.5 6%
Coffee 1095.0 22%
Black pepper 33.4 1%
Fruit trees 67.5 1%
Total 4969.7 100% Source: Statistic data from Nghia Trung village.
- 7 -

III. Characteristics of the households
Regarding the characteristics of the sample households, data collected from the baseline survey were analyzed based on farmers’ wealth status (i.e. wealthy, intermediate and poor farmer groups) and by ethnicity (Kinh and other ethnic minority group). A relatively high number of wealthy households (53%) was recorded among Kinh households while only 33% of the ethnic minority households belong to the wealthy household group. The number of poor households is quite high among ethnic minority household (about 20%). The data on major characteristics of the sample households are summarized in Table 4.
Table 4. Basic features of the sample households by wealth status and ethnicity.
By wealth status By ethnicity Wealthy Intermediate Poor Kinh Other ethnic
Total Items
n = 148 n = 123 n = 35 n = 231 n = 75 n = 306
Age of HH head (year) 45.4 45.8 46.3 45.8 45.3 45.7 Educational status (%)
Illiterate 6% 15% 29% 6% 32% 12% Primary 30% 37% 31% 30% 41% 33% Lower secondary 37% 35% 31% 41% 20% 36% Higher secondary 24% 11% 9% 21% 7% 17% College/university 3% 1% 0% 2% 0% 2%
Ethnic background (%) Kinh (% of N=231) 53% 38% 9% Other (% of N=75) 33% 47% 20%
Family size (persons) 5.0 6.0 5.4 5.1 6.5 5.4 Gender (%)
Female 46% 50% 45% 48% 47% 48% Male 54% 50% 55% 52% 53% 52%
Age Structure < 15 years 27% 36% 35% 30% 37% 32% 15-60 years 70% 59% 59% 66% 58% 64% > 60 years 3% 6% 6% 4% 5% 5%
Labor per household 2.9 3.1 2.8 2.9 3.3 3.0 Dependency Ratio 0.74 0.94 0.94 0.78 1.01 0.84
Source: Baseline survey data
* Labor force refers to the number of member of the household who are actually involving in at least one economic activity (on farm, off-farm or non-farm work). Dependency ratio indicates the number of family members (aged 0-14 and over the age of 65) to the total number of labor per household.
- 8 -

1. Household size
The average household size in the survey is 5.4 persons/household, with a slightly higher number of males (52%) than females (48%). The proportion of female members of the sample households is similar to that of the statistic data reported by the village (46% of the population are females). The survey data shows that majority of households (64%) have 4-6 members. About 20% of the households have a family size of 7-9 members and about 12% with 1-3 members. Only few households have large family size of 10-12 persons or more (Figure 2). Data collected from the baseline survey shows that on the average, wealthy household have a smaller household size than poor and intermediate households. Among the households under survey, households of ethnic minority groups has significant larger household size (6.5) than Kinh group (5.1).
1-3 persons(12%)7-9 persons
(20%)
10-12 persons
(3%)
>13persons
(1%)
4-6 persons (64%)
Figure 2. Distribution of the sample households by family size.
2. Literacy Level
Data on the educational status of the respondents are presented in Table 4. In general, most of the household heads (88%) had attended school whereas 12% never had. Majority of the heads of households (69%) have either primary or lower secondary education level. A relatively high level of education was reported among wealthy farmers with 27% of the household head having higher secondary education or higher education.
Low literacy level was recorded among the poor households and households of the ethnic minority groups. The number of household heads having higher secondary education is quite low among the poor households and households of ethnic minority group with only 9% and 7%, respectively. The data also shows that about 29% of the poor households and 32% of ethnic minority households having their household head illiterate while illiteracy among the head of the Kinh households is only 6%.
- 9 -

3. Labor
The age structure among members of the households under survey revealed that the village has a young population with about 95% of the household members are younger than 60 years. About 64% of household members are in the working age from 15 to 65 years old. The composition and size of the household is presented in Table 4.
The average number of labor per household is 3 person (56% of total family size). This average number of labor among households under survey is relatively higher than the statistic data reported by the village authority (42%). The reason may be due to the fact that farmers have often reported both full-time and part-time laborers (such as wife and children older than 15 years old participating as part-time labor in farm activities) while statistic data in the village recorded only fulltime laborer. There is no significant difference in the average labor force among households with different wealth status and ethnic groups. However due to the relatively large family size, there is a high dependency ratio among ethnic households in the village.
4. Occupation
The baseline survey has also collected information on the main and side occupation of the household heads. This information is summarized in Table 5. Main activities of the heads of the sample households are highly characterized by an agriculture orientation with about 91.2% of the heads of the family engaged in agricultural production. Agriculture was reported to be the main occupation for all household heads of ethnic minority groups. Among poor households, particularly Kinh farmers, only 85.7% of the household heads find their main occupation in agriculture. Others, due to the limited land for cultivation, have to earn their income from off-farm and non-farm activities.
As side occupation, data from the baseline survey refers to other activities of the household heads besides their main occupation to generate additional income for the farm households. A relatively high percentage of wealthy households were recorded to have their household heads involved in trade business and services while working in forestry, mainly in forest protection activities, is an important side occupation among ethnic poor households. It was reported that currently, forest land in the village is being managed by Nghia Trung sate forest enterprise. The forests in the study area are not only importance for providing timber and other forest products, but also important environmental and ecological services, particularly for regulating water flow to support the Tri An and Thac Mo hydroelectric plants. Based on the forest allocation and benefit sharing policies implemented the country and in Binh Phuoc province, Nghia Trung state forest enterprise has allocated forest land to local villagers, mainly to the poor Stieng households for protection. The average area contracted to local households for forest protection is about 30 ha/household. Household received a fixed payment of VND 50,000 per hectare per year for forest protection.
- 10 -

Table 5. Percentage distribution of respondent by occupation.
By wealth status By ethnicity
Wealthy Intermediate Poor Kinh Other ethnic Total
Items % of
(n = 148) % of
(n = 123) % of
(n = 35) % of
(n = 231) % of
(n = 75) % of
(n = 306)
Main Occupation Agriculture 90.5% 91.9% 85.7% 88.3% 100.0% 91.2% Off-farm labor 0.0% 0.0% 8.6% 0.9% 0.0% 0.7% Non-farm labor 5.4% 1.6% 2.9% 4.8% 0.0% 3.6% Trade business 0.0% 2.4% 0.0% 1.3% 0.0% 1.0% Govt Service 0.0% 0.8% 0.0% 0.4% 0.0% 0.3% Teacher 1.4% 1.6% 0.0% 1.7% 0.0% 1.3% Private services - Transport 1.4% 0.0% 0.0% 0.4% 0.0% 0.3% - Other services 1.4% 1.6% 2.9% 2.2% 0.0% 1.6% Side occupation Agriculture 8.1% 5.7% 0.0% 8.2% 0.0% 7% Forestry 1.4% 3.3% 2.9% 0.0% 9.3% 2.3% Off-farm labor 1.4% 1.6% 5.7% 2.6% 0.0% 2.0% Non-farm labor 3.4% 4.1% 2.9% 3.9% 2.7% 3.6% Trade business 7.4% 2.4% 0.0% 5.6% 1.3% 4.6% Govt Service 3.4% 1.6% 2.9% 3.0% 0.0% 2.6% Private services - Transport 1.4% 0.8% 0.0% 1.3% 0.0% 1.0% - Other services 1.4% 0.8% 0.0% 1.3% 0.0% 1.0%
Source: Baseline survey data
5. Housing and assets
During the survey, farmers were asked to provide information on housing material and their housing condition. The survey data revealed that about 53.6% of the households have brick and cemented houses and 39.2% living in wooden house. Among poor households, about 37.1% of the households is residing in thatch-roofed houses. Regarding housing condition, there is only a small number of households (0.3%), mainly wealthy Kinh farmers, reported to have a very good housing condition. The majority of households dwell in houses of either fair or good condition. The number of household having poor housing condition is relatively large, 14.7% and 18.7% among Kinh and ethnic minority farmers, respectively. Among the poor, there is very high percentage of households (68.6%) living under poor housing condition. It was reported during the farmer group discussion that poor housing condition is a significant factor contributing to poor health.
- 11 -
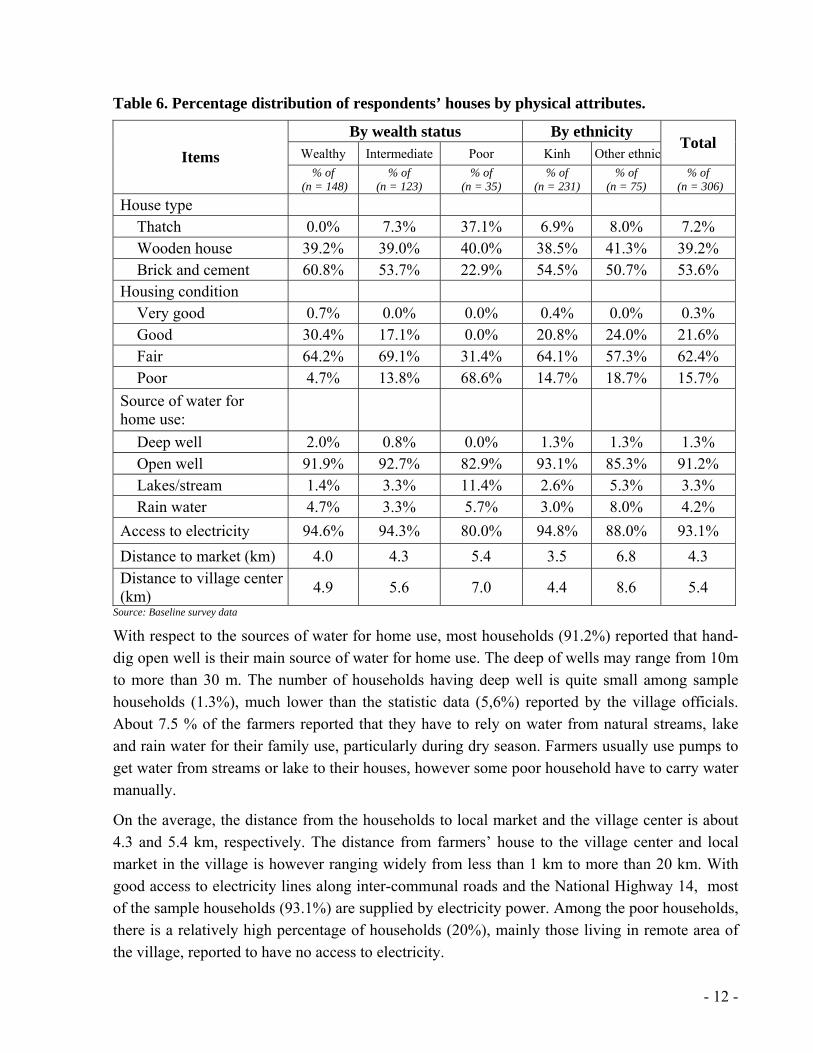
Table 6. Percentage distribution of respondents’ houses by physical attributes.
By wealth status By ethnicity Wealthy Intermediate Poor Kinh Other ethnic
Total Items
% of (n = 148)
% of (n = 123)
% of (n = 35)
% of (n = 231)
% of (n = 75)
% of (n = 306)
House type Thatch 0.0% 7.3% 37.1% 6.9% 8.0% 7.2% Wooden house 39.2% 39.0% 40.0% 38.5% 41.3% 39.2% Brick and cement 60.8% 53.7% 22.9% 54.5% 50.7% 53.6%
Housing condition Very good 0.7% 0.0% 0.0% 0.4% 0.0% 0.3% Good 30.4% 17.1% 0.0% 20.8% 24.0% 21.6% Fair 64.2% 69.1% 31.4% 64.1% 57.3% 62.4% Poor 4.7% 13.8% 68.6% 14.7% 18.7% 15.7%
Source of water for home use:
Deep well 2.0% 0.8% 0.0% 1.3% 1.3% 1.3% Open well 91.9% 92.7% 82.9% 93.1% 85.3% 91.2% Lakes/stream 1.4% 3.3% 11.4% 2.6% 5.3% 3.3% Rain water 4.7% 3.3% 5.7% 3.0% 8.0% 4.2%
Access to electricity 94.6% 94.3% 80.0% 94.8% 88.0% 93.1% Distance to market (km) 4.0 4.3 5.4 3.5 6.8 4.3 Distance to village center (km) 4.9 5.6 7.0 4.4 8.6 5.4
Source: Baseline survey data
With respect to the sources of water for home use, most households (91.2%) reported that hand-dig open well is their main source of water for home use. The deep of wells may range from 10m to more than 30 m. The number of households having deep well is quite small among sample households (1.3%), much lower than the statistic data (5,6%) reported by the village officials. About 7.5 % of the farmers reported that they have to rely on water from natural streams, lake and rain water for their family use, particularly during dry season. Farmers usually use pumps to get water from streams or lake to their houses, however some poor household have to carry water manually.
On the average, the distance from the households to local market and the village center is about 4.3 and 5.4 km, respectively. The distance from farmers’ house to the village center and local market in the village is however ranging widely from less than 1 km to more than 20 km. With good access to electricity lines along inter-communal roads and the National Highway 14, most of the sample households (93.1%) are supplied by electricity power. Among the poor households, there is a relatively high percentage of households (20%), mainly those living in remote area of the village, reported to have no access to electricity.
- 12 -

The percentage of households owning a specific household assets and farm machinery and equipments is presented in Table 7. The survey data shows that there is only a small number of households having tractor and electric generator, mainly wealthy farmers. Except for poor households, majority of the sample households have pumps and a relatively large number of households have pipe line for crop irrigation, particularly for coffee and black pepper. Majority of the households (94%) have television and motorbike, an important mean for transportation of personnel and inputs and farm produce for local villagers. As reported by farmers, television is an important source of information for them, particularly information from extension program in the province.
Table 7. Assets of the sample households.
By wealth status By ethnicity Wealthy Intermediate Poor Kinh Other ethnic
Total Assets
% of (n = 148)
% of (n = 123)
% of (n = 35)
% of (n = 231)
% of (n = 75)
% of (n = 306)
Tractor/plowing tractor 11% 2% 0% 7% 4% 6% Electric generator 7% 4% 0% 4% 8% 5% Pump 89% 69% 31% 74% 76% 74% Miller 11% 5% 3% 6% 11% 8% Irrigation pipes 57% 45% 11% 48% 44% 47% Car, Jeep 1% 1% 3% 0% 4% 1% Radio 24% 20% 20% 22% 21% 22% Refrigerator 42% 22% 3% 37% 7% 29% TV 99% 93% 74% 95% 92% 94% Bicycle 19% 27% 31% 25% 19% 24% Motorbike 99% 93% 77% 96% 91% 94% Electric fan 86% 74% 46% 81% 61% 76% Cooking stove/gas 79% 55% 9% 74% 23% 61% Telephone 58% 30% 11% 47% 25% 42% VDC, Video 84% 80% 34% 78% 72% 77% Total value of assets ('000 VND/HH) 30,469 14,127 3,804 22,595 15,478 20,850
Source: Baseline survey data
The data on total value of household assets revealed that there is quite large differences in total value of assets among households with different wealth status. On the average, the value of assets owned by a wealthy household is about 30 time higher than that of a poor household. The differences in total value of assets also reflect the differences in the living condition between poor and wealthy households in the village. Significant higher value of assets was also recorded among Kinh farmers as compared to ethnic minority farmers.
- 13 -

6. Income
The average annual income per farm household in the study area is about 63.645 million VND (3978.4 USD). The annual income per household however varies widely across the surveyed households, ranging from about 2 million VND to 200 million VND. On the average, income from a wealth household is about 8.3 times more than that of a poor household and about 2.8 times more than an intermediate household. Income of Kinh farmers is on the average about 21% higher than that of ethic minority household.
Average income per capital of about 975,000 VND (61 USD) per months. However there is quite large differences in income per capital between wealthy and poor households in the village. The average income per capital of a wealthy household is about 9 time higher than that of a poor household and 3.4 time higher than that of an intermediate household. With lower income and a large household size, income per capital of an ethnic minority household is about 1.6 time lower than that of a Kinh household.
Table 8. Income of the sample household by sources.
By wealth status By ethnicity Wealthy Intermediate Poor Kinh Other ethnic
Total Items
% of (n = 148)
% of (n = 123)
% of (n = 35)
% of (n = 231)
% of (n = 75)
% of (n = 306)
Income per household 99,332 35,419 11,930 66,514 54,808 63,645 Agriculture 86.2% 86.6% 64.7% 83.1% 96.0% 85.8%
Animal production 4.4% 4.3% 5.9% 4.4% 4.5% 4.4% Crop production 81.7% 82.4% 58.8% 78.7% 91.6% 81.4%
Forestry 0.0% 0.2% 0.6% 0.0% 0.3% 0.1% Off-farm activities 2.2% 3.2% 15.4% 3.2% 1.1% 2.7% Non farm activities 11.6% 9.9% 19.2% 13.8% 2.5% 11.4%
Income per capita ('000VND/month) 1,667 489 185 1,091 698 975 Income per labor ('000VND/month) 2,896 948 359 1,943 1,404 1,797
Source: Baseline survey data
Income from agriculture contributes the largest share (86%) of the total household income in the village. This data reflects the occupation data reported earlier that most of the household labor are involved in agricultural activities. The income from agriculture is based mainly from crop production. Livestock production contributed only 4,4% to the total household income. Across different types of farmers, animal production seems to be slightly more important for the poor household with about 5.9% of their total household income on the average.
Off-farm and non farm activities were recorded to be important income sources for poor households (15.4% and 19.2%, respectively), particularly for households with small land holding. Non-farm activities such as trading business and local services, also provide significant income for Kinh farmers, particularly wealthy households. Forestry only contributes to a small share to
- 14 -

the total income of the sample households, mainly for ethnic poor households who have been allocated forest land for protection and management.
In term of income from crop production, cashew is the most important crop contributing to more than 61% of the total income from crop production of the sample households (Table 9). Coffee is the second most important crop in the village, followed by rubber and black pepper. Annual crops such as maize and cassava have only a small contribution to household income of local villagers. The income from vegetables and fruit contributes to only a very small income of the sample households. The data on income from different crops clearly reflects the current cropping pattern of the village towards perennial crop production and highly monoculture cash crop production system with a few perennial cash crops such as cashew, coffee, rubber and black pepper.
Table 9. Income of the sample household from crop production.
By wealth status By ethnicity Wealthy Intermediate Poor Kinh Other ethnic
Total Items
% of (n = 148)
% of (n = 123)
% of (n = 35)
% of (n = 231)
% of (n = 75)
% of (n = 306)
Income from crop production ('000 VND) 81,188 29,167 7,018 52,315 50,192 51,794
Income share by crops: Maize 0.1% 0.0% 1.0% 0.1% 0.0% 0.1%Coffee 28.2% 17.7% 17.5% 21.7% 38.4% 25.6%Black pepper 3.6% 3.2% 1.1% 4.5% 0.2% 3.5%Cashew 56.8% 74.5% 76.0% 61.8% 59.0% 61.1%Rubber 10.9% 1.2% 0.0% 11.0% 0.8% 8.6%Cassava 0.2% 2.6% 4.4% 0.6% 1.5% 0.8%Vegetables 0.0% 0.3% 0.0% 0.1% 0.0% 0.1%Fruits 0.1% 0.0% 0.0% 0.0% 0.1% 0.1%Other crops 0.0% 0.4% 0.0% 0.1% 0.0% 0.1%
Source: Baseline survey data
- 15 -

IV. Household consumption
1. Household expenditure
During the baseline survey, farmers were asked to provide their annual expenditure for the year 2005 as well as expenditure spent for major items such as food, education, clothes, health, festivals, agriculture and livestock production, and others. The survey data is summarized in Table 10. The survey data on household expenditures shows that on the average a farm household in Nghia Trung village spent 45.43 million VND (about 2,839 USD) per year. On the average, the annual expenditure for consumption is about 71% of their annual income. Average annual saving is about 29% of the total household income. The largest household expenditure is for food (37%), followed by the expenditure for agriculture inputs (21%) and education (10%).
Table 10. Households’ annual expenditure by items.
By wealth status By ethnicity Wealthy Intermediate Poor Kinh Other ethnic
Total Items
% of (n = 148)
% of (n = 123)
% of (n = 35)
% of (n = 231)
% of (n = 75)
% of (n = 306)
Annual expenditure (Mil VND) 59.25 36.48 17.49 47.45 38.32 45.43 Expenditure by items:
Food 34% 41% 48% 37% 36% 37% Education 11% 7% 7% 10% 10% 10% Clothes 4% 5% 4% 4% 4% 4% Health 8% 8% 22% 8% 8% 8% Festivals 6% 7% 6% 7% 6% 7% Agriculture (Seed, fertilizer, wage, etc) 25% 15% 9% 20% 24% 21% Livestock (Inputs, others) 3% 9% 1% 6% 3% 5% Others 8% 8% 3% 8% 8% 8%
Percentage of Expenditure to Income 60% 103% 147% 71% 70% 71%
Source: Baseline survey data
However among poor households, the expenditure for food is almost a half of the total household expenditure. Expenditure for health care was reported to be very high for poor households and is the second larges expenditure item (22%). The expenditure for agriculture inputs was recorded to be very low for poor households as compared to the average data for the village. Data on the percentage of annual expenditure to total household income shows that while a wealthy
- 16 -

household in the village could have a saving of about 40% of the income, poor household on the average has spent about 47% more than their annual income.
The survey data has been further analyzed based on a range of expenditure over household income. The data is summarized in Table 11. In term of expenditure over household income, the survey data shows that about 34% of the sample households have higher annual expenditure than their income. Most of the poor households (63%) and about half of the intermediate households have spend more than the income they have earned annually.
Table 11. Percentage of expenditure over income of the sample households.
By wealth status By ethnicity Wealthy Intermediate Poor Kinh Other ethnic
Total % of expenditure over income
% of (n = 148)
% of (n = 123)
% of (n = 35)
% of (n = 231)
% of (n = 75)
% of (n = 306)
≤ 50% 29% 7% 3% 16% 20% 17%
50% - 75% 34% 25% 14% 30% 24% 28%
76 - 100% 22% 17% 20% 19% 23% 20%
>100% 14% 51% 63% 35% 33% 34%Source: Baseline survey data
More detail information on household expenditure for food has been collected during the household nutrient survey in which farmers were asked to provide information on their spending for different food items per week. Figure 3 presents the distribution of expenditure per week for various food items consumed by an average household in the village. The data shows that most of food expenditure is for meet, fish, eggs and cereals. The share of expenditure for vegetable and fruit consumption is about 19% of the total households expenditure for food.
Cereals (rice,other)
25%
Meet, fish, eggs49%
Vegetables11%
Fruits 8%
Other food7%
Figure 3. Distribution of household’s weekly expenditure for food items.
- 17 -

2. Vegetable and fruit consumption
With special interest of the study on vegetable agro-forestry system, the baseline study has further collected data on vegetable and fruit consumption of the sample households. The survey data on vegetable and fruit consumption across households with different wealth status and ethnicity is summarized in Table 12 and 13.
The survey data on vegetable consumption shows that on the average, a farm household in the village has consumed about the same quantity of different types of vegetable in both the wet and dry season. The average quantity of vegetables consumed per households per week in the wet and dry season is about 7.4 kg and 7.6 kg, respectively. There is no large differences in the expenditure for vegetables and quantity consumed across household groups.
Table 12. Vegetables consumption per week among sample households.
By wealth status By ethnicity Wealthy Intermediate Poor Kinh Other ethnic
Total Vegetable consumption
% of (n = 148)
% of (n = 123)
% of (n = 35)
% of (n = 231)
% of (n = 75)
% of (n = 306)
Wet season Quantity (kg/week) 7.7 7.0 8.0 7.5 7.4 7.4
Farm produced 13% 13% 8% 12% 15% 13% Home garden 0% 1% 1% 0% 1% 1% Collected in the forest 2% 5% 6% 1% 12% 4% Bought 84% 81% 85% 87% 72% 83%
Cost for vegetables (’000VND/week) 26.9 25.1 26.5 27.4 22.2 26.1
Dry season Quantity (kg/week) 7.8 7.3 8.1 7.6 7.6 7.6
Farm produced 10% 12% 8% 10% 13% 11% Home garden 0% 0% 0% 0% 1% 0% Collected in the forest 1% 5% 5% 0% 11% 3% Bought 89% 82% 87% 90% 75% 86%
Cost for vegetables (’000VND/week) 29.2 26.0 27.4 29.1 23.5 27.7
Source: Baseline survey data
Similarly, the average quantity of fruit consumed per household is almost the same in both wet and dry season. The expenditure for fruits is however much higher for a wealthy household as compared to that of a poor household, explaining the fact that wealthy households could be able to spend for higher quality and more expensive fruits. It was reported that more than 80% of the vegetables as well as fruits consumed by the household is brought from local market. Among ethnic minority households, a relatively large quantity (25% to 28%) of vegetables consumed by their family is either planted in the farm or collected from the forest.
- 18 -

The survey data on vegetable and fruit consumption among sample households indicates that improving vegetable cultivation, either from improving vegetable cultivation in home garden or through integrated vegetable agro-forestry systems would help farmers in the village, particularly the poor farmers to reduce their expenditure for vegetable and fruit significantly. The reduction in expenditure for vegetables and fruits would therefore increase the relative income of the poor households, in term of saving a significant amount of money for vegetable and fruits to spend for other food items.
Table 13. Fruits consumption per week among sample households.
By wealth status By ethnicity
Wealthy Intermediate Poor Kinh Other ethnic Total
Fruit consumption % of
(n = 148) % of
(n = 123) % of
(n = 35) % of
(n = 231) % of
(n = 75) % of
(n = 306)
Wet season Quantity (kg/week) 5.2 4.8 2.7 5.0 3.9 4.7
Farm produced 14% 20% 3% 17% 11% 15% Home garden 1% 0% 0% 0% 3% 1% Collected in the forest 1% 0% 0% 0% 0% 0% Bought 84% 80% 97% 82% 87% 84%
Cost for fruits (’000VND/week) 28.9 21.1 15.7 26.2 18.2 24.3
Dry season Quantity (kg/week) 5.2 4.4 2.6 4.8 3.9 4.6
Farm produced 14% 19% 24% 14% 27% 17% Home garden 1% 0% 0% 0% 2% 0% Collected in the forest 1% 0% 0% 0% 0% 0% Bought 84% 81% 76% 86% 72% 82%
Cost for fruits (’000VND/week) 31.4 23.6 14.3 29.1 17.8 26.3
Source: Baseline survey data
- 19 -

V. Characteristics of the farm and farming system
1. Characteristics of the farm
The average farm size of the sample farm in Nghia Trung village is 3.7 hectare (Table 14). This average farm size in Nghia Trung village is much higher than the average farm size in the country. Majority of the households (62%) have a fame size from 1-4 ha. On the average, ethnic minority farmer own a larger farm (4.3 ha) than Kinh farmers (3.6 ha). The data revealed that most poor farmers (83%) own a farm land of less than 2 hectare. About 40% of the poor household has a farm size of less than 1 hectare. A relatively large number of wealthy farmers (29%) have very large farm size of more than 5 hectare.
Table 14. Distribution of sample households by farm size.
By wealth status By ethnicity Wealthy Intermediate Poor Kinh Other ethnic
Total Farm size (ha)
% of (n = 148)
% of (n = 123)
% of (n = 35)
% of (n = 231)
% of (n = 75)
% of (n = 306)
Average farm size (ha) 4.9 3.1 1.3 3.6 4.3 3.7 <1 3% 6% 40% 10% 5% 8% 1-2 11% 33% 43% 25% 20% 24% 2-3 18% 26% 11% 20% 21% 21% 3-4 20% 17% 6% 16% 19% 17% 4-5 11% 3% 0% 8% 4% 7% 5-6 10% 7% 0% 7% 9% 8% >6 12% 8% 0% 8% 13% 9% >10 7% 0% 0% 3% 4% 3%
Source: Baseline survey data
2. Land ownership
The information on land ownership and land use were also recorded during the survey. The data on the distribution of farm land regarding ownership indicates that about 59% of the farmer’s land have a formal land title (land use certificate) and 38% do still not have a formal land title. The discussion with villager leaders revealed that the process of providing land use certificates to local farmers has been speeding up over the last years. Land without a formal land use certificates includes mainly those illegally opened from forest land or do not have clear prove of their origin.
- 20 -

It was reported that only 35% of the land cultivated by poor household have a formal land use certificates and 10% is tribal or traditional land while 55% of their land do not have a formal land title. Among intermediate farmers, there is also a high percentage of land area that do not have formal land title. It was reported that for borrowing credit loan from the bank, farmers often use their land use certificate as collateral. Lack of formal land title (land use certificates) is one critical factor that limits poor farmers from access to the formal credit sources.
Table 15. Distribution of farm land by ownership and use types.
By wealth status By ethnicity
Wealthy Intermediate Poor Kinh Other ethnic Total
Items % of
(n = 148) % of
(n = 123) % of
(n = 35) % of
(n = 231) % of
(n = 75) % of
(n = 306)
Size of farm (ha) 4.9 3.1 1.3 3.6 4.3 3.7 Ownership (%)
- Formal title 68% 45% 35% 62% 51% 59% - Tribal or traditional 2% 4% 10% 2% 6% 3% - Non 30% 50% 55% 35% 43% 38%
Source: Baseline survey data
3. Land use
In general, soils in the study area are found to be very fertile. It was reported that major soil types in the village is the basaltic soil which is fertile and has favorable physical characteristics for the cultivation of perennial cash crops such as coffee, rubber, cashew, black pepper, cacao and fruit trees. There is only small area with black soil and swampland in narrow valleys in the village. The field survey revealed that most farm land of the respondents are sloping land that have medium to high risk of soil erosion. A large proportion of farmers’ cultivated land is located on steep slopping hill sides where soil erosion and loss of soil fertility is clearly visible. Most farmers have realized the risk of soil erosion but many do not know the effective way to control it. It was reported during farmer group discussion that soil erosion is one priority problem that need to be addressed.
Farmers’ land are classified based on the land use types such as home garden, paddy field, land for other annual crops, land for perennial crops, barren land, and land for other uses such as fish ponds. The survey data on farmers’ land uses show that almost all land area of the sample farmers (96%) is classified as land for perennial crops (Table 16). Only very small portion of the total farm land of the sample farmers is classified as home garden, paddy field, or land for other annual crops.
- 21 -

Table 16. Distribution of farm land by land use types (% of total farm land)
By wealth status By ethnicity Wealthy Intermediate Poor Kinh Other ethnic
Total Land use types
% of (n = 148)
% of (n = 123)
% of (n = 35)
% of (n = 231)
% of (n = 75)
% of (n = 306)
Home garden 1% 1% 1% 1% 1% 1% Paddy field 0% 1% 1% 0% 1% 0% Other annual crops 0% 1% 1% 1% 1% 1% Perennial crops 98% 94% 96% 97% 95% 96% Barren land 0% 1% 1% 0% 0% 0% Other use 0% 1% 0% 1% 1% 1%
Source: Baseline survey data
On the average, paddy field and land for other annual crop is only less than 1% of the total farm land, reflecting the fact that the cultivation of rice and other annual food and cash crop play only a minor role in the farming system of the local villagers. Farmers in the village also keep a small area for home garden (less than 1% of the farm land). The home garden of many farmers in the village however have a similar structure and cropping pattern like that of perennial crop land. In the home garden around their houses, most farmers have also planted perennial cash crops such as cashew, coffee or black pepper. Vegetables are grown in only a small area in the home garden, mainly for home consumption. Data on sources of water for different types of land (Table 17) shows that very large area of the farmers’ land classified as paddy field, land for other annual crops and for perennial crops is cultivated under rainfed condition. About 34% of the land cultivated with perennial crops have good access to water from natural stream, pond or lake in the village. Better access to water sources such as steam, lakes or ponds, and wells is mainly found for farmers’ land classified as home gardens.
Table 17. Sources of water for different types of farm land (% of area by land use types).
Source of irrigation Home garden Paddy field Land for other annual crops
Land for perennial crops
Rainfed 23% 86% 75% 62% Stream 17% 0% 0% 18% Lake, pond 23% 14% 13% 16% Hand-dig well 30% 0% 6% 3% Deep well 7% 0% 6% 0%
Source: Baseline survey data
4. Cropping pattern
Most farmers in the study area are involved in the production of perennial cash crops with either one or a combination of different perennial cash crops such as cashew, coffee, rubber, black pepper, and more recently with cacao. Data on major cropping pattern among sample households is summarized in Table 18. Data from the baseline survey revealed that about 90% of farmers’
- 22 -

perennial crop land is planted with one monoculture perennial crop and only 5% is planted two perennial cash crops in combination. Even in farmers’ home garden, about 56% of the farmers have planted only one perennial crops with either cashew, coffee, or black pepper.
Table 18. Major cropping pattern of the sample households (% of sample households).
Cropping pattern Home garden Land for perennial crops
One perennial crop (Cashew or coffee, or black pepper, or rubber) 56% 90%
Two perennial crops (cashew+ coffee or pepper, or cacao, other) 13% 5%
Thee perennial crops 4% 0%
Fruit trees 4% 1%
Vegetables 10% 0%
Argro-forestry (Perennial and annual food crops) 4% 4%
Vegetable agro-forestry (Perennial and vegetables) 9% 0%
It was found that about 4% of the farmers’ perennial crop land is cultivated with agro-forestry systems such as the planting an annual food crop like cassava, maize, or other food crops in youth planting of a perennial crops such as cashew, coffee, or rubber. About 13% of the sample farmers have practiced an agro-forestry system (i.e. perennial cash crop with annual food crop or vegetables) in a part of their home garden.
Data from the baseline survey revealed that cashew is the dominant crop planted by most local villagers. Food crops and vegetables have only a minor role in the farming system of the village. Agro-forestry systems, even found in the home garden of 13% of the sample households, are practiced only on a small area. Data from the survey clearly shows that there is a low crop diversification among farmers in Nghia Trung village.
5. Vegetable cultivation and constraints
In term of vegetable cultivation, the data shows that among the 306 sample household, only 64 households (21%) have some vegetables cultivated on their farm. The area cultivated with vegetable as well as the quantity of vegetables produced by a farm household is usually small. Among the households having vegetable cultivation, only 5% of the households reported to sell vegetables to the local market. Farmers usually bring a small quantities of vegetables they produced to the local market using bike or motor bike. Income from vegetable cultivation therefore contributes to a very small portion of the total household’s income as reported in the earlier section. The data is reflecting the fact that vegetable production in Nghia Trung village is characterized by a small scale production, mainly for home consumption.
- 23 -

Table 19. Vegetable cultivation among sample households.
By wealth status By ethnicity Wealthy Intermediate Poor Kinh Other ethnic
Total Items
% of (n = 148)
% of (n = 123)
% of (n = 35)
% of (n = 231)
% of (n = 75)
% of (n = 306)
Number 30 31 3 51 13 64 Households growing vegetables % 20% 25% 9% 22% 17% 21%
Number 1 1 1 2 1 3 Households selling vegetables % 3% 3% 33% 4% 8% 5% Source: Baseline survey data
During the survey, farmers were asked to provide major constraints to vegetable cultivation on their farm. Among the 306 households under survey, 192 households provide their answers to this question. Constraints reported by farmers include those relating to land suitability, marketing and vegetables prices, experience with vegetables, pest/disease problems, labor availability, water availability and other factors (Table 20). A large number of farmers mentioned that their land is not suitable for vegetables. Labor, land, and water availability were also reported by local farmers to be important constraints to vegetable cultivation.
Table 20. Constraints to vegetable cultivation.
Constraints to vegetable cultivation Number of farmers reported
% (of N=192)
Number of households answered 192 Land is not suitable 110 57% Vegetables is difficult to market 2 1% Vegetables prices are too low 1 1% No experience with vegetables 12 6% Pest/disease problems 5 3% Better to do something else 27 14% Not enough labor 25 13% Not enough land 58 30% No water for cultivation 38 20%
Source: Baseline survey data
Limited land was considered by 30% of the sample farmers as an important constraint to farmers cultivation of vegetables. Many farmers have explained that the remaining area in their home garden is limited because they have already planted cashew or other perennial crops in their home garden. Water shortage is a serious problem for vegetable cultivation during dry season. Regarding the option for integrating vegetables under perennial trees in the home garden, farmers have also reported that they find it difficult to cultivate vegetables in their home garden due to great shade under perennial crops and lack of suitable shade-tolerant vegetables varieties. Labor
- 24 -

availability was considered as an important constraints for large households. With relatively large land area, most family labor is spend for farming activities relating to the cultivation of perennial cash crop. Lack of labor was reported to be common among farmers during harvesting periods. These limiting factors need to be further investigated and be considered in the investigation on options for integrating vegetables into existing tree planting.
- 25 -

VI. Cashew production
1. General characteristics of cashew cultivation
As cashew is the major crop in the village, the baseline study provides a more detail analysis on the production practices and crop budgeting for this crop. The field survey in the village revealed that the fertile and well-drained basaltic soil in the study area is very suitable for cashew production. It was reported that the total area planted with cashew in Nghia Trung village is about 3,255 ha. The income from cashew contributes to the largest share of total income of many households in the village. Among 306 households under survey, 291 households (95%) have reported to plan cashew in their farm. On the average, the number of cashew trees per hectare is 240 trees, but may range widely from 50 to 1,200 trees/ha, depend on the age of cashew trees. The distribution of cashew planting according to tree age and number of trees per hectare is presented in Table 21.
Table 21. Distribution of age and density of cashew plantations.
Items Number of households
% of (N=291)
Number of households planted 291 Age of trees (years)
<5 16 5% 5-10 66 23% 10-15 86 30% 15-20 97 33% >20 26 9%
Number of tree/ha 50-100 51 18% 100-200 73 25% 200-400 135 46% 401-600 23 8% 601-800 5 2% >800 4 1%
Source: Baseline survey data
Data shows that most cashew plantation (71%) has a density between 100-400 trees per hectare. Only small number of cashew plantation has a density of more than 400 trees per hectare, mainly youth cashew plantations. A large number of cashew garden were planted about 10 to 20 years ago. There is only 9% of the cashew plantation are older than 20 years. It was reported by farmers that under the local soil and climatic conditions, cashew trees begin to bear fruits in year
- 26 -

3 after planting. The highest yield is achieved from year 5 to year 7 and cashew yield will reduce after year 10.
The major activities in cashew production include weeding, pruning of branches, application of fertilizers and pesticides, field cleaning, and harvesting. A general cropping calendar for cashew crop is presented in Table 22.
Table 22. Cashew cropping calendar in Nghia Trung village.
Activities Jan Feb Mar Apr May Jun Jul Aug Sep Oct Nov DecWeeding
Pruning
Fertilizer application
Pesticides application
Field cleaning
Harvesting Source: Baseline survey data
Weeding is usually done two time, one at the begin of the rainy reason in June and another one at the end of the rainy season in September. Weeding may be done using motorized weeder or herbicides to control the weeds. Some farmers do the weeding only one time at the end of the rainy season to avoid soil erosion on their field. Fertilizer application is usually done after weeding. During the rainy season, farmers have also pruned cashew trees to remove death and unproductive branches of the trees. Pesticides application is often done in September and in November before the cashew trees start blooming. Before the harvesting, farmers often have to clean their field by gathering and burning leaves and death branches for easier harvesting of the cashew nuts on the ground. This activity is often done in the period from December to February. The harvesting season usually last form March to middle of May.
2. Input use in cashew production
Major inputs use far cashew production recorded during the survey include chemical and organic fertilizer, herbicides, pesticides, and labor. The average quantities of inputs use for one hectare of cashew of the sample households are presented in Table 23. Among the sample farmers with different wealth status and ethnicity, the level of input use for cashew production is varied significantly. The number of herbicide, fertilizer, and pesticides application, use of organic fertilizer and irrigation for cashew practiced by farmers are presented in Table 24.
- 27 -

Table 23. Input use per hectare of cashew.
By wealth status By ethnicity Wealthy Intermediate Poor Kinh Other ethnic
Total Items
% of (n = 143)
% of (n = 119)
% of (n = 29)
% of (n = 219)
% of (n = 72)
% of (n = 291)
Chemical fertilizer (kg/ha) 579 457 216 508 450 493 - Nitrogen (kg/ha) 43 63 31 51 48 50 - NPK (kg/ha) 437 331 117 375 322 362 - Potassium (kg/ha) 31 22 27 28 23 27 - Phosphorus (kg/ha) 47 23 41 35 41 36 - Ammonium Sulphate (kg/ha) 6 3 0 3 10 4 - Other (kg/ha) 15 15 0 16 6 13 Organic fertilizer (kg/ha) 191 205 132 209 137 191 Herbicides (liter/ha) 4.6 4.4 5.2 4.4 5.2 4.6 Pesticides (liter/ha) 3.4 2.8 1.9 3.3 2.1 3.0 Total labor (mandays/ha) 190 148 157 167 176 170
Family labor (mandays/ha) 102 113 134 109 111 110 Hired labor (mandays/ha) 89 34 22 58 64 60
Wage rate (VND/manday) 30,000 30,000 30,000 30,000 30,000 30,000 Source: Baseline survey data
On the average, the amount of chemical fertilizer used by the sample farmers is about 493 kg/ha (Table 23). NPK fertilizer is the main type of fertilizer used for cashew. The amount of chemical fertilizer applied for cashew varied widely among the sample households. Due to the limited cash for buying fertilizer, on the average a poor household uses about 216 kg/ha of fertilizer, just less than a half of the amount of fertilizer (579 kg/ha) applied by a wealthy farmer. The number of household used irrigation for cashew is very small, mainly for young trees. In the dry season, some farmers have irrigated their cashew plantation after applying fertilizer.
Table 24. Number of fertilizer and pesticides application for cashew.
By wealth status By ethnicity Items Wealthy Intermediate Poor Kinh Other ethnic
Total
Number of households planted 143 119 29 219 72 291
Number of fertilizer application 1.6 1.3 1.0 1.5 1.1 1.4
Number of herbicides application 1.3 1.4 1.3 1.4 1.2 1.3
Number of pesticides application 1.7 1.5 1.2 1.7 1.2 1.6
Use of organic fertilizer (% of HH) 15% 16% 17% 16% 13% 15%
Source: Baseline survey data
- 28 -

Pest infestation is one of the major problems in cashew production in the study area. To protect their cashew crop, many farmers mentioned that more pesticides have been used in the recent years. Cashew worm (stem borer) and termites were report to be serious pests in the study area. Regarding number of pesticides application, majority of farmers applied pesticides from 1 to 2 times (Table 25). About 25% of the farmers have applied pesticides for their cashew more than 3 times.
Table 25. Percentage of respondents per category of pesticide application on cashew.
By wealth status By ethnicity Wealthy Intermediate Poor Kinh Other ethnic
Total Number of pesticides application % of
(n = 143) % of
(n = 119) % of
(n = 29) % of
(n = 219) % of
(n = 72) % of
(n = 291)
1 42% 44% 41% 41% 51% 42% 2 30% 39% 24% 33% 33% 33% 3 20% 9% 29% 18% 12% 17% 4 7% 3% 6% 6% 4% 6%
>4 1% 4% 0% 3% 0% 2% Source: Baseline survey data
Among farmers, there is also a relatively large variation in the amount of pesticides used for cashew. While majority of farmers have applied an amount of pesticides of less than 4 kg/hectare, there is a relatively large number of farmers (10%) who have applied more than 6 kg of pesticides per hectare per year. Among poor farmers, about 23% have reported to applied more than 4kg/ha of pesticides. Preventive method of pesticides application is the common method applied by majority of the farmers to prevent pest attached even when there is no sign of infestation of insect pests.
Table 26. Quantity of pesticides use among cashew farmers.
By wealth status By ethnicity Wealthy Intermediate Poor Kinh Other ethnic
Total Quantity of pesticides (kg/ha) % of
(n = 143) % of
(n = 119) % of
(n = 29) % of
(n = 219) % of
(n = 72) % of
(n = 291)
<1 12% 18% 17% 14% 19% 15% 1-2 24% 31% 28% 26% 29% 27% 2-3 24% 18% 33% 22% 21% 22% 3-4 18% 14% 0% 17% 8% 15% 4-5 9% 4% 11% 7% 10% 7% 5-6 3% 5% 6% 4% 4% 4% >6 11% 10% 6% 10% 8% 10%
Source: Baseline survey data
As mention in the section above, no farmers have reported to applied IPM on crop production. There seem to be significant reduction of pesticides use if farmers applied IPM for pest management in cashew production. As Nghia Trung is located in the upper watershed of the
- 29 -

Dong Nai and Be River, the reduction is expected to have significant effect on the environment in the watershed.
Its was reported that on the average, the number of labor used for cashew production activities including weeding, pruning of branches, application of fertilizers and pesticides, field cleaning, and harvesting is about 170 mandays/hectare/year. On the average, about 65% of the total labor used for cashew production is family labor and 45% is hired labor. Among farmers with different wealth status, more hired labor has been used by wealth households (Table 23). The average labor used for cashew cultivation is about the same for Kinh and ethnic minority farmers. Harvesting is the most time-consuming activity in cashew production. It was reported that during harvesting season, a large number of migrating workers from the provinces in the Mekong Delta have been hired by local households for harvesting cashew.
3. Yield and yield distribution
The average yield of cashew is 1,507kg per hectare. There is a high yield variation among sample households, ranging from 100 kg/ha to 4,500 kg/ha. While wealthy household could achieve an average yield of 1,164 kg/ha, poor household has a much lower yield of 935 kg/ha on the average due to the lower investment in their cashew production. Maximum yield achieve by poor farmers is 2,000 kg/ha, just about a half of the maximum yield achieved in the village. Yield variation among sample farmers indicates that there is potential for narrowing the yield gap between the farmers with best production practices and other with those with yield performance. Measures to support farmers to use their input more efficiently and better manage their cashew plantation will significantly improve the overall efficiency in cashew production in the village.
Table 27. Yield and yield distribution among cashew farmers.
By wealth status By ethnicity Wealthy Intermediate Poor Kinh Other ethnic
Total Items
% of (n = 143)
% of (n = 119)
% of (n = 29)
% of (n = 219)
% of (n = 72)
% of (n = 291)
Average yield (kg/ha) 1,664 1,459 935 1,550 1,377 1,507 Highest yield (kg/ha) 4,500 4,500 2,000 4,500 4,000 4,500 Lowest yield (kg/ha) 250 100 200 200 100 100
Standardeviation 828.9 930.8 423.8 1026.3 809.2 867.1 Yield distribution (kg/ha)
0-1000 21% 43% 57% 29% 48% 34% 1001-2000 61% 43% 43% 55% 41% 52% 2001-3000 13% 7% 0% 12% 0% 9% 3001-4000 4% 4% 0% 2% 7% 4% > 4000 1% 3% 0% 1% 3% 2%
Source: Baseline survey data
- 30 -

4. Cost and return for cashew
Crop budgeting was computed for one hectare of cashew planted by sample farmers with different wealth status and ethnicity. The average cost and crop budget per one hectare of cashew is presented in Table 28 and Table 29. Cost for cashew production is about 4,851 thousand VND/ha on the average. Data on the average cost per one hectare among farmers with different wealth status shows that a wealthy farmer could be able to invest about 3 times more than poor farmers thus achieving a higher yield. Among cost items, fertilizer is the largest expenses followed by hired labor.
Table 28. Production cost per hectare of cashew (‘000VND/ha).
By wealth status By ethnicity Wealthy Intermediate Poor Kinh Other ethnic
Total Items
% of (n = 143)
% of (n = 119)
% of (n = 29)
% of (n = 219)
% of (n = 72)
% of (n = 291)
Fertilizer 2,326 2,211 939 2,271 1,743 2,141 Herbicide 243 267 273 241 302 256 Pesticide 174 146 123 166 130 157 Irrigation 193 227 - 140 330 187 Hired labor 2,921 1,137 733 1,923 2,126 1,973 Transportation, other costs 151 124 112 138 131 136 Total cost 6,008 4,111 2,179 4,880 4,762 4,851
Source: Baseline survey data
With the average price of 8,500 VND/kg of cashew nut, the average income per hectare of cashew was 7.96 million VND per year. For many farmers, the income per one hectare of cashew is not very high however the crop is considered by farmers as a relatively safe crop because the price of cashew nut do not fluctuated much as compared with other crop such as coffee, black pepper, and rubber.
Table 29. Crop budget for one hectare of mature cashew (‘000VND/ha).
By wealth status By ethnicity Wealthy Intermediate Poor Kinh Other ethnic
Total Items
% of (n = 143)
% of (n = 119)
% of (n = 29)
% of (n = 219)
% of (n = 72)
% of (n = 291)
Yield (kg/ha) 1664 1459 935 1550 1377 1,507 Price (‘000VND/kg) 8.5 8.5 8.5 8.5 8.5 8.5 Total revenue 14,146 12,397 7,945 13,177 11,704 12,813 Total costs 6,008 4,111 2,179 4,880 4,762 4,851 Income ('000 VND/ha) 8,137 8,286 5,766 8,297 6,942 7,962 Income per family labor (‘000VND/personday) 80.1 73.0 42.9 76.0 62.3 72.6
Source: Baseline survey data
- 31 -

Data on the average income per one hectare of cashew shows that there is no large difference in average income per hectare among farmers with different wealth status. However a closer look at the range of income among cashew farmers (Table 30) shows that there is a large variation in income among the sample farmers, ranging from less than 5 million VND/ha to more than 30 million VND/ha. This data shows a significant difference in the income level of best farmers and those of the average farmers.
Table 30. Percentage of respondents per category of income from one hectare of cashew.
By wealth status By ethnicity Wealthy Intermediate Poor Kinh Other ethnic
Total Income level (Mill VND/ha) % of
(n = 143) % of
(n = 119) % of
(n = 29) % of
(n = 219) % of
(n = 72) % of
(n = 291)
<5 15% 36% 45% 21% 43% 27% 5-10 29% 31% 38% 32% 30% 31% 10-15 24% 19% 17% 22% 20% 21% 15-20 9% 8% 0% 9% 3% 8% 20-25 1% 3% 0% 1% 3% 1% 25-30 1% 3% 0% 2% 1% 2% 30-35 5% 1% 0% 3% 1% 3%
Source: Baseline survey data
- 32 -

VII. Gender
To have a better understanding on the role of men and women in agriculture production in the village, the base line survey has gathered data on gender division of labor in agricultural activities among farm households. As women and men might grow separate crops or they may work on the same crop on the same field but perform different tasks, data have been collected for different crops grown in the village and major tasks associated with the cultivation of these crops. Data on the participation of men and women of the sample households in crop production activities is presented in Table 31.
Table 31. Participation of men and women by crops and farming activities (%).
Activities cashew coffee rubber Black pepper
vegetables Rice Maize Cassava
Number of HH answered 287 42 104 62 15 6 5 19Land preparation
Mainly men 40% 52% 39% 48% 33% 50% 70% 32%Mainly Women 8% 5% 6% 6% 53% 17% 20% 16%Both 53% 43% 55% 45% 13% 33% 10% 53%
Planting Mainly men 39% 58% 43% 49% 0% 57% 23% 50%Mainly Women 9% 7% 5% 5% 93% 29% 17% 22%Both 52% 35% 52% 46% 7% 14% 60% 28%
Weeding/Crop care Mainly men 34% 50% 31% 40% 0% 33% 15% 33%Mainly Women 12% 10% 11% 6% 93% 50% 25% 17%Both 54% 40% 58% 54% 7% 17% 60% 50%
Fertilizer application Mainly men 41% 55% 40% 48% 0% 43% 50% 47%Mainly Women 9% 7% 6% 5% 93% 29% 20% 13%Both 50% 38% 54% 48% 7% 29% 30% 40%
Pest control Mainly men 70% 72% 71% 65% 50% 67% 75% 65%Mainly Women 7% 5% 5% 6% 43% 17% 20% 12%Both 23% 23% 24% 29% 7% 17% 5% 24%
Harvesting Mainly men 25% 39% 21% 24% 0% 33% 30% 28%Mainly Women 9% 7% 5% 5% 80% 17% 20% 17%Both 66% 54% 74% 71% 20% 50% 50% 56%
Source: Baseline survey data
- 33 -

It is evident that both women and men play important roles in agricultural production. A large number of households reported that both men and women involved in most of the activities relating to the cultivation of major crops in the village such as cashew, coffee, and rubber. The division of labor between men and women varies by types of crops and farming activities. Relatively more men’s labor is spend for coffee, while more women’s labor is spend for vegetables. Among farming activities, pest control is mainly done by men. Regarding hired labor, there is a perception that female work is lighter and, thus, they receive less daily wages for their work, usually 12-14% lower than males.
Data on the level of participation of men and women among sample households by activities and households decisions is summarized in Table 32. The survey data shows that women spends relatively more time for raising farm animal and working in home garden than men. In most of the sample households (65%), both men and women are involved in the drying, cleaning, and grading of farm produce. While purchasing farm inputs is mainly done by men (58%), about 55% of the sample household mentioned that selling farm produce is usually the decision of both husband and wife. The survey data reveals that for many households, the men have stronger role than women in making major farming decisions and in credit attainment as well as in participating in village meeting and extension activities. The number of women participating in village meetings and extension and training activities is quite small.
Table 32. The role of men and women by activities and major decisions.
Activities/Decision Mainly Men Mainly Women Both
Drying, cleaning, grading of products 15% 20% 65% Purchase farm inputs 58% 7% 35% Sell farm produce 27% 19% 55% Raising farm animals 11% 45% 44% Working in home garden 16% 47% 36% Making major farming decisions 64% 7% 29% Credit attainment 66% 11% 23% Participation in village meetings 78% 8% 14% Participation in training, extension 85% 9% 6% Decision on household spending 13% 46% 41% Contribution to household’s income 25% 10% 64%
Source: Baseline survey data
In term of income generation, most households (64%) reported that both men and women have equal role in income generation. About 25% of the sample households reported that household income is mainly made by the men and only 10% reported that income is mainly made by women. Regarding the decision on household spending, about 41% of the sample households reported that both husband and wife have equal role. However a large number of sample
- 34 -

households (46%) reported that this decision is mainly made by the wife. The survey data show that women tend to have a stronger role than men in making decision on household spending. Women spend numbers of hours not only in agricultural tasks, but also in cooking, and caring for children, as well as other domestic tasks for the household. In term of housework, it was reported during the farmer group discussion that women spent more time than men in doing all domestic works. The farmer group discussion in the village also revealed that women and men spend approximately the same amount of time on income-generating labor. However, women spend much more time than men on unpaid household works.
- 35 -

VIII. Credit and extension
1. Credit
Access to credit is critical for many farmers to increase agricultural production and their family’s income as well as for other needs of their families. Data collected from the household survey revealed that about 65% of the farmers have borrowed credit loan. The most important credit source as reported by farmers is the Vietnam Bank of Agriculture (VBA) that provide them short and medium term credit. Many poor farmers reported that they have access to credit for the poor, a subsidized interest rate arm of the Vietnam Bank for the Poor (VBP) to offer subsidized credit to poor households. Other sources of credit reported by farmers include private lenders, relatives, friends, other farmers, the women’s associations, peasant associations or farmers’ credit groups. However the number of loan and amount of credit from these informal credit sources is small.
Table 33. Credit loan and utilization of the sample households.
By wealth status By ethnicity Wealthy Intermediate Poor Kinh Other ethnic
Total Items
% of (n = 148)
% of (n = 123)
% of (n = 35)
% of (n = 231)
% of (n = 75)
% of (n = 306)
Number of respondents obtaining credits 83 92 25 144 56 200
Percentage of total respondents (%) 56% 75% 71% 62% 75% 65%
Average credit loan (mill VND/household) 36.1 19.2 11.8 24.9 25.4 25
Purpose of loan (% of total credit loan)
Farming 74% 76% 63% 71% 81% 73% Off-farm (business, micro-enterprise, etc) 11% 5% 3% 10% 5% 9%
Health 3% 3% 11% 3% 3% 3% Housing 2% 2% 4% 3% 0% 2% Festivals 0% 0% 0% 0% 0% 0% Education 1% 2% 1% 1% 1% 1% Consumption 3% 10% 9% 6% 4% 6% Others 6% 4% 7% 5% 6% 5%
Source: Baseline survey data
- 36 -

Among households who have borrowed credit loan, the average amount of loan is about 25 mill. VND/household/year. There is no significant difference in the average amount of loan borrowed between Kinh farmers and farmers from other ethnic minority group. However there is significant difference in the average amount of credit loan per household across farmers with different wealth status. The credit loan obtained by wealthy farmers is about 3 times more that that of poor farmers.
During the baseline survey, many farmers reported that the amount of credit loan they have borrowed from the bank and other formal credit institution could only meet a part of their credit demand. Many farmers reported that they wanted to borrow a large credit amount but have difficulties in meeting the collateral requirements demanded by the VBA for getting loans. It was reported that the formal land title (land use certificate) have often been used by the bank as collateral when farmers apply credit loan from the bank. As reported in previous section, a large land area of the local farmers do not have a formal land title therefore limiting them to have access to formal credit. Lack of credit for investment in agricultural production is one major constraint in agricultural production, particularly for poor farmers.
The baseline survey has also recorded information on the purpose of the credit loan of the sample households. Data on purpose of credit loan is summarized in Table 33. The survey data shows that most of the credit loan (73%) is used for farming (i.e. investment in agriculture production). On the average, the use of credit loan for investing in off-farm business and micro-enterprise is relatively small (only 9%). Credit used for this purpose is much higher among wealthy households (11%) than poor household (3%) and is higher among Kinh farmers and than farmers from other ethnic minority groups. The amount of credit loan used by the sample households for other purposes such as for health, housing, festivals, education, consumption, and others is small. Among poor households, the proportion of loan used for investing in crop farming is only 63%, much lower than that of a wealthy household, while there is a high proportion of credit loan used for health care.
2. Extension
The extension system in Binh Phuoc Province has been organized from the provincial level (extension center), district level (extension sub-center) up to village level (volunteer extension agent). The provincial extension center have a total number of 30 staff including specialists in crop production and pest management, animal husbandry, veterinary medicine, agricultural economics, forestry, and aquaculture. Funding for extension activities comes from both central government and provincial budget. In each of the 8 districts of the province, there is an extension sub-center with three extension agents. Typically, each sub-center has specialists in crop/plant production, animal husbandry, and forestry or aquaculture. In each village, there is one extension volunteer who does not receive salary but an honorarium of about 300,000 VND/month. Bu Dang District, with 115,616 people and 12 communes or villages, has one sub-centre with four extension agents. The sub-center is located in Duc Phong town, the capital of the district, about
- 37 -

35 kilometers from Nghia Trung village. There is only one extension volunteer in Nghia Trung village. Farmers can go to sub-centers and the provincial center for agricultural assistance and loans.
Approaches applied in extension in Binh Phuoc include field demonstrations, training courses, seminars, meetings, group discussions and production and dissemination of information through printed materials such as brochures and leaflets, radio and television. Shortage of budget is often a problem that limits the service’s extension areas and the number of activities for farmers.
Table 34. Participation in extension and training among sample households.
By wealth status By ethnicity Wealthy Intermediate Poor Kinh Other ethnic
Total Items
% of (n = 148)
% of (n = 123)
% of (n = 35)
% of (n = 231)
% of (n = 75)
% of (n = 306)
Number of households attending training 71 46 9 103 23 126
% 48% 37% 26% 45% 31% 41% Source: Baseline survey data
The survey data on number of households having extension and training over the past three year across wealth status and ethnicity is summarized in Table 34. On average, about 41% of the sample households reported that over the last 3 years, they had participated in a training course on agriculture provided either by the extension service or other agencies such as fertilizer and pesticides companies, cacao program. While there is a large number of wealthy farmers (46%) reported to attend at least one training over the last 3 years, a much smaller number of poor farmers having access to training (26%) was recorded.
Table 35. Perception of the sample households on training and extension activities.
Items Number of households
% (on N=158)
Number of HH answered 158 100% Gender equity
Equal for men and women 54 34% More for men 104 66% More for women 0 0%
Wealth equity Equal for poor and better-off households 140 89% More for better-off households 6 5% More for poor households 10 6%
Source: Baseline survey data
Farmers’ perception on the performance of extension activities regarding gender and wealth equity issues were also explored during the survey. The data is summarized in Table 35. In general, majority (89%) of the farmers have the perception that training and extension activities are equal for both poor and better-off households and 66% think that they are equal for men and
- 38 -

women. This perception is higher than the actual number of poor households and women participating in training organized in the village.
3. Source of information Respondents were asked during the survey about their sources of information on agricultural production including information on general farming practices, soil fertility and erosion control, fertilizer application, water conservation techniques, new crop cultivation techniques, new seed, pest control, animal husbandry, and market and market prices. Their selection is shown in Table 36. Results of the survey show that besides their own experiences, farmers in the study area often rely on interpersonal network of co-farmers (neighbor and other farmers) and radio and television for farming information. A relatively high number of farmers in the village cited radio and television as an important source for major farming information they need. Extension system seems to be important source of information for local farmers on fertilizer application, new crop cultivation techniques, new seed, and animal husbandry. Very few farmers reported to approach local farmers’ organization such as Women Association, Farmers Association or extension club for information or advice. Regarding market prices, many farmers reported that co-farmers, radio and television, input dealers and newspaper are important information sources for them.
Table 36. Major sources of information for local farmers.
Sources of information Types of farming
information Own
experience Other
household members
Neighbors/other farmers
Government extension workers
Extension club
Input dealers Radio/ television
Farmers’ organization
Newspaper/other print
media
General farming practices 32% 3% 19% 9% 5% 1% 21% 2% 6%
Erosion control 38% 2% 17% 9% 6% 0% 21% 1% 5%
Soil fertility management 38% 1% 19% 9% 6% 0% 20% 1% 5%
Fertilizer application 33% 2% 17% 10% 6% 6% 19% 1% 5%
Water conservation 46% 1% 19% 7% 5% 0% 17% 1% 4%
Cultivation of new crops 29% 1% 21% 13% 7% 1% 21% 2% 5%
New seed 27% 2% 21% 14% 7% 2% 21% 2% 5%
Pest control 32% 2% 19% 9% 6% 7% 19% 1% 4%
Animal husbandry 39% 1% 18% 10% 6% 1% 20% 1% 5%
Market prices 17% 1% 16% 3% 1% 14% 34% 0% 13% Source: Baseline survey data
The baseline survey has also explored farmers’ evaluation of the amount of information they received for different types of farming techniques. A summary of the survey data is presented in the Table 37. The survey data shows that there is a relatively large number of farmers have
- 39 -

evaluated that the information they received are reasonable. Across different types of farming information, this number is ranging from 50% to 62% of the sample households. Only less than 10% of the farmers reported that the information they received from different sources are adequate for their farming while for most farming techniques, around 30% to 40% of the farmers reported that the information they received is little or very little. Lack of information on farming techniques and market prices is still a problem for a large number of farmers in the study area.
Table 37. Farmers’ evaluation on information received.
Amount of information received Types of information Very little Little Reasonable Adequate
General farming practices 9% 27% 56% 8% Erosion control 17% 25% 51% 7% Soil fertility management 16% 24% 53% 7% Fertilizer application 9% 19% 62% 9% Water conservation techniques 20% 19% 54% 8% New crop cultivation techniques 15% 27% 50% 8% New seed 17% 25% 51% 7% Pest control 16% 22% 53% 9% Animal husbandry 16% 19% 60% 6% Market and market prices 9% 22% 59% 10%
Source: Baseline survey data
- 40 -

IX. Participation in local organizations
During the survey, respondents were asked to specify the participation of their household’s members by gender in the following organizations: Farmer Association, Farmer interest groups, Extension Club, Veteran Association, Women Association, Youth Association, Credit/micro-credit group, Forest protection group, Cooperative, Red Cross and others. The participation of the sample households in local organization is presented in Table 38. Overall, 61% of the sample households have members that participate in at least one of the local institutions or groups. A relatively high number of households reported to participate in the Farmers’ Association and Women Association. However there are only a low percentage of households participating in other local organization or groups.
Table 38. Participation of sample households in local organizations
By wealth status By ethnicity Wealthy Intermediate Poor Kinh Other ethnic
Total Local organization
N % of (n = 148) N
% of (n = 123) N
% of (n = 35) N
% of (n = 231) N
% of (n = 75) N
% of (n = 306)
Farmer Association
66 45% 49 40% 14 40% 107 46% 22 29% 129 42%
Farmer interest groups
3 2% 0 0% 0 0% 0 0% 3 4% 3 1%
Extension club 11 7% 7 6% 0 0% 13 6% 5 7% 18 6%
Veteran Association
15 10% 6 5% 1 3% 21 9% 1 1% 22 7%
Women Association
60 41% 45 37% 8 23% 99 43% 14 19% 113 37%
Youth Association 18 12% 13 11% 5 14% 29 13% 7 9% 36 12%
Credit/micro-credit group
4 3% 3 2% 0 0% 5 2% 2 3% 7 2%
Forest protection group
3 2% 4 3% 1 3% 4 2% 4 5% 8 3%
Cooperative 5 3% 0 0% 2 6% 7 3% 0 0% 7 2%
Red Cross, others 6 4% 9 7% 1 3% 11 5% 5 7% 16 5%
Participating at least one organization
99 67% 68 55% 19 54% 151 65% 36 48% 187 61%
Source: Baseline survey data
- 41 -

The number of men and women farmers participating in local organizations or groups was also recorded during the survey and is summarized in Table 39. The data reveals that within each group, the percentage of males participating always exceeded that of females, except in Women Association. There is only small percentage of women members of the sample households participating other local organizations or groups. It was reported that men have more time to participate in local social activities while women do not have much time to participate due to their busy schedule for households’ works.
Table 39. Participation of female members of the sample households in local organization.
Local organizations Number of households
Women Participation (%)
Men Participation (%)
Farmer Association 129 23% 77% Farmer interest groups 3 0% 100% Extension club 18 6% 94% Veteran Association 22 5% 95% Women Association 113 100% 0% Youth Association 36 22% 78% Credit/micro-credit group 7 29% 71% Forest protection group 8 25% 75% Cooperative 7 14% 86% Red Cross, others 16 0% 100%
Source: Baseline survey data
- 42 -

X. Constraints and changes in farming practices
1. Major constraints and priority
During the survey farmers were asked to provide their valuation on the constraints to their farming activities. Issues considered by farmers include drought, soil erosion, loss of soil fertility, weed, insect pests and diseases, lack of cash for investment, lack of inputs, lack of technical information/knowledge, and market information. Data on farmers’ perception on priority level for their farming constraints is presented in Table 40. Regarding drought problem, about 47% of the sample farmers have the perception that it has high to very high priority to be addressed. Soil erosion, loss of soil fertility, and insect pests and diseases are also important problems to be addressed in the study area with about 45%, 43%, and 57% of the sample farmers considered them with high to very high priority, respectively.
The survey data shows that weed and inputs availability seem not to be a high priority issue for local farmers while a large number of farmers (50%) have evaluated the problem of lack of cash for investment with high to very high priority. This data reflects the fact reported earlier in the section on farmers’ access to credit sources that lack of credit for investment in agricultural production was one of the major constraints in agricultural production in the study area, particularly among the poor farmers. A relatively high number of sample farmers, about 33% and 29% of the farmers respectively, have considered the problem of lack of technical information and lack of market information with high or very high priority.
Table 40. Major constraints to local farming and priority level (% of n=306).
Priority level Problems Low Medium High Very high
Drought 23% 30% 37% 10% Soil erosion 24% 31% 36% 9% Loss of soil fertility 25% 32% 37% 6% Weed 22% 56% 19% 3% Insect pests and diseases 7% 36% 45% 12% Lack of cash for investment 21% 29% 36% 14% Lack of inputs 34% 47% 17% 2% Lack of technical information/ knowledge 31% 36% 23% 10% Lack of market information 30% 42% 20% 9%
Source: Baseline survey data
- 43 -

2. Labor shortage
During the survey, a large number of the sample households (56%) reported that they have faced the problem of labor shortage for their farm operations (Table 33). Labor shortage was recorded to be quite high among wealthy households (76%). Even some poor households (11%) have also to face with the problem of labor shortage.
Table 41. Labor shortage among sample households.
By wealth status By ethnicity Wealthy Intermediate Poor Kinh Other ethnic
Total Households with labor shortage
% of (n = 148)
% of (n = 123)
% of (n = 35)
% of (n = 231)
% of (n = 75)
% of (n = 306)
Number of households 112 55 4 130 41 171 % 76% 45% 11% 56% 55% 56%
Source: Baseline survey data
Farmers have also been asked to provide the month with labor shortage. The survey data on monthly distribution of labor shortage among sample households is summarized in Table 42. The pattern on months with labor shortage among the sample households shows that labor shortage mainly concentrate during the cashew harvesting period from February to April. However labor shortage was not considered by farmers as high priority problem to be addressed. Most farmers (90%) reported that they were able to hired labor when their family labor is not enough to carry out their farming activities. About 10% reported they have exchanged their labor with their relatives, friends and other neighbour farmers.
Table 42. Monthly distribution of labor shortage among sample households.
Households with labor shortage Month Number % (of N=306)
January 44 8% February 124 24% March 112 21% April 85 16% May 14 3% June 6 1% July 4 1% August 4 1% September 22 4% October 43 8% November 41 8% December 23 4%
Source: Baseline survey data
- 44 -

3. Changes in farming practices
To have a better understanding on the changes in farming practices in the study area, farmers were asked to report any changes they adopted in their farming practices over the last 3 years. It was recorded that during the last 3 years, major changes in farming practices of the sample farmers’ include changes in cropping pattern (22% of the sample farmers), fertilizer application (18%), pest management practices (22%), and weed control (17%). Only few farmers reported that they have changes in land preparation, crop establishment, irrigation/ drainage, soil conservation, soil fertility management, and harvesting.
Table 43. Changes in farming practices among sample households over the last three years.
Households with changes in farming practices Types of changes in farming practices Number % (of N=306)
Cropping pattern 66 22% Land preparation 14 5% Crop establishment 8 3% Fertilizer application 55 18% Pest management 68 22% Weed control 53 17% Irrigation/ drainage 6 2% Soil conservation 29 9% Soil fertility management 11 4% Harvesting practices 5 2%
Source: Baseline survey data
Among farmers who have adopted a change in cropping pattern, about 56% reported that they have planted a new crop such as rubber, black pepper, cacao, and coffee in some plots at their farm. About 27% reported that they have changed from one to other crop, for example from coffee to cashew or rubber due to the low price, low profitability of coffee or due to lack of water for irrigation. Only few farmers reported that they have adopted agro-forestry practices by integrating an annual food crops or vegetable with perennial crop. Regarding cacao planting, it should be noted that cacao is a new crop recently introduced to Nghia Trung and some other villages in Bu Dang district. The potential of cacao production in the district is still unknown and cacao cultivation is very much in the experimental stage.
The changes in fertilizer application practices reported by farmers mainly refer to the changes in type and amount of fertilizer used. Some farmers have changed from spreading fertilizer on the soil surface to digging holes near cashew trees to apply fertilizer. Changes in pest management of the farmers include mainly the changes in the types and amount of pesticides use and the number of pesticide application. No farmers have reported to apply integrated pest management (IPM) practices for their crops. Regarding farmers’ changes in weed control, the data reported by the sample farmers refer mainly to the change from hand weeding to use of herbicides or changes in types or amount of herbicides use. The changes in soil fertility management reported by farmers
- 45 -

refer mainly to the use of more chemical fertilizer for improving soil fertility. Only few farmers have reported to use organic fertilizer, grass, and litters to maintain or improve soil fertility in their farm.
Table 44. Changes in cropping pattern among sample households over the last three years.
Households with changes in cropping pattern Types of changes in cropping pattern
Number % of (N=66) Planting new crops (rubber, black pepper, cacao, coffee) 37 56% Integrate 2 perennial crops 5 8% integrate annual crops with perennial crop. 5 8% Integrate vegetables with perennial crops 1 2% Change to other crop 18 27% Total number of households adopted changes 66 100%
Source: Baseline survey data
The baseline survey has also explored farmers’ practices to control soil erosion on their fields. The data on soil erosion control measures that are currently practiced by the sample farmers are summarized in Table 45. The survey data shows that about 28% of the sample farmers have applied soil control measures on their fields. Different measures to control soil erosion have been practiced by the sample farmers including making small canal and earthen banks to control soil erosion (8%), no weeding during rainy season, only weeding at the end of rainy season (6%), reduced weeding (10%), and planting of hedgerows (3%). It was revealed from the survey that the number of farmers practiced soil erosion control measures is still small. Farmers reported during group discussion that they were not able to control soil erosion effectively. Reasons include that there are not effective soil erosion control measures to farmers to apply. The effectiveness of soil control measure also depends much on farmers’ techniques, and knowledge. The application of soil control measure is also labor consuming for local farmers. Supporting farmers with more effective soil control measure and better knowledge in soil erosion control will benefit farmers themselves and the watershed services significantly, thus would lead to higher social benefits.
Table 45. Measures to control soil erosion practiced by the sample households.
Measures to control soil erosion Number of households practices
% (of N=306)
Making small canal, earthen bank 25 8% Only weeding at the end of rainy season 19 6% Reduced weeding 31 10% Planting of hedgerow 10 3% Total 85 28%
Source: Baseline survey data
- 46 -

XI. Summary and concluding remarks
1. Nghia Trung is an upland village in the upper catchments of the Dong Nai and Song Be Rivers. The total area of the village is 13,357 hectare with about 70% of medium to high sloping land. The risk of soil erosion in many area is high, particularly on land on slopping hill sides. The village has a total population of 2682 households with 12.376 persons. Agriculture is the main livelihood activity among sample households with about 91% of the households’ heads engaged in agricultural production. The poverty level in the village is around 11%. The number of poor households is quite high (20%) among ethnic minority households. Illiteracy among sample households is about 12% on the average but higher among poor households (29%) and households of ethnic minority groups (32%).
2. The survey data on housing condition revealed that about 53.6% of the households have brick and cemented houses and 39.2% living in wooden house. Among the poor, there is very high percentage of households (68.6%) living under poor housing condition. Large differences in total value of assets among households with different wealth status were recorded in the study area. On the average, the value of assets owned by a wealthy household is about 30 time higher than that of a poor household.
3. The average annual income per household is about 63.645 million VND (3978.4 USD) and average annual income per capital is 975 thousand VND (61 USD). On the average, the income per capital of a wealthy household is about 9 time higher than that of a poor household and 3.4 time higher than that of an intermediate household. Income from agriculture, mainly from crop production, contributes the largest share (86%) of the total household income in the village. Off-farm and non farm activities are important income sources for poor households, contributing to about 15.4% and 19.2% of their total households income, respectively. In term of income from crop production, cashew is the most important crop contributing to more than 61% of the total income from crop production of the sample households. Coffee is the second most important crop, followed by rubber and black pepper. The data on income from different crops reflects the current cropping pattern of the village towards perennial crop production systems with a few perennial cash crops such as cashew, coffee, rubber and black pepper.
4. Among sample households, the average annual expenditure for consumption is about 71% of their annual income. The largest household expenditure is for food (37%), followed by the expenditure for agriculture inputs (21%) and education (10%). Most of food expenditure is for meet, fish, eggs and cereals. The share of expenditure for vegetable and fruit consumption is about 19% of the total households expenditure for food. It was reported that more than 80%
- 47 -

of the vegetables as well as fruits consumed by the household is brought from local market. Among ethnic minority households, a relatively large quantity of vegetables consumed by their family is planted in the farm or collected from forests. This implies that improving vegetable cultivation, either from improving vegetable cultivation in home garden or through integrated vegetable agro-forestry systems would help farmers in the village, particularly the poor farmers to reduce their expenditure for vegetable and fruit significantly.
5. On the average, the farm size in Nghia Trung village is 3.7 hectare per household. Majority of the households (62%) have a farm size from 1-4 ha. A relatively large number of wealthy farmers (29%) have very large farm size of more than 5 hectare while about 40% of the poor household has a farm size of less than 1 hectare. Data on land ownership indicates that 38% of farmers’ land do not have a formal land title. Lack of formal land title (land use certificates) is one critical factor that limits poor farmers from access to the formal credit sources.
6. The survey data shows that there is a low crop diversification among farmers in Nghia Trung village. Most of farmers’ land (96%) is classified as land for perennial crops in which 90% is planted with one perennial crop and only 5% with two perennial cash crops in combination. It was found that only 4% of the farmers’ perennial crop land is cultivated with agro-forestry systems. Most farmers’ home garden (56%) is planted with only one perennial crop and only about 13% with an agro-forestry system (i.e. perennial cash crop with annual food crop or vegetables). Among sample households, only 21% have some vegetables on their farm. The survey revealed that vegetable production in Nghia Trung village is characterized by a small scale production, mainly for home consumption. Regarding constraints to vegetables cultivation, a large number of farmers mentioned that their land is not suitable for vegetables. Labor, land, and water availability were also reported by local farmers to be important constraints to vegetable cultivation.
7. As cashew is the most important tree crop in the village and could potentially be integrated with vegetables, its production practice was analyzed in this study. Among 306 households under survey, 291 households (95%) have reported to plan cashew in their farm. The level of input use for cashew production is varied significantly among farmers with different wealth status and ethnicity. On the average, the amount of chemical fertilizer used by the sample farmers is about 493 kg/ha. It was recorded that on the average, a poor household uses just less than a half of the amount of fertilizer applied by a wealthy farmer. Preventive method of pesticides application is the common method applied farmers to prevent pest attached even when there is no sign of pest infestation. No farmers have reported to applied IPM on cashew. There seem to be significant reduction of pesticides use if farmers applied IPM for pest management in cashew production. As Nghia Trung is located in the upper watershed of the Dong Nai and Be River, the reduction is expected to have significant benefit to the environment in the watershed.
- 48 -
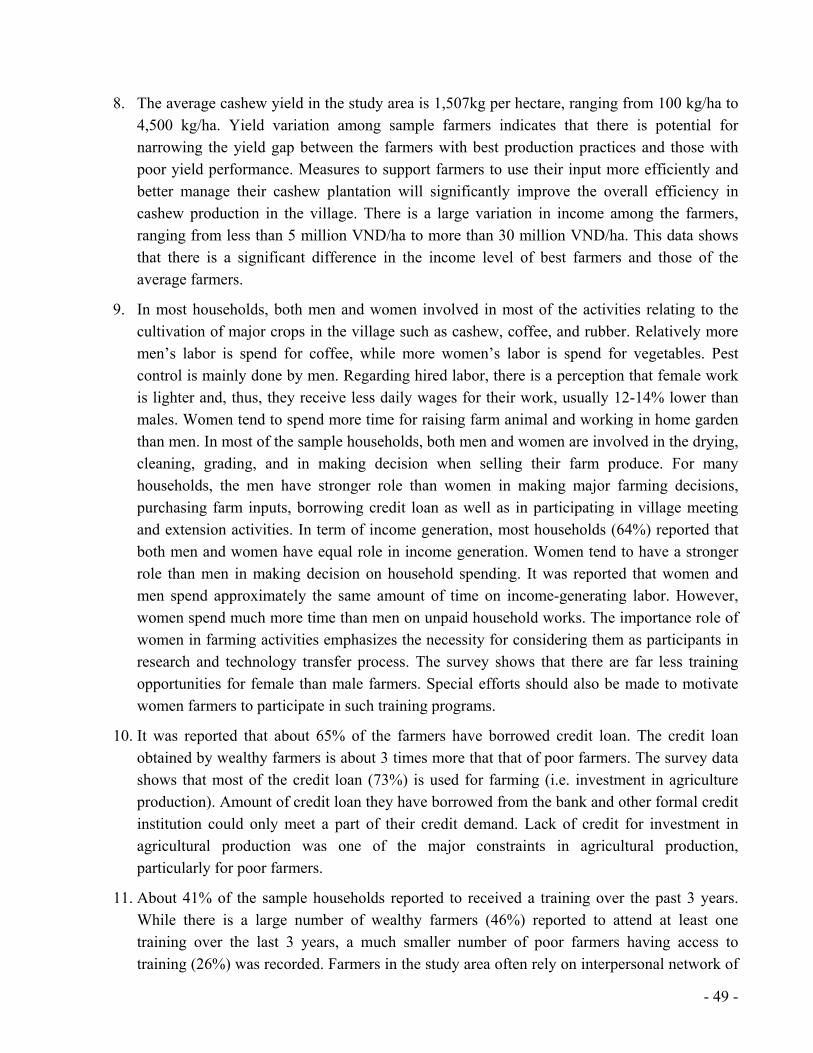
8. The average cashew yield in the study area is 1,507kg per hectare, ranging from 100 kg/ha to 4,500 kg/ha. Yield variation among sample farmers indicates that there is potential for narrowing the yield gap between the farmers with best production practices and those with poor yield performance. Measures to support farmers to use their input more efficiently and better manage their cashew plantation will significantly improve the overall efficiency in cashew production in the village. There is a large variation in income among the farmers, ranging from less than 5 million VND/ha to more than 30 million VND/ha. This data shows that there is a significant difference in the income level of best farmers and those of the average farmers.
9. In most households, both men and women involved in most of the activities relating to the cultivation of major crops in the village such as cashew, coffee, and rubber. Relatively more men’s labor is spend for coffee, while more women’s labor is spend for vegetables. Pest control is mainly done by men. Regarding hired labor, there is a perception that female work is lighter and, thus, they receive less daily wages for their work, usually 12-14% lower than males. Women tend to spend more time for raising farm animal and working in home garden than men. In most of the sample households, both men and women are involved in the drying, cleaning, grading, and in making decision when selling their farm produce. For many households, the men have stronger role than women in making major farming decisions, purchasing farm inputs, borrowing credit loan as well as in participating in village meeting and extension activities. In term of income generation, most households (64%) reported that both men and women have equal role in income generation. Women tend to have a stronger role than men in making decision on household spending. It was reported that women and men spend approximately the same amount of time on income-generating labor. However, women spend much more time than men on unpaid household works. The importance role of women in farming activities emphasizes the necessity for considering them as participants in research and technology transfer process. The survey shows that there are far less training opportunities for female than male farmers. Special efforts should also be made to motivate women farmers to participate in such training programs.
10. It was reported that about 65% of the farmers have borrowed credit loan. The credit loan obtained by wealthy farmers is about 3 times more that that of poor farmers. The survey data shows that most of the credit loan (73%) is used for farming (i.e. investment in agriculture production). Amount of credit loan they have borrowed from the bank and other formal credit institution could only meet a part of their credit demand. Lack of credit for investment in agricultural production was one of the major constraints in agricultural production, particularly for poor farmers.
11. About 41% of the sample households reported to received a training over the past 3 years. While there is a large number of wealthy farmers (46%) reported to attend at least one training over the last 3 years, a much smaller number of poor farmers having access to training (26%) was recorded. Farmers in the study area often rely on interpersonal network of
- 49 -

co-farmers (neighbor and other farmers) and radio and television for farming information. A relatively high number of farmers in the village cited radio and television as an important source for major farming information they need. For most farming techniques, around 30% to 40% of the farmers reported that the information they received is little or very little. Lack of information on farming techniques and market prices is still a problem for a large number of farmers in the study area.
12. Regarding drought problem, about 47% of the sample farmers have the perception that it has high to very high priority to be addressed. Soil erosion, loss of soil fertility, and insect pests and diseases are also important problems to be addressed in the study area with about 45%, 43%, and 57% of the sample farmers considered them with high to very high priority, respectively. A large number of farmers (50%) have evaluated the problem of lack of cash for investment with high to very high priority. Lack of technical information and lack of market information were considered by 33% and 29% of the farmers, respectively as constrains with high or very high priority. Labor shortage was recorded to be quite high among wealthy households (76%), particularly during the cashew harvesting period from February to April. However labor shortage was not considered by farmers as high priority problem to be addressed as most farmers (90%) could use hired labor.
13. Changes in farming practices among farmers during the last 3 years were also recorded in the survey. Major changes in farming practices among sample farmers’ include the changes in cropping pattern (22% of the sample farmers), fertilizer application (18%), pest management practices (22%), and weed control (17%). Changes in farming practices mainly refer to the planting of a new crop or changing to other crop, changes in type and amount of fertilizer and pesticides use, from hand weeding to use of herbicides or changes in types or amount of herbicides use. The changes in soil fertility management reported by farmers refer mainly to the use of more chemical fertilizer for improving soil fertility. No farmers have reported to apply integrated pest management (IPM) practices for their crops.
14. It was reported that about 28% of the sample farmers have applied soil control measures on their fields including making small canal and earthen banks to control soil erosion, no or reduced weeding during rainy season, and planting of hedgerows. The number of farmers practiced soil erosion control measures is still small. Farmers reported during group discussion that they were not able to control soil erosion effectively. Efforts to address this issues is therefore important. Supporting farmers with more effective soil control measure and better knowledge in soil erosion control will benefit farmers themselves and the watershed services significantly, thus would lead to higher social benefits.
- 50 -

References
Statistic office of Bu Dang District, 2005. Statistic Yearbook 2005 of Bu Dang District.
People Committee of Nghia Trung village, 2005. Annual report on socio-economic development situation for the year 2005.
- 51 -