Research report In vivo Hebbian and basal forebrain ...nmw.bio.uci.edu/publications/Cruikshank &...
16
Brain Research 891 (2001) 78–93 www.elsevier.com / locate / bres Research report In vivo Hebbian and basal forebrain stimulation treatment in morphologically identified auditory cortical cells * Scott J. Cruikshank, Norman M. Weinberger Center for the Neurobiology of Learning and Memory and Department of Neurobiology and Behavior, University of California, Irvine, CA 92717, USA Accepted 31 October 2000 Abstract The present study concerns the interactions of local pre / postsynaptic covariance and activity of the cortically-projecting cholinergic basal forebrain, in physiological plasticity of auditory cortex. Specifically, a tone that activated presynaptic inputs to a recorded auditory cortical neuron was repeatedly paired with a combination of two stimuli: (1) local juxtacellular current that excited the recorded cell and (2) basal forebrain stimulation which desynchronized the cortical EEG. In addition, the recorded neurons were filled with biocytin for morphological examination. The hypothesis tested was that the combined treatment would cause increased potentiation of responses to the paired tone, relative to similar conditioning treatments involving either postsynaptic excitation alone or basal forebrain stimulation alone. In contrast, there was no net increase in plasticity and indeed the combined treatment appears to have decreased plasticity below that previously found for either treatment alone. Several alternate interpretations of these results are discussed. 2001 Elsevier Science B.V. All rights reserved. Theme: Neural basis of behaviour Topic: Neural plasticity Keywords: Neocortex; Cortex; Biocytin; Nucleus basalis; EEG; Hebb; Covariance Cells in the adult auditory cortex appear to follow the 1. Introduction predictions of the covariance hypothesis, but the degree to which this occurs can be strongly affected by certain Recent experiments on physiological plasticity of adult conditions [2,4,18,24]. One condition reported to be criti- sensory cortex have found support for a modified form of cal is ‘arousal state.’ For example, in urethane-anesthetized the Hebbian hypothesis, which is sometimes called the guinea-pigs, Hebbian / covariance pairing treatments result ‘covariance hypothesis.’ It posits that the strength of in greatest plasticity when those pairings are conducted in synapses can be affected by relative levels of pre- vs. auditory cortices exhibiting nonsynchronized, low-voltage postsynaptic activity (i.e. pre / postsynaptic covariance). fast-wave EEG activity [24]. Facilitation of Hebbian Specifically it predicts that pairing presynaptic input with plasticity in a way that is reminiscent of the EEG-related increased postsynaptic activity should strengthen paired effects observed in the anesthetized guinea-pig, has also synapses, while pairing presynaptic input with decreased been observed in the auditory cortices of unanesthetized postsynaptic activity should weaken paired synapses primates [2,4]. Together, these results suggest that acti- [1,22,23,31,35,60,62]. vated / aroused cortical or behavioral states facilitate induc- tion of covariance plasticity. However, the variables critical to plasticity that are associated with such arousal *Corresponding author. Tel.: 11-949-824-5512; fax: 11-949-824- have yet to be defined. 8481. Insight might be obtained by examining the role of the E-mail address: [email protected] (N.M. Weinberger). 0006-8993 / 01 / $ – see front matter 2001 Elsevier Science B.V. All rights reserved. PII: S0006-8993(00)03197-8
Transcript of Research report In vivo Hebbian and basal forebrain ...nmw.bio.uci.edu/publications/Cruikshank &...

Brain Research 891 (2001) 78–93www.elsevier.com/ locate /bres
Research report
In vivo Hebbian and basal forebrain stimulation treatment inmorphologically identified auditory cortical cells
*Scott J. Cruikshank, Norman M. WeinbergerCenter for the Neurobiology of Learning and Memory and Department of Neurobiology and Behavior, University of California, Irvine, CA 92717,
USA
Accepted 31 October 2000
Abstract
The present study concerns the interactions of local pre /postsynaptic covariance and activity of the cortically-projecting cholinergicbasal forebrain, in physiological plasticity of auditory cortex. Specifically, a tone that activated presynaptic inputs to a recorded auditorycortical neuron was repeatedly paired with a combination of two stimuli: (1) local juxtacellular current that excited the recorded cell and(2) basal forebrain stimulation which desynchronized the cortical EEG. In addition, the recorded neurons were filled with biocytin formorphological examination. The hypothesis tested was that the combined treatment would cause increased potentiation of responses to thepaired tone, relative to similar conditioning treatments involving either postsynaptic excitation alone or basal forebrain stimulation alone.In contrast, there was no net increase in plasticity and indeed the combined treatment appears to have decreased plasticity below thatpreviously found for either treatment alone. Several alternate interpretations of these results are discussed. 2001 Elsevier Science B.V.All rights reserved.
Theme: Neural basis of behaviour
Topic: Neural plasticity
Keywords: Neocortex; Cortex; Biocytin; Nucleus basalis; EEG; Hebb; Covariance
Cells in the adult auditory cortex appear to follow the1. Introductionpredictions of the covariance hypothesis, but the degree towhich this occurs can be strongly affected by certainRecent experiments on physiological plasticity of adultconditions [2,4,18,24]. One condition reported to be criti-sensory cortex have found support for a modified form ofcal is ‘arousal state.’ For example, in urethane-anesthetizedthe Hebbian hypothesis, which is sometimes called theguinea-pigs, Hebbian /covariance pairing treatments result‘covariance hypothesis.’ It posits that the strength ofin greatest plasticity when those pairings are conducted insynapses can be affected by relative levels of pre- vs.auditory cortices exhibiting nonsynchronized, low-voltagepostsynaptic activity (i.e. pre /postsynaptic covariance).fast-wave EEG activity [24]. Facilitation of HebbianSpecifically it predicts that pairing presynaptic input withplasticity in a way that is reminiscent of the EEG-relatedincreased postsynaptic activity should strengthen pairedeffects observed in the anesthetized guinea-pig, has alsosynapses, while pairing presynaptic input with decreasedbeen observed in the auditory cortices of unanesthetizedpostsynaptic activity should weaken paired synapsesprimates [2,4]. Together, these results suggest that acti-[1,22,23,31,35,60,62].vated /aroused cortical or behavioral states facilitate induc-tion of covariance plasticity. However, the variablescritical to plasticity that are associated with such arousal*Corresponding author. Tel.: 11-949-824-5512; fax: 11-949-824-have yet to be defined.8481.
Insight might be obtained by examining the role of theE-mail address: [email protected] (N.M. Weinberger).
0006-8993/01/$ – see front matter 2001 Elsevier Science B.V. All rights reserved.PI I : S0006-8993( 00 )03197-8
S.J. Cruikshank, N.M. Weinberger / Brain Research 891 (2001) 78 –93 79
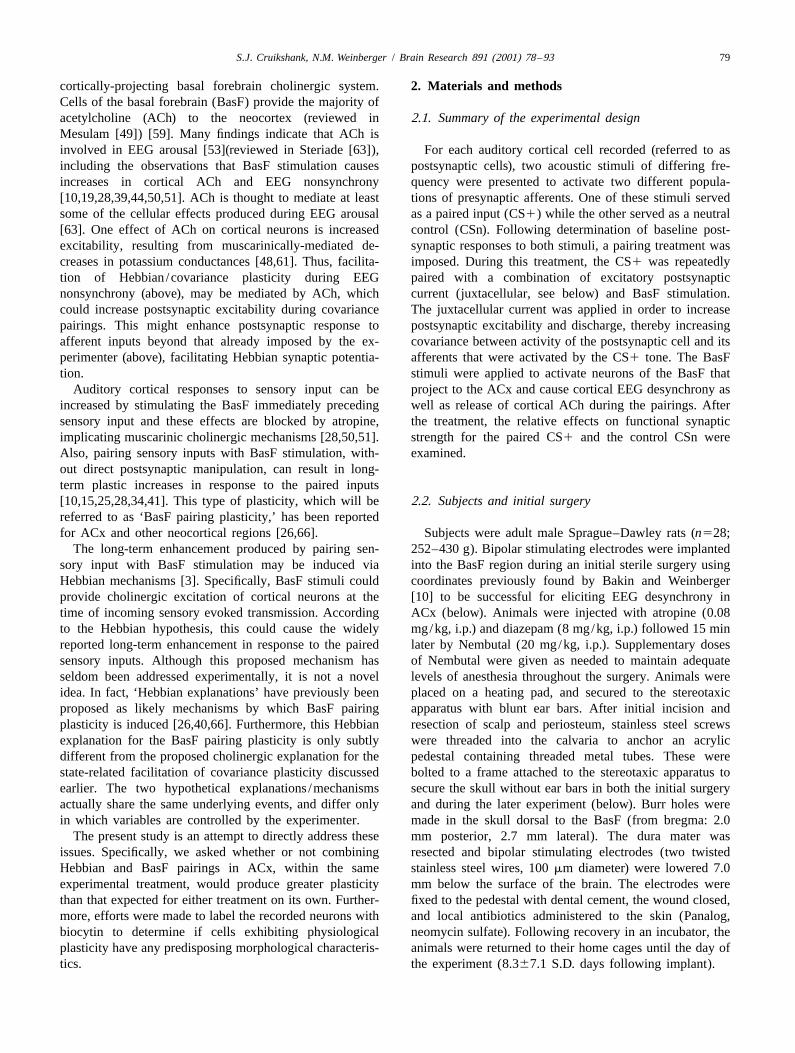
cortically-projecting basal forebrain cholinergic system. 2. Materials and methodsCells of the basal forebrain (BasF) provide the majority ofacetylcholine (ACh) to the neocortex (reviewed in 2.1. Summary of the experimental designMesulam [49]) [59]. Many findings indicate that ACh isinvolved in EEG arousal [53](reviewed in Steriade [63]), For each auditory cortical cell recorded (referred to asincluding the observations that BasF stimulation causes postsynaptic cells), two acoustic stimuli of differing fre-increases in cortical ACh and EEG nonsynchrony quency were presented to activate two different popula-[10,19,28,39,44,50,51]. ACh is thought to mediate at least tions of presynaptic afferents. One of these stimuli servedsome of the cellular effects produced during EEG arousal as a paired input (CS1) while the other served as a neutral[63]. One effect of ACh on cortical neurons is increased control (CSn). Following determination of baseline post-excitability, resulting from muscarinically-mediated de- synaptic responses to both stimuli, a pairing treatment wascreases in potassium conductances [48,61]. Thus, facilita- imposed. During this treatment, the CS1 was repeatedlytion of Hebbian /covariance plasticity during EEG paired with a combination of excitatory postsynapticnonsynchrony (above), may be mediated by ACh, which current (juxtacellular, see below) and BasF stimulation.could increase postsynaptic excitability during covariance The juxtacellular current was applied in order to increasepairings. This might enhance postsynaptic response to postsynaptic excitability and discharge, thereby increasingafferent inputs beyond that already imposed by the ex- covariance between activity of the postsynaptic cell and itsperimenter (above), facilitating Hebbian synaptic potentia- afferents that were activated by the CS1 tone. The BasFtion. stimuli were applied to activate neurons of the BasF that
Auditory cortical responses to sensory input can be project to the ACx and cause cortical EEG desynchrony asincreased by stimulating the BasF immediately preceding well as release of cortical ACh during the pairings. Aftersensory input and these effects are blocked by atropine, the treatment, the relative effects on functional synapticimplicating muscarinic cholinergic mechanisms [28,50,51]. strength for the paired CS1 and the control CSn wereAlso, pairing sensory inputs with BasF stimulation, with- examined.out direct postsynaptic manipulation, can result in long-term plastic increases in response to the paired inputs[10,15,25,28,34,41]. This type of plasticity, which will be 2.2. Subjects and initial surgeryreferred to as ‘BasF pairing plasticity,’ has been reportedfor ACx and other neocortical regions [26,66]. Subjects were adult male Sprague–Dawley rats (n528;
The long-term enhancement produced by pairing sen- 252–430 g). Bipolar stimulating electrodes were implantedsory input with BasF stimulation may be induced via into the BasF region during an initial sterile surgery usingHebbian mechanisms [3]. Specifically, BasF stimuli could coordinates previously found by Bakin and Weinbergerprovide cholinergic excitation of cortical neurons at the [10] to be successful for eliciting EEG desynchrony intime of incoming sensory evoked transmission. According ACx (below). Animals were injected with atropine (0.08to the Hebbian hypothesis, this could cause the widely mg/kg, i.p.) and diazepam (8 mg/kg, i.p.) followed 15 minreported long-term enhancement in response to the paired later by Nembutal (20 mg/kg, i.p.). Supplementary dosessensory inputs. Although this proposed mechanism has of Nembutal were given as needed to maintain adequateseldom been addressed experimentally, it is not a novel levels of anesthesia throughout the surgery. Animals wereidea. In fact, ‘Hebbian explanations’ have previously been placed on a heating pad, and secured to the stereotaxicproposed as likely mechanisms by which BasF pairing apparatus with blunt ear bars. After initial incision andplasticity is induced [26,40,66]. Furthermore, this Hebbian resection of scalp and periosteum, stainless steel screwsexplanation for the BasF pairing plasticity is only subtly were threaded into the calvaria to anchor an acrylicdifferent from the proposed cholinergic explanation for the pedestal containing threaded metal tubes. These werestate-related facilitation of covariance plasticity discussed bolted to a frame attached to the stereotaxic apparatus toearlier. The two hypothetical explanations /mechanisms secure the skull without ear bars in both the initial surgeryactually share the same underlying events, and differ only and during the later experiment (below). Burr holes werein which variables are controlled by the experimenter. made in the skull dorsal to the BasF (from bregma: 2.0
The present study is an attempt to directly address these mm posterior, 2.7 mm lateral). The dura mater wasissues. Specifically, we asked whether or not combining resected and bipolar stimulating electrodes (two twistedHebbian and BasF pairings in ACx, within the same stainless steel wires, 100 mm diameter) were lowered 7.0experimental treatment, would produce greater plasticity mm below the surface of the brain. The electrodes werethan that expected for either treatment on its own. Further- fixed to the pedestal with dental cement, the wound closed,more, efforts were made to label the recorded neurons with and local antibiotics administered to the skin (Panalog,biocytin to determine if cells exhibiting physiological neomycin sulfate). Following recovery in an incubator, theplasticity have any predisposing morphological characteris- animals were returned to their home cages until the day oftics. the experiment (8.367.1 S.D. days following implant).
80 S.J. Cruikshank, N.M. Weinberger / Brain Research 891 (2001) 78 –93
2.3. Preliminary procedures on the experimental day resistance (.20%) upon achieving the configuration.These operational features were taken as an indication that
Rats were anesthetized with Urethane (ethyl carbamate, the tip of the microelectrode was situated very close to the1.45 gm/kg, i.p.) and supplemented as needed to maintain recorded soma, probably directly contacting the membraneareflexia. An opening was made in the skull over temporal [5,22,24,38]. In this configuration, low levels of currentcortex, and ACx was located by position, vascular land- (520 nA, 100 ms, tip positive) applied through themarks, and click-evoked field potentials. Small holes were micropipette could effectively elicit action potentials, ascut in the dura to allow insertion of a juxtacellular previously reported [5,14,16,17,24,32,57,64,68]. A bridgerecording/stimulating micropipette into ACx. Core body circuit allowed uninterrupted recording during currenttemperature was maintained at 378C with a heating pad. pulses.Auditory cortical EEG was monitored continuously fromeither the juxtacellular recording electrode (below) or froma tungsten microwire on the cortical surface (bandpass 2.5. Characterization of responses to tones and1–100 Hz, single-ended recordings, animal grounded via juxtacellular currentskin flap). The maximum lateral distance between thesurface and juxtacellular electrodes was about 3 mm The protocol following cellular isolation is summarized(usually they were within 1 mm of each other). At the in Fig. 1. First the receptive field (RF) of the neuron wasbeginning of the recording session, a test was administered characterized. Tones were delivered to the ear contralateralto determine the threshold current level at which BasF to the recording locus via a calibrated acoustic deliverystimulation could desynchronize the EEG of the ipsilateral system (100 ms pure tones, 0.1–30 kHz, 0–90 dB, rise /ACx (0.1 ms biphasic pulses, 200 Hz, 200 ms train, fall times 5 ms, 1 tone /s), using a small speaker fixed in100–500 mA). Later, during the pairing treatment (below), place at the opening of the external auditory meatus (nearBasF stimuli were delivered at an intensity sufficient to field, [65]). Threshold tuning curve, best frequency (BF),produce continuous desynchrony, up to a maximum of 500 and evoked spike rates for the different tone frequenciesmA (mean564625% above threshold). within the RF were determined. Two tones were chosen
from the RF for subsequent experimental phases. One of2.4. Juxtacellular recording and stimulation these tones was defined as the CS1, and was paired with
juxtacellular and BasF stimuli during the upcoming treat-The juxtacellular microelectrode (glass micro-pipette, tip ment. The other tone was defined as the CS neutral (CSn)
diameter 0.5–1.5 mm) was filled with a solution consisting and served as an unpaired control.of 140 mM K-gluconate, 1.0 mM MgCl , 1.0 mM CaCl , The CS1 and CSn tones were different frequencies (one2 2
10.0 mM HEPES buffer, and 1.6 mM EGTA. DC re- lower than the BF, the other higher than the BF, counter-sistances were 3–8 MOhms (mean55.760.3 S.E.M.). The balanced across cells) and were presented at the samesolution also contained a 2% concentration of biocytin so intensity for a given cell. On average this intensity was 24that the recorded cells could be labeled and subsequently dB above the threshold of the cell: mean threshold (at theidentified (below). BF) was 35(66 S.E.M.) dB and mean intensity used for
At the beginning of an experiment, the juxtacellular the CS tones was 59(63 S.E.M.) dB. The mean frequencyelectrode was advanced perpendicular to the cortical chosen as the CS1 was 0.5(60.1) octaves from the BF,surface by a stepping micro-drive. At a depth of 200–400 and the mean CSn was 0.4(60.2) octaves from the BF.mm, the penetration was temporarily halted and the cortex The average baseline response to the CS1 was slightlywas covered with warmed agar (4% in saline) to prevent weaker, than the response to the CSn (11.661.4 vs.pulsation. In most cases, cisternal puncture and tracheal 13.961.7 spikes / s, respectively) but not significantlycannulation were also used to minimize cortical move- different (t-test, P.0.05). Comparison with the meanment. After allowing the electrode to settle for 10 min, the response to the BF tone (22.463.4 spikes / s, presented atpenetration was resumed, and the search for a single the same intensity as the CS tones) revealed that thecortical neuron commenced (approximately 1 mm/s for baseline responses to both the CS1 and CSn were5–10 s, followed by 5–10 s pauses before advancing moderate (55–64% of those elicited by the BF), allowingfurther). During this search, acoustic stimuli were pre- for possible increases and decreases that might occur as thesented while physiological activity (DC — 6 kHz, am- result of the treatment.plified 3100) and electrode resistance were monitored. After choosing the CS tones, the response to positive
Upon detection of small extracellular action potentials juxtacellular current was characterized by determining(,1 mV), the electrode was carefully advanced further threshold, spike rate and latency. A value that was aboveuntil a juxtacellular recording configuration could be the threshold for eliciting spikes, but was not so high as toachieved. This was operationally defined as a recording de-stabilize the recording, was selected for subsequentwith very large action potentials (.2 mV) having a pairing (mean threshold58.861.1 nA, mean pairingpositive polarity initial phase and an increase in electrode intensity512.661.5 nA).

S.J. Cruikshank, N.M. Weinberger / Brain Research 891 (2001) 78 –93 81
Fig. 1. Experiment protocol. The temporal position of each experimental period is shown on the timeline (top). The treatment is depicted in the middle.Timing of stimuli for a single pairing trial is shown on the bottom.
2.6. Baseline, treatment, and post-treatment procedures for each baseline and post trial (a trial5one sequentialpresentation of the CS1 and CSn) as follows:
The response characterizations were followed by a 15CS1 /CSn Index 5min baseline period, during which the stability of re-
(spike rate to CS1)sponses to 60 presentations of the CS1 and CSn tones]]]]]]]]]]](spike rate to CS1) 1 (spike rate to CSn)were measured (separated into three blocks, with 20
interleaved presentations of each tone per block, 0.2 HzThe potential values of the CS1 /CSn Index range fromstimulus rate). Next, a treatment was administered in which
0.0 to 1.0. A value close to 1.0 indicates a strongthe CS1 tone was repeatedly paired with simultaneouspreference for the CS1, a value close to 0.0 indicates ajuxtacellular current (240 pairings at 0.2 Hz; tone andstrong preference for the CSn, and a value close to 0.5juxtacellular current durations were 100 ms; Fig. 1). Inindicates about equal responses for the CS1 and CSn.addition, each tone /current pairing was preceded by a 200
Analysis of variance (ANOVA) was used to examine thems train of BasF stimulation, that was adjusted to producestability of the Index scores across the three baselineEEG desynchrony in the ACx (0.1 ms biphasic currentblocks. Only those neurons that were stable (indicated bypulses, 100 Hz, 100–500 mA, onset of train began 250 msP.0.05), were used in subsequent analyses. After de-prior to the tone). Immediately following the treatment andtermining that the three baseline blocks were not sig-at 15 min intervals for up to an hour, the responses to thenificantly different from one-another, they were collapsedtones alone were re-determined (20 trials each, CS1 andinto a single block for comparison with the treatment andCSn interleaved as during the baseline, without anypost-treatment periods. Unpaired t-tests were used tocurrent).examine differences between the baseline period and otherperiods (significant difference, P,0.05).
2.7. Data analysis2.8. Histological localization of the BasF electrodes
The spike rate responses evoked by each presentation ofthe CS1 and CSn were collected during the baseline, At the end of a recording session, the BasF stimulatingtreatment, and post-treatment periods. These spike rates electrode positions were marked by passing direct currentwere averaged over the 100 ms of tone duration (for all (5–10 mA, 10 s) between the two poles of the stimulatingcells during all experimental periods) in order to capture electrode. Animals were then euthanized with an overdosethe majority of evoked spikes, while avoiding periods of of urethane and intracardially perfused with phosphateinhibition that often followed offset of the tone. The buffered saline (9 g NaCl per liter of 0.02 M phosphaterelative response to the CS1 vs. the CSn was calculated buffer) followed by 4% paraformaldehyde fixative (40 g

82 S.J. Cruikshank, N.M. Weinberger / Brain Research 891 (2001) 78 –93
paraformaldehyde per liter of 0.1 M phosphate buffer). The Baseline periods identical to the other experiments (above).brains were removed from the skull and stored in 4% Next was a Treatment phase that simply consisted of 240paraformaldehyde for 1–3 days, then in a solution of 20% repeated presentations of one tone frequency, at 0.2 Hz.sucrose (w/v) in 4% paraformaldehyde for 1–3 days (48C Finally Post-Treatment periods identical to the otherfor both solutions). Brains were cut on a freezing mi- experiments were conducted. No current stimuli werecrotome in the coronal plane (40–100 mm thickness). delivered at any time. Furthermore, the recording pipetteSections from the rostral regions, which contained the contained no biocytin. For analysis, the repeated toneBasF, were stained with Cresyl Violet. Locations of lesion (CSr) substituted for the CS1, and replaced it in themarks were compared with boundaries derived from the rat CS1 /CSn Index.brain atlas of Paxinos and Watson [55] to determine BasFelectrode locations. Sections from the caudal regions,which contained the ACx, were stored in phosphate buffer 3. Results(PB) for visualization of the recorded cells as describednext. 3.1. Juxtacellular labeling of physiologically identified
cells with biocytin2.9. Juxtacellular labeling and histology
From an initial total of 201 acoustically responsive unitsThe recorded cells were labeled with biocytin using the from 28 animals, 53 were successfully isolated in a
method of Pinault [57,58]. Cells were isolated in a juxtacellular configuration and characterized quantitativelyjuxtacellular configuration with micropipettes filled with for their acoustic receptive fields and current evoked2% biocytin solution as described above. Positive current responses. Of these, 15 cells (from 12 rats) were ‘held’stimuli were delivered through the micropipette during the throughout the baseline, treatment, and post-treatmentcurrent characterization phase and during the pairing periods. Finally, 10 of these 15 cells were successfullytreatment as described above. These stimuli appear to eject labeled with Biocytin. For all labeled cells, at least theBiocytin from the pipette into the neuron [58]. Following a soma and major proximal dendrites were stained. Dendriticsurvival period (between 45 min and 8 h; mean5230630 spines were often visible. Axonal labeling was nevermin) the brain was fixed and sectioned as indicated above. complete, although the initial portions of the axons could
Standard visualization methods, modified from sometimes be seen. The 10 recovered neurons includedHorikawa and Armstrong [36], were applied. Sections eight pyramidal cells, identified by the presence of anwere incubated for 10 min in a 0.2% concentration of obvious apical dendrite. These were distributed as follows:H O in phosphate buffer (PB), followed by PB rinses, Layer III51, Layer IV55, Layer V51, Layer VI51. The2 2
then incubated overnight in avidin–biotin–peroxidase solu- two remaining neurons had no obvious apical dendrites,tion at 48C, on a rotator (Standard ABC kit, Vector Labs, and were classified as non-pyramidal cells. Both of the0.3% Triton X-100 in PB). The next day sections were non-pyramidal cells were located in Layer IV. One hadrinsed in PB, pre-incubated in 0.01% DAB solution for 10 high spine density while the other had no obvious spines.min, then reacted by adding 60 ml of 30% H O to each Fig. 2 presents confocal microscopic images of two2 2
100 ml of DAB solution. After 20 min the sections were recovered cells and their corresponding acoustically drivenrinsed with PB, mounted on slides, air-dried, then lightly responses. Fig. 2A shows a Layer IV non-pyramidal cell. Itcounterstained with Cresyl Violet to facilitate the demarca- has a high spine density and is multipolar in form, withtion of laminar boundaries. Finally sections were dehy- many dendritic branches emanating in all directions fromdrated, cleared and coverslipped for microscopic examina- the soma. Based on morphology and position, this celltion. appears to be a layer IV spiny stellate cell [56]. In support
The representations of the cells presented below are of this, the cell displayed robust, short latency responses toeither camera lucida reconstructions, or computer images tones (approximately 20 ms; Fig. 2B) as might be expectedcaptured from a laser confocal microscope. For clarity, of a primary recipient of thalamocortical input [56].blood cell artifacts were attenuated, and contrast enhanced, Further physiological characterization of this cell revealedusing Adobe Photoshop. a reasonably low acoustic threshold (20–25 dB), and
narrow tuning: #0.25 octave response range at 20 dB2.10. Habituation control above threshold (Fig. 2B). For comparison, Fig. 2C shows
a pyramidal cell from deep layer 6. It has an ovoid somaHabituation control experiments were conducted for an located ,100 mm from the subcortical white matter and an
additional nine cells (n56 animals) to test whether or not apical dendrite that terminates in layer IV with a bouquetrepeated presentation of one tone frequency would cause a of branches. In contrast to the layer IV cell discussedspecific decrease in ACx responses to that frequency, above, this infragranular pyramidal cell displayed longerrelative to a control frequency that was not presented latency responses to acoustic stimuli (.40 ms; Fig. 2D)during the treatment. The protocol consisted of RF and and broad frequency tuning: $1.5 octaves range at 20 dB

S.J. Cruikshank, N.M. Weinberger / Brain Research 891 (2001) 78 –93 83
Fig. 2. Morphology and acoustic responses of two auditory cortical cells. (A) Morphology of a of spiny non-pyramidal cell ([BH2406). Far left is lowmagnification image showing position of soma in layer IV. Open arrows positioned at layer I / II border and bottom of layer VI. Upper right shows mediumpower image of the soma and dendrites. Note the lack of apical dendrite. Bottom right is magnified view of the dendrites that project ventrally from thesoma (they are rotated 90 degrees in the display). Note the high spine density. (B) Acoustic response of the cell visualized in ‘A’. Top shows theperistimulus time histograms and raster plots for a range of tone frequencies presented at 45 dB. Note that there is a significant response at only one of thefrequencies (15.5 kHz). Bottom shows the response latency and pattern for the 15.5 kHz tone. The bin width is 10 ms. The bin with the largest number ofspikes begins 20 ms following the stimulus onset, and the response ends within 50 ms of stimulus onset. (C, D) Morphology and acoustic responses of adeep layer VI pyramidal cell ([BH3212). The cell has an obvious apical dendrite that extends to approximately layer IV, typical of layer VI cells (C).Tuning is broad (D, top), responses are relatively weak, and latencies are long (540 ms at the best frequency; D, bottom). Tissue is counterstained withCresyl Violet in A and C.

84 S.J. Cruikshank, N.M. Weinberger / Brain Research 891 (2001) 78 –93
above threshold (Fig. 2D). Possible relationships between between stimuli. However, by the middle of the treatment,morphological characteristics and plasticity will be dis- the desynchrony was continuous, lasting the full 5 scussed below. between trials. Finally, following termination of the treat-
ment, there was a gradual and complete recovery of3.2. Effects of basal forebrain stimuli during the pairing synchronous activity.treatment Of the 15 experiments that were completed, four were
similar to the example shown in Fig. 3; i.e. there wasBasF stimulation during the pairing treatments generally desynchronous EEG on greater than 90% of the treatment
produced desynchronization of the EEG (below). An trials. These experiments were classified as ‘desynchron-example is shown in Fig. 3. EEG records and associated ized.’ For seven experiments, the BasF stimulus inducedfrequency power spectra are plotted for periods before, desynchrony for 50–90% of the treatment trials. Theseduring, and after the treatment. [Note the sudden shift from were classified as ‘mixed.’ Finally, for four experiments,large slow waves during the baseline to low amplitude the BasF stimulus was ineffective, having no effect on thefaster waves during the treatment (which included BasF cortical EEG; they were classified as ‘synchronized.’ Figs.stimulation: see Materials and methods)]. For this experi- 4A, B shows examples of the three categories of EEGment there was clear EEG desynchrony on nearly every effects [24]. Fig. 4C plots the stimulation electrode place-trial. For the initial trials, there was some recovery ments as a function of EEG state during the treatment.
Fig. 3. Example of BasF stimulus that desynchronized the EEG during treatment. (A) EEG activity obtained from the ACx before during and after BasFstimulation (recorded at a depth of 683 mm and bandpass filtered 1–75 Hz). During the treatment, trains of BasF stimuli are delivered every 5 s (indicatedby arrows). Notice the time-locked decrease in large amplitude slow waves beginning immediately after BasF stimulation (2). By the ‘middle of treatment’the EEG remains completely desynchronized between stimulus trains (3). After the ‘end of treatment’ the EEG gradually recovers toward pre-treatmentlevels (4). Within 2 min of terminating stimulation, the large slow wave activity has fully recovered (5). (B) The frequency power spectra are obtainedfrom the 3 s periods centered between the BasF stimuli. Note the robust decreases in low frequencies and increases in high frequencies during the BasFstimulation treatment, relative to baseline (B, top). The spectrum recovers 2 min after the treatment (low frequencies are even more dominant in thepost-treatment phase; B, bottom), indicating that it was the BasF stimulation and not spontaneous drifting of state, that produced the changes.

S.J. Cruikshank, N.M. Weinberger / Brain Research 891 (2001) 78 –93 85
Fig. 4. Categories of EEG responses and the position of electrodes for BasF stimuli. (A) Examples of each category of EEG responses to BasF stimulation(stimuli indicated by arrows; polygraph recordings are bandpass filtered @ 1–75 Hz). Records taken from middle of treatment phases. Each example comesfrom the ACx of a different rat. See text for explanation of classifications. (B) Frequency power spectra associated with each of the experiments illustratedin ‘A’. Again, power spectra were calculated from 3 s periods centered between the BasF stimuli. Note the progressive decreases in slow waves andincreases in fast waves, as one examines first the synchronized, then the mixed, and finally the desynchronized power spectra. (C) BasF stimulatingelectrode loci, determined histologically, and plotted according to EEG category during the treatment. Numbers on sections represent distance from bregma(Adapted from [52]). Abbreviations: B, cells of the basal nucleus of Meynert; EP, entopeduncular nucleus; GP, globus pallidus; ic, internal capsule;LH/mfb, lateral hypothalamus/medial forebrain bundle; Rt, reticular thalamic nucleus; SI, substantia innominata; VM, ventromedial thalamic nucleus;VPL, ventrolateral thalamic nucleus; VPM, ventroposterior thalamic nucleus, medial division; ZI, zona incerta.
Loci included a variety of nuclei and tracts in and around 3.3. An increase in pre /postsynaptic covariance wasthe BasF region, between 1.8 and 3.3 mm posterior to imposed during the treatmentbregma. There was no clear relationship between ana-tomical position and effect on the EEG within the regions During the treatment, application of the positive jux-stimulated here. tacellular current significantly increased the responses to

86 S.J. Cruikshank, N.M. Weinberger / Brain Research 891 (2001) 78 –93
the CS1. This was consistent for both the group data,where the mean response imposed during the treatmentwas nearly three-fold above baseline (Fig. 5), and in theindividual data, where each of the 15 cells tested exhibitedsignificant increases (P,0.05, t-test, treatment vs.baseline). It has previously been shown that the excitationproduced by juxtacellular current using these stimulationparameters is highly localized to the postsynaptic cell [24]and can best be accounted for by direct current injectioninto the postsynaptic cell [22]. Thus, these imposedpostsynaptic response increases indicate that the treatmenteffectively increased the covariance between the post-synaptic cells and the presynaptic afferents activated by theCS1 tones [23,24].
3.4. No significant post-treatment plasticity was observedacross the population Fig. 6. Group effects for the CS1 /CSn Index. The histograms compare
the mean group CS1 vs. CS2 index values for the baseline and each ofDespite the effective treatment (above), there was no the post-treatment periods. Measurement periods are labeled along the
bottom. Number of cells for each period shown in the correspondingsignificant group change in the CS1 /CSn Index immedi-histogram. Probabilities are results of paired t-tests (posts vs. baseline,ately after the treatment (P50.9, Immed. Post vs.within-cell). Notice that there is no significant change relative to baseline
Baseline), nor did changes emerge at the 15- or 30-min for any of the post-treatment measures.post-treatment measurement periods (Fig. 6; Ps.0.2).This stands in stark contrast to a previous study of auditorycortex [24], in which significant mean increases were for at least 15 min (P,0.03). The previous study did notinduced immediately after a Hebbian treatment, and lasted include BasF stimulation. This suggests that the addition of
the BasF stimuli in the present study did not augment theHebbian plasticity as predicted, but instead may haveattenuated plasticity (discussed below).
Analysis of the post-treatment results on an individualcell-by-cell basis confirm and extend the group results.Only one of the 15 neurons (6.7%) showed the predictedrelative increase in the CS1 vs. CSn Index (Fig. 7A;P,0.05, Post vs. Baseline). Examination of the peri-stimulus time histograms for this ‘plastic’ cell reveals thatthe differential change was caused exclusively by anincrease in the CS1 response; the response to the CSn didnot change significantly (Fig. 7B). A second cell changedsignificantly in the non-predicted direction (i.e. relativeCS1 decrease; P,0.05, not shown). The relative re-sponses for both neurons returned to baseline levels within15 min. Thus, as was the case for the group results, theindividual cell data showed very little post-treatmentplasticity. Furthermore, the two changes that did occurwere in offsetting directions. Also in agreement with thegroup results, the individual cell data contrast with theprevious Hebbian study from our laboratory, in which7/22 (32%) cells exhibited significant relative increasesimmediately after a Hebbian treatment, while no cellsshowed decreases. Furthermore, six of those ‘plastic’ cellsFig. 5. Increases in responses imposed during covariance treatment.
Mean group response (n515) to the CS1 tones alone (baseline period, from the previous study maintained the changes for at leastblack bar) are compared with the group response to same tones in the 15 min (P,0.05, [24]). Given the surprising finding thatpresence of positive postsynaptic current (treatment period, grey bar). the treatment in the present study, which included theProbability shown is from paired t-test. Note the highly significant
addition of BasF stimulation, induced less (rather thanincrease in response to the CS1 produced by the addition of positivemore) plasticity than the previous Hebbian treatment alonecurrent. This indicates that the addition of positive current was effective
in increasing ‘covariance’ during the treatment. See text. [24], we next focused our analysis and experiments on
S.J. Cruikshank, N.M. Weinberger / Brain Research 891 (2001) 78 –93 87
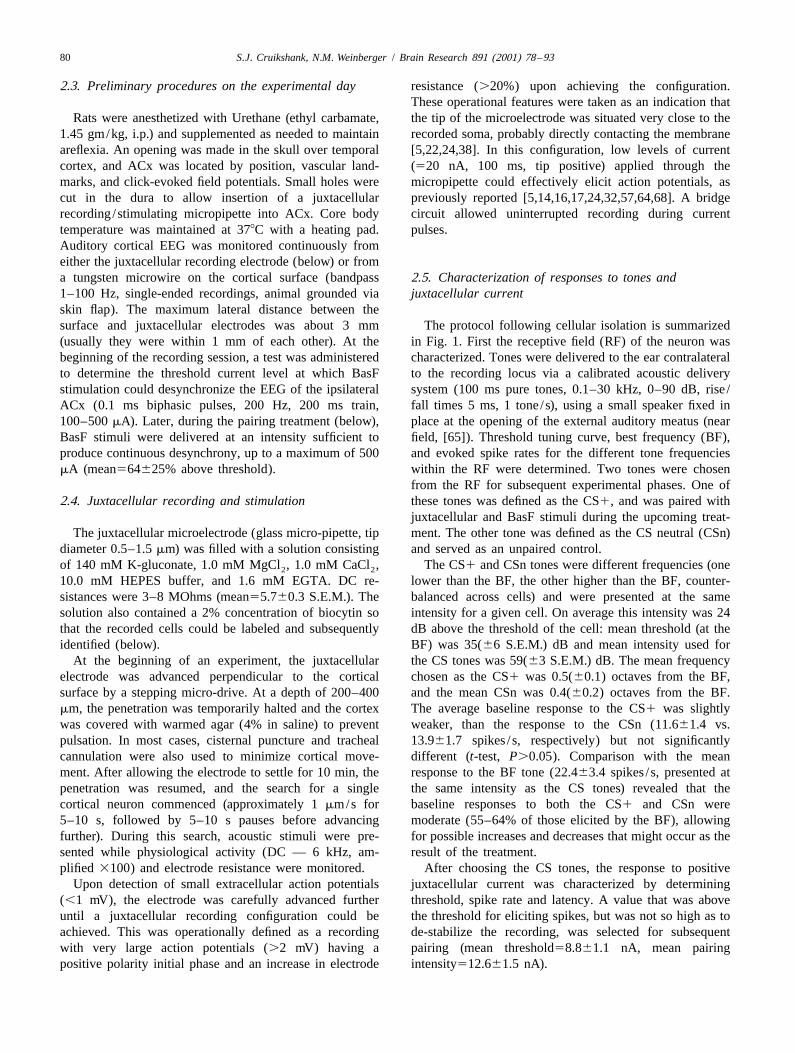
Fig. 7. Example increase in post-treatment response to CS1, and morphology. (A) Evolution of the Index values for the cell that underwent the significantincrease. Measurement periods labeled along bottom. Note that the increase relative to baseline only remained significant for the first post-treatmentmeasurement (asterisk indicates P,0.05). (B) Peri-stimulus time histograms (PSTs) and associated raster plots for the cell described in part ‘A’ of thisfigure. Separate responses to the CSn (top row) and the CS1 (bottom row) are shown. Bins are 10 ms. Response magnitudes in spikes / s (see calibration).Each dot in a raster represents a spike. Successive trials for a given period are stacked in rows upon one-another. The treatment period has more rowsbecause it represent responses to 240 trials rather than 20 trials. The baseline CS1 response was modest, and the CSn response was slightly stronger,resulting in a baseline Index value of 0.4460.03. During the treatment, a significant increase in CS1 response was imposed (P,0.0001). Immediatelyafter the treatment there was a significant increase in CS1 response compared to baseline (P,0.02), and a non-significant decrease to the CSn (P50.21),resulting in a significant increase in the Index (Post50.5960.07, P,0.04). Note that along with the increase in mean rate, the response pattern alsochanged; after the treatment the CS1 elicited a robust ‘on’ type response. At 15 min, the CS1 response remained elevated, but the CSn response hadincreased as well, such that the Index value had fallen to non-significant levels (P50.30). (C) The drawing on the left (‘Plastic, Layer IV’) shows the somaand dendrites of the cell exhibiting the significant increase following treatment, described in parts ‘A’ and ‘B’ of this figure. Note the large amount ofbranching off the distal portions of the apical dendrite (i.e. in the upper layers). The drawing on the right (‘Non-Plastic, Layer IV’) shows a layer IV cellthat failed to display physiological plasticity. Note that the apical dendrite has only one small offshoot, with no branching in the distal upper layer region.Also see text.

88 S.J. Cruikshank, N.M. Weinberger / Brain Research 891 (2001) 78 –93
possible explanations for the lack of strong plasticity in the less overall effect on the auditory cortices for the syn-present study. chronous cases (which appeared unaffected on the in-
dependent measure of EEG) than for the nonsynchronous3.5. Morphological observations: plastic vs. non-plastic cases. Fig. 8 compares the plasticity for the two EEGcells categories and reveals that the four cells exhibiting the
greatest relative increase in response to the CS1 (i.e. theBoth the number of morphologically recovered cells and greatest plasticity in the predicted direction) were actually
the degree of physiological plasticity were quite limited. the same four cells that composed the entire ‘synchronous’However, there are also very little data available on the EEG group. When considered as a separate unit, the cellsrelationship between morphology and plasticity in the of the synchronous group actually exhibited significantneocortical literature. With this in mind, we attempted to plasticity (P,0.003, paired t-test, post vs. baseline),extract whatever potentially useful information we could whereas cells of the analogous nonsynchronous group didfrom our sample. The cell that exhibited the significant not (P.0.05). Observe that even the cell with the weakestincrease in the CS1 /CSn Index is illustrated in Fig. 7C. It increase for the synchronized group had a higher valuewas determined to be a pyramidal cell, located in layer IV. than the strongest increase for the non-synchronized groupBased on the simple criteria of (a) pyramidal vs. non- (Fig. 8). Among the cells of the synchronized group waspyramidal cell type and (b) layer, the ‘plastic’ cell did not the one statistically significant positive effect previouslydistinguish itself from several non-plastic cells; recall that illustrated in Fig. 7. Thus, contrary to expectations, BasFthere were six other cells recovered in Layer IV that stimuli that were effective (as assessed by their effects oncompleted the experiment (e.g., see Fig. 2A), including EEG), may have somehow ‘prevented’ the Hebbian treat-four pyramidal cells. None of these exhibited significant ment from inducing potentiation of CS1 responses.plasticity. One possible way in which BasF stimuli could nega-
However, examination of gross dendritic morphology tively effect plasticity would be to reduce postsynapticdid reveal one obvious distinguishing feature of the ‘plastic excitability during the treatment. This possibility wascell’: the spread of the dendritic branching in the upper examined by comparing the pre-tone spike firing rates forlayers. The apical dendritic arbor of the plastic cell wasbroad, having a medial / lateral spread of approximately450 mm (Fig. 7C; ‘Plastic, Layer IV’). In contrast, theupper layer branching was quite sparse for the other layerIV pyramidal cells. The most extreme case, also shown inFig. 7C (‘Non-Plastic, Layer IV’), has no labeled branchesin the upper layers whatsoever. In fact, the largest spreadof apical dendritic branching for any of the non-plasticLayer IV cells was approximately 150 mm (not shown).Thus, the amount of upper layer branching seems todistinguish the plastic Layer IV pyramidal cell from thenon-plastic Layer IV pyramidal cells. It remains to bedetermined whether or not such branching is important forplasticity.
The cell displaying the significant relative decrease inCS1 response was not recovered histologically. Based onmicrodrive measurements during the recording (923 mmfrom the pial surface), it was estimated that this cell waslocated in Layer V.
3.6. Effectiveness of BasF stimuli on cortical state vs.Fig. 8. Greatest increases on plasticity measure were from Synchronizedplasticitygroup. The values on the plasticity measure (i.e. the CS1 /CSn Index;y-axis) were compared for the Synchronized vs. the Non-synchronized
As shown above, BasF stimulation produced non- EEG groups (means6S.E.M. for the two groups and individual values forsynchronized EEGs for the majority of cases. However it each cell are shown). Notice that there is a significantly higher dis-may have had additional effects, particularly on plasticity, tribution of values for the Synchronized group. In fact, there was no
overlap in values between groups at all; the four highest overall valuesthat were unexpected. To address this possibility, we firstcomposed the entire Synchronized group. Considered on its own, thisexamined the magnitude of plasticity for the synchronoussynchronized group underwent a significant increase on the plasticity
vs. nonsynchronous cell groups (nonsynchronous group measure (P,0.003, paired t-test, baseline vs. post), whereas the remain-composed of desynchronous and mixed as in [24]). This ing cells, which composed the nonsynchronized group, did not exhibitdivision is based on the premise that the BasF stimulus had significant change (P.0.05) See text.

S.J. Cruikshank, N.M. Weinberger / Brain Research 891 (2001) 78 –93 89
the treatment vs. baseline periods. The time window over any of the post-treatment time-points (Fig. 9). Therefore,which firing rates were averaged corresponded to the 200 habituation can be ruled out.ms immediately preceding tone onset, which overlappedwith the last 150 ms of BasF stimulation. Significantdecreases during the treatment were observed for seven 4. Discussioncells, while significant increases occurred for only fourcells (the four remaining cells showed no significant The combination of BasF stimulation and juxtacellularchanges; P,0.05, unpaired t-tests, treatment vs. baseline), excitatory current failed to increase CS1 specific re-indicating a depressing effect on postsynaptic excitability sponses to tones. In fact, it apparently reduced suchfor the majority of affected cells. plasticity. Lack of plasticity would be expected if the
critical hypothesized conditions were not present. How-ever, the failure to observe plasticity does not appear to be
3.7. Control for habituation due to a failure to control the relevant independentvariables in the experiment. For example, during the
It is important to rule out a possible methodological pairing treatment the excitatory juxtacellular current sig-problem that might have reduced the apparent incidence of nificantly increased the responses to the CS1 tones for allplasticity. The CS1 tone was repeatedly presented during of the experiments (15/15). Moreover, the BasF stimula-the treatment period, while the CSn was not. If this tion produced non-synchronous cortical EEGs for therepetition caused habituation of responses to the CS1 majority of the experiments (11/15).[20,67], then this might have canceled out or masked the It might be argued the low probability of plasticity wasdetection of any potentiation induced by the pairing, due to habituation to the CS1 tone during the treatment,making it appear that no change had occurred for the which might have masked an underlying potentiation.CS1. However, no habituation was detected in a control experi-
As indicated in the Materials and methods, the test for ment. Thus, overall these results indicate that the con-habituation involved repeatedly presenting one tone fre- ditions hypothesized to be sufficient for plasticity werequency, 240 times at 0.2 Hz, then determining whether or present.not this caused a specific decrease in ACx response to that One might speculate that failure to obtain potentiationfrequency (CSr), relative to a control frequency that was could have been due to the relative timing of the presynap-not presented during the treatment (the CSn). Results tic (tone) input and the postsynaptic (juxtacellular) current.indicated that no cells underwent significant decreases in Recent experiments conducted in the neocortex [47] andrelative response to the CSr compared with the CSn elsewhere [12,13,45], have indicated that the precisefollowing the habituation treatment (P.0.05, n59, t-test). timing of presynaptic and postsynaptic activity can haveFurthermore, group data indicated no significant changes at important consequences for the degree and polarity of
plasticity. For example, Markram and colleagues foundthat in synaptically coupled layer V cells, potentiationoccurred when presynaptic input preceded postsynapticspikes by 10 ms, but depression resulted when postsynap-tic spikes preceded presynaptic input by 10 ms [47]. In thepresent study, the mean response latency to the CS1
during baseline was 27.063.5 ms after tone onset, whilethe average response latency to the compound tone pluscurrent stimulus during the treatment was 15.762.9 ms.Thus, on average, spikes were initiated by the juxtacellularpostsynaptic stimulus 11.3 ms before the response to thepresynaptic tone input. This appears to indicate that thepre /postsynaptic timing in the present experiment is moresimilar to the situation that produced synaptic depressionin the Markram et al. report than that which producedpotentiation. However, several other studies of the neocor-tex have obtained robust potentiation with treatments inwhich depolarizing postsynaptic stimuli were deliveredeither before [30,43,54,69] or simultaneous /continuous
Fig. 9. Habituation experiment: group results. Mean CSr vs. CSn Index with the presynaptic input [21,42,69]. In one example,values (6S.E.M.) for the baseline and each of the post-‘habituation’
Fregnac et al. [30] found that a synaptic stimulus deliveredperiods. There are essentially no changes relative to baseline for any of5–10 ms after the onset of a depolarizing current pulse,the post-habituation measurements. Probabilities are results of paired
t-tests (posts vs. baseline, within-cell). produced synaptic potentiation in 36% of visual cortical

90 S.J. Cruikshank, N.M. Weinberger / Brain Research 891 (2001) 78 –93
cells and depression in no cells. Similar or stronger effects immediately preceding response of the cells to tones. Thiswere reported in the other studies cited above. This might have reduced cellular response to tones so that theevidence suggests that precise pre- vs. postsynaptic timing effectiveness of juxtacellular current on responses to tonesis unlikely to have been responsible to the failure to was itself reduced.observe potentiation in the present study. Unfortunately, the effects of BasF stimulation on the
tone / juxtacellular current evoked responses could not beassessed directly because the tone / juxtacellular combina-
4.1. Morphological observations: single cell labelingtion was never presented in the absence of the BasF
with biocytinstimulus. However, it may be possible to estimate theseeffects indirectly by using results from a previous study
The biocytin data revealed that the one cell expressingthat did not involve BasF stimulation [22,24]. These results
significant potentiation of the relative CS1 response was ashowed a strong correlation between the numerical sum of
layer IV pyramidal cell. This was consistent with the locithe responses to juxtacellular current alone plus responses
of cells expressing plasticity in previous studies of ACxto tone alone vs. the response to the combined tone /current
using both BasF pairing and Hebbian protocols [10,23,24].stimuli (Fig. 10A, r50.716, P,0.0005, n522). By
However, in the present study six other cells were re-applying the regression equation describing this relation-
covered from layer IV, four of them pyramidal, that did notship to the results of the present study (and knowing the
exhibit significant plasticity. The plastic cell had con-actual responses to the CS1 alone and juxtacellular
siderably broader upper layer branching than the non-current alone in the present study), it was possible to
plastic cells, raising the possibility that a larger sample ofestimate for each cell what the responses to the combined
cells having the laminar and morphological characteristicstone / juxtacellular current stimuli would have been had
of the plastic cell might result in a greater incidence ofthere been no BasF stimuli. Results indicated that for
plasticity. The potential importance of upper layer branch-12/15 cells, the actual responses were weaker than pre-
ing might be related to the fact that the density ofdicted to occur without BasF stimuli (Fig. 10, P,0.05,
cholinergic axons in ACx is highest in the upper layers,sign test). This finding involves extrapolation from previ-
especially layer I [9,27,46,49]. This implies that choliner-ous studies, so caution should be exercised. However, it
gic cells of the BasF would have their strongest influencedoes provide some evidence that evoked responses, like
on cortical neurons with extensive processes in layer I,tonic excitability (above), were attenuated by the BasF
such as the plastic cell of Fig. 7. While an n51 is toostimuli during the treatment. Thus, although the increase in
small to permit any conclusions, the correlation of uniquepostsynaptic response during the treatment (produced by
upper layers branching with enhanced plasticity suggeststhe juxtacellular excitatory current) was highly significant,
that the matter be given further consideration.it was not as large as it would have been had there been noBasF stimulus. Further experiments will be required to
4.2. ‘Appropriate’ conditions were present but may be determine whether or not this apparent attenuation ofinsufficient or incorrect response during the treatment is strong enough to prevent
plastic changes from being induced.The initial discussion indicated that the factors hypoth- An indication that BasF stimulation may have interfered
esized to be important for plasticity were present, yet with plasticity is the finding that the greatest relativeplasticity was not consistently induced. Despite this, it potentiation of the CS1 responses occurred during theremains possible that the general hypothesis is correct, but four experiments in which BasF stimuli were not effective,that plasticity also requires other factors that were not as assessed by the EEG (Fig. 8). In fact those fourpreviously accounted for. The morphological observations experiments, when considered as a group, actually ex-above suggest one such potential factor. Another possi- hibited significant plasticity. In contrast, the 11 experi-bility is that the conditions / factors originally hypothesized ments in which BasF stimulation was effective at de-to be important were not correct. For example, an underly- synchronizing the EEG did not exhibit significant grouping assumption of the BasF-Covariance hypothesis (see plasticity. An alternative potential interpretation of theseIntroduction) is that the BasF stimulation would facilitate effects is that BasF stimuli for the synchronous group wereHebbian plasticity by increasing cellular excitability during effective for inducing plasticity but not for EEG de-the pairing treatment. To test for changes in excitability synchronization, whereas the BasF stimuli for theduring the treatment, the pre-tone firing rates were com- nonsynchronous group were more effective on the EEGpared for the treatment vs. baseline phases of the experi- and less effective (possibly too strong) for plasticity. Aments. There were more decreases than increases in pre- parametric study, examining different intensities and dura-tone firing rates during the BasF stimulation (seven tions of BasF stimulation, might help to resolve this issue.significant decreases, four significant increases, see Re- In summary, it is possible that the BasF stimulation in thesults), supporting the notion that the BasF stimulation present experiment disrupted Hebbian plasticity, perhapsreduced, rather than increased, postsynaptic excitability by decreasing cellular excitability.

S.J. Cruikshank, N.M. Weinberger / Brain Research 891 (2001) 78 –93 91
4.3. Simple ‘BasF-covariance hypothesis’ may beincorrect
Neither depression of excitability nor disruption ofplasticity were predicted outcomes of BasF stimulation.Cortical excitability is generally thought to be increasedduring manipulations / states associated with high BasFactivity (e.g., direct BasF stimulation, behavioral arousal /cortical desynchrony, cortical perfusion of ACh; reviewedin Sillito [61] and Cruikshank and Weinberger [23]. Thepresent results indicate that this may be an oversimplifica-tion. This conclusion is supported by recent studies ofBasF function in ACx. For example, a number of in vitrostudies in the ACx have indicated that the effects ofacetylcholine, which is normally released from cholinergicfibers of the BasF in vivo, can be quite complicated.Excitatory synaptic potentials can be either increased ordecreased by ACh depending on a number of circum-stances including initial strength of response, the presence /absence of preceding stimuli, and the degree of inhibition[7,8,52].
These complications are echoed by anatomical findings.For example, it has been reported that cholinergic fibers ofthe BasF synapse not only on pyramidal cells, but also oninhibitory cells of the neocortex [6,11,37], and reviewed inMesulam [49]. Thus, these inhibitory cells may be excitedby BasF stimuli and, in turn, inhibit pyramidal cells (whichmade up the majority of the cells recorded in the presentstudy). There are also direct inhibitory projections (i.e.containing GABA) from the BasF to the neocortex.Although the majority of these projections may synapse onneocortical GABAergic cells, producing disinhibition ofpyramidal cells [26], there are inhibitory projections fromthe BasF to cortical targets that are negative for GABA[33]. Such projections may explain the observation thatBasF stimulation can produce inhibition of cortical unitactivity [39].
Fig. 10. Calculated effect of BasF stimulation on tone-evoked responses. The present experiments were partly motivated by an(A) Regression plot from previous experiment [22] illustrating relation-
earlier study in which auditory cortical plasticity wasship between sum of individual responses to tone and positive juxtacellu-induced using a modified Hebbian treatment, without anylar current (x-axis) vs. actual response to tone /current composite stimulus
( y-axis). Note the strong positive correlation. The regression equation BasF stimulation [24]. In that study, at two-tone discrimi-describing this relationship is 0.66(x) 1 14.4 5 y, and can be thought of as nation paradigm was applied, in which a CS1 tone wasa way to predict the response to the composite, given the sum of the paired with excitatory postsynaptic current and a CS2responses to the individual stimuli. Note that the experiment from which
tone was paired with inhibitory postsynaptic current. Thethe regression equation was derived involved no BasF stimulation [22].protocol produced enduring changes in response favoring(B) Predicted vs. actual responses during treatment for present experi-
ment. The x-axis is the predicted response to the tone /current composite the CS1 relative to the CS2, and was most effectivestimulus if there had been no BasF stimulus. Values for this axis were when the cortical EEG was desynchronized during thecalculated by summing the individual responses to the tone and juxtacel- pairing treatment. It was hypothesized that the facilitatedlular current stimuli for the present experiment, then entering these sums
plasticity occurring during EEG desynchrony might beinto the regression equation obtained in A. The y-axis represents themediated by cholinergic excitation of the postsynaptic cellsactual response to the tone /current composite, in the presence of BasF
stimulation. Points falling above the diagonal dashed line indicate that the during the CS1 portion of the pairing treatment [22].actual response is higher than the predicted response. Points falling below Therefore in the present experiment, the cholinergic BasFthe diagonal indicate the actual response is lower than predicted. Notice was stimulated during CS1 Hebbian pairing, and no CS2that 12/15 points fall below the line. Because the actual responses in the
pairings were administered. The failure of the presentpresence of BasF stimulation are significantly lower than the responsesprotocol to induce potentiation of CS1 responses encour-predicted to occur in the absence of BasF stimulation, it would appear
that the BasF stimulation had a depressing effect on evoked response. ages reconsideration of the original hypothesis. For exam-
92 S.J. Cruikshank, N.M. Weinberger / Brain Research 891 (2001) 78 –93
ultrastructural basis for interaction with glutamate-immunoreactiveple, it is possible that the CS2 pairings in the previousneurons and other cells, Vis. Neurosci. 8 (1992) 177–191.discrimination experiment may have played a more im-
[7] V.B. Aramakis, A.E. Bandrowski, J.H. Ashe, Activation of mus-portant role than originally thought (e.g., [30]), and the carinic receptors modulates NMDA receptor-mediated responses infacilitation of plasticity by cortical desynchronization may auditory cortex, Exp. Brain Res. 113 (1997) 484–496.have been mediated through effects on the CS2, rather [8] V.B. Aramakis, A.E. Bandrowski, J.H. Ashe, Muscarinic reduction
of GABAergic synaptic potentials results in disinhibition of thethan completely via the CS1. The combined effects ofAMPA/kainate-mediated EPSP in auditory cortex, Brain Res. 758BasF stimulation in the present experiment (i.e. EEG(1997) 107–117.
desynchronization ‘and’ suppression of cellular excitabili- [9] C. Avendano, D. Umbriaco, R.W. Dykes, L. Descarries, Acetyl-ty) are consistent with the latter possibility. This issue calls choline innervation of sensory and motor neocortical areas in adultfor further investigation. cat: a choline acetyltransferase immunohistochemical study, J.
Chem. Neuroanat. 11 (1996) 113–130.[10] J.S. Bakin, N.M. Weinberger, Induction of a physiological memory
in the cerebral cortex by stimulation of the nucleus basalis [see5. Conclusions comments], Proc. Natl. Acad. Sci. USA 93 (1996) 11219–11224.
[11] C. Beaulieu, P. Somogyi, Enrichment of cholinergic synapticterminals on GABAergic neurons and coexistence of immuno-The present findings may be seen as negative insofar asreactive GABA and choline acetyltransferase in the same synapticBasF stimulation immediately preceding cellular excitationterminals in the striate cortex of the cat, J. Comp. Neurol. 304
to tone / juxtacellular current failed to increase frequency- (1991) 666–680.specific plasticity of responses to tone. However, this [12] C. C Bell, V.Z. Han, Y. Sugawara, K. Grant, Synaptic plasticity in aoutcome appears to have uncovered additional considera- cerebellum-like structure depends on temporal order, Nature 387
(1997) 278–281.tions in the potential relationships between BasF and[13] G.Q. Bi, M.M. Poo, Synaptic modifications in cultured hippocampalHebbian /covariance processes. Specifically, BasF stimula-
neurons: dependence on spike timing, synaptic strength, and post-tion actually decreased background excitability of corticalsynaptic cell type, J. Neurosci. 18 (1998) 10464–10472.
cells in the majority of cases and greater Hebbian /co- [14] E. Bienenstock, Y. Fregnac, S. Thorpe, Ionophoretic clamp ofvariance plasticity occurred in the absence of BasF-in- activity in visual cortical neurons in the cat: a test of Hebb’s
hypothesis, J. Physiol. (Lond.) 345 (1983) 123P.duced changes in the EEG. The present observations are[15] T.S. Bjordahl, M.A. Dimyan, N.M. Weinberger, Induction of long-compatible with two explanations: either the BasF-Hebbian
term receptive field plasticity in the auditory cortex of the wakingcovariance hypothesis is wrong or plasticity in this situa-guinea pig by stimulation of the nucleus basalis, Behav. Neurosci.
tion requires factors other than those indexed by BasF- 112 (1998) 467–479.induced EEG desynchronization or current-induced facili- [16] J.F. Brons, C.D. Woody, N. Allon, Changes in excitability to
weak-intensity extracellular electrical stimulation of units of peric-tation of cellular responses to tones (e.g., the morphologi-ruciate cortex in cats, J. Neurophysiol. 47 (1982) 377–388.cal cell type, above). This study does not permit a choice
[17] J. Buchhalter, J. Brons, C.D. Woody, Changes in cortical neuronalbetween the two possibilities.excitability after presentations of a compound auditory stimulus,Brain Res. 156 (1978) 162–167.
[18] D.V. Buonomano, Distinct functional types of associative long-termpotentiation in neocortical and hippocampal pyramidal neurons, J.AcknowledgementsNeurosci. 19 (1999) 6748–6754.
[19] F. Casamenti, G. Deffenu, A.L. Abbamondi, G. Pepeu, Changes inSupported by NIH-NIDCD research grants [DC 02938 cortical acetylcholine output induced by modulation of the nucleus
and [DC02346 (N.M.W.) and MH10432-03 (S.C.). basalis, Brain Res. Bull. 16 (1986) 689–695.[20] C. Condon, N.M. Weinberger, Habituation produces frequency-
specific plasticity of receptive fields in auditory cortex, Behav.Neurosci. 105 (1991) 416–430.
References [21] M.C. Crair, R.C. Malenka, A critical period for long-term potentia-tion at thalamocortical synapses [see comments], Nature 375 (1995)325–328.[1] E. Ahissar, M. Ahissar, Plasticity in auditory cortical circuitry, Curr.
[22] S.J. Cruikshank, Evaluation of the Hebbian covariance hypothesis inOpin. Neurobiol. 4 (1994) 500–507.receptive field plasticity of adult auditory cortical neurons, Thesis[2] E. Ahissar, M. Abeles, M. Ahissar, S. Haidarliu, E.Vaadia, Hebbian-(Ph.D., Biological Sciences) — University of California, Irvine,like functional plasticity in the auditory cortex of the behaving(1997).monkey, Neuropharmacology 37 (1998) 633–655.
[23] S.J. Cruikshank, N.M. Weinberger, Evidence for the Hebbian[3] E. Ahissar, S. Haidarliu, D.E. Shulz, Possible involvement ofhypothesis in experience-dependent physiological plasticity ofneuromodulatory systems in cortical Hebbian-like plasticity, J.neocortex: a critical review, Brain Res. Rev. 22 (1996) 191–228.Physiol. Paris 90 (1996) 353–360.
[24] S.J. Cruikshank, N.M. Weinberger, Receptive-field plasticity in adult[4] E. Ahissar, E. Vaadia, M. Ahissar, H. Bergman, A. Arieli, M.auditory cortex induced by Hebbian covariance, J. Neurosci. 16Abeles, Dependence of cortical plasticity on correlated activity of(1996) 861–875.single neurons and on behavioral context, Science 257 (1992)
[25] M.A. Dimyan, N.M. Weinberger, Basal forebrain stimulation in-1412–1415.duces discriminative receptive field plasticity in auditory cortex,[5] R.D. Andrew, M. Fagan, A technique for controlling the membraneBehav. Neurosci. 113 (1999) 691–702.potential of neurons during unit recording, J. Neurosci. Methods 33
[26] R.W. Dykes, Mechanisms controlling neuronal plasticity in somato-(1990) 55–60.sensory cortex, Can. J. Physiol. Pharmacol. 75 (1997) 535–545.[6] C. Aoki, S. Kabak, Cholinergic terminals in the cat visual cortex:

S.J. Cruikshank, N.M. Weinberger / Brain Research 891 (2001) 78 –93 93
[27] F.P. Eckenstein, R.W. Baughman, J. Quinn, An anatomical study of [49] M.M. Mesulam, The systems-level organization of cholinergiccholinergic innervation in rat cerebral cortex, Neuroscience 25 innervation in the human cerebral cortex and its alterations in(1988) 457–474. Alzheimer’s disease, Prog. Brain Res. 109 (1996) 285–297.
[28] J.-M. Edeline, B. Hars, C. Maho, E. Hennevin, Transient and [50] R. Metherate, J.H. Ashe, Basal forebrain stimulation modifiesprolonged facilitation of tone-evoked responses induced by basal auditory cortex responsiveness by an action at muscarinic receptors,forebrain stimulations in the rat auditory cortex, Exp. Brain Res. 97 Brain Res. 559 (1991) 163–167.(1994) 373–386. [51] R. Metherate, J.H. Ashe, Nucleus basalis stimulation facilitates
[30] Y. Fregnac, J.P. Burke, D. Smith, M.J. Friedlander, Temporal thalamocortical synaptic transmission in the rat auditory cortex,covariance of pre- and postsynaptic activity regulates functional Synapse 14 (1993) 132–143.connectivity in the visual cortex, J. Neurophysiol. 71 (1994) 1403– [52] R. Metherate, J.H. Ashe, Synaptic interactions involving acetyl-1421. choline, glutamate, and GABA in rat auditory cortex, Exp. Brain
[31] Y. Fregnac, D. Shulz, Models of synaptic plasticity and cellular Res. 107 (1995) 59–72.analogs of learning in the developing and adult vertebrate visual [53] R. Metherate, C.L. Cox, J.H. Ashe, Cellular bases of neocorticalcortex, in: V. Casagrande, P. Shinkman (Eds.), Advances in Neural activation: modulation of neuronal oscillations by the nucleusand Behavioral Development, Vol. 4, Ablex Publ. Corp, New Jersey, basalis and endogenous acetylcholine, J. Neurosci. 12 (1992) 4701–1994, pp. 149–252. 4711.
[32] Y. Fregnac, D. Shulz, S. Thorpe, E. Bienenstock, A cellular [54] Y. Otsu, F. Kimura, T. Tsumoto, Hebbian induction of LTP in visualanalogue of visual cortical plasticity, Nature 333 (1988) 367–370. cortex: perforated patch-clamp study in cultured neurons, J. Neuro-
[33] T.F. Freund, A.I. Gulyas, GABAergic interneurons containing physiol. 74 (1995) 2437–2444.calbindin D28K or somatostatin are major targets of GABAergic [55] G. Paxinos, C. Watson, The Rat Brain in Stereotaxic Coordinates,basal forebrain afferents in the rat neocortex, J. Comp. Neurol. 314 Academic Press, New York, 1982.(1991) 187–199. [56] A. Peters, E.G. Jones, Cerebral Cortex, Vol. 1, Plenum Press, New
[34] B. Hars, C. Maho, J.-M. Edeline, E. Hennevin, Basal forebrain York, 1984.stimulation facilitates tone-evoked responses in the auditory cortex [57] D. Pinault, Golgi-like labeling of a single neuron recorded extracel-of awake rat, Neuroscience 56 (1993) 61–74. lularly, Neurosci. Lett. 170 (1994) 255–260.
[35] D.O. Hebb, Organization of Behavior, Wiley, New York, 1949. [58] D. Pinault, A novel single-cell staining procedure performed in vivo[36] K. Horikawa, W.E. Armstrong, A versatile means of intracellular under electrophysiological control: morpho-functional features of
labeling: injection of biocytin and its detection with avidin conju- juxtacellularly labeled thalamic cells and other central neurons withgates, J. Neurosci. Methods 25 (1988) 1–11. biocytin or Neurobiotin, J. Neurosci. Methods 65 (1996) 113–136.
[37] C.R. Houser, G.D. Crawford, P.M. Salvaterra, J.E. Vaughn, Immuno- [59] R. Schliebs, S. Rossner, V. Bigl, Immunolesion by 192IgG-saporincytochemical localization of choline acetyltransferase in rat cerebral of rat basal forebrain cholinergic system: a useful tool to producecortex: a study of cholinergic neurons and synapses, J. Comp. cortical cholinergic dysfunction, Prog. Brain Res. 109 (1996) 253–Neurol. 234 (1985) 17–34. 264.
[38] J.I. Hubbard, R. Llinas, D.M. Quastel, Electrophysiological Analysis [60] T.J. Sejnowski, G. Tesauro, The Hebb rule for synaptic plasticity:of Synaptic Transmission, Edward Arnold, London, 1969. algorithms and implementations, in: J.H. Byrne, W.O. Berry (Eds.),
[39] M.E. Jimenez-Capdeville, R.W. Dykes, A.A. Myasnikov, Differen- Neural Models of Plasticity, Academic Press, San Diego, 1989, pp.tial control of cortical activity by the basal forebrain in rats: a role 94–101.for both cholinergic and inhibitory influence, J. Comp. Neurol. 381 [61] A.M. Sillito, The cholinergic neuromodulatory system: an evalua-(1997) 53–67. tion of its functional roles, Prog. Brain Res. 98 (1993) 371–378.
[40] S.L. Juliano, Mapping the sensory mosaic [comment], Science 279 [62] G.S. Stent, A physiological mechanism for Hebb’s postulate of(1998) 1653–1654. learning, Proc. Natl. Acad. Sci. USA 70 (1973) 997–1001.
[41] M.P. Kilgard, M.M. Merzenich, Cortical map reorganization enabled [63] M. Steriade, D.A. McCormick, T.J. Sejnowski, Thalamocorticalby nucleus basalis activity [see comments], Science 279 (1998) oscillations in the sleeping and aroused brain, Science 262 (1993)1714–1718. 679–685.
[42] A. Kirkwood, M.F. Bear, Hebbian synapses in visual cortex, J. [64] F. Strumwasser, S. Rosenthal, Prolonged and patterned directNeurosci. 14 (1994) 1634–1645. extracellular stimulation of single neurons, Am. J. Physiol. 198
[43] A. Kossel, T. Bonhoeffer, J. Bolz, Non-Hebbian synapses in rat (1960) 405–413.visual cortex, NeuroReport 1 (1990) 115–118. [65] N. Suga, T. Manabe, Neural basis of amplitude-spectrum representa-
[44] M. Kurosawa, A. Sato, Y. Sato, Stimulation of the nucleus basalis of tion in auditory cortex of the mustached bat, J. Neurophysiol. 47Meynert increases acetylcholine release in the cerebral cortex of the (1982) 225–255.rat, Neurosci. Lett. 98 (1989) 45–50. [66] N.M. Weinberger, Tuning the brain by learning and by stimulation
[45] D.J. Linden, The return of the spike: postsynaptic action potentials of the nucleus basalis, Trends Cogn. Sci. 2 (1998) 271–273.and the induction of LTP and LTD, Neuron 22 (1999) 661–666. [67] N.M. Weinberger, T.D. Oleson, J.H. Ashe, Sensory system neural
[46] A. Lysakowski, B.H. Wainer, G. Bruce, L.B. Hersh, An atlas of the activity during habituation of the pupillary orienting reflex, Behav.regional and laminar distribution of choline acetyltransferase im- Biol. 15 (1975) 283–301.munoreactivity in rat cerebral cortex, Neuroscience 28 (1989) 291– [68] C.D. Woody, J.D. Knispel, T.J. Crow, P.A. Black-Cleworth, Activity336. and excitability to electrical current of cortical auditory receptive
[47] H. Markram, J. Lubke, M. Frotscher, B. Skmann, Regulation of neurons of awake cats as affected by stimulus association, J.synaptic efficacy by coincidence of postsynaptic APs and EPSPs Neurophysiol. 39 (1976) 1045–1061.[see comments], Science 275 (1997) 213–215. [69] Y. Yoshimura, T. Tsumoto, Dependence of LTP induction on
[48] D.A. McCormick, Neurotransmitter actions in the thalamus and postsynaptic depolarization: a perforated patch-clamp study in visualcerebral cortex, J. Clin. Neurophysiol. 9 (1992) 212–223. cortical slices of young rats, J. Neurophysiol. 71 (1994) 1638–1645.