Research Report - APTARE
59
Research Report 2012 Storage Market Survey By Bill Lundell, Senior Research Analyst and Mark Peters, Senior Analyst With Jennifer Gahm November 2012 © 2012, The Enterprise Strategy Group, Inc. All Rights Reserved.
Transcript of Research Report - APTARE

Research Report
2012 Storage Market Survey
By Bill Lundell, Senior Research Analyst and Mark Peters, Senior Analyst
With Jennifer Gahm
November 2012
© 2012, The Enterprise Strategy Group, Inc. All Rights Reserved.
Research Report: 2012 Storage Market Survey 2
© 2012 by The Enterprise Strategy Group, Inc. All Rights Reserved.
Contents
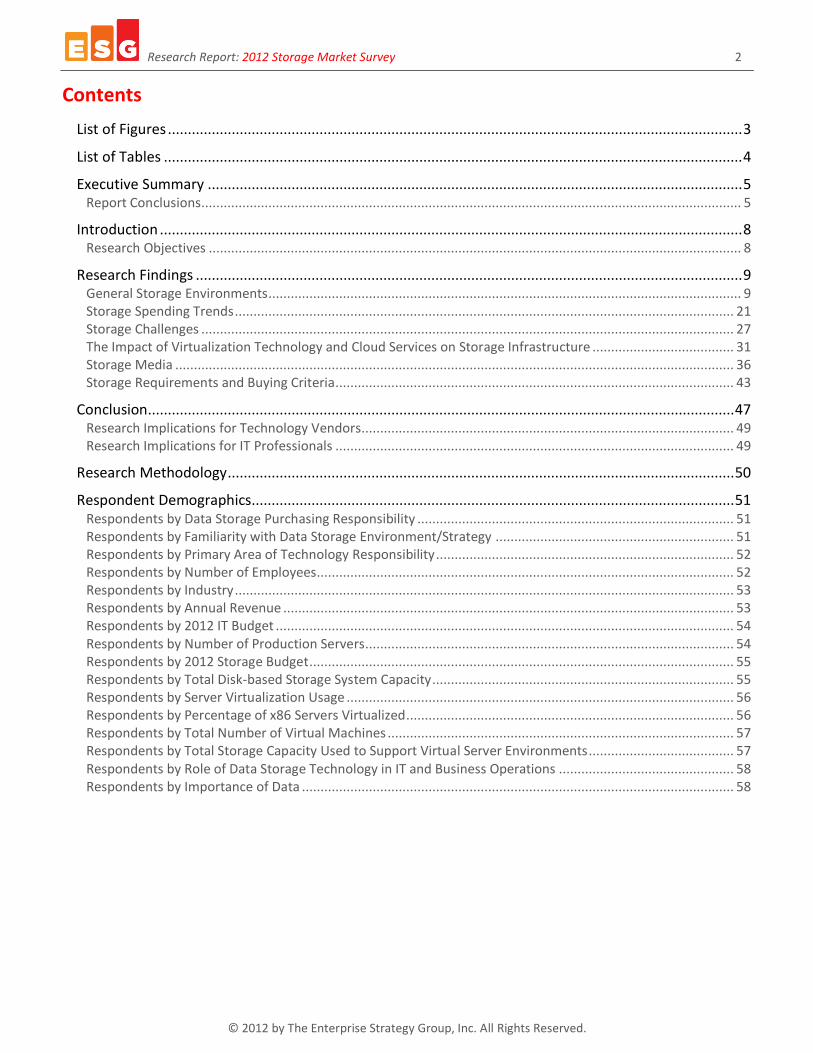
List of Figures ................................................................................................................................................ 3
List of Tables ................................................................................................................................................. 4
Executive Summary ...................................................................................................................................... 5 Report Conclusions ................................................................................................................................................. 5
Introduction .................................................................................................................................................. 8 Research Objectives ............................................................................................................................................... 8
Research Findings ......................................................................................................................................... 9 General Storage Environments ............................................................................................................................... 9 Storage Spending Trends ...................................................................................................................................... 21 Storage Challenges ............................................................................................................................................... 27 The Impact of Virtualization Technology and Cloud Services on Storage Infrastructure ...................................... 31 Storage Media ...................................................................................................................................................... 36 Storage Requirements and Buying Criteria........................................................................................................... 43
Conclusion ................................................................................................................................................... 47 Research Implications for Technology Vendors.................................................................................................... 49 Research Implications for IT Professionals ........................................................................................................... 49
Research Methodology ............................................................................................................................... 50
Respondent Demographics......................................................................................................................... 51
Respondents by Data Storage Purchasing Responsibility ..................................................................................... 51 Respondents by Familiarity with Data Storage Environment/Strategy ................................................................ 51 Respondents by Primary Area of Technology Responsibility ................................................................................ 52 Respondents by Number of Employees................................................................................................................ 52 Respondents by Industry ...................................................................................................................................... 53 Respondents by Annual Revenue ......................................................................................................................... 53 Respondents by 2012 IT Budget ........................................................................................................................... 54 Respondents by Number of Production Servers................................................................................................... 54 Respondents by 2012 Storage Budget .................................................................................................................. 55 Respondents by Total Disk-based Storage System Capacity ................................................................................. 55 Respondents by Server Virtualization Usage ........................................................................................................ 56 Respondents by Percentage of x86 Servers Virtualized ........................................................................................ 56 Respondents by Total Number of Virtual Machines ............................................................................................. 57 Respondents by Total Storage Capacity Used to Support Virtual Server Environments ....................................... 57 Respondents by Role of Data Storage Technology in IT and Business Operations ............................................... 58 Respondents by Importance of Data .................................................................................................................... 58

Research Report: 2012 Storage Market Survey 3
© 2012 by The Enterprise Strategy Group, Inc. All Rights Reserved.
List of Figures Figure 1. Total Disk-based Storage System Capacity, by Company Size .................................................................... 9 Figure 2. Total Installed Disk-Based Storage System Capacity, by Total Number of Production Servers ................ 10 Figure 3. Percent of Organizations with Disk-based Storage System Capacity of 500 TB or More, 2010 vs. 2012 .. 10 Figure 4. Annual Data Storage Capacity Growth Rate ............................................................................................. 11 Figure 5. Annual Data Storage Capacity Growth Rates, by Total Disk-based Storage System Capacity .................. 11 Figure 6. Applications Responsible for Storage Growth .......................................................................................... 12 Figure 7. Most Common Reason for Adding New Storage Systems ........................................................................ 13 Figure 8. All Disk-based Storage Technologies in Use ............................................................................................. 14 Figure 9. All Disk-based Storage Technologies in Use, by Company Size ................................................................ 15 Figure 10. Primary Disk-based Storage Technology in Use, by Company Size ......................................................... 15 Figure 11. All Disk-based Storage Technologies in Use, by Total Disk-based Storage System Capacity .................. 16 Figure 12. Primary Disk-based Storage Technology in Use, by Total Disk-based Storage System Capacity............. 16 Figure 13. Primary Disk-based Storage Technology in Use, by Total Disk-based Storage System Capacity............. 17 Figure 14. Number of Storage Administrators, by Company Size ........................................................................... 18 Figure 15. Number of Storage Administrators, by Total Disk-based Storage System Capacity ............................... 19 Figure 16. Number of Storage Administrators, by Role of Data Storage Technology in IT and Business Operations
................................................................................................................................................................... 19 Figure 17. Ability to Support Storage with Current Staff ......................................................................................... 20 Figure 18. 2012 Storage Budget Levels, by Company Size ...................................................................................... 21 Figure 19. 2012 Storage Budget Levels, by Total Installed Disk-Based Storage System Capacity ............................ 22 Figure 20. 2012 Storage Budget Levels, by Role of Data Storage Technology in IT and Business Operations ......... 22 Figure 21. Expected 2013 Storage Budget Levels .................................................................................................... 23 Figure 22. Expected 2013 Storage Budget Levels, by Company Size ....................................................................... 24 Figure 23. Expected 2013 Storage Budget Levels, by Role of Data Storage Technology in IT and Business
Operations ................................................................................................................................................. 24 Figure 24. IT Initiatives Expected to Significantly Impact Storage Spending over the Next 12-18 Months ............. 25 Figure 25. IT Initiatives Expected to Significantly Impact Storage Spending over the Next 12-18 Months, by
Company Size ............................................................................................................................................. 26 Figure 26. The Progression of Managing Data Storage Technology ........................................................................ 27 Figure 27. Storage Challenges ................................................................................................................................. 28 Figure 28. Satisfaction Level with Storage Hardware Utilization Rate .................................................................... 29 Figure 29. The Impact of Desktop Virtualization on Storage Infrastructure ............................................................ 30 Figure 30. Total Storage Capacity Currently Used to Support Virtual Server Environment ..................................... 31 Figure 31. Total Storage Capacity Currently Used to Support Virtual Server Environment, by Company Size ........ 32 Figure 32. Total Storage Capacity Currently Used to Support Virtual Server Environments, by Total Number of
Virtual Machines ........................................................................................................................................ 32 Figure 33. Storage Challenges Stemming from Server Virtualization Usage ........................................................... 33 Figure 34. Storage Challenges Stemming from Server Virtualization Usage, by Total Storage Capacity Currently
Used to Support Virtual Server Environment ............................................................................................. 34 Figure 35. Expected Impact of Public Cloud Computing Services to Onsite Storage Infrastructure and Processes 35 Figure 36. Solid-state Storage Usage Trends ........................................................................................................... 36 Figure 37. Significant Increase in Solid-state Storage Usage among Enterprise Organizations since 2008 ............. 37 Figure 38. Solid-state Storage Implementation Types among Current Users .......................................................... 38 Figure 39. All Solid-state Storage Implementation Types among Current Users, by Company Size ........................ 39 Figure 40. Solid-state Storage Implementation Types among Potential Adopters .................................................. 39 Figure 41. Allocation of Disk-based Storage Capacity across Disk Drive Types, Now vs. 24 Months from Now ...... 40 Figure 42. Overall Solid-state Storage Footprint Now and 24 Months from Now, by 2012 Storage Budget ........... 40 Figure 43. Tape Usage Trends and Future Plans ..................................................................................................... 41 Figure 44. How Organizations Currently Use Tape .................................................................................................. 42 Figure 45. Must-have Storage Features and Capabilities ........................................................................................ 43

Research Report: 2012 Storage Market Survey 4
© 2012 by The Enterprise Strategy Group, Inc. All Rights Reserved.
Figure 46. Important Criteria When Selecting Storage Vendors/Solutions ............................................................. 44 Figure 47. Most Important TCO Cost Considerations .............................................................................................. 45 Figure 48. Long-term View of Data Storage Technology ......................................................................................... 48 Figure 49. Long-term View of Data Storage Technology, by Role of Data Storage Technology in IT and Business
Operations ................................................................................................................................................. 48 Figure 50. Survey Respondents, by Data Storage Purchasing Responsibility .......................................................... 51 Figure 51. Survey Respondents, by Familiarity with Data Storage Environment and/or Strategy........................... 51 Figure 52. Survey Respondents, by Primary Area of Technology Responsibility ..................................................... 52 Figure 53. Survey Respondents, by Number of Employees ..................................................................................... 52 Figure 54. Survey Respondents, by Industry ........................................................................................................... 53 Figure 55. Survey Respondents, by Annual Revenue .............................................................................................. 53 Figure 56. Survey Respondents, by 2012 IT Budget ................................................................................................ 54 Figure 57. Survey Respondents, by Number of Production Servers ........................................................................ 54 Figure 58. Survey Respondents, by 2012 Storage Budget ....................................................................................... 55 Figure 59. Survey Respondents, by Total Disk-based Storage System Capacity ...................................................... 55 Figure 60. Survey Respondents, by Usage of Server Virtualization Technology ...................................................... 56 Figure 61. Survey Respondents, by Percentage of x86 Servers Virtualized ............................................................. 56 Figure 62. Survey Respondents, by Total Number of Virtual Machines .................................................................. 57 Figure 63. Survey Respondents, by Total Storage Capacity Used to Support Virtual Server Environments ............ 57 Figure 64. Survey Respondents, by Role of Data Storage Technology in Business and IT Operations..................... 58 Figure 65. Survey Respondents, by Importance of Data ......................................................................................... 58
List of Tables Table 1. Applications Responsible for Storage Growth, by Company Size .............................................................. 13 Table 2. Primary Disk-based Storage Technology in Use, by Role of Data Storage Technology in IT and Business
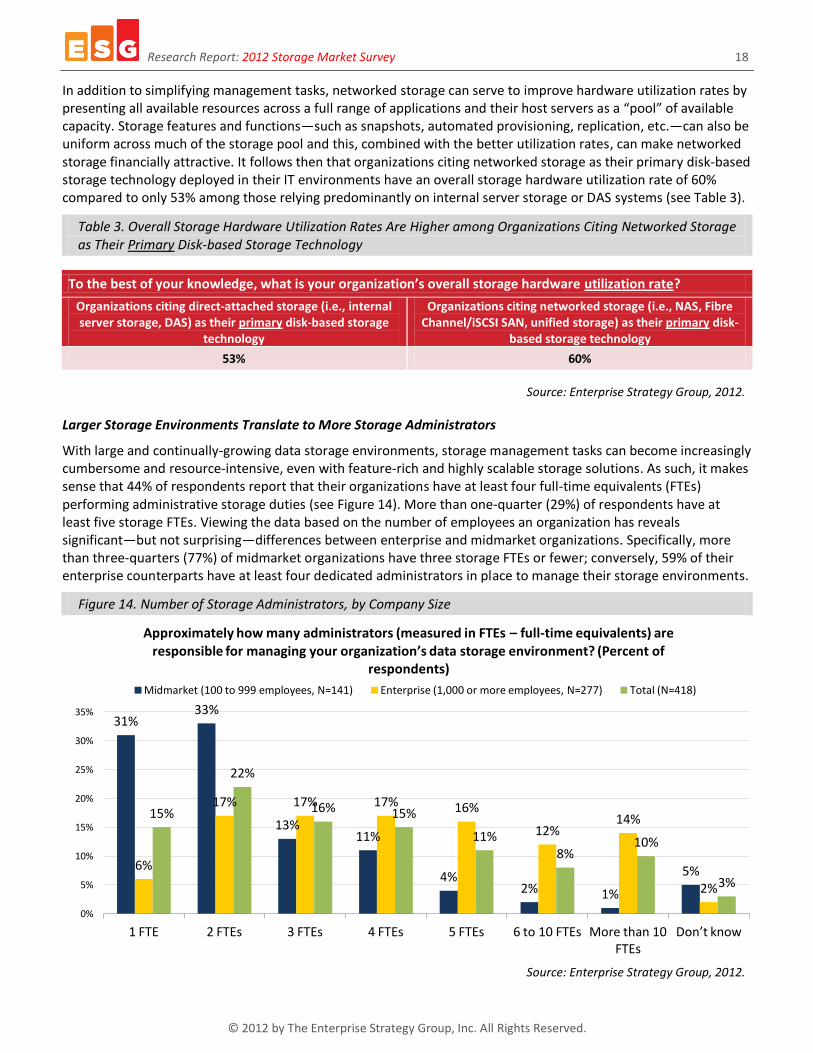
Operations ................................................................................................................................................. 17 Table 3. Overall Storage Hardware Utilization Rates Are Higher among Organizations Citing Networked Storage as
Their Primary Disk-based Storage Technology ........................................................................................... 18 Table 4. Storage Challenges, by Company Size ....................................................................................................... 29 Table 5. Overall Storage Hardware Utilization Rates Are Lower among Organizations Citing Poor Storage
Hardware Utilization as a Challenge .......................................................................................................... 30 Table 6. Expected Impact of Public Cloud Computing Services to Onsite Storage Infrastructure and Processes, by
Total Disk-based Storage System Capacity ................................................................................................. 35 Table 7. Current Usage of Solid-state Storage, by Role of Data Storage Technology in IT and Business Operations
................................................................................................................................................................... 36 Table 8. Tape Usage Trends and Future Plans, by Company Size ............................................................................ 41 Table 9. How Organizations Currently Use Tape, by Total Disk-based Storage System Capacity ............................ 42 Table 10. Must-have Storage Features and Capabilities, by Total Disk-based Storage System Capacity ................ 44 Table 11. Important Criteria When Selecting Storage Vendors/Solutions, by Company Size.................................. 45 Table 12. Most Important Message Storage Vendors Can Deliver .......................................................................... 46 Table 13. Most Important Message Storage Vendors Can Deliver, by Role of Data Storage Technology in IT and
Business Operations ................................................................................................................................... 46
All trademark names are property of their respective companies. Information contained in this publication has been obtained by sources The Enterprise Strategy Group (ESG) considers to be reliable but is not warranted by ESG. This publication may contain opinions of ESG, which are subject to change from time to time. This publication is copyrighted by The Enterprise Strategy Group, Inc. Any reproduction or redistribution of this publication, in whole or in part, whether in hard-copy format, electronically, or otherwise to persons not authorized to receive it, without the express consent of The Enterprise Strategy Group, Inc., is in violation of U.S. copyright law and will be subject to an action for civil damages and, if applicable, criminal prosecution. Should you have any questions, please contact ESG Client Relations at 508.482.0188.

Research Report: 2012 Storage Market Survey 5
© 2012 by The Enterprise Strategy Group, Inc. All Rights Reserved.
Executive Summary
Report Conclusions
ESG conducted an in-depth survey of 418 IT and data storage professionals concerning their organizations’ current data storage environments including current storage resources, challenges, purchase criteria, as well as forward-looking data storage plans. Survey participants represented midmarket (100 to 999 employees) and enterprise-class (1,000 employees or more) organizations in North America (United States and Canada).
Based on the data collected from this survey, ESG concludes:
Total installed disk-based storage system capacity continues to grow. More than one-quarter of organizations have at least 500 TB of disk-based storage system capacity deployed. From a company size perspective, nearly two-thirds (63%) of midmarket organizations (i.e., 100 to 999 employees) manage less than 50 TB of total disk-based storage system capacity; conversely, more than one in five enterprises (i.e., 1,000 or more employees) have 1 PB or more deployed, while 8% of these larger organizations reported having at least 5 PB of total disk-based storage system capacity. The majority of respondents cited overall annual storage capacity growth rates in the 1%-20% range, with more than one-quarter reporting that their data is growing in excess of 20% per year. Organizations with at least 500 TB of disk-based storage capacity are almost three times as likely as those with less than 100 TB to anticipate growth rates exceeding 20%.
The biggest application drivers of storage growth include business intelligence/data warehousing, ERP, and e-mail. While half of respondents believe that e-mail will be responsible for storage growth over the next two years, 12% believe that business intelligence and/or data analytics will be the application most responsible for storage growth over that same period. Other applications expected to have a significant impact on storage growth included enterprise resource planning systems, office productivity applications, and digital images. When analyzed by company size, enterprises are more likely than their midmarket counterparts to see data growth associated with business intelligence and data analytics, as well as web serving and e-commerce applications. For their part, midmarket organizations were more likely to cite e-mail, office productivity applications (i.e., Excel, PowerPoint, etc.), and video surveillance as more common application data storage growth sources.
Networked storage is the preferred infrastructure choice of large and more sophisticated organizations. The majority of users still leverage internal server storage (82%) and/or direct-attached storage (57%) to some extent. However, nearly two-thirds of users cite networked storage—whether network-attached storage (NAS), Fibre Channel and iSCSI SAN, or unified storage—as their primary disk-based storage technology (measured by percentage of total disk-based capacity). Networked storage systems were more likely to be identified as the primary underlying infrastructure for larger organizations—whether measured by employees, total disk-based capacity, or production servers—and those that view data storage as strategic to both IT and business operations. Organizations using networked storage were also more likely to report higher overall storage hardware utilization rates.
Size and importance of data storage technology dictates extent of support headcount. More than one-quarter (29%) of respondents have at least five storage full time equivalents (FTEs). Viewing the data based on company size—both number of employees and disk-based storage system capacity—reveals significant differences. Specifically, 59% of enterprises have at least four dedicated administrators in place to manage their storage environments compared to only 18% of midmarket organizations; similarly, nearly three-quarters (73%) of organizations with at least 500 TB of disk-based storage system capacity employ four or more administrators to manage these environments as opposed to 27% of those with less than 100 TB. Organizations that consider storage to be strategic to IT and business operations are more than twice as likely as those that view storage more tactically to have six or more FTEs focused on storage management activities. However, more than half (55%) of respondent organizations believe that they have some level of shortage when it comes to storage management headcount.

Research Report: 2012 Storage Market Survey 6
© 2012 by The Enterprise Strategy Group, Inc. All Rights Reserved.
Organizations expect to maintain healthy 2012 storage spending levels in 2013. Using $1 million as the line of delineation for 2012 storage spending levels, more than three-quarters (79%) of midmarket organizations found themselves below that line while nearly two-thirds (64%) of enterprise organizations came in above it. Organizations with at least 500 TB of total disk-based storage system capacity were more than six times as likely as those with less than 100 TB to have allocated $5 million or more for storage-related capital expenditures. Looking ahead, 59% of respondents expect to see an increase in 2013 storage spending relative to 2012 levels. Nearly two-thirds (65%) of enterprise-class organizations expect to increase their 2013 storage spending levels compared to 48% of midmarket respondents.
Cloud storage and server virtualization are expected to impact storage spending over the next 12-18 months. The use of cloud storage services to source storage capacity in lieu of buying new onsite infrastructure was the most commonly cited IT initiative with storage spending implications. More than one-third (35%) of organizations expect that supporting server virtualization implementations and/or technology refreshes will influence storage spending decisions. In addition to cloud storage and server virtualization, other IT initiatives most likely to impact storage spending among enterprise organizations included business intelligence/data analytics activities and data center initiatives.
Challenges associated with storage environments span a wide spectrum of issues. When asked to assess the process of managing data storage technology, more than half (57%) of survey respondents indicated that it has actually become easier over the last five years. However, that does not mean that organizations don’t still encounter issues with their storage environments. In fact, respondents clearly acknowledge a wide variety of ongoing challenges based on the fact that every one of the issues provided as an option was cited by at least one respondent organization as their primary challenge. Storage costs are clearly a key consideration for IT organizations, with more than half citing capital expense (i.e., hardware) and/or operational expense (i.e., largely staff) as a storage challenge. Additionally, 15% of organizations cited cost as their primary challenge, whether related to CAPEX or OPEX. The rapid growth—and subsequent management—of unstructured data was also identified as a challenge by 40% of all respondents, with 15% singling it out as their primary challenge.
Cost of new infrastructure is the biggest server virtualization-related storage challenge. Of the organizations with server virtualization technology deployed, 38% report that virtual machine images, applications, and associated data combine to consume 10 TB of storage capacity or less. While just 30% of enterprise organizations allocate at least 100 TB of storage capacity to support their virtual server environments, more than three-quarters (76%) of those organizations with more than 500 virtual machines have at least 100 TB of storage capacity associated with their virtual server environments. As such, it is not surprising that from a storage infrastructure perspective, 43% of organizations cite the capital cost of new storage-—whether incremental capacity or net-new systems—as a significant challenge related to server virtualization support.
The impact of public cloud services on storage infrastructure will remain limited for most users. While more than three-quarters (78%) of organizations currently leverage public cloud computing services—or have plans to—to some extent over the next five years, only 10% of these respondents expect cloud computing to have a significant impact on their onsite storage infrastructure and processes. Instead, many respondents foresee using these services in a more tactical manner as a way to offload the burden on both technology and personnel resources, at least for the foreseeable future.
Solid-state storage usage is increasing. More than one-third (33%) of respondents indicated that their organizations are leveraging solid-state storage technology in some form today. In light of the high raw price points for the technology, it makes sense that 37% of enterprise organizations—compared to 16% in 2008—use solid-state storage compared to only 24% of their midmarket counterparts. Those organizations that view data storage more strategically are more than four times as likely as those that dismiss it as an afterthought (39% vs. 9%) to use solid-state storage.

Research Report: 2012 Storage Market Survey 7
© 2012 by The Enterprise Strategy Group, Inc. All Rights Reserved.
Solid-state drives (SSDs) are still the most common solid-state storage implementation type. Since the latest wave of solid-state usage started with enterprise storage vendors shipping external disk storage subsystems with solid-state drives, it is not surprising that nearly half of current solid-state users are leveraging this option today and that one-quarter of these organizations consider it to be their primary implementation type. The other top implementation type in use is extended cache/memory/primary storage within servers, both from an overall (48%) and most widely deployed perspective (25%). Among potential adopters, solid-state drives in an external disk storage subsystem are the most commonly cited implementation type.
Tape won’t disappear anytime soon, but it’s not a top priority. While the use of disk-based technology has become more pervasive in data protection strategies due in large part to its performance capabilities, tape technologies are still used for backup and archive activities. In fact, 82% of respondent organizations currently use tape technology to some extent, although only 15% will continue to invest in tape and increase their current footprint. Conversely, more than one-third (37%) of organizations will actually decrease their usage of tape going forward, with the remaining 30% standing pat with their existing implementation. Midmarket organizations are more than twice as likely as their enterprise counterparts (26% vs. 10%) to not use tape to store any data.
High availability is most commonly cited as a “must have” storage system feature. Respondents were asked to identify up to five features they would classify as “must have” when purchasing a storage system. Considering downtime tolerance windows continue to shrink, especially for tier-1 and mission-critical applications and data, it makes sense that the majority of organizations gravitate to storage systems that can deliver high availability. The fact that 41% of organizations would expect their storage systems to provide 10 Gigabit Ethernet support is not surprising given that the increasing use of server virtualization is leading many organizations to re-architect their data center networks to accommodate increased throughput requirements. Data reduction technologies such as data deduplication (37%), storage tiering (33%), and unified storage (23%) were other top must-have storage system attributes identified by respondents, especially those with at least 500 TB of disk-based storage system capacity.
TCO and service and support are what organizations look for when making product/vendor selections. The majority of organizations rely on total cost of ownership (TCO) measurements and/or service and support capabilities when evaluating storage vendors/solutions. The fact that nearly two-thirds of organizations identify TCO as an important storage selection criterion, in spite of hardware costs being one of the most commonly cited storage challenges, clearly demonstrates that organizations are willing to make the initial upfront investments in order to increase efficiency and cost savings in the long run. The majority of those organizations that consider total cost of ownership when evaluating storage vendors/solutions gravitated toward the reduced cost of storage hardware and software as the most important cost consideration factoring into TCO calculations.
Storage performance and cost are the key messages vendors can deliver. When respondents were asked about the key messages that storage vendors should emphasize, performance and cost were ranked as the top two value propositions. Considering that hardware costs are among the top storage challenges and TCO is the most commonly leveraged storage vendor/solution selection criterion, it is not surprising that users put such a premium on cost. Among those organizations that view data storage as an afterthought in terms of the role it plays in IT and business operations, cost—both CAPEX and OPEX—actually supersedes storage performance. Additionally, these organizations put a slightly higher premium on a vendor’s cloud vision.

Research Report: 2012 Storage Market Survey 8
© 2012 by The Enterprise Strategy Group, Inc. All Rights Reserved.
Introduction
Research Objectives
In order to assess the current state and future direction of the data storage technology market, ESG recently surveyed 418 North American-based IT and data storage professionals representing midmarket (100 to 999 employees) and enterprise-class (1,000 employees or more) organizations. All respondents were personally responsible for evaluating, purchasing, and managing data storage technology for their organization and were familiar with their organization’s data storage environment and/or strategy—including topics such as storage technology types in use, current storage challenges, and forward looking data storage plans.
The survey was designed to answer the following questions:
How large is a typical storage environment in terms of disk-based storage system capacity?
At what rate are organizations adding storage capacity on an annual basis?
What applications are most responsible for data storage capacity growth?
What types of disk-based storage systems do organizations use? How does this vary according to size and complexity of IT and storage environments?
How many storage administrators do organizations employ? Are they satisfied with storage-focused headcount they have in place?
How much did organizations spend on data storage technology in 2012? How do they expect that to change in 2013?
What IT initiatives will have the greatest impact on storage spending over the next 12-18 months?
What challenges do organizations face in terms of their data storage environments? Is it getting easier to manage data storage?
What kind of impact has server virtualization technology had on data storage?
How do organizations expect public cloud computing services to affect their onsite storage infrastructure and processes?
How pervasive is the adoption of solid-state storage technology?
How extensive are current solid-state storage deployments? At what rate will solid-state storage erode the footprint of hard disk drives (HDDs)?
What solid-state storage implementation types have current users deployed? What do potential adopters expect to use?
What are the future plans for tape technology? How are current tape users leveraging the technology today?
What are viewed as “must have” storage features and functions? What criteria do organizations use when evaluating storage vendors/solutions?
What is the most important message storage vendors can deliver to their customers?
Survey participants represent a wide range of industries including manufacturing, financial services, communications and media, health care, retail, government, and business services. For more details, please see the Research Methodology and Respondent Demographics sections of this report.

Research Report: 2012 Storage Market Survey 9
© 2012 by The Enterprise Strategy Group, Inc. All Rights Reserved.
Research Findings
General Storage Environments
Capacity and Infrastructure
ESG regularly conducts research on the topic of data storage, and has consistently found that IT organizations are managing large and continually growing storage environments. In fact, managing data growth was cited as a top five overall IT priority by one-quarter of those surveyed in ESG’s 2012 IT Spending Intentions Survey.1 This is significant because it reflects the opinions of general IT professionals and not just storage managers and administrators, which would seem to indicate that storage is being more broadly acknowledged as strategically important at an organization-wide level.
As shown in Figure 1, more than one-quarter (29%) of organizations have at least 500 TB of disk-based storage system capacity deployed. From a company size perspective, nearly two-thirds (63%) of midmarket organizations (i.e., 100 to 999 employees) manage less than 50 TB of total disk-based storage system capacity; conversely, more than one in five enterprises (i.e., 1,000 or more employees) have 1 PB or more deployed, while 8% of these larger organizations reported having at least 5 PB of total disk-based storage system capacity.
Figure 1. Total Disk-based Storage System Capacity, by Company Size
Source: Enterprise Strategy Group, 2012.
This data becomes more meaningful when analyzed based on the scope of onsite IT infrastructure—as measured by the number of production servers—already deployed. Indeed, there is a direct relationship between the amount of disk-based storage system capacity and the number of production servers. Figure 2 reveals that nearly two-thirds (61%) of organizations with more than 500 production servers have at least 500 TB of disk-based storage system capacity as opposed to only 11% of those with 100 or fewer production servers. When compared to storage environments from 2010, there has been a significant increase in the number of organizations with 500 TB or more
1 Source: ESG Research Report, 2012 IT Spending Intentions Survey, January 2012.
40%
23%
11% 10%
6% 8%
2% 0% 0% 0%
8% 10%
13% 16%
12%
18%
9% 7%
3% 5%
19%
14% 12%
14%
10%
14%
6% 4%
2% 3%
0%
5%
10%
15%
20%
25%
30%
35%
40%
45%
Less than 25 TB
25 TB to 49 TB
50 TB to 99 TB
100 TB to 249 TB
250 TB to 499 TB
500 TB to 999 TB
1 PB to 2.499 PB
2.5 PB to 4.999 PB
5 PB to 9.999 PB
10 PB or more
To the best of your knowledge, what is your organization’s total installed capacity associated with disk-based storage systems? (Percent of respondents)
Midmarket (100 to 999 employees, N=141) Enterprise (1,000 or more employees, N=276) Total (N=417)

Research Report: 2012 Storage Market Survey 10
© 2012 by The Enterprise Strategy Group, Inc. All Rights Reserved.
of total disk-based storage system capacity, especially in the midmarket and small enterprise segments (see Figure 3).
Figure 2. Total Installed Disk-Based Storage System Capacity, by Total Number of Production Servers
Source: Enterprise Strategy Group, 2012.
Figure 3. Percent of Organizations with Disk-based Storage System Capacity of 500 TB or More, 2010 vs. 2012
Source: Enterprise Strategy Group, 2012.
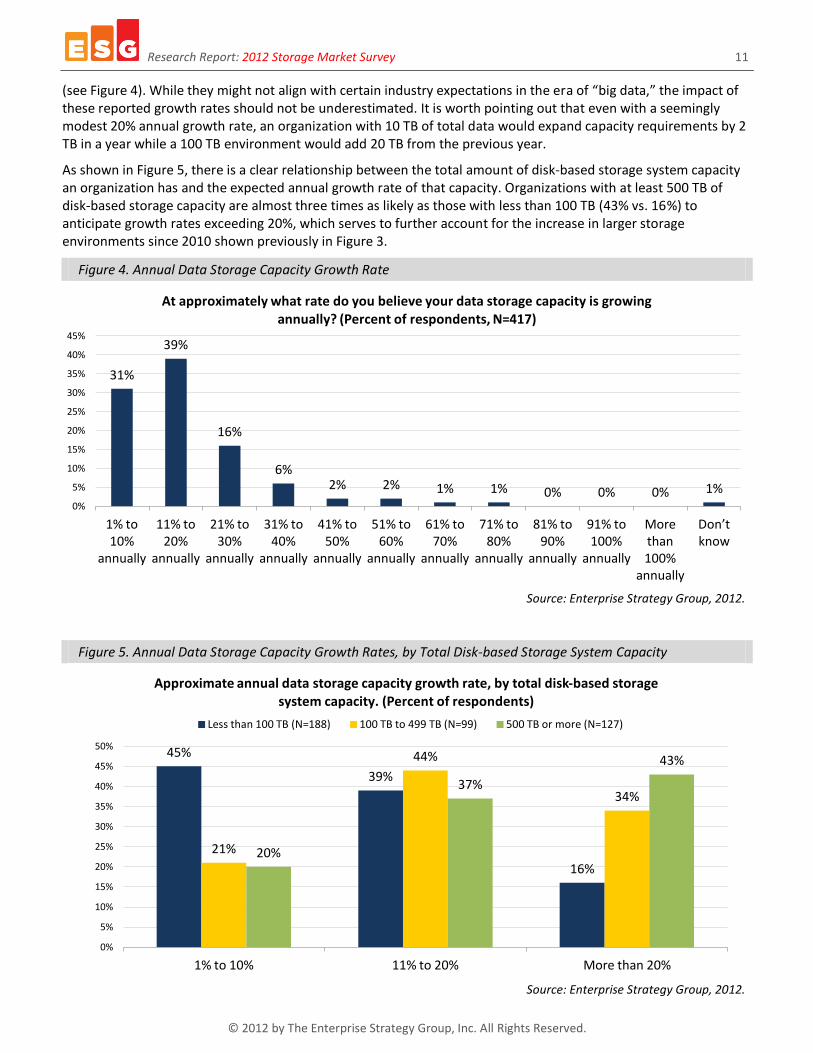
At what rate is storage capacity increasing annually to at least try to keep pace with continually growing volumes of data? ESG research found that the majority of respondents (70%) cited overall annual storage capacity growth rates in the 1%-20% range, with more than one-quarter reporting that their data is growing in excess of 20% per year
11%
33%
61%
18%
33%
23%
72%
34%
16%
0% 20% 40% 60% 80% 100%
100 or fewer production servers (N=180)
101 to 500 production servers (N=123)
More than 500 production servers (N=112)
Total installed disk-based storage system capacity, by total number of production servers. (Percent of respondents)
500 TB or more 100 TB to 499 TB Less than 100 TB
2%
9%
33%
50%
10%
24%
49%
57%
0% 10% 20% 30% 40% 50% 60%
100 to 999 employees
1,000 to 4,999 employees
5,000 to 19,999 employees
20,000 or more employees
Percent of organizations with external disk-based storage capacity of 500 TB or more, by number of employees—2010 vs. 2012. (Percent of respondents)
2012 (N=418)
2010 (N=271)
Research Report: 2012 Storage Market Survey 11
© 2012 by The Enterprise Strategy Group, Inc. All Rights Reserved.
(see Figure 4). While they might not align with certain industry expectations in the era of “big data,” the impact of these reported growth rates should not be underestimated. It is worth pointing out that even with a seemingly modest 20% annual growth rate, an organization with 10 TB of total data would expand capacity requirements by 2 TB in a year while a 100 TB environment would add 20 TB from the previous year.
As shown in Figure 5, there is a clear relationship between the total amount of disk-based storage system capacity an organization has and the expected annual growth rate of that capacity. Organizations with at least 500 TB of disk-based storage capacity are almost three times as likely as those with less than 100 TB (43% vs. 16%) to anticipate growth rates exceeding 20%, which serves to further account for the increase in larger storage environments since 2010 shown previously in Figure 3.
Figure 4. Annual Data Storage Capacity Growth Rate
Source: Enterprise Strategy Group, 2012.
Figure 5. Annual Data Storage Capacity Growth Rates, by Total Disk-based Storage System Capacity
Source: Enterprise Strategy Group, 2012.
31%
39%
16%
6% 2% 2% 1% 1% 0% 0% 0% 1%
0%
5%
10%
15%
20%
25%
30%
35%
40%
45%
1% to 10%
annually
11% to 20%
annually
21% to 30%
annually
31% to 40%
annually
41% to 50%
annually
51% to 60%
annually
61% to 70%
annually
71% to 80%
annually
81% to 90%
annually
91% to 100%
annually
More than 100%
annually
Don’t know
At approximately what rate do you believe your data storage capacity is growing annually? (Percent of respondents, N=417)
45%
39%
16%
21%
44%
34%
20%
37%
43%
0%
5%
10%
15%
20%
25%
30%
35%
40%
45%
50%
1% to 10% 11% to 20% More than 20%
Approximate annual data storage capacity growth rate, by total disk-based storage system capacity. (Percent of respondents)
Less than 100 TB (N=188) 100 TB to 499 TB (N=99) 500 TB or more (N=127)
Research Report: 2012 Storage Market Survey 12
© 2012 by The Enterprise Strategy Group, Inc. All Rights Reserved.
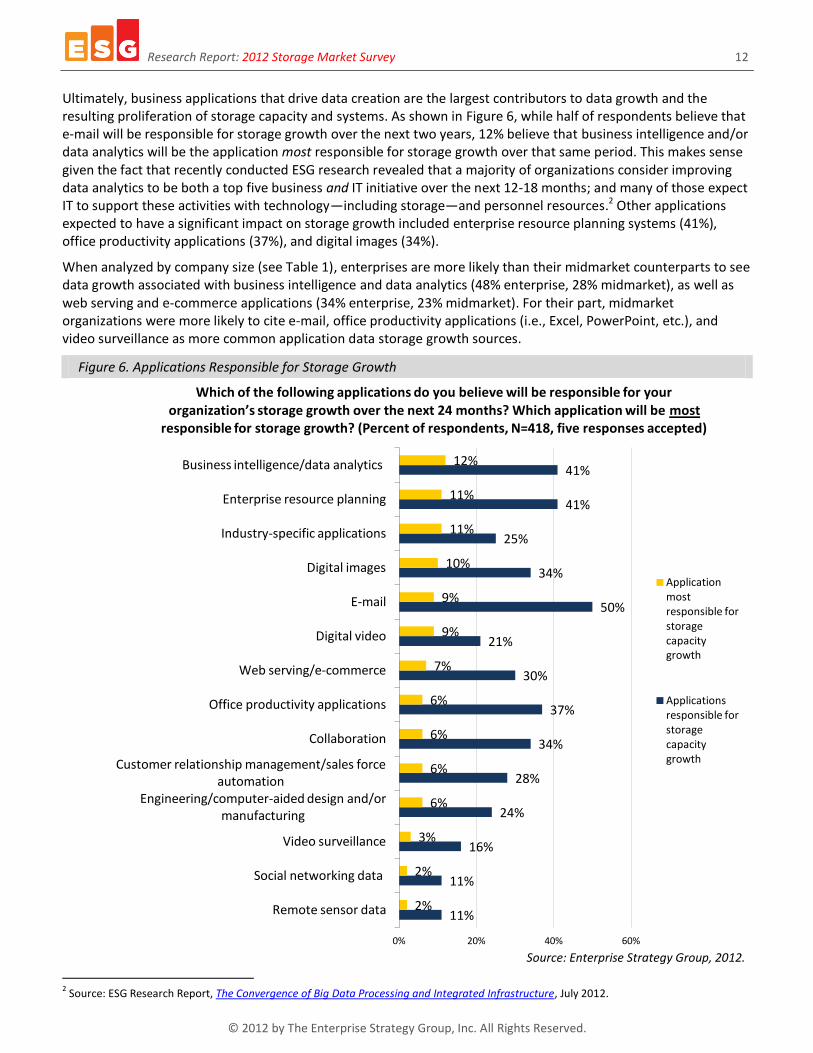
Ultimately, business applications that drive data creation are the largest contributors to data growth and the resulting proliferation of storage capacity and systems. As shown in Figure 6, while half of respondents believe that e-mail will be responsible for storage growth over the next two years, 12% believe that business intelligence and/or data analytics will be the application most responsible for storage growth over that same period. This makes sense given the fact that recently conducted ESG research revealed that a majority of organizations consider improving data analytics to be both a top five business and IT initiative over the next 12-18 months; and many of those expect IT to support these activities with technology—including storage—and personnel resources.2 Other applications expected to have a significant impact on storage growth included enterprise resource planning systems (41%), office productivity applications (37%), and digital images (34%).
When analyzed by company size (see Table 1), enterprises are more likely than their midmarket counterparts to see data growth associated with business intelligence and data analytics (48% enterprise, 28% midmarket), as well as web serving and e-commerce applications (34% enterprise, 23% midmarket). For their part, midmarket organizations were more likely to cite e-mail, office productivity applications (i.e., Excel, PowerPoint, etc.), and video surveillance as more common application data storage growth sources.
Figure 6. Applications Responsible for Storage Growth
Source: Enterprise Strategy Group, 2012.
2 Source: ESG Research Report, The Convergence of Big Data Processing and Integrated Infrastructure, July 2012.
11%
11%
16%
24%
28%
34%
37%
30%
21%
50%
34%
25%
41%
41%
2%
2%
3%
6%
6%
6%
6%
7%
9%
9%
10%
11%
11%
12%
0% 20% 40% 60%
Remote sensor data
Social networking data
Video surveillance
Engineering/computer-aided design and/or manufacturing
Customer relationship management/sales force automation
Collaboration
Office productivity applications
Web serving/e-commerce
Digital video
Digital images
Industry-specific applications
Enterprise resource planning
Business intelligence/data analytics
Which of the following applications do you believe will be responsible for your organization’s storage growth over the next 24 months? Which application will be most
responsible for storage growth? (Percent of respondents, N=418, five responses accepted)
Application most responsible for storage capacity growth
Applications responsible for storage capacity growth
Research Report: 2012 Storage Market Survey 13
© 2012 by The Enterprise Strategy Group, Inc. All Rights Reserved.
Table 1. Applications Responsible for Storage Growth, by Company Size
Which of the following applications do you believe will be responsible for your organization’s storage growth over the next 24 months?
Midmarket (100 to 999
employees, N=141) Enterprise (1,000 or more
employees, N=277)
Business intelligence/data analytics 28% 48%
E-mail 58% 46%
Web serving/e-commerce 23% 34%
Office productivity applications 42% 34%
Video surveillance 20% 14%
Source: Enterprise Strategy Group, 2012.
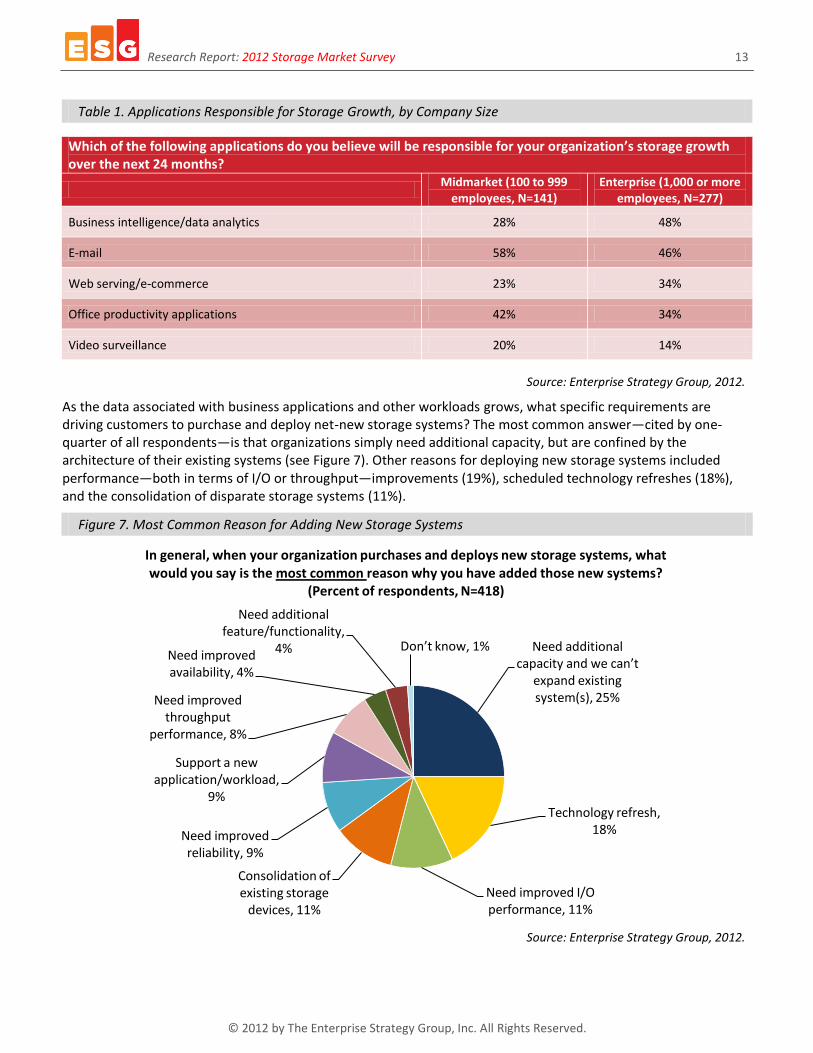
As the data associated with business applications and other workloads grows, what specific requirements are driving customers to purchase and deploy net-new storage systems? The most common answer—cited by one-quarter of all respondents—is that organizations simply need additional capacity, but are confined by the architecture of their existing systems (see Figure 7). Other reasons for deploying new storage systems included performance—both in terms of I/O or throughput—improvements (19%), scheduled technology refreshes (18%), and the consolidation of disparate storage systems (11%).
Figure 7. Most Common Reason for Adding New Storage Systems
Source: Enterprise Strategy Group, 2012.
Need additional capacity and we can’t
expand existing system(s), 25%
Technology refresh, 18%
Need improved I/O performance, 11%
Consolidation of existing storage
devices, 11%
Need improved reliability, 9%
Support a new application/workload,
9%
Need improved throughput
performance, 8%
Need improved availability, 4%
Need additional feature/functionality,
4% Don’t know, 1%
In general, when your organization purchases and deploys new storage systems, what would you say is the most common reason why you have added those new systems?
(Percent of respondents, N=418)

Research Report: 2012 Storage Market Survey 14
© 2012 by The Enterprise Strategy Group, Inc. All Rights Reserved.
There is a wide array of data storage system options with various features and performance capabilities available to support the needs of IT environments. While the focus of a lot of industry commentary concerns the various forms of networked storage, Figure 8 reveals that the majority of users still leverage internal server storage (82%) and/or direct-attached storage (57%). Of course, the former comes as part of a delivered system, so its existence doesn’t automatically equate to its use or value. Indeed, when all the various forms of networked (i.e., shared or at least shareable) storage are added together, nearly two-thirds (64%) of users attest to such an approach as their primary disk-based storage technology, as measured by percentage of total disk-based capacity. This makes sense, given the benefits of shared access to data across systems and applications that networked storage invariably delivers, together with the improved utilization rates that tend to follow more of a pooled approach. It is worth noting that 54% of all respondent organizations use Fibre Channel SAN-based systems to some extent, with 22% singling it out as their primary storage infrastructure. What this says simply is that—relative to all other disk-based storage options—those organizations using Fibre Channel SAN technology were more likely to recognize it as their most widely deployed storage platform.
Figure 8. All Disk-based Storage Technologies in Use
Source: Enterprise Strategy Group, 2012.
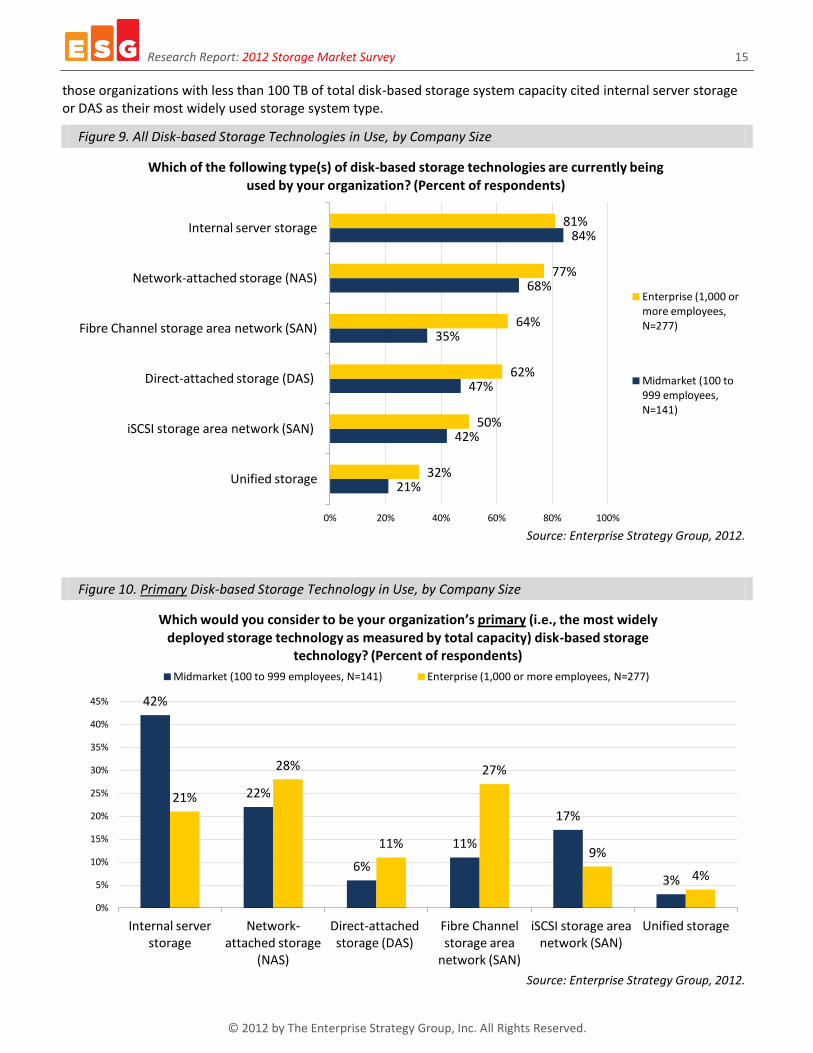
When viewed by company size—whether measured by the number of employees or total disk-based storage system capacity—some interesting trends emerge (see Figure 9 and Figure 11). The first obvious takeaway is that larger organizations are more likely to have each of the various storage options deployed, which is likely a function of more diversified environments—either by design, ability, and/or acquisition—in terms of applications and data with varying underlying storage system requirements. Looking at all of the storage system types that organizations have in place, internal server storage is still the most commonly deployed storage type regardless of company size, and usage does not vary much between large and small organizations; however, there is a significant difference in Fibre Channel SAN usage. Specifically, nearly two-thirds (64%) of enterprise organizations have Fibre Channel SAN technology implemented compared to only 35% of their midmarket counterparts; likewise, more than two-thirds (68%) of organizations with more than 500 TB of disk-based storage capacity are Fibre Channel SAN users as opposed to only 41% of those with less than 100 TB. According to Figure 10 and Figure 12, in terms of the depth of usage, smaller organizations are significantly more likely to report that the largest portion of their overall storage capacity is provided by internal server storage or DAS. Indeed, nearly half (48%) of midmarket respondents identified these “non-networked” options as their organization’s primary storage infrastructure; similarly, 48% of
28%
47%
54%
57%
74%
82%
4%
12%
22%
9%
26%
28%
0% 20% 40% 60% 80% 100%
Unified storage
iSCSI storage area network (SAN)
Fibre Channel storage area network (SAN)
Direct-attached storage (DAS)
Network-attached storage (NAS)
Internal server storage
Which of the following type(s) of disk-based storage technologies are currently being used by your organization? Which would you consider to be your organization’s primary
disk-based storage technology? (Percent of respondents, N=418)
Primary disk-based storage technology
All disk-based storage technologies
Research Report: 2012 Storage Market Survey 15
© 2012 by The Enterprise Strategy Group, Inc. All Rights Reserved.
those organizations with less than 100 TB of total disk-based storage system capacity cited internal server storage or DAS as their most widely used storage system type.
Figure 9. All Disk-based Storage Technologies in Use, by Company Size
Source: Enterprise Strategy Group, 2012.
Figure 10. Primary Disk-based Storage Technology in Use, by Company Size
Source: Enterprise Strategy Group, 2012.
21%
42%
47%
35%
68%
84%
32%
50%
62%
64%
77%
81%
0% 20% 40% 60% 80% 100%
Unified storage
iSCSI storage area network (SAN)
Direct-attached storage (DAS)
Fibre Channel storage area network (SAN)
Network-attached storage (NAS)
Internal server storage
Which of the following type(s) of disk-based storage technologies are currently being used by your organization? (Percent of respondents)
Enterprise (1,000 or more employees, N=277)
Midmarket (100 to 999 employees, N=141)
42%
22%
6%
11%
17%
3%
21%
28%
11%
27%
9%
4%
0%
5%
10%
15%
20%
25%
30%
35%
40%
45%
Internal server storage
Network-attached storage
(NAS)
Direct-attached storage (DAS)
Fibre Channel storage area
network (SAN)
iSCSI storage area network (SAN)
Unified storage
Which would you consider to be your organization’s primary (i.e., the most widely deployed storage technology as measured by total capacity) disk-based storage
technology? (Percent of respondents)
Midmarket (100 to 999 employees, N=141) Enterprise (1,000 or more employees, N=277)

Research Report: 2012 Storage Market Survey 16
© 2012 by The Enterprise Strategy Group, Inc. All Rights Reserved.
Figure 11. All Disk-based Storage Technologies in Use, by Total Disk-based Storage System Capacity
Source: Enterprise Strategy Group, 2012.
Figure 12. Primary Disk-based Storage Technology in Use, by Total Disk-based Storage System Capacity
Source: Enterprise Strategy Group, 2012.
21%
40%
53%
41%
72%
85%
24%
49%
56%
62%
69%
76%
43%
56%
64%
68%
80%
80%
0% 20% 40% 60% 80% 100%
Unified storage
iSCSI storage area network (SAN)
Direct-attached storage (DAS)
Fibre Channel storage area network (SAN)
Network-attached storage (NAS)
Internal server storage
Type(s) of disk-based storage technologies currently being used, by total disk-based storage system capacity. (Percent of respondents)
500 TB or more (N=128)
100 TB to 499 TB (N=99)
Less than 100 TB (N=190)
39%
9%
21%
16% 13%
2%
22%
11%
22%
29%
11%
4%
16%
9%
38%
23%
10%
5%
0%
5%
10%
15%
20%
25%
30%
35%
40%
45%
Internal server storage
Direct-attached storage (DAS)
Network-attached storage
(NAS)
Fibre Channel storage area
network (SAN)
iSCSI storage area network (SAN)
Unified storage
Primary disk-based storage technology currently being used, by total disk-based storage system capacity. (Percent of respondents)
Less than 100 TB (N=190) 100 TB to 499 TB (N=99) 500 TB or more (N=128)
Research Report: 2012 Storage Market Survey 17
© 2012 by The Enterprise Strategy Group, Inc. All Rights Reserved.
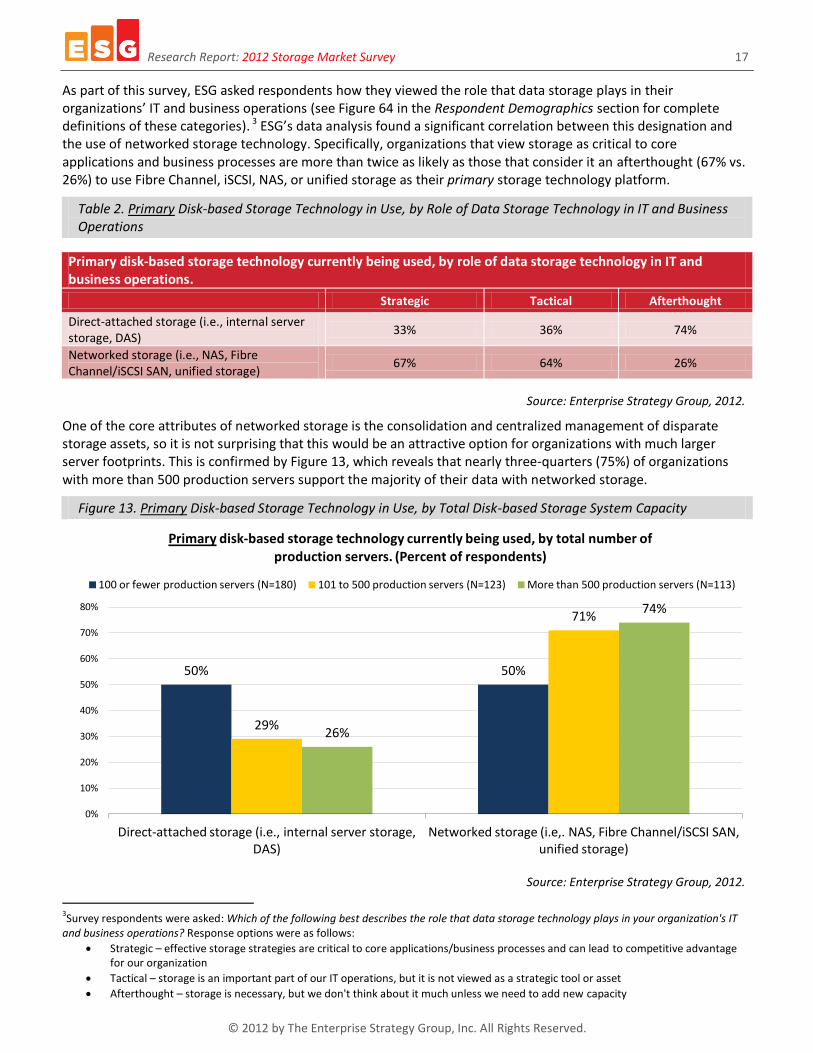
As part of this survey, ESG asked respondents how they viewed the role that data storage plays in their organizations’ IT and business operations (see Figure 64 in the Respondent Demographics section for complete definitions of these categories). 3 ESG’s data analysis found a significant correlation between this designation and the use of networked storage technology. Specifically, organizations that view storage as critical to core applications and business processes are more than twice as likely as those that consider it an afterthought (67% vs. 26%) to use Fibre Channel, iSCSI, NAS, or unified storage as their primary storage technology platform.
Table 2. Primary Disk-based Storage Technology in Use, by Role of Data Storage Technology in IT and Business Operations
Primary disk-based storage technology currently being used, by role of data storage technology in IT and business operations.
Strategic Tactical Afterthought
Direct-attached storage (i.e., internal server storage, DAS)
33% 36% 74%
Networked storage (i.e., NAS, Fibre Channel/iSCSI SAN, unified storage)
67% 64% 26%
Source: Enterprise Strategy Group, 2012.
One of the core attributes of networked storage is the consolidation and centralized management of disparate storage assets, so it is not surprising that this would be an attractive option for organizations with much larger server footprints. This is confirmed by Figure 13, which reveals that nearly three-quarters (75%) of organizations with more than 500 production servers support the majority of their data with networked storage.
Figure 13. Primary Disk-based Storage Technology in Use, by Total Disk-based Storage System Capacity
Source: Enterprise Strategy Group, 2012.
3Survey respondents were asked: Which of the following best describes the role that data storage technology plays in your organization's IT
and business operations? Response options were as follows:
Strategic – effective storage strategies are critical to core applications/business processes and can lead to competitive advantage for our organization
Tactical – storage is an important part of our IT operations, but it is not viewed as a strategic tool or asset
Afterthought – storage is necessary, but we don't think about it much unless we need to add new capacity
50% 50%
29%
71%
26%
74%
0%
10%
20%
30%
40%
50%
60%
70%
80%
Direct-attached storage (i.e., internal server storage, DAS)
Networked storage (i.e,. NAS, Fibre Channel/iSCSI SAN, unified storage)
Primary disk-based storage technology currently being used, by total number of production servers. (Percent of respondents)
100 or fewer production servers (N=180) 101 to 500 production servers (N=123) More than 500 production servers (N=113)
Research Report: 2012 Storage Market Survey 18
© 2012 by The Enterprise Strategy Group, Inc. All Rights Reserved.
In addition to simplifying management tasks, networked storage can serve to improve hardware utilization rates by presenting all available resources across a full range of applications and their host servers as a “pool” of available capacity. Storage features and functions—such as snapshots, automated provisioning, replication, etc.—can also be uniform across much of the storage pool and this, combined with the better utilization rates, can make networked storage financially attractive. It follows then that organizations citing networked storage as their primary disk-based storage technology deployed in their IT environments have an overall storage hardware utilization rate of 60% compared to only 53% among those relying predominantly on internal server storage or DAS systems (see Table 3).
Table 3. Overall Storage Hardware Utilization Rates Are Higher among Organizations Citing Networked Storage as Their Primary Disk-based Storage Technology
To the best of your knowledge, what is your organization’s overall storage hardware utilization rate?
Organizations citing direct-attached storage (i.e., internal server storage, DAS) as their primary disk-based storage
technology
Organizations citing networked storage (i.e., NAS, Fibre Channel/iSCSI SAN, unified storage) as their primary disk-
based storage technology
53% 60%
Source: Enterprise Strategy Group, 2012.
Larger Storage Environments Translate to More Storage Administrators
With large and continually-growing data storage environments, storage management tasks can become increasingly cumbersome and resource-intensive, even with feature-rich and highly scalable storage solutions. As such, it makes sense that 44% of respondents report that their organizations have at least four full-time equivalents (FTEs) performing administrative storage duties (see Figure 14). More than one-quarter (29%) of respondents have at least five storage FTEs. Viewing the data based on the number of employees an organization has reveals significant—but not surprising—differences between enterprise and midmarket organizations. Specifically, more than three-quarters (77%) of midmarket organizations have three storage FTEs or fewer; conversely, 59% of their enterprise counterparts have at least four dedicated administrators in place to manage their storage environments.
Figure 14. Number of Storage Administrators, by Company Size
Source: Enterprise Strategy Group, 2012.
31% 33%
13% 11%
4% 2% 1%
5% 6%
17% 17% 17% 16%
12% 14%
2%
15%
22%
16% 15%
11% 8%
10%
3%
0%
5%
10%
15%
20%
25%
30%
35%
1 FTE 2 FTEs 3 FTEs 4 FTEs 5 FTEs 6 to 10 FTEs More than 10 FTEs
Don’t know
Approximately how many administrators (measured in FTEs – full-time equivalents) are responsible for managing your organization’s data storage environment? (Percent of
respondents)
Midmarket (100 to 999 employees, N=141) Enterprise (1,000 or more employees, N=277) Total (N=418)

Research Report: 2012 Storage Market Survey 19
© 2012 by The Enterprise Strategy Group, Inc. All Rights Reserved.
This data becomes more meaningful when analyzed from the perspective of both storage environment size and strategic relevance. Not surprisingly, there is a direct correlation between the number of storage FTEs an organization has and the amount of disk-based capacity requiring management. Indeed, more than one-third (38%) of organizations with at least 500 TB of disk-based storage system capacity employ six or more administrators to manage these environments. On the other hand, nearly three-quarters (73%) of those organizations with disk-based storage footprints of less than 100 TB have three or fewer storage FTEs (see Figure 15). While organizations that place a greater emphasis on storage technology are much more likely to have more advanced storage systems deployed in their environments (as seen in Table 2), it is also important to consider the human element. Indeed, organizations that consider storage to be strategic to IT and business operations are more than twice as likely as those that view storage more tactically (27% vs. 10%) to have six or more FTEs focused on storage management activities (see Figure 16).
Figure 15. Number of Storage Administrators, by Total Disk-based Storage System Capacity
Source: Enterprise Strategy Group, 2012.
Figure 16. Number of Storage Administrators, by Role of Data Storage Technology in IT and Business Operations
Source: Enterprise Strategy Group, 2012.
9%
11%
38%
5%
14%
20%
13%
21%
15%
15%
17%
16%
30%
27%
10%
28%
9%
1%
0% 10% 20% 30% 40% 50% 60% 70% 80% 90% 100%
Less than 100 TB (N=182)
100 TB to 499 TB (N=98)
500 TB or more (N=124)
Number of administrators (measured in FTEs) responsible for managing data storage environments, by total disk-based storage system capacity. (Percent of respondents)
6 or more FTEs 5 FTEs 4 FTEs 3 FTEs 2 FTEs 1 FTE
10%
27%
5%
13%
12%
10%
19%
13%
10%
15%
19%
25%
29%
18%
50%
15%
11%
0% 20% 40% 60% 80% 100%
Afterthought – storage is necessary but we don't think about it much unless we need to add new capacity
(N=20)
Tactical – storage is an important part of our IT operations but it is not viewed as a strategic tool or
asset (N=172)
Strategic – effective storage strategies are critical to core applications/business processes and can lead to competitive advantage for our organization (N=205)
Number of administrators (measured in FTEs) responsible for managing data storage environments, by role of data storage technology in IT and business operations. (Percent of
respondents)
6 or more FTEs 5 FTEs 4 FTEs 3 FTEs 2 FTEs 1 FTE
Research Report: 2012 Storage Market Survey 20
© 2012 by The Enterprise Strategy Group, Inc. All Rights Reserved.
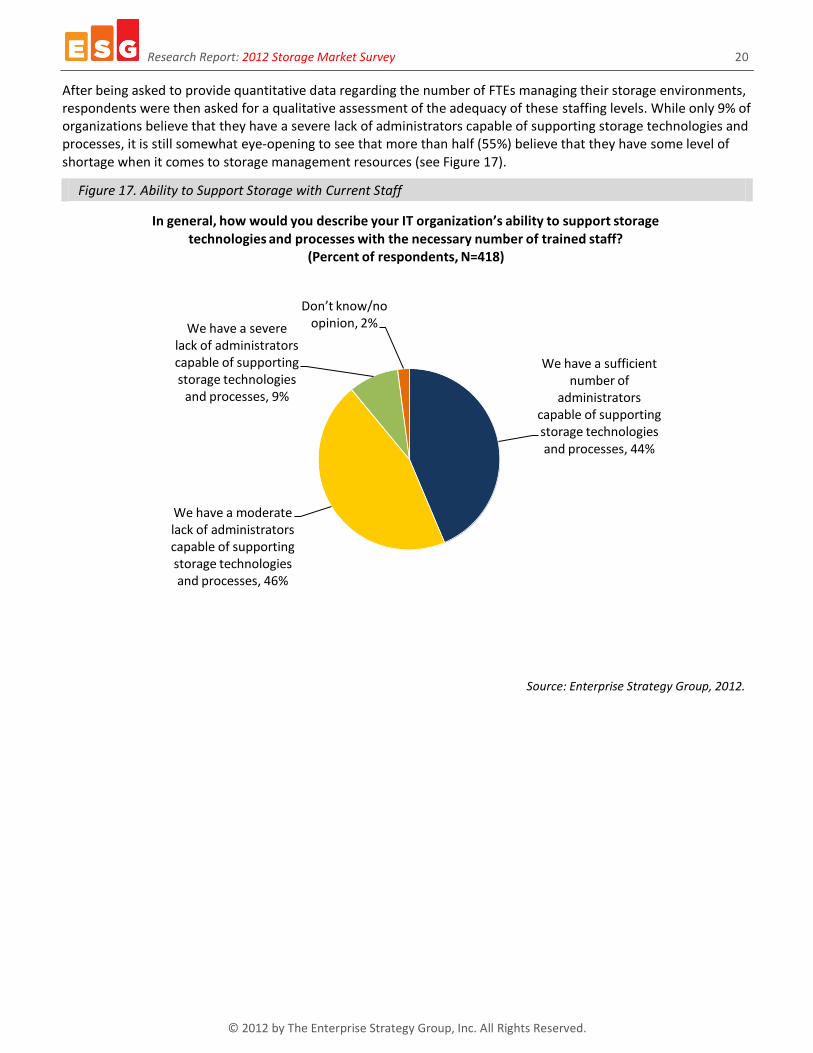
After being asked to provide quantitative data regarding the number of FTEs managing their storage environments, respondents were then asked for a qualitative assessment of the adequacy of these staffing levels. While only 9% of organizations believe that they have a severe lack of administrators capable of supporting storage technologies and processes, it is still somewhat eye-opening to see that more than half (55%) believe that they have some level of shortage when it comes to storage management resources (see Figure 17).
Figure 17. Ability to Support Storage with Current Staff
Source: Enterprise Strategy Group, 2012.
We have a sufficient number of
administrators capable of supporting storage technologies and processes, 44%
We have a moderate lack of administrators capable of supporting storage technologies and processes, 46%
We have a severe lack of administrators capable of supporting storage technologies
and processes, 9%
Don’t know/no opinion, 2%
In general, how would you describe your IT organization’s ability to support storage technologies and processes with the necessary number of trained staff?
(Percent of respondents, N=418)

Research Report: 2012 Storage Market Survey 21
© 2012 by The Enterprise Strategy Group, Inc. All Rights Reserved.
Storage Spending Trends
What Organizations Spent in 2012…
Respondents were asked about their organizations’ total 2012 budget for storage-related capital expenditures for any hardware, software, and/or services purchased over the course of the year. More than three-quarters (79%) of midmarket organizations reported spending less than $1 million on storage technology (see Figure 18). Conversely, nearly two-thirds (64%) of enterprise organizations allocated more than $1 million to storage-related investments in 2012, with one-quarter allotting at least $10 million for storage CAPEX.
Figure 18. 2012 Storage Budget Levels, by Company Size
Source: Enterprise Strategy Group, 2012.
Not surprisingly, there is a strong correlation between the amount of money an organization spent on storage hardware, software, and service in 2012 and the total amount of disk-based storage system capacity it has deployed. According to Figure 19, organizations with at least 500 TB of total disk-based storage system capacity were more than six times as likely as those with less than 100 TB (52% vs. 8%) to have allocated $5 million or more for storage-related capital expenditures. On the flip side, more than three-quarters (77%) of organizations with a disk-based storage footprint of less than 100 TB did not exceed the $1 million threshold in terms of their 2012 storage spending.
The role that data storage technology plays in an organization’s IT and business operations is also a good indicator of storage budget levels. One-third of respondents that believe effective storage strategies are critical to core applications/business processes and can lead to competitive advantage for their organization reported making investments of at least $5 million in storage technology in 2012 (see Figure 20). Of the organizations that consider storage to be necessary but don't think about it unless they need to add new capacity, 94% spent less than $1 million.
79%
12% 6%
1% 0% 0% 0% 2%
33% 27%
13% 10% 6% 6% 3% 3%
0%
10%
20%
30%
40%
50%
60%
70%
80%
90%
Less than $1 million
$1 million to $4.999 million
$5 million to $9.999 million
$10 million to $24.999
million
$25 million to $49.999
million
$50 million to $99.999
million
$100 million or more
Don’t know
To the best of your knowledge, what is your organization’s total 2012 budget for all storage-related capital expenditures (including hardware, software, and services)?
(Percent of respondents)
Midmarket (100 to 999 employees, N=126) Enterprise (1,000 or more employees, N=235)

Research Report: 2012 Storage Market Survey 22
© 2012 by The Enterprise Strategy Group, Inc. All Rights Reserved.
Figure 19. 2012 Storage Budget Levels, by Total Installed Disk-Based Storage System Capacity
Source: Enterprise Strategy Group, 2012.
Figure 20. 2012 Storage Budget Levels, by Role of Data Storage Technology in IT and Business Operations
Source: Enterprise Strategy Group, 2012.
8%
34%
52%
16%
24%
33%
77%
43%
15%
0% 10% 20% 30% 40% 50% 60% 70% 80% 90% 100%
Less than 100 TB (N=166)
100 TB to 499 TB (N=80)
500 TB or more (N=100)
Total 2012 budget for all storage-related capital expenditures (including hardware, software, and services), by total installed disk-based storage system capacity.
(Percent of respondents)
$5 million or more $1 million to $4.999 million Less than $1 million
6%
24%
33%
24%
23%
94%
52%
44%
0% 20% 40% 60% 80% 100%
Afterthought – storage is necessary but we don't think about it much unless we need to add new capacity
(N=17)
Tactical – storage is an important part of our IT operations but it is not viewed as a strategic tool or
asset (N=152)
Strategic – effective storage strategies are critical to core applications/business processes and can lead to competitive advantage for our organization (N=176)
Total 2012 budget for all storage-related capital expenditures (including hardware, software, and services), by role of data storage technology in IT and business
operations. (Percent of respondents)
$5 million or more $1 million to $4.999 million Less than $1 million

Research Report: 2012 Storage Market Survey 23
© 2012 by The Enterprise Strategy Group, Inc. All Rights Reserved.
…And What They Expect to Spend in 2013
What is the outlook for 2013 storage budgets? Figure 21 reveals that 59% of respondents expect to see an increase in 2013 storage spending relative to 2012 levels. Those organizations planning to increase storage spending project an estimated average year-over-year budget increase of 5.41%, while ESG’s respondent base as a whole (i.e., organizations with increasing, flat, or declining storage budgets) expects an estimated average spending increase of 2.89% in 2013. A mere 6% expect to decrease their 2013 storage budgets, but not a single organization expects those cuts to exceed 10%. It is also worth noting that 2% of organizations had not begun their 2013 storage planning at the time of the survey.
Figure 21. Expected 2013 Storage Budget Levels
Source: Enterprise Strategy Group, 2012.
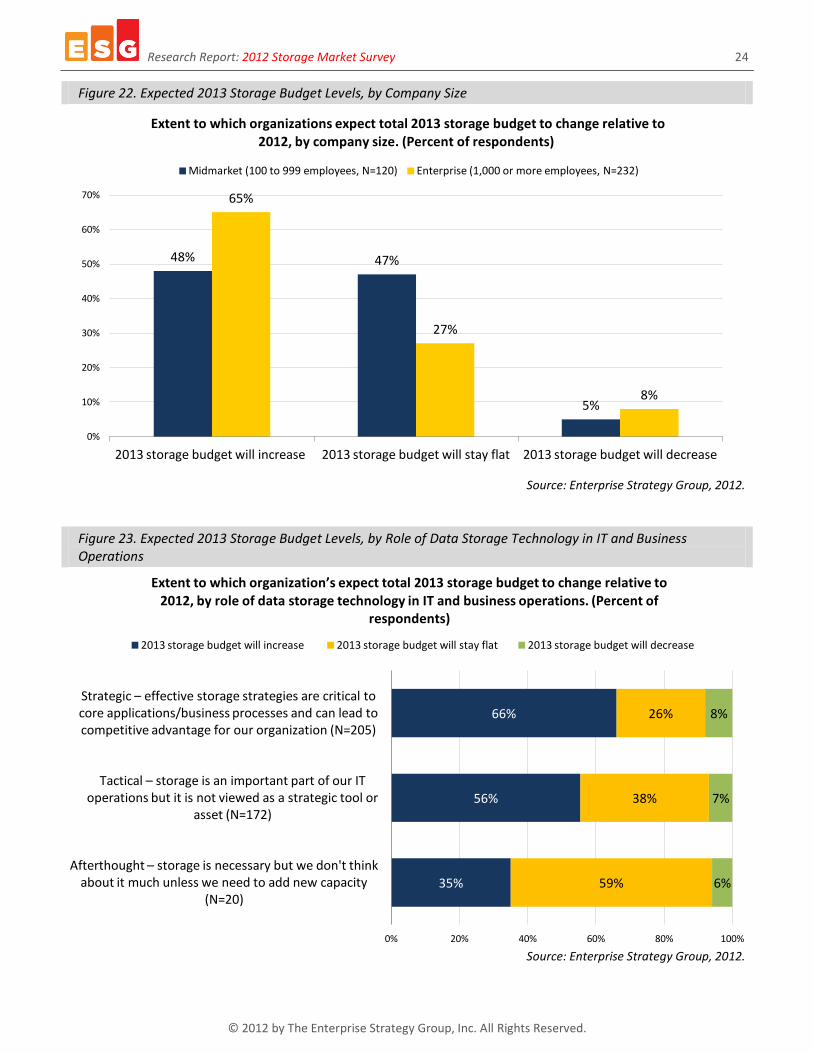
Nearly two-thirds (65%) of enterprise-class organizations expect to increase their 2013 storage spending levels compared to 48% of midmarket respondents (see Figure 22). Midmarket organizations, for their part, are more likely to hold the line, with nearly half (47%) reporting that 2013 storage budgets will remain flat relative to 2012. Overall, ESG estimates that the average expected net change in 2013 storage spending is 2.82% for midmarket organizations and 2.93% for enterprises.
According to Figure 23, organizations that consider data storage to be strategic to IT and business operations were nearly twice as likely as those characterizing the technology as an afterthought to be increasing 2013 storage budgets (66% vs. 35%). Overall, ESG estimates that organizations that view data storage technology as being strategic, tactical, or an afterthought will see a net year-over-year storage spending increase (2.82%, 2.53%, and 1.09%, respectively).
1%
14% 16%
12% 15%
33%
2% 2% 1% 1% 0% 2%
0%
5%
10%
15%
20%
25%
30%
35%
Increase more
than 10%
Increase 8% to 10%
Increase 5% to 7%
Increase 3% to 4%
Increase 1% to 2%
Stay flat Decrease 1% to 2%
Decrease 3% to 4%
Decrease 5% to 7%
Decrease 8% to 10%
Decrease more
than 10%
We have not
begun our
storage planning for 2013
at this point
At this point, to what extent do you believe your organization’s total 2013 storage budget will change relative to 2012? (Percent of respondents, N=361)
Research Report: 2012 Storage Market Survey 24
© 2012 by The Enterprise Strategy Group, Inc. All Rights Reserved.
Figure 22. Expected 2013 Storage Budget Levels, by Company Size
Source: Enterprise Strategy Group, 2012.
Figure 23. Expected 2013 Storage Budget Levels, by Role of Data Storage Technology in IT and Business Operations
Source: Enterprise Strategy Group, 2012.
48% 47%
5%
65%
27%
8%
0%
10%
20%
30%
40%
50%
60%
70%
2013 storage budget will increase 2013 storage budget will stay flat 2013 storage budget will decrease
Extent to which organizations expect total 2013 storage budget to change relative to 2012, by company size. (Percent of respondents)
Midmarket (100 to 999 employees, N=120) Enterprise (1,000 or more employees, N=232)
35%
56%
66%
59%
38%
26%
6%
7%
8%
0% 20% 40% 60% 80% 100%
Afterthought – storage is necessary but we don't think about it much unless we need to add new capacity
(N=20)
Tactical – storage is an important part of our IT operations but it is not viewed as a strategic tool or
asset (N=172)
Strategic – effective storage strategies are critical to core applications/business processes and can lead to competitive advantage for our organization (N=205)
Extent to which organization’s expect total 2013 storage budget to change relative to 2012, by role of data storage technology in IT and business operations. (Percent of
respondents)
2013 storage budget will increase 2013 storage budget will stay flat 2013 storage budget will decrease
Research Report: 2012 Storage Market Survey 25
© 2012 by The Enterprise Strategy Group, Inc. All Rights Reserved.
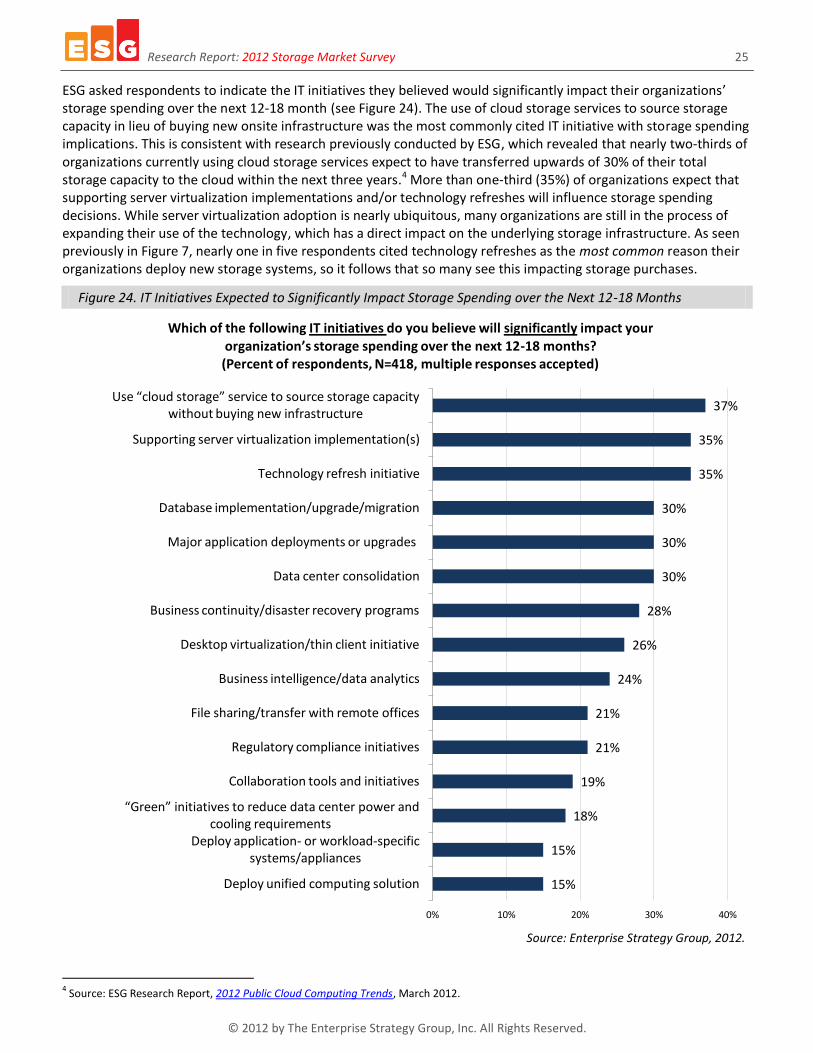
ESG asked respondents to indicate the IT initiatives they believed would significantly impact their organizations’ storage spending over the next 12-18 month (see Figure 24). The use of cloud storage services to source storage capacity in lieu of buying new onsite infrastructure was the most commonly cited IT initiative with storage spending implications. This is consistent with research previously conducted by ESG, which revealed that nearly two-thirds of organizations currently using cloud storage services expect to have transferred upwards of 30% of their total storage capacity to the cloud within the next three years.4 More than one-third (35%) of organizations expect that supporting server virtualization implementations and/or technology refreshes will influence storage spending decisions. While server virtualization adoption is nearly ubiquitous, many organizations are still in the process of expanding their use of the technology, which has a direct impact on the underlying storage infrastructure. As seen previously in Figure 7, nearly one in five respondents cited technology refreshes as the most common reason their organizations deploy new storage systems, so it follows that so many see this impacting storage purchases.
Figure 24. IT Initiatives Expected to Significantly Impact Storage Spending over the Next 12-18 Months
Source: Enterprise Strategy Group, 2012.
4 Source: ESG Research Report, 2012 Public Cloud Computing Trends, March 2012.
15%
15%
18%
19%
21%
21%
24%
26%
28%
30%
30%
30%
35%
35%
37%
0% 10% 20% 30% 40%
Deploy unified computing solution
Deploy application- or workload-specific systems/appliances
“Green” initiatives to reduce data center power and cooling requirements
Collaboration tools and initiatives
Regulatory compliance initiatives
File sharing/transfer with remote offices
Business intelligence/data analytics
Desktop virtualization/thin client initiative
Business continuity/disaster recovery programs
Data center consolidation
Major application deployments or upgrades
Database implementation/upgrade/migration
Technology refresh initiative
Supporting server virtualization implementation(s)
Use “cloud storage” service to source storage capacity without buying new infrastructure
Which of the following IT initiatives do you believe will significantly impact your organization’s storage spending over the next 12-18 months? (Percent of respondents, N=418, multiple responses accepted)
Research Report: 2012 Storage Market Survey 26
© 2012 by The Enterprise Strategy Group, Inc. All Rights Reserved.
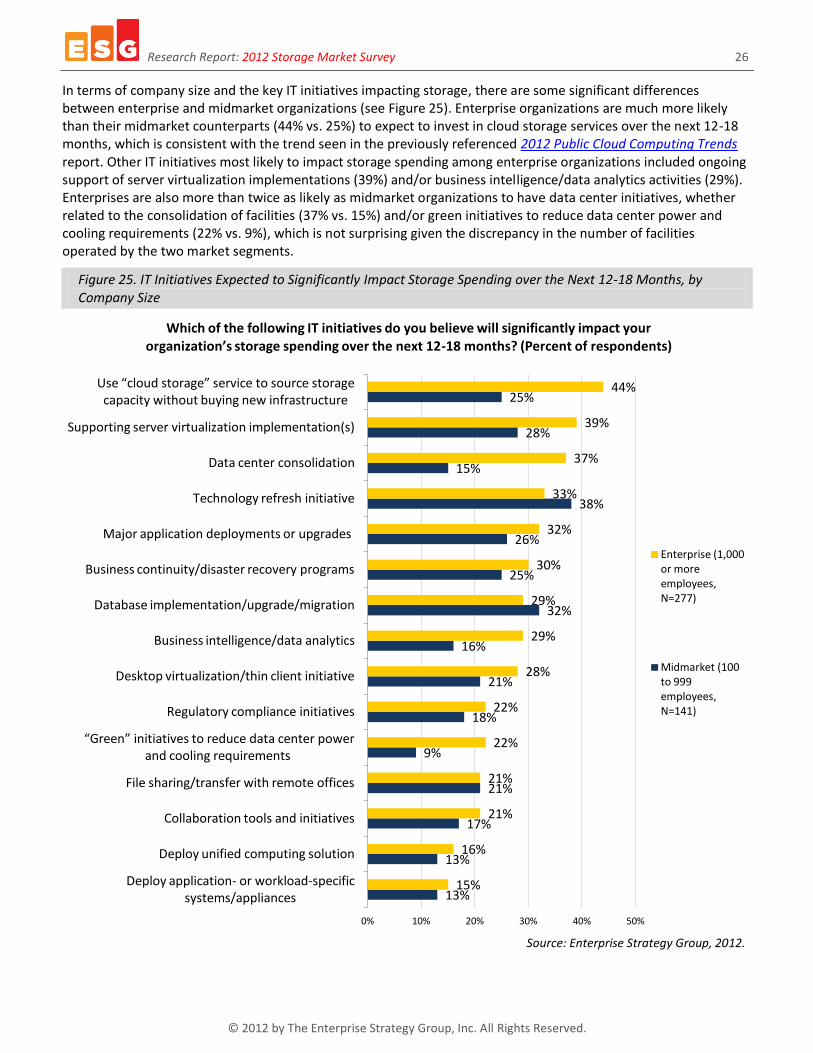
In terms of company size and the key IT initiatives impacting storage, there are some significant differences between enterprise and midmarket organizations (see Figure 25). Enterprise organizations are much more likely than their midmarket counterparts (44% vs. 25%) to expect to invest in cloud storage services over the next 12-18 months, which is consistent with the trend seen in the previously referenced 2012 Public Cloud Computing Trends report. Other IT initiatives most likely to impact storage spending among enterprise organizations included ongoing support of server virtualization implementations (39%) and/or business intelligence/data analytics activities (29%). Enterprises are also more than twice as likely as midmarket organizations to have data center initiatives, whether related to the consolidation of facilities (37% vs. 15%) and/or green initiatives to reduce data center power and cooling requirements (22% vs. 9%), which is not surprising given the discrepancy in the number of facilities operated by the two market segments.
Figure 25. IT Initiatives Expected to Significantly Impact Storage Spending over the Next 12-18 Months, by Company Size
Source: Enterprise Strategy Group, 2012.
13%
13%
17%
21%
9%
18%
21%
16%
32%
25%
26%
38%
15%
28%
25%
15%
16%
21%
21%
22%
22%
28%
29%
29%
30%
32%
33%
37%
39%
44%
0% 10% 20% 30% 40% 50%
Deploy application- or workload-specific systems/appliances
Deploy unified computing solution
Collaboration tools and initiatives
File sharing/transfer with remote offices
“Green” initiatives to reduce data center power and cooling requirements
Regulatory compliance initiatives
Desktop virtualization/thin client initiative
Business intelligence/data analytics
Database implementation/upgrade/migration
Business continuity/disaster recovery programs
Major application deployments or upgrades
Technology refresh initiative
Data center consolidation
Supporting server virtualization implementation(s)
Use “cloud storage” service to source storage capacity without buying new infrastructure
Which of the following IT initiatives do you believe will significantly impact your organization’s storage spending over the next 12-18 months? (Percent of respondents)
Enterprise (1,000 or more employees, N=277)
Midmarket (100 to 999 employees, N=141)

Research Report: 2012 Storage Market Survey 27
© 2012 by The Enterprise Strategy Group, Inc. All Rights Reserved.
Storage Challenges
Overall, it would appear that respondents believe that storage is getting easier to manage. Indeed, when asked to assess the process of managing data storage technology, more than half (57%) of survey respondents indicated that it has actually become easier over the last five years (see Figure 26). This finding is not as mundane as it may at first appear: Although technology improvements are designed to make IT tasks easier, they are often outpaced by the growing complexity and demands of an organization’s IT infrastructure. For example, in a separate ESG survey5 of over 300 IT security professionals, only 5% said that their job has become any easier over time.
Figure 26. The Progression of Managing Data Storage Technology
Source: Enterprise Strategy Group, 2012.
ESG asked respondents to identify their organizations’ biggest challenges pertaining to their storage environments. As shown in Figure 27, respondents clearly acknowledge a wide variety of ongoing challenges based on the fact that every one of the issues provided as an option was cited by at least one respondent organization as their primary challenge. Cost is clearly a key consideration for IT organizations, with more than half citing capital expense (i.e., hardware) and/or operational expense (largely staff) as a storage challenge. Additionally, 15% of organizations cited cost as their primary challenge, whether related to CAPEX (10%) or OPEX (5%). The rapid growth—and subsequent management—of unstructured data was also identified as a challenge by 40% of all respondents, with 15% singling it out as their primary challenge.
In terms of discrepancies regarding storage challenges based on company size, midmarket organizations were more likely to call out the rapid growth and management of unstructured data, data protection, and running out of physical space as their top storage challenges (see Table 4). The fact that midmarket organizations are more concerned with their data protection strategies is consistent with previously conducted ESG research that revealed improved backup and recovery as the top overall IT priority for midmarket organizations in 2012 and beyond.6
5 Source: ESG Research Report, Security Management and Operations: Changes on the Horizon, July 2012.
6 Source: ESG Research Report, 2012 IT Spending Intentions Survey, January 2012.
Significantly easier, 9%
Easier, 48% No change, 22%
More difficult, 19%
Significantly more difficult, 2%
Don’t know, 1%
In your opinion, has data storage technology gotten easier or more difficult to manage over the last five years? (Percent of respondents, N=418)
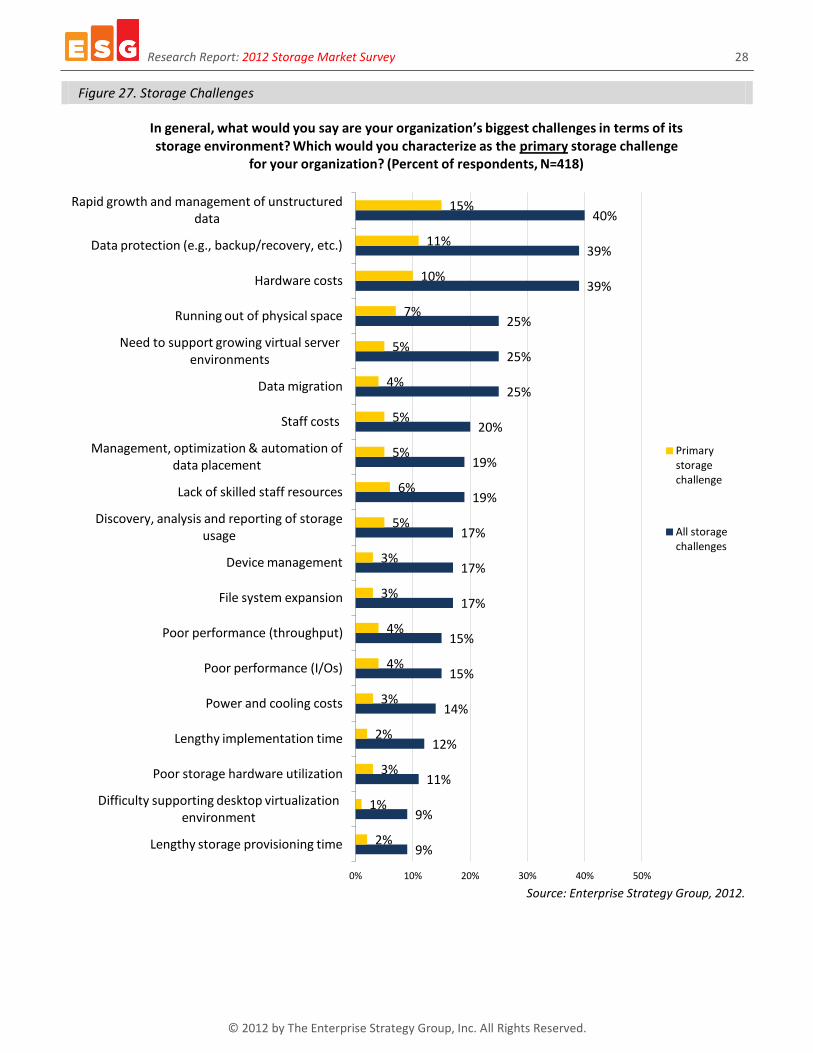
Research Report: 2012 Storage Market Survey 28
© 2012 by The Enterprise Strategy Group, Inc. All Rights Reserved.
Figure 27. Storage Challenges
Source: Enterprise Strategy Group, 2012.
9%
9%
11%
12%
14%
15%
15%
17%
17%
17%
19%
19%
20%
25%
25%
25%
39%
39%
40%
2%
1%
3%
2%
3%
4%
4%
3%
3%
5%
6%
5%
5%
4%
5%
7%
10%
11%
15%
0% 10% 20% 30% 40% 50%
Lengthy storage provisioning time
Difficulty supporting desktop virtualization environment
Poor storage hardware utilization
Lengthy implementation time
Power and cooling costs
Poor performance (I/Os)
Poor performance (throughput)
File system expansion
Device management
Discovery, analysis and reporting of storage usage
Lack of skilled staff resources
Management, optimization & automation of data placement
Staff costs
Data migration
Need to support growing virtual server environments
Running out of physical space
Hardware costs
Data protection (e.g., backup/recovery, etc.)
Rapid growth and management of unstructured data
In general, what would you say are your organization’s biggest challenges in terms of its storage environment? Which would you characterize as the primary storage challenge
for your organization? (Percent of respondents, N=418)
Primary storage challenge
All storage challenges

Research Report: 2012 Storage Market Survey 29
© 2012 by The Enterprise Strategy Group, Inc. All Rights Reserved.
Table 4. Storage Challenges, by Company Size
In general, what would you say are your organization’s biggest challenges in terms of its storage environment?
Midmarket (100 to 999
employees, N=141) Enterprise (1,000 or more
employees, N=277)
Rapid growth and management of unstructured data 47% 37%
Data protection (e.g., backup/recovery, etc.) 43% 36%
Running out of physical space 31% 21%
Power and cooling costs 7% 18%
Source: Enterprise Strategy Group, 2012.
While poor storage hardware utilization was identified as an ongoing challenge by a relatively small percentage of respondents in the previous chart, just 11% of respondents in a later question acknowledged that they are completely satisfied with their current hardware utilization rate (see Figure 28). The majority (60%) see some room for utilization improvement with slightly more than one-quarter (26%) of organizations considering their utilization rates sub-par and in need of significant improvement.
Figure 28. Satisfaction Level with Storage Hardware Utilization Rate
Source: Enterprise Strategy Group, 2012.
As seen in Table 5, those organizations that view poor storage hardware utilization as a challenge reported an overall average hardware utilization rate of 52%, compared to all other organizations (i.e., those that don’t view poor storage hardware utilization as a challenge) with an overall average utilization rate of 58%.
Completely satisfied – we believe our
storage hardware utilization rate is
optimal, 11%
Mostly satisfied – we know our storage
hardware utilization rate can be improved, but it is sufficient for our current needs,
60%
Somewhat satisfied – we know our storage hardware utilization
rate must be improved and will
look to address this issue going forward,
24%
Not at all satisfied – poor utilization is one
of our greatest storage pain points
and must be addressed
immediately, 2%
Don’t know/no opinion, 3%
Which of the following statements best describes the satisfaction level your organization has with its overall storage hardware utilization rate?
(Percent of respondents, N=418)

Research Report: 2012 Storage Market Survey 30
© 2012 by The Enterprise Strategy Group, Inc. All Rights Reserved.
Table 5. Overall Storage Hardware Utilization Rates Are Lower among Organizations Citing Poor Storage Hardware Utilization as a Challenge
To the best of your knowledge, what is your organization’s overall storage hardware utilization rate?
Organizations that view poor storage hardware utilization as a challenge (N=44)
All other organizations (N=334)
52% 58%
Source: Enterprise Strategy Group, 2012.
Those respondents that identified the support of desktop virtualization environments as a storage challenge were asked to further qualify exactly what kind of problem(s) the technology was causing. As seen in Figure 29, more than three-quarters (77%) of organizations believe that desktop virtualization causes a significant increase in storage capacity requirements, and 44% believe this is the only storage challenge stemming from desktop virtualization. This is consistent with previous desktop virtualization research conducted by ESG in which more than half of early virtual desktop infrastructure (VDI) adopters reported purchasing new networked storage systems and/or additional capacity specifically to support the technology.7 It is worth noting that more than half of the respondents that identified supporting desktop virtualization as a storage challenge have experienced a negative impact on storage performance.
Figure 29. The Impact of Desktop Virtualization on Storage Infrastructure
Source: Enterprise Strategy Group, 2012.
7 Source: ESG Research Report, Virtual Desktop Infrastructure Market Trends, February 2009.
Significant increase in storage capacity requirements, 44%
Negative impact on storage
performance, 18%
It has significantly increased storage
capacity requirements and
negatively impacted storage
performance, 33%
Don’t know, 5%
What is the primary storage infrastructure challenge your organization faces when it comes to supporting centralized virtual desktop images?
(Percent of respondents, N=39)

Research Report: 2012 Storage Market Survey 31
© 2012 by The Enterprise Strategy Group, Inc. All Rights Reserved.
The Impact of Virtualization Technology and Cloud Services on Storage Infrastructure
As seen previously in Figure 24, more than one-third of organizations expect server virtualization to impact data storage over the next 12-18 months. In order to get a sense of the impact that server virtualization has had to date on storage infrastructure and processes, respondents were asked about how much total storage capacity is consumed in support of their organization’s virtual server environment, as well as any challenges that stem from this support. Of the nearly three-quarters of organizations with server virtualization technology deployed (see Figure 60 in the Respondent Demographics section for chart), 38% report that virtual machine images, applications, and associated data consumes 10 TB of storage capacity or less (see Figure 30). By calculating the overall average storage capacity associated with virtual server environments (114 TB) and leveraging the total amount of disk-based capacity data (1,624 TB) provided by Figure 1, ESG was able to determine that that—on average—7% of total disk-based storage capacity is consumed supporting server virtualization technology.
Figure 30. Total Storage Capacity Currently Used to Support Virtual Server Environment
Source: Enterprise Strategy Group, 2012.
Nearly two-thirds (65%) of midmarket organizations report that the capacity required to store virtual machine images, applications, and associated data does not exceed 10 TB, compared to only 34% of enterprises (see Figure 31). Conversely, 30% of enterprise organizations allocate at least 100 TB of storage capacity to support their virtual server environments. Among midmarket organizations, 30% of total disk-based storage capacity is deployed in support of server virtualization implementations compared to only 6%. This discrepancy is likely due in large part to the differences in both size and complexity of IT environments, with enterprise organizations having a greater propensity to continue to leverage mainframe technology and other host server platforms (i.e., UNIX). These systems and the applications that run atop them are rarely—if ever—candidates for x86 server virtualization technology.
Needless to say, organizations with a more expansive virtualized system footprint deployed required a correspondingly larger amount of storage capacity for that purpose. Specifically, more than three-quarters (76%) of those organizations with more than 500 virtual machines have at least 100 TB of storage capacity associated with their virtual server environments, compared to only 8% of those with no more than 100 virtual machines.
4%
20%
14% 15%
9%
5%
8%
4%
6%
15%
0%
5%
10%
15%
20%
25%
Less than 1 TB
1 TB to 5 TB
6 TB to 10 TB
11 TB to 25 TB
26 TB to 49 TB
50 TB to 99 TB
100 TB to 249 TB
250 TB to 499 TB
500 TB or more
Don’t know
Approximately how much total storage capacity is currently used to support your virtual server environment (including storage of virtual machine images, applications,
and associated data)? (Percent of respondents, N=311)

Research Report: 2012 Storage Market Survey 32
© 2012 by The Enterprise Strategy Group, Inc. All Rights Reserved.
Figure 31. Total Storage Capacity Currently Used to Support Virtual Server Environment, by Company Size
Source: Enterprise Strategy Group, 2012.
Figure 32. Total Storage Capacity Currently Used to Support Virtual Server Environments, by Total Number of Virtual Machines
Source: Enterprise Strategy Group, 2012.
65%
33%
2%
34% 36%
30%
0%
10%
20%
30%
40%
50%
60%
70%
10 TB or less 11 TB to 99 TB 100 TB or more
Approximately how much total storage capacity is currently used to support your virtual server environment (including storage of virtual machine images, applications,
and associated data)? (Percent of respondents) Midmarket (100 to 999 employees, N=83) Enterprise (1,000 or more employees, N=217)
8%
23%
76%
35%
42%
21%
57%
35%
3%
0% 10% 20% 30% 40% 50% 60% 70% 80% 90% 100%
100 or fewer VMs (N=157)
101 to 500 VMs (N=62)
More than 500 VMs (N=38)
Total storage capacity currently used to support virtual server environments, by total number of virtual machines. (Percent of respondents)
100 TB or more 11 TB to 99 TB 10 TB or less
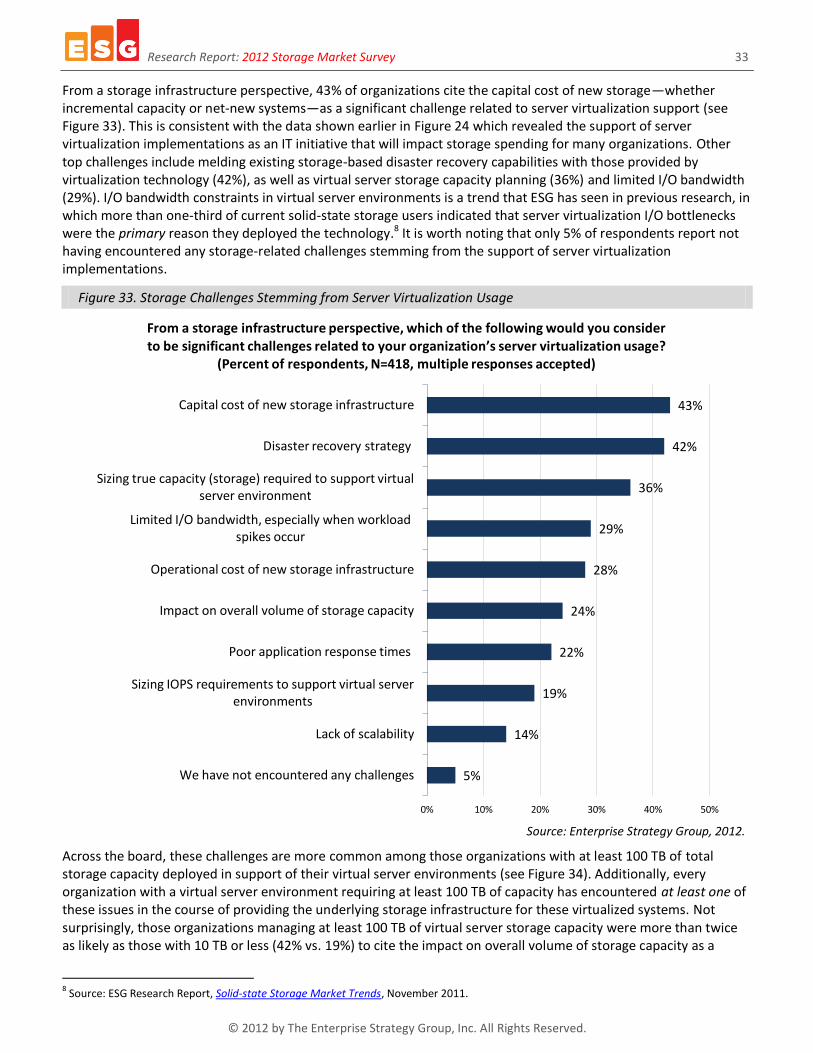
Research Report: 2012 Storage Market Survey 33
© 2012 by The Enterprise Strategy Group, Inc. All Rights Reserved.
From a storage infrastructure perspective, 43% of organizations cite the capital cost of new storage—whether incremental capacity or net-new systems—as a significant challenge related to server virtualization support (see Figure 33). This is consistent with the data shown earlier in Figure 24 which revealed the support of server virtualization implementations as an IT initiative that will impact storage spending for many organizations. Other top challenges include melding existing storage-based disaster recovery capabilities with those provided by virtualization technology (42%), as well as virtual server storage capacity planning (36%) and limited I/O bandwidth (29%). I/O bandwidth constraints in virtual server environments is a trend that ESG has seen in previous research, in which more than one-third of current solid-state storage users indicated that server virtualization I/O bottlenecks were the primary reason they deployed the technology.8 It is worth noting that only 5% of respondents report not having encountered any storage-related challenges stemming from the support of server virtualization implementations.
Figure 33. Storage Challenges Stemming from Server Virtualization Usage
Source: Enterprise Strategy Group, 2012.
Across the board, these challenges are more common among those organizations with at least 100 TB of total storage capacity deployed in support of their virtual server environments (see Figure 34). Additionally, every organization with a virtual server environment requiring at least 100 TB of capacity has encountered at least one of these issues in the course of providing the underlying storage infrastructure for these virtualized systems. Not surprisingly, those organizations managing at least 100 TB of virtual server storage capacity were more than twice as likely as those with 10 TB or less (42% vs. 19%) to cite the impact on overall volume of storage capacity as a
8 Source: ESG Research Report, Solid-state Storage Market Trends, November 2011.
5%
14%
19%
22%
24%
28%
29%
36%
42%
43%
0% 10% 20% 30% 40% 50%
We have not encountered any challenges
Lack of scalability
Sizing IOPS requirements to support virtual server environments
Poor application response times
Impact on overall volume of storage capacity
Operational cost of new storage infrastructure
Limited I/O bandwidth, especially when workload spikes occur
Sizing true capacity (storage) required to support virtual server environment
Disaster recovery strategy
Capital cost of new storage infrastructure
From a storage infrastructure perspective, which of the following would you consider to be significant challenges related to your organization’s server virtualization usage?
(Percent of respondents, N=418, multiple responses accepted)
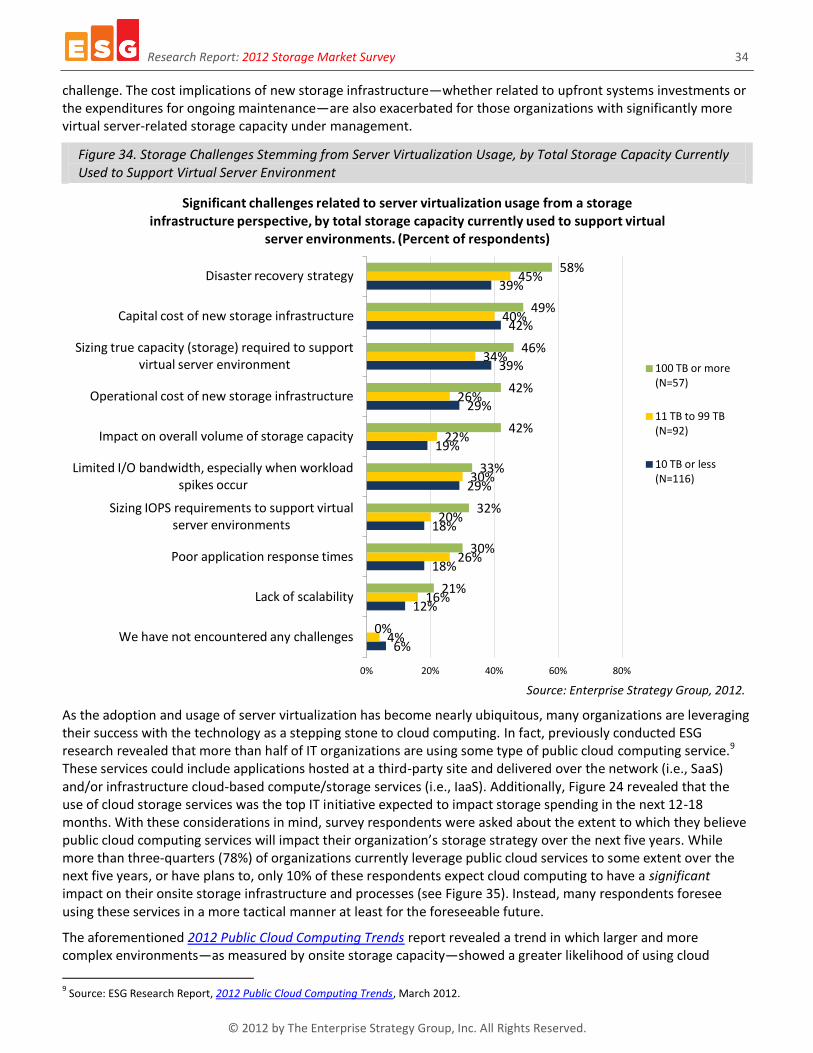
Research Report: 2012 Storage Market Survey 34
© 2012 by The Enterprise Strategy Group, Inc. All Rights Reserved.
challenge. The cost implications of new storage infrastructure—whether related to upfront systems investments or the expenditures for ongoing maintenance—are also exacerbated for those organizations with significantly more virtual server-related storage capacity under management.
Figure 34. Storage Challenges Stemming from Server Virtualization Usage, by Total Storage Capacity Currently Used to Support Virtual Server Environment
Source: Enterprise Strategy Group, 2012.
As the adoption and usage of server virtualization has become nearly ubiquitous, many organizations are leveraging their success with the technology as a stepping stone to cloud computing. In fact, previously conducted ESG research revealed that more than half of IT organizations are using some type of public cloud computing service.9 These services could include applications hosted at a third-party site and delivered over the network (i.e., SaaS) and/or infrastructure cloud-based compute/storage services (i.e., IaaS). Additionally, Figure 24 revealed that the use of cloud storage services was the top IT initiative expected to impact storage spending in the next 12-18 months. With these considerations in mind, survey respondents were asked about the extent to which they believe public cloud computing services will impact their organization’s storage strategy over the next five years. While more than three-quarters (78%) of organizations currently leverage public cloud services to some extent over the next five years, or have plans to, only 10% of these respondents expect cloud computing to have a significant impact on their onsite storage infrastructure and processes (see Figure 35). Instead, many respondents foresee using these services in a more tactical manner at least for the foreseeable future.
The aforementioned 2012 Public Cloud Computing Trends report revealed a trend in which larger and more complex environments—as measured by onsite storage capacity—showed a greater likelihood of using cloud
9 Source: ESG Research Report, 2012 Public Cloud Computing Trends, March 2012.
6%
12%
18%
18%
29%
19%
29%
39%
42%
39%
4%
16%
26%
20%
30%
22%
26%
34%
40%
45%
0%
21%
30%
32%
33%
42%
42%
46%
49%
58%
0% 20% 40% 60% 80%
We have not encountered any challenges
Lack of scalability
Poor application response times
Sizing IOPS requirements to support virtual server environments
Limited I/O bandwidth, especially when workload spikes occur
Impact on overall volume of storage capacity
Operational cost of new storage infrastructure
Sizing true capacity (storage) required to support virtual server environment
Capital cost of new storage infrastructure
Disaster recovery strategy
Significant challenges related to server virtualization usage from a storage infrastructure perspective, by total storage capacity currently used to support virtual
server environments. (Percent of respondents)
100 TB or more (N=57)
11 TB to 99 TB (N=92)
10 TB or less (N=116)
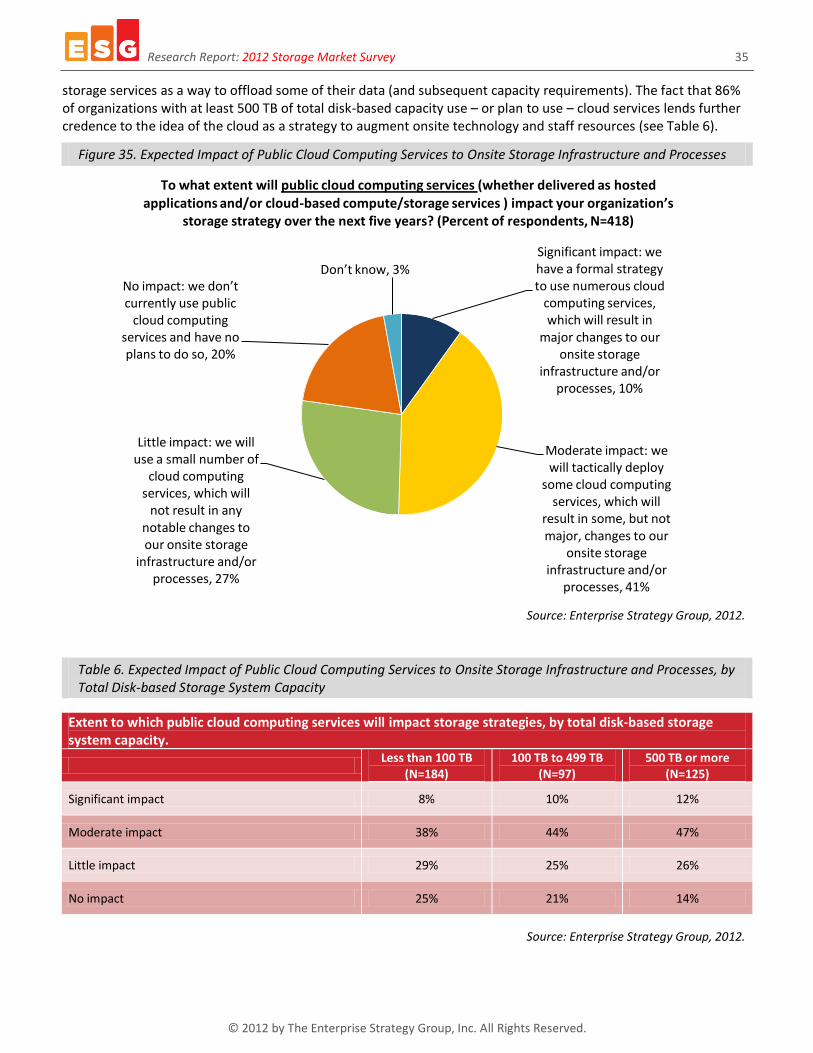
Research Report: 2012 Storage Market Survey 35
© 2012 by The Enterprise Strategy Group, Inc. All Rights Reserved.
storage services as a way to offload some of their data (and subsequent capacity requirements). The fact that 86% of organizations with at least 500 TB of total disk-based capacity use – or plan to use – cloud services lends further credence to the idea of the cloud as a strategy to augment onsite technology and staff resources (see Table 6).
Figure 35. Expected Impact of Public Cloud Computing Services to Onsite Storage Infrastructure and Processes
Source: Enterprise Strategy Group, 2012.
Table 6. Expected Impact of Public Cloud Computing Services to Onsite Storage Infrastructure and Processes, by Total Disk-based Storage System Capacity
Extent to which public cloud computing services will impact storage strategies, by total disk-based storage system capacity.
Less than 100 TB
(N=184) 100 TB to 499 TB
(N=97) 500 TB or more
(N=125)
Significant impact 8% 10% 12%
Moderate impact 38% 44% 47%
Little impact 29% 25% 26%
No impact 25% 21% 14%
Source: Enterprise Strategy Group, 2012.
Significant impact: we have a formal strategy to use numerous cloud
computing services, which will result in
major changes to our onsite storage
infrastructure and/or processes, 10%
Moderate impact: we will tactically deploy
some cloud computing services, which will
result in some, but not major, changes to our
onsite storage infrastructure and/or
processes, 41%
Little impact: we will use a small number of
cloud computing services, which will
not result in any notable changes to our onsite storage
infrastructure and/or processes, 27%
No impact: we don’t currently use public
cloud computing services and have no plans to do so, 20%
Don’t know, 3%
To what extent will public cloud computing services (whether delivered as hosted applications and/or cloud-based compute/storage services ) impact your organization’s
storage strategy over the next five years? (Percent of respondents, N=418)
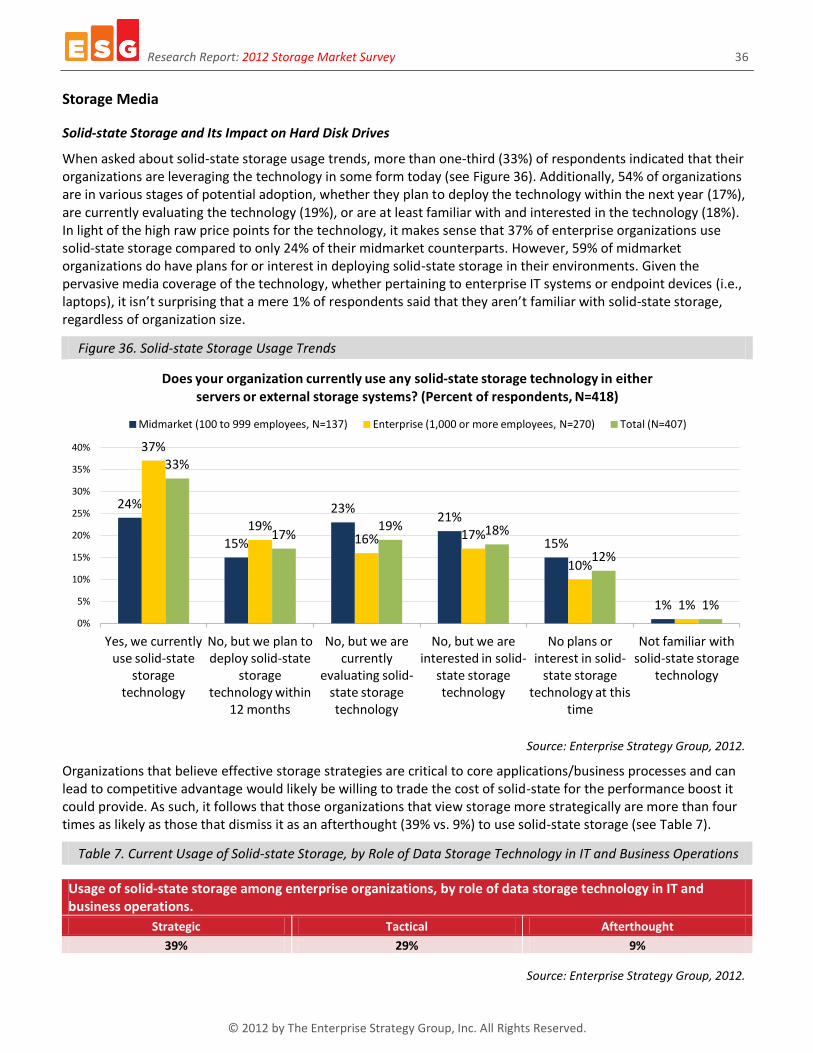
Research Report: 2012 Storage Market Survey 36
© 2012 by The Enterprise Strategy Group, Inc. All Rights Reserved.
Storage Media
Solid-state Storage and Its Impact on Hard Disk Drives
When asked about solid-state storage usage trends, more than one-third (33%) of respondents indicated that their organizations are leveraging the technology in some form today (see Figure 36). Additionally, 54% of organizations are in various stages of potential adoption, whether they plan to deploy the technology within the next year (17%), are currently evaluating the technology (19%), or are at least familiar with and interested in the technology (18%). In light of the high raw price points for the technology, it makes sense that 37% of enterprise organizations use solid-state storage compared to only 24% of their midmarket counterparts. However, 59% of midmarket organizations do have plans for or interest in deploying solid-state storage in their environments. Given the pervasive media coverage of the technology, whether pertaining to enterprise IT systems or endpoint devices (i.e., laptops), it isn’t surprising that a mere 1% of respondents said that they aren’t familiar with solid-state storage, regardless of organization size.
Figure 36. Solid-state Storage Usage Trends
Source: Enterprise Strategy Group, 2012.
Organizations that believe effective storage strategies are critical to core applications/business processes and can lead to competitive advantage would likely be willing to trade the cost of solid-state for the performance boost it could provide. As such, it follows that those organizations that view storage more strategically are more than four times as likely as those that dismiss it as an afterthought (39% vs. 9%) to use solid-state storage (see Table 7).
Table 7. Current Usage of Solid-state Storage, by Role of Data Storage Technology in IT and Business Operations
Usage of solid-state storage among enterprise organizations, by role of data storage technology in IT and business operations.
Strategic Tactical Afterthought 39% 29% 9%
Source: Enterprise Strategy Group, 2012.
24%
15%
23% 21%
15%
1%
37%
19% 16% 17%
10%
1%
33%
17% 19% 18%
12%
1% 0%
5%
10%
15%
20%
25%
30%
35%
40%
Yes, we currently use solid-state
storage technology
No, but we plan to deploy solid-state
storage technology within
12 months
No, but we are currently
evaluating solid-state storage technology
No, but we are interested in solid-
state storage technology
No plans or interest in solid-
state storage technology at this
time
Not familiar with solid-state storage
technology
Does your organization currently use any solid-state storage technology in either servers or external storage systems? (Percent of respondents, N=418)
Midmarket (100 to 999 employees, N=137) Enterprise (1,000 or more employees, N=270) Total (N=407)
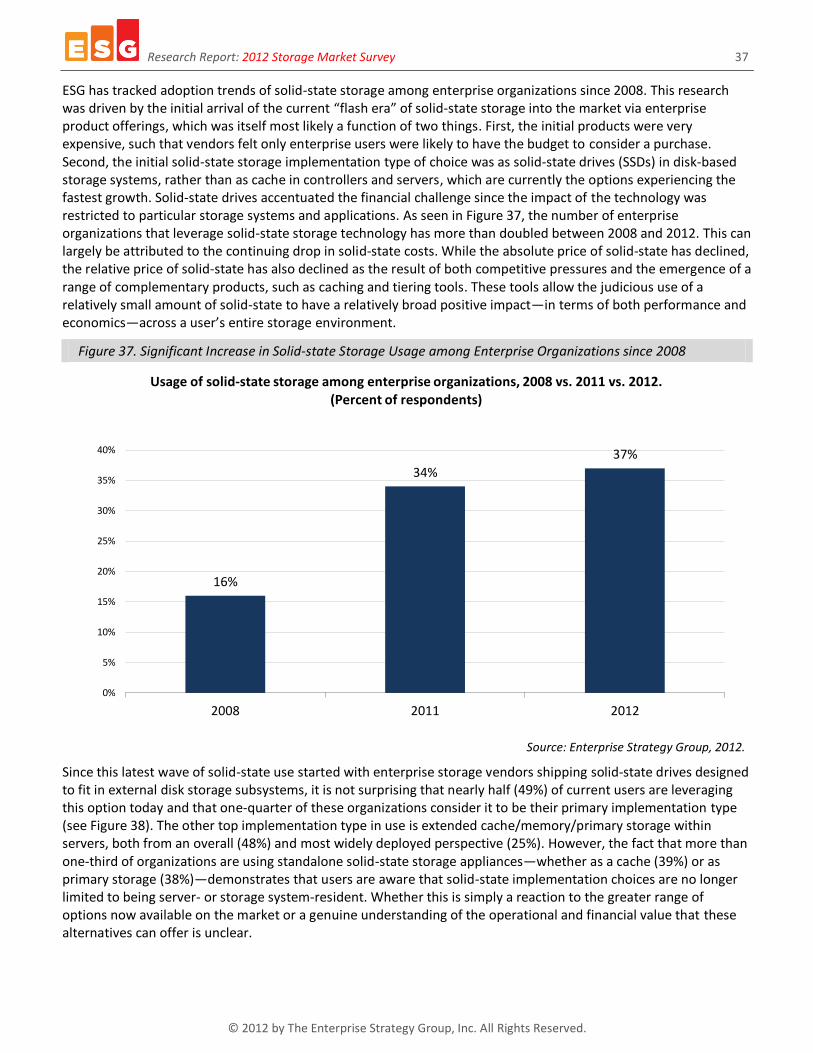
Research Report: 2012 Storage Market Survey 37
© 2012 by The Enterprise Strategy Group, Inc. All Rights Reserved.
ESG has tracked adoption trends of solid-state storage among enterprise organizations since 2008. This research was driven by the initial arrival of the current “flash era” of solid-state storage into the market via enterprise product offerings, which was itself most likely a function of two things. First, the initial products were very expensive, such that vendors felt only enterprise users were likely to have the budget to consider a purchase. Second, the initial solid-state storage implementation type of choice was as solid-state drives (SSDs) in disk-based storage systems, rather than as cache in controllers and servers, which are currently the options experiencing the fastest growth. Solid-state drives accentuated the financial challenge since the impact of the technology was restricted to particular storage systems and applications. As seen in Figure 37, the number of enterprise organizations that leverage solid-state storage technology has more than doubled between 2008 and 2012. This can largely be attributed to the continuing drop in solid-state costs. While the absolute price of solid-state has declined, the relative price of solid-state has also declined as the result of both competitive pressures and the emergence of a range of complementary products, such as caching and tiering tools. These tools allow the judicious use of a relatively small amount of solid-state to have a relatively broad positive impact—in terms of both performance and economics—across a user’s entire storage environment.
Figure 37. Significant Increase in Solid-state Storage Usage among Enterprise Organizations since 2008
Source: Enterprise Strategy Group, 2012.
Since this latest wave of solid-state use started with enterprise storage vendors shipping solid-state drives designed to fit in external disk storage subsystems, it is not surprising that nearly half (49%) of current users are leveraging this option today and that one-quarter of these organizations consider it to be their primary implementation type (see Figure 38). The other top implementation type in use is extended cache/memory/primary storage within servers, both from an overall (48%) and most widely deployed perspective (25%). However, the fact that more than one-third of organizations are using standalone solid-state storage appliances—whether as a cache (39%) or as primary storage (38%)—demonstrates that users are aware that solid-state implementation choices are no longer limited to being server- or storage system-resident. Whether this is simply a reaction to the greater range of options now available on the market or a genuine understanding of the operational and financial value that these alternatives can offer is unclear.
16%
34%
37%
0%
5%
10%
15%
20%
25%
30%
35%
40%
2008 2011 2012
Usage of solid-state storage among enterprise organizations, 2008 vs. 2011 vs. 2012. (Percent of respondents)
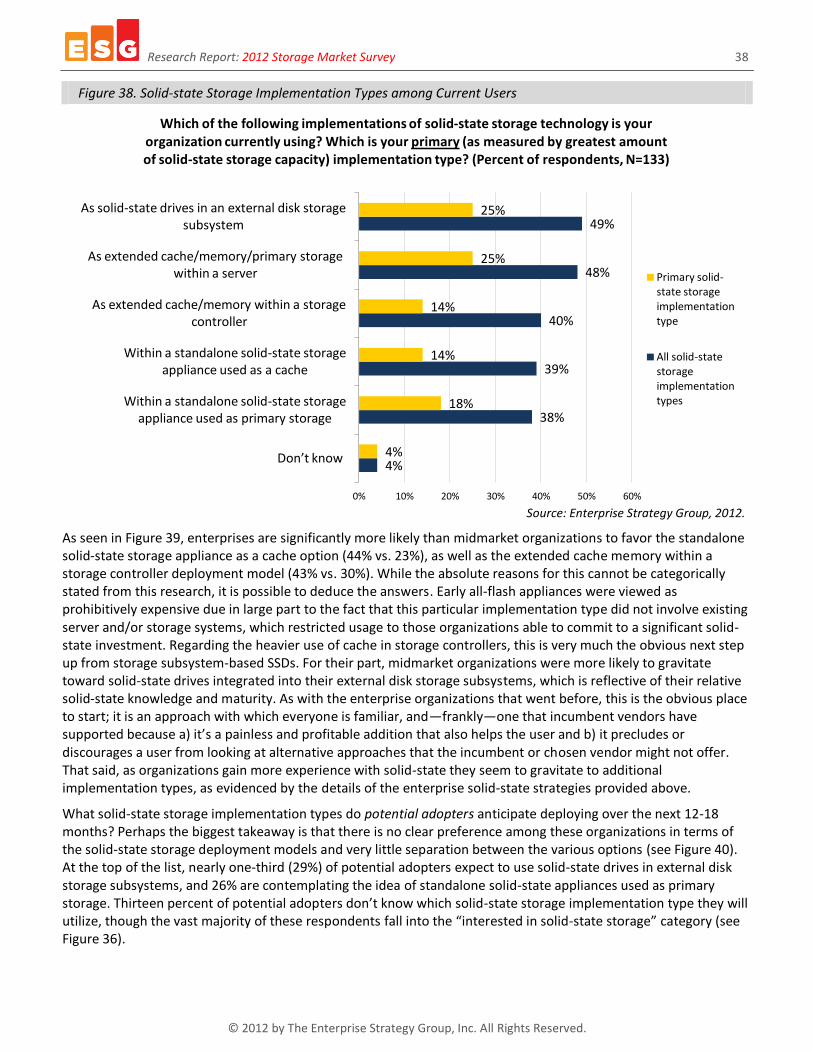
Research Report: 2012 Storage Market Survey 38
© 2012 by The Enterprise Strategy Group, Inc. All Rights Reserved.
Figure 38. Solid-state Storage Implementation Types among Current Users
Source: Enterprise Strategy Group, 2012.
As seen in Figure 39, enterprises are significantly more likely than midmarket organizations to favor the standalone solid-state storage appliance as a cache option (44% vs. 23%), as well as the extended cache memory within a storage controller deployment model (43% vs. 30%). While the absolute reasons for this cannot be categorically stated from this research, it is possible to deduce the answers. Early all-flash appliances were viewed as prohibitively expensive due in large part to the fact that this particular implementation type did not involve existing server and/or storage systems, which restricted usage to those organizations able to commit to a significant solid-state investment. Regarding the heavier use of cache in storage controllers, this is very much the obvious next step up from storage subsystem-based SSDs. For their part, midmarket organizations were more likely to gravitate toward solid-state drives integrated into their external disk storage subsystems, which is reflective of their relative solid-state knowledge and maturity. As with the enterprise organizations that went before, this is the obvious place to start; it is an approach with which everyone is familiar, and—frankly—one that incumbent vendors have supported because a) it’s a painless and profitable addition that also helps the user and b) it precludes or discourages a user from looking at alternative approaches that the incumbent or chosen vendor might not offer. That said, as organizations gain more experience with solid-state they seem to gravitate to additional implementation types, as evidenced by the details of the enterprise solid-state strategies provided above.
What solid-state storage implementation types do potential adopters anticipate deploying over the next 12-18 months? Perhaps the biggest takeaway is that there is no clear preference among these organizations in terms of the solid-state storage deployment models and very little separation between the various options (see Figure 40). At the top of the list, nearly one-third (29%) of potential adopters expect to use solid-state drives in external disk storage subsystems, and 26% are contemplating the idea of standalone solid-state appliances used as primary storage. Thirteen percent of potential adopters don’t know which solid-state storage implementation type they will utilize, though the vast majority of these respondents fall into the “interested in solid-state storage” category (see Figure 36).
4%
38%
39%
40%
48%
49%
4%
18%
14%
14%
25%
25%
0% 10% 20% 30% 40% 50% 60%
Don’t know
Within a standalone solid-state storage appliance used as primary storage
Within a standalone solid-state storage appliance used as a cache
As extended cache/memory within a storage controller
As extended cache/memory/primary storage within a server
As solid-state drives in an external disk storage subsystem
Which of the following implementations of solid-state storage technology is your organization currently using? Which is your primary (as measured by greatest amount of solid-state storage capacity) implementation type? (Percent of respondents, N=133)
Primary solid-state storage implementation type
All solid-state storage implementation types

Research Report: 2012 Storage Market Survey 39
© 2012 by The Enterprise Strategy Group, Inc. All Rights Reserved.
Figure 39. All Solid-state Storage Implementation Types among Current Users, by Company Size
Source: Enterprise Strategy Group, 2012.
Figure 40. Solid-state Storage Implementation Types among Potential Adopters
Source: Enterprise Strategy Group, 2012.
It is important to note that the percent of use (i.e., adoption) far exceeds the share of the total storage market—whether measured in revenue or total capacity shipped—represented by solid-state storage, which is neither surprising nor likely to change anytime soon. In simple terms, a lot of users have a little solid-state. As far as quantifying the extent of solid-state storage usage relative to other disk drive technologies, Figure 41 reveals that, overall, solid-state storage accounts for approximately 9% of total disk-based storage capacity, which is expected to increase to 14% over the next two years.
33%
30%
23%
53%
47%
40%
43%
44%
47%
48%
0% 10% 20% 30% 40% 50% 60%
Within a standalone solid-state storage appliance used as primary storage
As extended cache/memory within a storage controller
Within a standalone solid-state storage appliance used as a cache
As solid-state drives in an external disk storage subsystem
As extended cache/memory/primary storage within a server
Which of the following implementations of solid-state storage technology is your organization currently using? (Percent of respondents, multiple responses accepted)
Enterprise (1,000 or more employees, N=100)
Midmarket (100 to 999 employees, N=33)
13%
22%
22%
24%
26%
29%
0% 5% 10% 15% 20% 25% 30% 35%
Don’t know
Within a standalone solid-state storage appliance used as a cache
As an extended cache/memory within a storage controller
As extended cache/memory/primary storage within a server
Within a standalone solid-state storage appliance used as primary storage
As solid-state drives in an external disk storage subsystem
Which of the following implementations of solid-state storage technology does your organization plan to utilize over the next 12-18 months?
(Percent of respondents, N=222, multiple responses accepted)
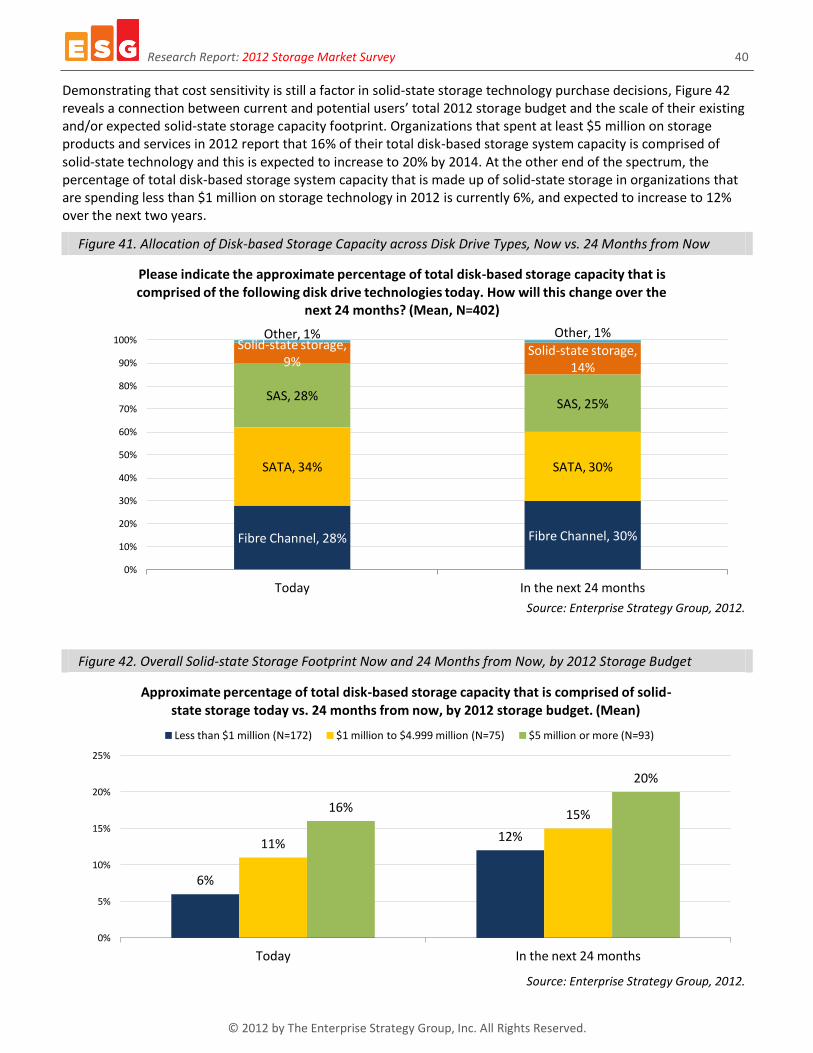
Research Report: 2012 Storage Market Survey 40
© 2012 by The Enterprise Strategy Group, Inc. All Rights Reserved.
Demonstrating that cost sensitivity is still a factor in solid-state storage technology purchase decisions, Figure 42 reveals a connection between current and potential users’ total 2012 storage budget and the scale of their existing and/or expected solid-state storage capacity footprint. Organizations that spent at least $5 million on storage products and services in 2012 report that 16% of their total disk-based storage system capacity is comprised of solid-state technology and this is expected to increase to 20% by 2014. At the other end of the spectrum, the percentage of total disk-based storage system capacity that is made up of solid-state storage in organizations that are spending less than $1 million on storage technology in 2012 is currently 6%, and expected to increase to 12% over the next two years.
Figure 41. Allocation of Disk-based Storage Capacity across Disk Drive Types, Now vs. 24 Months from Now
Source: Enterprise Strategy Group, 2012.
Figure 42. Overall Solid-state Storage Footprint Now and 24 Months from Now, by 2012 Storage Budget
Source: Enterprise Strategy Group, 2012.
Fibre Channel, 28% Fibre Channel, 30%
SATA, 34% SATA, 30%
SAS, 28% SAS, 25%
Solid-state storage, 9%
Solid-state storage, 14%
Other, 1% Other, 1%
0%
10%
20%
30%
40%
50%
60%
70%
80%
90%
100%
Today In the next 24 months
Please indicate the approximate percentage of total disk-based storage capacity that is comprised of the following disk drive technologies today. How will this change over the
next 24 months? (Mean, N=402)
6%
12% 11%
15% 16%
20%
0%
5%
10%
15%
20%
25%
Today In the next 24 months
Approximate percentage of total disk-based storage capacity that is comprised of solid-state storage today vs. 24 months from now, by 2012 storage budget. (Mean)
Less than $1 million (N=172) $1 million to $4.999 million (N=75) $5 million or more (N=93)
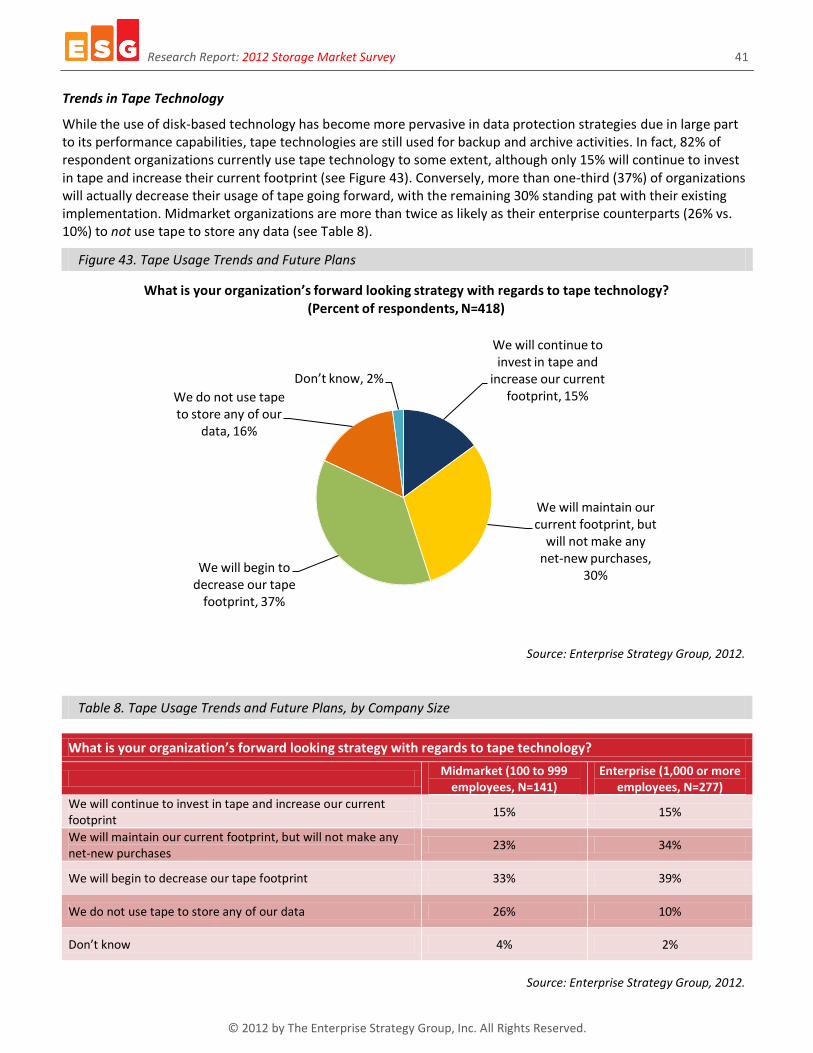
Research Report: 2012 Storage Market Survey 41
© 2012 by The Enterprise Strategy Group, Inc. All Rights Reserved.
Trends in Tape Technology
While the use of disk-based technology has become more pervasive in data protection strategies due in large part to its performance capabilities, tape technologies are still used for backup and archive activities. In fact, 82% of respondent organizations currently use tape technology to some extent, although only 15% will continue to invest in tape and increase their current footprint (see Figure 43). Conversely, more than one-third (37%) of organizations will actually decrease their usage of tape going forward, with the remaining 30% standing pat with their existing implementation. Midmarket organizations are more than twice as likely as their enterprise counterparts (26% vs. 10%) to not use tape to store any data (see Table 8).
Figure 43. Tape Usage Trends and Future Plans
Source: Enterprise Strategy Group, 2012.
Table 8. Tape Usage Trends and Future Plans, by Company Size
What is your organization’s forward looking strategy with regards to tape technology?
Midmarket (100 to 999
employees, N=141) Enterprise (1,000 or more
employees, N=277)
We will continue to invest in tape and increase our current footprint
15% 15%
We will maintain our current footprint, but will not make any net-new purchases
23% 34%
We will begin to decrease our tape footprint 33% 39%
We do not use tape to store any of our data 26% 10%
Don’t know 4% 2%
Source: Enterprise Strategy Group, 2012.
We will continue to invest in tape and
increase our current footprint, 15%
We will maintain our current footprint, but
will not make any net-new purchases,
30% We will begin to
decrease our tape footprint, 37%
We do not use tape to store any of our
data, 16%
Don’t know, 2%
What is your organization’s forward looking strategy with regards to tape technology? (Percent of respondents, N=418)

Research Report: 2012 Storage Market Survey 42
© 2012 by The Enterprise Strategy Group, Inc. All Rights Reserved.
Among the organizations that do use tape technology, the most common use case involves storing backup data at an offsite location. In fact, providing further reinforcement for the idea that backup-to-disk solutions are quickly becoming the preferred onsite data protection target, nearly three-quarters (74%) of current users report leveraging tape for offsite purposes backup and/or archived data, compared to only 58% that use tape as part of their onsite operations and processes (see Figure 44). From an overall perspective, organizations are more likely to use tape for backup purposes (76%) than for archiving data (63%). However, this dynamic varies when viewed by the total amount of disk-based storage system capacity under management. Specifically, Table 9 reveals that organizations with at least 500 TB of disk-based storage capacity are significantly more likely than those with less than 100 TB to be using tape as an offsite (54% vs. 42%) and/or onsite (35% vs. 25%) archiving repository. It makes sense that organizations with more overall disk capacity would indeed be the more likely candidates to have examined all the opportunities that a storage hierarchy affords them, and to have the greatest need to choose storage platforms and data placement carefully; consequently, such organizations are most likely to use optimization strategies and tools such as storage tiering, which would likely include tape for long-term archive and retention purposes regardless of location.
Figure 44. How Organizations Currently Use Tape
Source: Enterprise Strategy Group, 2012.
Table 9. How Organizations Currently Use Tape, by Total Disk-based Storage System Capacity
How organizations currently use tape technology, by total disk-based storage system capacity.
Less than 100 TB
(N=139) 100 TB to 499 TB
(N=88) 500 TB or more
(N=115)
We use tape to store backup data offsite 55% 55% 51%
We use tape to store archive data offsite 42% 50% 54%
We use tape to store backup data onsite 48% 48% 41%
We use tape to store archive data onsite 25% 29% 35%
Source: Enterprise Strategy Group, 2012.
29%
45%
48%
54%
0% 10% 20% 30% 40% 50% 60%
We use tape to store archive data onsite
We use tape to store backup data onsite
We use tape to store archive data offsite
We use tape to store backup data offsite
Which of the following describes how your organization currently uses tape technology? (Percent of respondents, N=343, multiple responses accepted)

Research Report: 2012 Storage Market Survey 43
© 2012 by The Enterprise Strategy Group, Inc. All Rights Reserved.
Storage Requirements and Buying Criteria
Today’s storage systems come with an array of various features and functionalities that improve data availability, increase performance, or optimize resource utilization. Which ones resonate most with users? Respondents were asked to identify up to five features they would classify as “must have” when purchasing a storage system. Considering that downtime tolerance windows continue to shrink, especially for tier-1 and mission-critical applications and data,10 it makes sense that the majority of organizations gravitate to storage systems that can deliver high availability (see Figure 45). The increasing use of server virtualization is leading many organizations to re-architect their data center networks to accommodate increased throughput requirements,11 which has a trickle-down effect on all underlying resources, including storage. As such, it is also not surprising that 41% of organizations would expect their storage systems to provide 10 Gigabit Ethernet support. Data reduction technologies such as data deduplication (37%), storage tiering (33%), and unified storage (23%) were other top must-have storage system attributes identified by respondents. This suggests that more and more, organizations are looking for solutions that can help to optimize and/or more efficiently leverage their existing storage resources.
Figure 45. Must-have Storage Features and Capabilities
Source: Enterprise Strategy Group, 2012.
The desire for features and capabilities that foster storage optimization and efficiency is particularly high among organizations with more capacity under management. Specifically, those organizations with at least 500 TB of disk-based storage system capacity are much more likely than their smaller counterparts to classify data reduction technologies, storage tiering, and unified storage as must-have features and capabilities (see Table 10).
10
Source: ESG Research Report, Trends in Data Protection Modernization, August 2012. 11
Source: ESG Research Report, Data Center Networking Trends, January 2012.
15%
16%
16%
18%
19%
21%
22%
22%
23%
33%
37%
41%
59%
0% 10% 20% 30% 40% 50% 60% 70%
Read-only snapshot
Asynchronous replication
Thin provisioning
Remote monitoring/management capabilities via tablet
Synchronous replication
Read-write snapshot
Flash-based solid-state drives (SSDs)
Fibre Channel over Ethernet (FcoE) support
Unified storage
Storage tiering
Data reduction technologies
10 Gigabit Ethernet support
High availability
Which of the following features would you consider to be “must have” when it comes to purchasing storage systems? (Percent of respondents, N=418, five responses accepted)
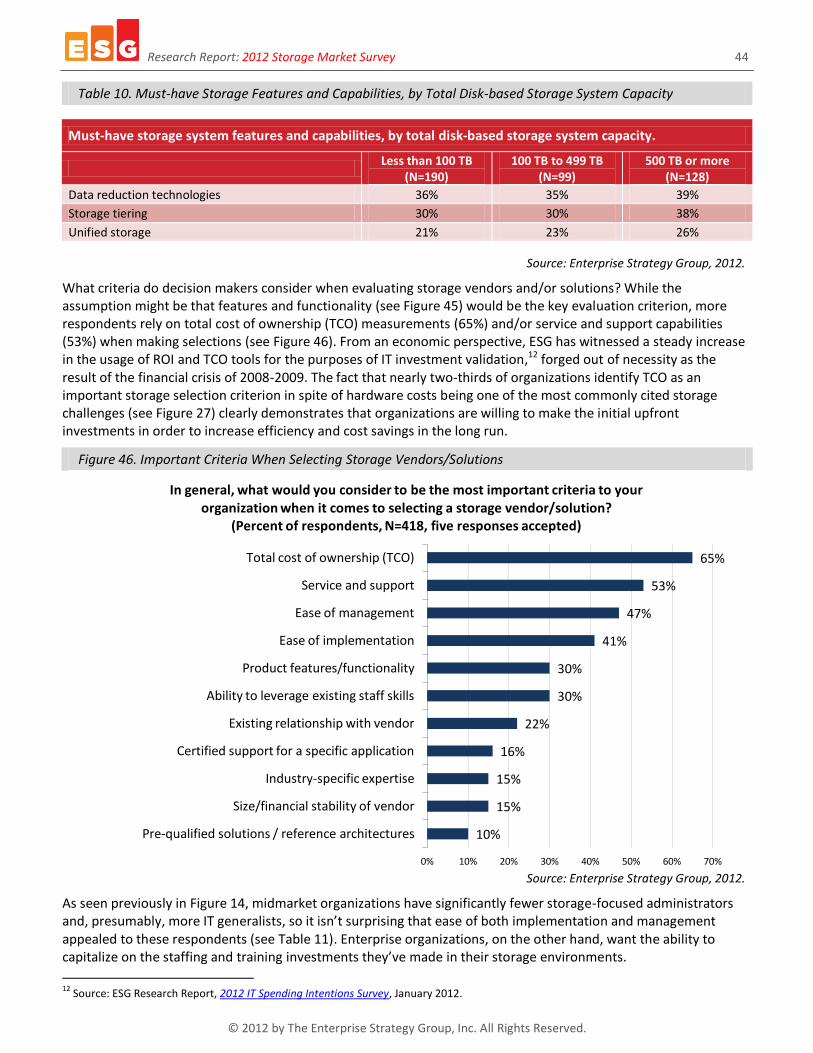
Research Report: 2012 Storage Market Survey 44
© 2012 by The Enterprise Strategy Group, Inc. All Rights Reserved.
Table 10. Must-have Storage Features and Capabilities, by Total Disk-based Storage System Capacity
Must-have storage system features and capabilities, by total disk-based storage system capacity.
Less than 100 TB
(N=190) 100 TB to 499 TB
(N=99) 500 TB or more
(N=128)
Data reduction technologies 36% 35% 39%
Storage tiering 30% 30% 38%
Unified storage 21% 23% 26%
Source: Enterprise Strategy Group, 2012.
What criteria do decision makers consider when evaluating storage vendors and/or solutions? While the assumption might be that features and functionality (see Figure 45) would be the key evaluation criterion, more respondents rely on total cost of ownership (TCO) measurements (65%) and/or service and support capabilities (53%) when making selections (see Figure 46). From an economic perspective, ESG has witnessed a steady increase in the usage of ROI and TCO tools for the purposes of IT investment validation,12 forged out of necessity as the result of the financial crisis of 2008-2009. The fact that nearly two-thirds of organizations identify TCO as an important storage selection criterion in spite of hardware costs being one of the most commonly cited storage challenges (see Figure 27) clearly demonstrates that organizations are willing to make the initial upfront investments in order to increase efficiency and cost savings in the long run.
Figure 46. Important Criteria When Selecting Storage Vendors/Solutions
Source: Enterprise Strategy Group, 2012.
As seen previously in Figure 14, midmarket organizations have significantly fewer storage-focused administrators and, presumably, more IT generalists, so it isn’t surprising that ease of both implementation and management appealed to these respondents (see Table 11). Enterprise organizations, on the other hand, want the ability to capitalize on the staffing and training investments they’ve made in their storage environments.
12
Source: ESG Research Report, 2012 IT Spending Intentions Survey, January 2012.
10%
15%
15%
16%
22%
30%
30%
41%
47%
53%
65%
0% 10% 20% 30% 40% 50% 60% 70%
Pre-qualified solutions / reference architectures
Size/financial stability of vendor
Industry-specific expertise
Certified support for a specific application
Existing relationship with vendor
Ability to leverage existing staff skills
Product features/functionality
Ease of implementation
Ease of management
Service and support
Total cost of ownership (TCO)
In general, what would you consider to be the most important criteria to your organization when it comes to selecting a storage vendor/solution?
(Percent of respondents, N=418, five responses accepted)

Research Report: 2012 Storage Market Survey 45
© 2012 by The Enterprise Strategy Group, Inc. All Rights Reserved.
Table 11. Important Criteria When Selecting Storage Vendors/Solutions, by Company Size
In general, what would you consider to be the most important criteria to your organization when it comes to selecting a storage vendor/solution?
Midmarket (100 to 999
employees, N=141) Enterprise (1,000 or more
employees, N=277)
Ease of management 56% 42%
Ease of implementation 50% 36%
Ability to leverage existing staff skills 24% 33%
Source: Enterprise Strategy Group, 2012.
Respondents that identified total cost of ownership as an important criterion for storage vendor/solution selection were asked a follow-up question about the most important cost considerations that factor into TCO calculations. Nearly two-thirds (65%) of organizations gravitated toward the reduced cost of storage hardware and software (the lone CAPEX option available), while one-quarter cited reduced staff costs, making it the top OPEX-related selection (see Figure 47).
Figure 47. Most Important TCO Cost Considerations
Source: Enterprise Strategy Group, 2012.
Respondents were then asked about the key messages that storage vendors should emphasize. As shown in Table 12, performance and cost were ranked as the top two value propositions. Considering that hardware costs are among the top storage challenges and TCO is the most commonly leveraged storage vendor/solution selection criterion, it is not surprising that users put such a premium on cost. Among those organizations that view data storage as an afterthought in terms of the role it plays in IT and business operations, cost—both CAPEX and OPEX—actually supersedes storage performance (see Table 13). Additionally, these organizations put a slightly higher premium on a vendor’s cloud vision. However, what is more important is the fact that overall there is remarkably little difference between the ranks in this breakdown—the top three favored messages are identical, simply with a different ranking.
Reduced cost of storage hardware and
software, 65%
Reduced IT staff-related costs, 25%
Reduced data center floor space
requirements, 5%
Reduced power and cooling requirements,
3%
Other, 1% Don’t know, 1%
Which of the following cost considerations that factor into a TCO calculation would you consider to be the most important? (Percent of respondents, N=271)
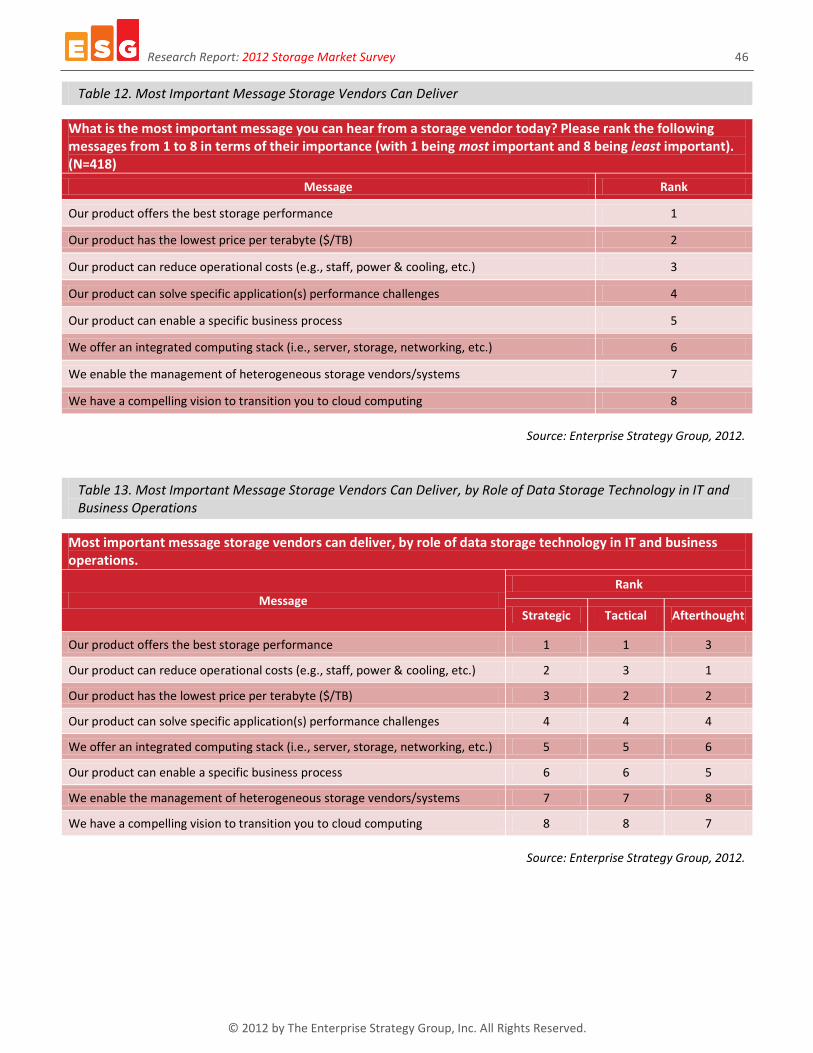
Research Report: 2012 Storage Market Survey 46
© 2012 by The Enterprise Strategy Group, Inc. All Rights Reserved.
Table 12. Most Important Message Storage Vendors Can Deliver
What is the most important message you can hear from a storage vendor today? Please rank the following messages from 1 to 8 in terms of their importance (with 1 being most important and 8 being least important). (N=418)
Message Rank
Our product offers the best storage performance 1
Our product has the lowest price per terabyte ($/TB) 2
Our product can reduce operational costs (e.g., staff, power & cooling, etc.) 3
Our product can solve specific application(s) performance challenges 4
Our product can enable a specific business process 5
We offer an integrated computing stack (i.e., server, storage, networking, etc.) 6
We enable the management of heterogeneous storage vendors/systems 7
We have a compelling vision to transition you to cloud computing 8
Source: Enterprise Strategy Group, 2012.
Table 13. Most Important Message Storage Vendors Can Deliver, by Role of Data Storage Technology in IT and Business Operations
Most important message storage vendors can deliver, by role of data storage technology in IT and business operations.
Message Rank
Strategic Tactical Afterthought
Our product offers the best storage performance 1 1 3
Our product can reduce operational costs (e.g., staff, power & cooling, etc.) 2 3 1
Our product has the lowest price per terabyte ($/TB) 3 2 2
Our product can solve specific application(s) performance challenges 4 4 4
We offer an integrated computing stack (i.e., server, storage, networking, etc.) 5 5 6
Our product can enable a specific business process 6 6 5
We enable the management of heterogeneous storage vendors/systems 7 7 8
We have a compelling vision to transition you to cloud computing 8 8 7
Source: Enterprise Strategy Group, 2012.

Research Report: 2012 Storage Market Survey 47
© 2012 by The Enterprise Strategy Group, Inc. All Rights Reserved.
Conclusion
This research report provides a comprehensive and insightful snapshot of where the storage market is today and how that might be changing down the road. In terms of the present state of the storage market, perhaps the most important and intriguing takeaway is how important the basics are. This means that the focus of users—in terms of challenges, preferred technologies, messaging desires—remains heavily focused on foundational elements, such as dealing with the growth of storage capacity, protecting the data driving that growth, and finding ways to stretch their budgets to achieve these two things. While storage budgets – in conjunction with overall IT spending levels13 – have improved in the wake of the 2008-2009 financial crisis, decision-makers are still sensitive to the capital and operating expenses associated with data storage technology. In fact, nearly one-in-five organizations identified cost in some form as their primary storage-related challenge, and cost reduction was also highly ranked by respondents as key storage vendor value propositions. However, mirroring a general IT market trend, those IT professionals responsible for purchasing data storage technology demonstrate a willingness to make the initial upfront investments in order to increase efficiency and cost savings for their organizations in the long run.
To achieve TCO and ROI needs in a world of modest budget increases demands some agility, especially when users attest to faster growth in capacity than in budget levels. Thus, in order to manage the gap, ESG sees a growing trend towards the use of both efficiency and flexibility tools. The research shows a marked increase to date in the adoption of such efficiencies as networked storage and solid-state-enhanced and/or -based products—with forward-looking indications of this adoption continuing. Meanwhile, the addition of flexibility is best represented by the drive to move appropriate data – and corresponding storage capacity – to the cloud. By leveraging third-party services to manage certain types of capacity, such as unstructured or archived data, IT and storage professionals would not only be offloading these burdens, they would free up time and resources to more efficiently manage the remaining “traditional” onsite storage infrastructure.
Looking ahead to what’s on the horizon, the descriptor of “traditional” in the context of data storage bears some investigation. Managing data growth, which has a clear connection to data storage technologies and processes, is an overall top five IT priority,14 but the most effective strategy is certainly up for debate, with Figure 48 revealing how respondents expect data storage technology to evolve over the long term. What is interesting is that the chart can be viewed in two ways, which in themselves demonstrate the stress—and indeed opportunity—in the storage market today. The most broadly held opinion – chosen by more than half (58%) of respondents – is that data storage will remain a distinct technology discipline with specialized hardware, software, and staff, which is reflective of the traditional approach. However, the fact that nearly one-third (32%) of respondents believe that data storage will become a less specialized technology discipline built upon cheap hardware with software features/functionality operating at the virtualization or even data center operating system level is significant because it really wasn’t even a consideration only a few years ago. This percentage represents a whole ethos of technology convergence, hypervisors, and software-definition that is so prevalent right now in thought leadership arenas of general IT, and it is clearly beginning to creep onto the radars of storage decision-makers as they contemplate their organization’s strategic direction.
And yet this is not the full story: As Figure 49 shows, there is a marked difference in expectations when this same data is cut by the role that data storage plays in technology in IT and business operations. What the psychographic data shows is that nearly three-quarters (73%) of organizations that view storage as strategic to core business applications/processes believe that storage will remain a distinct technology discipline as opposed to those who classify storage as tactical (48%)or an afterthought (39%). While conventional wisdom might suggest that organizations with a strategic storage focus—who are typically first movers and most receptive to change—might be more likely to stray from the “traditional storage path,” the data would seem to indicate that their investments in both technology and people have fortified their commitment to this approach, as they attempt to continue to extract value from these resources. On the other hand, those organizations that place less of a premium on storage
13
Source: ESG Research Report, 2012 IT Spending Intentions Survey, January 2012. 14
Source: Ibid.
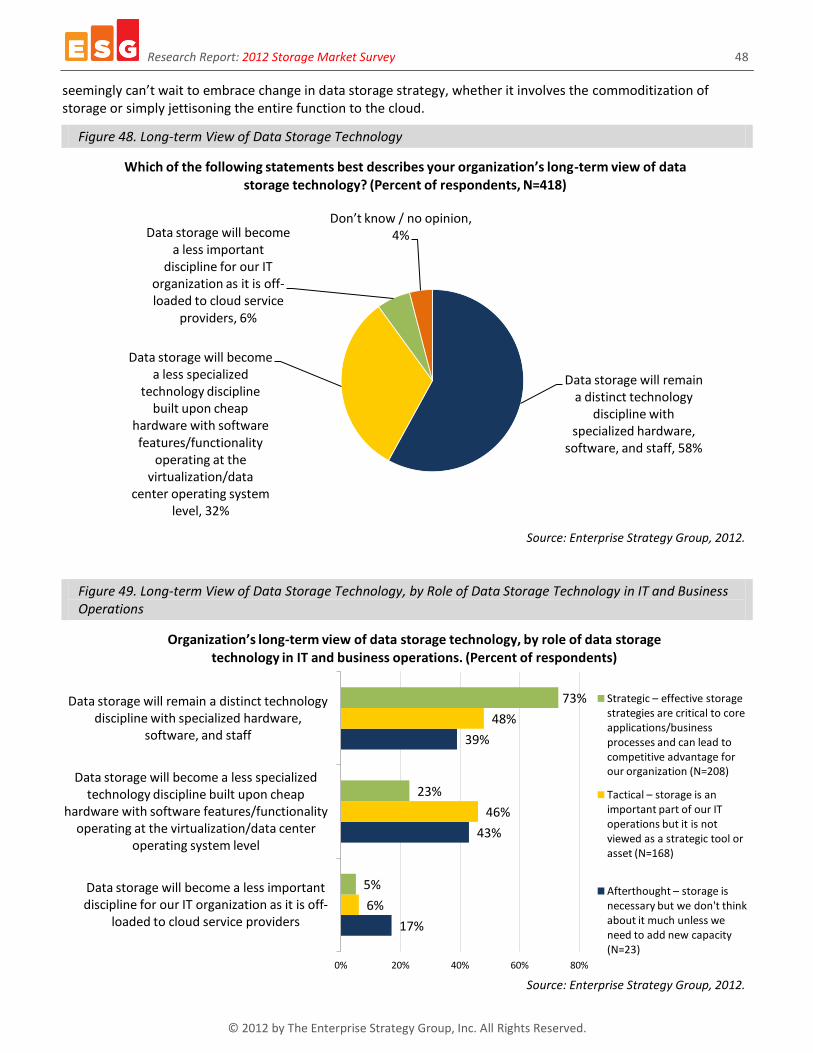
Research Report: 2012 Storage Market Survey 48
© 2012 by The Enterprise Strategy Group, Inc. All Rights Reserved.
seemingly can’t wait to embrace change in data storage strategy, whether it involves the commoditization of storage or simply jettisoning the entire function to the cloud.
Figure 48. Long-term View of Data Storage Technology
Source: Enterprise Strategy Group, 2012.
Figure 49. Long-term View of Data Storage Technology, by Role of Data Storage Technology in IT and Business Operations
Source: Enterprise Strategy Group, 2012.
Data storage will remain a distinct technology
discipline with specialized hardware,
software, and staff, 58%
Data storage will become a less specialized
technology discipline built upon cheap
hardware with software features/functionality
operating at the virtualization/data
center operating system level, 32%
Data storage will become a less important
discipline for our IT organization as it is off-loaded to cloud service
providers, 6%
Don’t know / no opinion, 4%
Which of the following statements best describes your organization’s long-term view of data storage technology? (Percent of respondents, N=418)
17%
43%
39%
6%
46%
48%
5%
23%
73%
0% 20% 40% 60% 80%
Data storage will become a less important discipline for our IT organization as it is off-
loaded to cloud service providers
Data storage will become a less specialized technology discipline built upon cheap
hardware with software features/functionality operating at the virtualization/data center
operating system level
Data storage will remain a distinct technology discipline with specialized hardware,
software, and staff
Organization’s long-term view of data storage technology, by role of data storage technology in IT and business operations. (Percent of respondents)
Strategic – effective storage strategies are critical to core applications/business processes and can lead to competitive advantage for our organization (N=208)
Tactical – storage is an important part of our IT operations but it is not viewed as a strategic tool or asset (N=168)
Afterthought – storage is necessary but we don't think about it much unless we need to add new capacity (N=23)
Research Report: 2012 Storage Market Survey 49
© 2012 by The Enterprise Strategy Group, Inc. All Rights Reserved.
Research Implications for Technology Vendors
IT vendors should read this report thoroughly and adjust their messaging—assuming it is realistic and credible to do so—in order to reflect those basic issues and considerations that drive storage decisions. While continuing to drive up simplicity, manageability, and functionality, vendors should be aware that driving down the TCO remains at the top of the list for users, albeit while offering high levels of service and support. Anecdotally—as well as in this research—ESG is reminded time and again of the sheer challenge of affording and managing huge data storage volumes; however, vendors should also be aware that even in the face of these obstacles, there may be a need for a dual development path going forward. While many organizations will remain committed to the traditional approach of buying and managing storage hardware and software for the foreseeable future, there are some that would prefer alternatives that allow them to take advantage of commoditized hardware running advanced storage software or even cloud-based services. While it is imperative to continue catering to those organizations that prefer a richly-functional, eminently modifiable portfolio of storage infrastructure solutions, it is also important to provide options for those that lack the ability and/or desire to commit–or over-commit – resources to support data storage technology and processes.
Research Implications for IT Professionals
IT professionals should read this report to look for opportunities—both in terms of the technologies and approaches or processes that they have missed or dismissed. Look for areas where other users are having success. At the same time, there’s likely to be some cathartic value to this report. Users will be happy to know that just about everyone is struggling with the fundamentals—managing data/capacity growth, budgets, data protection—and most people are equally or more concerned about TCO and service as they are interested in the latest shiny new storage widget. Clearly one area of opportunity is to look for efficiency that is tried and tested and (invariably) easily applied—think about using solid-state storage or judiciously adding a cloud component to your storage infrastructure mix. Also, it is important to consider where you think your storage environment and primary approach are headed; some users are looking for something akin to “storage as an application,” whereas others want to maintain a traditional hands-on approach. Either could work, but you need a strategy; otherwise, as the saying goes, “if you don’t know the destination, any road will do.”

Research Report: 2012 Storage Market Survey 50
© 2012 by The Enterprise Strategy Group, Inc. All Rights Reserved.
Research Methodology
To gather data for this report, ESG conducted a comprehensive online survey of IT and storage professionals from private- and public-sector organizations in North America (United States and Canada) from July 26 to August 8, 2012.To qualify for this survey, respondents were required to have day-to-day knowledge of or familiarity with their organization’s data storage environment and/or strategy. Additionally, respondents were required to be responsible for evaluating, purchasing, and/or managing data storage technology. All respondents were provided an incentive to complete the survey in the form of cash awards and/or cash equivalents.
After filtering out unqualified respondents, removing duplicate responses, and screening the remaining completed responses (on a number of criteria) for data integrity, ESG was left with a final total sample of 418 IT and storage professionals.
Please see the Respondent Demographics section of this report for more information on these respondents.
Note: Totals in figures and tables throughout this report may not add up to 100% due to rounding.
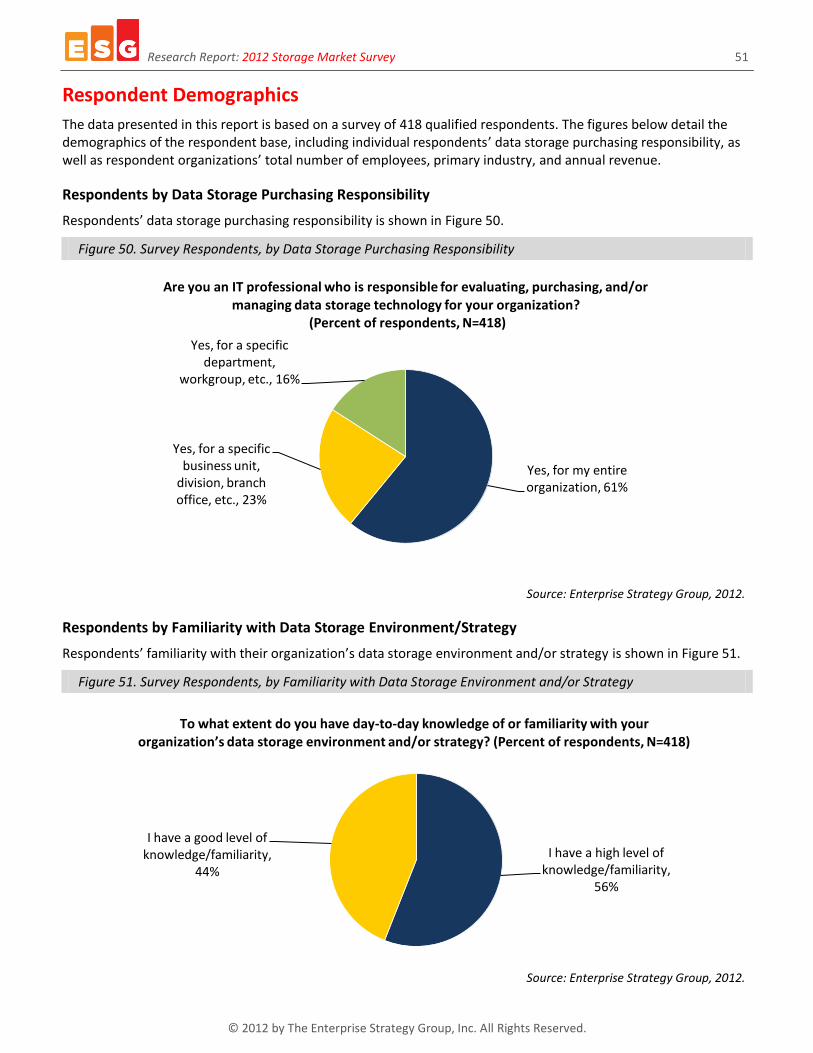
Research Report: 2012 Storage Market Survey 51
© 2012 by The Enterprise Strategy Group, Inc. All Rights Reserved.
Respondent Demographics
The data presented in this report is based on a survey of 418 qualified respondents. The figures below detail the demographics of the respondent base, including individual respondents’ data storage purchasing responsibility, as well as respondent organizations’ total number of employees, primary industry, and annual revenue.
Respondents by Data Storage Purchasing Responsibility
Respondents’ data storage purchasing responsibility is shown in Figure 50.
Figure 50. Survey Respondents, by Data Storage Purchasing Responsibility
Source: Enterprise Strategy Group, 2012.
Respondents by Familiarity with Data Storage Environment/Strategy
Respondents’ familiarity with their organization’s data storage environment and/or strategy is shown in Figure 51.
Figure 51. Survey Respondents, by Familiarity with Data Storage Environment and/or Strategy
Source: Enterprise Strategy Group, 2012.
Yes, for my entire organization, 61%
Yes, for a specific business unit,
division, branch office, etc., 23%
Yes, for a specific department,
workgroup, etc., 16%
Are you an IT professional who is responsible for evaluating, purchasing, and/or managing data storage technology for your organization?
(Percent of respondents, N=418)
I have a high level of knowledge/familiarity,
56%
I have a good level of knowledge/familiarity,
44%
To what extent do you have day-to-day knowledge of or familiarity with your organization’s data storage environment and/or strategy? (Percent of respondents, N=418)
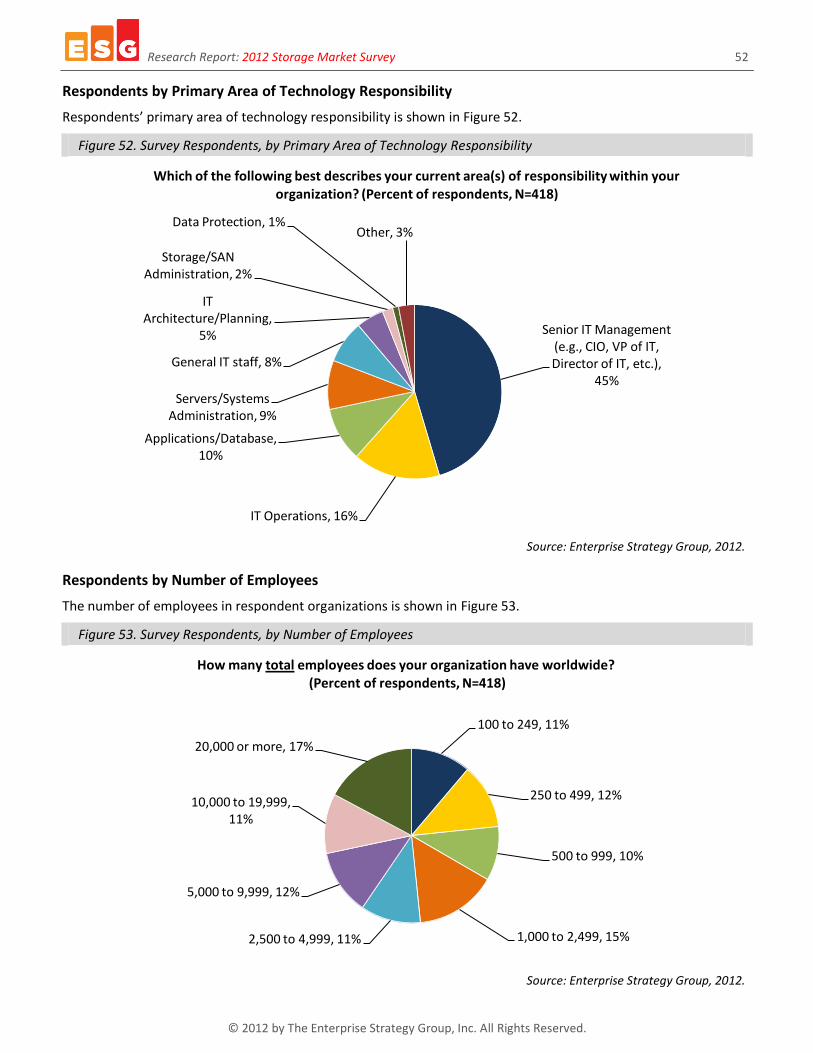
Research Report: 2012 Storage Market Survey 52
© 2012 by The Enterprise Strategy Group, Inc. All Rights Reserved.
Respondents by Primary Area of Technology Responsibility
Respondents’ primary area of technology responsibility is shown in Figure 52.
Figure 52. Survey Respondents, by Primary Area of Technology Responsibility
Source: Enterprise Strategy Group, 2012.
Respondents by Number of Employees
The number of employees in respondent organizations is shown in Figure 53.
Figure 53. Survey Respondents, by Number of Employees
Source: Enterprise Strategy Group, 2012.
Senior IT Management (e.g., CIO, VP of IT, Director of IT, etc.),
45%
IT Operations, 16%
Applications/Database, 10%
Servers/Systems Administration, 9%
General IT staff, 8%
IT Architecture/Planning,
5%
Storage/SAN Administration, 2%
Data Protection, 1% Other, 3%
Which of the following best describes your current area(s) of responsibility within your organization? (Percent of respondents, N=418)
100 to 249, 11%
250 to 499, 12%
500 to 999, 10%
1,000 to 2,499, 15% 2,500 to 4,999, 11%
5,000 to 9,999, 12%
10,000 to 19,999, 11%
20,000 or more, 17%
How many total employees does your organization have worldwide? (Percent of respondents, N=418)
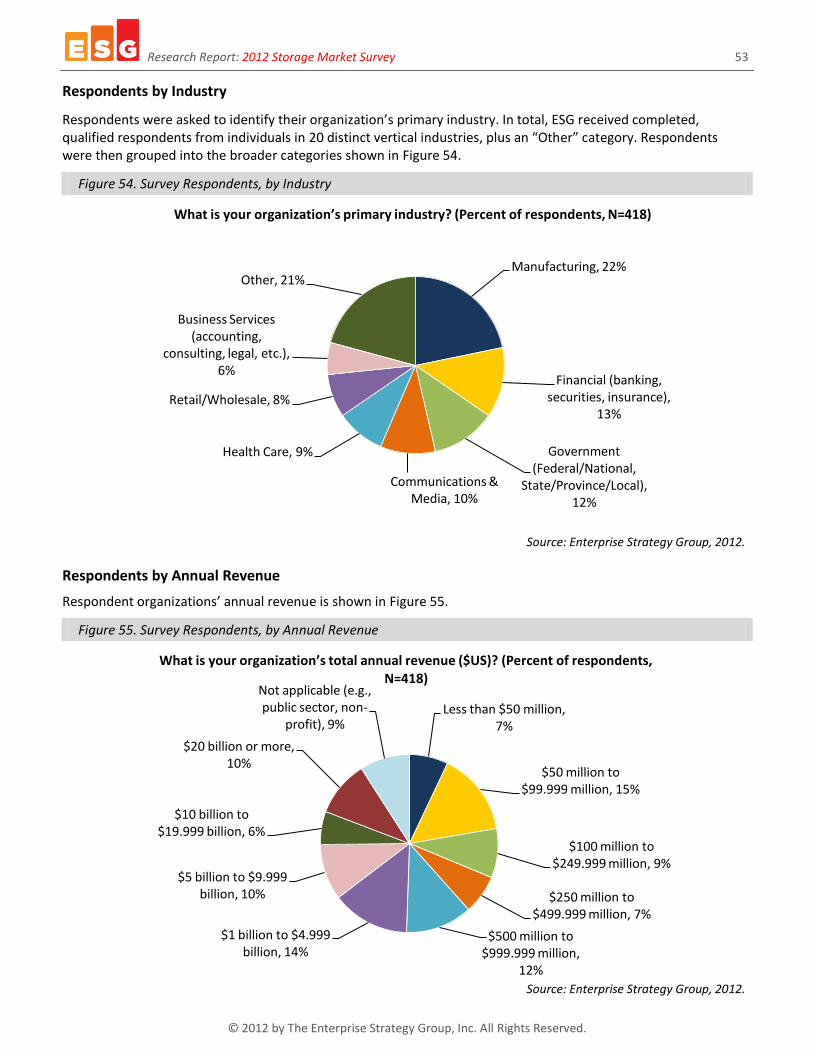
Research Report: 2012 Storage Market Survey 53
© 2012 by The Enterprise Strategy Group, Inc. All Rights Reserved.
Respondents by Industry
Respondents were asked to identify their organization’s primary industry. In total, ESG received completed, qualified respondents from individuals in 20 distinct vertical industries, plus an “Other” category. Respondents were then grouped into the broader categories shown in Figure 54.
Figure 54. Survey Respondents, by Industry
Source: Enterprise Strategy Group, 2012.
Respondents by Annual Revenue
Respondent organizations’ annual revenue is shown in Figure 55.
Figure 55. Survey Respondents, by Annual Revenue
Source: Enterprise Strategy Group, 2012.
Manufacturing, 22%
Financial (banking, securities, insurance),
13%
Government (Federal/National,
State/Province/Local), 12%
Communications & Media, 10%
Health Care, 9%
Retail/Wholesale, 8%
Business Services (accounting,
consulting, legal, etc.), 6%
Other, 21%
What is your organization’s primary industry? (Percent of respondents, N=418)
Less than $50 million, 7%
$50 million to $99.999 million, 15%
$100 million to $249.999 million, 9%
$250 million to $499.999 million, 7%
$500 million to $999.999 million,
12%
$1 billion to $4.999 billion, 14%
$5 billion to $9.999 billion, 10%
$10 billion to $19.999 billion, 6%
$20 billion or more, 10%
Not applicable (e.g., public sector, non-
profit), 9%
What is your organization’s total annual revenue ($US)? (Percent of respondents, N=418)

Research Report: 2012 Storage Market Survey 54
© 2012 by The Enterprise Strategy Group, Inc. All Rights Reserved.
Respondents by 2012 IT Budget
Respondent organizations’ 2012 IT budget is shown in Figure 56.
Figure 56. Survey Respondents, by 2012 IT Budget
Source: Enterprise Strategy Group, 2012.
Respondents by Number of Production Servers
The number of production servers in respondent organizations is shown in Figure 57.
Figure 57. Survey Respondents, by Number of Production Servers
Source: Enterprise Strategy Group, 2012.
Less than $1 million, 27%
$1 million to $4.999 million, 20%
$5 million to $9.999 million, 10%
$10 million to $24.999 million, 13%
$25 million to $49.999 million, 9%
$50 million to $99.999 million, 6%
$100 million to $249.999 million, 6%
$250 million to $499.999 million, 6%
$500 million or more, 1% Don’t know, 1%
To the best of your knowledge, what is your organization’s total 2012 budget for all IT capital expenditures (including hardware, software, and services) ($US)?
(Percent of respondents, N=361)
Less than 25, 18%
25 to 49, 12%
50 to 100, 13%
101 to 250, 14%
251 to 500, 15%
501 to 1,000, 6%
1,001 to 2,500, 7%
2,501 to 5,000, 5%
More than 5,000, 9%
Approximately how many production servers (whether physical or virtual) are supported worldwide by your IT organization? (Percent of respondents, N=418)
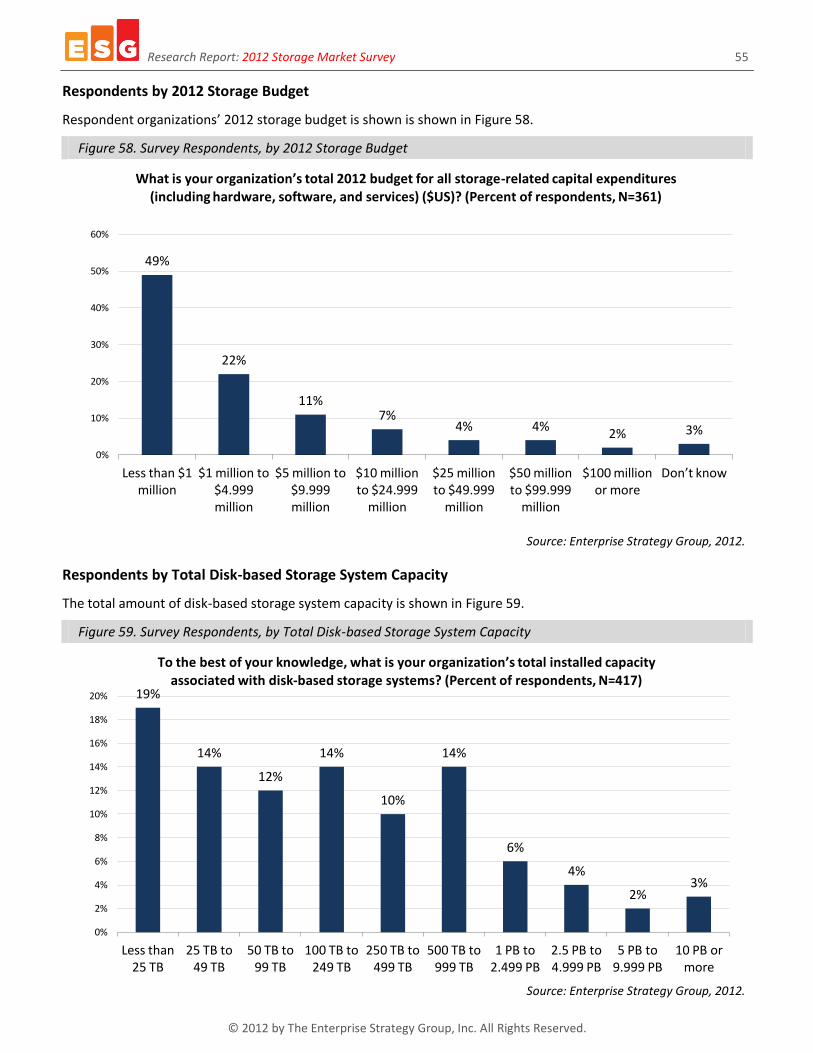
Research Report: 2012 Storage Market Survey 55
© 2012 by The Enterprise Strategy Group, Inc. All Rights Reserved.
Respondents by 2012 Storage Budget
Respondent organizations’ 2012 storage budget is shown is shown in Figure 58.
Figure 58. Survey Respondents, by 2012 Storage Budget
Source: Enterprise Strategy Group, 2012.
Respondents by Total Disk-based Storage System Capacity
The total amount of disk-based storage system capacity is shown in Figure 59.
Figure 59. Survey Respondents, by Total Disk-based Storage System Capacity
Source: Enterprise Strategy Group, 2012.
49%
22%
11% 7%
4% 4% 2% 3%
0%
10%
20%
30%
40%
50%
60%
Less than $1 million
$1 million to $4.999 million
$5 million to $9.999 million
$10 million to $24.999
million
$25 million to $49.999
million
$50 million to $99.999
million
$100 million or more
Don’t know
What is your organization’s total 2012 budget for all storage-related capital expenditures (including hardware, software, and services) ($US)? (Percent of respondents, N=361)
19%
14%
12%
14%
10%
14%
6%
4%
2% 3%
0%
2%
4%
6%
8%
10%
12%
14%
16%
18%
20%
Less than 25 TB
25 TB to 49 TB
50 TB to 99 TB
100 TB to 249 TB
250 TB to 499 TB
500 TB to 999 TB
1 PB to 2.499 PB
2.5 PB to 4.999 PB
5 PB to 9.999 PB
10 PB or more
To the best of your knowledge, what is your organization’s total installed capacity associated with disk-based storage systems? (Percent of respondents, N=417)

Research Report: 2012 Storage Market Survey 56
© 2012 by The Enterprise Strategy Group, Inc. All Rights Reserved.
Respondents by Server Virtualization Usage
Respondent organizations’ usage of server virtualization technology is shown in Figure 60.
Figure 60. Survey Respondents, by Usage of Server Virtualization Technology
Source: Enterprise Strategy Group, 2012.
Respondents by Percentage of x86 Servers Virtualized
The approximate percentage of x86 servers virtualized in respondents’ organizations is shown in Figure 61.
Figure 61. Survey Respondents, by Percentage of x86 Servers Virtualized
Source: Enterprise Strategy Group, 2012.
Yes, 74%
No, 23%
Don't know, 2%
Is your organization using server virtualization technology, in which multiple virtual machines can be run on a single physical server? (Percent of respondents, N=418)
10% 11%
16%
14%
11%
9% 8% 8%
6% 6%
1%
0%
2%
4%
6%
8%
10%
12%
14%
16%
18%
Less than 10% of servers
10% to 20% of servers
21% to 30% of servers
31% to 40% of servers
41% to 50% of servers
51% to 60% of servers
61% to 70% of servers
71% to 80% of servers
81% to 90% of servers
91% to 100% of servers
Don’t know
Of all the potential x86 servers in your organization that can be virtualized, approximately what percentage of these systems has actually been virtualized to date?
(Percent of respondents, N=311)

Research Report: 2012 Storage Market Survey 57
© 2012 by The Enterprise Strategy Group, Inc. All Rights Reserved.
Respondents by Total Number of Virtual Machines
The approximate total number of virtual machines in respondents’ organizations is shown in Figure 62.
Figure 62. Survey Respondents, by Total Number of Virtual Machines
Source: Enterprise Strategy Group, 2012.
Respondents by Total Storage Capacity Used to Support Virtual Server Environments
The amount of total storage capacity used to support virtual server environments is shown in Figure 62.
Figure 63. Survey Respondents, by Total Storage Capacity Used to Support Virtual Server Environments
Source: Enterprise Strategy Group, 2012.
21% 19%
15% 13%
9%
6%
3% 2%
3%
9%
0%
5%
10%
15%
20%
25%
Less than 25
25 to 49 50 to 100 101 to 250
251 to 500
501 to 1,000
1,001 to 2,500
2,501 to 5,000
More than 5,000
Don’t know
Approximately how many total virtual machines (whether production or test/development) are currently deployed in your organization?
(Percent of respondents, N=310)
4%
20%
14% 15%
9%
5%
8%
4% 6%
15%
0%
5%
10%
15%
20%
25%
Less than 1 TB
1 TB to 5 TB
6 TB to 10 TB
11 TB to 25 TB
26 TB to 49 TB
50 TB to 99 TB
100 TB to 249 TB
250 TB to 499 TB
500 TB or more
Don’t know
Approximately how much total storage capacity is currently used to support your virtual server environment (including storage of virtual machine images, applications,
and associated data)? (Percent of respondents, N=311)

Research Report: 2012 Storage Market Survey 58
© 2012 by The Enterprise Strategy Group, Inc. All Rights Reserved.
Respondents by Role of Data Storage Technology in IT and Business Operations
Figure 64 reveals the role data storage technology plays in respondent organizations’ IT and business operations.
Figure 64. Survey Respondents, by Role of Data Storage Technology in Business and IT Operations
Source: Enterprise Strategy Group, 2012.
Respondents by Importance of Data
Figure 65 reveals the level of importance that organizations assign to their data.
Figure 65. Survey Respondents, by Importance of Data
Source: Enterprise Strategy Group, 2012.
Strategic – effective storage strategies are
critical to core applications/business
processes and can lead to competitive advantage for our organization, 51%
Tactical – storage is an important part of our IT operations but it is
not viewed as a strategic tool or asset,
41%
Afterthought – storage is necessary but we don't think
about it much unless we need to add new
capacity, 6%
Don't know / no opinion, 2%
Which of the following best describes the role that data storage technology plays in your organization's IT and business operations? (Percent of respondents, N=418)
Data helps to support our business
(we offer physical products and services), 70%
Data is our business (our core products
and services are information-based),
30%
Which of the following statements best describes your organization’s perspective on data? (Percent of respondents, N=418)

20 Asylum Street | Milford, MA 01757 | Tel: 508.482.0188 Fax: 508.482.0128 | www.esg-global.com