RESEARCH REPORT 2021 Poverty Projections
46
RESEARCH REPORT 2021 Poverty Projections Assessing the Impact of Benefits and Stimulus Measures Laura Wheaton Linda Giannarelli Ilham Dehry July 2021 FROM SAFETY NET TO SOLID GROUND
Transcript of RESEARCH REPORT 2021 Poverty Projections
RESEARCH REPORT
2021 Poverty Projections Assessing the Impact of Benefits and Stimulus Measures
Laura Wheaton Linda Giannarelli Ilham Dehry
July 2021
F R O M S A F E T Y N E T T O S O L I D G R O U N D

ABOUT THE URBAN INSTITUTE
The nonprofit Urban Institute is a leading research organization dedicated to developing evidence-based insights
that improve people’s lives and strengthen communities. For 50 years, Urban has been the trusted source for
rigorous analysis of complex social and economic issues; strategic advice to policymakers, philanthropists, and
practitioners; and new, promising ideas that expand opportunities for all. Our work inspires effective decisions
that advance fairness and enhance the well-being of people and places.
Copyright © July 2021. Urban Institute. Permission is granted for reproduction of this file, with attribution to the
Urban Institute. Cover image by Tim Meko.
Contents Acknowledgments iv
2021 Poverty Projections: Assessing the Impact of Benefits and Stimulus Measures 1
2021 Poverty Projections 3
COVID Relief Policies Included in the Estimates 10
Methods for Creating the Estimates 12
Effect of Benefits and COVID Policies on Poverty 14
Why Do Antipoverty Effects Vary? 17
Program Effects in 2018 and 2021 18
Individual Program Effects 25
Conclusions 26
Appendix: Additional Tables 29
Notes 34
References 39
About the Authors 40
Statement of Independence 41

i v A C K N O W L E D G M E N T S
Acknowledgments This report was funded by the Robert Wood Johnson Foundation. The views expressed do not
necessarily reflect the views of the Foundation.
The views expressed are those of the authors and should not be attributed to the Robert Wood
Johnson Foundation or to the Urban Institute, its trustees, or its funders. Funders do not determine
research findings or the insights and recommendations of Urban experts. Further information on the
Urban Institute’s funding principles is available at urban.org/fundingprinciples.
The authors gratefully acknowledge the large team that designed and implemented the many
policy simulations underlying these estimates, including Sarah Minton, Joyce Morton, Kelly Dwyer,
Paul Johnson, Sarah Knowles, Danielle Kwon, Elaine Maag, Katie Shantz, Silke Taylor, and Kevin
Werner. We also owe thanks to Jeffrey Passel for developing the 2021 population weight
adjustments; to Janet Holtzblatt, Jack Smalligan, and Wayne Vroman for advising on policy changes;
to staff of the California Legislative Analyst’s Office and the Public Policy Institute of California for
information on California policies; to Ed Bolen and Brynne Keith-Jennings at the Center on Budget
and Policy Priorities for information about state Supplemental Nutrition Assistance Program waivers,
and to Gregory Acs, Sarah Minton, and Elaine Waxman for support in developing the assumptions and
for their comments on earlier drafts.
2021 Poverty Projections: Assessing
the Impact of Benefits and Stimulus
Measures At the midpoint of 2021, understanding the extent of need among America’s families presents unique
challenges. On the one hand, the economy is improving, employment is increasing, two additional
rounds of stimulus checks have been distributed, advance child tax credits are about to begin, and
many pandemic-related benefits remain in place. Fewer people than in December 2020 report that
they sometimes or often do not have enough to eat or that they are behind in their rent.1 On the other
hand, the number of jobs in the US economy in June 2021 was 6 million lower than in December 2019
(before the COVID-19 pandemic hit the US),2 no new rounds of stimulus checks are planned,
enhanced unemployment benefits are scheduled to end on September 6 (and earlier in many states), a
temporary increase in the maximum Supplemental Nutrition Assistance Program (SNAP) benefit will
end in September, and SNAP emergency allotments are ceasing in some states.
We previously projected that the American Rescue Plan, enacted in March 2021, would reduce
the 2021 annual poverty rate from 13.7 to 8.7 percent (Wheaton et al. 2021). We now project a 2021
poverty rate of 7.7 percent. The revised projection accounts for improvements in the economy,
incorporates updated state-level information on pandemic-related policies, and improves the method
for weighting the data to reflect 2021. Both the earlier poverty projections and these updated
projections use the Supplemental Poverty Measure (SPM), which allows a more comprehensive
assessment of families’ economic well-being than the official poverty measure. The projections,
developed using the Urban Institute’s Analysis of Transfers, Taxes, and Income Security (ATTIS) model,
take into account expected levels of employment and income in 2021, safety-net benefits, taxes and
tax credits, state “back to work” bonuses, and federal and state stimulus checks. The projections are
an annual measure and do not reflect the increased hardship that some families may experience
toward the end of 2021 once the stimulus checks have been spent, federal pandemic unemployment
benefits end, and some pandemic-related SNAP benefit increases are scaled back.
We present the updated 2021 projections by key characteristics, examine how much government
benefits reduce the poverty rate, and consider reasons why some subgroups of people may be more
likely than others to have their incomes raised above the poverty threshold by government benefits.
The 2021 poverty projections include the following:

2 2 0 2 1 P O V E R T Y P R O J E C T I O N S
◼ Using the SPM, the annual poverty rate projection for 2021, 7.7 percent, is well below the
rate of 13.9 percent that we estimate for 2018 with the same methods.
◼ The projected percentage of people in deep poverty in 2021 (that is, with family income less
than half the poverty threshold) is 2.6 percent, compared with 4.2 percent in 2018.
◼ The projected poverty rates are lowest for children (5.6 percent), higher for adults ages 18 to
64 (8.1 percent), and highest for people age 65 and older (9.2 percent).
◼ The 2021 poverty rate is projected to be higher for Black, non-Hispanic people (9.2 percent),
Hispanic people (11.8 percent), and non-Hispanic Asian American and Pacific Islanders, or
AAPIs (10.8 percent), than for white, non-Hispanic people (5.8 percent).3
◼ Projected poverty rates vary across the states. For example, the projected 2021 child poverty
rate ranges from 1.9 percent in Maine to 8.8 percent in Delaware and Florida.
Considering the impact of government benefits on the poverty rate, our key findings are as follows:
◼ We project that without any benefits from unemployment insurance (UI), government means-
tested programs (either standard benefits or benefits increased because of the pandemic),
pandemic-related stimulus payments or state payments, or the advance child tax credit, the
2021 poverty rate would be 23.1 percent. The combined effect of all the benefits (UI, means-
tested benefits, refundable tax credits, federal stimulus checks, the advance child tax credit,
and state payments) reduces that rate 67 percent to 7.7 percent, keeping nearly 50 million
Americans out of poverty in 2021.
◼ The federal stimulus checks have a larger antipoverty impact than any of the other programs;
if all other programs were in place but the stimulus checks had not been paid, we project 12.4
million more people would be in poverty in 2021. SNAP alone keeps 7.9 million people out of
poverty in 2021, and UI benefits lower the number in poverty by 6.7 million (assuming all
other programs are in place).
◼ Considering results by age group, the combined benefits have the largest impact on children,
reducing their projected 2021 poverty rate 81 percent relative to what it would be without
any benefits (from 30.1 percent to 5.6 percent).
◼ Considering results by race and ethnicity, the benefits have the largest impact on Black non-
Hispanic people (reducing their 2021 projected poverty rate 74 percent) and the smallest
impact on AAPIs (reducing their 2021 projected poverty rate 54 percent). The smaller

2 0 2 1 P O V E R T Y P R O J E C T I O N S 3
reduction in poverty for AAPIs is likely because of a combination of factors related to
geographic location and other demographic characteristics.
◼ Focusing on UI benefits and means-tested benefits (including their pandemic expansions but
omitting the pandemic-related stimulus checks, state payments, and advance child tax credits)
these programs reduced the projected 2021 poverty rate from 23.1 percent to 12.6 percent.
These programs also had a large impact before the pandemic, but it was not as large as
projected for 2021. We estimate that UI benefits and means-tested benefits reduced the
2018 poverty rate from 20.3 percent to 13.9 percent.
2021 Poverty Projections
Our poverty projections use an expanded poverty measure that considers not only a family’s cash
income but also their tax payments, child care and other work-related expenses, medical out-of-
pocket expenses, tax credits, in-kind benefits such as housing subsidies and nutrition help, and
stimulus checks (Fox 2020). This metric is the Supplemental Poverty Measure, or SPM. The SPM not
only uses a broader definition of income than the official poverty measure, it also uses a different
threshold (or “poverty line”) to determine if a family is in poverty. The SPM uses a poverty threshold
that reflects actual spending on food, clothing, shelter, and utilities plus a small amount for other
spending, at between the 30th to 36th percentile of the spending distribution based on data for
families with two children. The SPM threshold is adjusted by the number of adults and children in the
family and whether the family rents their home, owns without a mortgage, or owns with a mortgage,
The threshold is further adjusted to reflect differences in median rent for two-bedroom units across
major metropolitan areas and for the remaining grouped metropolitan areas and nonmetropolitan
areas within each state.
To develop the 2021 projected thresholds, we begin with the 2019 SPM thresholds developed by
the Bureau of Labor Statistics for renters and for owners with and without a mortgage, adjust for
projected inflation between 2019 and 2021, apply the Census Bureau’s adjustments for family size and
number of children, and apply the geographic adjustments developed by the Census Bureau.4 We then
assign the thresholds to families in the projected 2021 data. When averaged nationally, the projected
threshold is $13,667 for a one-person family, $20,669 for a family with one adult and one child, and
$30,232 for a family with two adults and two children. The projected thresholds for a family with two
adults and two children range from a low of $21,001 for a family that lives in a nonmetropolitan area of
Arkansas and owns their home without a mortgage to a high of $47,134 for a family that lives in the San
Jose–Sunnyvale–Santa Clara, California, metropolitan area and has a mortgage.
4 2 0 2 1 P O V E R T Y P R O J E C T I O N S
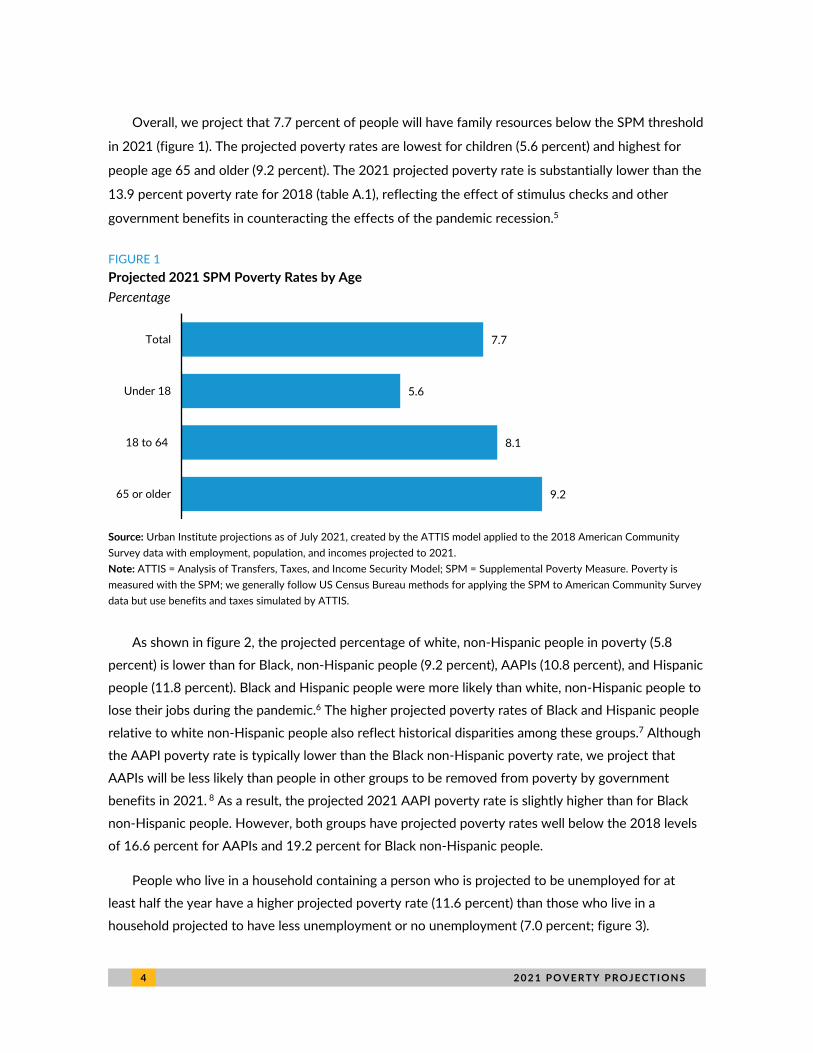
Overall, we project that 7.7 percent of people will have family resources below the SPM threshold
in 2021 (figure 1). The projected poverty rates are lowest for children (5.6 percent) and highest for
people age 65 and older (9.2 percent). The 2021 projected poverty rate is substantially lower than the
13.9 percent poverty rate for 2018 (table A.1), reflecting the effect of stimulus checks and other
government benefits in counteracting the effects of the pandemic recession.5
FIGURE 1
Projected 2021 SPM Poverty Rates by Age
Percentage
Source: Urban Institute projections as of July 2021, created by the ATTIS model applied to the 2018 American Community
Survey data with employment, population, and incomes projected to 2021.
Note: ATTIS = Analysis of Transfers, Taxes, and Income Security Model; SPM = Supplemental Poverty Measure. Poverty is
measured with the SPM; we generally follow US Census Bureau methods for applying the SPM to American Community Survey
data but use benefits and taxes simulated by ATTIS.
As shown in figure 2, the projected percentage of white, non-Hispanic people in poverty (5.8
percent) is lower than for Black, non-Hispanic people (9.2 percent), AAPIs (10.8 percent), and Hispanic
people (11.8 percent). Black and Hispanic people were more likely than white, non-Hispanic people to
lose their jobs during the pandemic.6 The higher projected poverty rates of Black and Hispanic people
relative to white non-Hispanic people also reflect historical disparities among these groups.7 Although
the AAPI poverty rate is typically lower than the Black non-Hispanic poverty rate, we project that
AAPIs will be less likely than people in other groups to be removed from poverty by government
benefits in 2021. 8 As a result, the projected 2021 AAPI poverty rate is slightly higher than for Black
non-Hispanic people. However, both groups have projected poverty rates well below the 2018 levels
of 16.6 percent for AAPIs and 19.2 percent for Black non-Hispanic people.
People who live in a household containing a person who is projected to be unemployed for at
least half the year have a higher projected poverty rate (11.6 percent) than those who live in a
household projected to have less unemployment or no unemployment (7.0 percent; figure 3).
7.7
5.6
8.1
9.2
Total
Under 18
18 to 64
65 or older

2 0 2 1 P O V E R T Y P R O J E C T I O N S 5
FIGURE 2
Projected 2021 SPM Poverty Rates by Race and Ethnicity
Percentage
Source: Urban Institute projections as of July 2021, created by the ATTIS model applied to the 2018 American Community
Survey data with employment, population, and incomes projected to 2021.
Note: AAPI = Asian American or Pacific Islander; ATTIS = Analysis of Transfers, Taxes, and Income Security Model; SPM =
Supplemental Poverty Measure. Poverty is measured with the SPM; we generally follow US Census Bureau methods for
applying the SPM to American Community Survey data but use benefits and taxes simulated by ATTIS.
FIGURE 3
Projected 2021 SPM Poverty Rates by Whether Someone in the Household is Unemployed for at
Least Six Months of 2021
Percentage
Source: Urban Institute projections as of July 2021, created by the ATTIS model applied to the 2018 American Community
Survey data with employment, population, and incomes projected to 2021.
Note: ATTIS = Analysis of Transfers, Taxes, and Income Security Model; SPM = Supplemental Poverty Measure. Poverty is
measured with the SPM; we generally follow US Census Bureau methods for applying the SPM to American Community Survey
data but use benefits and taxes simulated by ATTIS. People are counted as unemployed for six months or more if they appeared
to be not working and looking for work for at least six months in the original survey data or if they were identified as losing their
job due to the recession and being unemployed for at least six months in 2021. In official unemployment statistics, some people
who lost their jobs could be classified as discouraged workers or no longer in the labor force.
7.7
5.8
9.2
11.8
10.8
Total
White, non-Hispanic
Black, non-Hispanic
Hispanic
AAPI, non-Hispanic
7.7
11.6
7.0
Total
Yes
No
6 2 0 2 1 P O V E R T Y P R O J E C T I O N S
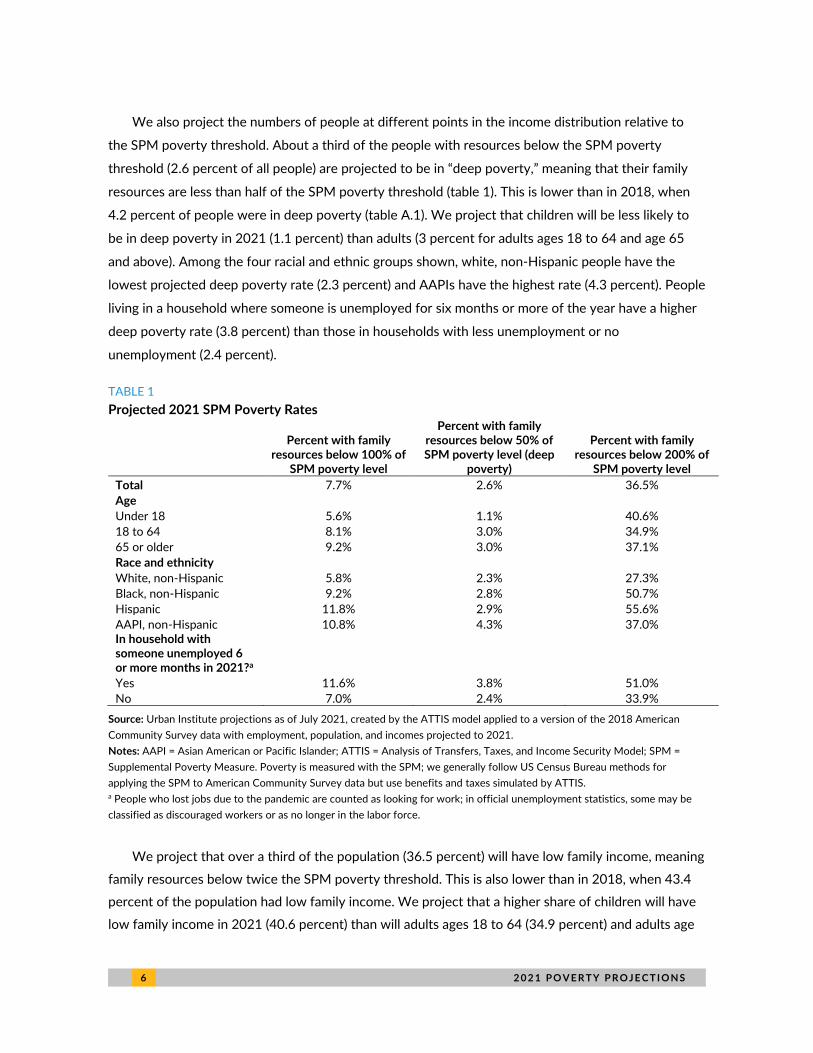
We also project the numbers of people at different points in the income distribution relative to
the SPM poverty threshold. About a third of the people with resources below the SPM poverty
threshold (2.6 percent of all people) are projected to be in “deep poverty,” meaning that their family
resources are less than half of the SPM poverty threshold (table 1). This is lower than in 2018, when
4.2 percent of people were in deep poverty (table A.1). We project that children will be less likely to
be in deep poverty in 2021 (1.1 percent) than adults (3 percent for adults ages 18 to 64 and age 65
and above). Among the four racial and ethnic groups shown, white, non-Hispanic people have the
lowest projected deep poverty rate (2.3 percent) and AAPIs have the highest rate (4.3 percent). People
living in a household where someone is unemployed for six months or more of the year have a higher
deep poverty rate (3.8 percent) than those in households with less unemployment or no
unemployment (2.4 percent).
TABLE 1
Projected 2021 SPM Poverty Rates
Percent with family resources below 100% of
SPM poverty level
Percent with family resources below 50% of SPM poverty level (deep
poverty)
Percent with family resources below 200% of
SPM poverty level
Total 7.7% 2.6% 36.5%
Age Under 18 5.6% 1.1% 40.6%
18 to 64 8.1% 3.0% 34.9%
65 or older 9.2% 3.0% 37.1%
Race and ethnicity White, non-Hispanic 5.8% 2.3% 27.3%
Black, non-Hispanic 9.2% 2.8% 50.7%
Hispanic 11.8% 2.9% 55.6%
AAPI, non-Hispanic 10.8% 4.3% 37.0% In household with someone unemployed 6 or more months in 2021?a Yes 11.6% 3.8% 51.0%
No 7.0% 2.4% 33.9%
Source: Urban Institute projections as of July 2021, created by the ATTIS model applied to a version of the 2018 American
Community Survey data with employment, population, and incomes projected to 2021.
Notes: AAPI = Asian American or Pacific Islander; ATTIS = Analysis of Transfers, Taxes, and Income Security Model; SPM =
Supplemental Poverty Measure. Poverty is measured with the SPM; we generally follow US Census Bureau methods for
applying the SPM to American Community Survey data but use benefits and taxes simulated by ATTIS. a People who lost jobs due to the pandemic are counted as looking for work; in official unemployment statistics, some may be
classified as discouraged workers or as no longer in the labor force.
We project that over a third of the population (36.5 percent) will have low family income, meaning
family resources below twice the SPM poverty threshold. This is also lower than in 2018, when 43.4
percent of the population had low family income. We project that a higher share of children will have
low family income in 2021 (40.6 percent) than will adults ages 18 to 64 (34.9 percent) and adults age
2 0 2 1 P O V E R T Y P R O J E C T I O N S 7
65 and older (37.1 percent). Among the four groups shown, white, non-Hispanic people are projected
to be the least likely to have low family income (27.3 percent) and Hispanic people are projected to be
the most likely to have low family income (55.6 percent). Among non-Hispanic Black people, the
projected percentage with low family income (50.7 percent) is slightly lower than projected for
Hispanic people. The share of AAPIs projected to have low family income (37.0 percent) is higher than
the share of white non-Hispanic people but lower than the share of Black non-Hispanic and Hispanic
people. Over half (51.0 percent) of people in a household where someone is projected to be
unemployed for six or more months of the year are projected to have low family income, compared
with 33.9 percent of people in households with less unemployment or no unemployment.
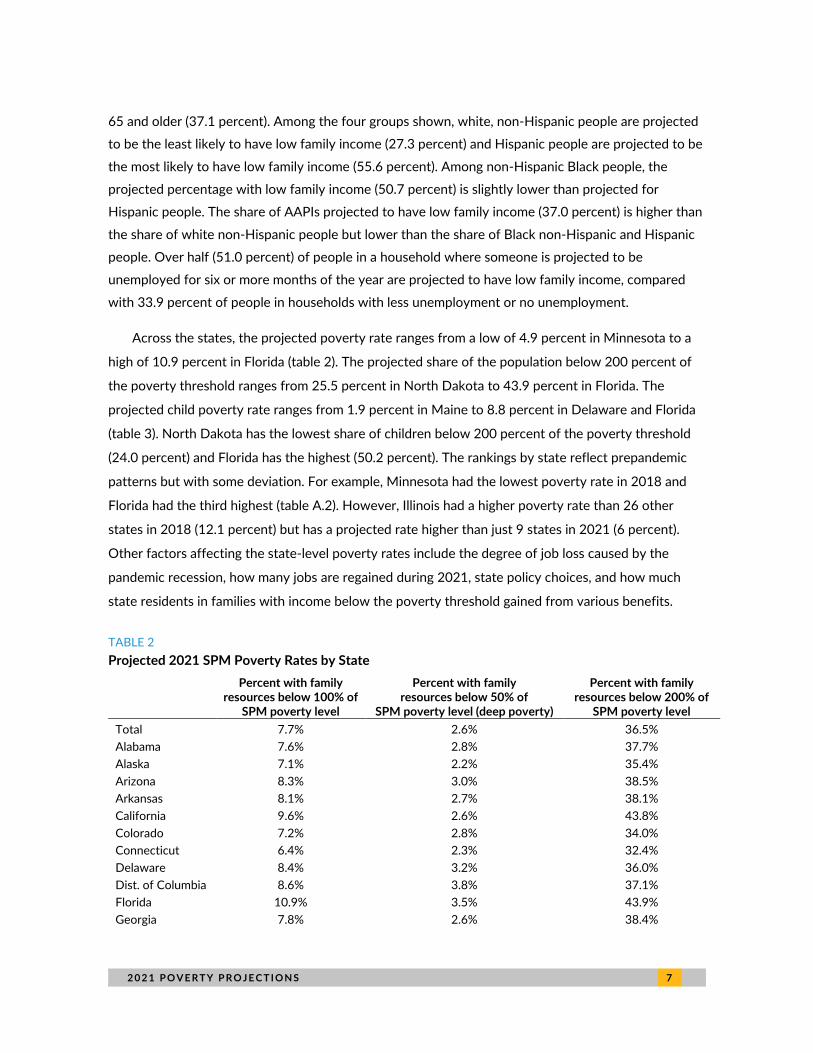
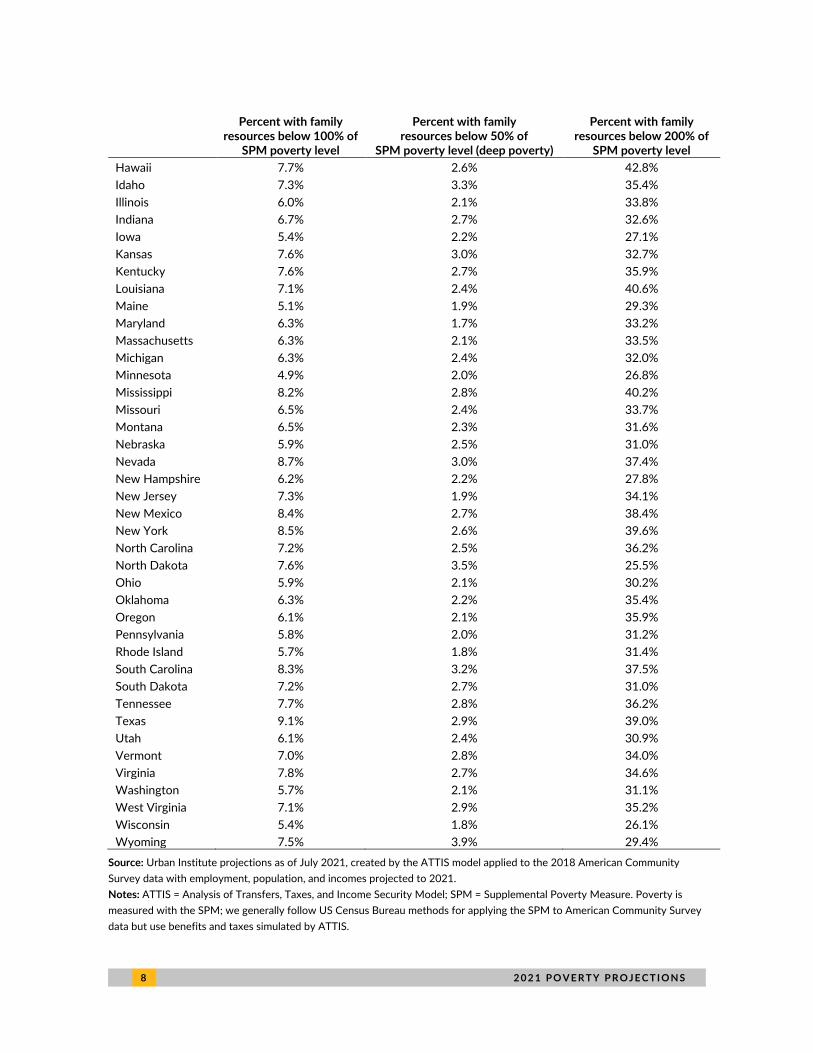
Across the states, the projected poverty rate ranges from a low of 4.9 percent in Minnesota to a
high of 10.9 percent in Florida (table 2). The projected share of the population below 200 percent of
the poverty threshold ranges from 25.5 percent in North Dakota to 43.9 percent in Florida. The
projected child poverty rate ranges from 1.9 percent in Maine to 8.8 percent in Delaware and Florida
(table 3). North Dakota has the lowest share of children below 200 percent of the poverty threshold
(24.0 percent) and Florida has the highest (50.2 percent). The rankings by state reflect prepandemic
patterns but with some deviation. For example, Minnesota had the lowest poverty rate in 2018 and
Florida had the third highest (table A.2). However, Illinois had a higher poverty rate than 26 other
states in 2018 (12.1 percent) but has a projected rate higher than just 9 states in 2021 (6 percent).
Other factors affecting the state-level poverty rates include the degree of job loss caused by the
pandemic recession, how many jobs are regained during 2021, state policy choices, and how much
state residents in families with income below the poverty threshold gained from various benefits.
TABLE 2
Projected 2021 SPM Poverty Rates by State
Percent with family resources below 100% of
SPM poverty level
Percent with family resources below 50% of
SPM poverty level (deep poverty)
Percent with family resources below 200% of
SPM poverty level
Total 7.7% 2.6% 36.5%
Alabama 7.6% 2.8% 37.7%
Alaska 7.1% 2.2% 35.4%
Arizona 8.3% 3.0% 38.5%
Arkansas 8.1% 2.7% 38.1%
California 9.6% 2.6% 43.8%
Colorado 7.2% 2.8% 34.0%
Connecticut 6.4% 2.3% 32.4%
Delaware 8.4% 3.2% 36.0%
Dist. of Columbia 8.6% 3.8% 37.1%
Florida 10.9% 3.5% 43.9%
Georgia 7.8% 2.6% 38.4%
8 2 0 2 1 P O V E R T Y P R O J E C T I O N S
Percent with family resources below 100% of
SPM poverty level
Percent with family resources below 50% of
SPM poverty level (deep poverty)
Percent with family resources below 200% of
SPM poverty level
Hawaii 7.7% 2.6% 42.8%
Idaho 7.3% 3.3% 35.4%
Illinois 6.0% 2.1% 33.8%
Indiana 6.7% 2.7% 32.6%
Iowa 5.4% 2.2% 27.1%
Kansas 7.6% 3.0% 32.7%
Kentucky 7.6% 2.7% 35.9%
Louisiana 7.1% 2.4% 40.6%
Maine 5.1% 1.9% 29.3%
Maryland 6.3% 1.7% 33.2%
Massachusetts 6.3% 2.1% 33.5%
Michigan 6.3% 2.4% 32.0%
Minnesota 4.9% 2.0% 26.8%
Mississippi 8.2% 2.8% 40.2%
Missouri 6.5% 2.4% 33.7%
Montana 6.5% 2.3% 31.6%
Nebraska 5.9% 2.5% 31.0%
Nevada 8.7% 3.0% 37.4%
New Hampshire 6.2% 2.2% 27.8%
New Jersey 7.3% 1.9% 34.1%
New Mexico 8.4% 2.7% 38.4%
New York 8.5% 2.6% 39.6%
North Carolina 7.2% 2.5% 36.2%
North Dakota 7.6% 3.5% 25.5%
Ohio 5.9% 2.1% 30.2%
Oklahoma 6.3% 2.2% 35.4%
Oregon 6.1% 2.1% 35.9%
Pennsylvania 5.8% 2.0% 31.2%
Rhode Island 5.7% 1.8% 31.4%
South Carolina 8.3% 3.2% 37.5%
South Dakota 7.2% 2.7% 31.0%
Tennessee 7.7% 2.8% 36.2%
Texas 9.1% 2.9% 39.0%
Utah 6.1% 2.4% 30.9%
Vermont 7.0% 2.8% 34.0%
Virginia 7.8% 2.7% 34.6%
Washington 5.7% 2.1% 31.1%
West Virginia 7.1% 2.9% 35.2%
Wisconsin 5.4% 1.8% 26.1%
Wyoming 7.5% 3.9% 29.4%
Source: Urban Institute projections as of July 2021, created by the ATTIS model applied to the 2018 American Community
Survey data with employment, population, and incomes projected to 2021.
Notes: ATTIS = Analysis of Transfers, Taxes, and Income Security Model; SPM = Supplemental Poverty Measure. Poverty is
measured with the SPM; we generally follow US Census Bureau methods for applying the SPM to American Community Survey
data but use benefits and taxes simulated by ATTIS.

2 0 2 1 P O V E R T Y P R O J E C T I O N S 9
TABLE 3
Projected 2021 SPM Poverty Rates by State, People Less than 18 Years Old
Percent with family resources below 100% of
SPM poverty level
Percent with family resources below 50% of SPM poverty level (deep
poverty)
Percent with family resources below 200% of
SPM poverty level
Total 5.6% 1.1% 40.6%
Alabama 5.1% 1.2% 41.2%
Alaska 4.9% 0.7% 37.7%
Arizona 6.5% 1.3% 44.0%
Arkansas 6.0% 0.9% 41.3%
California 7.0% 1.0% 49.2%
Colorado 4.7% 1.0% 37.8%
Connecticut 4.4% 0.9% 37.7%
Delaware 8.8% 2.7% 46.2%
Dist. of Columbia 5.0% 1.2% 48.1%
Florida 8.8% 1.7% 50.2%
Georgia 6.4% 1.2% 44.1%
Hawaii 4.0% 0.5% 49.5%
Idaho 4.5% 2.0% 38.4%
Illinois 3.8% 0.6% 36.9%
Indiana 4.5% 1.0% 35.8%
Iowa 2.9% 0.7% 26.2%
Kansas 5.3% 1.6% 34.5%
Kentucky 5.4% 1.5% 37.7%
Louisiana 4.6% 0.8% 44.2%
Maine 1.9% 0.4% 27.4%
Maryland 4.7% 0.7% 38.5%
Massachusetts 3.7% 0.6% 35.9%
Michigan 3.7% 0.7% 33.9%
Minnesota 2.0% 0.4% 27.1%
Mississippi 5.2% 0.9% 42.9%
Missouri 4.0% 0.6% 37.6%
Montana 2.8% 0.5% 32.8%
Nebraska 2.5% 0.7% 33.0%
Nevada 7.3% 1.6% 43.0%
New Hampshire 5.0% 1.2% 29.1%
New Jersey 6.4% 1.0% 39.2%
New Mexico 6.4% 1.4% 39.1%
New York 6.4% 1.1% 44.8%
North Carolina 5.6% 1.2% 41.2%
North Dakota 4.3% 1.0% 24.0%
Ohio 3.6% 0.7% 32.3%
Oklahoma 4.4% 0.9% 39.2%
Oregon 4.0% 0.8% 39.3%
Pennsylvania 3.5% 0.5% 33.7%
Rhode Island 4.6% 1.2% 36.3%
South Carolina 5.8% 1.3% 42.1%
South Dakota 5.0% 0.9% 32.5%
Tennessee 6.1% 1.6% 41.4%

1 0 2 0 2 1 P O V E R T Y P R O J E C T I O N S
Percent with family resources below 100% of
SPM poverty level
Percent with family resources below 50% of SPM poverty level (deep
poverty)
Percent with family resources below 200% of
SPM poverty level
Texas 8.0% 1.5% 44.9%
Utah 3.4% 0.8% 32.2%
Vermont 2.6% 0.5% 33.2%
Virginia 5.4% 1.1% 39.3%
Washington 3.2% 0.6% 35.1%
West Virginia 5.3% 1.5% 34.2%
Wisconsin 3.4% 0.7% 26.0%
Wyoming 4.7% 1.7% 32.4%
Source: Urban Institute projections as of July 2021, created by the ATTIS model applied to the 2018 American Community
Survey data with employment, population, and incomes projected to 2021.
Note: ATTIS = Analysis of Transfers, Taxes, and Income Security Model; SPM = Supplemental Poverty Measure. Poverty is
measured with the SPM; we generally follow US Census Bureau methods for applying the SPM to American Community Survey
data but use benefits and taxes simulated by ATTIS.
COVID Relief Policies Included in the Estimates
The Families First Coronavirus Response Act and CARES Act provided substantial relief to Americans
in 2020 and kept a projected 10.3 million people out of poverty (Giannarelli, Wheaton, and Acs
2020).9 Additional pandemic-relief legislation was enacted through the Coronavirus Response and
Relief Supplemental Appropriations Act in December 2020 and in the American Rescue Plan in March
2021.10 We model the following key elements of the 2020 and 2021 legislation that directly impact
families’ economic resources during 2021:11
◼ UI benefits: Before the passage of the December bill, many unemployed people were set to
exhaust their benefits at the end of 2020. The December legislation provided 11 additional
weeks of benefits and added $300 a week to regular state benefit amounts through the
middle of March 2021. The American Rescue Plan added another 25 weeks of benefits
(almost six months), including the additional $300 a week, from mid-March through
September 6, 2021.12 The American Rescue Plan also extended the special pandemic UI
program for people who do not usually qualify for UI (self-employed and gig workers) from its
previous expiration date in March to September 6. However, about half of the states have
opted to end participation in the federal pandemic UI enhancements before September, and
those policy differences are included in the model.13 As in our previous analysis, we assume
that not all unemployed people receive UI even if they appear eligible for it. The probabilities
of UI participation vary across states based in part on administrative data on UI receipt in the

2 0 2 1 P O V E R T Y P R O J E C T I O N S 1 1
first quarter of 2021; we also assume a lower rate of receipt among self-employed people
than among wage earners.14
◼ SNAP (formerly known as “food stamps”) benefits: The December 2020 legislation increased
the maximum monthly SNAP benefit 15 percent through June 30, 2021. The American
Rescue Plan extended the period for increased SNAP benefits by three months, to September
30, 2021. We also model provisions of the Families First Coronavirus Response Act of 2020
that temporarily suspended the time limit for able-bodied adults without children who do not
meet work requirements and that allow states to request emergency allotments that provide
all SNAP participants with the maximum benefit for their household size. We model a further
expansion of the emergency allotment beginning in April 2021 that guarantees that all SNAP
households receive at least $95 more than the benefit for which they would otherwise
qualify. Our projections assume that emergency allotments continue through the end of 2021,
except in the five states that have announced an earlier end date.15
◼ Economic impact payments (stimulus checks): We model the second stimulus check, enacted
by December 2020 legislation, and the third stimulus check, enacted by the American Rescue
Plan.
The December 2020 legislation made most adults eligible for a one-time payment of $600
($1,200 for a married couple), with an additional $600 for each dependent child under age 17.
The payments begin to phase out at income levels of $75,000 for single filers, $112,500 for
head-of-household filers (such as single parents with children), and $150,000 for married
couples. We assume that most but not all people eligible for the payments receive them.16 We
also model the December legislation’s extension of payments to certain families with mixed
immigration status who were ineligible for the first round of stimulus checks delivered in
2020. We model these families as receiving the new checks as well as receiving the first round
of checks retroactively.17
The American Rescue Plan provided a one-time payment of $1,400 ($2,800 for married
couples), with an additional $1,400 for each dependent. Unlike previous legislation, this
legislation allowed dependents of any age to be eligible for the rebate, not just children under
age 17. The payments begin to phase out at income levels of $75,000 for single filers,
$112,500 for head-of-household filers, and $150,000 for married couples. As with the second
stimulus check, we assume that most but not all people eligible for the payments receive them.
◼ Child tax credit: The American Rescue Plan makes several changes to the child tax credit for
tax year 2021. It makes the credit fully refundable, increases the amount to $3,600 per child

1 2 2 0 2 1 P O V E R T Y P R O J E C T I O N S
under age 6 and $3,000 per child age 6 and older, allows the credit to be taken on behalf of a
17-year-old (the prior maximum age was 16), and provides for monthly advance payments of
the credit beginning in July. The increased amount of the credit (the additional $1,000 or
$1,600 per child above the current-law amount of $2,000) begins to phase out at income
levels of $75,000 for single filers, $112,500 for head-of-household filers, and $150,000 for
married couples. Half of the credit would be issued in advance payments beginning in July
2021; the remaining credit would be delivered in 2022. For this analysis, we model only the
amount that would be paid in 2021. We assume that most people eligible for the increased
child tax credit receive it.18
◼ Other benefit increases: The simulation incorporates the increased funding for the Low
Income Home Energy Assistance Program that was included in the American Rescue Plan,
which we assume will increase the number of households with benefits during 2021.19 The
simulation also includes the four-month increase in the cash-value voucher available to
children and woman receiving benefits from the Special Supplemental Nutrition Program for
Women, Infants and Children.20
We do not estimate the effects of the American Rescue Plan’s increases to the earned income tax
credit and to the child and dependent care tax credit, because these benefits would not be delivered
in advance and so are unlikely to affect poverty levels in 2021.21
In addition to including federally funded pandemic-relief benefits, our estimates also include
pandemic-related policies instituted by some states.22 We include 2021 pandemic-relief payments
(state-level “stimulus checks”) in six states.23 We also model “back to work” bonuses that are being
paid in seven states to previously unemployed people who start a new job that meets their state’s
criteria.24 Both of these types of state payments are included as resources in computing the SPM.
Methods for Creating the Estimates
We project poverty rates using 2018 American Community Survey (ACS) data that we modified to
represent expected circumstances in 2021.25 To begin the projection, we adjusted employment
statuses for a sufficient number of people in the data so that the average monthly employment-to-
population ratios at the start of the year by age, sex, race and ethnicity, educational attainment, and
nativity all match actual levels in February 2021 (the most recent data available when we made the
adjustment) and so that we capture relative job loss to that point by state and industry.26 We also
increased the incidence of part-time work to reflect February 2021 levels. We then modeled

2 0 2 1 P O V E R T Y P R O J E C T I O N S 1 3
increasing employment from month to month for the remainder of the year based on national
projections from the Congressional Budget Office.27 Our poverty projections could be too high or low
if the actual rate of economic recovery during 2021 differs from the Congressional Budget Office
projections; further, although we captured state variation in employment at the start of the year, we did
not capture state variation in the rate at which unemployed people regain jobs throughout the year.
BOX 1
Programs Counted in Estimating the Effect of Safety-Net and Pandemic-Response Policies on Poverty
To estimate the effect of the safety net and COVID policies on poverty, we calculate SPM poverty
both with and without the following programs:
UI and traditional means-tested programs
◼ UI (including policy expansions)
◼ Supplemental Security Income
◼ Temporary Assistance for Needy Families and Solely State Funded Benefitsa
◼ Public and subsidized housing
◼ SNAP (including policy expansions)
◼ Special Supplemental Nutrition Program for Women, Infants and Children (including policy expansions)
◼ Low Income Home Energy Assistance Program (including policy expansions)
◼ Earned income tax credit and additional child tax credit (at traditional levels)b
Stimulus checks, advance child tax credit, and state payments (in some states)
◼ Second stimulus check (December 2020 legislation)
◼ Retroactive CARES stimulus check for certain families with mixed immigration statuses
◼ Third stimulus check (American Rescue Plan)
◼ One-half of the advance child tax creditc
◼ State pandemic relief payments (six states)
◼ State “back to work” bonuses (seven states)
Notes: Social Security is included in SPM resources but not in our estimate of the antipoverty effect of government programs. a We also capture the effect of state general assistance program benefits reported in the underlying 2018 American Community
Survey data, but we do not model changes or expansions to these programs. b We model the earned income tax credit and additional child tax credit at their traditional levels, without the American Rescue
Plan expansion, to approximate the refundable credits received as refunds on 2020 tax returns. Our projections do not capture the
rules that allow people to claim the additional child tax credit and earned income tax credit using either their 2019 or 2020 earnings
and so likely understate the additional child tax credit and earned income tax credit refunds received in the spring of 2020. c The amount of the child tax credit before the American Rescue Plan expansion is already reflected in taxes and tax credits in
our projected poverty estimates “without” the stimulus checks, state payments and one-half the advance child tax credit, so we
count one-half of the increased amount of the child tax credit when calculating the effect of the advance child tax credit on
projected poverty for 2021.

1 4 2 0 2 1 P O V E R T Y P R O J E C T I O N S
To make the data more closely reflect 2021, we adjusted the sampling weights to reflect the
population in mid-2021 by age group, race and ethnicity, sex, nativity, and state, and we adjusted
income amounts to reflect the nominal increases expected between 2018 and 2021 for types of
income that are anticipated to increase.
After creating this 2021 data file, we applied the ATTIS model (Pyati 2020) to simulate each of the
key government benefit and tax programs (box 1). The simulations used the rules expected to be in
place for each program in 2021 and captured the automatic changes in program eligibility and benefits
that occur in response to changes in family income. We also calibrated program caseloads to expected
levels. Our simulations capture key program interactions, including interactions with pandemic-relief
policies. In particular, the simulations capture how each US safety-net program treats the extra $300 a
week in UI benefits. After all the simulations, we calculated the SPM for people in the 2021 data file.
We generally followed the Census Bureau’s approach but used projected 2021 SPM thresholds as
described previously and used the income and resource amounts developed using ATTIS.
Effect of Benefits and COVID Policies on Poverty
Government assistance programs and other supports, including both the standard policies that would
have been in place without any special legislation as well as additional policies enacted because of the
pandemic, are projected to reduce the 2021 poverty rate by approximately two-thirds. The combined
benefits from UI, means-tested benefits, federal stimulus checks, the advance child tax credit, and
state payments (in some states) are projected to keep nearly 50 million Americans out of poverty in
2021, reducing poverty 67 percent relative to what it would have been without these programs (table
4). We project that almost 25 million people will remain in poverty in 2021. (Box 1 provides a list of
programs included in the antipoverty estimates.)
We project that the programs examined here will reduce child poverty by 81 percent in 2021,
keeping 17.7 million children out of poverty (table 4). We project that the programs will reduce
poverty 63 percent among working-age adults and 52 percent among people age 65 and above,
keeping 26.4 million working-age adults and 5.5 million older adults out of poverty.
We project that the programs will keep 19.3 million non-Hispanic white people out of poverty as
well as 10.5 million non-Hispanic Black people, 15.2 million Hispanic people, and 2.3 million AAPIs. In
percentage terms, the antipoverty effect of all these programs combined is greatest for non-Hispanic
Black people, reducing their poverty rate (without these programs) 74 percent, and it is smallest for
AAPIs, reducing their poverty rate 54 percent.

2 0 2 1 P O V E R T Y P R O J E C T I O N S 1 5
TABLE 4
Projected 2021 SPM Poverty, With and Without Benefit Programs, by Characteristic
Poverty rate without
programs
Poverty rate with programs and payments
Percent reduction in
poverty
Number of people removed from
poverty (thousands)
Number of people remaining in poverty
(thousands)
Total 23.1% 7.7% 66.6% 49,642 24,845
Age Less than 18 years old 30.1% 5.6% 81.4% 17,743 4,049 18 to 64 years old 21.7% 8.1% 62.8% 26,439 15,647 65 years or older 19.0% 9.2% 51.5% 5,459 5,149
Race and Ethnicity White, non-Hispanic 15.9% 5.8% 63.4% 19,269 11,108 Black, non-Hispanic 36.0% 9.2% 74.3% 10,494 3,631 Hispanic 36.7% 11.8% 67.8% 15,167 7,217 AAPI, non-Hispanic 23.4% 10.8% 53.8% 2,335 2,003
Metropolitan Area Status Metropolitan area 23.4% 8.0% 65.7% 39,042 20,354 Nonmetropolitan area 23.1% 6.7% 71.2% 4,178 1,690 Not identified 21.7% 6.6% 69.6% 6,421 2,801
In household with someone looking for work for at least half the year? Yes 44.7% 11.6% 74.1% 16,239 5,666 No 19.3% 7.0% 63.5% 33,403 19,179
Source: Urban Institute projections as of July 2021, created by the ATTIS model applied to a version of the 2018 American Community Survey data with employment, population,
and incomes projected to 2021.
Note: AAPI = Asian American or Pacific Islander; ATTIS = Analysis of Transfers, Taxes, and Income Security Model; SPM = Supplemental Poverty Measure. Poverty is measured
with the SPM; we generally follow US Census Bureau methods for applying the SPM to American Community Survey data but use benefits and taxes simulated by ATTIS.
Programs and payments include UI, means tested benefit programs, refundable tax credits, federal stimulus checks, state payments, and one half the advance child tax credit. See
box 1.
1 6 2 0 2 1 P O V E R T Y P R O J E C T I O N S
The antipoverty effect of these programs is somewhat higher among people living in
nonmetropolitan areas than among people in metropolitan areas. We project that the programs will
reduce poverty 71 percent in nonmetropolitan areas and 66 percent in metropolitan areas. The
programs also have a greater antipoverty effect for people in families where someone is projected to
be unemployed for at least half the year than for people in families with less unemployment or no
unemployment. We project that the programs will reduce poverty 74 percent among people in
families where someone is unemployed for at least half the year compared with 64 percent among
people in other families.
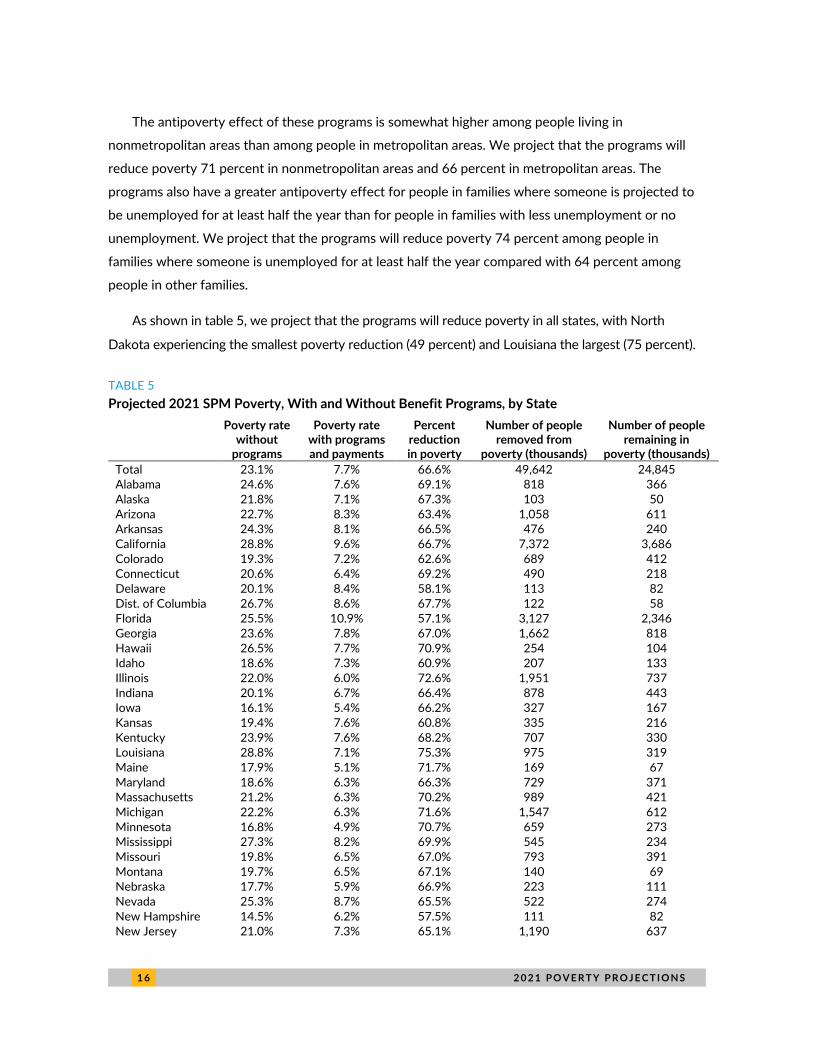
As shown in table 5, we project that the programs will reduce poverty in all states, with North
Dakota experiencing the smallest poverty reduction (49 percent) and Louisiana the largest (75 percent).
TABLE 5
Projected 2021 SPM Poverty, With and Without Benefit Programs, by State
Poverty rate without
programs
Poverty rate with programs and payments
Percent reduction in poverty
Number of people removed from
poverty (thousands)
Number of people remaining in
poverty (thousands)
Total 23.1% 7.7% 66.6% 49,642 24,845 Alabama 24.6% 7.6% 69.1% 818 366 Alaska 21.8% 7.1% 67.3% 103 50 Arizona 22.7% 8.3% 63.4% 1,058 611 Arkansas 24.3% 8.1% 66.5% 476 240 California 28.8% 9.6% 66.7% 7,372 3,686 Colorado 19.3% 7.2% 62.6% 689 412 Connecticut 20.6% 6.4% 69.2% 490 218 Delaware 20.1% 8.4% 58.1% 113 82 Dist. of Columbia 26.7% 8.6% 67.7% 122 58 Florida 25.5% 10.9% 57.1% 3,127 2,346 Georgia 23.6% 7.8% 67.0% 1,662 818 Hawaii 26.5% 7.7% 70.9% 254 104 Idaho 18.6% 7.3% 60.9% 207 133 Illinois 22.0% 6.0% 72.6% 1,951 737 Indiana 20.1% 6.7% 66.4% 878 443 Iowa 16.1% 5.4% 66.2% 327 167 Kansas 19.4% 7.6% 60.8% 335 216 Kentucky 23.9% 7.6% 68.2% 707 330 Louisiana 28.8% 7.1% 75.3% 975 319 Maine 17.9% 5.1% 71.7% 169 67 Maryland 18.6% 6.3% 66.3% 729 371 Massachusetts 21.2% 6.3% 70.2% 989 421 Michigan 22.2% 6.3% 71.6% 1,547 612 Minnesota 16.8% 4.9% 70.7% 659 273 Mississippi 27.3% 8.2% 69.9% 545 234 Missouri 19.8% 6.5% 67.0% 793 391 Montana 19.7% 6.5% 67.1% 140 69 Nebraska 17.7% 5.9% 66.9% 223 111 Nevada 25.3% 8.7% 65.5% 522 274 New Hampshire 14.5% 6.2% 57.5% 111 82 New Jersey 21.0% 7.3% 65.1% 1,190 637

2 0 2 1 P O V E R T Y P R O J E C T I O N S 1 7
Poverty rate without
programs
Poverty rate with programs and payments
Percent reduction in poverty
Number of people removed from
poverty (thousands)
Number of people remaining in
poverty (thousands) New Mexico 30.0% 8.4% 72.0% 447 173 New York 27.6% 8.5% 69.1% 3,545 1,588 North Carolina 22.4% 7.2% 67.8% 1,578 749 North Dakota 14.9% 7.6% 49.1% 54 56 Ohio 19.9% 5.9% 70.5% 1,595 668 Oklahoma 23.6% 6.3% 73.1% 671 246 Oregon 23.0% 6.1% 73.6% 704 252 Pennsylvania 21.0% 5.8% 72.6% 1,887 711 Rhode Island 21.4% 5.7% 73.2% 159 58 South Carolina 23.0% 8.3% 63.8% 752 427 South Dakota 17.7% 7.2% 59.5% 91 62 Tennessee 22.7% 7.7% 65.9% 1,013 525 Texas 24.8% 9.1% 63.3% 4,560 2,650 Utah 15.3% 6.1% 60.2% 298 197 Vermont 19.8% 7.0% 64.8% 77 42 Virginia 19.4% 7.8% 59.8% 971 653 Washington 18.4% 5.7% 68.9% 963 435 West Virginia 24.6% 7.1% 70.9% 301 123 Wisconsin 16.7% 5.4% 67.6% 642 308 Wyoming 16.9% 7.5% 55.4% 53 43
Source: Urban Institute projections as of July 2021, created by the ATTIS model applied to the 2018 American Community
Survey data with employment, population, and incomes projected to 2021.
Note: ATTIS = Analysis of Transfers, Taxes, and Income Security Model; SPM = Supplemental Poverty Measure. Poverty is
measured with the SPM; we generally follow US Census Bureau methods for applying the SPM to American Community Survey
data but use benefits and taxes simulated by ATTIS. Programs and payments include UI, means tested benefit programs,
refundable tax credits, federal stimulus checks, state payments., and one half the advance child tax credit. See box 1.
Why Do Antipoverty Effects Vary?
The antipoverty effect of benefit programs varies across demographic subgroups and states for
several reasons, including the extent to which people in the demographic subgroup or state meet the
eligibility criteria for government benefits, choose to participate in the programs for which they are
eligible, and are concentrated near enough to the poverty threshold for government benefits to raise
them above the poverty threshold. SPM poverty thresholds are adjusted for geographic variation in
housing costs, so a benefit that is sufficient to raise a family above the threshold in a less expensive
area may not be enough to raise a similar family above it in an area with higher housing costs. For
example, the projected 2021 SPM poverty threshold for a family with two adults and two children
who rent their home is $24,883 in nonmetropolitan areas of Arizona; $29,806 in Jacksonville, Florida;
and $38,333 in San Diego, California. The effects may also vary depending on state policy choices (for
example, whether a state opted out of federal pandemic unemployment benefits before September).
1 8 2 0 2 1 P O V E R T Y P R O J E C T I O N S
The relatively greater poverty reduction among children relative to adults ages 18 to 64 and those
age 65 and above reflects the targeting of Temporary Assistance for Needy Families, the Special
Supplemental Nutrition Program for Women, Infants and Children, the earned income tax credit, and
the child tax credit to families with children.28 Children and adults younger than 65 are also more likely
than those age 65 and older to be in families that receive UI. Families with children are likely to be
larger than other families, on average, and therefore to receive larger stimulus checks. They may also
receive greater benefits in programs such as SNAP, where the maximum benefit amount increases
with the size of the family.
Immigrant and citizenship status can also affect how much families benefit from government
programs. Unauthorized immigrants and people who are temporarily in the United States (such as with
a work or student visa) are typically ineligible for benefits. Eligibility for authorized immigrants varies
by program and other factors such as age, number of years in the country, and work history. Families
containing a mix of people of different immigration and citizenship statuses may receive lower
benefits than families in which all members are citizens. Among people eligible for SNAP, noncitizens
are less likely than citizens to participate in the program (Lauffer and Vigil 2021).
State-level differences in the antipoverty effectiveness of government programs reflect not only
the state’s policy choices but also the age distribution of people in the state who are below the
poverty threshold before counting benefits from government programs, their citizenship and
immigration status, the extent of their unemployment, their likelihood of program participation given
eligibility, and their concentration in areas with higher and lower housing costs. The depth of poverty
also influences the antipoverty effect of government programs within a state.
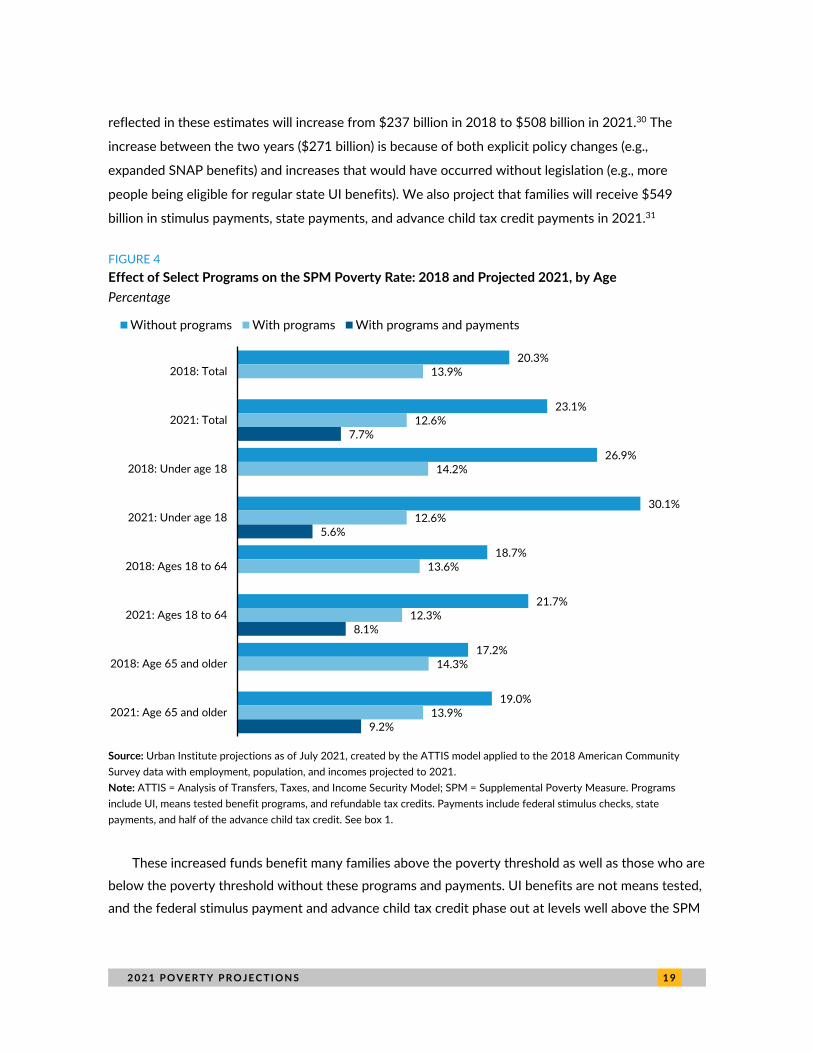
Program Effects in 2018 and 2021
Despite the substantial impact of the pandemic recession on unemployment, the projected SPM
poverty rate in 2021 is well below the SPM poverty rate in 2018.29 UI and means-tested benefit
programs alone, including the pandemic-related policy expansions to these programs, reduce
projected SPM poverty to levels just below those in 2018. Adding stimulus checks, the advance child
tax credit, and state payments further reduces the projected 2021 rates to levels well below those in
2018 (figure 4).
INCREASE IN AGGREGATE AND AVERAGE BENEFITS
These effects reflect the much higher benefits and payments distributed to families in 2021 than in
2018 as captured in our projections. We project that total UI benefits and means-tested benefits
2 0 2 1 P O V E R T Y P R O J E C T I O N S 1 9
reflected in these estimates will increase from $237 billion in 2018 to $508 billion in 2021.30 The
increase between the two years ($271 billion) is because of both explicit policy changes (e.g.,
expanded SNAP benefits) and increases that would have occurred without legislation (e.g., more
people being eligible for regular state UI benefits). We also project that families will receive $549
billion in stimulus payments, state payments, and advance child tax credit payments in 2021.31
FIGURE 4
Effect of Select Programs on the SPM Poverty Rate: 2018 and Projected 2021, by Age
Percentage
Source: Urban Institute projections as of July 2021, created by the ATTIS model applied to the 2018 American Community
Survey data with employment, population, and incomes projected to 2021.
Note: ATTIS = Analysis of Transfers, Taxes, and Income Security Model; SPM = Supplemental Poverty Measure. Programs
include UI, means tested benefit programs, and refundable tax credits. Payments include federal stimulus checks, state
payments, and half of the advance child tax credit. See box 1.
These increased funds benefit many families above the poverty threshold as well as those who are
below the poverty threshold without these programs and payments. UI benefits are not means tested,
and the federal stimulus payment and advance child tax credit phase out at levels well above the SPM
20.3%
23.1%
26.9%
30.1%
18.7%
21.7%
17.2%
19.0%
13.9%
12.6%
14.2%
12.6%
13.6%
12.3%
14.3%
13.9%
7.7%
5.6%
8.1%
9.2%
2018: Total
2021: Total
2018: Under age 18
2021: Under age 18
2018: Ages 18 to 64
2021: Ages 18 to 64
2018: Age 65 and older
2021: Age 65 and older
Without programs With programs With programs and payments
2 0 2 0 2 1 P O V E R T Y P R O J E C T I O N S
poverty threshold. Policies for state payments vary, but in general those payments have not been
restricted to the lowest-income families. Means-tested programs vary in their eligibility criteria; some
programs focus on families with very low incomes while others may serve some families with incomes
above the poverty threshold.
We project that families with income below the SPM poverty threshold before counting UI;
means-tested benefits; and (in 2021) the stimulus checks, state payments, and advance child tax
credit, will receive almost twice as much income from UI and means-tested benefits in 2021 as in
2018, with the total amount distributed to these families increasing from $161 billion in 2018 to $302
billion in 2021, an increase of $141 billion. We project that these families will receive $150 billion (27
percent) of the federal stimulus payments, state payments, and advance child tax credit payments
distributed in 2021.
More families had income below the SPM threshold before counting benefits in 2021 than in 2018,
so the total benefits to these families were distributed across a larger number of families. Even so, the
average amount distributed to families below the poverty threshold was much higher in 2021 than in
2018. On average, the 28.4 million families32 with income below the poverty threshold before counting
UI and means-tested benefits in 2018 received $5,672 in annual UI and means-tested benefits. In
contrast, the 32.4 million families with projected 2021 income below the poverty threshold before
counting UI, means-tested benefits, federal stimulus payments, state payments, and the advance child
tax credit received an average of $9,312 in annual UI and means-tested benefits and an average of
$4,620 in federal stimulus payments, state payments, and advance child tax credit payments.
PROGRAM EFFECTS IN TOTAL AND BY AGE
Without the programs discussed here, the projected poverty rate would be higher (23.1 percent) in 2021
than in 2018 (20.3 percent; figure 4). UI and the means-tested benefit programs bring the poverty rate
down to 13.9 percent in 2018. These programs, including their pandemic-related expansions, bring the
projected 2021 poverty rate down to 12.6 percent. Stimulus checks, the advance child tax credit, and
state payments further lower the projected 2021 poverty rate to 7.7 percent.
The programs examined here reduce poverty across all age groups, with children experiencing the
greatest poverty reduction. UI and means-tested benefits reduce the 2018 child poverty rate by
almost half, from 26.9 percent to 14.2 percent, and are projected to reduce child poverty by more
than half in 2021, from 30.1 percent to 12.6 percent. Stimulus checks, the advance child tax credit,
and state payments further reduce the projected child poverty rate to 5.6 percent.
Adult poverty rates are 9 to 11 percentage points lower than child poverty rates before counting
UI, means-tested benefits, and pandemic-related benefits. UI and means-tested benefit programs

2 0 2 1 P O V E R T Y P R O J E C T I O N S 2 1
eliminate most of the difference in child poverty rates and adult poverty rates. Stimulus checks, the
advance child tax credit, and state payments reduce adult poverty but not to the same extent as child
poverty. The 2021 projected poverty rate including these payments is 8.1 percent for adults ages 18
to 64 and 9.2 percent for older adults.
PROGRAM EFFECTS BY RACE AND ETHNICITY
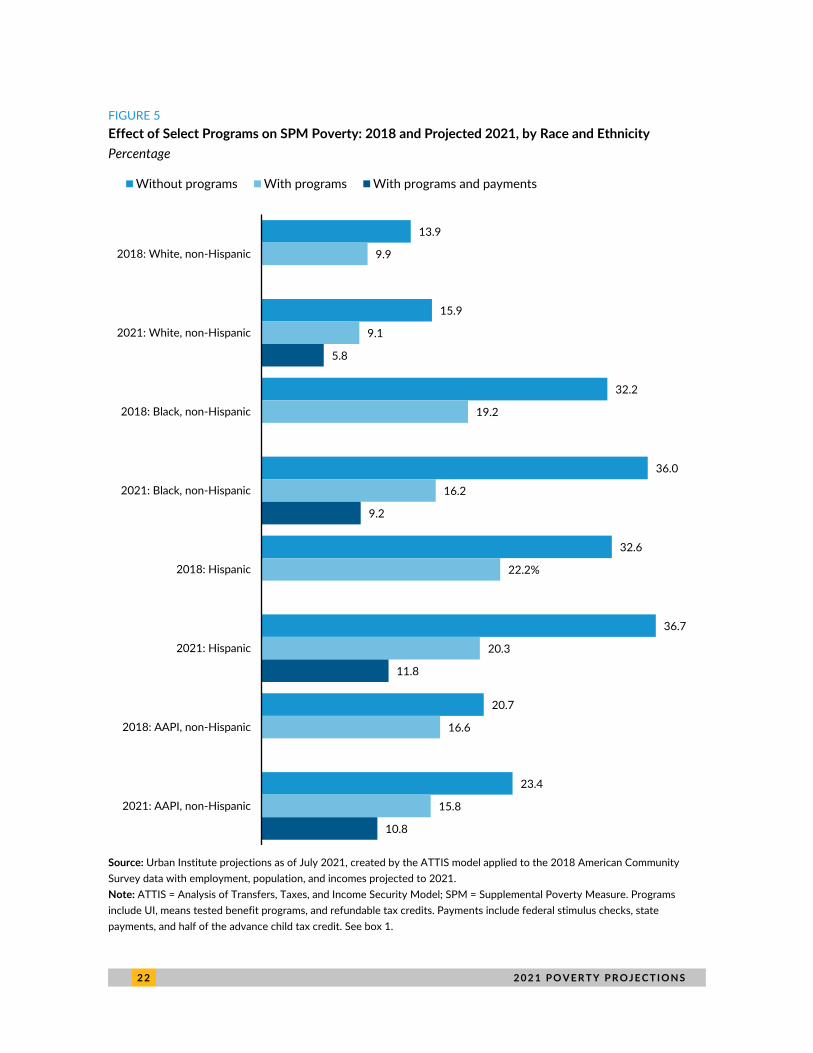
We project that without the programs examined here, poverty rates would have been about 2
percentage points higher in 2021 than in 2018 for white, non-Hispanic people, about 4 percentage
points higher for non-Hispanic Black people and Hispanic people, and almost 3 percentage points higher
for AAPIs (figure 5). For example, if we do not count income from UI and means tested benefits, we
estimate that 32.2 percent of Black non-Hispanic people have incomes below the poverty threshold in
2018. We project that 36.0 percent of Black non-Hispanic people will have incomes below the poverty
threshold in 2021 if these benefits are not counted—an increase of nearly 4 percentage points.
UI and means-tested benefits (including their pandemic-related expansions) reduce the projected
2021 rate to below the 2018 rate for all four groups, but the projected reduction is greatest for Black
and Hispanic people. The projected 2021 poverty rate for white, non-Hispanic people and AAPIs,
before counting stimulus checks, state payments, and the advance child tax credit, is less than 1
percentage point lower than in 2018. For Black and Hispanic people, that rate is 3 percentage points
and almost 2 percentage points lower, respectively, than in 2018. We project that stimulus checks,
state payments, and the advance child tax credit reduce SPM poverty to levels well below the 2018
level in all four groups.
In contrast to prepandemic years, when the AAPI poverty rate has typically been lower than the
Black poverty rate, the projected 2021 AAPI poverty rate (10.8 percent) is slightly higher than the
projected poverty rate for Black, non-Hispanic people (9.2 percent). Several factors may help explain
why the AAPI poverty rate did not fall further relative to the Black, non-Hispanic poverty rate. Among
people who are below the poverty threshold before counting benefits from these programs, AAPI
people are less likely than Black non-Hispanic people to be in families with children (and so are less
likely to benefit from programs targeted to children).33 They are more likely to be immigrants or in
families with mixed immigration statuses, so they may be less likely to meet benefit eligibility criteria
and participate in certain programs for which they are eligible.34 They are more likely to live in
metropolitan areas and states with higher housing costs and thus to have higher SPM poverty
thresholds35 and need more additional resources, on average, to reach the poverty threshold.36
2 2 2 0 2 1 P O V E R T Y P R O J E C T I O N S
FIGURE 5
Effect of Select Programs on SPM Poverty: 2018 and Projected 2021, by Race and Ethnicity
Percentage
Source: Urban Institute projections as of July 2021, created by the ATTIS model applied to the 2018 American Community
Survey data with employment, population, and incomes projected to 2021.
Note: ATTIS = Analysis of Transfers, Taxes, and Income Security Model; SPM = Supplemental Poverty Measure. Programs
include UI, means tested benefit programs, and refundable tax credits. Payments include federal stimulus checks, state
payments, and half of the advance child tax credit. See box 1.
13.9
15.9
32.2
36.0
32.6
36.7
20.7
23.4
9.9
9.1
19.2
16.2
22.2%
20.3
16.6
15.8
5.8
9.2
11.8
10.8
2018: White, non-Hispanic
2021: White, non-Hispanic
2018: Black, non-Hispanic
2021: Black, non-Hispanic
2018: Hispanic
2021: Hispanic
2018: AAPI, non-Hispanic
2021: AAPI, non-Hispanic
Without programs With programs With programs and payments

2 0 2 1 P O V E R T Y P R O J E C T I O N S 2 3
The factors causing government programs to have relatively less effect on AAPI poverty than on
Black, non-Hispanic poverty were also present in 2018, so why was the AAPI poverty rate lower than
the Black, non-Hispanic poverty rate in that year and in other years before the pandemic? One
possibility is that in a typical year, the relatively lower poverty rate for AAPIs before counting benefits
from these programs more than offsets the relatively greater efficacy of the programs in reducing
poverty among Black, non-Hispanic people. In 2018, UI and means-tested programs reduced the
Black, non-Hispanic rate from 32.2 percent to 19.2 percent, which is only slightly lower than the AAPI
poverty rate before counting benefits from these programs (20.7 percent). UI and means-tested
programs then lowered the AAPI poverty rate to 16.6 percent. The much lower “starting point” for the
AAPI poverty rate meant that the AAPI poverty rate could remain lower than the Black, non-Hispanic
poverty rate even though government benefits did not do as much to lower poverty among AAPIs as
among Black, non-Hispanic people. In contrast, the projected government benefits and payments are
so much higher in 2021 than in 2018 that the relatively greater efficacy of these programs in
removing Black, non-Hispanic people from poverty is enough to outweigh the relatively lower starting
point for the AAPI poverty rate, with the net result being a slightly lower projected poverty rate for
Black, non-Hispanic people than for AAPI people. Although we have considered AAPIs as a group
here, people who identify as AAPIs are a diverse population reflecting many countries of origin and
different economic circumstances.37
PROGRAM EFFECTS BY STATE
UI and means-tested benefits reduce the variation in poverty rates by state, and we project that
stimulus checks, state payments, and the advance child tax credit will further reduce this variation in
2021 (table A.4). Without these programs, there is a 15.5 percentage-point difference between the
state with the lowest projected poverty rate, New Hampshire (14.5 percent), and the state with the
highest projected poverty rate, New Mexico (30.0 percent). UI and means-tested benefits reduce the
difference in rates between the state with the lowest poverty rate, Minnesota (7.9 percent), and the
state with the highest poverty rate, Florida (16.9 percent), to 8 percentage points. Stimulus checks,
state payments, and the advance child tax credit narrow the gap to a 6 percentage-point difference
between the state with the lowest projected poverty rate, Minnesota (4.9 percent), and the state with
the highest projected poverty rate, Florida (10.9 percent).
Figure 6 illustrates how government benefits are projected to reduce poverty in Hawaii, a state
that has been hit particularly hard by the pandemic recession, and Idaho, a state that has been
relatively less affected. (Hawaii had the largest reduction in jobs from before the pandemic to the start
of 2021—a drop of 17 percent—while Idaho was one of two states with February 2021 employment
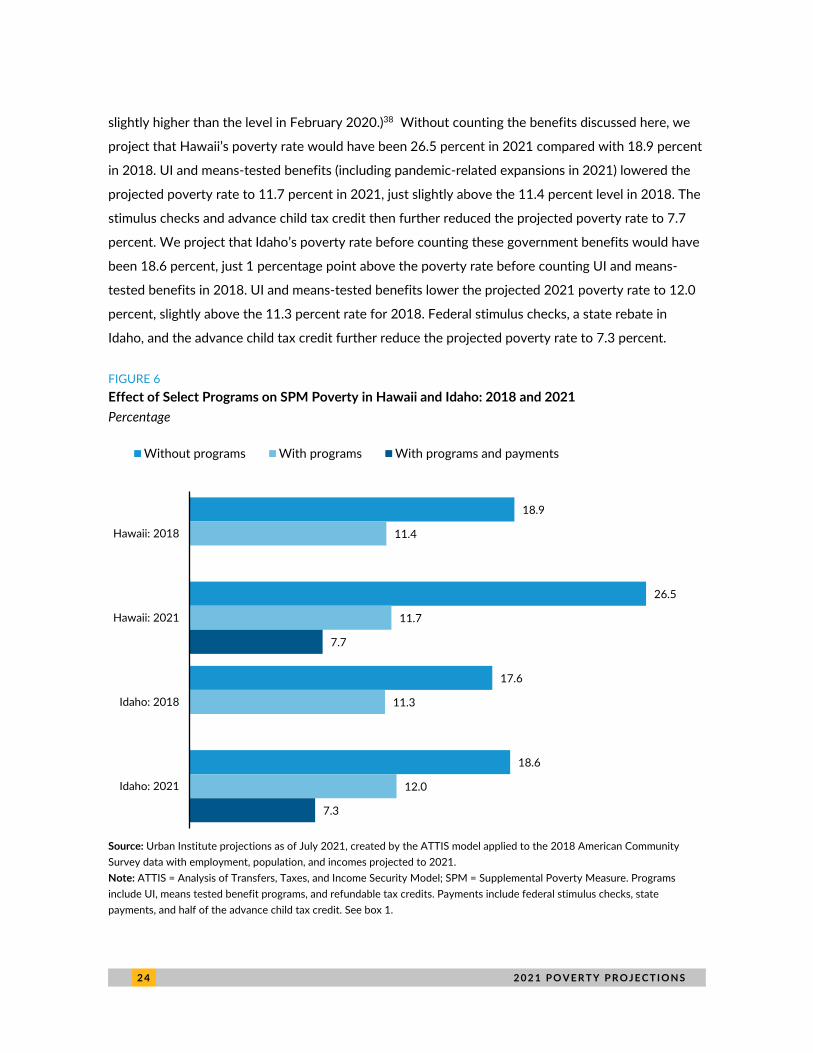
2 4 2 0 2 1 P O V E R T Y P R O J E C T I O N S
slightly higher than the level in February 2020.)38 Without counting the benefits discussed here, we
project that Hawaii’s poverty rate would have been 26.5 percent in 2021 compared with 18.9 percent
in 2018. UI and means-tested benefits (including pandemic-related expansions in 2021) lowered the
projected poverty rate to 11.7 percent in 2021, just slightly above the 11.4 percent level in 2018. The
stimulus checks and advance child tax credit then further reduced the projected poverty rate to 7.7
percent. We project that Idaho’s poverty rate before counting these government benefits would have
been 18.6 percent, just 1 percentage point above the poverty rate before counting UI and means-
tested benefits in 2018. UI and means-tested benefits lower the projected 2021 poverty rate to 12.0
percent, slightly above the 11.3 percent rate for 2018. Federal stimulus checks, a state rebate in
Idaho, and the advance child tax credit further reduce the projected poverty rate to 7.3 percent.
FIGURE 6
Effect of Select Programs on SPM Poverty in Hawaii and Idaho: 2018 and 2021
Percentage
Source: Urban Institute projections as of July 2021, created by the ATTIS model applied to the 2018 American Community
Survey data with employment, population, and incomes projected to 2021.
Note: ATTIS = Analysis of Transfers, Taxes, and Income Security Model; SPM = Supplemental Poverty Measure. Programs
include UI, means tested benefit programs, and refundable tax credits. Payments include federal stimulus checks, state
payments, and half of the advance child tax credit. See box 1.
18.9
26.5
17.6
18.6
11.4
11.7
11.3
12.0
7.7
7.3
Hawaii: 2018
Hawaii: 2021
Idaho: 2018
Idaho: 2021
Without programs With programs With programs and payments

2 0 2 1 P O V E R T Y P R O J E C T I O N S 2 5
Individual Program Effects
We calculate the antipoverty effect of an individual program by subtracting the benefits from that
program from family resources, recalculating the poverty rate, and counting the increase in the
number of people below the poverty threshold. By this method, a family might be counted as being
moved above the poverty threshold by more than one program. For example, a family with $2,500 in
SNAP benefits, $3,000 in UI, and total family resources (including SNAP, UI, and other sources of
income and benefits) that are $2,000 above the poverty threshold would be counted as being lifted
out of poverty by SNAP and as being lifted out of poverty by UI.39
Federal stimulus checks have the greatest projected antipoverty effect among the programs
examined, removing a projected 12.4 million people from poverty in 2021 (table 6). SNAP (including
its pandemic-related policy expansions) has the next largest effect, removing a projected 7.9 million
people from poverty, followed closely by UI with its pandemic-related policy expansions (6.7 million
people).
TABLE 6
Projected Number of People Removed from Poverty by Program, 2021
Thousands
Total Under age 18 Ages 18 to 64 Age 65 or older UI 6,731 1,523 4,820 388 SSI 3,769 699 2,325 745 TANF/GA 706 308 332 66 Public and Subsidized Housing 2,520 827 1,118 575 SNAP 7,945 2,806 4,164 974 WIC 195 111 81 3 LIHEAP 245 44 134 67 Refundable tax credits 2,861 1,310 1,499 51 Stimulus checks 12,380 3,211 6,690 2,479 State payments 299 68 192 39 1/2 Advance CTC 1,763 1,018 714 30
Source: Urban Institute projections as of July 2021, created by the ATTIS model applied to the 2018 American Community
Survey data with employment, population, and incomes projected to 2021.
Note: ATTIS = Analysis of Transfers, Taxes, and Income Security Model; CTC = Child Tax Credit; GA = General Assistance;
LIHEAP = Low Income Home Energy Assistance Program; SNAP = Supplemental Nutrition Assistance Program; SPM =
Supplemental Poverty Measure; SSI = Supplemental Security Income; TANF = Temporary Assistance for Needy Families; UI =
Unemployment Insurance; WIC = Special Supplemental Nutrition Program for Women, Infants and Children. Poverty is
measured with the SPM; we generally follow US Census Bureau methods for applying the SPM to American Community Survey
data but use benefits and taxes simulated by ATTIS.
These results reflect both the size of these benefits and the number of families receiving them.
For example, a family with two adults and two children could receive up to $8,000 through the second
and third stimulus payments. If they are eligible for SNAP for the entire year and live in a state that
2 6 2 0 2 1 P O V E R T Y P R O J E C T I O N S
provides all families with the maximum SNAP benefit for the duration of 2021, they would receive
approximately $9,100 in SNAP benefits. A person receiving unemployment benefits from the start of
the year through the first week of September who lives in a state that did not opt out of the federal
expansions could receive approximately $24,000 in UI support.40 The actual level of annual benefits
for a particular person or family depends on the number of weeks or months of receipt and other
factors. For example, we project that individuals receiving UI in 2021 will receive an average of
$10,108 during the year and that families with two adults and two children who receive SNAP will
receive an average annual amount of $6,257 in SNAP benefits.
We project that federal stimulus checks will remove 3.2 million children from poverty in 2021 and
that SNAP and UI will remove 2.8 million and 1.5 million children from poverty, respectively. We
project that refundable credits (approximating the earned income tax credit and refundable portion of
the child tax credit received on 2020 taxes) will remove 1.3 million children from poverty in 202141
and that the advance child tax credit payments (for the 2021 tax year) to be distributed in July through
December of 2021 will remove 1 million children from poverty.
We project that more working-age adults will be removed from poverty by UI (4.8 million) than by
SNAP (4.2 million) in 2021. We project that federal stimulus checks will remove 6.7 million people
ages 18 to 64 from poverty. Supplemental Security Income, which provides benefits to low-income
people with disabilities or who are age 65 or older, has the fourth-largest antipoverty effect for this
age group, removing a projected 2.3 million people ages 18 to 64 from poverty.
We project that federal stimulus checks will remove 2.5 million people age 65 and older from
poverty in 2021. SNAP has the second largest antipoverty effect for this age group, removing 974,000
from poverty. Supplemental Security Income is projected to remove 745,000 people age 65 or older
from poverty, followed by public and subsidized housing (575,000). We do not separately examine the
antipoverty effect of Social Security, which has by far the largest antipoverty effect of government
programs for this age group (Fox 2020).
Conclusions
During 2021, after factoring in all regular safety-net benefits, taxes, and tax credits (the expanded UI
and SNAP benefits; the additional stimulus checks enacted in December 2020 and in March 2021, the
advance payments of the child tax credit, and state-specific recession related payments), we project
an SPM poverty rate of 7.7 percent, with 2.6 percent of people in deep poverty and 36.5 percent with

2 0 2 1 P O V E R T Y P R O J E C T I O N S 2 7
resources no more than twice the SPM poverty threshold. The projected poverty rates are
substantially lower than the prepandemic (2018) poverty rate across the racial and ethnic groups
examined here and for children, working-age adults, and people age 65 and older.
The relatively low projected 2021 poverty rates are attributable to the hundreds of billions of
dollars in pandemic-related benefits that have been or will be distributed in 2021. We project that
total UI benefits and means-tested benefits reflected in these estimates will increase from $237 billion
in 2018 to $508 billion in 202142 and that families will receive $549 billion in stimulus payments, state
payments, and advance child tax credit payments in 2021. We project that the total UI and means-
tested benefits paid to families who have income below the SPM poverty threshold before counting
UI, means-tested benefits, federal stimulus payments, state payments, and the advance child tax credit
will increase from $161 billion in 2018 to $302 billion in 2021, and that these families will receive
$150 billion in federal stimulus payments, state payments, and advance child tax credit payments.
Federal stimulus checks, UI, and SNAP have the largest projected antipoverty effects of the
programs examined here. These benefits have kept many families above the poverty threshold,
including families with workers who lost jobs in the recession as well as families with no pandemic job
loss but whose resources would fall below the poverty threshold without the pandemic-related
benefits. The safety net and policy interventions have also helped many other people in need,
including those who remain in poverty even with the additional benefits, or who have low incomes or
are temporarily unemployed yet have income above the poverty threshold.
Going forward, it will be important to consider what happens as pandemic-related policy
expansions come to an end. Substantial amounts of money were distributed through stimulus checks
in the first half of 2021, benefiting most families. Many families with children will receive monthly
advance child tax credits, beginning in July, and employment is projected to increase throughout the
year. However, enhanced UI benefits and certain expanded SNAP benefits will expire in the second
half of the year, potentially increasing hardship for families with few other resources and whose
stimulus checks have already been spent. The advance child tax credits are a temporary measure,
affecting income in 2021 and 2022.
Our projections demonstrate that government benefits can reduce poverty well below traditional
levels when substantial resources are devoted to that task. Policymakers who want to make some
aspects of the higher level of support permanent will need to consider the appropriate levels and
types of increased supports, the best ways to fund such efforts, and the potential macroeconomic
implications of various choices.
2 8 2 0 2 1 P O V E R T Y P R O J E C T I O N S
Further, even with poverty projected to be at a much lower level in 2021 than before the
pandemic, racial disparities in poverty rates persist: white, non-Hispanic people have a lower projected
poverty rate than other racial and ethnic groups. Although UI, means-tested benefits, stimulus checks,
state payments, and the advance child tax credit substantially decreased poverty across all four of the
racial and ethnic groups examined, the effect was smaller for AAPI people than for people of other
racial and ethnic identities. Future efforts to reduce poverty could consider how to address the factors
that contribute to poverty among different groups.

A P P E N D I X 2 9
Appendix: Additional Tables Tables A.1 through A.3 show the ATTIS model’s SPM poverty estimates for 2018, developed using
data from the 2018 American Community Survey. These 2018 SPM poverty estimates provide a point
of comparison for the 2021 projections; the 2018 ACS data are the same data used as the foundation
for our 2021 projections. We generally follow the Census Bureau’s approach to modeling the SPM on
the ACS, except that we use the IPUMS version of the ACS as input (Ruggles et al. 2020), use taxes
and benefits simulated by ATTIS, and construct SPM family units based on detailed household
relationship information imputed by IPUMS. We apply the Census Bureau’s geographic adjustments to
the SPM threshold and use the Census Bureau’s medical out-of-pocket expense imputation. Our 2018
poverty rate estimate of 13.9 percent is lower than the Census Bureau’s ACS-based SPM poverty
estimate of 15.3 percent primarily because of the ATTIS model’s correction for underreporting of UI
and means-tested benefits.43 Table A.4 provides 2018 estimates and 2021 projections of the effect of
government benefits on poverty, by state.
TABLE A.1
2018 SPM Poverty Rates by Age and Race and Ethnicity
Percent with family resources below 100% of
SPM poverty level
Percent with family resources below 50% of SPM poverty level (deep
poverty)
Percent with family resources below 200% of
SPM poverty level
Total 13.9% 4.2% 43.4%
Age Less than 18 years old 14.2% 2.9% 51.8%
18 to 64 years old 13.6% 4.6% 40.9%
65 years or older 14.3% 4.2% 41.0%
Race and ethnicity White, non-Hispanic 9.9% 3.5% 33.7%
Black, non-Hispanic 19.2% 5.0% 59.4%
Hispanic 22.2% 5.1% 64.1%
AAPI, non-Hispanic 16.6% 6.1% 41.7%
Source: Urban Institute ATTIS model using data from the 2018 American Community Survey
Notes: AAPI = Asian American or Pacific Islander; ATTIS = Analysis of Transfers, Taxes, and Income Security Model; SPM =
Supplemental Poverty Measure. Poverty is measured with the SPM; we generally follow US Census Bureau methods for
applying the SPM to American Community Survey data but use benefits and taxes simulated by ATTIS.
3 0 A P P E N D I X
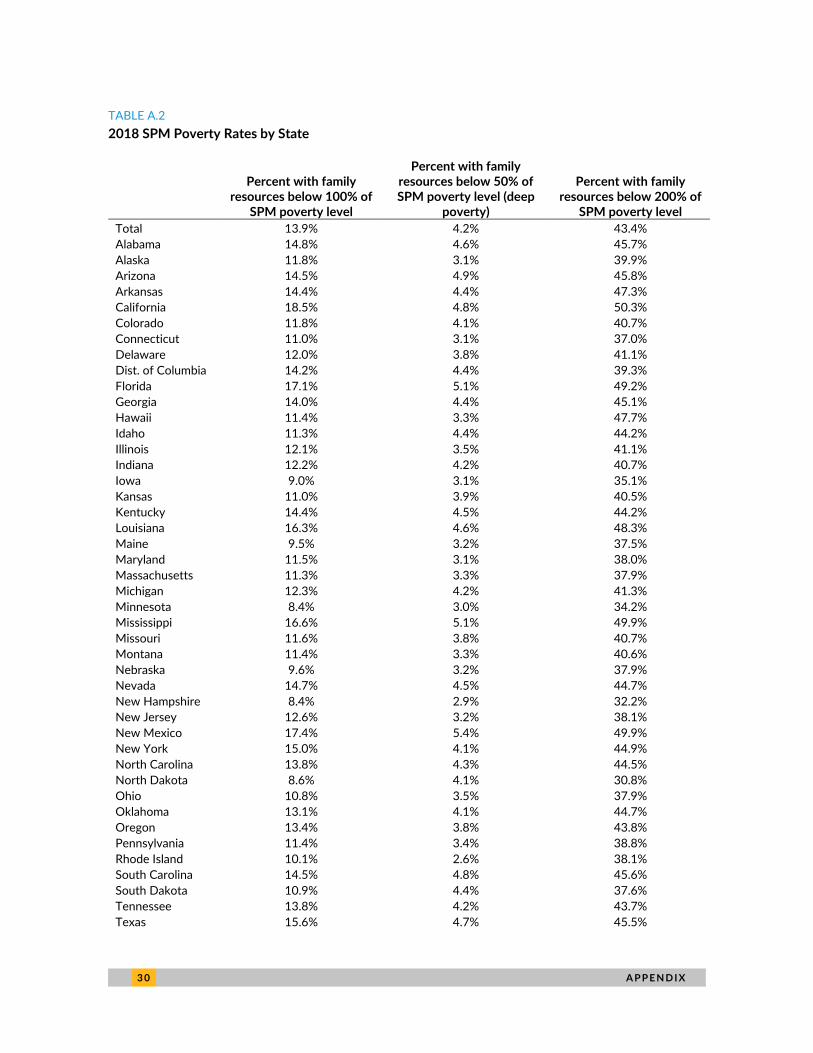
TABLE A.2
2018 SPM Poverty Rates by State
Percent with family resources below 100% of
SPM poverty level
Percent with family resources below 50% of SPM poverty level (deep
poverty)
Percent with family resources below 200% of
SPM poverty level
Total 13.9% 4.2% 43.4%
Alabama 14.8% 4.6% 45.7%
Alaska 11.8% 3.1% 39.9%
Arizona 14.5% 4.9% 45.8%
Arkansas 14.4% 4.4% 47.3%
California 18.5% 4.8% 50.3%
Colorado 11.8% 4.1% 40.7%
Connecticut 11.0% 3.1% 37.0%
Delaware 12.0% 3.8% 41.1%
Dist. of Columbia 14.2% 4.4% 39.3%
Florida 17.1% 5.1% 49.2%
Georgia 14.0% 4.4% 45.1%
Hawaii 11.4% 3.3% 47.7%
Idaho 11.3% 4.4% 44.2%
Illinois 12.1% 3.5% 41.1%
Indiana 12.2% 4.2% 40.7%
Iowa 9.0% 3.1% 35.1%
Kansas 11.0% 3.9% 40.5%
Kentucky 14.4% 4.5% 44.2%
Louisiana 16.3% 4.6% 48.3%
Maine 9.5% 3.2% 37.5%
Maryland 11.5% 3.1% 38.0%
Massachusetts 11.3% 3.3% 37.9%
Michigan 12.3% 4.2% 41.3%
Minnesota 8.4% 3.0% 34.2%
Mississippi 16.6% 5.1% 49.9%
Missouri 11.6% 3.8% 40.7%
Montana 11.4% 3.3% 40.6%
Nebraska 9.6% 3.2% 37.9%
Nevada 14.7% 4.5% 44.7%
New Hampshire 8.4% 2.9% 32.2%
New Jersey 12.6% 3.2% 38.1%
New Mexico 17.4% 5.4% 49.9%
New York 15.0% 4.1% 44.9%
North Carolina 13.8% 4.3% 44.5%
North Dakota 8.6% 4.1% 30.8%
Ohio 10.8% 3.5% 37.9%
Oklahoma 13.1% 4.1% 44.7%
Oregon 13.4% 3.8% 43.8%
Pennsylvania 11.4% 3.4% 38.8%
Rhode Island 10.1% 2.6% 38.1%
South Carolina 14.5% 4.8% 45.6%
South Dakota 10.9% 4.4% 37.6%
Tennessee 13.8% 4.2% 43.7%
Texas 15.6% 4.7% 45.5%

A P P E N D I X 3 1
Percent with family resources below 100% of
SPM poverty level
Percent with family resources below 50% of SPM poverty level (deep
poverty)
Percent with family resources below 200% of
SPM poverty level
Utah 9.3% 3.5% 39.1%
Vermont 10.2% 3.7% 40.9%
Virginia 13.5% 4.2% 40.4%
Washington 10.6% 3.5% 37.9%
West Virginia 14.1% 4.6% 44.8%
Wisconsin 9.1% 3.2% 33.6%
Wyoming 10.6% 4.7% 34.7%
Source: Urban Institute ATTIS model using data from the 2018 American Community Survey
Notes: ATTIS = Analysis of Transfers, Taxes, and Income Security Model; SPM = Supplemental Poverty Measure. Poverty is
measured with the SPM; we generally follow US Census Bureau methods for applying the SPM to American Community Survey
data but use benefits and taxes simulated by ATTIS.
TABLE A.3
2018 SPM Poverty Rates by State, People Less than 18 Years Old
Percent with family resources below 100% of SPM poverty level
Percent with family resources below 50% of SPM poverty level (deep
poverty)
Percent with family resources below 200% of SPM poverty level
Total 14.2% 2.9% 51.8% Alabama 15.0% 3.4% 54.3% Alaska 12.0% 1.9% 44.3% Arizona 15.6% 4.0% 56.4% Arkansas 13.8% 2.9% 56.0% California 20.5% 3.4% 58.0% Colorado 11.7% 2.5% 49.0% Connecticut 11.1% 1.6% 45.1% Delaware 13.0% 3.6% 54.9% Dist. of Columbia 15.2% 1.2% 52.4% Florida 18.2% 3.7% 59.2% Georgia 14.8% 3.6% 54.7% Hawaii 9.8% 1.3% 58.2% Idaho 10.1% 3.2% 52.1% Illinois 11.4% 2.0% 49.3% Indiana 11.8% 2.9% 49.8% Iowa 7.1% 1.3% 41.3% Kansas 9.0% 2.1% 47.9% Kentucky 13.7% 3.5% 51.4% Louisiana 16.6% 3.4% 57.6% Maine 7.2% 1.0% 43.9% Maryland 12.1% 2.1% 46.0% Massachusetts 10.6% 1.9% 42.9% Michigan 11.9% 3.1% 50.2% Minnesota 5.7% 1.0% 40.1% Mississippi 16.5% 3.8% 59.5% Missouri 11.2% 2.4% 49.5% Montana 9.2% 1.1% 50.4% Nebraska 6.8% 1.2% 44.8% Nevada 15.7% 3.5% 55.2%

3 2 A P P E N D I X
Percent with family resources below 100% of SPM poverty level
Percent with family resources below 50% of SPM poverty level (deep
poverty)
Percent with family resources below 200% of SPM poverty level
New Hampshire 8.4% 2.4% 36.8% New Jersey 14.3% 3.0% 45.1% New Mexico 18.0% 4.1% 58.6% New York 15.6% 3.0% 53.6% North Carolina 15.0% 3.4% 54.0% North Dakota 4.8% 1.8% 32.2% Ohio 10.3% 2.3% 46.3% Oklahoma 13.1% 3.0% 53.2% Oregon 13.2% 2.3% 52.3% Pennsylvania 10.5% 2.0% 46.5% Rhode Island 10.3% 1.7% 47.5% South Carolina 14.7% 3.6% 55.1% South Dakota 10.2% 3.1% 44.5% Tennessee 15.0% 3.5% 53.3% Texas 17.3% 3.8% 54.3% Utah 7.0% 1.8% 44.6% Vermont 7.1% 1.7% 43.7% Virginia 14.5% 2.9% 48.3% Washington 9.4% 2.0% 46.1% West Virginia 13.8% 3.5% 52.5% Wisconsin 7.2% 1.9% 40.3% Wyoming 10.4% 2.8% 40.6%
Source: Urban Institute ATTIS model using data from the 2018 American Community Survey
Notes: ATTIS = Analysis of Transfers, Taxes, and Income Security Model; SPM = Supplemental Poverty Measure. Poverty is
measured with the SPM; we generally follow US Census Bureau methods for applying the SPM to American Community Survey
data but use benefits and taxes simulated by ATTIS.
TABLE A.4
Effect of Select Programs on the SPM Poverty Rate: 2018 and Projected 2021, by State
2018 without
programs 2018 with programs
2021 without programs
2021 with programs
2021 with programs and
payments
Total 20.3% 13.9% 23.1% 12.6% 7.7%
Alabama 22.9% 14.8% 24.6% 13.6% 7.6%
Alaska 17.8% 11.8% 21.8% 12.1% 7.1%
Arizona 20.5% 14.5% 22.7% 13.3% 8.3%
Arkansas 22.9% 14.4% 24.3% 14.2% 8.1%
California 25.1% 18.5% 28.8% 16.4% 9.6%
Colorado 16.8% 11.8% 19.3% 11.3% 7.2%
Connecticut 17.3% 11.0% 20.6% 9.9% 6.4%
Delaware 17.3% 12.0% 20.1% 13.4% 8.4%
Dist. of Columbia 23.1% 14.2% 26.7% 12.8% 8.6%
Florida 22.8% 17.1% 25.5% 16.9% 10.9%
Georgia 21.2% 14.0% 23.6% 13.0% 7.8%
Hawaii 18.9% 11.4% 26.5% 11.7% 7.7%
Idaho 17.6% 11.3% 18.6% 12.0% 7.3%
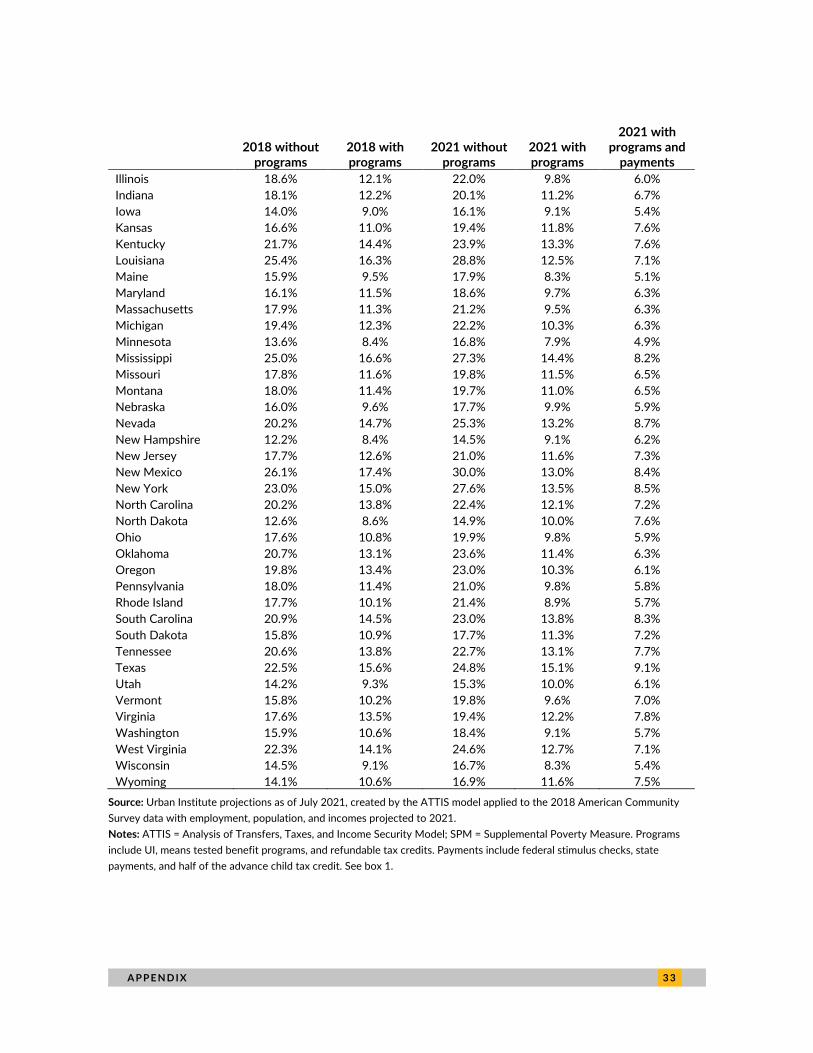
A P P E N D I X 3 3
2018 without
programs 2018 with programs
2021 without programs
2021 with programs
2021 with programs and
payments
Illinois 18.6% 12.1% 22.0% 9.8% 6.0%
Indiana 18.1% 12.2% 20.1% 11.2% 6.7%
Iowa 14.0% 9.0% 16.1% 9.1% 5.4%
Kansas 16.6% 11.0% 19.4% 11.8% 7.6%
Kentucky 21.7% 14.4% 23.9% 13.3% 7.6%
Louisiana 25.4% 16.3% 28.8% 12.5% 7.1%
Maine 15.9% 9.5% 17.9% 8.3% 5.1%
Maryland 16.1% 11.5% 18.6% 9.7% 6.3%
Massachusetts 17.9% 11.3% 21.2% 9.5% 6.3%
Michigan 19.4% 12.3% 22.2% 10.3% 6.3%
Minnesota 13.6% 8.4% 16.8% 7.9% 4.9%
Mississippi 25.0% 16.6% 27.3% 14.4% 8.2%
Missouri 17.8% 11.6% 19.8% 11.5% 6.5%
Montana 18.0% 11.4% 19.7% 11.0% 6.5%
Nebraska 16.0% 9.6% 17.7% 9.9% 5.9%
Nevada 20.2% 14.7% 25.3% 13.2% 8.7%
New Hampshire 12.2% 8.4% 14.5% 9.1% 6.2%
New Jersey 17.7% 12.6% 21.0% 11.6% 7.3%
New Mexico 26.1% 17.4% 30.0% 13.0% 8.4%
New York 23.0% 15.0% 27.6% 13.5% 8.5%
North Carolina 20.2% 13.8% 22.4% 12.1% 7.2%
North Dakota 12.6% 8.6% 14.9% 10.0% 7.6%
Ohio 17.6% 10.8% 19.9% 9.8% 5.9%
Oklahoma 20.7% 13.1% 23.6% 11.4% 6.3%
Oregon 19.8% 13.4% 23.0% 10.3% 6.1%
Pennsylvania 18.0% 11.4% 21.0% 9.8% 5.8%
Rhode Island 17.7% 10.1% 21.4% 8.9% 5.7%
South Carolina 20.9% 14.5% 23.0% 13.8% 8.3%
South Dakota 15.8% 10.9% 17.7% 11.3% 7.2%
Tennessee 20.6% 13.8% 22.7% 13.1% 7.7%
Texas 22.5% 15.6% 24.8% 15.1% 9.1%
Utah 14.2% 9.3% 15.3% 10.0% 6.1%
Vermont 15.8% 10.2% 19.8% 9.6% 7.0%
Virginia 17.6% 13.5% 19.4% 12.2% 7.8%
Washington 15.9% 10.6% 18.4% 9.1% 5.7%
West Virginia 22.3% 14.1% 24.6% 12.7% 7.1%
Wisconsin 14.5% 9.1% 16.7% 8.3% 5.4%
Wyoming 14.1% 10.6% 16.9% 11.6% 7.5%
Source: Urban Institute projections as of July 2021, created by the ATTIS model applied to the 2018 American Community
Survey data with employment, population, and incomes projected to 2021.
Notes: ATTIS = Analysis of Transfers, Taxes, and Income Security Model; SPM = Supplemental Poverty Measure. Programs
include UI, means tested benefit programs, and refundable tax credits. Payments include federal stimulus checks, state
payments, and half of the advance child tax credit. See box 1.

3 4 N O T E S
Notes
1 Eight percent of people responding to the May 2021 Census Bureau Household Pulse Survey report either
sometimes or often not having enough to eat in the past seven days, compared with 12 percent in December
2020 and 9 percent before the pandemic. About 14 percent of renters reported being behind on their rent in
May 2021 compared with 19 percent in December 2020. The December 2020 estimates are obtained from
Food Sufficiency tables 2a and 2b and Housing table 1b at “Week 21 Household Pulse Survey: December 9–
December 21,” US Census Bureau, January 6, 2021,
https://www.census.gov/data/tables/2020/demo/hhp/hhp21.html. The May 2021 estimates are obtained
from Food Sufficiency table 2 and Housing table 1b at “Week 31 Household Pulse Survey: May 26–June 7,” US
Census Bureau, June 16, 2021, https://www.census.gov/data/tables/2021/demo/hhp/hhp31.html.
2 See “Employment, Hours, and Earnings from the Current Employment Statistics Survey (National),” series
CES0000000001, US Bureau of Labor Statistics, accessed July 9, 2021,
https://data.bls.gov/timeseries/CES0000000001. These data are for seasonally adjusted nonfarm
employment.
3 We classify people as white, Black, or AAPI if they identify as being that race (and no other race) and they
report that they are not Hispanic. We classify people as Hispanic if they report that they are Hispanic; Hispanic
people include people of any race. People who report that they are American Indian or Alaska Native or that
they are of more than one race are included in the totals but not shown separately.
4 We obtained the 2019 SPM thresholds from “2019 Research Experimental Supplemental Poverty Measures
Thresholds,” US Bureau of Labor Statistics, last modified September 9, 2020,
https://www.bls.gov/pir/spm/spm_thresholds_2019.htm. We use geographic adjustments developed by the
Census Bureau as part of their work to adapt the SPM to the ACS (Fox, Glassman, and Pacas 2020).
5 Tables A.2 and A.3 provide additional 2018 poverty rate estimates.
6 Between February and April 2020, the share of adults employed fell 15 percent for white people, 17 percent
for Black people, and 20 percent for Hispanic people. (These figures, which are from tables published by the
Bureau of Labor Statistics, include both Hispanic and non-Hispanic people in the figures for white and Black
people.) See tables A-2 and A-3 at “Labor Force Statistics from the Current Population Survey | Household
Data Series from the Monthly A Tables,” US Bureau of Labor Statistics, last modified February 5, 2010,
https://www.bls.gov/cps/cpsatabs.htm. See also Steven Brown, “How COVID-19 Is Affecting Black and Latino
Families’ Employment and Financial Well-Being,” Urban Wire, May 6, 2020, https://www.urban.org/urban-
wire/how-covid-19-affecting-black-and-latino-families-employment-and-financial-well-being.
7 A study by Iceland (2019) finds that racial and ethnic disparities in poverty rates are influenced by differences
in educational attainment, nativity, and family structure. These factors explain a growing share of the
difference between groups across the 1959 to 2015 period covered by his study, and in general, racial and
ethnic disparities in poverty decreased over this period. Nevertheless, a substantial amount of the difference
in poverty rates cannot be explained by these factors, especially for Black people and American Indians. Iceland
cites literature suggesting that ongoing racial discrimination, higher incarceration rates for Black men, historical
inequalities, intergenerational transmission of economic status, and social and cultural factors all likely
contribute to continued disparities. Further, differences in educational attainment and family structure may
themselves be influenced by these structural factors. For additional perspective on the role of structural
factors in influencing outcomes across racial and ethnic groups, see “Structural Racism in America,” Urban
Institute, accessed July 21, 2021, https://www.urban.org/features/structural-racism-america.
8 Our 2018 SPM poverty rate estimate is 16.6 percent for AAPIs and 19.2 percent for Black, non-Hispanic
people (table A.1). The Census Bureau also finds higher poverty rates for Black people than for AAPIs in years
N O T E S 3 5
before the pandemic using both the SPM and official poverty measure (Fox, Glassman, and Pacas 2020, Fox
2020).
9 The poverty rates in this brief cannot be directly compared to our 2020 poverty projections (Giannarelli,
Wheaton, and Acs 2020) because the poverty definition differs.
10 For more information about the December 2020 legislation, see the Consolidated Appropriations Act, 2021,
H.R. 133, 116th Cong. (2020), https://www.congress.gov/116/bills/hr133/BILLS-116hr133enr.pdf. For more
information about the American Rescue Plan, see “American Rescue Plan Act of 2021,” H.R. 1319, 117th Cong.
(2021), https://www.congress.gov/bill/117th-congress/house-bill/1319/text/rh
11 Our estimates only capture those aspects of pandemic-relief legislation specifically described here. For
example, the estimates do not incorporate the impact of rental assistance funds included in the Consolidated
Appropriations Act and American Rescue Plan Act because of insufficient information regarding the state and
local implementation of pandemic rental assistance programs. Because rental assistance is counted as a
resource in the SPM measure (up to the portion of the poverty threshold representing housing needs), our
estimates of SPM poverty would be somewhat lower if these benefits had been included. Similarly, we do not
capture the effect of SNAP Pandemic Electronic Benefits Transfer that provides benefits to families with
children who are unable to receive free or reduced-price school lunch because of school closures.
12 We do not model the provision of the American Rescue Plan that would exempt some UI benefits from 2020
income taxes.
13 The simulation captures states’ policies regarding the federal UI benefits as of early June 2021; policy changes
following that date were not captured. The simulation captures that most of these states chose to end
participation in all of the federal pandemic unemployment programs, while some ended the additional $300-a-
week payments but are continuing to participate in the extended weeks of benefits and expanded eligibility
policies until September 6. The simulation does not capture any changes in likelihood of returns to work in the
states that are ending some or all of the federally funded UI benefits before September 6. The model does not
capture the possibility that the lack of availability of the federally funded benefits could induce some
individuals to return to work sooner than would otherwise be the case.
14 Nationally, we estimate that approximately 80 percent of UI-eligible wage earners, and approximately 70
percent of people eligible based solely on self-employment income, received benefits. The enrollment rates
vary across states, with the highest rate at 95 percent. In most cases, the simulated weeks of unemployment
benefits in the first quarter of 2021 come close to the actual weeks of UI paid according to administrative data;
the highest simulated overall rate of receipt among the UI-eligible people is 95 percent. The simulation adjusts
weeks of UI available to a particular worker in 2021 based on the imputed week of the previous year the
person became unemployed and the weeks of regular state UI and extended benefits in the person’s state,
both during 2020 and in 2021 following the expiration of the pandemic benefits. Simulated weekly benefits
include both regular state benefits and, when available, the supplemental weekly benefits.
15 The guaranteed $95 increase arose from an executive order and went into effect in April 2021. See “USDA
Increases Emergency SNAP Benefits for 25 Million Americans; Ensures COVID-19 Relief Reaches Those
Struggling Most,” news release, US Department of Agriculture, April 1, 2021,
https://www.usda.gov/media/press-releases/2021/04/01/usda-increases-emergency-snap-benefits-25-
million-americans-ensures. States can request emergency allotments so long as federal and state public health
emergencies remain in effect. All states received emergency allotments at the beginning of 2021; some have
opted to no longer receive them or have become ineligible as their state public health emergency declarations
end. We model emergency allotments as ending after March 2021 in Idaho, May in North Dakota, June in
Arkansas, July in South Carolina, and August in Missouri, based on the latest available information at the time
of this analysis.
3 6 N O T E S
16 We assume that all eligible tax filers receive the economic stimulus payment as well as nonfilers who receive
Social Security or Supplemental Security Income, 10 percent of family members of nonfilers who receive Social
Security or Supplemental Security Income, and 78 percent of other nonfilers. Because of data limitations, we
are unable to automatically assign the payment to nonfilers who receive Veterans Benefits.
17 To receive the retroactive stimulus check, families must apply through their 2020 tax return. See Julia Gelatt,
Randy Capps, and Michael Fix, “Nearly 3 Million U.S. Citizens and Legal Immigrants Initially Excluded under the
CARES Act Are Covered under the December 2020 COVID-19 Stimulus,” Migration Policy Institute, January
2021, https://www.migrationpolicy.org/news/cares-act-excluded-citizens-immigrants-now-covered. We
assign the retroactive stimulus check to eligible families with mixed immigrant status but do not assign other
payments related to the first stimulus check, because most of the benefits were distributed in 2020.
18 We apply the same assumptions regarding receipt as for the stimulus checks.
19 “LIHEAP-DCL-2021-05 FY 2021 Supplemental Funding Release under the American Rescue Plan Act of 2021,”
US Department of Health and Human Services, Administration for Children and Families, Office of Community
Services, May 4, 2021, https://www.acf.hhs.gov/ocs/policy-guidance/liheap-dcl-2021-05-supplemental-
funding-release-fy-21.
20 “USDA to Incentivize Purchase of Fruits and Vegetables under WIC for 4 Months with American Rescue Plan
Funding,” news release, US Department of Agriculture, April 28, 2021, https://www.usda.gov/media/press-
releases/2021/04/28/usda-incentivize-purchase-fruits-and-vegetables-under-wic-4-months.
21 The earned income tax credit and child and dependent care tax credit expansions could affect income in 2021
if taxpayers reduce their withholding in anticipation of the higher credit amounts. We do not account for this in
our estimates.
22 State-level payments and back-to-work bonuses are included if the policies had become law by approximately
mid-June 2021.
23 Colorado paid $375 to unemployment insurance claimants, and the District of Columbia provided $1,200 to
district residents receiving UI through the special federal program for people ineligible for regular state UI.
Both of these programs began in late 2020; we model the portion of the payments estimated to have been
received in 2021. California is providing payments of $600 or more to tax filers with income up to $75,000,
including immigrants filing with an Individual Taxpayer Identification Number, as well as to recipients of
Supplemental Security Income or cash aid from the CalWorks program. Florida is providing $1,000 payments
to teachers, principals, and first responders; Idaho is paying a rebate equal to the larger of 9 percent of a
resident’s 2019 state income tax payment or $50 per taxpayer and dependent; and Maryland is providing 2019
state earned income tax credit recipients with $500 if they filed a joint or head-of-household return or $300 if
they filed a single return. Our analysis does not include state or local stimulus measures that provided all of
their benefits in 2020.
24 We model back-to-work bonuses in Arizona, Colorado, Connecticut, Montana, New Hampshire, Oklahoma, and
Virginia. The amounts range from $500 to $2,000. The model does not capture the possibility that back-to-
work bonuses could induce individuals to return to work sooner than would otherwise have been the case.
25 We obtained the 2018 ACS data from the IPUMS USA Database (Ruggles et al. 2020).
26 We tabulated the CPS data for February 2021 to obtain the percentages of adults with different characteristics
who were employed full time or part time in that month. We obtained the percentage changes in jobs by state
and by industry groups within states using the Bureau of Labor Statistics’ Establishment Survey data through
February 2021. The February 2021 data were the most recent available from these sources at the time that
work was performed.
27 See the analysis and supplemental tables in Congressional Budget Office (2021).
N O T E S 3 7
28 Pregnant women are also eligible for the Special Supplemental Nutrition Program for Women, Infants and
Children, and working-age adults with very low earnings can qualify for the earned income tax credit, but most
of the benefits from these programs go to families with children.
29 We compare the 2021 projections with 2018 because that is the most recent prepandemic year for which we
have simulated eligibility and participation in government programs and developed SPM estimates. We use the
2018 data as the source for our 2021 projections.
30 We report 2018 totals in projected 2021 dollar amounts.
31 The total dollar amounts shown here are projections based on the most recent information available at the
time of the analysis. For each program, we reviewed our results against the most recent available data on the
number of participants or aggregate benefits for the program, typically reflecting an early month of 2021. We
then used that information, combined with our understanding of changes in program rules and employment
projections across the year, to ensure that the annual number of participants and benefits looked reasonable.
Our projections will not necessarily match projections from other sources due to differences in data,
methodology, and economic assumptions. For example, the aggregate amount of stimulus checks assigned in
our simulation is 9 percent lower than Congressional Budget Office projections for the total amount of
stimulus checks distributed in 2021. Our data exclude most active-duty armed forces personnel as well as
people who are institutionalized or living in the US territories, and so we would expect our results to be
somewhat lower than the Congressional Budget Office projections. See “Estimate for Division N —Additional
Coronavirus Response and Relief, H.R. 133, Consolidated Appropriations Act, 2021, Public Law 116-260,
Enacted on December 27, 2020,” Congressional Budget Office, January 14, 2021; and “Estimated Budgetary
Effects of H.R. 1319, American Rescue Plan Act of 2021,” Congressional Budget Office, March 10, 2021,
https://www.cbo.gov/publication/57056.
32 A single individual living without relatives or a partner is counted as a one-person “family” in these estimates.
33 Of people who would be below the poverty threshold before counting benefits from these programs, 60
percent of Black non-Hispanic people and 49 percent of AAPIs are in families with children.
34 Among people who would be below the poverty threshold before counting benefits from these programs, 90
percent of Black, non-Hispanic people were born in the United States and 5 percent are naturalized. In
contrast, 32 percent of AAPIs who would be below the threshold before counting benefits from these
programs were born in the United States and 36 percent are naturalized citizens.
35 Almost a third (32 percent) of AAPIs who would be below the poverty threshold before counting benefits in
these programs live in California, a state with high housing costs, compared with 5 percent of Black, non-
Hispanic people who would be below the threshold before counting benefits from these programs. The
average geographic adjustment to the housing share of the SPM threshold for Black, non-Hispanic people who
are below the poverty threshold before counting benefits from these programs is 1.03, compared with 1.30 for
AAPIs who would be below the threshold before counting benefits from these programs.
36 On average, a single AAPI person who is below the poverty threshold before counting benefits from these
programs is projected to need $11,310 to be lifted above it. The average projected amounts for AAPI families
with two, three, and four members to be lifted above the poverty threshold are $12,585, $15,615, and
$16,686, respectively. The corresponding figures for Black, non-Hispanic people are $8,855 (for a single
person) and $11,318, $14,516, and $16,284 for two, three, and four-member families respectively. The
average amount needed to lift a family with five or more members above the poverty threshold is $20,951 for
AAPIs and $20,961 for Black, non-Hispanic people.
37 Abby Budiman and Neil G. Ruiz, “Key Facts about Asian Americans, a Diverse and Growing Population,” Pew
Research Center, April 29, 2021. A 2018 report found that income inequality is greater among AAPI people
than among any other racial or ethnic group within the United States (Kochhar and Cilluffo 2018).

3 8 N O T E S
38 According to data from the Bureau of Labor Statistics (BLS) Establishment Survey, the number of nonfarm jobs
in Hawaii fell 17 percent from February 2020 to February 2021; in contrast, in Idaho, employment increased 1
percent from February 2020 to February 2021. See data on total nonfarm employment available in the BLS
databases, https://www.bls.gov/data/.
39 The Census Bureau uses this approach when estimating the effects of individual programs on SPM poverty
(Fox 2020).
40 The average amount of state-funded UI is approximately $300 a week. The $300 in federal help is paid in
addition to the state benefit.
41 The projected number of people removed from poverty by refundable tax credits in 2021 is much lower than
estimates from other sources for earlier years. For example, the Census Bureau estimates that 7.5 million
people were removed from poverty by refundable tax credits in 2019 (Fox 2020). Our estimates are not
directly comparable with the Census Bureau’s because we use a different data source and correct for
underreporting of means-tested benefits. Using data and methods consistent with the 2021 projections, we
estimate that 9.8 million people were removed from poverty by refundable credits in 2018. Much of the lower
antipoverty effect of the refundable credits in our 2021 projection appears to arise from the fact that stimulus
checks, state payments, and the advance payments of the child tax credit move enough people far enough
above the poverty threshold that they would not be in poverty even if they had not received refundable
credits for the 2020 tax year. We project that if no stimulus checks, state payments, or advance child were
distributed in 2021, refundable credits would remove 6.9 million people from poverty. In addition, we do not
capture the rules that allow people to claim the additional child tax credit and earned income tax credit using
either their 2019 or 2020 earnings and so likely understate the additional child tax credit and earned income
tax credit payments received in the spring of 2020.
42 We report 2018 totals in projected 2021 dollar amounts.
43 The Census Bureau’s ACS SPM estimate is available at “Table 1A: Number (in Thousands) and Percentage of
People in Poverty by State Using the ACS: 2018,” US Census Bureau, SPM Time Series, accessed July 21,
2021, https://www2.census.gov/programs-surveys/supplemental-poverty-measure/tables/time-series/SPM-
Table1.pdf.
R E F E R E N C E S 3 9
References Congressional Budget Office. 2021. “An Overview of the Economic Outlook: 2021 to 2031.” Washington, DC:
Congressional Budget Office.
Fox, Liana, 2020. The Supplemental Poverty Measure: 2019. Current Population Report P60-272. Washington, DC:
US Census Bureau.
Fox, Liana, Brian Glassman, and José Pacas. 2020. The Supplemental Poverty Measure Using the American
Community Survey. SEHSD working paper 2020-09. Washington, DC: US Census Bureau, Social, Economic, and
Housing Statistics Division.
Giannarelli, Linda, Laura Wheaton, and Gregory Acs. 2020. “2020 Poverty Projections: Initial US Policy Response
to the COVID-19 Pandemic’s Economic Effects Is Projected to Blunt the Rise in Annual Poverty.” Washington,
DC: Urban Institute.
Iceland, John. 2019. “Racial and Ethnic Inequality in Poverty and Affluence, 1959-2015.” Population Research and
Policy Review 38, 615-654.
Kochhar, Rakesh and Anthony Cilluffo. 2018. “Income Inequality in the U.S. is Rising Most Rapidly Among Asians.”
Washington, DC: Pew Research Center.
Lauffer, Sarah, and Alma Vigil. 2021. “Trends in Supplemental Nutrition Assistance Program Participation Rates:
Fiscal Year 2016 to Fiscal Year 2018.” Washington, DC Mathematica Policy Research.
Pyati, Archana. 2020. “The Analysis of Transfers, Taxes, and Income Security (ATTIS) Model.” Washington, DC:
Urban Institute.
Ruggles, Steven, Sarah Flood, Ronald Goeken, Josiah Grover, Erin Meyer, José Pacas, and Matthew Sobek. 2020.
IPUMS USA: Version 10.0 [dataset]. Minneapolis: IPUMS.
Wheaton, Laura, Sarah Minton, Linda Giannarelli, and Kelly Dwyer. 2021. “2021 Poverty Projections: Assessing
Four American Rescue Plan Policies.” Washington, DC: Urban Institute.
https://www.urban.org/sites/default/files/publication/103794/2021-poverty-projections-assessing-four-
american-rescue-plan-policies_0_0.pdf.
4 0 A B O U T T H E A U T H O R S
About the Authors Laura Wheaton is a senior fellow in the Income and Benefits Policy Center at the Urban Institute. She
codirects the TRIM3 microsimulation project and is a lead analyst for ATTIS, the Urban Institute’s
ACS-based simulation model. Wheaton is a national expert on the use of microsimulation modeling to
study income supports for lower-income Americans. She also specializes in SNAP and has conducted
research on SNAP eligibility and participation, churning, asset limits, work requirements, and the
potential effects of proposed policy changes.
Linda Giannarelli is a senior fellow in the Income and Benefits Policy Center. She leads the group that
develops the ATTIS model, codirects work with the TRIM3 simulation model, and is a national expert
on the use of microsimulation modeling to study income supports for lower-income Americans. She
also studies participation rates among people eligible for safety-net programs, state policy variations in
the provision of cash assistance and child care subsidies, and the impact of increased earnings on the
net economic resources of lower-income families.
Ilham Dehry is a research analyst in the Income and Benefits Policy Center. She tracks and analyzes
states’ policies for providing cash assistance through work on the Welfare Rules Database. She also
works on TRIM3 and ATTIS microsimulation modeling of safety net programs for low-income families.

STATEMENT OF INDEPENDENCE
The Urban Institute strives to meet the highest standards of integrity and quality in its research and analyses and
in the evidence-based policy recommendations offered by its researchers and experts. We believe that operating
consistent with the values of independence, rigor, and transparency is essential to maintaining those standards.
As an organization, the Urban Institute does not take positions on issues, but it does empower and support its
experts in sharing their own evidence-based views and policy recommendations that have been shaped by
scholarship. Funders do not determine our research findings or the insights and recommendations of our experts.
Urban scholars and experts are expected to be objective and follow the evidence wherever it may lead.
500 L’Enfant Plaza SW
Washington, DC 20024
www.urban.org