
RESEARCH REPORT 098
46
HSE Health & Safety Executive T ransport at work: Rollover of lorries transporting paper reels Prepared by Sheffield Hallam University for the Health and Safety Executive 2003 RESEARCH REPORT 098
Transcript of RESEARCH REPORT 098

HSE Health & Safety
Executive
Transport at work: Rollover of lorries transporting paper reels
Prepared by Sheffield Hallam University
for the Health and Safety Executive 2003
RESEARCH REPORT 098
HSE Health & Safety
Executive
Transport at work: Rollover of lorries transporting paper reels
Professor Keith Berrington, Dr Richard Pitt and Dr Hugh Porteous
School of Science and Mathematics Sheffield Hallam University
Sheffield S1 1WB
United Kingdom
Heavy goods vehicle rollover accidents, in which a lorry rolls over sideways when cornering bends and roundabouts, can be costly in property and injuries. Recognising the importance of this class of accident to the haulage industry and particularly in the transportation of paper products, the UK Health and Safety Executive (HSE) commissioned this study. The aim is to review the rollover risk in the light of current regulations and best practice, by theoretical and practical analysis of the real-life operations of a haulage company specialising in paper reels and paper products. Particular attention is on high centre of gravity loads, which basic physics and accident reports suggest are vulnerable to rollover. We carried out a series of road trials with laden lorries, measuring the acceleration vectors and other parameters. Our analysis of the data includes establishing the main risk factors, looking at the effect of natural oscillations and identifying possible instabilities such as load movement. We find little evidence to support any major change in existing best-practice, except for the highest loads where we there is an inherent rollover risk which we suggest could be effectively eliminated by good driving augmented by maximum speed recommendations on sharp bends and roundabouts..
This report and the work it describes were funded by the HSE. Its contents, including any opinions and/or conclusions expressed, are those of the authors alone and do not necessarily reflect HSE policy.
HSE BOOKS

© Crown copyright 2003
First published 2003
ISBN 0 7176 2182 0
All rights reserved. No part of this publication may bereproduced, stored in a retrieval system, or transmitted inany form or by any means (electronic, mechanical,photocopying, recording or otherwise) without the priorwritten permission of the copyright owner.
Applications for reproduction should be made in writing to: Licensing Division, Her Majesty's Stationery Office, St Clements House, 2-16 Colegate, Norwich NR3 1BQ or by e-mail to [email protected]
ii

ACKNOWLEDGEMENTS
We acknowledge the cooperation and goodwill of A A Griggs Distribution, without which the trials would have been impossible, and to thank Brian Dunbavin who drove the lorry during the trials and who remained patient and supportive throughout. AAG provided lorry, driver and depot facilities for a week of trials in Soham during 9-13 September 2002. John Lane of the Corrugated Packaging Association provided encouragement and guidance. We also acknowledge the help and assistance of Sue O'Callaghan, Len Fuller and Keith Tylee from Sheffield Hallam University.
iii

iv

CONTENTS
EXECUTIVE SUMMARY vii
1. INTRODUCTION 1 Background 1 Previous work 1 Overview of report structure 3
2. ROLLOVER RISK FACTORS 5 Rollover and the static stability factor 5 Motion on a curved path 7 Factors reducing the rollover stability 8 Energy and its contribution to rollo 10Timescale for rollover 10
3. EXPERIMENTAL PROCEDURES 13 The trials 13 The measuring equipment 14
4. RESULTS 17 Acceleration handling 17 Natural oscillations 19 Transmission of motion from base to load 21Analysis of averaged accelerations 24
5. DISCUSSION 25 Summary for each load 25 Further discussion of the tall reels trial 27
6. CONCLUSION 31
7. RECOMMENDATIONS 33
References 35
v

vi

EXECUTIVE SUMMARY
Heavy goods vehicle rollover accidents, in which a lorry rolls over sideways when cornering bends and roundabouts, occur at surprisingly slow speeds, and can be costly in property and injuries. Recognising the importance of this class of accident to the haulage industry and particularly in the transportation of paper products, the UK Health and Safety Executive commissioned this study. The aim is to review the rollover risk in the light of current regulations and best practice, by theoretical and practical analysis of the real-life operations of a haulage company specialising in paper reels and products.
Many factors can contribute to an accident, for example the driver's actions, the road conditions, the vehicle and its load. An interesting feature of lorry rollovers is that, by contrast to many other types of accidents, the roll can occur at relatively low speeds on bends. This 'slow-roll' phenomenon is controlled by the laws of physics: if sufficient sideways acceleration is applied for long enough, and the tyres are gripping well to the road, a loaded lorry will roll over.
We strongly advocate the use of the static stability factor (SSF) as a quantity which can easily be calculated in a depot given the lorry and load weights and dimensions. The SSF is a rigid body model that gives the critical lateral acceleration for rollover: a high centre of gravity yields a low SSF, which can be used to gauge the rollover risk. We quantify further factors such as camber and lean, asymmetric load and high cross wind pressure, which can lower the stability still further, and recommend that 0.25g be subtracted from the SSF to allow for these factors when quantifying the rollover risk while cornering.
In the experimental part of this project, we found that an experienced driver takes bends and roundabouts with speeds well below the rollover risk limit for a particular load. But we feel that it would be helpful if this 'driving to the load' experience were quantified with a parameter such as the SSF, perhaps cast in the form of a suggested maximum speed for sharp bends and roundabouts. This could be as low as 25 km/hr for the highest centre of gravity loads.
Our measurements included continuous three-dimensional accelerometer readings from the top and bottom of loads. We identified natural oscillations laterally in the highest centre of gravity loads of 0.5-1 Hz, but we can find no evidence to suggest that rollover might be induced by resonant reinforcement by external factors such as road oscillations at this frequency.
In one of the trial loads (2.5m tall reels stacked vertically) we detected a time delay between the high frequency lateral acceleration peaks measured at the top and bottom of the load, and between the peaks measured at the front and rear: the use of straps according to existing recommendations is essential to dissipate the swaying energy of such motions. We found no such delay in the vertical oscillations, indicating that the loads we trialled approximated a single mass with the trailer, with no evidence of any dangerous load shift or ‘walking’. Video camera evidence of significant internal swaying of tall palleted loads indicates the importance to us of secure strapping. There is no evidence that the curtains were, or should be, taking any load.
In summary, we found little evidence to support any major change in existing best-practice, except for the highest centre-of-gravity loads where we there is an inherent rollover risk which we feel could be eliminated by good driving augmented by maximum speed recommendations on sharp bends and roundabouts as described above.
vii

viii

1. INTRODUCTION
1.1 BACKGROUND
Heavy goods vehicle rollover accidents, in which a lorry rolls over sideways when cornering bends and roundabouts, occur at surprisingly slow speeds, and can be costly in property and injuries. Recognising the importance of this class of accident to the haulage industry and particularly in the transportation of paper products, the UK Health and Safety Executive commissioned this study. The aim is to review the rollover risk in the light of current regulations and best practice, by theoretical and practical analysis of the real-life operations of a haulage company specialising in paper reels and products.
Many factors can contribute to an accident, for example the driver's actions, the road conditions, the vehicle and its load. An interesting feature of lorry rollovers is that, by contrast to many other types of accidents, the roll can occur at relatively low speeds on bends. This 'slow-roll' phenomenon is controlled by the laws of physics: if sufficient sideways acceleration is applied for long enough, and the tyres are gripping well to the road, a loaded lorry will roll over. It is usual to distinguish slow roll from the ‘tripped’ rollover, caused by hitting or skidding sideways into a curb or other such obstacle, though of course the same physics is involved, except with much higher lateral accelerations acting over a very short time.
Typically 1.8m tonnes of corrugated case material are produced in UK mills each year and additional tonnages are imported; the vast majority is transported by road as reels [1]. A rollover of a paper-carrying lorry incurs both a direct cost to the owner, and indirect costs caused by failure to deliver on time, for example if a newspaper does not appear due to lack of paper. There is also a high incidence of personal injury and fatality. As a result, insurance costs can be high for transporting such high centre of gravity loads, providing further incentive to reduce the risk of rollover.
There are government and industry guidelines for loading, unloading and storage of paper reels [2] and there are guidelines for securing paper reels and general guidelines for freight transport [3,4]. Paper reels are normally stacked vertically in lorries and secured by cable. This is normally stable. But lorry rollover incidents are not necessarily a result of excessive speed, and can occur even at the very low speeds used to negotiate roundabouts. This indicates that there may be some instability issues not sufficiently addressed by current regulations, and it is an objective of this report to provide input for scientifically justifiable guidelines to ensure safe paper transport by British and foreign lorries.
1.2 PREVIOUS WORK
The emphasis in our work is to examine real-life loads in transport. This differs from and augments the traditional approach of establishing general criteria based on repeatable experiments, which is only really possible using dedicated test tracks where the lorry geometry, load, speed, bends etc can be unambiguously measured. Most relevant to our studies were experiments carried out by the UK Motor Industry Research Association [5] to determine the limiting safe speeds for heavy goods vehicles when cornering. The tests were performed on a test track and the vehicles were driven round a 33m radius track at increasing speeds until wheel lift was observed. Outriggers attached to the trailers ensured that the vehicles did not actually roll over.
1

It was observed that while the vehicles were driven in both clockwise and anticlockwise directions round the circle they did not perform the left – right – left routine common when negotiating roundabouts. Typical lateral accelerations of between 0.25g and 0.3g were observed. It was noted that the air-suspension vehicles performed better than those with spring suspension. In one experiment the load shifted so much that the stability of the vehicle was seriously compromised. It should be noted that the restraining straps did not actually break, but they did stretch, thus demonstrating that it is not only the breaking strain of the straps which needs to be considered when load restraint is being discussed. Furthermore, since the straps are almost parallel to the restraining force which they need to impart, the tension in the straps can greatly exceed the restraining force.
The UK haulage industry's concern about load shifting and rollover is evident in the discussion document from WRM [6]. There is an attempt to quantify the forces on a lorry and its load as it proceeds along the road and negotiates corners and bends. The principal conclusion appears to be that loads should not be able to shift, due to the friction between the load and the floor of the trailer, before the lateral accelerations are so great that the lorry should roll over first. It is argued, therefore, that only minimal restraint should be required and that the curtains should provide sufficient restraint provided certain simple precautions are taken. The paper does not explain why loads do, in fact, shift in transit. It does, however, suggest that vibration due to roughness in the road surface could be transmitted through the suspension and this may reduce the effective value of the coefficient of friction m. This could allow the load to "walk" slowly unless it is restrained in other ways. We will use our data to examine this in sections 4.3 and 5.
The UK Fibreboard Packaging Association [3] issues guidelines concerning the loading and unloading of vehicles and the storage of reels. Their paper is primarily concerned with the process of loading and unloading in the depot and has little to say about the stability of loads on the road. It deals both with reels stacked horizontally and vertically and imposes conditions on permissible arrangements both on the vehicle and in the depot.
The USA government has commissioned much research into vehicle rollovers in general, particularly for automobiles and SUVs. We follow their example in exploiting the static stability factor (SSF) in risk guidance [7]. We discuss this research further in section 2.
To set the scene for our research, we show in figure 1 evidence that when rollover occurs, the trailer typically tips over first and pulls the tractor unit over afterwards [12]. This figure is a clip from a movie of a series of J-turns at set steering angle and increasing speed (rollover is at 35mph) with the lorry carrying rolled aluminium. The rear of the trailer rolled to about 90o when the rear tyres of the tractor lift. Earlier in the movie, just at the moment when the trailer tyres lift, the lorry changes from turning to straight: this is evidence of the driver being aware of pending rollover but unable to correct. There are two conclusions which we draw from this figure:
· the trailer can be considered nearly independent of the tractor for the purposes of assessing rollover risk, and we use this as guidance in our research methods.
· it is clear that by the time the driver realises that something is wrong it is too late to take corrective action.
We find this latter point corroborated by driver's statements in some accident reports which we have seen in the UK. A typical example is the following: a driver of an articulated lorry carrying paper reels is moving to exit a roundabout, when the vehicle suddenly turns over on its near side. The driver apparently felt no shift in weight, and his statement continues: “The vehicle did not skid or slide but tipped over suddenly with no prior warning and no opportunity to take any action.”
2

This lack of awareness is well known in the transport industry. Winkler [12] comments that “It is relatively hard for the truck driver to perceive the proximity of rollover while driving. Rollover is very much an either or situation. It is something like walking over a cliff with your eyes closed: as you approach the edge, you are still walking on solid ground but once you have stepped over it is too late.”
Figure 1 A typical rollover where the trailer tips over first and pulls the tractor unit over afterwards [reproduced from ref.12 with permission of the author]
1.3 OVERVIEW OF REPORT STUCTURE
The structure of this report is as follows. Much insight into road accidents in general and rollover in particular can be gained by looking at the physics, so in section 2 we examine rollover risk factors from the point of view of physics. We introduce the static stability factor (SSF), a useful measure of rollover risk based on the rigid body model. Then we consider cornering and factors reducing rollover stability, energy considerations and the timescales involved. In section 3 we describe our experimental procedures, the trials and the measurements made. In section 4 we give an overview of our results, such as the analysis of measured accelerations, natural oscillations and their transmission through the load, and an analysis of averaged accelerations. In section 5 we give a detailed summary for each load, and further discussions focusing on the tall reels trial. Our conclusions are presented in section 6, and recommendations in section 7.
3

4

2. ROLLOVER RISK FACTORS
In this section we discuss the main physics of rollover, and quantify some of the main parameters for the type of lorry and loads used in our trials. The objective here is to highlight the important risk factors and develop some guidelines based on the laws of physics [8-12]. In quantifying these factors, we find it most helpful to use the ‘static stability factor’ (SSF) of [7]. The SSF is the lateral acceleration in g required for rollover in a rigid body model, and depends largely on the ratio of track width to the centre of gravity height, though as we shall see, it can be modified to take into account other important risk factors.
Analysis of crash data in the USA reveals that SSF correlates significantly with a vehicle's involvement in single-vehicle rollovers [7]. From this, the National Highway Traffic Safety Administration (NHTSA) developed a rating system for rollover resistance. But it encapsulates tripped and untripped rollover data for all vehicles and is not especially tuned to HGVs; the rating boundaries are coarse, particularly at the lower SSFs (the lowest rating is given to all SSFs less than 1.03). In the UK the HGV untripped rollover database would be statistically even coarser, so in our work we regard the SSF as providing quantifiable guidance to risk rather than a measurement of risk.
2.1 ROLLOVER AND THE STATIC STABILITY FACTOR (SSF)
When a lorry is stationary or moving with constant speed, the gravitational force downwards is exactly balanced by the road pressure transmitted symmetrically through the tyres (figure 2a, left). Applying a sideways acceleration introduces a torque acting to lift one side of the lorry, producing an asymmetric force on the tyres (figure 2a, right). If sufficient acceleration a is sustained, then the lorry will roll over.
Let M be the total weight of the lorry, acting at a centre of gravity distance H from the ground, with T the track width and g the gravitational constant. As can be seen from figure 2a, the lefthand wheels lift off when F=Mg/2. Taking moments about the right-hand wheels gives the critical acceleration a required to supply this F and so cause rollover:
MaH = MgT/2.
Rewriting this in acceleration units of g,
a/g = T/2H Ł SSF.
This factor T/2H is known as the static stability factor (SSF) used to categorize rollover risks in the USA [7]. Cars have a SSF of around 1.4 and are relatively stable against untripped rollover. However, the increase in centre of gravity height H arising from loading a high-sided lorry can decrease the SSF to below 1.0.
The SSF, which can be calculated fairly easily in the lorry depot, gives a useful yardstick for assessing the inherent stability of loaded lorries, and for assessing the risk of various actions of a working lorry, such as cornering, camber, cross winds etc. by evaluating the affect on the SSF.
5

2.1.1 Calculating the SSF
The width T would be similar for many lorries. Since we are concerned here with rollover, we will take T to be the width of the trailer unit, which assumes that any roll will pivot around the outer edges of the wheels. In the trailer unit used in our trials, this was 2.5m. We will also ignore the tractor unit in this equation: this is because empirical evidence from accident reports suggests that slow rollover generally starts with the trailer.
The centre of gravity H of a loaded trailer can be calculated by combining the unladen trailer, whose weight is mu and centre of gravity height from the road is hu , with the load, whose weight is m and average height is h from the trailer floor, which is distance hf above the road:
H = [muhu + m(hf+h/2)]/M, M = mu+m.
T, mu , hu and ht are fixed for a given type of lorry. Putting in reasonable figures based on the lorry trailer used in our trials of 2.4m, 7.4t, 1m and 1.3m respectively, and with the load's weight m and average height h measured in tonnes and meters:
SSF § 1.2(7.4+m)/[7.4+m(1.3+h/2)].
Given an average load height of 2.5m and weight of 26 t, we estimate SSF to be 0.56. Further figures for the trial loads are tabulated in table 2.
Figure 2a Static forces on a lorry (left), and in the presence of lateral acceleration (right)
6
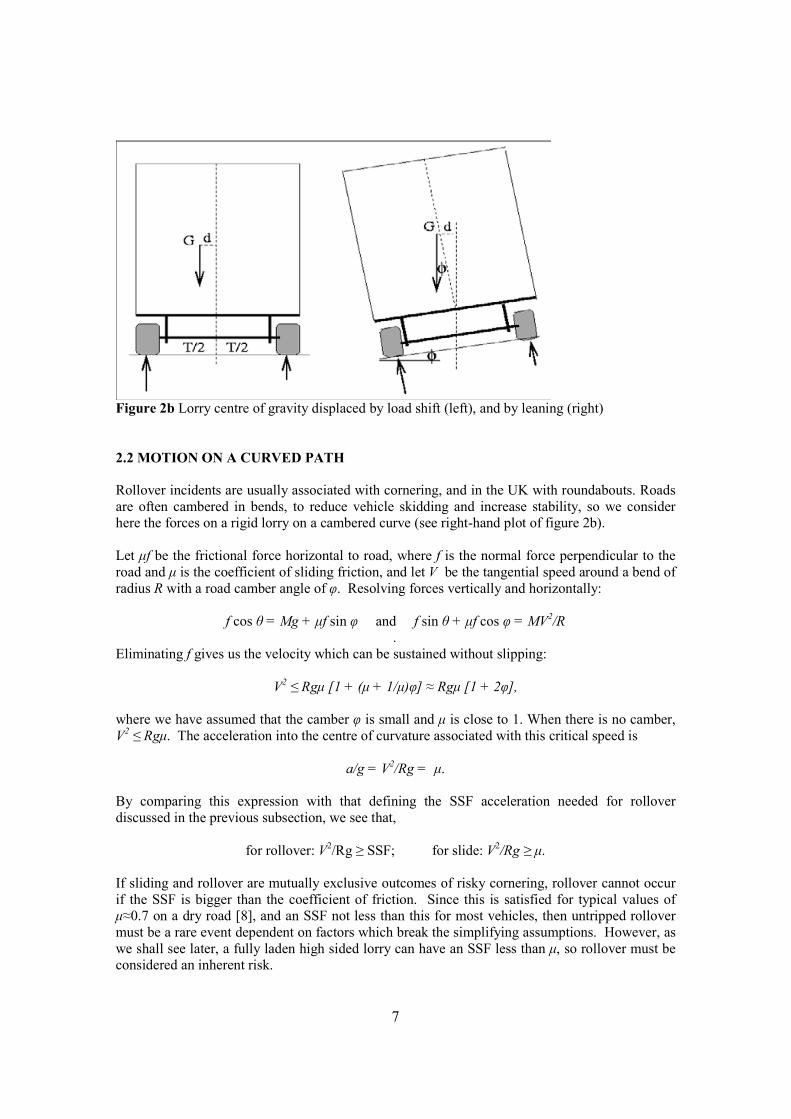
Figure 2b Lorry centre of gravity displaced by load shift (left), and by leaning (right)
2.2 MOTION ON A CURVED PATH
Rollover incidents are usually associated with cornering, and in the UK with roundabouts. Roads are often cambered in bends, to reduce vehicle skidding and increase stability, so we consider here the forces on a rigid lorry on a cambered curve (see right-hand plot of figure 2b).
Let µf be the frictional force horizontal to road, where f is the normal force perpendicular to the road and µ is the coefficient of sliding friction, and let V be the tangential speed around a bend of radius R with a road camber angle of ij. Resolving forces vertically and horizontally:
f cos ș = Mg + µf sin ij and f sin ș + µf cos ij = MV2/R .
Eliminating f gives us the velocity which can be sustained without slipping:
V2 � Rgµ [1 + (µ + 1/µ)ij] § Rgµ [1 + 2ij],
Vwhere we have assumed that the camber ij is small and µ is close to 1. When there is no camber,
2 � Rgµ. The acceleration into the centre of curvature associated with this critical speed is
a/g = V2/Rg = µ.
By comparing this expression with that defining the SSF acceleration needed for rollover discussed in the previous subsection, we see that,
for rollover: V2/Rg � SSF; for slide: V2/Rg � µ.
If sliding and rollover are mutually exclusive outcomes of risky cornering, rollover cannot occur if the SSF is bigger than the coefficient of friction. Since this is satisfied for typical values of µ§0.7 on a dry road [8], and an SSF not less than this for most vehicles, then untripped rollover must be a rare event dependent on factors which break the simplifying assumptions. However, as we shall see later, a fully laden high sided lorry can have an SSF less than µ, so rollover must be considered an inherent risk.
7

2.2.1 Cornering speed for rollover
The maximum speed V that a corner of radius R can be taken, assuming that SSF is smaller than µ so that slide does not occur, is
V = ¥(RgSSF).
As an example, with SSF=0.56 and R=25m, the critical speed is 42 km/hr. The good news is the square root dependence here: reduction of R or SSF by, say, 10% reduces the critical speed by only 5%.
2.3 FACTORS REDUCING THE ROLLOVER STABILITY
We now look at some factors which can reduce the effective SSF, and hence increase rollover risk, such as off-centred loads, a sideways lean or camber, and side wind pressure.
2.3.1 Off-centred loads
Loading conventions aim to align the load symmetrically on the left-right axis so that the centre of gravity G lies in the middle of the track width. We now consider the effect of a displacement of G (figure 2b, left), which may arise either from bad loading or from load shift in transit. A similar analysis applies to a lorry on a camber, even when symmetrically loaded (figure 2b, right).
Assume a rectangular cross section of width T and centre of gravity height H. Let d be the fractional displacement of the centre of gravity from the midpoint T/2, and let the load be tipped up by an angle ij to the horizontal. The coordinates of the centre of gravity G(x,z) relative to a base corner and measured along the horizontal x axis and vertical z axis are
G(x,z) = H((1 í d)SSF cos ij í sin ij, cos ij + (1 í d)SSF sin ij).
So an off-centre load reduces the effective SSF by the factor (1íd), essentially by reducing the effective track width T. For example, if T = 2.4m, then a displacement of the centre of gravity by 12 cm from centre reduces the SSF by 10%.
2.3.2 Sideways lean or adverse camber
From the same equation we see that even if the load is symmetrically placed with d=0, the SSF would be reduced when leaning sideways, as on a camber, by a factor (1í ij/SSF) for small ij. An SSF of 0.7 will be reduced by 10% if the camber or leaning angle is 40. This presents little risk if the vehicle is cornering on a properly aligned camber; on the other hand, adverse camber does present a risk.
A combination of the effects of asymmetric load and lean can be additive. The reduction of an already low SSF by these means can place a high-loaded lorry into serious risk of rollover.
2.3.3 Side winds
A strong cross wind can seriously affect the dynamics of a high sided lorry. Let W be the wind speed normal to a surface area A. The volume of air hitting the surface in time t is AWt, and its momentum is ȡairAW2t where ȡair is the air density. The time derivative of the momentum gives the force exerted on the side of the lorry,
8

Fwind = ȡairAW2.
This can be divided by the lorry mass M to obtain the lateral acceleration a. Inserting values for the constants (ȡair = 1.3 kg m-3), and expressing the surface area in m2, the wind speed in km/hr and lorry mass in tonnes,
a/g § 10-5AW2/M.
To give some feel for the magnitude of this, consider a moderate gale of 50km/hr impacting a lorry side of area 40m2: a 10 or 40 tonne vehicle will feel a lateral acceleration of 0.1g or 0.025g respectively.
The inverse dependence on the lorry mass is justification for unladen high-sided lorries to remove side curtains in high winds, to reduce the effective surface area. But it is the dependence on the square of the wind speed which concerns us here: doubling the wind speed to a not-uncommon severe gale quadruples the accelerations calculated above, so that a 40 tonne vehicle in such a side wind will experience a lateral acceleration of 0.1g, which would add significant risk to rollover if the SSF were already low.
2.3.4 Increased load height
We examine here the effect of increasing the load height, either by stacking or by a change of cargo type to taller objects such as paper reels. Assume that the weight of the load m remains the same, and the height h is increased by a factor į. The SSF calculated in subsection 2.1.1 is then reduced by a factor mhį/[2muhu + m(2hf+h)].
Specifically, if the 2.5m high load referred to in subsection 2.1.1 is increased to 2.8m with other parameters including the weight remaining the same, then the SSF reduces from 0.56 to 0.53. This is not particularly significant.
2.3.5 Summary of factors acting to reduce the SSF
We summarise in table 1 the effects of the factors considered in this subsection which cause the SSF to be reduced. An original SSF of 0.56 is taken (using the parameters of subsection 2.1.1), and we consider what is required to reduce the SSF by 0.1, which is equivalent to reducing the critical lateral acceleration for rollover by 0.1g.
The significance of this reduction is as follows. If the lorry is travelling around a bend or roundabout whose curvature of radius is 25m, and its SSF is 0.56, then the critical speed for rollover to occur is 42 km/hr. A reduction of SSF by 0.1 reduces this critical speed to 38 km/hr.
Table 1 A summary of the amount of perturbation required to reduce the SSF by 0.1, which is equivalent to reducing the critical lateral acceleration for rollover by 0.1g. We assume an original SSF of 0.56 and the lorry parameters of subsection 2.1.1. Perturbation Amount to reduce the SSF by 0.1 Bend of 25m radius of curvature Off-centred load Angle of lean or adverse camber Side wind speed Increasing the load height from 2.5m
18km/hr 25cm displacement from centre 60
90 km/hr severe gale 3.7m load height
9

2.4 ENERGY AND ITS CONTRIBUTION TO ROLLOVER
An angular object pivoting on its corner must have its centre of gravity raised before it can be rolled over (figure 3). In the case of rollover caused by motion, there must be sufficient kinetic energy available to convert into the required potential energy.
The required upward displacement zroll of the centre of gravity is the maximal given by setting dz/dij=0 in the coordinate function G of subsection 2.3.1 to find the angle ijroll relative to horizontal beyond which rollover must occur:
ijroll = tan -1 (SSF)
zroll = H (cos ijroll + SSF sin ijroll í 1),
where SSF=T/2H is reduced by the factor (1-d) discussed above for an off-centre load. The kinetic energy (½mV2) pays the potential energy cost for the upward zroll displacement:
V2 � 2gH (cos ijrol + SSF sin ijrol í 1).
The assumption here is that the bottom corner of the object remains at constant height, which is unlikely for the whole lorry because of the response of the suspension. However, it can apply to the load in incidents where load flip occurs, or in tripped or jack-knife rollovers. If a lorry turns sharply at right-angles then its velocity vector V changes direction. Its load (which could include the trailer if articulated) wants to continue in the original direction and has sufficient energy to rollover if V exceeds the above criterion. Quantifying this for a load or lorry of track width T=2.4m, a centre of gravity height H of 1m or 2.5m gives the minimum sideways-pointing speed for load rollover or lorry jack-knifing as 12 or 9 km/hr respectively.
Figure 3 Centre of gravity H for tilting lorry or load. The base width is 2.4 m, and H when upright is 1.2m (solid line) or 2.4m (dashed line) above ground.
2.5 TIMESCALE FOR ROLLOVER
Both the lateral acceleration-induced SSF rollover and the load-flip, tripped or jack-knife rollovers examined in the previous subsections require the application of a sideways acceleration or velocity over a period of time. We now derive typical timings for turning manoeuvres.
10

Let R be the curvature radius of the bend and V the vehicle speed, assumed constant. The time taken to go round a right-angled bend is
t(secs) = 1.8ʌR(metres) / V(km/hr).
So travelling at 40 km/hr around a right-angled bend of radius 20m takes just under 3 seconds. We now investigate the timescale required for rollover. From the equation for the motion of centre of gravity G(x,z) given above, the horizontal displacement xroll to the point of no return is when G is vertically above the pivoting corner,
xroll = T/2.
With constant sideways acceleration a this takes time
1/2 t = (T/a) .
At the critical sideways acceleration of a/g=SSF the time to rollover is
1/2 troll = (2H/g) .In our experiments we use troll to define an averaging interval for our acceleration measurements,since this is the amount of time that the critical acceleration has to be sustained for rollover to occur.
As an example, to roll over a lorry of track width T=2.5m and a centre of gravity height H of 1mor 2.5m, the formula tells us that the critical sideways acceleration needs to be sustained for 0.5s or 0.7s respectively [load flip, untripped rollover or lorry jack-knifing at the critical sidewaysspeed discussed in the previous subsection takes slightly less time than these].
The importance of this for securing a load is as follows. Manoeuvring forces and velocitychanges need to be transmitted from the lorry to the load, and from the bottom to the top of theload in the case of loads secured to the lorry primarily by base friction. We will see later in our experiments that the loads we dealt with had response transmission times well below the criticaltimes identified above, so that the load follows the lorry well for normal manoeuvring.
11

12

3. EXPERIMENTAL PROCEDURES
3.1 THE TRIALS
An articulated lorry and driver were provided by AAG Distribution for a week of road trials during 9-13 September 2002. Our experiments consisted of gathering diagnostic data under realistic road and load conditions. In order to do this, we placed accelerometers on the lorry and load and made use of video camera images, tachometer output and other data as described in section 3.2. Seven journeys, each with a different type of load were investigated, as described below; these represented as far as possible a range of typical working conditions encountered by the paper and card transportation industry, after prior discussions with the HSE and AAG Distribution.
tThe seven loads are described below. The centre of gravity height, the SSF and the rollover time roll calculated for the loaded trailer in each case are summarised in table 2.
3.1.1 The trial loads
Mixed reels. These were twenty four paper reels of varying heights and weight, upright and staggered along the length of the trailer and strapped; the total weight being 25.1 tonnes. The six tallest (of height 1.50m to 1.55m) were placed at front and back. The remaining eighteen (of height 0.90m to 1.15m) were double stacked.
Uniform pallets. These were small pallets (see below) containing paper products, double stacked to a height of 2.5m, strapped and placed two-by-two down the trailer.
Baled waste. There were forty two bales of paper waste stacked three bales high filling most of the trailer with an average height of about 3m. The total cargo weight was 28 tonnes.
Tall pallets. These were unstrapped at the side, but cross strapped at rear. There were 16 pallets of paper products at 380kg and 8 at 130kg with an average height of 2.5m and placed two-by-two down the trailer.
Mixed pallets. These were side strapped and cross strapped at the rear, and were arranged twoby two down the trailer: eight 2.5m high pallets (each 380kg) at the front, followed by four 1.2m (380kg) pallets double stacked, twelve 1.3m (420kg) pallets double stacked, and eight 1.2m pallets single stacked at the rear. The total cargo weight was 12.8 tonnes.
Small pallets. These were unstrapped at the side, but cross strapped at rear: a single stacked two-by-two arrangement of 24 pallets 1.3m high and 420kg weight.
Tall reels. There were twelve 2.5m high cylindrical paper reels placed on end in a staggered arrangement down the centre of the trailer, with a gap of around 0.2m to the side and 2m at the rear. The reels were side and rear strapped (figure 5). This trial involved a 3hr journey from Soham to Louth.
13
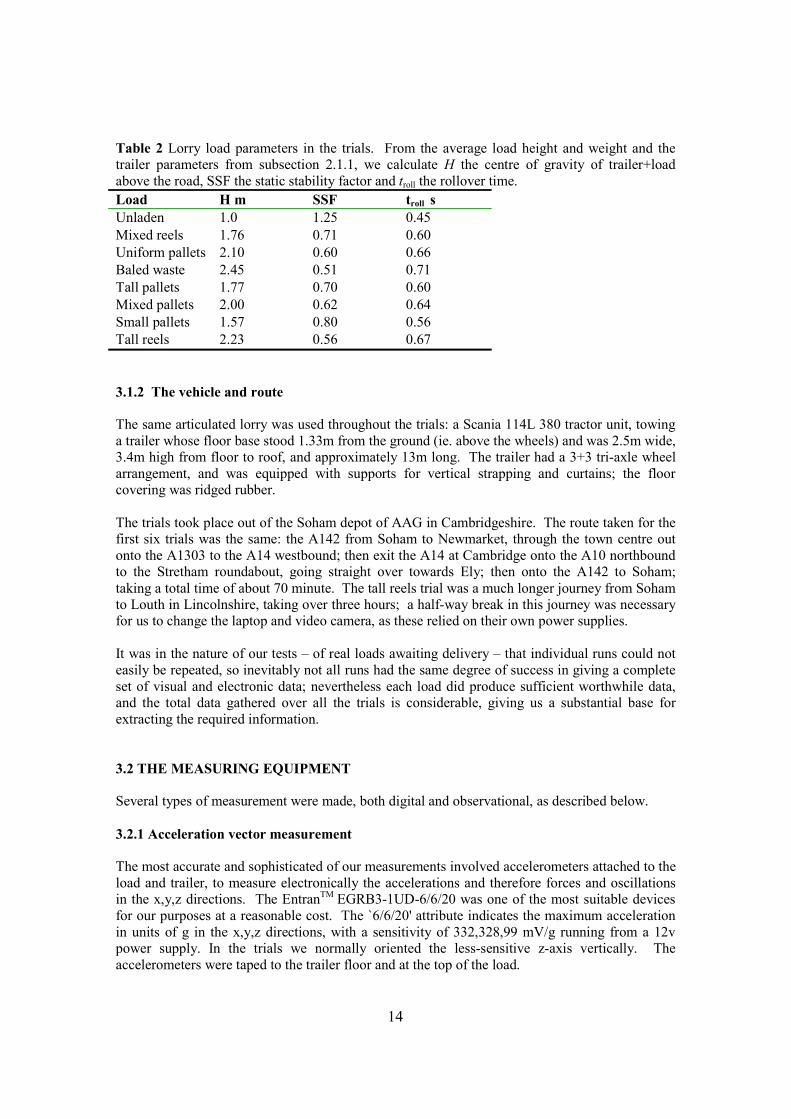
Table 2 Lorry load parameters in the trials. From the average load height and weight and the trailer parameters from subsection 2.1.1, we calculate H the centre of gravity of trailer+load above the road, SSF the static stability factor and troll the rollover time. Load H m SSF troll s Unladen Mixed reels Uniform pallets Baled waste Tall pallets Mixed pallets Small pallets Tall reels
1.0 1.762.10 2.45 1.77 2.001.57 2.23
1.25 0.71
0.60 0.51 0.70
0.620.80 0.56
0.45 0.60
0.66 0.71 0.60
0.64 0.56 0.67
3.1.2 The vehicle and route
The same articulated lorry was used throughout the trials: a Scania 114L 380 tractor unit, towing a trailer whose floor base stood 1.33m from the ground (ie. above the wheels) and was 2.5m wide, 3.4m high from floor to roof, and approximately 13m long. The trailer had a 3+3 tri-axle wheel arrangement, and was equipped with supports for vertical strapping and curtains; the floor covering was ridged rubber.
The trials took place out of the Soham depot of AAG in Cambridgeshire. The route taken for the first six trials was the same: the A142 from Soham to Newmarket, through the town centre out onto the A1303 to the A14 westbound; then exit the A14 at Cambridge onto the A10 northbound to the Stretham roundabout, going straight over towards Ely; then onto the A142 to Soham; taking a total time of about 70 minute. The tall reels trial was a much longer journey from Soham to Louth in Lincolnshire, taking over three hours; a half-way break in this journey was necessary for us to change the laptop and video camera, as these relied on their own power supplies.
It was in the nature of our tests – of real loads awaiting delivery – that individual runs could not easily be repeated, so inevitably not all runs had the same degree of success in giving a complete set of visual and electronic data; nevertheless each load did produce sufficient worthwhile data, and the total data gathered over all the trials is considerable, giving us a substantial base for extracting the required information.
3.2 THE MEASURING EQUIPMENT
Several types of measurement were made, both digital and observational, as described below.
3.2.1 Acceleration vector measurement
The most accurate and sophisticated of our measurements involved accelerometers attached to the load and trailer, to measure electronically the accelerations and therefore forces and oscillations in the x,y,z directions. The EntranTM EGRB3-1UD-6/6/20 was one of the most suitable devices for our purposes at a reasonable cost. The `6/6/20' attribute indicates the maximum acceleration in units of g in the x,y,z directions, with a sensitivity of 332,328,99 mV/g running from a 12v power supply. In the trials we normally oriented the less-sensitive z-axis vertically. The accelerometers were taped to the trailer floor and at the top of the load.
14

Some technical preparations were needed to use these accelerometers, including wiring to power supplies and signal cables, and the installation of connectors and a junction box to manage the linkage of the three signals from each accelerometer to a National Instruments DAQCardTM6024E on the laptop (figure 4). We thus developed a packaged facility which could be safely installed on the lorry. It was also essential to stow the laptop on the trailer, as we felt we could not risk the possible mechanical stress and signal noise involved in running signal cables across the articulated trailer to the cab: AAG Distribution were able to construct a box slung under the trailer adequate for carrying the equipment safely (figure 4).
3.2.2 Data analysis
Data acquisition was managed with DAQCardTM to interface with the LabviewTM software from National Instruments running on a laptop. Each accelerometer provided three signal streams (x,y,z). A LabviewTM program was written to manage the data collection: briefly, this involved programming automatic discretization of the multi-channel data in intervals of 0.0025s, and to file the buffered memory to hard disk automatically every five minutes. The accelerometer output was thus captured by the laptop in the form of standard ASCII files which were stored on CDs for later viewing and analysis. Most of this later analysis, described in more detail in the results section, involved some programming; this, and the graphical preparation for this report, was done with open source software under Suse Linux 8.0.
3.3.3 Visual and analogue information
Visual display of the cargo in motion was provided by having a video camera inside the trailer. AAG Distribution were able to fix secure brackets in the trailer to hold the camera in position. In most of the trials, the camera was placed 2 or 3m from the bottom in the rear corner, giving a good view of the top of the loads when in motion (figure 5). The camera is not however on a fixed frame, and shares the motion of the trailer. It nevertheless gives a useful qualitative picture of life inside the trailer in motion.
In order to derive more quantitative data we fixed torches to the load and trailer to give some points of light shining towards the camera (figure 5): the idea being that any gross motion of the load relative to the trailer (as opposed to load and trailer moving together) might be measurable from the video footage.
A log book was kept of each trial, noting the geographical aspects of the journeys as noted by one of the SHU team in the passenger seat of the lorry. This was augmented by route maps, tachographs, cargo specifications, tape-measurements of positioning of reels etc. We also used chalk marks on the base of the trailer to indicate overall cargo movement. An extra video camera was used for the final day of the trials (the tall reel Soham-Louth journey), to provide a filmed record of the lorry from a following car, and from the passenger cab, to augment the log book.
Because of the several different types of experiments active in a given trial (eg. accelerometers attached to a laptop, video camera, log book, tachometer), we needed some synchronization. Some of the graphs displayed later in this report (eg. figures 6 and 7) show an absolute time scale. The zero on this scale refers to an arbitrary point of time before departure at the Soham depot, specifically when the data acquisition program is started on the laptop. This can then be used to synchronize events for that particular trial. There is therefore no particular significance in the absolute time scale used on these graphs, other than to provide a relative sequencing of events.
15

Figure 4 The equipment. Above: circuit diagram for connecting the accelerometers to a laptop. Right: accelerometer cable junction boxes on the lorry, with laptop and power supply (not visible here) in the secure box slung under the trailer, which is here laden with tall reels.
Figure 5 The trailer used in the trials, here carrying the tall reels. Left: arrangement of load and straps (this photograph was taken in the depot: side curtains are drawn before the vehicle starts). Right: clip taken from the interior video camera slung at the top corner in the rear, looking across the tall-reel load while the vehicle is moving at 80km/hr; note the accelerometer and torch attached to the top of the reel in the foreground.
16

4. RESULTS
4.1 ACCELERATION HANDLING
4.1.1 Raw data and moving averages
Figure 6 gives some indication of the data gathered from the accelerometers. This figure shows a fragment of the accelerometer data for the Soham-Louth run with the 2.5m tall reels: specifically for a 25s time interval covering the approach and rounding of the Soham bypass roundabout near the AAG depot. The left plot shows the signal from one of the accelerometers placed on top of a reel (the one shown in figure 5), along the x axis (aligned width-wise across the lorry, horizontally).
We noted in subsection 2.5 that the critical acceleration for rollover must be sustained for time troll for rollover to actually occur. We therefore wrote an analysis program so that we could view a moving average of our acceleration data: we chose a time interval of 0.64s for the averaging, as being typical of the calculated troll of table 2. Although the higher frequency raw data contains useful information, discussed further in subsection 4.3, the moving averages are more convenient for analysing the low frequency signatures of rollover, and form the basis of much of the analysis of this report.
The right plot in figure 6 shows the effect of this averaging. The x axis data from the left plot is here augmented with simultaneous measurements along the y axis (length-wise) and z axis (vertical). The resulting plot shows several things: the broad dip in the y direction at 690s indicates a deceleration well in advance of the roundabout; a small dip in the x direction at 695s followed by a broad peak at 700s followed by another small dip, indicates lateral forces due to the left-right-left trajectory of a roundabout manoeuvre from entrance to exit. In addition, the signal shows some low frequency oscillations which we will discuss later.
4.1.2 A comparison of the palleted loads at one particular roundabout
All the trials except the tall reels one discussed above followed the same road map. This circuit began by turning right at the above Soham roundabout onto the Soham bypass. In figure 7 we show the x and y accelerations measured in four of the trials for this same manoeuvre for comparison. In each case the dominant features are an initial negative y acceleration dip due to decelerating well before the roundabout, and an x acceleration small dip, large broad peak and small dip due to the left-right-left motion cornering the roundabout from entrance to exit. In one of the trials (tall pallets) the lorry halted at the roundabout, and this accounts for the deep deceleration dip in y due to braking followed by y peaks due to accelerations.
The tachographs give some estimate of the speed in each case and we give these in table 3. This gives us some confidence in our calibration: if the (non-zero) minimum speeds of table 3 are roughly the speed V cornering the roundabout, then the maximum lateral acceleration a/g of around 0.2 is very similar to that predicted by the relation a/g = V2/Rg for a curved path of radius R § 25m. The theory of section 2 tells us that the lowest centre-of-gravity load (small pallets) could be safely driven at the greatest speed for this manoeuvre, and this was found to be the case in practice: the driver drove with due regard to the load.
17

Figure 6 Lorry with tall reels negotiating the Soham bypass roundabout, from the initial decelerating approach at 690s (time is zeroized at the AAG Soham depot), to the roundabout at 700s and departure soon after on the Ely road exit. Left: accelerometer output in the lateral x direction, raw data. Right: x (solid line), y (dashed line), z (dotted line in middle) accelerations averaged over 0.64s.
Figure 7 A comparison of different palleted loads performing the same manoeuvre at the Soham bypass roundabout: x (solid line), y (dashed line) averaged accelerations. (There is no significance in the absolute time scale here: each trial is independently zeroized at the depot.)
18

The high lateral acceleration shown in figure 7 for the uniform pallets load, of 0.25g is not particularly dangerous here – it would require doubling the speed to 44km/hr to give a/g =0.59, which is the SSF rating for the load and therefore the rollover risk threshold – however, as pointed out in section 1, other factors could make this more of a risk such as taking the roundabout on a tighter curve, or an adverse camber etc.
Table 3 Estimates from the tachograph of the approximate speed before the Soham roundabout, the minimum speed recorded while negotiating the roundabout, and speed reached afterwards on the bypass. This table refers to the palleted loads as illustrated in figure 7. Load Before km/hr Minimum km/hr After km/hr Uniform pallets 56 22 80 Tall pallets 58 0 82 Mixed pallets 55 24 80 Small pallets 60 28 82
4.2 NATURAL OSCILLATIONS
4.2.1 The acceleration spectrum
Oscillations can be extracted from our data by looking for dominant frequencies ȣ in the acceleration spectrum. We define the spectral density S(ȣ,x,y,z,) to be the following convolution of the acceleration a(t,x,y,z) signal:
S(ȣ,x,y,z,) = | � exp(i2ʌȣt) a(t,x,y,z) dt |2
The integral is done numerically over intervals of 600s, chosen to exclude times when the lorry is stationary; the spectral density is calculated on a logarithmic mesh in frequency using an interval in ln ȣ of 0.002 and normalized over the range 0.25–64 Hz. This is plotted in binned histogram form in figure 8 for five of the trial loads: uniform pallets; tall pallets; mixed pallets; small pallets; tall reels. In each case the top-of-load acceleration in the x,y,z directions is shown.
4.2.2 High frequency oscillations
A high frequency signature at about 16Hz is one of the dominant features of figure 8, and probably arises from some mechanical agitation caused by engine or transmission vibrations. However, this is far too high a frequency by comparison with the time troll for which the critical rollover acceleration must be sustained for rollover to occur, so this frequency would appear to have little relevance for rollover. It may however give us information on how oscillations are transmitted through the load, and whether different parts of the load are acting in unison or independently: a subject we will return to in subsections 4.3 and 5.7.
19

Figure 8 Spectral densities of the top-of-load accelerometer signals a(t,x,y,z), normalized in the range 0.25–64 Hz. From the top: uniform pallets; tall pallets; mixed pallets; small pallets; tall reels.
20

4.3.4 Low frequency oscillations
Low frequency oscillations are less clearly defined in figure 8, and hardly present at all in the y and z directions, except for the tall reels case. But it is in the x direction, important for rollovers, that we see the most significant low frequency signatures.
We note that that the shape of the potential well in figure 3, of a rectangular object rocking from side to side, precludes a simple harmonic solution. This has two consequences. Firstly, there may not be a simple inverse relation between ȣ2 and a length, such as the load height, though in fact figure 8 shows that the high centre of gravity loads, such as the tall reels, do have the most significant low frequency signatures. Secondly, an oscillation, unless externally reinforced, is going to be damped by the rectangular gradient discontinuity, and probably further modified by suspension characteristics, so that `natural’ oscillations may appear only as weak features in the spectrum.
Figure 8 shows clear evidence of significant lateral oscillations of 0.5-1 Hz in the trials involving loads with the highest centre of gravity, and some confirmation of this was provided in the tall reels trial by a visual observation of the lorry which indicated a lateral sway with a period of about one second. This is close to the time range troll required for sustaining the critical rollover acceleration, and justifies the emphasis in this report on the tall reels trial in particular for informing rollover risk. The good news is that for articulated lorries under normal driving conditions, the response times for manoeuvres such as turns is probably a lot longer than one or two seconds, so that there should not normally be any problem. Nevertheless these `natural’ low frequency oscillations could become a risk factor when aggravated by other phenomena such as camber changes.
4.3 TRANSMISSION OF MOTION FROM BASE TO TOP OF LOAD
All motion at the top of the load must arise from forces acting from the base. Deviations from a rigid body model of the trailer plus load would occur if motion of the load was in some way different from that of the trailer bed, and this would constitute a serious risk. Here we look at the vertical transmission of vibrations. Further discussion on specific loads is left to section 5.
Figure 9 shows a comparison of the acceleration measured at the top and bottom of a reel in the tall reel trial. The lateral x direction shows significant phase shift or delay in the high frequency peaks; the longitudinal y direction shows some differences in structure but the oscillations are not large; the peaks in the vertical z direction show almost perfect synchronization. These results are encapsulated in figure 10, where we plot the proportion of peaks being delayed by a given time. In the x direction it is about 0.02s. Figures 11 and 12 repeat the analysis for the uniform pallets load and the tall pallets load. In each case, there is good synchronization between the peaks measured at top and bottom of the loads. Therefore the lateral oscillations in the tall reels trial seem to show the only case of a significant top-bottom delay in the transmission of oscillations.
In figure 13 we look at the spectral amplification in the lateral direction between the bottom and top of the load. A positive value on this plot indicates that the spectral signature of a particular frequency is amplified from the bottom to the top of the load; a negative value indicates damping of the spectral signature. All the cases considered show some small spectral amplification at low frequencies. At higher frequencies the side-strapped loads show some damping, probably due to dissipation of vibrations into the strapping; the unstrapped tall pallets load shows some amplification, and we discuss this further later.
21

Figure 9 Transmission of motion from base to top of load, x,y,z acceleration [tall reels]. Solid line, trailer base accelerations; dashed curve, top of load accelerations
Figure 10 Transmission of motion from base to top of load for tall reels: the proportion of acceleration peaks at the base which are delayed by a given time before the top response
22

Figure 11 Transmission of motion from base to top of load as in figure 10, but for uniform pallets
Figure 12 Transmission of motion from base to top of load as in figure 10, but for tall pallets
Figure 13 Transmission of motion from base to top of load. Spectral amplification factors for figures 10-12
23

Figure 14 Dynamic stability factor (DSF, see text) as a proportion of time. This figure is a composite plot combining the results of all the trials.
4.4 ANALYSIS OF AVERAGED ACCELERATIONS (DSF)
The rollover time troll defined in subsection 2.5 provides us with a criterion for stability against rollover in dynamic situations (as opposed to the SSF which is a static measure) if we can derive from acceleration vector measurements on a lorry a `Dynamic Stability Factor':
DSF = <a/g>/SSF
where <> denotes an average of the lateral acceleration over troll. The DSF ratio must be less than 1 for rollover stability.
This is shown in figure 14, which is a composite histogram combining all the data from all the trial loads. The highest DSF ratings were for the tall reels trial. However, none were dangerous: the DSF was always below 0.64.
24

5. DISCUSSION
5.1 SUMMARY FOR EACH LOAD
5.1.1 Paper reels mixed height
This was a relatively heavy load of paper reels, cylindrical in shape and stowed on end. The paper reels were of mixed height, and some of the smaller ones were double stacked. The overall centre of gravity height was not particularly high however, and internal video images revealed no significant motion of the load relative to the trailer while in motion. The side strapping was secure and showed little movement, suggesting that the conventional system of strapping reels is sound, and at the end of the run the load had not moved from its original position on the trailer bed. Although the accelerometers were not operational in this trial, due to a technical error, we suggest that the dynamics of this load would follow the characteristics of the tall reel trial , but with a lower centre of gravity there would be less rollover risk involved. As an aside, there was very heavy rain during this trial, so the observed stability of this load could be accounted for in part by the slower driving conditions.
5.1.2 Palletised load uniform and strapped
On this trial the load was short pallets, double stacked. The video showed considerable movement of the load as the lorry traversed the route from Soham through Newmarket and Ely. The pallets appear to rock gently but there was no evidence that their bases had moved on the floor of the trailer. They did not appear to make contact with the curtains, suggesting that the internal strapping was able to restrain the load safely. Figure 8 shows some evidence of a low lateral sway of 0.5Hz; this is not a problem under normal driving conditions unless very rapid manoeuvres are attempted at speed. Figure 11 shows that base oscillations seem to be transmitted immediately to the top of the load, showing that trailer and load form effectively a rigid body, and that the strapping is satisfactory.
5.1.3 Baled waste
On this trial the load was baled paper waste and the weight was the maximum allowed by the regulations. Since the baling was essentially cubical in nature the load was extremely stable and did not appear to move at all when watched on the video. There was quite a lot of high frequency vibration, but it was not clear from the video whether the load itself was shaking or if the camera was shaking on its support. There was occasional evidence of a 1 Hz sway, but this was very slight and difficult to measure accurately. The accelerometers were not operational in this trial and so only the video evidence was available. Because of the high weight and centre of gravity of this load, this load does have a high rollover risk, but it is clear that this can be avoided by careful driving, as in the trial.
5.1.4 Tall pallets (2.5m high) unstrapped, cross strapped at rear
This was a light load of tall palleted paper card product: the centre of gravity height of the loaded trailer was relatively low. Figure 8 showed evidence of natural oscillations in the x,y,z accelerations of over 2Hz, which is too high by comparison with normal lorry manoeuvres to cause problems. Figure 12 shows no significant delay in the transmission of these oscillations from the base to the top of the load. However figure 13 showed some evidence of a bottom to top of load amplification in the high frequency spectrum of the lateral sway, and we note that this
25

amplification is not present in the strapped loads. Because this might be an indication that the load and trailer were not entirely integrated and could lead to load ‘walking’ due to lessening of the friction with the trailer bed – though there was no evidence in the trial that the load had in fact shifted relative to the trailer bed – we recommend that pallets of this size should be side strapped for greater integrity.
5.1.5 Mixed load pallets cross and side strapped
This was a relatively light paletted load of paper card with a fairly low overall centre of gravity. Some of the pallets were double stacked; side and end strapping was used. The video shows a gentle swaying motion. Figure 8 shows some indication of a 0.5Hz lateral sway, and the video showed gentle swaying motion of the load and flexing of the straps. There appeared to be good integrity between load and trailer bed, which suggest that the side strapping is adequate for the purpose.
5.1.6 Small pallets unstrapped, cross-strapped at rear
This was a light load consisting of a layer of pallets with approximately cubic loads of card product 1.3m high; it had the lowest centre of gravity of all the trials. No side strapping was used. Figure 8 shows no significant low frequency lateral oscillation except above 3Hz, and it is difficult to detect any movement at all in the video images. This load appeared to be very stable in the trial conditions, so we have no evidence to suggest that this load would be any safer if side strapped.
5.1.7 Tall reels (2.5m high)
This is a heavy load of twelve 2.5m high cylindrical paper reels placed on end (see figure 5 for a photograph of the configuration), with a high centre of gravity of trailer plus load. This run was over a different route to the other trials, being a 3hr journey from Soham to Louth. Two video cameras were used: one fixed inside the trailer as in the other runs, and the other in a car following the lorry; in a later part of the journey this second camera was placed in the lorry cab to give a driver’s eye view of the road ahead. The interior images showed little oscillation of the load inside trailer (figure 5 showed a frame from this movie). The second camera when following the lorry showed an interesting incident when the lorry went over a bump in the road (figure 15) which we discuss later. Accelerometers were used on top of the 4th reel from the rear and at the bottom of this reel on the trailer bed, in similar positions as in the other trials, but additional accelerometers were used half way up this same reel, in the middle of the load and on top of the 5th reel from the front. The largest lateral accelerations were recorded for this trial, so we devote the next subsection to a deeper analysis of the results for this trial.
Figure 15 Lorry sway while driving over a bump: frame times at (from left) 2207s, 2207.5s and 2208s (see also figure 16)
26

Figure 16 Lorry driving over bump. Upper plot: lateral acceleration (solid line at lorry base, dashed line at top of load). Lower plot: vertical acceleration. The time scale is zeroized at the Soham depot and is the same as in figure 15.
5.2 FURTHER DISCUSSION OF THE TALL REEL TRIAL
5.2.1 Two incidents: driving over a bump, and on a steep hill
We begin with the interesting incident shown in figure 15, where the lorry drove over a bump in the road caused by a small bridge. The lorry is seen to tilt right then left before righting itself in the third clip of figure 15. From the figure we estimate the total sway to be about 3½o. The corresponding accelerometer readings are shown in figure 16, where the lateral acceleration shows a dip and peak at the left and right lean respectively: the top of load accelerations being larger than at the base. We also show the vertical acceleration showing a peak up and dip down. The lateral a/g reaches 0.2 at the top of load: compare this with the calculated SSF of 0.56, and we see that this is nowhere near dangerous; however a ramp of this type would add a significant risk while cornering. The good news on figure 16 is that the ramp represented a forced oscillation of about 1Hz, and yet was quickly damped: the signal quickly reverted to fairly low level oscillations.
We now look at another incident in this trial. Near to the destination at Louth, the road traverses the edge of the Lincolnshire Wolds and we encountered a short but steep upward gradient of about 1:10. Because the lorry was initially in too high a gear, it came to a stop on the hill, and starting up and ascending from there was somewhat jerky. Although no lateral motion was involved (the road was straight), it nevertheless enabled us to examine some large longitudinal motions. Figure 27 shows the x,y,z accelerations at top of load: the x and z signals are featureless as expected, but the longitudinal y direction shows a 0.1g acceleration as the lorry powers up the hill, punctuated by dips at the points when the lorry stops. The 0.25g peak in acceleration here is
27

one of the largest longitudinal acceleration seen in the trials. However it did not appear to lead to any significant sway which might lead to shedding load at the rear, and the strapping systems seemed adequate.
5.2.2 Oscillations of the tall reel load
Figure 8 indicated a ‘natural’ lateral oscillation of this load of 0.5-1Hz. We showed in figure 10 that there was a delay of about 0.02s in transmitting oscillations from the trailer bed to the top of the load, and that this is the only load that showed evidence of a delay. We further showed in figure 13 some evidence for bottom-to-top amplification of the oscillation spectrum at low frequencies. We can also look for front/rear differences, as we had accelerometers positioned to do this for this load. Figure 18 shows a comparison of the lateral accelerations at front and rear of the trailer which shows a similar high frequency spectrum, but a delay or phase difference in low frequency features; this is summarised in figure 19 where we show as a histogram the number of peaks experiencing a given delay: this shows that many of the lateral acceleration peaks get delayed by around 0.04s from front to back. A further point we should make is that two of the reels had moved slightly during the journey: figure 20 shows the chalk marks drawn on the reel and trailer bed and this reel had shifted by about 1cm.
All the evidence given above indicates that the tall reel load did not form a completely rigid body with the trailer, and did have some independent motion. Careful driving ensured that these motions did not get out of hand, and we regard the strapping as essential and adequate for this load. High centre of gravity loads like this one are inherently unstable against rollover, but it should be pointed out that at all times in the trial, the lateral acceleration was less than 2/3 of that required to constitute a rollover risk (as shown in figure 14).
5.2.3 A suggested maximum speed when taking bends with high centre of gravity loads
The 2/3 margin of error referred to above is essential for safety when cornering, in view of the effect of unexpected incidents like the bump discussed in subsection 5.2.1 which could augment the lateral acceleration when cornering. There are of course other ways in which the lateral acceleration could be augmented as we discussed in section 2.3 and table 3, and a given accident might be a combination of several factors. The bump in figure 16 gave a lateral acceleration of 0.2g, and subsection 2.3 gives details of other risk factors which may be involved (eg. sidewind, off-centred load, etc.).
This suggests that allowance must be made in excess of 0.2g when assessing the total risk from an accumulation of factors in a rollover accident. Based on the actual accelerations we measured in our trials (which clearly did not involve an actual rollover) it is reasonable in view of the above to subtract 0.25g from the SSF to give a maximum rollover-safe lateral acceleration for a vehicle. For a high centre of gravity load with an SSF=0.5: if we subtract 0.25 and translate into a speed when taking a bend or roundabout with steering curve of, say, 20m radius of curvature, we arrive at a rollover-safe maximum speed of 25 km/hr.
28
Figure 17 Ascending a steep straight hill with the tall reels load. Notice the spiky longitudinal acceleration a(y) which shows the jerky stops and accelerations up the hill.
Figure 18 Top-of-load lateral acceleration measured at front (dashed line) and rear (solid line) of the tall reel load. Left plot: raw data; right: low frequency signal after averaging over 0.64s.
29

Figure 19 Proportion of the low frequency top-of-load lateral acceleration peaks, whose time differences between the front and rear measurements fall within the given time delay bands.
Figure 20 Photograph taken at the end of the tall reels journey showing the reel and trailer bed chalk marks which were aligned at the start but now shifted by about 1cm.
30

6. CONCLUSION
Our aim was to review the HGV rollover risk in the light of current regulations and best practice, by theoretical and practical analysis of the real-life operations of a haulage company specialising in paper reels and products. The emphasis in our work is to examine real-life loads in transport. This differs from and augments the traditional approach of establishing general criteria based on repeatable experiments, which is only really possible using dedicated test tracks where the lorry geometry, load, speed, bends etc can be unambiguously measured.
In the theoretical sections we discussed the static stability factor (SSF) as a quantity which can easily be calculated in a depot given the lorry and load weights and dimensions. The SSF is a rigid body model that gives the critical lateral acceleration for rollover: a high centre of gravity yields a low SSF, which can be used to gauge the rollover risk. We quantify further factors such as camber and lean, asymmetric load and high cross wind pressure, which can lower the stability still further, and recommend that 0.25g be subtracted from the SSF to allow for these factors when quantifying the rollover risk while cornering.
In the experimental part of this project, we found that an experienced driver takes bends and roundabouts with speeds well below the rollover risk limit for a particular load. But we feel that it would be helpful if this 'driving to the load' experience were quantified with a parameter such as the SSF, perhaps cast in the form of a suggested maximum speed for sharp bends and roundabouts. This could be as low as 25 km/hr for the highest centre of gravity loads.
Our measurements included continuous three-dimensional accelerometer readings from the top and bottom of loads. We identified natural oscillations laterally in the highest centre of gravity loads of 0.5-1 Hz, but we can find no evidence to suggest that rollover might be induced by resonant reinforcement by external factors such as road oscillations at this frequency.
In one of the trial loads (2.5m tall reels stacked vertically) we detected a time delay between the high frequency lateral acceleration peaks measured at the top and bottom of the load, and between the low frequency peaks measured at the front and rear: the use of straps according to existing recommendations is essential to dissipate the swaying energy of such motions. We found no such delay in the vertical oscillations, indicating that the loads we trialled act approximated a single mass with the trailer, with no evidence of dangerous load shift or ‘walking’. Video camera evidence of significant internal swaying of tall palleted loads indicates the importance to us of secure strapping. There is no evidence that the curtains were, or should be, taking any load.
Although not part of the current investigation, we note that alternative methods of transport, such as using low loaders, or stacking heavy cylindrical objects such as paper reels horizontally rather than vertically, would significantly reduce the centre of gravity of the loaded vehicle. However, there may be other safety issues involved in such a strategy which would need further analysis.
We also note research being carried out active control mechanisms consisting of active anti-roll bars to improve the roll stability of HGVs[10]: the strategy is to identify a mechanism for reducing lateral load transfer by rolling the vehicle body into corners, with feedback control using various dynamical input; simulations of such active roll control show promising increases in the rollover threshold for articulated vehicles of around 30%[10]. This may lead to new developments in the future design of safer lorries, though this is outside the scope of our report.
31

In using the calculable SSF of the trailer plus load as an indicator of rollover risk, we are acknowledging the separation of driver and load inherent in an articulated vehicle. Knowledge of the SSF is useful but could be made more so if the driver in the cab were aware of actual lateral accelerations down the trailer. A possibility here is to install sensors to inform the driver of lateral acceleration and/or proximity of rollover. For example instruments could be installed in the suspension on both sides of the trailer to measure the downward force of the load on the wheels. When this becomes less than a certain percentage of the static force, say 25%, on one side or the other, then a red light could come on in the cab to warn the driver to slow down or straighten up. An alternative to the red light could be an audible warning. Some research would be needed to decide on the most effective signal and to refine the 25% threshold value. The aim would be to give a warning that the wheels on one side were in danger of lifting, this warning coming soon enough to allow corrective action without initiating a jack-knife or other catastrophic event. The exact design of sensor would depend on the type of suspension used on the lorry. It could measure either air pressure or the physical position of the load relative to the wheels. Although this has not been part of our current research brief, we suggest that such instruments would be helpful with training, general monitoring of good driving, as well as precrisis warning.
32

7. RECOMMENDATIONS
We strongly advocate the use of the static stability factor (SSF) as a quantity which can easily be calculated in a depot given the lorry and load weights and dimensions: it is half the track width divided by the centre of gravity height of trailer plus load from the road. The SSF is a rigid body model that gives the critical lateral acceleration for rollover: a high centre of gravity implies a low SSF, which can approach 0.5 for high loads, and which gives a high rollover risk. Other factors can be related to the SSF, such as camber and lean, asymmetric load and high cross wind pressure, which can lower the stability still further, and we recommend that 0.25g be subtracted from the SSF to allow for these factors when quantifying the rollover risk while cornering.
In the experimental part of this project, we found that an experienced driver takes bends and roundabouts with speeds well below the rollover risk limit for a particular load. But we feel that it would be helpful if this 'driving to the load' experience were quantified with a parameter such as the SSF, perhaps cast in the form of a suggested maximum speed for sharp bends and roundabouts. This could be as low as 25 km/hr for the highest centre of gravity loads (with an SSF approaching 0.5), and the risk increases with the sharpness of the turning circle.
In one of the trial loads (2.5m tall reels stacked vertically) we detected a time delay between the high frequency lateral acceleration peaks measured at the top and bottom of the load, and between the low frequency peaks measures at the front and rear: the use of straps according to existing recommendations is essential to dissipate the swaying energy of such motions. Video camera evidence of significant internal swaying of tall palleted loads indicates the importance to us of secure strapping there, which we recommend.
In view of the industry requirement to transport vertically stacked reels taller than hitherto, we recommend that statistics on rollover be monitored to give future guidance. We also note that the high centre of gravity of some loads could be reduced with low loaders or horizontal stacking of reels, but we make no recommendations on this as other safety issues may arise. For the future, we suggest the possibility of using remote sensors in the trailer to give the driver some informative feedback, though we have not evaluated this, and the possibility of using active control mechanisms when this technology matures.
In summary, we found little evidence to support any major change in existing best-practice, except for the highest centre-of-gravity loads where we there is an inherent rollover risk which we feel could be eliminated by good driving and maximum speed recommendations on sharp bends and roundabouts as described above.
33

34

REFERENCES
1. Safe transport of reels of corrugating case materials by road The Paper Federation of Great Britain 2001
2. Code of practice safety of loads on vehicles consultation paper Department of Environment Transport and the Regions 15 November 2000
3. Recommended safe practices for the loading and unloading of vehicles and storage of reels. British Fibreboard Packaging Association, April 1997
4. Paper and print industry transport guidance Health and Safety Executive 5. An investigation into the roll stability of articulated vehicles carrying rolls of paper
MIRA 99 244817/B 6. Thomas S, Discussion document, WRM Logistics, January 2001 7. An Assessment of the National Highway Traffic Safety Administration's Rating System for
Rollover Resistance (Committee for the study of a motor vehicle rollover rating system, Transport Research Board, National Research Council) National Academy Press, Washington DC (ISBN 0-309-07249-2) 2002
8. Jones E R and Childers R L Contemporary College Physics Addison-Wesley 1993 9. Sadler A J and Thorning D W S Understanding mechanics OUP (ISBN 0-19-914097-9)
1983 10. Sampson D J M Active roll control of articulated heavy vehicles Technical report
CUED/C-Mech/TR 82, January 2002 11. Symon K R Mechanics Addison-Wesley 1960 12. Winkler C Rollover of heavy commercial vehicles UMTRI Research Review Vol 31 No 4
University of Michigan Transportation Research Institute 2000
35

Printed and published by the Health and Safety ExecutiveC30 1/98
Printed and published by the Health and Safety Executive C1.25 04/03

ISBN 0-7176-2182-0
CRR 098
780717621828£10.00 9


![[Shinobi] Claymore 098](https://static.fdocuments.in/doc/165x107/568c34651a28ab02359048db/shinobi-claymore-098.jpg)


![7124 0/098 a. S.A.] 20-4 0-0Sipsrn8 RESEARCH SN: 52646 ... · 7124 0/098 a. S.A.] 20-4 0-0Sipsrn8 RESEARCH SN: 52646 WILCOXON SERIES intelligent transmitter series u 02.3.]' +1 301](https://static.fdocuments.in/doc/165x107/5fc3ebb7315c0312860998b6/7124-0098-a-sa-20-4-0-0sipsrn8-research-sn-52646-7124-0098-a-sa-20-4.jpg)
