Research Paper FORCED DEGRADATION STUDIES...
14
Transcript of Research Paper FORCED DEGRADATION STUDIES...


196
This article can be downloaded from http://www.ijlbpr.com/currentissue.php
Int. J. LifeSc. Bt & Pharm. Res. 2014 Divya Saxena et al., 2014
FORCED DEGRADATION STUDIES OF
AMLODIPINE BESYLATE AND
CHARACTERIZATION OF ITS MAJOR
DEGRADATION PRODUCTS BY LC-MS/MS
Divya Saxena1*, Shailesh Damale2, Amit Joshi2 and Ajit Datar1
Research Paper
The proposed study describes an isocratic reversed phase HPLC method for investigation ofdegradation products of Amlodipine Besylate API under different stress conditions (acid hydrolysis,base hydrolysis, oxidation and thermal degradation). Separation of Amlodipine and its degradationproducts was achieved on a phenomenex C18 column. Amlodipine was found to degrade themost under base hydrolysis (about 99%) followed by acid hydrolysis (about 87%) then in oxidation(about 12%) and negligible in thermal degradation (about 0.2%). Structures of the degradationproducts were studied using a Triple Quadrapole Mass Spectrometer. A separate gradient LC-MS method was developed for this purpose. Analysis was done using Shim-pack XR ODScolumn. Depending on the degradation type, possible chemical reactions were predicted andsupported by fragmentation data obtained from LC-MS. One major degradation product fromeach of the stress conditions was isolated using preparative LC technique. These degradationproducts were obtained in solid form using Rotavap and lyophilizer and were then analyzed byNMR and IR spectroscopy to confirm their structural details.
Keywords: Amlodipine Besylate, Forced degradation studies, Degradation products, LC, LC-MS
*Corresponding Author: Divya Saxena � [email protected]
ISSN 2250-3137 www.ijlbpr.com
Vol. 3, No. 3, July 2014
© 2014 IJLBPR. All Rights Reserved
Int. J. LifeSc. Bt & Pharm. Res. 2014
1 Guru Nanak Institute of Research and Development, Guru Nanak Khalsa College, Opp. Don Bosco School, Nathalal Parekh Marg, Matunga-
east, Mumbai - 400 019, Maharashtra, India.
2 Shimadzu Analytical India Pvt. Ltd.,Rushabh Chambers,Makwana Road, Marol, Andheri east, Mumbai -400059, Maharashtra, India
INTRODUCTION
Amlodipine (AMD), (RS)-3-ethyl 5-methyl 2-[(2-
aminoethoxy) methyl]-4-(2-chlorophenyl)-6-
methyl-1, 4-dihydropyridine-3, 5-dicarboxylate, is
a long-acting calcium channel blocker of the
dihydropyridine class that inhibits the movement
of calcium ions into vascular smooth muscle cells
and cardiac muscle cells. It’s a peripheral arterial
vasodilator that acts directly on vascular smooth
muscle to cause a reaction in peripheral vascular
resistance and reduction in blood pressure. It is
widely used as an antihypertensive agent and in
the treatment of angina pectoris. It’s a chiral drug
available both as a racemate as well as in a pure

197
This article can be downloaded from http://www.ijlbpr.com/currentissue.php
Int. J. LifeSc. Bt & Pharm. Res. 2014 Divya Saxena et al., 2014
enantiomeric form. Similar to most other calcium
blocking agents of the dihydropyridine class, a
racemic mixture of AMD is mostly used for
therapeutical purposes. However, it has been
reported that the vasodilatation effect of AMD is
largely attributed to its S- enantiomer (Damale et
al., 2013; Kumar et al., 2012; Patil et al., 2010;
Vasanth et al., 2013; Yoo et al., 2011).
Forced degradation is a process whereby the
natural degradation rate of a drug product or drug
substance is accelerated by the application of an
additional stress. Forced Degradation Studies
(FDS) or stress testing form a very important part
of the drug development strategy in
pharmaceutical industries under the guidelines
(entitled ‘Stability Testing of New Drug Substances
and Products’, Q1A) of International Conference
on Harmonization (ICH) and is carried out under
more severe conditions than accelerated
conditions (ICH guidelines, 2003). These studies
serve to give information on a drug’s inherent
stability and assist in the validation of analytical
methods to be used in stability studies. It also
helps in determining the degradation products and
in estimating the tentative degradation pathway
of the drug. Identification and qualification of these
Degradation Products (DPs) is quite essential
since it can cause undesirable side effects in
patients, at times these side effects could also
be fatal. FDS is also very effective for optimizing
the formulation, packaging and storage conditions
of the drug product and hence even though ICH
and FDA ask to include this study at Phase III of
the clinical trial, it is recommended to start it as
early as possible (Damale et al., 2013; Aneesh
and Rajasekaran, 2012; Abela et al., 2010;
Murakami et al., 2008; Singh et al., 2000; Patel et
al., 2011).
For the proposed study, Amlodipine Besylate
(Figure 1) API was subjected to degradation under
different stress conditions like acid hydrolysis,
base hydrolysis, oxidation and thermal
degradation. Generally, a drug molecule is
subjected to a maximum of 5-20% degradation
which is enough to get the relevant information
regarding its degradation pathway and likely
degradation products (Ngwa, 2010; Brummer,
2011). However, more harsh conditions were
used in the present study to achieve complete or
near to complete degradation of the drug
substance so as to study the degradation
products formed after maximum degradation.
Thus, the main purpose of this study was to
identify and characterize the DPs formed after
complete or maximum degradation of AMD, under
different stress conditions using LC-MS/MS
technique.
An isocratic LC method was developed for
separation of Amlodipine Besylate and its
degradation products. Simultaneously, a LC-MS/
MS method was also developed to study the
structural details of the DPs. The isocratic LC
Figure 1: Amlodipine Besylate

198
This article can be downloaded from http://www.ijlbpr.com/currentissue.php
Int. J. LifeSc. Bt & Pharm. Res. 2014 Divya Saxena et al., 2014
method was also used on preparative LC in order
to isolate the major degradation products. The
fractions of DPs collected from preparative LC
were processed through rotavap to evaporate the
aqueous phase followed by lyophilization in order
to obtain the DPs in solid form. NMR and IR
spectra of these DPs were then obtained as a
supporting data to MS results.
MATERIALS AND METHODS
Chemicals and Reagents
Amlodipine Besylate API was procured from
Hetero Chemical Lab, Hyderabad, India with a
purity of 99.4%w/w. HPLC grade- Methanol, water,
glacial acetic acid; analytical grade-ammonium
acetate (NH3COOH), Hydrochloric acid (HCl),
Sodium Hydroxide (CH3COONH4), Hydrogen
Peroxide (H2O
2) - 30% v/v, Liquor ammonia
solution (NH3) -25% and LC-MS grade-
ammonium acetate were purchased from Merck.
Sample Preparation
Alkali Degradation
One gram of Amlodipine Besylate API was
weighed and dissolved in 2.0 mL of Methanol, to
this 1.0 mL of 5M NaOH was added. The solution
was kept in water bath at 80°C for 3 h; it was
then cooled at room temperature and neutralized
with 5 M HCl (stock solution).
From the above stock solution, 0.1 mL was
taken in a 25 mL volumetric flask and volume was
made up with methanol. This was analyzed on
HPLC and MS.
The stock solution was analyzed on
Preparative LC.
Acid Degradation
One gram of Amlodipine Besylate API was
weighed and dissolved in 2.0 mL of Methanol, to
this 1.0 mL of 5 M HCl was added. The solution
was kept in water bath at 80°C for 6 h; it was
then cooled at room temperature and neutralized
with 5 M NaOH (stock solution).
From the above stock solution, 0.1 mL was
taken in a 25 mL volumetric flask and volume was
made up with methanol. This was analyzed on
HPLC and MS.
The stock solution was analyzed on
Preparative LC.
Oxidative Degradation
One gram of Amlodipine Besylate API was
weighed and dissolved in 2.0 mL of Methanol, to
this 8.0 mL of 30% H2O2 (v/v) was added. The
solution was kept in water bath at 80°C for 6 h
(stock solution).
From the above stock solution, 0.1 mL was
taken in a 25 mL volumetric flask and volume was
made up with methanol. This was analyzed on
HPLC and MS.
The stock solution was analyzed on
Preparative LC.
Thermal Degradation
About 1.5 g of Amlodipine Besylate API was kept
in controlled oven at 80°C for 48 h. From this 1.0
g of the API was weighed and dissolved in 3.0 mL
of methanol (stock solution).
From the above stock solution, 0.1 mL was
taken in a 25 mL volumetric flask and volume was
made up with methanol. This was analyzed on
HPLC and MS.
The stock solution was analyzed on
Preparative LC.
LC Analysis
HPLC system (Shimadzu Prominence Binary
199
This article can be downloaded from http://www.ijlbpr.com/currentissue.php
Int. J. LifeSc. Bt & Pharm. Res. 2014 Divya Saxena et al., 2014
Gradient System, Shimadzu Corporation, Japan)
equipped with binary pump (20 AP), degasser,
an autosampler (SIL-20AC), a temperature
controlled column compartment and Photodiode
array detector (SPD – 20A) was used.
Chromatographic data was acquired using
LabSolutions software. Analysis was done using
Phenomenex C18 column (250 mm x 4.6 mm, 5
µ). The mobile phase comprised of 30 mM
ammonium acetate buffer: Methanol (1:1, v/v). The
flow rate was maintained at 1.0 mL/min, injection
volume was 20 µL and the column temperature
was maintained at 30°C. Run time for the analysis
was kept 70 min. The chromatograms were
monitored at 238 nm.
LC/MS/MS Analysis
HPLC system (Shimadzu Prominence Binary
Gradient System, Shimadzu Corporation, Japan)
equipped with binary pump (LC – 30AD),
autosampler (SIL – 30ACMP), column
compartment (CTO – 30A), Photodiode array
detector (SPD –M20A). Chromatographic data
was acquired using LabSolutions software.
Analysis was done using Shim-pack XR ODS
column (75 mm x 3 mm, 2.2 µ). The mobile phase
comprised of (A) 10 mM ammonium acetate
buffer with 0.4% ammonia solution, pH adjusted
to 7.0 with glacial acetic acid: (B) Acetonitrile in a
gradient mode. The gradient program is given
Table 1. The flow rate was maintained at 0.5 mL/
min, injection volume was 5 µL and the column
temperature was maintained at 40°C. Run time
for the analysis was kept 8 min. The
chromatograms were monitored at 238 nm.
The structure elucidation of degradation
products was done using triple quadrupole mass
spectrometer LCMS-8080 equipped with
Electrospray Ionization (ESI) source, operated in
positive mode. Nitrogen gas was used at flow
rates of 2 L/min for nebulization, 15 L/min for
heating and as a curtain gas at 2.4 L/min. Argon
was used as a collision gas. The probe and Hot
Source Induced Desolvation (HSID) temperature
was maintained at 150°C. The collision energy
was optimized and set to -35.0 V. Mass spectra
were acquired over m/z range of 100 – 370.0.
Event time was of 0.03 s.
Preparative LC Analysis
HPLC system (Shimadzu Prominence Binary
Gradient System, Shimadzu Corporation, Japan)
equipped with binary pump (20 AP), degasser,
injector (SIL -10AP), Fraction Collector (FRC 10A)
and Photodiode array detector (SPD – 20A) was
used. Chromatographic data was acquired using
LabSolutions software. Analysis was done using
Phenomenex C18 column (250 mm x 21 mm, 5
µ). The mobile phase comprised of 30 mM
ammonium acetate buffer: Methanol (1:1, v/v). The
flow rate was maintained at 7.0 mL/min, injection
volume was 1.0 mL and column was maintained
at room temperature (around 25°C). The
chromatograms were monitored at 238 nm.
NMR Analysis
The NMR experiment was performed on a Bruker
instrument working at 400 MHz for 1H. CDCl3 was
used as a solvent.
IR Analysis
IR analysis was performed on Shimadzu’s FTIR,
‘IRAffinity-1’ instrument with diamond ATR
accessory.
RESULTS
Amlodipine Besylate was found to degrade to
different extent under various stress conditions.
The percentage of degradation obtained under

200
This article can be downloaded from http://www.ijlbpr.com/currentissue.php
Int. J. LifeSc. Bt & Pharm. Res. 2014 Divya Saxena et al., 2014
each of the stress conditions is depicted in Table
2 and the respective chromatograms are shown
in Figure 2. The degradation products were
subjected to LC-MS/MS study to elucidate their
structural details. The molecular scan is provided
in Figure 3 and their fragment ions obtained are
shown in Table 3. The tentative degradation
pathway is also predicted based on the LC-MS/
MS data. This is given in Figure 4. IR and NMR
analysis of the major degradation products were
performed, results of these analyses are provided
in Table 4 and 5, respectively.
DISCUSSION
The objective of this study was to investigate the
degradation products of AMD under different
stress conditions. For this purpose, AMD was
subjected to base hydrolysis; acid hydrolysis,
oxidation and thermal degradation at conditions
mentioned in Table 2. AMD was found to degrade
about 99% under basic conditions; it degraded
up to 87% under acidic conditions, about 12%
under oxidative conditions while it was found to
be almost stable under thermal stress conditions
(degraded only 0.2%). Amlodipine Besylate and
its degradation products were separated using
an isocratic LC method. There was one major
Table 1: Gradient LC program
Time A (%) B (%)
0.01 80 20
1.00 80 20
4.00 20 80
5.00 20 80
5.50 80 20
8.00 80 20
Table 2: Percentage of degradation observed in each of the stress conditions
No Degradation Type Degradation Condition Amount degraded
1. Base Hydrolysis 5M NaOH, 800C for 3hrs About 99%
2. Acid hydrolysis 5M HCl, 800C for 6hrs About 87%
3 Oxidation 30% H2O
2, 800C for 6 hrs About 12%
4. Thermal 800C for 48 hrs About 0.2%
Table 3: Product Ions and their respective fragment ions obtained from LC- MS/MS study
Stress Condition Precursor /Molecular Ion (m/z) Product ions obtained (m/z) Fragment Ions obtained (m/z)
Base 409 395 180, 366
349 167, 248
381 337, 223
351 180, 150
Acid 409 407 167, 230
351 180, 150
Oxidation 409 407 167, 230
201
This article can be downloaded from http://www.ijlbpr.com/currentissue.php
Int. J. LifeSc. Bt & Pharm. Res. 2014 Divya Saxena et al., 2014
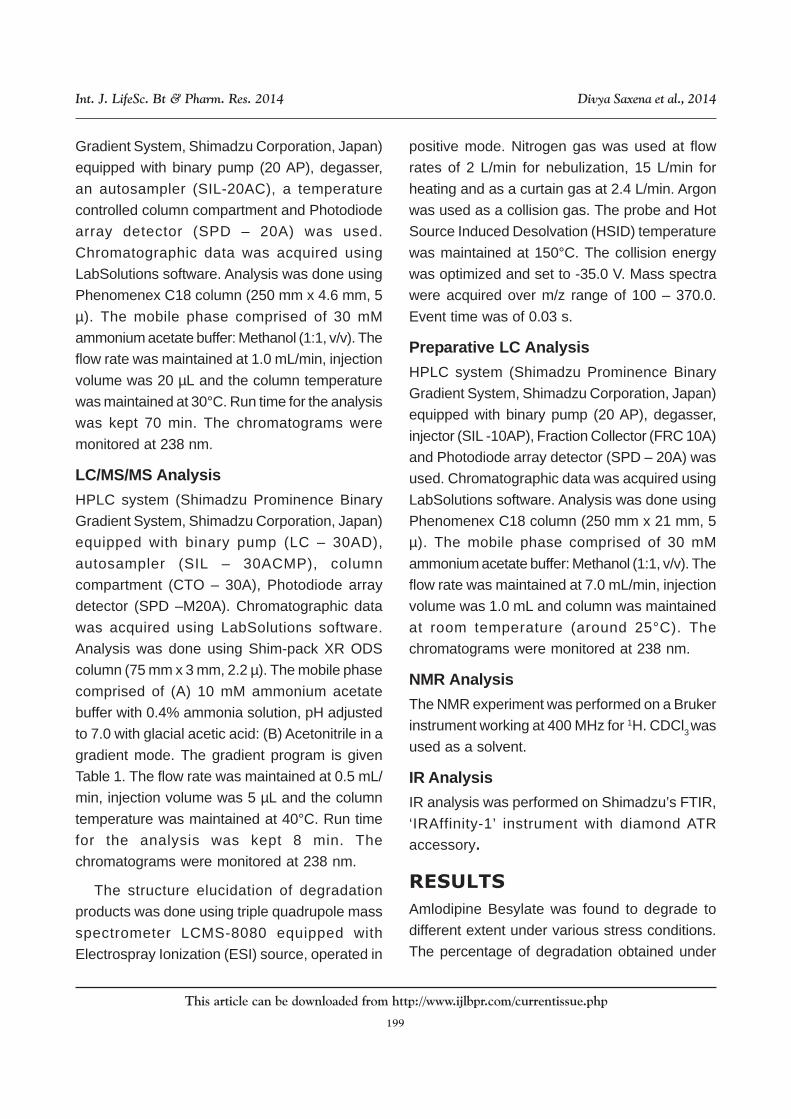
degradation product obtained under base
hydrolysis at retention time of 4.1 min, two major
degradation products under acid hydrolysis at 9.4
min and 15.8 min, one major degradation product
under oxidative hydrolysis at 16.3 min while there
were no major degradation products obtained
under thermal degradation. The retention time of
AMD in this method was found to be around 41.0
min (Figure 2). One major degradation product
from each of the stress condition was isolated
using preparative LC technique; the same
isocratic LC method was employed as mentioned
above. Fractions of these major degradation
products were evaporated using rotavap and
lyophilization techniques to obtain the degradation
products in solid form. NMR and IR analysis of
these degradation products were performed. IR
and NMR interpretations are given in Table 4 and
Table 5, respectively.
A separate gradient LC method (Table 1) was
developed for analyzing the degradation products
on LC-MS/MS. This method was quite fast in
comparison to the isocratic LC method which
Figure 2: Chromatograms of Forced Degradation Study of AMD (a) API (b) Base Degradation(c) Acid Degradation (d) Oxidation Degradation (e) Thermal Degradation
202
This article can be downloaded from http://www.ijlbpr.com/currentissue.php
Int. J. LifeSc. Bt & Pharm. Res. 2014 Divya Saxena et al., 2014
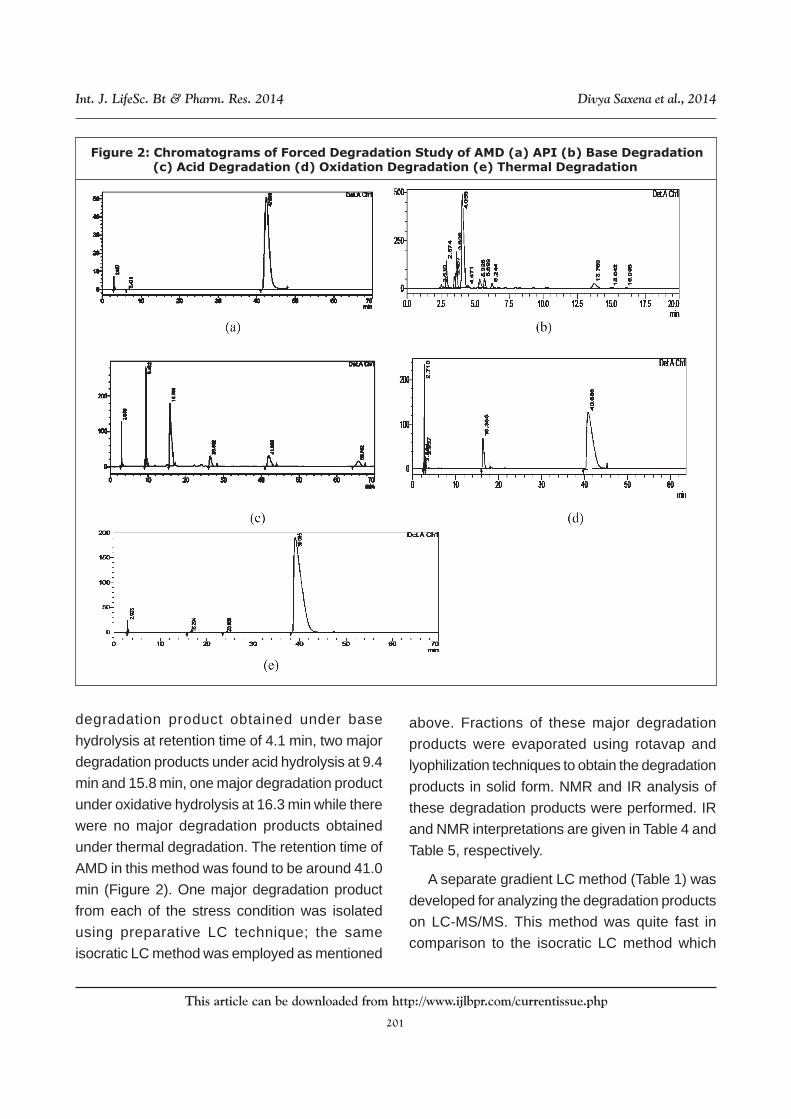
Figure 3: Molecular Ion spectra (Q3 Scan) of degradation products of AMD obtained underdifferent stress conditions (a) Base degradation (m/z-395,349,381 and 351) (b) Acid
degradation (m/z- 351 and 407) (c) Oxidation degradation (m/z – 407)

203
This article can be downloaded from http://www.ijlbpr.com/currentissue.php
Int. J. LifeSc. Bt & Pharm. Res. 2014 Divya Saxena et al., 2014
Table 4: IR interpretations of the major degradation productsof AMD obtained under different stress conditions
S. No. Wavenumber Functional Group
(A) Base degradation product (m/z – 351)
1) 2916.37 and 2848.86 -CH
2) 2212.35 -CN or -CC
3) 1660.71 -CO
4) 1573.91 -NH
5) 1126.43 -COC (ether)
6) 727.16 -CCl
(B) Acid degradation product (m/z – 407)
1) 2949.16 and 2926.01 -CH
2) 1726.29 -CO
3) 1556.55 -NH
4) 1228.66 -CO (ester)
5) 1105.21 and 1035.77 -COC (ether)
6) 729.09 -CCl
(C) Oxidation degradation product (m/z – 407)
1) 2981.95 and 2953.02 -CH
2) 1726.29 -CO
3) 1556.55 -NH
4) 1230.58 -CO (ester)
5) 1105.21 and 1037.70 -COC (ether)
6) 727.16 -CCl
was employed for separation of AMD and its
degradation products. The molecular weight of
AMD is 408 and that of the protonated ion in the
positive ion mode is 409. The degradation
products obtained under base degradation had
m/z ratio of 395, 349, 381 and 351, under acid
degradation – 407 and 351 and under oxidation -
407. The degradation product with m/z of 407 was
common in oxidation and acid degradation, which
is reported as Impurity D (Imp D) in European
Pharmacopeia. These degradation products were
further subjected to molecular ion scan at
different collision energies. Best fragmentation
was obtained at collision energy of -35.0 V.
Product ions of AMD and their respective
fragment ions obtained are depicted in Table 3
and Figure 3. Fragment ion with m/z of 167 was
common in all the degradation products while

204
This article can be downloaded from http://www.ijlbpr.com/currentissue.php
Int. J. LifeSc. Bt & Pharm. Res. 2014 Divya Saxena et al., 2014
Figure 4: Tentative degradation pathway of AMD under different stress conditions, based on thefragmentation pattern obtained by MS/MS data (a) Base (b) acid (c) oxidation
(b) (c)
(a)

205
This article can be downloaded from http://www.ijlbpr.com/currentissue.php
Int. J. LifeSc. Bt & Pharm. Res. 2014 Divya Saxena et al., 2014
Table 5: NMR interpretations of the major degradation productsof AMD obtained under different stress conditions
(A) Base degradation product (m/z- 351) Protons position is depicted below
Proton ID Chemical shift No. protons
1 6.94 1
2 7.18 1
3 7.17 1
4 7.352 1
5 4.23 2
6 1.83 3
7 2.049 3
8 5.4 1
9 2.05 3
10 3.63 3
11 4.6 1
(B) Acid and Oxidation degradation product (m/z- 407) Protons position is depicted below
1 7.33 1
2 7.28 1
3 7.12 1
4 7.30 1
5 4.01 2
6 0.91 3
7 3.54 2
8 3.70 2
9 3.10 2
10 4.80 2
11 3.54 3
12 2.60 3
fragment ion with m/z 230 was found in oxidation
and acid hydrolysis; fragment ion with m/z 180
was found in base and acid hydrolysis. Structural
elucidation of the degradation products and the
tentative degradation pathway of AMD were also
predicted based on the product ions formed and
their respective fragmentation pattern (Figure 4).
The major functional groups of the degradation
206
This article can be downloaded from http://www.ijlbpr.com/currentissue.php
Int. J. LifeSc. Bt & Pharm. Res. 2014 Divya Saxena et al., 2014
products were also indicated in IR and NMR
analysis. Data obtained from these analyses
supported the structural elucidation done based
on the MS data (Table 4 and 5).
CONCLUSION
An isocratic LC method was optimized for the
separation of AMD and its degradation products.
Amlodipine Besylate API was subjected to
different stress conditions. It was found to degrade
the most under basic conditions and least under
thermal degradation.
A fast LC-MS/MS method was developed to
identify and characterize the degradation products
formed under different stress condition. One
major degradation product from each of the
stress conditions was isolated using preparative
LC technique.
Structure elucidation of the major degradation
products was done using LC-MS/MS data and it
was supported by NMR and IR results. A tentative
degradation pathway of AMD was also predicted
under different chemical stress conditions.
ACKNOWLEDGMENT
The authors are grateful to Shimadzu Analytical India
Pvt. Ltd (Mumbai) for letting the LC-MS/MS, IR and
preparative LC work be carried out at their lab.
The authors are thankful to the Director of Guru
Nanak Institute of Research and Development,
Guru Nanak Khalsa College, Mumbai, India for
providing all the research related facilities,
required to accomplish the present research
work.
We are also grateful to Department of Science
and Technology (DST), India for providing the
INSPIRE fellowship.
REFERENCES
1. Abela D et al. (2010), “A chromatographic
Determination of the Stability of Solutions of
Amlodipine Benazepril and Amlodipine
Besilate”, Presented at the Seventh World
Meeting on Pharmaceutics,
Biopharmaceutics and
Pharmaharmaceutical Technology, Malta.
2. Aneesh T P and Rajasekaran A (2012),
“Forced Degradation Studies – A Tool for
Determination of Stability in Pharmaceutical
Dosage Forms”, Internl. J. Biol. Pharmacl.
Res., Vol. 3, No. 5, pp. 699-702.
3. Brummer H (2011), “How to Approach a
Forced degradation Study”, Life Science –
Technical Bulletin.
4. Damale S et al (2013), Poster on
“Characterization of products formed by
forced degradation of Amlodipine Besylate
using LC-MS/MS”, Presented at ACMS.
5. European Pharmacopeia (2008),
Monograph 1491, Edition 8th.
6. ICH guidelines (Q1A9R2) – Stability Testing
of New Drug Substances and Products (rev
2), Nov 2003.
7. Kumar G V S et al (2012), “Development
and Validation of Stability Indicating RP-
HPLC Method for Simultaneous Estimation
of Amlodipine and Losartan in Bulk Drug and
Tablet Dosage Formulation”, Internl. Res.
J. Pharmacy., Vol. 3, No. 11, pp. 92-95.
8. Murakami T et al (2008), “Application of liquid
chromatography-two-dimensional nuclear
magnetic resonance spectroscopy using
pre-concentration column trapping and
liquid chromatography-mass spectrometry
207
This article can be downloaded from http://www.ijlbpr.com/currentissue.php
Int. J. LifeSc. Bt & Pharm. Res. 2014 Divya Saxena et al., 2014
for the identification of degradation products
in stressed commercial amlodipine maleate
tablets”, J. chromatogr. A., Vol. 118, pp. 67-
76.
9. Ngwa G (2010), “Forced Degradation as an
Integral part of HPLC Stability-Indicating
method Development”, Drug Delivery
Technology, Vol. 10, No. 5.
10. Patel R M et al (2011), “Stability Indicating
HPLC Method Development- A Review”,
Intrnl. Res. J. Pharm., Vol. 2, No. 5, pp. 79-
87.
11. Patil K R et al (2010), “Stability Indicating
LC Method for the Simultaneous
Determination of Amlodipine and
Olmesartan in Dosage Form”, J.
Chromatogr. Sc., Vol. 48, pp. 601-606.
12. Singh S and Bakshi M (2000), “Guidance
on Conduct of Stress Tests to Determine
Inherent Stability of Drugs”, Pharmaceutical
Technology Online, www.pharmaportal.com
13. Vasanth P M et al (2013), “Simultaneous
estimation and forced degradation studies
of Amlodipine besylate and Indapamida in
tablet dosage form by RP-HPLC method”,
Der Pharma Chemica, Vol. 5, No. 6, pp. 347
– 352.
14. Yoo H H et al (2011), “Determination of S-
and R- Amlodipine in Rat Plasma using LC-
MS/MS after Oral Administration of S-
Amlodipine and Racemic Amlodipine”,
Mass spectrometry Letters, Vol. 2, No. 4,
pp. 88-91.