
Research Paper: Calibration of Equity Returns and ... Paper. Calibration of Equity Returns and...
28
Research Paper Calibration of Equity Returns and Volatility for Stochastic Models Committee on Life Insurance Financial Reporting May 2017 Document 217055 Ce document est disponible en français © 2017 Canadian Institute of Actuaries Research reports do not necessarily represent the views of the Canadian Institute of Actuaries. Members should be familiar with research reports. Research reports do not constitute standards of practice and therefore are not binding. Research reports may or may not be in compliance with standards of practice. Responsibility for the manner of application of standards of practice in specific circumstances remains that of the members.
Transcript of Research Paper: Calibration of Equity Returns and ... Paper. Calibration of Equity Returns and...

Research Paper
Calibration of Equity Returns and Volatility for Stochastic Models
Committee on Life Insurance Financial Reporting
May 2017
Document 217055
Ce document est disponible en français
© 2017 Canadian Institute of Actuaries
Research reports do not necessarily represent the views of the Canadian Institute of Actuaries. Members should be familiar with research reports. Research reports do not constitute standards of practice and
therefore are not binding. Research reports may or may not be in compliance with standards of practice. Responsibility for the manner of application of standards of practice in specific circumstances remains
that of the members.
1740-360 Albert, Ottawa, ON K1R 7X7 613-236-8196 613-233-4552 [email protected] / [email protected] cia-ica.ca
MEMORANDUM
To: All Fellows, Affiliates, Associates, and Correspondents of the Canadian
Institute of Actuaries
From: Pierre Dionne, Chair Practice Council
Stéphanie Fadous Committee on Life Insurance Financial Reporting
Dean Stamp, Chair Designated Group
Date: May 17, 2017
Subject: Research Paper: Calibration of Equity Returns and Volatility for Stochastic Models
The Committee on Life Insurance Financial Reporting has created a working group to draft this paper to provide support for an updated promulgation of calibration criteria for equity returns and volatility for use in stochastic models related to life insurance actuarial valuation and financial reporting.
The existing calibration criteria for equity returns were developed using the data from January 1956 to June 2010. The data have been updated to cover the period from January 1956 to December 2015 for developing the updated calibration criteria.
Consistent with the existing calibration criteria, equity return calibration criteria are provided in the form of the maximum values for the accumulation factors for the 2.5th, 5th, and 10th percentiles for the one-year, five-year, 10-, and 20-year horizons.
In addition, equity volatility criteria are now provided in the form of minimum values of the annualized standard deviation of continuously compounded monthly returns for the 90th and 95th percentiles for the one-year and five-year horizons.
Two sets of calibration criteria are provided, one for broad-based equity indices of non- Asian developed economies, and one for small capitalization equity indices. Guidance is also provided for indices that do not fall into these two categories.
In accordance with the Institute’s Policy on Due Process for the Adoption of Guidance Material Other than Standards of Practice and Research Documents, this research paper has been prepared by the Committee on Life Insurance Financial Reporting, and has received the approval for distribution from the Practice Council on May 16, 2017.

4
The members of the working group are: Craig Fyfe, Sara Lang, Ling Luo, Ricardo Mitchell, Chris Moorley, Martin Ng, Stephan Sabourin, Dean Stamp (Chair), Na Ta, David Tian, Pierre-Alexandre Veilleux, Stephen Wang, and Salina Young.
If you have any questions or comments regarding this research paper, please contact Dean Stamp, Chair, working group, at [email protected].
PD, SF, DS
Research Paper May 2017
4
Table of Contents
1 Purpose .......................................................................................................................... 5
2 Summary ........................................................................................................................ 5
3 Data ................................................................................................................................ 6
3.1 Equity Return Data ......................................................................................................... 6
3.1.1 Choice of Indices .................................................................................................... 6
3.1.2 Choice of Historical Periods ................................................................................... 7
3.1.3 Source of Data ........................................................................................................ 7
3.2 Equity Volatility Data ...................................................................................................... 7
4 Method ........................................................................................................................... 7
4.1 Equity Return Calibration ............................................................................................... 8
4.1.1 Choice of Models ................................................................................................... 8
4.1.2 Accumulation Factor Criteria for Non-Canadian Indices ........................................ 8
4.2 Equity Volatility Calibration ........................................................................................... 9
4.2.1 Key Considerations ................................................................................................. 9
4.2.2 Calibration Criteria Design ................................................................................... 11
4.2.3 Choice of Models .................................................................................................. 11
4.3 Validation ..................................................................................................................... 12
5 Results .......................................................................................................................... 12
5.1 Equity Return Percentiles ............................................................................................ 12
6 Criteria .......................................................................................................................... 17
6.1 Number of Calibration Sets .......................................................................................... 17
6.2 Recommended Criteria ................................................................................................ 17
6.3 Application of the Criteria ............................................................................................ 18
7 References .................................................................................................................... 21
Appendix A: Equity Return Results ......................................................................................... 22
Appendix B: Equity Volatility Results ...................................................................................... 25
Appendix C: L1 Broad-Based Indices ...................................................................................... 27
Appendix D: Comparison of 2012 and 2015 Accumulation Factor Data ................................ 28

Research Paper May 2017
5
1 Purpose The existing calibration criteria for equity returns used in stochastic modelling, and the methodology used to develop them, were published by a designated group of the Committee on Life Insurance Financial Reporting in a research paper in 2012.
The 2012 research paper included criteria for the following:
• The left tail of Canadian equity returns at percentiles 2.5%, 5%, and 10%, for the one-, five-,10-, and 20-year horizons;
• The right tail of equity returns; and
• Non-Canadian equity returns.
The 2012 research paper deferred developing calibration criteria in respect of the volatility of equity returns in the context of hedging.
The scope of this research paper includes a review of the existing equity return calibration, including a review of the models used to produce them, and the development of equity volatility calibration criteria. These calibration criteria are applicable to all stochastic models related to life insurance actuarial valuation and financial reporting that require equity return and volatility assumptions.
2 Summary The models and methodologies used to develop the accumulation factor calibration criteria in the 2012 research paper were reviewed. The data used in the 2012 research paper analysis was also updated to include monthly TSX and S&P total return data between January 2011 and December 2015. As a result of this review and data update, no changes to the existing left-tail accumulation factor calibration criteria are proposed.
The following table presents the maximum values for the accumulation factors for broad-based equity indices of developed non-Asian economies (L1 indices) and small capitalization equity indices and economies (L2 indices):
In addition, the range for the expectation (mean) of the one-year horizon accumulation factor is as follows.
Calibration criteria have also been developed for the volatility of equity returns, as shown below. Consistent with accumulation factor and return calibration criteria, two sets of calibration criteria on the volatility of equity returns have been established: one applicable to broad-based indices of developed non-Asian economies (L1 indices), and one applicable to small capitalization indices (L2 indices). The following table presents the minimum
Left tail calibrationcriteria 2.5th 5th 10th 2.5th 5th 10th 2.5th 5th 10th 2.5th 5th 10thL1 indices 0.74 0.81 0.88 0.70 0.80 0.95 0.80 0.95 1.20 1.25 1.65 2.25 L2 indices 0.68 0.76 0.85 0.60 0.70 0.90 0.70 0.90 1.20 1.10 1.55 2.35
1 year 5 years 10 years 20 years
Mean Criteria Min MaxL1 indices 8% 12%L2 indices 11% 15%

Research Paper May 2017
6
values for the realized volatility of equity returns:
The above criteria are to be applied to the annualized standard deviation of continuously compounded monthly returns over the first one-year and first five-year projection horizons.
Details on the development of the criteria are provided in section 4.
The Application of the Criteria
The criteria continue to apply to the scenarios generated for the valuation. If a closed-form formula exists for a statistic subject to the criteria, it would be sufficient to test that the theoretical value of the statistic calculated using the closed-form formula meets the criteria, as long as a large number of scenarios is used for valuation, and the actuary tests that the discrepancy between the theoretical value and the value calculated with the scenario set is not material.
The calibration process also provides rules for indices other than L1 and L2 indices. Details on the process of applying criteria are provided in section 6.
3 Data 3.1 Equity Return Data
3.1.1 Choice of Indices
As with the 2012 research paper, we attempted to choose indices that are commonly used when modelling benchmarks in the valuation of segregated fund investment guarantees.
We reviewed and analyzed the data of large capitalization indices in the following countries/regions:
Indices by Region Countries/Regions Name of Index
Canada S&P TSX Composite United States S&P 500 United Kingdom FTSE All-Share Europe, Australasia, and Far East MSCI EAFE
A detailed description of the indices mentioned above is also available in appendix A of the educational note Investment Return Assumptions for Non-Fixed Income Assets for Life Insurers.
In addition, we reviewed the data of the Russell 2000, which is the most representative small capitalization index in the United States.
90th 95th 90th 95thL1 21.50% 24.60% 19.10% 20.50%L2 29.00% 32.60% 25.00% 26.50%
Right-tail Volatility Calibration Criteria
1 year 5 years
Research Paper May 2017
7
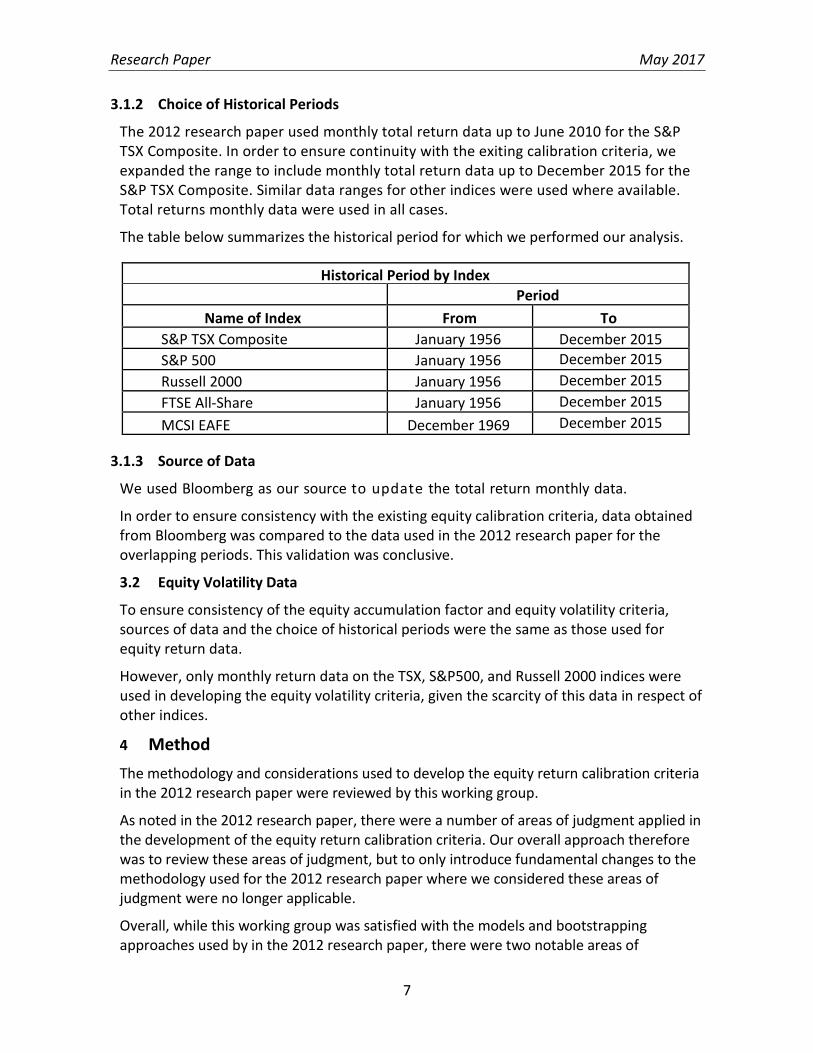
3.1.2 Choice of Historical Periods
The 2012 research paper used monthly total return data up to June 2010 for the S&P TSX Composite. In order to ensure continuity with the exiting calibration criteria, we expanded the range to include monthly total return data up to December 2015 for the S&P TSX Composite. Similar data ranges for other indices were used where available. Total returns monthly data were used in all cases.
The table below summarizes the historical period for which we performed our analysis.
Historical Period by Index Period
Name of Index From To S&P TSX Composite January 1956 December 2015 S&P 500 January 1956 December 2015 Russell 2000 January 1956 December 2015 FTSE All-Share January 1956 December 2015
MCSI EAFE December 1969 December 2015
3.1.3 Source of Data
We used Bloomberg as our source to update the total return monthly data.
In order to ensure consistency with the existing equity calibration criteria, data obtained from Bloomberg was compared to the data used in the 2012 research paper for the overlapping periods. This validation was conclusive.
3.2 Equity Volatility Data
To ensure consistency of the equity accumulation factor and equity volatility criteria, sources of data and the choice of historical periods were the same as those used for equity return data.
However, only monthly return data on the TSX, S&P500, and Russell 2000 indices were used in developing the equity volatility criteria, given the scarcity of this data in respect of other indices.
4 Method The methodology and considerations used to develop the equity return calibration criteria in the 2012 research paper were reviewed by this working group.
As noted in the 2012 research paper, there were a number of areas of judgment applied in the development of the equity return calibration criteria. Our overall approach therefore was to review these areas of judgment, but to only introduce fundamental changes to the methodology used for the 2012 research paper where we considered these areas of judgment were no longer applicable.
Overall, while this working group was satisfied with the models and bootstrapping approaches used by in the 2012 research paper, there were two notable areas of
Research Paper May 2017
8
judgment in the 2012 research paper that this working group determined required additional consideration. These were the grouping of indices underlying the L1 and L2 equity return calibration criteria, and the development of new equity volatility criteria.
Of note, the inclusion of the equity volatility criteria also introduced an additional step in the equity return calibration process that was necessary to ensure that scenarios underlying the equity return calibration also met the requirements of the equity volatility calibration (i.e., that the equity return and volatility calibrations were internally consistent).
4.1 Equity Return Calibration
4.1.1 Choice of Models
This working group had no concerns with the bootstrapping and model approaches used to determine the equity return calibration in the 2012 research paper. Specifically, the four models used in the 2012 research paper were considered to remain appropriate by this task force. These models are:
• Log-normal model (LN);
• Two-factor regime-switching log-normal (RS2LN) model;
• Two-factor regime-switching drawdown (RS2DD1) model; and
• Correlated stochastic volatility log-normal (CSVL) model.
The working group also considered the bootstrapping approach. The approach used for bootstrapping is consistent with the approach used in the 2012 research paper.
4.1.2 Accumulation Factor Criteria for Non-Canadian Indices
A significant portion of segregated fund exposure for Canadian insurers is related to non- Canadian markets. The 2012 working group applied judgment in developing the criteria for non-Canadian indices in the following areas:
• Historical data periods for the TSX, S&P 500, FTSE, Russell 2000, Topix, MSCI EAFE, and Hang Seng indices;
• Establishing a common set of criteria in respect of indices sharing similar statistics (e.g., in respect of diversification, geography, size of capitalization, etc.); and
• Indices that show very high historical returns.
Overall, this working group had no concerns with the judgment applied by the 2012 working group in establishing the L1 and L2 calibration grouping. Consideration was given by this working group to developing separate criteria for S&P and TSX equity returns, but this separation was ultimately rejected. Further details on this are provided in section 5 below.
The calibration criteria apply to the accumulation factors of non-Canadian indices in local currency. When non-Canadian indices are modelled, the foreign exchange rate would also be considered.

Research Paper May 2017
9
4.2 Equity Volatility Calibration
4.2.1 Key Considerations
The 2012 working group provided the following recommendations regarding the future development of the equity volatility calibration:
1. Provide guidance for the projection of future realized volatility of equity returns;
2. Consider the relevance of reflecting the volatility regime prevailing at the valuation date in projecting equity returns; and
3. Determine the appropriate time step to use for estimating volatility in the context of hedging.
This working group included the following additional considerations;
4. Requirement to ensure consistency between real-world (RW) scenarios used for unhedged and hedged valuation;
5. Internal consistency of equity returns and volatility calibrations; and
6. Applicability of the volatility calibration recommendation to risk-neutral (RN) assumptions used for hedging.
Finally, as noted by the 2012 working group, “the exercise of establishing criteria does not rely only on statistical analysis, and involves a certain level of professional judgment”. This is particularly relevant in respect of establishing the equity volatility calibration in that there is little existing guidance/practice on this subject. This working group therefore took a pragmatic approach to the development of the equity volatility calibration criteria, notably applying professional judgment in a number of areas rather than attempting to strive for perfection with overly complex models.
Further details on these key considerations are provided below.
Projection of Future Realized Volatility of Equity Returns
Since cash flows associated with dynamic hedging strategies are primarily associated with realized volatility rather than implied volatility, the working group has focused its guidance on future realized volatility. Guidance on future implied volatility may however be needed at some point in the future as hedging strategies evolve.
Relevance of Reflecting the Volatility Regime Prevailing at the Valuation Date
It is widely accepted that realized volatility exhibits strong mean reversion characteristics, and as a result reflecting the volatility regime at the valuation date would increase the pro-cyclicality of the valuation of liabilities to changes in volatility without adding any significant degree of accuracy.
The working group therefore concluded that the volatility regime prevailing at the valuation date should have limited relevance in the context of the valuation of long-term liabilities.

Research Paper May 2017
10
Appropriate Time Step to Use for Estimating Volatility in the Context of Hedging
The reflection of hedging in segregated fund guarantee valuation requires very time-consuming calculations, which often preclude the use of a daily time step in the modelling of hedge rebalancing. As a result, a monthly time step is a common assumption in reflecting hedging in segregated fund guarantee valuation.
While the working group acknowledges that companies are typically subject to daily volatility in their hedge operations, the working group decided to base the volatility calibration on monthly returns rather than daily returns, to better align with how hedging is reflected in valuation in practice.
There are two important considerations in this decision. The first is the fact that the relationship between daily and monthly volatility has not been stable over time, and the working group wanted to avoid a volatility calibration recommendation that was dependent on the data period being considered. Of note, over the December 1977 to December 2015 data period (the longest data period over which TSX daily volatility data is available), TSX monthly volatility was higher than daily volatility. As a result, the working group did not consider a volatility calibration recommendation based on daily volatility data to be an automatic requirement.
The second is the fact that a larger time step increases the variability of hedge inefficiencies and thus adds conservatism to the valuation. The working group wanted to avoid adding to this conservatism through the use of daily data in determining the volatility calibration criteria.
The working group would, however, advise companies reflecting hedging in their valuation through a stochastic-on-stochastic method with a time step more frequent than monthly or through a method in which the frequency of projection does not create additional hedge inefficiencies, to reflect the difference between the daily and monthly volatility in their valuation.
Consistency between Real-World (RW) Scenarios Used for Unhedged and Hedged Valuation
The 2012 working group commented that “the increasing use of hedging by companies has raised additional issues with regard to calibration of models”. While the working group acknowledges that the volatility of equity returns has an impact on the valuation of unhedged segregated funds that is much more limited than on that of hedged segregated funds, it considers consistency in scenarios to be important given that there can be only one future equity market environment.
The recommendations from this working group are therefore intended to be applied to the calibration of stochastic RW scenarios, regardless of whether these scenarios are being used to reflect the impact of hedging in the valuation or not.
Internal Consistency of Equity Returns and Volatility Calibrations
The working group considered that the consistency principle should also apply to the calibration of equity accumulation factor and volatility criteria. Ultimately there is only one
Research Paper May 2017
11
future equity market environment, and given that the pattern of equity returns and volatility are closely related to one another, the calibration of equity returns and volatility should be consistent.
Although separate analysis was conducted in respect of the accumulation factors and volatility criteria, the working group paid close attention to the data and models used to conduct this analysis to ensure consistency.
Applicability of Volatility Calibration Recommendation to Risk-Neutral (RN) Assumptions Used for Hedging
RN volatility assumptions used for hedging are invariably proprietary assumptions based on the individual company’s view of economic parameters applicable to their hedging program.
As a result, the working group concluded that the volatility calibration recommendation should apply only to equity volatility assumed in stochastic RW scenarios, and should not apply to the RN equity volatility assumed for hedging.
In the context of a stochastic-on-stochastic valuation used for the determination of International Financial Reporting Standards (IFRS) liabilities, the volatility calibration recommendations apply to the outer loop RW scenarios only.
4.2.2 Calibration Criteria Design
The criteria are defined to be the annualized standard deviation of continuously compounded monthly returns and are applied over the first one-year and first five-year projection horizons.
The criteria were designed to be consistent with the accumulation factor criteria, with the use of percentiles and the selection of years. The criteria were established with restrictions on ensuring a minimum level of high volatility with the expectation that liabilities would be sensitive to high volatility. Criteria were not established on low, median, or average volatility as we did not want to dictate specific model forms or best estimate assumptions.
Projection horizons of one and five years were selected, as there is an expectation of mean reversion in the equity volatility, and the five-year point was felt to be sufficient to ensure that the mean reversion in the model was appropriate. This criteria form requires that both the one-year and five-year criteria are satisfied at each future valuation date to ensure appropriate reserve on an ongoing basis.
The criteria consider two percentiles, 90th and 95th. More than one percentile is considered to allow for restrictions on multiple points at the tail and to be consistent with the accumulation factor criteria. However, the 97.5th percentile and beyond are not considered because of limited data.
4.2.3 Choice of Models
A number of models were looked at to determine the equity volatility criteria, as well as bootstrapping with a 12-month block size. The models include the following:
• RS2LN and CSVL models, which were chosen for consistency with the equity

Research Paper May 2017
12
accumulation factor models;
• Heston, which was chosen as it is a common model used within the industry to model equity volatility; and
• Other non-affine stochastic volatility models (Christoffersen et al., 2010).
Christofferson et al (2010) suggested using the maximum likelihood estimation (MLE) with particle filter to calibrate parameters. The particle filter algorithm approximates the true density of the instantaneous variance by a set of discrete points or particles. At each particle, the value of the instantaneous variance is simulated. The method was implemented and tested with monthly TSX and S&P total returns. It has been observed that the calibration results are not very stable and vary by the number of particles and random seed.
The Heston model is one of the most popular stochastic volatility models for derivatives pricing. When calibrated to historical monthly returns, it produced a much thinner tail of volatility than the CSVL model described in Section 4.1.1. One possible explanation is that the CSVL variance process follows the log-normal distribution, which has a heavier right tail than the Heston variance process distribution; that is, non-central chi-square distribution.
For the reasons above, the Christofferson et al. and Heston models were not used in determining the equity volatility criteria.
All models were calibrated using maximum likelihood estimators (MLE).
4.3 Validation
Equity return and volatility models (and associated calibrations) were validated as follows:
• The LN, RS2LN, RS2DD1, and CSVL models used by this working group were recalibrated to the 1956–2010 data (same period as used by the 2012 working group), and all equity return model results produced by the 2012 working group were replicated.
• All models were independently recalibrated by different members of the working group, and all model outputs were independently reconciled.
5 Results 5.1 Equity Return Percentiles
Consistent with the approach taken by the 2012 working group, random paths of equity returns over different horizons (one-, five-, 10-, and 20-year) were generated for each of the four models selected (LN, RS2LN, RS2DD1, and CSVL). To minimize sample error, at least 10,000 paths were generated. Similarly, random paths of returns were generated using the bootstrap technique using block sizes of three, six, and 12 months.
Broad-Based Indices of Developed Non-Asian Economies (L1)
The accumulation factor criteria were primarily developed using the TSX and S&P 500 index data given that equity return data in other indices was more limited, and the fact that the TSX and S&P 500 indices form the majority of equity exposure in Canada.

Research Paper May 2017
13
While the bootstrapping, LN, and RS2DD1 model results provided a useful benchmark, the results from the models provided limited value in directly establishing the accumulation factor criteria, as the LN and RS2DD1 models were generally considered too aggressive, and bootstrapping lacks sufficient independent data at longer horizons. As a result, the equity return criteria were primarily established using the TSX and S&P 500 accumulation factor results from the RS2LN and CSVL models.
Detailed results are provided in appendix A and a summary of results for the TSX and the S&P 500 indices is shown below.
The resulting 2.5th, 5th , and 10th percentiles are presented in appendix A and a summary of results for TSX and S&P 500 is shown below.
Observations on these results are similar to those made by the 2012 working group:
• The bootstrap method produces accumulation factors similar to those for the RS2LN and CSVL models for the one-year horizon, but generally higher accumulation factors over longer horizons, and the differences increase with the length of the horizon.
• Accumulation factors for the RS2DD1 model over long horizons are significantly higher than those obtained with other methods, because of the mean reversion assumed in this model. The differences increase with the length of the horizon. The LN model produces the second-largest accumulation factors.
• There is no clear relation between accumulation factors produced by the RS2LN and CSVL models. The RS2LN model produces lower accumulation factors than the CSVL
2.5th 5th 10th 2.5th 5th 10th 2.5th 5th 10th 2.5th 5th 10thEmpirical 0.71 0.80 0.88Bootstrap 3-months 0.76 0.82 0.88 0.72 0.82 0.95 0.82 0.98 1.20 1.26 1.62 2.14Bootstrap 6-months 0.74 0.80 0.87 0.70 0.80 0.93 0.79 0.94 1.17 1.17 1.53 2.05Bootstrap 12-months 0.74 0.82 0.88 0.71 0.81 0.94 0.80 0.96 1.19 1.25 1.59 2.10LN Model 0.81 0.85 0.89 0.78 0.87 0.99 0.91 1.06 1.26 1.44 1.78 2.29RS2LN model 0.72 0.79 0.88 0.63 0.75 0.90 0.69 0.86 1.11 1.01 1.38 1.92RS2DD1 model 0.74 0.81 0.88 0.86 0.94 1.04 1.10 1.23 1.39 1.93 2.24 2.68CSVL model 0.75 0.82 0.89 0.68 0.80 0.95 0.77 0.94 1.18 1.17 1.54 2.08
2.5th 5th 10th 2.5th 5th 10th 2.5th 5th 10th 2.5th 5th 10thEmpirical 0.71 0.82 0.89Bootstrap 3-months 0.79 0.85 0.91 0.81 0.91 1.04 0.99 1.16 1.40 1.75 2.19 2.81Bootstrap 6-months 0.77 0.84 0.90 0.78 0.89 1.02 0.95 1.13 1.37 1.64 2.07 2.72Bootstrap 12-months 0.76 0.84 0.89 0.76 0.87 1.02 0.93 1.11 1.36 1.62 2.07 2.72LN Model 0.83 0.86 0.91 0.85 0.94 1.06 1.05 1.21 1.43 1.86 2.29 2.90RS2LN model 0.76 0.82 0.89 0.73 0.84 0.99 0.86 1.05 1.30 1.45 1.89 2.55RS2DD1 model 0.77 0.84 0.91 0.90 1.00 1.12 1.21 1.37 1.57 2.38 2.79 3.35CSVL model 0.75 0.81 0.89 0.64 0.77 0.93 0.70 0.89 1.15 1.02 1.39 1.95
L1 Criteria 0.74 0.81 0.88 0.70 0.80 0.95 0.80 0.95 1.20 1.25 1.65 2.25
TSX - Jan '56 - Dec '15
S&P500 - Jan '56 - Dec '151 year 5 years 10 years 20 years
1 year 5 years 10 years 20 years
Research Paper May 2017
14
model for the TSX, and higher accumulation factors than the CSVL model for the S&P 500.
• While the bootstrapping, LN, and R22DD1 model results provided a useful benchmark, results from these models provided limited value in directly establishing the accumulation factor criteria. As a result, the equity return criteria were primarily established using the TSX and S&P 500 accumulation factor results from the RS2LN and CSVL models.
One notable difference since 2012 was that accumulation factors for the S&P 500 using the R2SLN and CSVL models in this study were generally higher than those determined by the 2012 working group. In contrast, accumulation factors for the TSX were similar or marginally lower in this study compared to the results determined by the 2012 working group. See appendix D for a comparison. Consideration was therefore given to potentially developing separate L1 equity calibration criteria for the S&P 500 and TSX to reflect the changes in these returns since the last study.
As can be seen in the above table, while RS2LN results for the S&P 500 are noticeably higher than those for the TSX, the reverse is true for results using the CSVL model. As noted by the 2012 working group, although the RS2LN and CSVL models were the preferred models for the calibration, there was nothing to suggest that one of these models was intrinsically better than the other.
Further, it was also noted that differences between the S&P 500 and the TSX accumulation factors calculated using the RS2LN model were within model error tolerances (i.e., differences in the S&P 500 and TSX accumulation factors were not statistically different). Similar comments apply to the CSVL model results.
As can be seen from the TSX and S&P 500 results, the average of the RS2LN and CSVL model results were reasonably close to the existing accumulation factor criteria. The working group did give consideration to updating the accumulation factor criteria based on these results, but ultimately concluded that differences from the existing recommendation were not substantive enough to warrant updating the existing criteria.
It was therefore concluded that the RS2LN and CSVL model accumulation factor results do not support changing to separate TSX and S&P 500 equity return calibration criteria; both should be calibrated to the existing L1 criteria.
Small Capitalization Indices/Economies (L2)
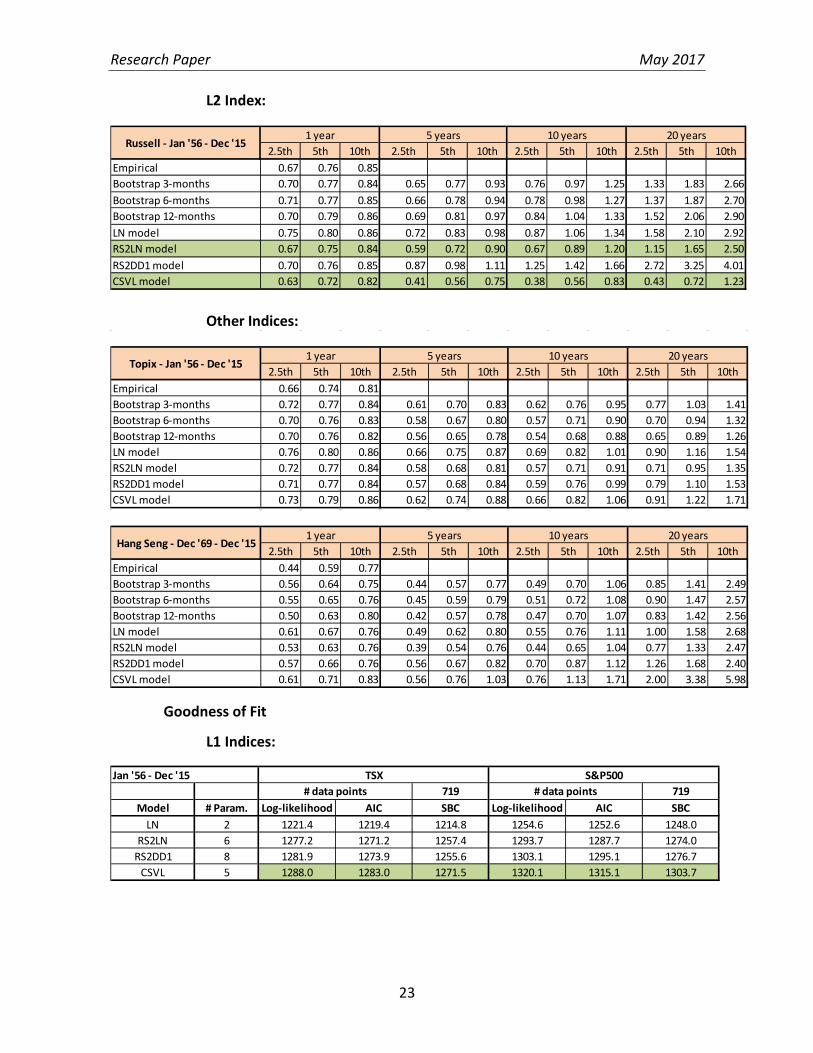
The 2.5th, 5th, and 10th percentiles for the Russell 2000 index are shown below. Consistent
with the approach taken by the 2012 working group, the higher of the RS2LN and CSVL results were used to determine the criteria. At all horizons, the RS2LN model produced higher percentiles than the CSVL model. Hence, the RS2LN results were used to determine the L2 criteria. As the RS2LN model results are reasonably close to the existing accumulation factor criteria, the working group decided that no change to the L2 criteria was needed.

Research Paper May 2017
15
Goodness of Fit
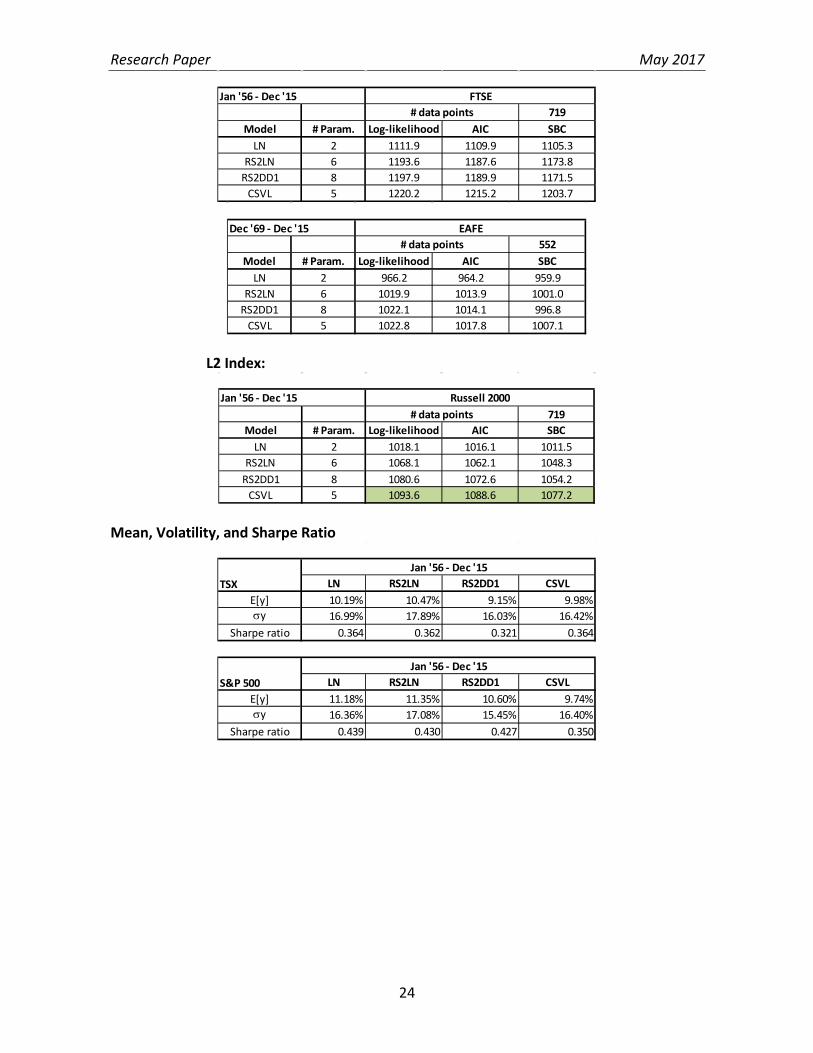
We determined parameters for the four models we selected using maximum likelihood estimation. The following tables present the log-likelihood value for each of the models for TSX, S&P 500, and Russell 2000. Similar information can be found for FTSE and MSCI EAFE in appendix A. We also computed the Akaike information criterion (AIC) and Schwarz-Bayes Criterion (SBC). The interpretation of these criteria is that given a set of plausible models for the data, the preferred model is the one with the highest criteria value. The CSVL provides the best fit under the log-likelihood, AIC, and SBC criteria for the TSX, S&P 500, and Russell 2000.
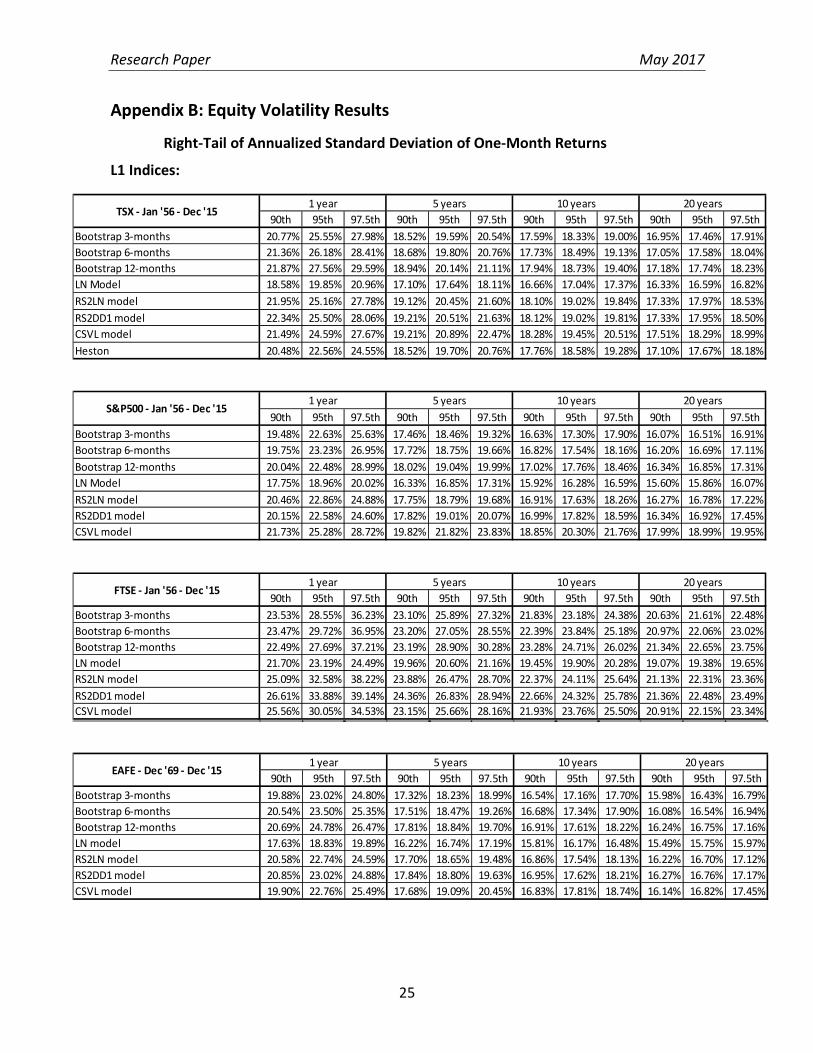
5.2 Equity Volatility Percentiles
Detailed results are provided in appendix B, and a summary of results for the TSX, S&P500, and Russell 2000 indices is shown below.
2.5th 5th 10th 2.5th 5th 10th 2.5th 5th 10th 2.5th 5th 10thEmpirical 0.67 0.76 0.85Bootstrap 3-months 0.70 0.77 0.84 0.65 0.77 0.93 0.76 0.97 1.25 1.33 1.83 2.66Bootstrap 6-months 0.71 0.77 0.85 0.66 0.78 0.94 0.78 0.98 1.27 1.37 1.87 2.70Bootstrap 12-months 0.70 0.79 0.86 0.69 0.81 0.97 0.84 1.04 1.33 1.52 2.06 2.90LN model 0.75 0.80 0.86 0.72 0.83 0.98 0.87 1.06 1.34 1.58 2.10 2.92RS2LN model 0.67 0.75 0.84 0.59 0.72 0.90 0.67 0.89 1.20 1.15 1.65 2.50RS2DD1 model 0.70 0.76 0.85 0.87 0.98 1.11 1.25 1.42 1.66 2.72 3.25 4.01CSVL model 0.63 0.72 0.82 0.41 0.56 0.75 0.38 0.56 0.83 0.43 0.72 1.23
L2 Criteria 0.68 0.76 0.85 0.60 0.70 0.90 0.70 0.90 1.20 1.10 1.55 2.35
Russell - Jan '56 - Dec '151 year 5 years 10 years 20 years
719 719Model # Param. Log-likelihood AIC SBC Log-likelihood AIC SBC
LN 2 1221.4 1219.4 1214.8 1254.6 1252.6 1248.0RS2LN 6 1277.2 1271.2 1257.4 1293.7 1287.7 1274.0
RS2DD1 8 1281.9 1273.9 1255.6 1303.1 1295.1 1276.7CSVL 5 1288.0 1283.0 1271.5 1320.1 1315.1 1303.7
Jan '56 - Dec '15 TSX S&P500# data points # data points
719Model # Param. Log-likelihood AIC SBC
LN 2 1018.1 1016.1 1011.5RS2LN 6 1068.1 1062.1 1048.3
RS2DD1 8 1080.6 1072.6 1054.2CSVL 5 1093.6 1088.6 1077.2
# data pointsRussell 2000Jan '56 - Dec '15
Research Paper May 2017
16
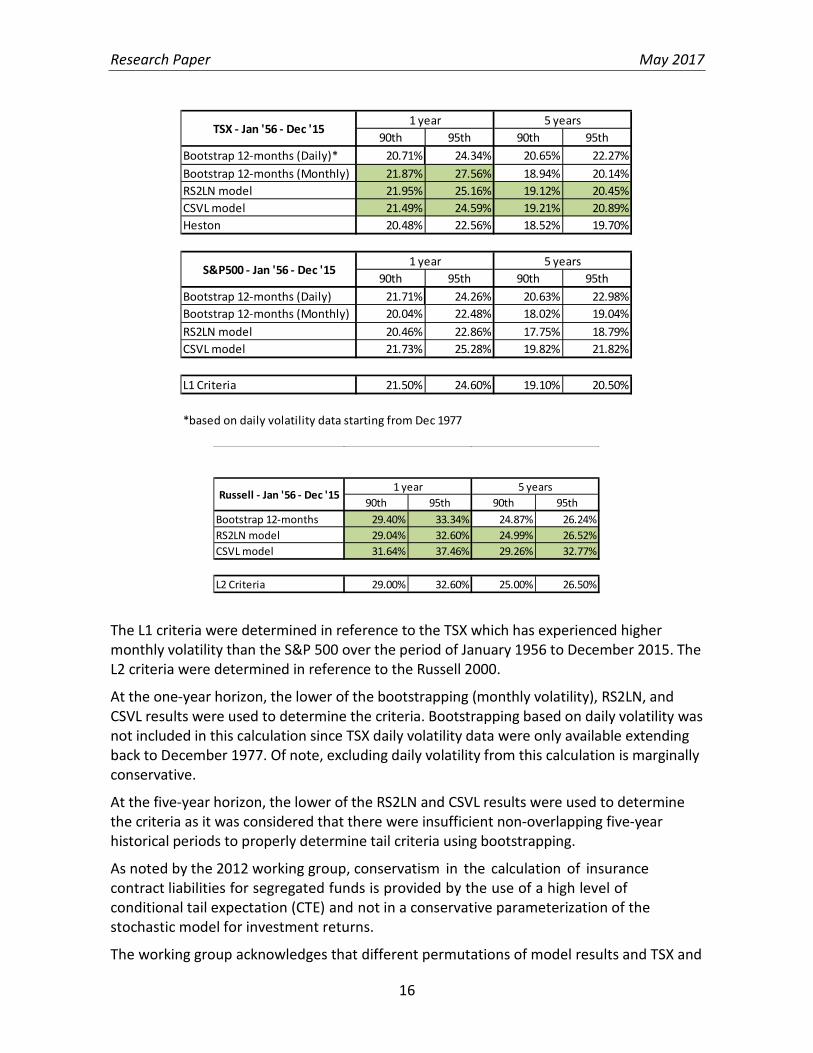
The L1 criteria were determined in reference to the TSX which has experienced higher monthly volatility than the S&P 500 over the period of January 1956 to December 2015. The L2 criteria were determined in reference to the Russell 2000.
At the one-year horizon, the lower of the bootstrapping (monthly volatility), RS2LN, and CSVL results were used to determine the criteria. Bootstrapping based on daily volatility was not included in this calculation since TSX daily volatility data were only available extending back to December 1977. Of note, excluding daily volatility from this calculation is marginally conservative.
At the five-year horizon, the lower of the RS2LN and CSVL results were used to determine the criteria as it was considered that there were insufficient non-overlapping five-year historical periods to properly determine tail criteria using bootstrapping.
As noted by the 2012 working group, conservatism in the calculation of insurance contract liabilities for segregated funds is provided by the use of a high level of conditional tail expectation (CTE) and not in a conservative parameterization of the stochastic model for investment returns.
The working group acknowledges that different permutations of model results and TSX and
90th 95th 90th 95thBootstrap 12-months (Daily)* 20.71% 24.34% 20.65% 22.27%Bootstrap 12-months (Monthly) 21.87% 27.56% 18.94% 20.14%RS2LN model 21.95% 25.16% 19.12% 20.45%CSVL model 21.49% 24.59% 19.21% 20.89%Heston 20.48% 22.56% 18.52% 19.70%
90th 95th 90th 95thBootstrap 12-months (Daily) 21.71% 24.26% 20.63% 22.98%Bootstrap 12-months (Monthly) 20.04% 22.48% 18.02% 19.04%RS2LN model 20.46% 22.86% 17.75% 18.79%CSVL model 21.73% 25.28% 19.82% 21.82%
L1 Criteria 21.50% 24.60% 19.10% 20.50%
*based on daily volatility data starting from Dec 1977
S&P500 - Jan '56 - Dec '15
1 year 5 years
1 year 5 years
TSX - Jan '56 - Dec '15
90th 95th 90th 95thBootstrap 12-months 29.40% 33.34% 24.87% 26.24%RS2LN model 29.04% 32.60% 24.99% 26.52%CSVL model 31.64% 37.46% 29.26% 32.77%
L2 Criteria 29.00% 32.60% 25.00% 26.50%
Russell - Jan '56 - Dec '151 year 5 years

Research Paper May 2017
17
S&P 500 data would have produced criteria higher or lower than those recommended, but overall, the working group considers that this approach applies an appropriate degree of conservatism in setting the calibration criteria.
6 Criteria 6.1 Number of Calibration Sets
The considerations given by the 2012 working group regarding the number of equity return calibration sets were reviewed and no changes were considered necessary. Equity return calibration sets proposed by this working group are as follows:
• L1 – broad-based indices of developed non-Asian economies; and
• L2 – small capitalization indices/economies.
The return and volatility criteria apply to business that is both hedged and unhedged.
Further details on these calibration sets can be found in appendix C.
Some economies considered as developed by MSCI are of small size, such as Belgium. A fund tied to one or a few of these small developed economies should be subject to more stringent criteria than a fund tied to a well-diversified basket of developed economies or a large developed economy such as the United Kingdom or Germany.
Indices to which a single set of criteria will apply are those that are composed of a diversified basket of L1 indices or of a single index of a large economy that falls within the L1 index classification. Indices that include a relatively small number of markets that fall within the L1 index classification or consist of small economies will be subject to a different treatment (they will fall under case 2 in the decision tree presented in section 7.1).
6.2 Recommended Criteria
The following table presents the maximum values for the left tail of accumulation factors for the one-, five-, 10-, and 20-year horizons.
In addition, the range for the expectation (mean) of the one-year horizon accumulation factor is as follows.
These are identical to the 2012 equity accumulation left-tail and mean accumulation factor criteria.
Calibration criteria have also been developed for the volatility of equity returns, as shown below. Consistent with accumulation factor and return calibration criteria, two sets of calibration criteria on the volatility of equity returns have been established: one
Left tail calibrationcriteria 2.5th 5th 10th 2.5th 5th 10th 2.5th 5th 10th 2.5th 5th 10thL1 indices 0.74 0.81 0.88 0.70 0.80 0.95 0.80 0.95 1.20 1.25 1.65 2.25 L2 indices 0.68 0.76 0.85 0.60 0.70 0.90 0.70 0.90 1.20 1.10 1.55 2.35
1 year 5 years 10 years 20 years
Mean Criteria Min MaxL1 indices 8% 12%L2 indices 11% 15%
Research Paper May 2017
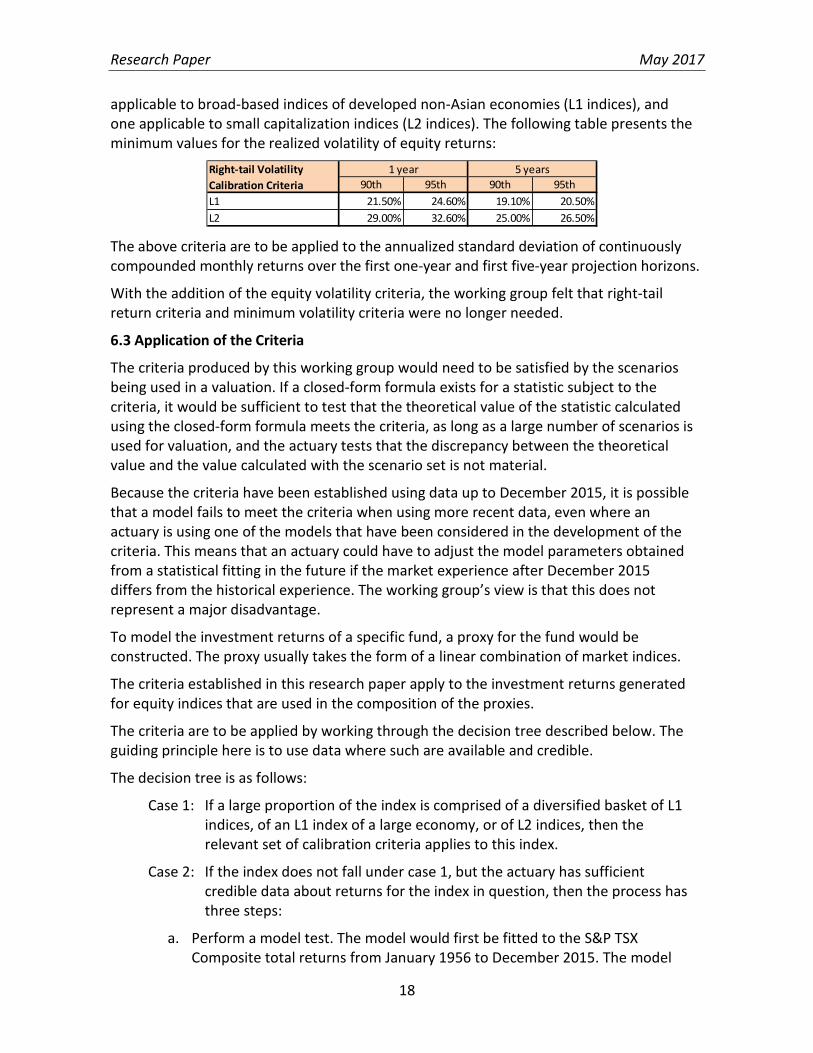
18
applicable to broad-based indices of developed non-Asian economies (L1 indices), and one applicable to small capitalization indices (L2 indices). The following table presents the minimum values for the realized volatility of equity returns:
The above criteria are to be applied to the annualized standard deviation of continuously compounded monthly returns over the first one-year and first five-year projection horizons.
With the addition of the equity volatility criteria, the working group felt that right-tail return criteria and minimum volatility criteria were no longer needed.
6.3 Application of the Criteria
The criteria produced by this working group would need to be satisfied by the scenarios being used in a valuation. If a closed-form formula exists for a statistic subject to the criteria, it would be sufficient to test that the theoretical value of the statistic calculated using the closed-form formula meets the criteria, as long as a large number of scenarios is used for valuation, and the actuary tests that the discrepancy between the theoretical value and the value calculated with the scenario set is not material.
Because the criteria have been established using data up to December 2015, it is possible that a model fails to meet the criteria when using more recent data, even where an actuary is using one of the models that have been considered in the development of the criteria. This means that an actuary could have to adjust the model parameters obtained from a statistical fitting in the future if the market experience after December 2015 differs from the historical experience. The working group’s view is that this does not represent a major disadvantage.
To model the investment returns of a specific fund, a proxy for the fund would be constructed. The proxy usually takes the form of a linear combination of market indices.
The criteria established in this research paper apply to the investment returns generated for equity indices that are used in the composition of the proxies.
The criteria are to be applied by working through the decision tree described below. The guiding principle here is to use data where such are available and credible.
The decision tree is as follows:
Case 1: If a large proportion of the index is comprised of a diversified basket of L1 indices, of an L1 index of a large economy, or of L2 indices, then the relevant set of calibration criteria applies to this index.
Case 2: If the index does not fall under case 1, but the actuary has sufficient credible data about returns for the index in question, then the process has three steps:
a. Perform a model test. The model would first be fitted to the S&P TSX Composite total returns from January 1956 to December 2015. The model
90th 95th 90th 95thL1 21.50% 24.60% 19.10% 20.50%L2 29.00% 32.60% 25.00% 26.50%
Right-tail Volatility Calibration Criteria
1 year 5 years

Research Paper May 2017
19
outputs are then compared to the equity return and volatility calibration criteria for L1 indices. If the model outputs satisfy those criteria, then the form of the model is acceptable and the actuary can proceed to the second step. If not, then the actuary would change the model form.
b. Fit the model to the available data for the index. The model is then used to generate returns.
c. A final test is to review the Sharpe ratio1 of the model outputs. The Sharpe ratio is to be calculated using the expectation and the standard deviation of the one-year accumulation factor. The Sharpe ratio would not exceed 0.40 with an assumed risk-free rate of 4.00%. If necessary, the fitted parameters for the mean from step b. would be adjusted downward until this Sharpe criterion is satisfied.
Case 3: If the index does not fall under case 1 or case 2, then
a. The equity criteria to be applied are derived from criteria for the L1 indices with an adjustment for the expected differences in mean returns and volatility.
The criteria for the accumulation factor of the index are
AF(F, p, t) = AF(TSX, p, t) × exp(µDiff × t + σDiff × Φ-1(p) × √t ) where,
AF(F, p, t) is the left tail criterion for index F for the pth percentile at horizon t;
AF(TSX, p, t) is the left tail criterion for L1 indices for the pth percentile at horizon t;
Φ-1 (p) is the inverse cumulative distribution function of the standard normal distribution;
σTSX is the sample standard deviation for the TSX;
σF is the sample standard deviation for the index;
σDiff is equal to σF - σTSX , the differential in the standard deviation of the two indices;
µTSX is the sample mean for the TSX;
µF is the mean for the index, calculated using the Sharpe ratio as:
µF = r + σF × (µTSX - r)/σTSX;
µDiff is equal to µF - µTSX, the differential in the mean of the two indices; and
r is the risk-free rate established at 4% for the calibration.
1 The Sharpe ratio of an index is equal to the difference between the expected return of the index and the risk-free rate, divided by the standard deviation of the index.

Research Paper May 2017
20
The sample mean and the sample volatilities are calculated based on historical monthly log returns. The sample volatilities for the TSX and the index would be calculated using the longest common historical period available with the end date of December 2015. The sample mean for the TSX would be calculated using the data from January 1956 to December 2015.
At a minimum, the index would be no less volatile than the TSX. If appropriate, the assumed volatility would be adjusted upward to reflect the stated objectives of the index.
b. The volatility criteria to be applied are derived from criteria for the L1 indices with an adjustment for the expected differences in the average and variability of volatility.
𝑉(𝐹,𝑝, 𝑡) = 𝑉(𝑇𝑇𝑇,𝑝, 𝑡) × exp ��𝜇𝐹
(𝑙𝑙𝑙𝑙) − 𝜇𝑇𝑇𝑇(𝑙𝑙𝑙𝑙)�× 𝑡 + �𝜎𝐹
(𝑙𝑙𝑙𝑙) − 𝜎𝑇𝑇𝑇(𝑙𝑙𝑙𝑙)� × Φ−1(𝑝) × √𝑡�
where,
𝑉(𝐹,𝑝, 𝑡) is the right tail criterion for index 𝐹 for the 𝑝𝑡ℎ percentile at horizon 𝑡;
𝑉(𝑇𝑇𝑇,𝑝, 𝑡) is the right tail criterion for L1 indices for the 𝑝𝑡ℎ percentile at horizon 𝑡;
Φ−1(𝑝) is the inverse cumulative distribution function of the standard normal distribution;
𝜇𝐹(𝑙𝑙𝑙𝑙) is the sample mean of the non-overlapping one-year log
volatilities for index 𝐹;
𝜎𝐹(𝑙𝑙𝑙𝑙) is the sample standard deviation of the non-overlapping one-
year log volatilities for index 𝐹;
𝜇𝑇𝑇𝑇(𝑙𝑙𝑙𝑙) is the sample mean of the non-overlapping one-year log
volatilities for the TSX; and
𝜎𝑇𝑇𝑇(𝑙𝑙𝑙𝑙) is the sample standard deviation of the non-overlapping one-
year log volatilities for the TSX.
The non-overlapping one-year log volatilities are the natural logarithm of the sample standard deviations of non-overlapping one-year monthly log returns obtained by starting at the end of the data period and working backwards. The sample standard deviations for the TSX and the index would be calculated using the longest common historical period available with the end date of December 2015.
The maximum value of 0.40 for the Sharpe ratio in case 2 has been established by considering historical values for the TSX and the S&P 500. These historical values are presented in appendix A.
The MSCI EAFE is an example of an index falling under case 1, as a well-diversified basket of

Research Paper May 2017
21
L1 indices typically represents about 75 percent of this index. The TSX and S&P 500 indices also fall under case 1 as they are L1 indices of large economies. The actuary would apply judgment for determining whether an economy is large enough or whether a basket of L1 indices is diversified enough for falling under case 1.
The Hang Seng, Topix, and NASDAQ are examples of indices that fall under case 2. They are not broad-based indices of developed non-Asian economies nor are they small capitalization indices, but long-time series of data are available for these indices.
The Shanghai Composite is an example of an index that falls under case 3. It is not an L1 index nor an L2 index, and data are only available since 1991.
7 References Canadian Institute of Actuaries. Calibration of Equity Returns for Segregated Fund Liabilities Research Paper, 2012.
Christoffersen P., Jacobs K., and Mimouni K., “Volatility Dynamics for the S&P500: Evidence from Realized Volatility, Daily Returns, and Option Prices,” The Review of Financial Studies, The Society for Financial Studies, 2010.

Research Paper May 2017
22
Appendix A: Equity Return Results Left-Tail Accumulation Factors
L1 Indices:
2.5th 5th 10th 2.5th 5th 10th 2.5th 5th 10th 2.5th 5th 10thEmpirical 0.71 0.80 0.88Bootstrap 3-months 0.76 0.82 0.88 0.72 0.82 0.95 0.82 0.98 1.20 1.26 1.62 2.14Bootstrap 6-months 0.74 0.80 0.87 0.70 0.80 0.93 0.79 0.94 1.17 1.17 1.53 2.05Bootstrap 12-months 0.74 0.82 0.88 0.71 0.81 0.94 0.80 0.96 1.19 1.25 1.59 2.10LN Model 0.81 0.85 0.89 0.78 0.87 0.99 0.91 1.06 1.26 1.44 1.78 2.29RS2LN model 0.72 0.79 0.88 0.63 0.75 0.90 0.69 0.86 1.11 1.01 1.38 1.92RS2DD1 model 0.74 0.81 0.88 0.86 0.94 1.04 1.10 1.23 1.39 1.93 2.24 2.68CSVL model 0.75 0.82 0.89 0.68 0.80 0.95 0.77 0.94 1.18 1.17 1.54 2.08
2.5th 5th 10th 2.5th 5th 10th 2.5th 5th 10th 2.5th 5th 10thEmpirical 0.71 0.82 0.89Bootstrap 3-months 0.79 0.85 0.91 0.81 0.91 1.04 0.99 1.16 1.40 1.75 2.19 2.81Bootstrap 6-months 0.77 0.84 0.90 0.78 0.89 1.02 0.95 1.13 1.37 1.64 2.07 2.72Bootstrap 12-months 0.76 0.84 0.89 0.76 0.87 1.02 0.93 1.11 1.36 1.62 2.07 2.72LN Model 0.83 0.86 0.91 0.85 0.94 1.06 1.05 1.21 1.43 1.86 2.29 2.90RS2LN model 0.76 0.82 0.89 0.73 0.84 0.99 0.86 1.05 1.30 1.45 1.89 2.55RS2DD1 model 0.77 0.84 0.91 0.90 1.00 1.12 1.21 1.37 1.57 2.38 2.79 3.35CSVL model 0.75 0.81 0.89 0.64 0.77 0.93 0.70 0.89 1.15 1.02 1.39 1.95
TSX - Jan '56 - Dec '15
S&P500 - Jan '56 - Dec '151 year 5 years 10 years 20 years
1 year 5 years 10 years 20 years
2.5th 5th 10th 2.5th 5th 10th 2.5th 5th 10th 2.5th 5th 10thEmpirical 0.66 0.79 0.88Bootstrap 3-months 0.76 0.82 0.88 0.77 0.88 1.03 0.95 1.16 1.43 1.80 2.34 3.18Bootstrap 6-months 0.73 0.80 0.88 0.73 0.85 1.00 0.90 1.10 1.40 1.66 2.21 3.06Bootstrap 12-months 0.72 0.82 0.89 0.69 0.83 1.01 0.86 1.08 1.39 1.58 2.17 3.06LN model 0.79 0.83 0.89 0.80 0.90 1.05 1.01 1.20 1.48 1.94 2.49 3.33RS2LN model 0.72 0.82 0.90 0.65 0.81 1.01 0.78 1.02 1.37 1.45 2.05 2.99RS2DD1 model 0.69 0.78 0.89 0.85 0.95 1.08 1.17 1.34 1.57 2.43 2.92 3.62CSVL model 0.72 0.80 0.88 0.64 0.79 0.98 0.75 0.98 1.29 1.27 1.81 2.63
FTSE - Jan '56 - Dec '151 year 5 years 10 years 20 years
2.5th 5th 10th 2.5th 5th 10th 2.5th 5th 10th 2.5th 5th 10thEmpirical 0.68 0.74 0.83Bootstrap 3-months 0.76 0.82 0.88 0.71 0.81 0.94 0.80 0.94 1.15 1.17 1.48 1.93Bootstrap 6-months 0.74 0.80 0.87 0.68 0.78 0.91 0.75 0.90 1.11 1.05 1.36 1.83Bootstrap 12-months 0.70 0.77 0.85 0.64 0.75 0.88 0.69 0.85 1.07 0.98 1.28 1.75LN model 0.81 0.85 0.90 0.78 0.87 0.98 0.89 1.03 1.22 1.35 1.66 2.10RS2LN model 0.72 0.78 0.86 0.62 0.73 0.87 0.66 0.81 1.03 0.89 1.19 1.65RS2DD1 model 0.74 0.79 0.86 0.76 0.84 0.94 0.92 1.03 1.19 1.44 1.70 2.07CSVL model 0.78 0.84 0.91 0.76 0.87 1.02 0.90 1.09 1.34 1.53 1.96 2.59
EAFE - Dec '69 - Dec '151 year 5 years 10 years 20 years
Research Paper May 2017
23
L2 Index:
Other Indices:
Goodness of Fit L1 Indices:
2.5th 5th 10th 2.5th 5th 10th 2.5th 5th 10th 2.5th 5th 10thEmpirical 0.67 0.76 0.85Bootstrap 3-months 0.70 0.77 0.84 0.65 0.77 0.93 0.76 0.97 1.25 1.33 1.83 2.66Bootstrap 6-months 0.71 0.77 0.85 0.66 0.78 0.94 0.78 0.98 1.27 1.37 1.87 2.70Bootstrap 12-months 0.70 0.79 0.86 0.69 0.81 0.97 0.84 1.04 1.33 1.52 2.06 2.90LN model 0.75 0.80 0.86 0.72 0.83 0.98 0.87 1.06 1.34 1.58 2.10 2.92RS2LN model 0.67 0.75 0.84 0.59 0.72 0.90 0.67 0.89 1.20 1.15 1.65 2.50RS2DD1 model 0.70 0.76 0.85 0.87 0.98 1.11 1.25 1.42 1.66 2.72 3.25 4.01CSVL model 0.63 0.72 0.82 0.41 0.56 0.75 0.38 0.56 0.83 0.43 0.72 1.23
Russell - Jan '56 - Dec '151 year 5 years 10 years 20 years
2.5th 5th 10th 2.5th 5th 10th 2.5th 5th 10th 2.5th 5th 10thEmpirical 0.66 0.74 0.81Bootstrap 3-months 0.72 0.77 0.84 0.61 0.70 0.83 0.62 0.76 0.95 0.77 1.03 1.41Bootstrap 6-months 0.70 0.76 0.83 0.58 0.67 0.80 0.57 0.71 0.90 0.70 0.94 1.32Bootstrap 12-months 0.70 0.76 0.82 0.56 0.65 0.78 0.54 0.68 0.88 0.65 0.89 1.26LN model 0.76 0.80 0.86 0.66 0.75 0.87 0.69 0.82 1.01 0.90 1.16 1.54RS2LN model 0.72 0.77 0.84 0.58 0.68 0.81 0.57 0.71 0.91 0.71 0.95 1.35RS2DD1 model 0.71 0.77 0.84 0.57 0.68 0.84 0.59 0.76 0.99 0.79 1.10 1.53CSVL model 0.73 0.79 0.86 0.62 0.74 0.88 0.66 0.82 1.06 0.91 1.22 1.71
Topix - Jan '56 - Dec '151 year 5 years 10 years 20 years
2.5th 5th 10th 2.5th 5th 10th 2.5th 5th 10th 2.5th 5th 10thEmpirical 0.44 0.59 0.77Bootstrap 3-months 0.56 0.64 0.75 0.44 0.57 0.77 0.49 0.70 1.06 0.85 1.41 2.49Bootstrap 6-months 0.55 0.65 0.76 0.45 0.59 0.79 0.51 0.72 1.08 0.90 1.47 2.57Bootstrap 12-months 0.50 0.63 0.80 0.42 0.57 0.78 0.47 0.70 1.07 0.83 1.42 2.56LN model 0.61 0.67 0.76 0.49 0.62 0.80 0.55 0.76 1.11 1.00 1.58 2.68RS2LN model 0.53 0.63 0.76 0.39 0.54 0.76 0.44 0.65 1.04 0.77 1.33 2.47RS2DD1 model 0.57 0.66 0.76 0.56 0.67 0.82 0.70 0.87 1.12 1.26 1.68 2.40CSVL model 0.61 0.71 0.83 0.56 0.76 1.03 0.76 1.13 1.71 2.00 3.38 5.98
Hang Seng - Dec '69 - Dec '151 year 5 years 10 years 20 years
719 719Model # Param. Log-likelihood AIC SBC Log-likelihood AIC SBC
LN 2 1221.4 1219.4 1214.8 1254.6 1252.6 1248.0RS2LN 6 1277.2 1271.2 1257.4 1293.7 1287.7 1274.0
RS2DD1 8 1281.9 1273.9 1255.6 1303.1 1295.1 1276.7CSVL 5 1288.0 1283.0 1271.5 1320.1 1315.1 1303.7
Jan '56 - Dec '15 TSX S&P500# data points # data points
Research Paper May 2017
24
L2 Index:
Mean, Volatility, and Sharpe Ratio
719Model # Param. Log-likelihood AIC SBC
LN 2 1111.9 1109.9 1105.3RS2LN 6 1193.6 1187.6 1173.8
RS2DD1 8 1197.9 1189.9 1171.5CSVL 5 1220.2 1215.2 1203.7
# data pointsJan '56 - Dec '15 FTSE
552Model # Param. Log-likelihood AIC SBC
LN 2 966.2 964.2 959.9RS2LN 6 1019.9 1013.9 1001.0
RS2DD1 8 1022.1 1014.1 996.8CSVL 5 1022.8 1017.8 1007.1
Dec '69 - Dec '15 EAFE# data points
719Model # Param. Log-likelihood AIC SBC
LN 2 1018.1 1016.1 1011.5RS2LN 6 1068.1 1062.1 1048.3
RS2DD1 8 1080.6 1072.6 1054.2CSVL 5 1093.6 1088.6 1077.2
# data pointsRussell 2000Jan '56 - Dec '15
LN RS2LN RS2DD1 CSVLE[y] 10.19% 10.47% 9.15% 9.98%σy 16.99% 17.89% 16.03% 16.42%
Sharpe ratio 0.364 0.362 0.321 0.364
LN RS2LN RS2DD1 CSVLE[y] 11.18% 11.35% 10.60% 9.74%σy 16.36% 17.08% 15.45% 16.40%
Sharpe ratio 0.439 0.430 0.427 0.350
Jan '56 - Dec '15
Jan '56 - Dec '15
TSX
S&P 500
Research Paper May 2017
25
Appendix B: Equity Volatility Results
Right-Tail of Annualized Standard Deviation of One-Month Returns L1 Indices:
90th 95th 97.5th 90th 95th 97.5th 90th 95th 97.5th 90th 95th 97.5thBootstrap 3-months 20.77% 25.55% 27.98% 18.52% 19.59% 20.54% 17.59% 18.33% 19.00% 16.95% 17.46% 17.91%Bootstrap 6-months 21.36% 26.18% 28.41% 18.68% 19.80% 20.76% 17.73% 18.49% 19.13% 17.05% 17.58% 18.04%Bootstrap 12-months 21.87% 27.56% 29.59% 18.94% 20.14% 21.11% 17.94% 18.73% 19.40% 17.18% 17.74% 18.23%LN Model 18.58% 19.85% 20.96% 17.10% 17.64% 18.11% 16.66% 17.04% 17.37% 16.33% 16.59% 16.82%RS2LN model 21.95% 25.16% 27.78% 19.12% 20.45% 21.60% 18.10% 19.02% 19.84% 17.33% 17.97% 18.53%RS2DD1 model 22.34% 25.50% 28.06% 19.21% 20.51% 21.63% 18.12% 19.02% 19.81% 17.33% 17.95% 18.50%CSVL model 21.49% 24.59% 27.67% 19.21% 20.89% 22.47% 18.28% 19.45% 20.51% 17.51% 18.29% 18.99%Heston 20.48% 22.56% 24.55% 18.52% 19.70% 20.76% 17.76% 18.58% 19.28% 17.10% 17.67% 18.18%
90th 95th 97.5th 90th 95th 97.5th 90th 95th 97.5th 90th 95th 97.5thBootstrap 3-months 19.48% 22.63% 25.63% 17.46% 18.46% 19.32% 16.63% 17.30% 17.90% 16.07% 16.51% 16.91%Bootstrap 6-months 19.75% 23.23% 26.95% 17.72% 18.75% 19.66% 16.82% 17.54% 18.16% 16.20% 16.69% 17.11%Bootstrap 12-months 20.04% 22.48% 28.99% 18.02% 19.04% 19.99% 17.02% 17.76% 18.46% 16.34% 16.85% 17.31%LN Model 17.75% 18.96% 20.02% 16.33% 16.85% 17.31% 15.92% 16.28% 16.59% 15.60% 15.86% 16.07%RS2LN model 20.46% 22.86% 24.88% 17.75% 18.79% 19.68% 16.91% 17.63% 18.26% 16.27% 16.78% 17.22%RS2DD1 model 20.15% 22.58% 24.60% 17.82% 19.01% 20.07% 16.99% 17.82% 18.59% 16.34% 16.92% 17.45%CSVL model 21.73% 25.28% 28.72% 19.82% 21.82% 23.83% 18.85% 20.30% 21.76% 17.99% 18.99% 19.95%
90th 95th 97.5th 90th 95th 97.5th 90th 95th 97.5th 90th 95th 97.5thBootstrap 3-months 23.53% 28.55% 36.23% 23.10% 25.89% 27.32% 21.83% 23.18% 24.38% 20.63% 21.61% 22.48%Bootstrap 6-months 23.47% 29.72% 36.95% 23.20% 27.05% 28.55% 22.39% 23.84% 25.18% 20.97% 22.06% 23.02%Bootstrap 12-months 22.49% 27.69% 37.21% 23.19% 28.90% 30.28% 23.28% 24.71% 26.02% 21.34% 22.65% 23.75%LN model 21.70% 23.19% 24.49% 19.96% 20.60% 21.16% 19.45% 19.90% 20.28% 19.07% 19.38% 19.65%RS2LN model 25.09% 32.58% 38.22% 23.88% 26.47% 28.70% 22.37% 24.11% 25.64% 21.13% 22.31% 23.36%RS2DD1 model 26.61% 33.88% 39.14% 24.36% 26.83% 28.94% 22.66% 24.32% 25.78% 21.36% 22.48% 23.49%CSVL model 25.56% 30.05% 34.53% 23.15% 25.66% 28.16% 21.93% 23.76% 25.50% 20.91% 22.15% 23.34%
FTSE - Jan '56 - Dec '151 year 5 years 10 years 20 years
20 years10 yearsTSX - Jan '56 - Dec '15
1 year 5 years
S&P500 - Jan '56 - Dec '151 year 5 years 10 years 20 years
90th 95th 97.5th 90th 95th 97.5th 90th 95th 97.5th 90th 95th 97.5thBootstrap 3-months 19.88% 23.02% 24.80% 17.32% 18.23% 18.99% 16.54% 17.16% 17.70% 15.98% 16.43% 16.79%Bootstrap 6-months 20.54% 23.50% 25.35% 17.51% 18.47% 19.26% 16.68% 17.34% 17.90% 16.08% 16.54% 16.94%Bootstrap 12-months 20.69% 24.78% 26.47% 17.81% 18.84% 19.70% 16.91% 17.61% 18.22% 16.24% 16.75% 17.16%LN model 17.63% 18.83% 19.89% 16.22% 16.74% 17.19% 15.81% 16.17% 16.48% 15.49% 15.75% 15.97%RS2LN model 20.58% 22.74% 24.59% 17.70% 18.65% 19.48% 16.86% 17.54% 18.13% 16.22% 16.70% 17.12%RS2DD1 model 20.85% 23.02% 24.88% 17.84% 18.80% 19.63% 16.95% 17.62% 18.21% 16.27% 16.76% 17.17%CSVL model 19.90% 22.76% 25.49% 17.68% 19.09% 20.45% 16.83% 17.81% 18.74% 16.14% 16.82% 17.45%
20 years10 yearsEAFE - Dec '69 - Dec '15
1 year 5 years
Research Paper May 2017
26
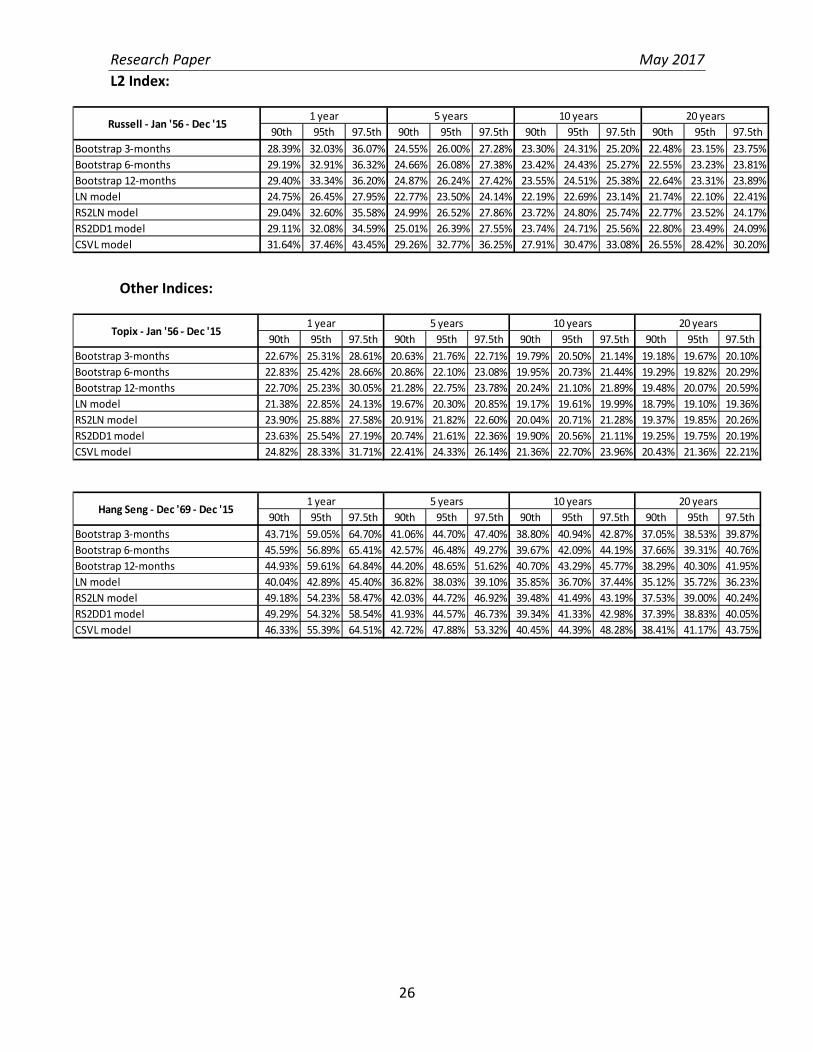
L2 Index:
Other Indices:
90th 95th 97.5th 90th 95th 97.5th 90th 95th 97.5th 90th 95th 97.5thBootstrap 3-months 28.39% 32.03% 36.07% 24.55% 26.00% 27.28% 23.30% 24.31% 25.20% 22.48% 23.15% 23.75%Bootstrap 6-months 29.19% 32.91% 36.32% 24.66% 26.08% 27.38% 23.42% 24.43% 25.27% 22.55% 23.23% 23.81%Bootstrap 12-months 29.40% 33.34% 36.20% 24.87% 26.24% 27.42% 23.55% 24.51% 25.38% 22.64% 23.31% 23.89%LN model 24.75% 26.45% 27.95% 22.77% 23.50% 24.14% 22.19% 22.69% 23.14% 21.74% 22.10% 22.41%RS2LN model 29.04% 32.60% 35.58% 24.99% 26.52% 27.86% 23.72% 24.80% 25.74% 22.77% 23.52% 24.17%RS2DD1 model 29.11% 32.08% 34.59% 25.01% 26.39% 27.55% 23.74% 24.71% 25.56% 22.80% 23.49% 24.09%CSVL model 31.64% 37.46% 43.45% 29.26% 32.77% 36.25% 27.91% 30.47% 33.08% 26.55% 28.42% 30.20%
Russell - Jan '56 - Dec '151 year 5 years 10 years 20 years
90th 95th 97.5th 90th 95th 97.5th 90th 95th 97.5th 90th 95th 97.5thBootstrap 3-months 22.67% 25.31% 28.61% 20.63% 21.76% 22.71% 19.79% 20.50% 21.14% 19.18% 19.67% 20.10%Bootstrap 6-months 22.83% 25.42% 28.66% 20.86% 22.10% 23.08% 19.95% 20.73% 21.44% 19.29% 19.82% 20.29%Bootstrap 12-months 22.70% 25.23% 30.05% 21.28% 22.75% 23.78% 20.24% 21.10% 21.89% 19.48% 20.07% 20.59%LN model 21.38% 22.85% 24.13% 19.67% 20.30% 20.85% 19.17% 19.61% 19.99% 18.79% 19.10% 19.36%RS2LN model 23.90% 25.88% 27.58% 20.91% 21.82% 22.60% 20.04% 20.71% 21.28% 19.37% 19.85% 20.26%RS2DD1 model 23.63% 25.54% 27.19% 20.74% 21.61% 22.36% 19.90% 20.56% 21.11% 19.25% 19.75% 20.19%CSVL model 24.82% 28.33% 31.71% 22.41% 24.33% 26.14% 21.36% 22.70% 23.96% 20.43% 21.36% 22.21%
90th 95th 97.5th 90th 95th 97.5th 90th 95th 97.5th 90th 95th 97.5thBootstrap 3-months 43.71% 59.05% 64.70% 41.06% 44.70% 47.40% 38.80% 40.94% 42.87% 37.05% 38.53% 39.87%Bootstrap 6-months 45.59% 56.89% 65.41% 42.57% 46.48% 49.27% 39.67% 42.09% 44.19% 37.66% 39.31% 40.76%Bootstrap 12-months 44.93% 59.61% 64.84% 44.20% 48.65% 51.62% 40.70% 43.29% 45.77% 38.29% 40.30% 41.95%LN model 40.04% 42.89% 45.40% 36.82% 38.03% 39.10% 35.85% 36.70% 37.44% 35.12% 35.72% 36.23%RS2LN model 49.18% 54.23% 58.47% 42.03% 44.72% 46.92% 39.48% 41.49% 43.19% 37.53% 39.00% 40.24%RS2DD1 model 49.29% 54.32% 58.54% 41.93% 44.57% 46.73% 39.34% 41.33% 42.98% 37.39% 38.83% 40.05%CSVL model 46.33% 55.39% 64.51% 42.72% 47.88% 53.32% 40.45% 44.39% 48.28% 38.41% 41.17% 43.75%
Hang Seng - Dec '69 - Dec '151 year 5 years
Topix - Jan '56 - Dec '151 year 5 years 10 years 20 years
10 years 20 years

Research Paper May 2017
27
Appendix C: L1 Broad-Based Indices
Economies included in L1 Index Americas Europe and Middle East Pacific
Canada Austria Italy Australia United States Belgium Netherlands Hong Kong
Denmark Norway Japan Finland Portugal New Zealand France Spain Singapore Germany Sweden Ireland Switzerland Israel United Kingdom
Research Paper May 2017
28
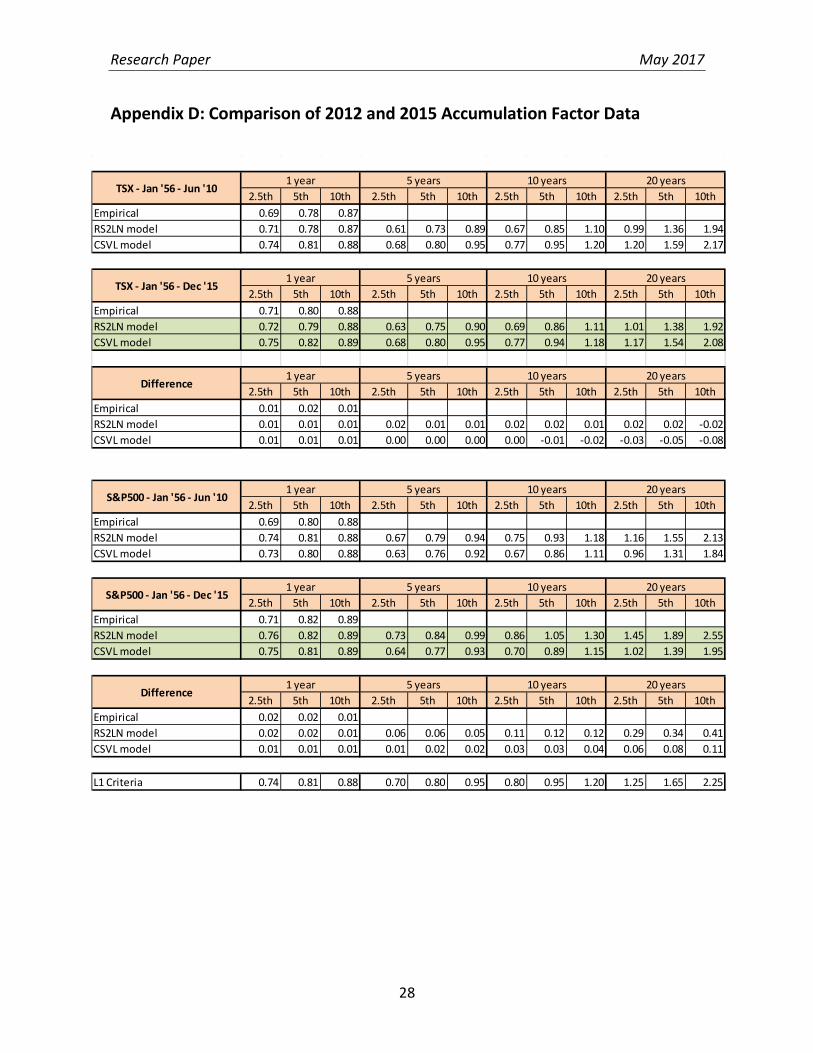
Appendix D: Comparison of 2012 and 2015 Accumulation Factor Data
2.5th 5th 10th 2.5th 5th 10th 2.5th 5th 10th 2.5th 5th 10thEmpirical 0.69 0.78 0.87RS2LN model 0.71 0.78 0.87 0.61 0.73 0.89 0.67 0.85 1.10 0.99 1.36 1.94CSVL model 0.74 0.81 0.88 0.68 0.80 0.95 0.77 0.95 1.20 1.20 1.59 2.17
2.5th 5th 10th 2.5th 5th 10th 2.5th 5th 10th 2.5th 5th 10thEmpirical 0.71 0.80 0.88RS2LN model 0.72 0.79 0.88 0.63 0.75 0.90 0.69 0.86 1.11 1.01 1.38 1.92CSVL model 0.75 0.82 0.89 0.68 0.80 0.95 0.77 0.94 1.18 1.17 1.54 2.08
2.5th 5th 10th 2.5th 5th 10th 2.5th 5th 10th 2.5th 5th 10thEmpirical 0.01 0.02 0.01RS2LN model 0.01 0.01 0.01 0.02 0.01 0.01 0.02 0.02 0.01 0.02 0.02 -0.02CSVL model 0.01 0.01 0.01 0.00 0.00 0.00 0.00 -0.01 -0.02 -0.03 -0.05 -0.08
2.5th 5th 10th 2.5th 5th 10th 2.5th 5th 10th 2.5th 5th 10thEmpirical 0.69 0.80 0.88RS2LN model 0.74 0.81 0.88 0.67 0.79 0.94 0.75 0.93 1.18 1.16 1.55 2.13CSVL model 0.73 0.80 0.88 0.63 0.76 0.92 0.67 0.86 1.11 0.96 1.31 1.84
2.5th 5th 10th 2.5th 5th 10th 2.5th 5th 10th 2.5th 5th 10thEmpirical 0.71 0.82 0.89RS2LN model 0.76 0.82 0.89 0.73 0.84 0.99 0.86 1.05 1.30 1.45 1.89 2.55CSVL model 0.75 0.81 0.89 0.64 0.77 0.93 0.70 0.89 1.15 1.02 1.39 1.95
2.5th 5th 10th 2.5th 5th 10th 2.5th 5th 10th 2.5th 5th 10thEmpirical 0.02 0.02 0.01RS2LN model 0.02 0.02 0.01 0.06 0.06 0.05 0.11 0.12 0.12 0.29 0.34 0.41CSVL model 0.01 0.01 0.01 0.01 0.02 0.02 0.03 0.03 0.04 0.06 0.08 0.11
L1 Criteria 0.74 0.81 0.88 0.70 0.80 0.95 0.80 0.95 1.20 1.25 1.65 2.25
Difference1 year 5 years 10 years 20 years
1 year 5 years 10 years 20 years
Difference1 year 5 years 10 years 20 years
TSX - Jan '56 - Dec '151 year 5 years 10 years 20 years
TSX - Jan '56 - Jun '10
S&P500 - Jan '56 - Dec '151 year 5 years 10 years 20 years
1 year 5 years 10 years 20 years
S&P500 - Jan '56 - Jun '10


