Research Paper 50 SD X54 - Oregon State University · Research Paper 50 March 1987 SD X54 ......
21
Research Paper 50 March 1987 SD X54 Unbound issue 1 Or?2Does not circulate YU ro c EQUATIONS FOR PREDICTING HEIGHT TO CROWN BASE FOR FOURTEEN TREE SPECIES IN SOUTHWEST OREGON Martin W. Ritchie David W. Hann q5161T17 cr) co 01V s 11F0F6Z El FORM RE/EARCH LAS College of Forestry Oregon State University
Transcript of Research Paper 50 SD X54 - Oregon State University · Research Paper 50 March 1987 SD X54 ......

Research Paper 50 March 1987
SDX54
Unbound issue
1
Or?2Does not circulate
YU
roc
EQUATIONS FOR PREDICTINGHEIGHT TO CROWN BASE FORFOURTEEN TREE SPECIES INSOUTHWEST OREGON
Martin W. RitchieDavid W. Hann
q5161T17
cr)co 01Vs
11F0F6Z
El FORM RE/EARCH LAS
College of Forestry Oregon State University

The Forest Research Laboratory of Oregon State University wasestablished by the Oregon Legislature to conduct research leadingto expanded forest yields, increased use of forest products, andaccelerated economic development of the State. Its scientists con-duct this research in laboratories and forests administered by theUniversity and cooperating agencies and industries throughoutOregon. Research results are made available to potential usersthrough the University's educational programs and through Labora-tory publications such as this, which are directed as appropriate toforest landowners and managers, manufacturers and users of forestproducts, leaders of government and industry, the scientificcommunity, and the general public.
As a research paper, this publication is one of a series thatdescribes a completed study or experiment or lists publications ona specific basis.
The AuthorsMartin W. Ritchie is a research assistant, Department of ForestScience, and David W. Harm is an associate professor of forestbiometry. Department of Forest Management, Oregon StateUniversity, Corvallis.
Acknowledgments
This study was conducted as part of the Forestry IntensifiedResearch (FIR) Program, a cooperative effort of Oregon StateUniversity, the USDA Forest Service, and the USDI Bureau of LandManagement. We thank Boise Cascade Corporation and MedfordCorporation for their special assistance.
To Order Copies
Copies of this and other Forest Research Laboratory publicationsare available from:
Forestry Business OfficeCollege of ForestryOregon State UniversityCorvallis, Oregon 97331
Please include author(s), title, and publication number if known.

EQUATIONS FOR PREDICTINGHEIGHT TO CROWN BASE FORFOURTEEN TREE SPECIES INSOUTHWEST OREGON
Martin W. RitchieDavid W. Hann

CONTENTS
1 Abstract2 Introduction3 Data6 Analysis and Results
6 Equation Selection7 Variable Selection and Weighting7 Parameter Estimates
8 Discussion8 Evaluating the Equations
11 Projecting Crown Change12 Summary12 Literature Cited
11

ABSTRACT
Equations are presented for predicting height to crown base (orbole ratio) for fourteen species of trees common to themixed-conifer zone of southwest Oregon. Nonlinear regressionwas used to fit a weighted logistic function for each species. Theindependent variables include height, crown competition factor inlarger trees, stand basal area, site index, and diameter divided byheight. Although a number of alternative model forms wereconsidered, the logistic function was found to fit the data best.Validation of the model indicated possible difficulties withponderosa pine and golden chinkapin, but these problems areprobably due to inconsistencies in the validation data rather thanshortcomings in the individual models.
INTRODUCTION
A tree's capacity for growth is largely determined by thequantity of its foliage. This quantity can be characterized by leafarea or foliage weight; but, because these variables are difficult tomeasure, live absolute crown length or relative crown length(crown ratio) are often used as surrogates in individual-treegrowth equations (Stage 1973, Daniels and Burkhart 1975,Krumland 1982, Ritchie and Hann 1985, Wensel and Koehler 1985).In that context, a crown ratio of 1.0 indicates the maximum leafarea or foliage weight attainable for a tree of a given height; avalue approaching zero indicates a restricted crown and impliesthat growth is constrained by the relative lack of foliage. Morerecently, crown ratio estimates have been used as predictorvariables in taper equations (Walters and Harm 1986).
I

In growth simulations, where projections for a given period arebased on stand and tree variables at the beginning of that period,the crown-ratio term in component growth equations must beupdated for each successive projection period. If crown changecannot be predicted directly (e.g., Maguire 1986), static equationsfor predicting height to crown base can be used to simulate thischange (Stage 1973, Daniels and Burkhart 1975, Van Deusen andBiging 1985). Change in crown ratio can then be predicted by
aCR = (CRH + AH - AHCB]/[H + AH] - CR
whereACR = change in crown ratioH = total tree height at start of growth periodCR = crown ratio at start of growth periodAH = change in tree heightAHCB = change in height to crown base (calculated with static
crown equations)
Static crown equations can also replace missing crownmeasurements so that growth simulations can be made from datathat lack values for either crown ratio or height to crown base.
The goal of this study was to develop species-specific staticequations for predicting height to crown base. These equations arepart of an individual tree, distance-independent (Munro 1974)stand simulator currently being developed for the mixed-coniferregion of southwest Oregon. The fourteen species considered inthe present analysis are:
Douglas-fir (Pseudotsuga menziesii [Mirb.] Franco)Grand fir (Abies grandis [Dougl.] Lindl.)White fir (Abies concolor [Gord. and Glend.] Lindl.)Ponderosa pine (Pines ponderosa Laws.)Sugar pine (Pines lambertiana Dougl.)Incense-cedar (Calocedrus decurrens [Tory.] Florin.)Western hemlock (Tsuga heterophylla [Raf.] Sarg.)Golden chinkapin (Castanopsis chrysophylla [Dougl.] A.DC.)Tanoak (Lithocarpus densiflorus [Hook and Am.] Rehd.)Pacific madrone (Arbutus menziesii Pursh.)Canyon live oak (Quercus chrysolepis Liebm.)California black oak (Quercus keiloggli Newb.)Oregon white oak (Quercus garryana Dougl.)Bigleaf maple (Acer macrophyllum Pursh.)
2
DATA
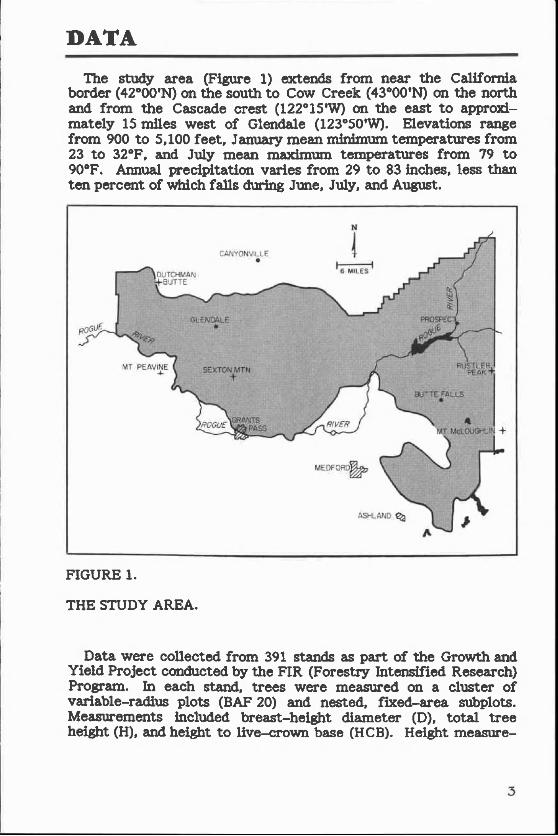
The study area (Figure 1) extends from near the Californiaborder (42°00'N) on the south to Cow Creek (43°00'N) on the northand from the Cascade crest (122°15W) on the east to approxi-mately 15 miles west of Glendale (123°50'W). Elevations rangefrom 900 to 5,100 feet, January mean minimum temperatures from23 to 32°F, and July mean maximum temperatures from 79 to90°F. Annual precipitation varies from 29 to 83 inches, less thanten percent of which falls during June, July, and August.
FIGURE 1.
THE STUDY AREA.
Data were collected from 391 stands as part of the Growth andYield Project conducted by the FIR (Forestry Intensified Research)Program. In each stand, trees were measured on a cluster ofvariable-radius plots (BAF 20) and nested, fixed-area subplots.Measurements included breast height diameter (D), total treeheight (H), and height to live-crown base (HCB). Height measure-
3

meets were taken by the tangent method (Curtis and Bruce 1968).Calculations for each plot included site index (SI) (from Harm andScrivani 1987). crown competition factor (CCF) (from Krajicek etal. 1961). and stand basal area (SBA) in square feet per acre.Maximum crown width values for CCF were estimated from equa-tions by Paine and Hann (1982).
In preparation for analysis, each plot was designated for eithermodeling or validation. Validation plots were selected to cover abroad range of stand ages, densities (basal area), and site indices.To ensure that crowns had stabilized, 126 of the 391 sampledstands were eliminated from the analysis because they had beenthinned within the last 20 years. Of the remaining plots, 237 wereused for modeling and 28 for validation.
In the modeling data, breast height stand age ranged from 13 to138 years and averaged 56 years; stand basal area ranged from 16to 400 ft2/acre and averaged 200 ft2/acre; and site index rangedfrom 50 to 140 feet and averaged 90 feet.
In the validation data, breast height stand age ranged from 18to 83 years and averaged 37 years; stand basal area ranged from 42to 300 ft2/acre and averaged 190 ft2/acre; and site index rangedfrom 59 to 130 feet and averaged 90 feet.
A summary, by species, of data for trees taller than breastheight (i.e., H > 4.5 ft) is presented in Table 1. Only eight speciesare represented in the validation data; data for the remainingspecies were insufficient for validation, and were thereforecombined with the modeling data to strengthen the data base forthose species.
4

TABLE 1.
SUMMARY, BY SPECIES, OF DATA USED IN DEVELOPING AND VALIDATING A MODEL FOR HEIGHT TO CROWN BASE.
Ul
Numberof obser- Height (ft) Diameter (in) Crown ratio
Species vations Range Mean Range Mean Range Mean
Modeling data
Douglas-fir 9778 4.5-210.3 74.4 0.1-84.0 12.8 0.006-0.996 0.467
Grand/white fir 1354 4.5-193.3 68.8 0.1-53.2 11.8 0.009-0.997 0.503
Ponderosa pine 959 4.5-192.2 76.1 0.1-55.8 15.2 0.031-0.949 0.441
Sugar pine 223 4.5-170.5 80.1 0.1-60.8 18.7 0.095-0.928 0.474
Incense-cedar 1008 4.5-165.0 30.2 0.1-67.1 7.0 0.024-0.977 0.482
Western hemlock 53 4.6-117.9 42.5 0.1-23.4 7.0 0.016-0.943 0.604
Golden chinkapin 766 4.5-89.2 19.1 0.1-27.6 3.1 0.031-0.957 0.433
Tanoak 337 4.5-65.0 13.5 0.1-13.0 1.6 0.057-0.875 0.450
Pacific madrone 713 4.6-107.5 40.7 0.1-42.1 7.8 0.005-0.958 0.398
Canyon live oak 205 4.7-57.9 17.7 0.1-10.3 3.1 0.071-0.989 0.518
California black oak 250 4.5-111.1 41.3 0.1-43.7 10.7 0.053-0.942 0.377
Oregon white oak 37 5.5-55.8 26.6 0.2-24.5 6.3 0.063-0.655 0.377
Bigleaf maple 47 4.9-91.3 46.8 0.2-20.0 6.9 0.114-0.714 0.356
Validation data
Douglas-fir 1084 4.6-198.5 74.6 0.1-70.4 12.4 0.080-0.950 0.478
Grand/white fir 186 4.7-156.8 65.2 0.1-39.6 10.7 0.061-0.977 0.483
Ponderosa pine 142 5.4-181.3 101.6 0.3-59.8 20.1 0.018-0.895 0.451
Sugar pine 33 7.3-118.1 68.1 0.8-30.7 14.3 0.118-0.906 0.511
Incense-cedar 108 4.7-111.8 32.8 0.1-52.6 7.4 0.160-0.896 0.562
Golden chinkapin 105 4.5-70.5 14.9 0.1-14.6 2.1 0.067-0.775 0.355
Tanoak 38 4.5-38.7 12.1 0.1-6.2 1.3 0.115-0.852 0.500
Pacific madrone 96 4.7-95.2 38.3 0.1-25.0 7.3 0.051-0.941 0.366

ANALYSIS AND RESULTS
Equation Selection
For this analysis, the first height-to-crown-base equation to beconsidered was the general equation presented by Wykoff et at.(1982), which is a logarithmic equation for crown ratio, fit throughordinary least squares.
kln(CR) _ bjXj
i=1where
bi = parameter estimateXi = predictor variablek = maximum number of parameters in the equation.
If this equation is expressed in the nonlinear form
kHCB = H [1.0 - exp biXi)],
i=1[1]
values of HCB are constrained to be less than H but not neces-sarily greater than zero. Preliminary analysis with Douglas-firdata indicated that, in the extremes of the data range, thisequation may predict HCB to be less than zero.
A similar equation was presented by Van Deusen and Biging (1985):
kHCB = H [1.0 - exp-( biXi)2] [2]
i=1
The following logistic equation (Walters and Harm 1986) alsoprovides the desired constraints on predicted HCB:
kHCB = H/[1.0 + exp( EbiXi)]
i=1[3]
6

Hatch (1980) found little difference between equations similarto [1] and [3]. We found that [1] and [3] perform comparably, but[3] has several advantages over both [1] and [2]. First, it is betterconstrained than either, and thus should be a more reliableexpression of the true relationships between crown length and thepredictor variables; second, preliminary analyses indicated that [3]provided slightly better fits than [2] for five of the seven coniferspecies; and third, [3] is more easily interpreted than [2] becausesquaring the expression
kbiX1
i=1
in [2] causes difficulty in interpreting the signs on the parameterestimates. For these reasons, equation [3] was selected for thepresent analysis.
Variable Selection and WeightingVariables were screened by ordinary least-squares regression
applied to a linearization of the weighted equation [3]. Theselinear regressions also provided starting values for subsequentnonlinear analyses. The variables selected were tree height, crowncompetition in larger trees (CCFL), natural log of stand basalarea, diameter divided by height, and site index.
Plots of residuals about equation [3] indicated that variance inHCB increases as height increases. A weight of (1.0/H)2 waschosen to homogenize this variance. Because applying this weightis equivalent to dividing both sides of equation [3] by H (Neter etal. 1983, p. 171-172), all subsequent fits were made using boleratio (HCB/H) as the dependent variable.
Because analysis of covariance showed no significant differencebetween the grand-fir and white-fir models, data for these specieswere combined into a true-fir data set for the final analysis.
7

Parameter Estimates
The final equations were fitted separately for each species bythe use of nonlinear regression:
HCB = 1.0H [1.0+exp(b0+b1H+b2CCFL+b3.1n(SBA)+b4D/H+b5SI] [4]
whereHCB/H = predicted bole ratio = (1.0 - CR)H = total tree height (feet)CCFL = stand crown competition factor for trees whose
diameter is greater than that of the subject tree (percent)ln(SBA) = natural log of stand basal area (ft2/acre)D/H = breast height diameter (inches) divided by height (feet)SI = base age 50 site index minus 4.5 (feet).
Parameter estimates and mean squared error (weighted residuals)for all species are presented in Table 2. (Nonsignificant coeffi-cients were set to zero and appear as dashes.) Height to crownbase can be determined by multiplying the predicted bole ratio(equation [4]) by the height of the subject tree.
DISCUSSION
Evaluating the EquationsAdjusted R2 values range from 0.04 for tanoak to 0.63 for
Oregon white oak (Table 2). When calculated for height to crownbase instead of bole ratio, adjusted R2 values are much higher(about 0.80 to 0.90 for major conifer species).
Equation [4], with the coefficients presented in Table 2, wasapplied to the validation data; mean residual bole ratio andstandard deviation for eight major species are shown in Table 3. At-test was used to test for significance of mean residuals. Thet-test in model validation is often suspect because a significantscore may reflect low variance associated with the model ratherthan actual significance of the bias (Freese 1960). For this reason,a high level of significance (ac = 0.01) was chosen for these tests.
Mean bias for Douglas-fir, ponderosa pine, and golden chinkapinwas significant at the 99% confidence level, but we feel that this
8

TABLE 2.
REGRESSION COEFFICIENTS, WEIGHTED MEAN SQUARED ERRORS (MSE), AND ADJUSTED COEFFICIENTS OFDETERMINATION (R2) FOR HEIGHT-TO-CROWN-BASE MODELS, BY SPECIES.
Species b0 bl b2 b3 b4 b5 MSE R2
Douglas-fir 2.59959 -0.00725950 -0.00458228 -0.441557 1.61311 0.00467539 0.0181 0.4761Grand/white fir 2.71071 -0.00366952 -0.00455308 -0.505344 1.72963 0.00472740 0.0239 0.4506Ponderosa pine 2.34665 -0.00206403 -0.00260411 -0.622085 3.09805 0.00426037 0.0134 0.5897Sugar pine 3.33895 -0.00430671 -0.00334020 -0.550645 - - 0.0190 0.3045Incense-cedar 4.40376 - -0.00267306 -0.844515 1.08515 - 0.0247 0.5409Western hemlock 0.791433 - -0.00255926 - - - 0.0415 0.0656Golden chinkapin 1.65623 - -0.00240594 -0.355275 1.24983 - 0.0202 0.3558Tanoak - - -0.00088567 - - - 0.0278 0.0359Pacific madrone 1.98835 -0.00594721 -0.00352276 -0.342935 - - 0.0169 0.4116Canyon live oak 2.22352 - - -0.426931 - - 0.0292 0.1104California black oak 2.65524 - - -0.646829 0.728396 - 0.0278 0.1313Oregon white oak 0.361630 - -0.00647642 - - - 0.0083 0.6290Bigleaf maple 0.919152 -0.00768402 -0.00618461 - - - 0.0133 0.5303

TABLE 3.
VALIDATION OF MODELS FOR HEIGHT TO CROWN BASE OF MAJOR SPECIES.1
Species
Douglas-fir
Grand/white firPonderosa pineSugar pineIncense-cedarGolden chinkapinTanoakPacific madrone
B s N
0.0112 ** 0.1280 10840.0192 0.1757 186-0.0530 ** 0.0969 1420.0038 0.1464 33-0.0334 0.1447 1080.0831 ** 0.1774 105-0.0506 0.1588 380.0244 0.1939 96
** Significant at a = 0.01.1 B = mean residual bole ratio (observed minus predicted), s = standard deviation ofresiduals, N = munber of observations in the validation data set.
may be misleading. Mean bias and standard deviation forDouglas-fir are not appreciably different from those for otherspecies; the residual is statistically significant mainly because ofthe large sample size. In the golden chinkapin validation data,almost all trees were less than 10 feet tall, and more thanone-third were on one plot whose high elevation and low basal areaplaced it at the extremes of the data range. Similarly, a highpercentage of the trees in the ponderosa pine validation data wereon two atypically dense, high-elevation plots. When thesequestionable plots were removed from the data, mean residuals forponderosa pine and golden chinkapin were not significant. Fromthese results we conclude that significant mean residuals may bedue to abnormalities in the validation data, and that behavior ofthe model is suspect at the extremes of the modeling data.
For all species except golden chinkapin and tanoak, at least 40%of the bole-ratio predictions were within 0.10 of the true boleratio, and accuracy was much higher for Douglas-fir and ponderosa
10

pine (Table 4). Furthermore, removal of the questionable plotfrom the golden chinkapin data substantially increased theaccuracy of predictions for that species.
TABLE 4.
PERCENT OF OBSERVATIONS IN THE VALIDATION DATA WITHIN FOUR RANGESOF ABSOLUTE VALUE OF BIAS (IBI).
Species IBI <0.05 IBI <0.1 IBI <0.2 IBI <0.3
Douglas-fir 33 59 87 97Grand/white fir 18 44 75 89Ponderosa pine 33 65 93 99Sugar pine 27 48 82 94Incense-cedar 20 47 86 96Golden chinkapin 21 33 66 83Tanoak 13 34 79 89Pacific madrone 27 46 69 82
Projecting Crown Change
Although static equations are not ideal for predicting changes inheight to crown base, they offer the only available method becausedata for developing crown-change equations are lacking. A majorproblem with this use of static equations is that, in some cases,predicted HCB may decrease in response to stand-densityreductions from thinning and mortality. To ensure that HCB willeither remain constant or increase over time, we can constrain itsvalue at the end of the growth period to be greater than or equalto HCB at the beginning of the period. This procedure may resultin predictions of zero crown recession after thinning until standdensity and tree height have increased enough to offset the effectsof thinning.
11

SUMMARY
The signs on the coefficients in equation [4] indicate how boleratio will respond to changes in the predictor variables. Thus,predicted bole ratios decrease with increasing values of D/H(higher D/H values indicate greater stem taper) and increase withincreasing density (CCFL and SBA) and tree height. Of thosespecies for which the site-index coefficient is not zero (e.g.,Douglas-fir and ponderosa pine), trees on high sites will tend tohave a smaller bole ratio than those on lower sites.
If these equations are used to simulate crown recession, they willbe most reliable in stands which are more than 20 years old andwhich have not been thinned in the past 20 years. With these staticequations, crown response to thinning is assumed to be immediateand will be affected not by thinning intensity but rather by residualdensity of the stand. However, in stands that have been thinned,we can constrain our predictions such that height to crown base ismonotonically increasing over time.
LITERATURE CITED
CURTIS, R.O., and D. BRUCE. 1968. Tree heights without atape. Journal of Forestry 66:60-61.
DANIELS, R.F., and H.E. BURKHART. 1975. Simulation ofindividual tree growth and stand development in managed loblollypine plantations. Division of Forestry and Wildlife Resources,Virginia Polytechnic and State University, Blacksburg. FWS-5-75.69 p.
FREESE, F. 1960. Testing accuracy. Forest Science 6:139-145.
HANN, D.W., and J.A. SCRIVANI. 1987. Dominant height growthand site index equations for Douglas-fir and ponderosa pine insouthwest Oregon. Forest Research Laboratory, Oregon StateUniversity, Corvallis. Research Bulletin 59. 13 p.
HATCH, C.R. 1980. Modeling tree crown size using inventorydata. P. 93-99 in Growth of Single Trees and Development ofStands. K. Johann and P. Schmid-Haas, eds. Proceedings, IUFROJoint Meeting of the Working Parties. S 4.01-02, Estimation ofIncrement, and S 4.02-03, Inventories on Successive Occasions.Vienna, Austria.
12

KRAJICEK, J.E., K.A. BRINKMAN, and S.F. GINGRICH. 1961.Crown competition-a measure of density. Forest Science 7:35-42.
KRUMLAND, B. 1982. A tree based forest yield projectionsystem for the north coast region of California. Ph.D. thesis.University of California, Berkeley. 187 p.
MAGUIRE, D.M. 1986. Construction of regression models forpredicting crown development in southwestern OregonDouglas-fir. Ph.D. thesis. Oregon State University, Corvallis.201 p.
MUNRO, D. 1974. Forest growth models-a prognosis. P. 7-21 inGrowth Models for Tree and Stand Simulation. J. Fries, ed. RoyalCollege of Forestry, Stockholm. Research Note 30.
NETER, J., W. WASSERMAN, and M.H. KUTNER. 1983. Appliedlinear regression models. Richard D. Irwin, Inc., Homewood,Illinois. 547 p.
PAINE, D.P., and D.W. HANN. 1982. Maximum crown widthequations for southwestern Oregon tree species. Forest ResearchLaboratory, Oregon State University, Corvallis. Research Paper46. 20 p.
RITCHIE, M.W., and D.W. HANN. 1985. Equations for predictingbasal area increment for Douglas-fir and grand fir. ForestResearch Laboratory, Oregon State University, Corvallis.Research Bulletin 51. 9 p.
STAGE, A.R. 1973. Prognosis model for stand development.USDA Forest Service, Intermountain Forest and Range ExperimentStation, Ogden, Utah. Research Paper INT-137. 32 p.
VAN DEUSEN, P.C., and G.S. BIGING. 1985. STAG, a STAndGenerator for mixed species stands. Northern California ForestYield Cooperative, Department of Forestry and ResourceManagement, University of California, Berkeley. Research Note11. 25 p.
WALTERS, D.K., and D.W. HANN. 1986. Taper equations for sixconifer species in southwest Oregon. Forest Research Laboratory,Oregon State University, Corvallis. Research Bulletin 56. 41 p.
13

WENSEL, L.C., and J.R. KOEHLER. 1985. A tree growthprojection system for northern California coniferous forests.Northern California Forest Yield Cooperative, Department ofForestry and Resource Management, University of California,Berkeley. Research Note 12. 30 p.
WYKOFF, W.R., N.L. CROOKSTON, and A.R. STAGE. 1982.User's guide to the Stand Prognosis Model. USDA Forest Service,Intermountain Forest and Range Experiment Station, Ogden,Utah. General Technical Report INT-133. 122 p.
14

Ritchie, M.W., and D.W. Hann. 1987. EQUATIONS FOR PRE-DICTING HEIGHT TO CROWN BASE FOR FOURTEEN TREESPECIES IN SOUTHWEST OREGON. Forest Research Labora-tory, Oregon State University, Corvallis. Research Paper 50.14 p.
Equations are presented for predicting height to crown base (or bole ratio) forfourteen species of trees common to the mixed-conifer zone of southwest Oregon.Nonlinear regression was used to fit a weighted logistic function for each species.The independent variables include height, crown competition factor in larger trees,stand basal area, site index, and diameter divided by height. Although a number ofalternative model forms were considered, the logistic function was found to fit thedata best. Validation of the model indicated possible difficulties with ponderosa pineand chinkapin, but these problems are probably due to inconsistencies in thevalidation data rather than shortcomings in the individual models.
Ritchie, M.W., and D.W. Ham. 1987. EQUATIONS FOR PRE-DICTING HEIGHT TO CROWN BASE FOR FOURTEEN TREESPECIES IN SOUTHWEST OREGON. Forest Research Labora-tory, Oregon State University, Corvallis. Research Paper 50.14 p.
Equations are presented for predicting height to crown base (or bole ratio) forfourteen species of trees common to the mixed-conifer zone of southwest Oregon.Nonlinear regression was used to fit a weighted logistic function for each species.The independent variables include height, crown competition factor in larger trees,stand basal area, site index, and diameter divided by height. Although a number ofalternative model forms were considered, the logistic function was found to fit thedata best. Validation of the model indicated possible difficulties with ponderosa pineand chinkapin, but these problems are probably due to inconsistencies in thevalidation data rather than shortcomings in the individual models.

As an affirmative action institution that complies with Section 504of the Rehabilitation Act of 1973, Oregon State University sup-ports equal educational and employment opportunity withoutregard to age, sex, race, creed, national origin, handicap, maritalstatus, or religion.

Forest Research LaboratoryCollege of ForestryOregon State UniversityCorvallis, OR 97331-5704
OregonStifleUniversity
NonProfit Org
US Postage
PAI DCorvallis OR 97331
Permit Na 200
Address Correction Requested