RESEARCH PAPAERS THE IMPACT OF CURRENCY …slfue.org/images/SLFUE_downloads/SLJER_Issues/2015... ·...
26
RESEARCH PAPAERS Sri Lanka Journal of Economic Research Volume 3 (1) June 2015: 3-28 Sri Lanka Forum of University Economists SLJER Nandasiri Keembiyahetti Athula Naranpanawa _______________________________________________ 3 THE IMPACT OF CURRENCY DEPRECIATION AND TRADE LIBERRALZATION ON TRADE BALANCE OF SRI LANKA Abstract This study examines the impact of trade liberalization and currency depreciation on the trade balance of Sri Lanka. Using the bounds testing ARDL approach for co-integration, which is more suitable for small finite sample cases, we found that there was a long run co-integrating relationship between the trade balance and its determinants; particularly the Trade Openness and Real Exchange Rate. Our findings suggest that 1% increase in trade openness leads to 0.48% deterioration, while 1 % depreciation of local currency leads to 0.45% improvement in the Trade Balance Ratio of Sri Lanka given all else remaining unchanged. These findings solve the fundamental dilemma, why Sri Lanka’s Trade Balance continued to deteriorate; despite of substantial currency devaluations/depreciations allowed during past five decades. Our findings conclude that a more powerful negative impact arising from trade openness fully offset the positive impact arising from currency depreciation; thereby leading the Trade Balance into deficit, eventually in the long run. Accordingly, we found trade liberalization and devaluation are counter-cyclical as policy tools. Keywords: – Trade Liberalization, Trade Balance, Bounds Testing, ARDL, Sri Lanka JEL classification: C22; C51; F14 _____________________________________________________ Nandasiri Keembiyahetti Senior Lecturer, Department of Economics, Faculty of HSS, University of Ruhuna, Matara, Sri Lanka. Email; [email protected] Athula Naranpanawa Associate Professor, Department of Accounting, Finance and Economics, Griffith Business School, Gold Coast Campus, Griffith University, Queensland 4222, Australia. Tel: + 61 7 5552 8083 Fax: +61 7 5552 8068 E-mail address: [email protected]
Transcript of RESEARCH PAPAERS THE IMPACT OF CURRENCY …slfue.org/images/SLFUE_downloads/SLJER_Issues/2015... ·...

RESEARCH PAPAERS Sri Lanka Journal of
Economic Research
Volume 3 (1)
June 2015: 3-28
Sri Lanka Forum of
University Economists
SLJER
Nandasiri Keembiyahetti
Athula Naranpanawa
_______________________________________________
3
THE IMPACT OF CURRENCY
DEPRECIATION AND TRADE
LIBERRALZATION ON TRADE
BALANCE OF SRI LANKA
Abstract
This study examines the impact of trade liberalization and currency
depreciation on the trade balance of Sri Lanka. Using the bounds testing
ARDL approach for co-integration, which is more suitable for small finite
sample cases, we found that there was a long run co-integrating relationship
between the trade balance and its determinants; particularly the Trade
Openness and Real Exchange Rate. Our findings suggest that 1% increase in
trade openness leads to 0.48% deterioration, while 1 % depreciation of local
currency leads to 0.45% improvement in the Trade Balance Ratio of Sri
Lanka given all else remaining unchanged. These findings solve the
fundamental dilemma, why Sri Lanka’s Trade Balance continued to
deteriorate; despite of substantial currency devaluations/depreciations
allowed during past five decades. Our findings conclude that a more powerful
negative impact arising from trade openness fully offset the positive impact
arising from currency depreciation; thereby leading the Trade Balance into
deficit, eventually in the long run. Accordingly, we found trade liberalization
and devaluation are counter-cyclical as policy tools.
Keywords: – Trade Liberalization, Trade Balance, Bounds Testing, ARDL,
Sri Lanka JEL classification: C22; C51; F14
_____________________________________________________
Nandasiri Keembiyahetti Senior Lecturer, Department of Economics, Faculty of HSS, University of Ruhuna,
Matara, Sri Lanka. Email; [email protected]
Athula Naranpanawa Associate Professor, Department of Accounting, Finance and Economics, Griffith
Business School, Gold Coast Campus, Griffith University, Queensland 4222,
Australia. Tel: + 61 7 5552 8083 Fax: +61 7 5552 8068
E-mail address: [email protected]

SLJER Volume 3 Number 1, June 2015
4
INTRODUCTION
Trade Liberalization refers to the removal or reduction of artificial
barriers to trade goods and services among nations. This includes the
reduction or removal of tariff (import duties and surcharges) and non-
tariff barriers (licensing, quotas, rules of origin, exchange restrictions).
Trade liberalization on the one hand encourages countries to be
specialized in producing the goods and services, for which they have
comparative advantages. On the other hand the removal of barriers
would result affordably low prices for consumers. Moreover, trade
liberalization exposes local producers for greater competition
emerging from other nations. This would stimulate to increase
production efficiency, cost reduction or provide an incentive for an
industry to move resources into new ventures, not vulnerable to
competition. Trade Liberalization enables economies of scale and
greater specialization, particularly for small economies, having
geographical limitations in very own country.
Sometimes, Trade Liberalization might be threatening the balance of
an economy. Some industries may grow faster, some might be sluggish
or collapse; thereby causing structural unemployment. Trade
Liberalization can often be painful to less developed countries, having
a great deal of infant industries that cannot compete against foreign
competition. On the top of all, Trade Liberalization may create or
worsen the existing trade imbalances among nations.

The Impact of Currency Depreciation and Trade Liberalization
5
The effect of Trade Liberalization on the trade balance is theoretically
indeterminate. The Elasticity Approach suggests the effect will depend
on the price elasticity of demand for imports and exports, as well as the
extent to which the liberalization causes to change the relative price of
export and import. Though the relative prices could be enormously
changed due to tariff reduction under Trade Liberalization, it does not
assure improvement in trade balance unless Marshall-learner (ML)
condition; together with its assumptions is satisfied. Nevertheless,
‘Trade Openness’ is a broader concept beyond reduction of tariffs,
which involves removal of non-tariff barriers and exchange controls as
well. Hence, the Elasticity approach alone does not suffice to conclude
whether openness improves or worsens the trade balance. The
Absorption Approach to the balance of payments by Sydney Alexander
(Haberler, 1976) suggests the effect of liberalization will depend on
how real income is affected in relation to real absorption. A reduction
in import duties will shift expenditure to imported goods, thereby
raising foreign exchange outflows; but a reduction in export duties
does the opposite. Yet, the balance of payments will not improve if the
propensity to absorb is greater than unity.
Given this theoretical ambiguity, the impact of trade openness on the
trade balance becomes an empirical issue. ‘Trade Openness’ has
become an important policy variable for developing countries for the
last few decades, its impact on trade balance has recently received a
great deal of attention from researchers and policy makers alike; as

SLJER Volume 3 Number 1, June 2015
6
many developing countries continue to embark on Trade Liberalization
entering into bilateral, regional, and multilateral trade agreements. This
process was further encouraged by the World Bank and World Trade
Organization (WTO)
The objectives of this study are as follows: (a) To examine whether
long-run level relationship exists between trade balance of Sri Lanka
and its determinants using recent bound testing techniques (b) To
estimate the short-run and long-run elasticity of trade openness and to
exchange rate with respect to the trade balance using ARDL and EC
models (c) To evaluate trade openness and to exchange rate
devaluation as policy tools to rectify the persistent balance of trade
problem in Sri Lanka.
The remainder of this paper is organized as follows: beginning with a
brief literature review on ‘Trade Openness’ and balance of trade nexus,
it subsequently presents theoretical and econometric specification of
the model, Then, it discusses the empirical results, and finally,
concludes the findings and presents policy recommendations.
BRIEF LITERATURE REVIEW
Ostry and Rose (1992) using five different data sets (including one for
developing countries) found no statistically significant effect of tariff
changes on the real trade balance. Lutz and Singer (1994) addressed
the question of the effect of Trade Liberalization on a country’s term
The Impact of Currency Depreciation and Trade Liberalization
7
of trade, based on a sample of 91 countries for 1968-88 including both
LDCs and industrialized countries. Their study conclude that
liberalization is likely to lead to the deterioration of the term of ‘trade,’
if Trade Liberalization was aimed at raising the size of the tradable
sector, either in absolute or relative terms. Santos-Paulino (2004) using
dynamic panel data and time series/cross-section analysis on the trade
balance and the current account balance of twenty two developing
countries from Latin America, Africa, East Asia and South Asia; where
significant trade reforms had been undertaken since the mid-1970s. It
has been found that liberalization has worsened the balance of trade
and the balance of payments; because imports have increased more
rapidly than exports. Using Bounds Testing Approach and Auto-
Regressive Distributed Lags (ARDL) model, Klasra (2011) tested the
existence of long run equilibrium relationship between the
determinants of growth during the period 1975–2004 for Pakistan and
Turkey. The results concluded that there is bi-directional causal
relationship between ‘Trade Openness’ and exports for Pakistan in the
short run. Moreover, they found that openness-growth nexus holds true
for Pakistan, and growth-driven exports hypothesis receives empirical
support for Turkey in the long run. Allaro (2012) examined the impact
of Trade Liberalization on the Ethiopia's trade balance, using the data
over the period 1974 to 2009; and found evidence to substantiate the
fact that Trade Liberalization led to deteriorate the trade balance due
to speedy increase in imports. Islam (2004) applied the Bounds Test to
determine the existence of a level relationship between government
sizes, openness, terms of trade volatility, and external risk using time

SLJER Volume 3 Number 1, June 2015
8
series data from Australia, Canada, England, Norway, Sweden, and the
US. Bounds Test results revealed that the existence of a long run
relationship in the US and Canada; but not in any of the other countries.
Among the studies pertaining to Sri Lanka, Chowdhury and Saleh
(2007) examined the long-run and short-run relationships between the
current account deficit, budget deficit, savings and investment gap and
‘Trade Openness’ in Sri Lanka using the Auto-Regressive Distributive
Lagged (ARDL) Approach. They found that ‘Trade Openness’ has a
positive effect on the current account deficit, but is statistically
insignificant. The result is not surprising, because the current account
balance includes private remittances from abroad; which is exogenous
to openness but helps in great deal to smooth the current account deficit
in Sri Lanka. Weliwita and Tsujii (2000) examined the responsiveness
of Sri Lanka’s trade deficit to currency devaluation during the post
liberalization period. The findings revealed that devaluation of Sri
Lankan rupee turned the trade deficit bad to worse, because trade
volumes were not responsive to the changes in real exchange rates. De
Silva and Zhu (2004) examined the effect of devaluation of rupee on
the trade balance and GDP using VAR and ECM, supplemented by
Variance Decomposition and Impulse Response Analysis. Their
findings based on aggregate annual data for 1977-1997, revealed that
the new exchange rate policy after 1977 has improved the trade
balance, but has failed to stimulate real output at least in the short run.

The Impact of Currency Depreciation and Trade Liberalization
9
BRIEF OVERVIEW OF BALANCE OF TRADE BEHAVIOUR
IN SRI LANKA
A couple of fundamental macroeconomic problems that Sri Lanka has
been facing since the 1950s is the declining terms of trade and
widening trade gap. When the earnings from the traditional agricultural
exports of tea, rubber, and coconut had been weakening in the
international marketplace in the early 1960s, governments responded
to this situation by introducing tight regulations over foreign exchange.
Imports and exports were strongly regulated. This trend had been
accelerated from 1970 to1977, when a coalition headed by the Sri
Lanka Freedom Party imposed direct controls over international trade,
especially on imports. After its electoral victory in 1977, the United
National Party (UNP) government made enormous effort to liberalize
the economy and encouraged private enterprise, welcomed foreign
direct investment (FDI) and slackened import controls in a platform
called ‘Open Economic Policies.’ This is unambiguously accepted as
the historic turning point in trade linearization in Sri Lanka. Following
liberalization, Sri Lanka's economy became more diverse in the 1970s
and 1980s. In 1986 textiles and garments surpassed tea for the first time
as the country's ‘single largest export.’ Nevertheless, the performance
of the traditional agricultural exports remained essential to the
country's economic sustainability, while remittances from Sri Lankans
working overseas, foreign aids, and tourism became the other
important sources of foreign exchange.

SLJER Volume 3 Number 1, June 2015
10
From economic viewpoint, one of the most important benefits
associated with trade openness is the achievement of a faster economic
growth and development (Winters, 2004). The economic intuition
behind this statement is that less developed countries require acquiring
a huge amount of resources and exploring market opportunities for
domestically produced goods and services from advanced economies.
However, while Sri Lanka benefitted from Open Market Policies in
many different ways, its trade balance continued to deteriorate year by
year after introducing the ‘Open Economy’ in 1977
(15,000)
(10,000)
(5,000)
-
5,000
10,000
15,000
20,000
25,000
19
60
19
62
19
64
19
66
19
68
19
70
19
72
19
74
19
76
19
78
19
80
19
82
19
84
19
86
19
88
19
90
19
92
19
94
19
96
19
98
20
00
20
02
20
04
20
06
20
08
20
10
20
12
20
14
USD
Mn
Figure -1: Exports Imports and Trade Balance of Sri Lanka 1960-2014
(USD Million)
Export USD Mn
Import USD Mn
Trade Balance USD Mn
.
As shown in Figure-1, starting from US Dollar 41 Million surplus in
1977, the trade balance reported historic lowest downturn of US Dollar
9,710 Million by 2011, which is almost equal to the entire export
earnings of the country for that year. After three years later in 2014, it
has very marginally improved to US Dollar -8,285 Million which is
still as high as 74% of the total export earnings.

The Impact of Currency Depreciation and Trade Liberalization
11
A careful study into the scatter plot depicted in Figure-2 would reveal
that Sri Lanka’s trade balance and exchange rate behaviour is totally
opposite to what is expected in ‘Economic Theory.’ Economic theory
postulates that trade balance should improve while exchange rate
continues to depreciate/devaluate given ML condition is satisfied.
Nevertheless, in Sri Lankan context the opposite seems true as
illustrated in Figure-2.
In this context, despite the studies so far done, we suspect that there
could be countercyclical effects between Trade Liberalization and
exchange devaluation on trade balance which offset the impact of each
other. As such, we attempt to answer the empirical question ‘why the
trade balance of Sri Lanka continued to deteriorate despite substantial
currency devaluations/depreciations during past five decades.’
-8,286 ,
131.05
-
20.00
40.00
60.00
80.00
100.00
120.00
140.00
-12,000 -10,000 -8,000 -6,000 -4,000 -2,000 - 2,000
Exch
an
ge
Ra
te L
KR
per
US
D
Trade Balance USD Mn
Figure-2, Scatter plot Nominal Exchange Rate vs.
Trade Balance of Sri Lanka 1960-2014

SLJER Volume 3 Number 1, June 2015
12
METHODOLOGY
Model
This study employs the standard “Two County” trade model as
stipulated by many studies in literature (see Rose and Yellen (1989);
Rose (1990); Bahmani-Oskooee (1991); Shirvani and Wilbratte
(1997); and Wilson (1999)) with a slight modification to incorporate
the ‘Trade Openness.’ The standard two country trade model assumes
that the demand for imports by domestic residents (Dm) depends on the
domestic income (y) and the relative price of imported goods to the
domestically produced goods (rpm) both expressed in home country
currency terms. Additionally, we assume that the trade balance is
affected by the degree of trade openness (top) of that economy. The
supper script f denotes the foreign counterpart of the analogous
variables. Thus, the initial equations can be given as:
Import demand
Dm = Dm(y, rpm, top) (1)
Dfm=Df
m(yf,rpfm,topf) (2)
rpm=e.pfx/p = (e.pf/p).(pf
x/pf) = q.rpfx (3)
q = e.pf/p (real exchange rate) (4)
(e- nominal exchange rate – the domestic currency price of foreign
exchange )

The Impact of Currency Depreciation and Trade Liberalization
13
Analogously,
rpfm=(px/pf .e)= (p/pf.e).(px/p)=(1/q).rpx (5)
rpfm=rpx/q
export supply
Sx = Sx(rpx, top)
Sfx= Sf
x (rpfx,topf) (6)
Equilibrium condition
Dm=Sfx and Df
m=Sx (7)
TB = Real Trade balance of the domestic country
TB=rpx.Sx - rpm.Dm (8)
TB= rpx.Dfm - q.rpf
x.Dm
TB= rpx. Dfm(yf,rpf
m,topf) - q.rpfx. Dm(y, rpm, top)
TB= rpx. Dfm(yf, rpx/q,topf) - q.rpf
x. Dm(y, q.rpfx, top) (9)
Assume, no tariffs on exports, and no taxes or subsidies on
domestically trading goods; thus domestic price must be equal to
export price in any country; it means always rpx = rpfx =1 in equation
9; so equation becomes
TB= Dfm(yf, 1/q,topf) - q.Dm(y, q, top) (10)
Now TB is a function of
TB=TB(yf, y, q, top,topf)

SLJER Volume 3 Number 1, June 2015
14
Applying small country argument, we could ignore the impact of
foreign country’s ‘Trade Openness’ on the trade balance of the
domestic country, because a small country would demand (import) or
supply (export) a negligibly small volume which could be
exchangeable irrespective of the degree of trade openness of the rest of
the world. Hence, we can reasonably omit (topf ) from the above
function. Thus TB can be expressed as:
TB=TB(yf, y, q, top) (11)
This study applies the Bounds Testing Method, which i widely known
as the Autoregressive Distributed Lagged (ARDL) co-integration
procedure developed by Pesaran and Smith (2001) to analyse the long-
run relationships and dynamic interactions among the variables of
interest. ARDL procedure is more appropriate for this analysis due to
following reasons. Firstly, the Bounds Testing procedure does not
require the pre-testing of the variables in the model for unit roots. The
bounds testing procedure is applicable irrespective of whether the
regresses are integrated I(0), I(1) or mutually co-integrated, as long as
they are not co-integrated I(2). Secondly, the bounds testing procedure
is relatively more efficient in small or finite sample data, where the
number of observations by nature is small as in our case. Thirdly, both
short-run and long-run parameters can be estimated simultaneously.
Furthermore, as opposed to other multivariate co-integration
techniques such as Johansen and Juselius (1990), the Bounds Test
procedure is simple because the co-integration relationship can be
estimated using OLS; once the lag order of the model is defined by a
suitable information criterion.

The Impact of Currency Depreciation and Trade Liberalization
15
Now we rewrite the functional relationship denoted in Eq(11) as
follows for notational convenience of the ARDL model.
𝑇𝐵 = 𝑓(𝐺𝐷𝑃, 𝐺𝐷𝑃𝑊, 𝑅𝐸𝑋, 𝑇𝑂𝑃, 𝑂𝐼𝐿, 𝑇) (12)
TB is the ratio of real exports to real imports both measured in USD
millions. Measuring TB as a ratio of exports to imports deserves at least
three advantages. It becomes unit less, non-negative allowing for log
transformation, and is normalized to one when trade is balanced.
GDP is Gross Domestic Product of home country and GDPW is the
sum of GDPs of the top 20 export destinations of Sri Lanka1.
REX is the real exchange defined in terms of domestic currency price
for one unit of US dollar. (Same as defined in Eq-4)
TOP is the sum of real exports and imports defined as a percentage of
GDP which is a proxy variable, representing the degree of Trade
Openness. Though it is subject to some limitations, this is the
conventional measure used to measure Trade Openness in many
empirical studies2. Many researchers use GDP in trade openness index
to normalize cross-sectional heterogeneity, depending on country size
which is not relevant to a single country case like ours. In our study,
taking total trade as a percentage of GDP at least produces a
1 U.S.A.,U.K., India, Italy, Belgium, Germany, Russia, U.A.E., Japan, Iran, France,
Netherlands, Canada, Turkey, Australia, China, Syria, Hong-Kong, Mexico,
Singapore, Switzerland. These countries account for 80.77% of Sri Lanka’s total
exports
2 See Islam(2004), Allaro (2012), Dritsaki (2013), Yanikkaya, H. (2003),
Narampanawa, A. (2011), Bowdler, C and Nunziata, L (2006),
SLJER Volume 3 Number 1, June 2015
16
comparable measure for Trade Openness over time. Nevertheless, this
measure as a proxy for Trade Openness is not free from errors. GDP
includes government expenditure (G) which is exogenously
determined, especially for country like Sri Lanka that had been
undergoing three decades of civil war. Thus, any abnormal increase in
G might erroneously means to suggest a reduction of Trade Openness,
as GDP appears in the denominator.
Also we included OIL dummy to capture world oil price hike in 1973
and a time (T) dummy for de-trending data.
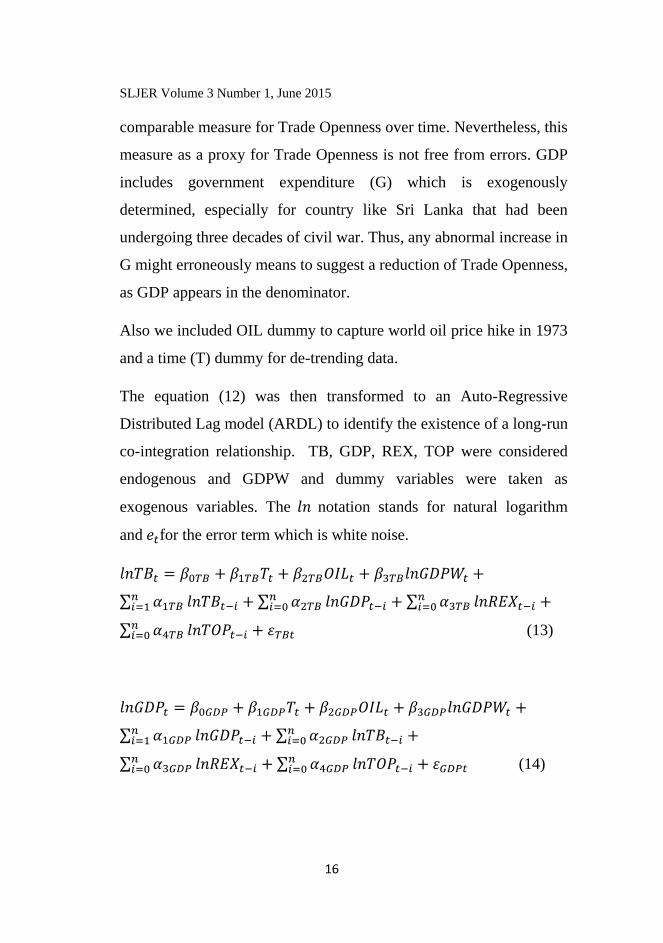
The equation (12) was then transformed to an Auto-Regressive
Distributed Lag model (ARDL) to identify the existence of a long-run
co-integration relationship. TB, GDP, REX, TOP were considered
endogenous and GDPW and dummy variables were taken as
exogenous variables. The 𝑙𝑛 notation stands for natural logarithm
and 𝑒𝑡for the error term which is white noise.
𝑙𝑛𝑇𝐵𝑡 = 𝛽0𝑇𝐵 + 𝛽1𝑇𝐵𝑇𝑡 + 𝛽2𝑇𝐵𝑂𝐼𝐿𝑡 + 𝛽3𝑇𝐵𝑙𝑛𝐺𝐷𝑃𝑊𝑡 +
∑ 𝛼1𝑇𝐵𝑛𝑖=1 𝑙𝑛𝑇𝐵𝑡−𝑖 + ∑ 𝛼2𝑇𝐵
𝑛𝑖=0 𝑙𝑛𝐺𝐷𝑃𝑡−𝑖 + ∑ 𝛼3𝑇𝐵
𝑛𝑖=0 𝑙𝑛𝑅𝐸𝑋𝑡−𝑖 +
∑ 𝛼4𝑇𝐵𝑛𝑖=0 𝑙𝑛𝑇𝑂𝑃𝑡−𝑖 + 𝜀𝑇𝐵𝑡 (13)
𝑙𝑛𝐺𝐷𝑃𝑡 = 𝛽0𝐺𝐷𝑃 + 𝛽1𝐺𝐷𝑃𝑇𝑡 + 𝛽2𝐺𝐷𝑃𝑂𝐼𝐿𝑡 + 𝛽3𝐺𝐷𝑃𝑙𝑛𝐺𝐷𝑃𝑊𝑡 +
∑ 𝛼1𝐺𝐷𝑃𝑛𝑖=1 𝑙𝑛𝐺𝐷𝑃𝑡−𝑖 + ∑ 𝛼2𝐺𝐷𝑃
𝑛𝑖=0 𝑙𝑛𝑇𝐵𝑡−𝑖 +
∑ 𝛼3𝐺𝐷𝑃𝑛𝑖=0 𝑙𝑛𝑅𝐸𝑋𝑡−𝑖 + ∑ 𝛼4𝐺𝐷𝑃
𝑛𝑖=0 𝑙𝑛𝑇𝑂𝑃𝑡−𝑖 + 𝜀𝐺𝐷𝑃𝑡 (14)

The Impact of Currency Depreciation and Trade Liberalization
17
𝑙𝑛𝑅𝐸𝑋𝑡 = 𝛽0𝑅𝐸𝑋 + 𝛽1𝑅𝐸𝑋𝑇𝑡 + 𝛽2𝑅𝐸𝑋𝑂𝐼𝐿𝑡 + 𝛽3𝑅𝐸𝑋𝑙𝑛𝐺𝐷𝑃𝑊𝑡 +
∑ 𝛼1𝑅𝐸𝑋𝑛𝑖=1 𝑙𝑛𝑅𝐸𝑋𝑡−𝑖 + ∑ 𝛼2𝑅𝐸𝑋
𝑛𝑖=0 𝑙𝑛𝐺𝐷𝑃𝑡−𝑖 +
∑ 𝛼3𝑅𝐸𝑋𝑛𝑖=0 𝑙𝑛𝑇𝐵𝑡−𝑖 + ∑ 𝛼4𝑅𝐸𝑋
𝑛𝑖=0 𝑙𝑛𝑇𝑂𝑃𝑡−𝑖 + 𝜀𝑅𝐸𝑋𝑡 (15)
𝑙𝑛𝑇𝑂𝑃𝑡 = 𝛽0𝑇𝑂𝑃 + 𝛽1𝑇𝑂𝑃𝑇𝑡 + 𝛽2𝑇𝑂𝑃𝑂𝐼𝐿𝑡 + 𝛽3𝑇𝑂𝑃𝑙𝑛𝐺𝐷𝑃𝑊𝑡 +
∑ 𝛼1𝑇𝑂𝑃𝑛𝑖=1 𝑙𝑛𝑇𝑂𝑃𝑡−𝑖 + ∑ 𝛼2𝑇𝑂𝑃
𝑛𝑖=0 𝑙𝑛𝐺𝐷𝑃𝑡−𝑖 +
∑ 𝛼3𝑇𝑂𝑃𝑛𝑖=0 𝑙𝑛𝑅𝐸𝑋𝑡−𝑖 + ∑ 𝛼4𝑇𝑂𝑃
𝑛𝑖=0 𝑙𝑛𝑇𝐵𝑡−𝑖 + 𝜀𝑇𝑂𝑃𝑡 (16)
Hypotheses
In equation 13, where real trade balance is the dependent variable
𝑓𝑇𝐵(𝑇𝐵|𝐺𝐷𝑃, 𝑅𝐸𝑋, 𝑇𝑂𝑃) the null hypothesis of no cointegration
amongst the variables is 𝐻0: ∝1𝑇𝐵= ∝2𝑇𝐵=∝3𝑇𝐵=∝4𝑇𝐵= 0 against the
alternative hypothesis 𝐻1: ∝1𝑇𝐵≠∝2𝑇𝐵≠∝3𝑇𝐵≠∝4𝑇𝐵≠0.
In equation 14, where GDP is the dependent variable,
𝑓𝐺𝐷𝑃(𝐺𝐷𝑃|𝑇𝐵, 𝑅𝐸𝑋, 𝑇𝑂𝑃) the null hypothesis of no cointegration is
𝐻0: ∝1𝐺𝐷𝑃= ∝2𝐺𝐷𝑃=∝3𝐺𝐷𝑃=∝4𝐺𝐷𝑃= 0 against the alternative
hypothesis 𝐻1: ∝1𝐺𝐷𝑃≠∝2𝐺𝐷𝑃≠∝3𝐺𝐷𝑃≠∝4𝐺𝐷𝑃≠0.
In equation 15, where REX is the dependent variable,
𝑓𝑅𝐸𝑋(𝑅𝐸𝑋|𝑇𝐵, 𝐺𝐷𝑃, 𝑇𝑂𝑃) the null hypothesis of no cointegration is
𝐻0: ∝1𝑅𝐸𝑋= ∝2𝑅𝐸𝑋=∝3𝑅𝐸𝑋=∝4𝑅𝐸𝑋= 0 against the alternative
hypothesis 𝐻1: ∝1𝑅𝐸𝑋≠∝2𝑅𝐸𝑋≠∝3𝑅𝐸𝑋≠∝4𝑅𝐸𝑋≠0.

SLJER Volume 3 Number 1, June 2015
18
Similarly in equation 16, where TOP is the dependent variable,
𝑓𝑇𝑂𝑃(𝑇𝑂𝑃|𝑇𝐵, 𝐺𝐷𝑃, 𝑅𝐸𝑋) the null hypothesis of no cointegration is
𝐻0: ∝1𝑇𝑂𝑃= ∝2𝑇𝑂𝑃=∝3𝑇𝑂𝑃=∝4𝑇𝑂𝑃= 0 against the alternative
hypothesis 𝐻1: ∝1𝑇𝑂𝑃≠∝2𝑇𝑂𝑃≠∝3𝑇𝑂𝑃≠∝4𝑇𝑂𝑃≠0.
Data
This study uses annual data1960-2014 from two sources. GDPW is
from author’s calculation with GDP data from International Financial
Statistics (IFS). All the other data are from the Annual Reports of the
Central Bank of Sri Lanka. GDP and export import data series were
rebased to 2005 constant price using relevant price indices.
EMPIRICAL RESULTS
The ARDL bounds test developed by Pesaran et al. (2001) can be used
to establish the short-run and long-run relationships, irrespective of
whether they are purely I(0), purely I(1), or mutually co-integrated.
Nevertheless, this procedure requires the variables under consideration
are not integrated at an order higher than one. In the presence of I(2)
variables, the model crashes because the critical values provided by
Pesaran et al. (2001) are no longer valid. Therefore, it is of crucial
importance to test the order of integration of all variables and to verify
none of them are of I(2). To test the null hypothesis of unit root against
the alternative of stationary, we performed Augmented Dickey–Fuller
(ADF) test for both “intercept only” and “intercept with liner trend”
methods but reported only the latter for brevity. The latter is more

The Impact of Currency Depreciation and Trade Liberalization
19
reliable, as all the variables are trending over time and we have no valid
statistical reason to avoid intercept.
As per the ADF test results reported in Table-1, all the variables were
found I(1) in levels, but I(0) in first difference and more importantly,
no evidences were detected for I(2). Hence, the variables are qualified
to be used in bounds testing.
Table-1: Augmented Dickey-Fuller Unit Root Test (Intercept and Trend)
Variable Level First Differenced
t-statistic Probability t-statistic Probability
lnGDP -2.070 (5) 0.5478 -5.707(0)*** 0.0001
lnTB -1.831 (0) 0.6745 -8.581 (0)*** 0.0000
lnTOP -2.631 (0) 0.2689 -3.763 (10)** 0.0296
lnGDPW -2.396 (1) 0.3771 -5.733 (1)*** 0.0001
lnREX -0.826 (2) 0.9558 -5.265 (1)*** 0.0004
For ADF test within brackets are lag length selected by AIC
*** Significant at 1% level
** Significant at 5% level
In the bounds testing approach to ARDL, F-statistic is used to test the
existence of long-run relationship. The F-stat used for this procedure,
however, does not follow standard F-distribution. Thus, the Pesaran et
al. (1996) computed two sets of critical values for any given
conventional significance level. One set assumes that all variables are
integrated order I(0), and the other set assumes that they all are
integrated order I(1). If the calculated F-statistics exceeds, the upper
bound critical value, then the H0 of no co-integration will be rejected
favouring the alternative that co-integration among the variables. On
the other hand, if the calculated F-statistic is less than the lower bound

SLJER Volume 3 Number 1, June 2015
20
critical value, then H0 of no co-integration among the variables cannot
be rejected. If F-statistic falls within the bounds, then the test result is
inconclusive and existence of long-run relationship is indeterminate.
Table-2 shows the Result of Bound Testing for Co-integration in
ARDL Model. The results indicate that the null hypothesis of no co-
integration cannot be rejected for the models defined by Eq(14), Eq(15)
and Eq(16). It reveals that the calculated F-statistic exceeds the upper
bound critical value at 5% significant level only for model defined by
Eq(13), leading to the concussion that there exists only one long run
co-integrating relationship where TB appears being the dependent
variable.
Table-2 Result of Bound Testing for Cointegration in ARDL Model
using Akaike Information Criterion
ARDL Model ARDL
Lag
Length
F-
Statistics
Presence of
Cointegration
𝐹𝑇𝐵(𝑇𝐵|𝑇𝑂𝑃, 𝐺𝐷𝑃, 𝑅𝐸𝑋) 1,2,2,1 6.6842** YES
𝐹𝑇𝑂𝑃(𝑇𝑂𝑃|𝑇𝐵, 𝐺𝐷𝑃, 𝑅𝐸𝑋, ) 1,0,2,1 1.6558* NO
𝐹𝐺𝐷𝑃(𝐺𝐷𝑃|𝑇𝑂𝑃, 𝑇𝐵, 𝑅𝐸𝑋) 2,0,1,2 5.0474* NO
𝐹𝑅𝐸𝑋(𝑅𝐸𝑋|𝐺𝐷𝑃, 𝑇𝑂𝑃, 𝑇𝐵) 1,1,2,1 1.8186* NO
** Above the 95% Upper bound critical value
* Below the 95% Lower bound critical value
Note: The critical value bounds are computed by stochastic
simulations using 20000 replications. For this analysis 95%
critical bounds are 5.0376-6.2037
Having established the co-integrating relationship, the long run
coefficients for Eq(13) was estimated using ARDL (1,2,2,1) selected
based on Akaike Information Criterion. The estimated long run
coefficients are reported in Table-3

The Impact of Currency Depreciation and Trade Liberalization
21
Table-3, The Estimated Long-run Coefficients
Regressor Coefficient Standard
Error
T-Ratio Prob
C -16.3545 22.6664 -0.7215 0.4760
T -0.0362 0.07406 -0.4899 0.6280
OIL 0.1966 0.17643 1.1141 0.2740
lnTOP -0.4803 ** 0.2281 -2.1055 0.0430
lnGDP 1.0655 1.4900 0.7151 0.4800
lnGDPW 0.0664 1.1923 0.0556 0.9560
lnREX 0.4596*** 0.1015 4.5240 0.0000
As shown in Table-3, all the variables take expected sign but only the
Trade Openness (TOT) and Real Exchange Rate (REX) are significant
in explaining long run variations in the Trade Balance (TB). The
estimated coefficient for REX shows highly significant long run impact
of Real Exchange Rate on the Trade Balance. The estimated coefficient
indicates that 1 % depreciation of local currency leads to 0.45%
improvement in the Trade Balance Ratio of Sri Lanka, given all else
being equal. On contrary the Trade Openness is negatively significant
at 5% level indicating that 1% increase in Trade Openness leads to
deteriorate the Trade Balance Ratio by 0.48%. The underlining
economic intuition is that the nature of Trade Openness in Sri Lanka
can be regarded as more supportive to imports than to exports. These
findings solve our basic puzzle that why Sri Lanka’s Trade Balance
continuous to deteriorate in long term despite of substantial currency
depreciation. It is proven in our findings that relatively a more
powerful negative impact arising from Trade Openness fully offset the
positive impact arising from currency depreciation ultimately leading
the Trade Balance into deficit in the long run.

SLJER Volume 3 Number 1, June 2015
22
Table-4, Error Correction Representation ARDL(1,2,2,1) selected
based on Akaike Information Criterion
Dependent variable is lnLTB
Regressor Coefficient Standard
Error
T-Ratio Prob
lnTOP -0.07473 0.17983 -0.4156 0.680
lnTOP1 0.44084 0.17988 2.4507 0.020
lnGDP -0.23013 1.01890 -0.2259 0.823
lnGDP1 -2.23960 1.00130 -2.2368 0.032
lnREX -0.07579 0.15949 -0.4752 0.638
T -0.02230 0.04366 -0.5108 0.613
OIL 0.12080 0.10365 1.1654 0.252
lnGDPW 0.04078 0.73425 0.0555 0.956
ECM(-1) -0.61456 0.14476 -4.2453 0.000
Notes, lnLTB = lnTB-lnTBt-1
lnTOP = lnTOP- TOPt-1
lnTOP1 = lnTOPt-1- lnTOPt-2
lnLGDP= lnGDP- lnGDPt-1
lnLGDP1= lnGDPt-1-lnGDPt-2
lnLREX = lnREX-lnREXt-1
T = T-Tt-1
OIL = OIL-OILt-1
lnLGDPW= lnGDPW-lnGDPWt-1
R-Squared 0.54956
R-Bar-Squared 0.37520
S.E. of Regression 0.091253
F-Stat. F(9,34) 4.2025[.001]
Residual Sum of Squares 0.25814
DW-statistic 2.3615
The results of the Error Correction Model (ECM) denotes the short-run
dynamics associated with the long run relationships are given in Table-
4. The short run dynamics tabulated in Table-4 suggest neither Real
Exchange Rate nor Trade Openness has significant influence on the
Trade Balance in the short run. However, the Error Correction Term
(ECM) estimated -0.61456 (0.000) is highly significant and negative
in sign indicating fairly a higher speed of adjustment towards
equilibrium after a short run shock. It is estimated approximately 61%
of disequilibria from the previous year would converge back to long
run equilibrium in the current year.

The Impact of Currency Depreciation and Trade Liberalization
23
Figure-3 depicts the dynamic forecast for the long run path of Real
Trade Balance while Figure-4 and Figure-5 respectively depict the plot
of cumulative sum of recursive residuals (CUSUM) and the plot of
cumulative sum of squares recursive residuals (CUSUMQ).
Figure-3
Both CUSUM and CUSUMQ moving within critical bounds at 5%
significant level illustrate the model stability for the sample period.
-1.6
-1.4
-1.2
-1.0
-0.8
-0.6
-0.4
-0.2
1962 1974 1986 1998 2010
Dynamic forecasts for the level of LREALTB
LREALTB Forecast

SLJER Volume 3 Number 1, June 2015
24
Figure-4
Figure-5
-20
-10
0
10
20
1962 1973 1984 1995 2005
The straight lines represent critical bounds at 5% significance level
Plot of Cumulative Sum of Recursive Residuals
-0.5
0.0
0.5
1.0
1.5
1962 1973 1984 1995 2005
The straight lines represent critical bounds at 5% significance level
Plot of Cumulative Sum of Squares of Recursive Residuals

The Impact of Currency Depreciation and Trade Liberalization
25
CONCLUSION
Employing the Bound Testing (ARDL) approach, this study examined
the short run and long run relationship between ‘Trade Openness’ and
the ‘Trade Balance’ of Sri Lanka. The Bounds test reveals that there is
a long run co-integrating relationship between the variables of interest,
predominantly the Trade Openness and Real Exchange Rate. Our
findings suggest that 1% increase in trade openness leads to 0.48%
deterioration while 1 % depreciation of local currency leads to 0.45%
improvement in the Trade Balance Ratio of Sri Lanka, given all else
remaining unchanged. These findings solve our basic dilemma, why
Sri Lanka’s Trade Balance continued to deteriorate, despite the
substantial currency depreciation allowed during last few decades. It is
proven that relatively a more powerful negative impact arising from
Trade Openness fully offset the positive impact arising from currency
depreciation; thereby leading the Trade Balance into deficit eventually
in the long run. Therefore, devaluating currency and liberalizing trade
are countercyclical policies offsetting the impact of each other. It leads
to the policy recommendation that government must allow further
depreciation of local currency if liberalizing trade any longer, in order
to prevent TB going bad to worse.
REFERENCES
Allaro, H. B. (2012). “The Impact of Trade Liberalization on the
Ethiopia's Trade Balance”, American Journal of Economics,
Vol 2(5): pp 75-81

SLJER Volume 3 Number 1, June 2015
26
Bahmani-Oskoee, M and Brooks T.J, (1991) “Cointegration approach
to Estimating Bilateral Trade elasticities between US and her
Trading partners” International Economic Journal, Vol.13, (4)
winter' pp 66-79
Bowdler, C and Nunziata, L (2006). “Trade Openness and Inflation
Episodes in the OECD”, Journal of Money, Credit and Banking,
Vol. 38 (2), pp. 553-563
Chowdhury, K. & Saleh, A.S. (2007). “Testing the Keynesian
Proposition of Twin Deficits in the Presence of Trade
Liberalization: Evidence from Sri Lanka” Working Paper 07-
09, Department of Economics, University of Wollongong,
2007. http://www.uow.edu.au/commerce/econ/wpapers.html
De Silva, D., Zhu, Z. (2004). “Sri Lanka’s Experiment with
Devaluation: VAR and ECM Analysis of the Exchange Rate
Effects on Trade Balance and GDP.” The International Trade
Journal 28(4): 269-301.
Dritsaki, M. & Dritski,C. (2013). “Bound Testing Approach for
Cointegration and Causality between Financial Development,
Trade Openness and Economic Growth in Bulgaria, the IUP
Journal of Applied Economics, Vol. 12 (1), pp. 50-67
Haberler, Gottfried (1976). "The Monetary Approach to the Balance of
Payments". Journal of Economic Literature 14 (4): pp. 1324–
1328
Islam, M. Q. (2004). “The long run relationship between openness and
government size: evidence from bounds test”, Applied
Economics, Vol. 36, pp. 995–1000
Johansen, S. and K. Juselius, (1990). “Maximum likelihood estimation
and inference on cointegration-with application to the demand
for money”. Oxford Bulletin of Economics and Statistics, Vol.
52 pp169-210

The Impact of Currency Depreciation and Trade Liberalization
27
Klasra, M. A. (2011). ‘Foreign direct investment, trade openness and
economic growth in Pakistan and turkey: an investigation
using bounds test’ Springer Science Business Media B.V.
Qual Quant (published on line) 45: pp. 223–231
LUTZ, M. and Singer, H.W. (1994). “The Link Between Increased
Trade Openness and the Terms of Trade: An Empirical
Investigation” World Development, Vol. 22, No. 11, pp.
1697-1709
Narampanawa, A. (2011). “Does trade openness promote carbon
emissions? Empirical evidence from Sri Lanka”, The Empirical
Economic Letters, Vol. 10(10). pp. 973-986
Ostry, J. D. and Rose, A. K. (1992). ‘An Empirical Evaluation of the
Macroeconomic Effects of Tariffs’, Journal of International
Money and Finance, Vol. 11, pp. 63–79
Pesaran, M.H., Shin, Y. and Smith, R.J. (2001). “Bounds testing
approaches to the analysis of level relationships”. Journal of
Applied Econometrics, Vol.16. pp 289-326.
Rose, Andrew K, and Yellen, Janet.L. (1989), “Is There a J-Curve?”
Journal of Monetary Economics, vol. (24), pp 53-68.
Rose, Andrew K., (1990), “Exchange Rate and the Trade balance:
Some Evidence from Developing Countries”, Economic
Letters, pp 217-275
Santos-Paulino, A.U. (2004) ‘Trade Liberalization and the Balance of
Payments in Selected Developing Countries’, The Manchester
School Vol 72 No. , pp.100-118
Shirvani, H., & Wilbratte, B. (1997). The relationship between the real
exchange rate and the trade balance: An empirical
reassessment. International Economic Journal, Vol. 11(1),
pp.39-51.

SLJER Volume 3 Number 1, June 2015
28
Weliwita, A., Tsujii, H. (2000). “The Exchange Rate and Sri Lanka’s
Trade Deficit.” Journal of Economic Development 25: 131-
157.
Wilson, P. (1999). “Exchange Rates and the Trade Balance: the case
of Malaysia from 1970 to 1996.” Malaysian Journal of
Economic Studies 36(2): 1-15.
Winters, L. A. (2004). “Trade Liberalization and Economic
Performance: An Overview”. The Economic Journal, 114, F4-
F21.
Yanikkaya, H. (2003). “Trade Openness and Economic Growth: a
Cross Country Empirical Investigation”, Journal of
development Economics, Vol.72, pp.57-89