RESEARCH OpenAccess Afemtocelllocationstrategyforimproving ...

EURASIP Journal on Imageand Video Processing
Liang et al. EURASIP Journal on Image and VideoProcessing (2016) 2016:22 DOI 10.1186/s13640-016-0126-5
RESEARCH Open Access
Gait recognition based on the golden ratioYaling Liang1, Chang-Tsun Li2* , Yu Guan2 and Yongjian Hu1
Abstract
Gait is known to be an effective behavioral biometric trait for the identification of individuals. However, clothing has adramatic influence on the recognition rate. Researchers have attempted to deal with this issue of clothing bysegmenting parts of the gait images based on anatomical proportions. However, the clothing proportion is not thesame as the anatomical proportion, as clothing is designed according to the golden ratio to enhance its look. Hence,methods for eliminating the influence of clothing should be based on the proportions of clothing. In this paper, wepropose the golden ratio-based segmentationmethod to reduce the influence of clothing. Experiments are conductedon the CASIA-B dataset, and experimental results show that the proposed method outperforms other approaches,achieving a 94.76 % recognition rate in various clothing conditions and a rate of 91.53 % when bags are being carried.
Keywords: Gait recognition, Golden ratio, Anatomical proportion, Body segmentation
1 IntroductionCompared withmany biometric traits, such as fingerprint,iris, and hand geometry, gait can be captured from a dis-tance. Gait recognition can be used in visual surveillance,forensics, robotics, computer animation, etc. However,there are many covariates [1–3] that influence the perfor-mance of gait recognition systems, such as clothing, carry-ing baggage, view angles, walking speed, elapsed time, andso on. Among these, the influence of clothing is generallyunavoidable and has a considerable effect on the recogni-tion rate. People generally change their clothes on a dailybasis. Yu et al. [4] demonstrated that clothing caused therecognition rate to drop from more than 95 % to less than33 %. Matovski et al. [5] also showed that clothing affectsthe recognition performance more than covariates such astime, footwear, and speed. Gafurov et al. [6], Hadid et al.[7], and Bustard et al. [8] researched the spoof attacks andanti-spoofing on gait recognition system. Hadid et al. [7]and Bustard et al. [8] showed that clothing is a big chal-lenge for gait anti-spoofing. Hence, in this paper, we focuson a method for reducing the influence of clothes on gaitrecognition systems.A number of researchers have used partial gait images,
instead of the whole gait, to reduce the influence of cloth-ing. For instance, Gabriel-Sanz et al. [9] used the lower
*Correspondence: [email protected]; [email protected] of Computer Science, University of Warwick, Gibbet Hill Road,CV4 7AL Coventry, UKFull list of author information is available at the end of the article
portion of gait images to eliminate the problem causedby clothing, whereas Hossain et al. [10] and Li et al. [11]segmented the gait into different parts according to theanatomical proportion and used different parts for therecognition task. Some researchers have constructed amask according to relative criterion to determine whichpart of the gait should be used for recognition [12, 13].Recently, Guan et al. [14] proposed a random subspacemethod to deal with the covariate of clothing. Many pre-vious studies attempted to discard the influenced partsand retain only those uninfluenced parts to eliminate theeffects of clothing. However, this problem has not beenconsidered in terms of the characteristics of clothing. Inthe clothing and fashion industry, based on the fact thatthe parts of the human body conform to golden ratio [15],such a ratio is commonly used to guide the design ofdifferent types of clothing [16, 17]. Based on this, we pro-pose a golden ratio segmentation method to deal with theproblems caused by clothing in gait recognition systems.The remainder of this paper is organized as follows.
Section 2 provides a brief review of the part-based meth-ods and Section 3 provides analyses of those methods.The proposed golden ratio segmentation method is thendescribed in Section 4. Some experimental results andanalysis are presented in Section 5, and Section 6 summa-rizes our work and states our conclusions.
2 Review of part-basedmethodsPart-based methods use parts of the gait to realize gaitrecognition. They fall into three categories depending on
© 2016 The Author(s). Open Access This article is distributed under the terms of the Creative Commons Attribution 4.0International License (http://creativecommons.org/licenses/by/4.0/), which permits unrestricted use, distribution, andreproduction in any medium, provided you give appropriate credit to the original author(s) and the source, provide a link to theCreative Commons license, and indicate if changes were made.

Liang et al. EURASIP Journal on Image and Video Processing (2016) 2016:22 Page 2 of 8
Fig. 1 Anatomical proportion and two typical methods based on it. a Anatomical proportion, H is the height of the body. b The method of Li et al.[11] segments the gait into six different parts. c The method of Hossain et al. [10] segments the gait into eight different parts
the segmentation method employed, namely, anatomicalproportion-based methods, self-defined methods, andmask-based methods.The anatomical proportion-based method segments the
body into different parts according to anatomical pro-portions [18]. Figure 1 illustrates the anatomical pro-portions and the main gait partitioning methods basedon them. This approach is easy to implement and wereemployed by Hossain et al. [10], Li et al. [11], and Liet al. [19]. However, the proportions of the parts can-not be adjusted for different probe samples accordingto clothing length, which often affects the recognitionrates.Self-defined proportion methods use proportions
defined by different authors. Figure 2 illustrates severalexamples. As shown in Fig. 2a, Gabriel-Sanz et al. [9] usedonly the lower part of the human body for recognition.Similarly, Li and Chen [20] (Fig. 2b) used the head andfeet of the gait to construct a structural gait energy image(SGEI) for recognition, [21] used the top and bottomparts of gait as selected features to mitigate the effect ofthe covariates. These methods select a few parts whichare assumed to be less affected by clothing. But some ofthe chosen parts are really affected by clothing, mean-while, these methods miss some uninfluenced parts.As a result, this kind of methods cannot eliminate theinfluenced parts fully and cannot make full use of theuninfluenced data.
To enhance robustness and make full use of all data,some studies create a unique mask for each test sample,as shown in Fig. 3. Exactly, Fig. 3a illustrates the approachof Whytock et al. [22], whereby a typical GEI was cre-ated using training data with typical clothing. For a giventest sample, the probe and typical GEI are subtracted toidentify the rows that could be used to realize the recog-nition. Figure 3b shows a mask-based method combinedwith self-defined proportions [23]. Figure 3c illustrates anapproach in which the training set is used to define a maskthat determines the parts to be used [13]. Mask-basedmethods are very robust and generally achieve high recog-nition rates. However, they are time consuming becausethemaskmust be created and trained for each test sample.Moreover, the performance is influenced by the thresholdvalue.
3 Analysis of part-basedmethods and problemstatement
We design the following experiments to exhibit the weak-ness of part-base methods. We used the CASIA-B dataset[4], which includes video sequences covering 124 subjects.For each subject, there are ten sequences (six with normalclothes, two with carrying objects, and two with clothingchanges) taken from 11 different view angles (from 0° to180° at an interval of 18°). As in other studies, we use theview angle 90° and divide the dataset into three subsets.Set A includes the six normal-clothes samples for the 124
Fig. 2 Self-defined proportion methods. a The method of Gabriel-Sanz et al. [9] uses the lower part of the gait. b The method of Li and Chen [20]uses both the head and the foot part of the gait

Liang et al. EURASIP Journal on Image and Video Processing (2016) 2016:22 Page 3 of 8
Fig. 3Mask-based methods. a The method of Whytock et al. [22] uses the lower parts for recognition. b The method of Bashir et al. [23] uses theparts for recognition. c The method of Rokanujjaman et al. [13] uses a mask and gives different weights to different parts
subjects, set B includes the samples with clothing changes,and set C includes samples with objects being carried.GEI, the average silhouette in the complete gait cycle(s),
is a popular appearance-based gait representationmethod[24]. GivenN binary gait silhouette image frames, Bt(x, y),the gray-level GEI is defined as:
G(x, y) = 1N
N∑
t=1Bt(x, y). (1)
WhereN is the number of frames in the complete cycle(s)of a silhouette sequence, t is the frame number in thesequence (point in time), and (x, y) are the pixels coordi-nates. Zheng et al. [25] used GEI as the gait representationmethod, where the resolution of GEI is 240 × 240 pixels,we will also adopt it in our work. The dataset CASIA-B
has already provided silhouettes, so we need not to seg-ment the object from the video. The GEI can be gotten bythe silhouettes and Eq. (1).
3.1 The contribution of different parts without theinfluence of clothing
3.1.1 Segmentation using existing proportionsThe gait was divided into different parts using the pro-portions discussed in Section 2. Each part is describedby its position within the whole gait image. For exam-ple, part (0:0.13) denotes the data from the top of thehead down to 13 % of the height of the image, i.e.,the head; the whole gait is thus described as (0:1).Using set A of the CASIA-B dataset, a sixfold cross-validation was employed to make the experimental resultsmore robust, and two-dimensional principal component
Table 1 Recognition rate of different parts on set A (%)
Part ID Part area Percentage (%) 1 test 2 test 3 test 4 test 5 test 6 test Mean
1 (0:1) 100 100 100 99.19 99.19 97.58 98.39 99.06
2 (0:0.13) 13 78.23 87.90 86.29 87.90 86.29 81.45 84.68
3 (0:0.182) 18.2 92.74 97.58 95.97 93.55 92.74 93.55 94.36
4 (0.13:0.465) 33.5 98.39 98.39 98.39 99.19 95.97 97.58 97.98
5 (0.465:0.715) 25.1 98.39 99.19 98.39 100 97.58 97.58 98.52
6 (0.715:1) 28.5 88.71 95.16 96.77 95.97 94.35 91.94 93.82
7 (0.13:0.52) 39 98.39 98.39 98.39 99.19 98.39 97.58 98.39
8 (0.52:1) 48 96.77 99.19 99.19 99.19 97.58 98.39 98.39
9 (0.13:0.715) 58.5 99.19 100 99.19 100 98.39 99.19 99.33
10 (0:0.52) 48 98.39 98.39 97.58 99.19 95.97 96.77 97.71
11 (0.13:0.28) 15 95.97 99.19 96.77 97.58 95.97 95.97 96.91
12 (0.28:0.623) 34.3 98.39 99.19 99.19 98.39 97.58 98.39 98.52
13 (0.623:0.82) 19.7 86.29 95.16 95.97 94.35 91.94 91.94 92.61
14 (0.82:1) 18 85.48 92.74 93.55 94.35 91.13 87.90 90.86
15 (0:0.13) + (0.715:1) 41.5 95.16 99.19 97.58 97.58 97.58 95.16 97.04
16 (0:0.13) + (0.52:1) 61 97.58 100 99.19 99.19 98.39 97.58 98.65
17 (0:0.13) + (0.82:1) 31 90.32 99.19 98.39 96.77 94.35 94.35 95.56

Liang et al. EURASIP Journal on Image and Video Processing (2016) 2016:22 Page 4 of 8
analysis (2DPCA) [26] was used to reduce the numberof dimensions to 30. Classification was performed usinga nearest neighbor (NN) [27] method. Table 1 presentsexperimental results. The third column in this table showsthe percentage of data that refers to the whole gait.Columns 4–9 give the results for each cross-validation,and the tenth column lists the mean recognitionrates.From Table 1, we can see that without covariates, the
use of most parts of the gait can achieve recognition rateshigher than 95 %. In fact, most parts can be used inde-pendently or combinedly. Usually the later can get betterperformance. For example, part 15 is combined by part2 and part 6, the use of part 15 get recognition rates(97.04 %) higher than those of using part 2 (84.68 %)or part 6 (93.82 %), similarly results for part 16 and 17.We also noticed that part 1 (the head) and part 13 (thefoot and lower leg) attain lower recognition rates thanthe other parts. The reasons are people often lower theirheads, and the feet can easily introduce errors duringpreprocessing. From Table 1, we can draw the followingconclusions for data without the influence of clothing andother covariates: (1) most parts can be used independentlyfor recognition; (2) The combined parts produce betterperformance.
3.1.2 Segmentation using equal proportionsWe equally segment the gait into ten and five parts withintervals of 10 and 20 %, respectively (as shown in Fig. 4),and repeat the experiments of Section 3.1.1. Figure 4shows that similar conclusions can be drawn. Parts canbe used for recognition independently, and the 20 % datagives a higher recognition rate than any of the 10 % datawhich combined by. Table 1 and Fig. 4 lead to similarconclusions. The torso can be used to attain better recog-nition performance when it is unaffected by clothes, andcombined parts give higher recognition rates than any oftheir constituent parts.
Fig. 4 Recognition rate for equal segmentation on CASIA set A. Theblue, green, and red bars illustrate the recognition rates for the use of10,10, and 20 % of gait, respectively
3.2 The influence of clothing and feature extractionmethod
Next, we attempted to uncover how clothing and fea-ture extraction method affects recognition rate. Set A ofthe CASIA-B dataset is used for training, and set B isused as the test data. The gait images were segmentedinto equally sized proportions (as in Section 3.1.2). Threecommonly used feature extraction methods, 2DPCA [26],2DDCT+2DPCA [28], and 2DGabor+2DPCA [29] wereused to examine their influence on the results, NN wasused to classify.Experimental results are presented in Table 2. Figure 5
illustrates different clothing types. Compared with Fig. 4,Table 2 shows that, for the parts (ID = 3, 4, 5, 6, 7, 12,13, and 14) which are covered by all types of clothing, therecognition rate dropped dramatically. While for the parts(ID = 2, 8, 9, 10, 11, 15 and 16) which are covered only bysome types of clothing, the recognition rate dropped rel-atively milder. Combined the fact that there are differentclothing types in the real life and the experimental results,we can know that, to eliminate the influence of clothing,the parts covered by coat should be discarded, and theother parts can be used for the recognition task.In this section, several experiments were carried out.
The experimental results show that without the influenceof clothes, every part of the body can be used for recog-nition, but when the clothes changed, the influenced partshould be discarded and only the uninfluenced part canbe used for recognition. So the problem is to identify
Table 2 Recognition rate (%) for different feature extractionmethods when the clothing is changed
ID Part Percentage (%) 2DPCA 2DDCT + 2DGabor +
2DPCA 2DPCA
1 (0:1) 100 42.34 28.63 49.60
2 (0:0.1) 10 70.16 68.15 78.63
3 (0.1:0.2) 10 8.47 8.87 11.29
4 (0.2:0.3) 10 3.23 3.23 4.44
5 (0.3:0.4) 10 4.44 1.61 3.23
6 (0.4:0.5) 10 4.44 2.82 3.23
7 (0.5:0.6) 10 6.45 5.65 4.84
8 (0.6:0.7) 10 52.82 0.50 53.63
9 (0.7:0.8) 10 74.60 77.02 83.47
10 (0.8:0.9) 10 71.77 73.39 84.68
11 (0.9:1) 10 65.32 64.92 70.16
12 (0:0.2) 20 29.03 34.68 35.08
13 (0.2:0.4) 20 5.65 4.44 6.45
14 (0.4:0.6) 20 8.87 6.45 5.24
15 (0.6:0.8) 20 67.34 70.16 71.77
16 (0.8:1) 20 78.23 77.02 86.69

Liang et al. EURASIP Journal on Image and Video Processing (2016) 2016:22 Page 5 of 8
Fig. 5 The illustration of different clothing types and their corresponding location
the clothes-affected parts for exclusion in the recognitionprocess.
4 The proposed golden ratio-basedmethodClothing is often designed using the golden ratio.Inspired by this rule, we propose the golden ratio-basedmethod to eliminate the influence of clothes in gaitrecognition.
4.1 Golden ratioThe golden ratio is illustrated in Fig. 6, the ratio AB:AC(and the subset ratio AC:CB) is known as the goldenratio, the longer part of the line is approximately 61.8 %of the whole line. The point C, which divides the line, iscalled the golden point. This also can be illustrated usingEqs. (2)–(4).
a : b = (a + b) : a = 1 +√5
2= 1.6180339887 . . . (2)
a : (a + b) = 0.6180339887 . . . (3)
a ≈ 0.618(a + b) (4)
4.2 Golden ratio in clothing designThe golden ratio is used in clothing design to make peoplelook beautiful. We noticed that people wear certain typesof clothing more frequently. These four main clothingtypes are: short (Fig. 7a), normal (Fig. 7b), long (Fig. 7c),and longer (Fig. 7d). The short types use golden point 2referenced from H1 (from Adam’s apple to the bottom).The normal length corresponds to golden point 3 refer-enced to the central part H2 (from the Adam’s apple to theknee), and the long and longer types correspond to golden
Fig. 6 Golden ratio. For a line segment AB, C is the golden point, a:bconforms to the golden ratio
point 6 and golden point 8. These are referenced to thewhole height H.
4.3 Our methodSection 3 concluded that the coat covering parts shouldbe discarded. Combined with the design of clothing thatadheres to the golden ratio, we propose the golden ratiomethod. Considering the typical clothing types, the bodycan be segmented by golden points Gp7, Gp2, Gp3, Gp6,and Gp8 into six parts, as shown in Fig. 8. We use vari-ous subsets of these six parts, i.e., subset 1 (part 1, part3, part 4, part 5, and part 6), subset 2 (part 1, part 4,part 5, and part 6), subset 3 (part 1, part 5, and part6), subset 4 (part 1 and part 6), and subset 5 (part 1).Different subsets cover different cases, e.g., subsets 1–4correspond to parts that exclude the four main cloth-ing parts, respectively, subset 5 is the head and will beused for the clothing is longer than type 4. This is illus-trated in Table 3. For different subsets, we trained thesubset data and extracted the features of different sub-sets. For a probe sample, we distinguish the clothing typefirstly, then combined the corresponding part into subsetaccording clothing type i, extract the features, choose thecorresponding subset features of training set, and use theclassifier to obtain the recognition result. The process isillustrated in Fig. 9. Our method can be summarized asfollows:
1. Segment the GEI into six different parts according tothe golden ratio and obtain the correspondingsubsets, as shown in Fig. 8.
2. Extract features from different subsets and access thesubset feature database.
3. For a given probe sample, distinguish which clothingtype the probe belongs to, using the correspondingsubset data to determine the features of the sample.
4. Use the features of the test sample and thecorresponding training subset as two inputs of theclassifier to obtain the recognition results.
4.4 Distinguishing clothing typeFor a given test sample, we first distinguish the clothingtype to know which parts should be retained and whichshould be discarded. Clothes are almost static in the GEI,

Liang et al. EURASIP Journal on Image and Video Processing (2016) 2016:22 Page 6 of 8
Fig. 7 Four typical clothing types according to the golden ratio. a Short. b Normal. c Long. d Longer. H is the height of gait and GP stands for thegolden point
so we use the static parts of the body to detect the areaof clothing. We need only detect the lower bound of theclothes.We use the sum of static points in each row and itschange to detect the lower edge and find the coordinatesof the edge of the cloth. Generally, the lower bound ofclothes is on or under Gp2. Hence, the bound area is(0.472H ,H). For a given probe sample, if the length of theclothes is Lt , the clothes lower bound of different clothestypes are L1, L2, L3, L4, and L5, while L1 < L2 < L3 <
L4 < L5, they correspond to the lower bound of short,normal, long, longer clothes, and full long (only head canbe used), respectively. When the resolution is 240 × 240,the coordinates of the lower bounds of these clothingtypes are 113, 126, 148, 183, and 240. The clothing typeTct of testing sample is distinguished by the followingfunction:
Tct = F(argmink=1,2,3,4,5(Lk > Lt)) (5)
Fig. 8 Segmentation of the body according to the golden ratio. Gaitis segmented into six different parts
F(Li) = i. (6)
Equations (5) and (6) classify the test sample into aproper clothing type. If L2 < Lt < L3, then the cloth-ing is type 3, and we use the parts relevant to type 3,i.e., part 1, part 5, and part 6, as the effective data. Thisprocess can be illustrated by Fig. 10. For a given test-ing sample like Fig. 10a, the sum of each row in GEIwas calculated firstly, as shown in Fig. 10b. Secondly, thechanges of sum between row 100 and 200 with the inter-val 7 were calculated, as shown in Fig. 10c. Finally, theempirical threshold 2000 was used to detect the bottomof clothing, and the detected boundary was shown inFig. 10d. In this sample, the row’s number of the boundaryis 147, so the clothing type should be type 3 according toEqs. (5) and (6).
5 Experimental results and analysisWe test our method on CASIA-B dataset. Set A was usedas the training set, with sets B and C as the test sets. A two-dimensional Gabor filter (2DGabor) was used to extractthe features, and 2DPCA was used to reduce the numberof feature dimensions to 30. For a given probe sample, wedetected the lower bound of the clothes and distinguishedthe clothing type to determine which parts of the datashould be used. For instance, if the clothing is of type 3,
Table 3 Clothing types and correspond parts
Subset ID Clothing Combined parts Descriptionstype (Fig. 10)
1 1 Part 1, 3, 4, 5, and 6 Short clothes as Fig. 7a
2 2 Part 1, 4, 5, and 6 Normal clothes as Fig. 7b
3 3 Part 1, 5, and 6 Long clothes as Fig. 7c
4 4 Part 1 and 6 Longer clothes as Fig. 7d
5 5 Part 1 Head

Liang et al. EURASIP Journal on Image and Video Processing (2016) 2016:22 Page 7 of 8
Fig. 9 Flowchart of the proposed golden ratio method
then parts 1, 5, and 6 will be used as the test data. The fea-ture subset of the training data was then selected, and NNused to obtain the recognition results. Table 4 presents theexperimental results.Table 4 shows that our method performs better than the
other methods, achieving a recognition rate of 94.76 % inclothing-change situations. When objects are being car-ried, the recognition rate was 91.53 %. The reason forthis superior performance is that the golden ratio takesthe characteristics of clothing into consideration, enablingall the clothing parts to be discarded and the unaffectedparts of the gait to be retained. At the same time, eachtest sample was segmented according to its clothing type,which made the performance of the proposed methodmore robust.Compared with the anatomical proportion-based
method, such as [11], golden ratio-based method dis-carding all the affected parts and make full use of theunaffected data. Thus, the golden ratio-based methodattains a higher recognition rate and is more robust.Compared with self-defined proportion method, such
as [20] and [21], the proposed method can keep moredata than self-defined proportion method becauseit distinguish the clothing type before segmenta-tion, and use different proportion for different probesample.Compared with mask-based methods, such as [23] and
[22], the proposed method achieves better recognition
performance. This is because the golden ratio methoddiscards the whole rows instead of parts of rows, thuscompletely discarding the areas affected by clothing. Asclothes not only influence the static part, but also themotion part of the gait, the whole influenced row shouldbe discarded. The golden ratio method has the merits ofmask-based methods, segmenting according to the testsample, which makes it flexible and robust. However, theproposed method does not require a training procedurefor each test sample.The proposedmethod is quite simple. Though detecting
the clothing boundary involves some time, the usage ofparts instead of whole gait saves some time. Hence, theproposed method would not increase the computationalcomplexity of the gait recognition system. Different from[21] which conducts recognition process multiple times tofind the boundary of top and bottom part, the proposedmethod only conducts once.
6 ConclusionsIn this paper, we first have investigated the contributionof different parts of gait with and without the influenceof clothing. We found that the key problem is to findout the exact part of clothing, and discard it. Consider-ing that the human body conforms to the golden ratio,and that clothing are designed according to this ratio,we proposed the golden ratio segmentation method toeliminate the influence of clothing. Experimental results
Fig. 10 The process of detecting the clothing bottom boundary. a A given GEI. b The sum of line of GEI. c The changes of the sum between the line100 and 200. d The detected bottom boundary of clothing
Liang et al. EURASIP Journal on Image and Video Processing (2016) 2016:22 Page 8 of 8
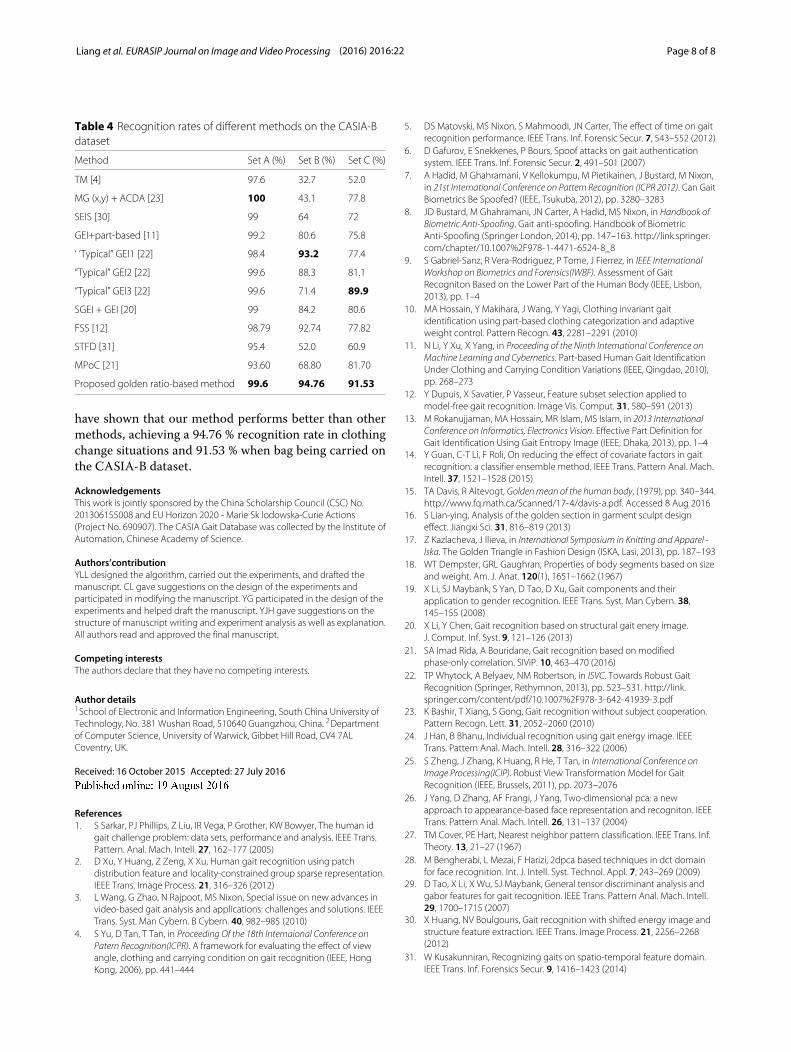
Table 4 Recognition rates of different methods on the CASIA-Bdataset
Method Set A (%) Set B (%) Set C (%)
TM [4] 97.6 32.7 52.0
MG (x,y) + ACDA [23] 100 43.1 77.8
SEIS [30] 99 64 72
GEI+part-based [11] 99.2 80.6 75.8
‘ ‘Typical” GEI1 [22] 98.4 93.2 77.4
“Typical” GEI2 [22] 99.6 88.3 81.1
“Typical” GEI3 [22] 99.6 71.4 89.9
SGEI + GEI [20] 99 84.2 80.6
FSS [12] 98.79 92.74 77.82
STFD [31] 95.4 52.0 60.9
MPoC [21] 93.60 68.80 81.70
Proposed golden ratio-based method 99.6 94.76 91.53
have shown that our method performs better than othermethods, achieving a 94.76 % recognition rate in clothingchange situations and 91.53 % when bag being carried onthe CASIA-B dataset.
AcknowledgementsThis work is jointly sponsored by the China Scholarship Council (CSC) No.201306155008 and EU Horizon 2020 - Marie Sk lodowska-Curie Actions(Project No. 690907). The CASIA Gait Database was collected by the Institute ofAutomation, Chinese Academy of Science.
Authors’contributionYLL designed the algorithm, carried out the experiments, and drafted themanuscript. CL gave suggestions on the design of the experiments andparticipated in modifying the manuscript. YG participated in the design of theexperiments and helped draft the manuscript. YJH gave suggestions on thestructure of manuscript writing and experiment analysis as well as explanation.All authors read and approved the final manuscript.
Competing interestsThe authors declare that they have no competing interests.
Author details1School of Electronic and Information Engineering, South China University ofTechnology, No. 381 Wushan Road, 510640 Guangzhou, China. 2Departmentof Computer Science, University of Warwick, Gibbet Hill Road, CV4 7ALCoventry, UK.
Received: 16 October 2015 Accepted: 27 July 2016
References1. S Sarkar, PJ Phillips, Z Liu, IR Vega, P Grother, KW Bowyer, The human id
gait challenge problem: data sets, performance and analysis. IEEE Trans.Pattern. Anal. Mach. Intell. 27, 162–177 (2005)
2. D Xu, Y Huang, Z Zeng, X Xu, Human gait recognition using patchdistribution feature and locality-constrained group sparse representation.IEEE Trans. Image Process. 21, 316–326 (2012)
3. L Wang, G Zhao, N Rajpoot, MS Nixon, Special issue on new advances invideo-based gait analysis and applications: challenges and solutions. IEEETrans. Syst. Man Cybern. B Cybern. 40, 982–985 (2010)
4. S Yu, D Tan, T Tan, in Proceeding Of the 18th Internaional Conference onPatern Recognition(ICPR). A framework for evaluating the effect of viewangle, clothing and carrying condition on gait recognition (IEEE, HongKong, 2006), pp. 441–444
5. DS Matovski, MS Nixon, S Mahmoodi, JN Carter, The effect of time on gaitrecognition performance. IEEE Trans. Inf. Forensic Secur. 7, 543–552 (2012)
6. D Gafurov, E Snekkenes, P Bours, Spoof attacks on gait authenticationsystem. IEEE Trans. Inf. Forensic Secur. 2, 491–501 (2007)
7. A Hadid, M Ghahramani, V Kellokumpu, M Pietikainen, J Bustard, M Nixon,in 21st International Conference on Pattern Recognition (ICPR 2012). Can GaitBiometrics Be Spoofed? (IEEE, Tsukuba, 2012), pp. 3280–3283
8. JD Bustard, M Ghahramani, JN Carter, A Hadid, MS Nixon, in Handbook ofBiometric Anti-Spoofing. Gait anti-spoofing. Handbook of BiometricAnti-Spoofing (Springer London, 2014), pp. 147–163. http://link.springer.com/chapter/10.1007%2F978-1-4471-6524-8_8
9. S Gabriel-Sanz, R Vera-Rodriguez, P Tome, J Fierrez, in IEEE InternationalWorkshop on Biometrics and Forensics(IWBF). Assessment of GaitRecogniton Based on the Lower Part of the Human Body (IEEE, Lisbon,2013), pp. 1–4
10. MA Hossain, Y Makihara, J Wang, Y Yagi, Clothing invariant gaitidentification using part-based clothing categorization and adaptiveweight control. Pattern Recogn. 43, 2281–2291 (2010)
11. N Li, Y Xu, X Yang, in Proceeding of the Ninth International Conference onMachine Learning and Cybernetics. Part-based Human Gait IdentificationUnder Clothing and Carrying Condition Variations (IEEE, Qingdao, 2010),pp. 268–273
12. Y Dupuis, X Savatier, P Vasseur, Feature subset selection applied tomodel-free gait recognition. Image Vis. Comput. 31, 580–591 (2013)
13. M Rokanujjaman, MA Hossain, MR Islam, MS Islam, in 2013 InternationalConference on Informatics, Electronics Vision. Effective Part Definition forGait Identification Using Gait Entropy Image (IEEE, Dhaka, 2013), pp. 1–4
14. Y Guan, C-T Li, F Roli, On reducing the effect of covariate factors in gaitrecognition: a classifier ensemble method. IEEE Trans. Pattern Anal. Mach.Intell. 37, 1521–1528 (2015)
15. TA Davis, R Altevogt, Goldenmean of the human body, (1979), pp. 340–344.http://www.fq.math.ca/Scanned/17-4/davis-a.pdf. Accessed 8 Aug 2016
16. S Lian-ying, Analysis of the golden section in garment sculpt designeffect. Jiangxi Sci. 31, 816–819 (2013)
17. Z Kazlacheva, J Ilieva, in International Symposium in Knitting and Apparel -Iska. The Golden Triangle in Fashion Design (ISKA, Lasi, 2013), pp. 187–193
18. WT Dempster, GRL Gaughran, Properties of body segments based on sizeand weight. Am. J. Anat. 120(1), 1651–1662 (1967)
19. X Li, SJ Maybank, S Yan, D Tao, D Xu, Gait components and theirapplication to gender recognition. IEEE Trans. Syst. Man Cybern. 38,145–155 (2008)
20. X Li, Y Chen, Gait recognition based on structural gait enery image.J. Comput. Inf. Syst. 9, 121–126 (2013)
21. SA Imad Rida, A Bouridane, Gait recognition based on modifiedphase-only correlation. SIViP. 10, 463–470 (2016)
22. TP Whytock, A Belyaev, NM Robertson, in ISVC. Towards Robust GaitRecognition (Springer, Rethymnon, 2013), pp. 523–531. http://link.springer.com/content/pdf/10.1007%2F978-3-642-41939-3.pdf
23. K Bashir, T Xiang, S Gong, Gait recognition without subject cooperation.Pattern Recogn. Lett. 31, 2052–2060 (2010)
24. J Han, B Bhanu, Individual recognition using gait energy image. IEEETrans. Pattern Anal. Mach. Intell. 28, 316–322 (2006)
25. S Zheng, J Zhang, K Huang, R He, T Tan, in International Conference onImage Processing(ICIP). Robust View Transformation Model for GaitRecognition (IEEE, Brussels, 2011), pp. 2073–2076
26. J Yang, D Zhang, AF Frangi, J Yang, Two-dimensional pca: a newapproach to appearance-based face representation and recogniton. IEEETrans. Pattern Anal. Mach. Intell. 26, 131–137 (2004)
27. TM Cover, PE Hart, Nearest neighbor pattern classification. IEEE Trans. Inf.Theory. 13, 21–27 (1967)
28. M Bengherabi, L Mezai, F Harizi, 2dpca based techniques in dct domainfor face recognition. Int. J. Intell. Syst. Technol. Appl. 7, 243–269 (2009)
29. D Tao, X Li, X Wu, SJ Maybank, General tensor discriminant analysis andgabor features for gait recognition. IEEE Trans. Pattern Anal. Mach. Intell.29, 1700–1715 (2007)
30. X Huang, NV Boulgouris, Gait recognition with shifted energy image andstructure feature extraction. IEEE Trans. Image Process. 21, 2256–2268(2012)
31. W Kusakunniran, Recognizing gaits on spatio-temporal feature domain.IEEE Trans. Inf. Forensics Secur. 9, 1416–1423 (2014)