RESEARCH ON THE PROPERTIES OF AMORPHOUS … · Pag^ 84,85 86,87 88,89 90,91 92,93 . Wr" ^mmmtmmmm...
108
Mwa* AD-766 142 RESEARCH ON THE PROPERTIES OF AMORPHOUS SEMICONDUCTORS AT HIGH TEMPERATURES John P. deNeufville Energy Conversion Devices, Incorporated y Prepared for: Advanced Research Projects Agency 17 June 1973 DISTRIBUlEDBY: KJUl National Technical Information Service U. S. DEPARTMENT OF COMMERCE 5285 Port Royal Road, Springfield Va. 22151
Transcript of RESEARCH ON THE PROPERTIES OF AMORPHOUS … · Pag^ 84,85 86,87 88,89 90,91 92,93 . Wr" ^mmmtmmmm...

- r »■--' -^ -r- i ' "^ ,l" ' '-""»"" "-l l"«1'"" mi i «m m^^mmm^nmm
■Mwa*
AD-766 142
RESEARCH ON THE PROPERTIES OF AMORPHOUS SEMICONDUCTORS AT HIGH TEMPERATURES
John P. deNeufville
Energy Conversion Devices, Incorporated
y
Prepared for:
Advanced Research Projects Agency
17 June 1973
DISTRIBUlEDBY:
KJUl National Technical Information Service U. S. DEPARTMENT OF COMMERCE 5285 Port Royal Road, Springfield Va. 22151
— - ■

_-
<
FOURTH SEMI-ANNUAL TECHNICAL REPORT
Contract DAHC15-70-C-0187
RESEARCH ON THE PROPERTIES OF
AMORPHOUS SEMICONDUCTORS
AT HIGH TEMPERATURES
Prepared by: Energy Conversion Devices, Inc. 1675 W. Maple Road Troy, Michigan 48084
For: Advanced Research Projects Agency [Order No. 1570; Program Code 0D10]
Contract Period: 18 May 1970 to 17 May 1973
Total Contract Price: $976,786.00
NATIONAL TECHNICAL INFORMATION SERVICE
D D
-HSLsi] , v"
Apptw«i to • ■ *****
Copy No. \'7
J. P. deNeufville Program Technical Manager 313-549-7300
/? id

mmmi*m**^mmimmm**m •^i^mm**^- • '<•<•• •••> " '
1 üoclaiiiüed
Secunty Classification /
DOCUMENT CONTROL DATA • RID rSacwWtr tlmflllcmuan ol llilm. ke4* ml mbtlmct an« tn«*»»« annaiaiien muti »• •nitn* •*•« if— ormrmll r»pori I» cl«««i/i»<«)
I Omr.lNATINC ACTIVITY (Coipormn mjlhof)
Energy Conversion Devices, Inc. 1675 W. Maple Road, Troy, Michigan 4B084
I« ■c»a»T «acux'Tv c L ••«I'IC* Tio«
Unclassified I» «KOU»
N/A 1 nt^ONT TITLl
RESEARCH ON THE PROPERTIES OF AMORPHOUS SEMICONDUCTORS AT HIGH TEMPERATURES
4 DCSCmPTl vE NO'ES rTvp« a« »parr «n« inc/u«iv« d»im»>
Fourth Semi-Annual Technical Report - 19 De^ 1971 to 18 May 1972 S AUTHOR'S; CLaal name. Unl n«m« mma/J
deNeufville, John P.
• MCPonr OATC
17 June 1973 7a TOTAL HO or »Aart
n wr/C'l 76. HO OP RCrt
53 • a CONTRACT O-l GRANT NO.
DAHC15-70-C-0187 k RROJCCT HO.
1001/36
tRfSj
516-4
• A. OTHSR RIRORT NO^S) (Any olhmr numbmrt thai may ba «aaf^tad Ala mpan)
None
10 A VA lUABILITY/UMITATION MOTICCS
The distribution of this report is unlimited
H SUPPLCMCNTAMV NOTES 01 »;n;,;if;.!:0"3 m
this document may b«b«H«r
»tudiod on microft;h«.
I> SRONSORIMG MILITARY ACTIVITY
Advanced Research Projects Agency Arlington, Virginia 22209
«3 ABSTRACT 1. Measurement of Tg versus composition In the Ce-Se-Te system have revealed that the Tg singularity, which occurs at the fully cross-linked dl-chalcogenlde composition (GeSe2) in the Ge-Se binary system, does not extend along the GeTe2 - GeSe2 line of chalcogen saturation in the ternary system, but rather deviates pro- gressively towards Ge as Te Is substituted for Se. This tendency appears to reflect the competitive effects of bond strength, as measured by band gap, and connected- ness, as measured by the 8-N rule, In determining Tg. 2. A region of liquid Immisciblllty was discovered In the GeSe2-GeTe2-Te sub- systf.m of the Ge-Se-Te ternary system. Tie lines appear to radiate from a GeSe2- rich liquid toward a range of Te-rich Te-Se liquids. This immisclbllity leads to the formation of 2-rhase glasses for certain compositions In this region, and the Tg's and Tx's of each phase can be separately measured by scanning calorlmetry. 3. This Immisciblllty tendency is termed "primary Immisciblllty" since It can be slmpl/ predicted as a topologlcal consequence of the thermodynamlc requirement of forming the lowest energy set of covalent chemical bonds. Thus G'^oSe^Te^or GeSe2Te2 can be regarded as a mixture of GeSe2 and Te2, which ire constructed of Ge-Se and Te-Te chemical bonds respectively. Only by phycically separating these two phases can one eliminate Se-Te, Ge-Te, Se-Se, and Ge-Ge bonds whose pre- sence results In a demcnstr^MG decrease In overall bonding energy. 4. We have observed copious nucleation of tiny Te crystals upon heating sputtered
DD /^ 1473 Unclassified Security Classification
in tmmt — - _ i ..

'■' '"
Unclassified Security Classification
//
1 •vr
KCT «OKOI
Amorphous Semiconductors Amorphous Materials Chalcogenide Materials High Temperature Device Materials
LINK * .NK ■ i.lHK C
amorphous films of Ce^QSe^QTe^Q, and we tentatively associate this phenomenon with the separation of a Te-rich liquid which spontaneously nucleates and crystallizes without the requirement of the familiar surface nucleation sites which characterize the nucleation and crystallization of most other telluride glass samples. Indeed, unlike other telluride alloys, the volume fraction of Te crystals depends on time and temperature alone, and not at all on film thickness. 5. The electrical and optical measurements of amorphous alloy phases in the Ge-Se- Te ternary system supply abundant evidence for chemical ordering for well annealed sputtjred films of composition GeTe2 and GeSe2. Each of these alloys can be modeled by the Si02 structure with tetrahedral Ge and 2-fold chalcogen, a structure which contains only one chemical bond type (i.e., Si-O, Ge-Se, Ge-Te, etc.). .6. The thermopower of unannealed and annealed sputtered amorphous Ge-Se-Te films has been surveyed extensively, resulting in the discovery of a wide variety of n-type amorphous chalcogenide alloys among the annealed Se-rich and Ge-rich ternary alloy sputtered film samples. Numerous examples of initially p-type sputtered alloys which become n-type .upon annealing at or below Tg have been discovered, leading to a wide variety of new electronic device possibilities. In addition to exposing these potential technological developments, the thermopower measurements have served a highly useful scientific role In characterizing the majority charge carriers as a function of alloy composition, state of annealing and temperature.
Unclassified -^T P-
.■^—— , ■ . .^m^m '.

« <■!■ P ■' "l" ' ' "U I"»IP" ■»•"- i iinanvMini« ^MW^mi'* ■,- ■" niWIP^PH»IW^WI^»-^l^^»»^^WHPi
///
TABLE OF CONTENTS
1 . INTRODUCTION AND SUMMARY OF MAJOR ACCOMPLISHMENTS
1 .1 Introduction
2. GLASS FORMATION AND PHASE SEPARATION IN THE GeSe-GeTe-Se-Te SYSTEM
2.1 Introduction
2.2 Limits of Glass Formation
2.3 Compositional Dependence of T
2.3.1 Binary Systems
2.3.2 Pseudoblnary Systems
2.4 Evidence for Phase Separation
2.4.1 Construction of Tie Lines
2.5 Discussion and Conclusions
2.5.1 Analysis of T vs. X Behavior in the g
GeSe-GeTe-Se-Te System
2.5.2 Analysis of Ordering and Separating Tendencies
3. CRYSTALLIZATION OF SPUTTERED Ge„ .Se ..Te ,n IU 4U 4U
3.1 Intioductlon
3.2 Qualitative X-ray and TEM Observations of Crystallization Behcwior
3.3 Study of Structural Evolution
3.3.1 Volume fraction Calculations
3.3.2 Particle Size Calculations
3.3.3 Integrated Bragg Peak Intensity R suits
Page
1
1
10
10
17
26
26
^2
44
44
46
16
52
56
56
57
63
63
64
66
M ■— -

H» miv wmm—mmmr*^^m — ' 1
n
TABLE OF CONTFNTS (CONT.)
3.3.4 Particle Size Evolution vs. Annealing Temperature
3.4 Discussion and Conclusions
4. ELECTRICAL AND OPTICAL PROPERTIES OF AMORPHOUS PHASES IN THE Ge-Se-Te SYSTEM
4.1 Introduction
4.2 Summary of Electrical and Optical Properties
4.3 Discussion
4.4 Summary and Conclusions
BIBLIOGRAPHY
Page
72
76
81
81
31
89
95
96
ma

'»■■ "' " ■ "I ' ' im^^m^mt n PIUI.I. i i i^Bw^pa^a^
v LIST OF FIGURES
Figure Title Page
2.1 Mapping of Preparation Method and Investi-
gated Alloys in Ge-Se-Te System 2 3,24
2.2 T and T for Ge-Te Binary System 27,28 g x
2.3 T for Ge-Se Binary System 29,30
2.4 T for Se-Te Binary System 33,34
2.5 T for GeSe-GeTe Pseudo-Binary System 35,36
2.6 T for GeSe-GeTe Pseudo-Binary System 38,39
2.7 T for Ge-SeTe Pseudo-Binary System 40,41
2.8 T Isotherms for Ge-Se-Te Ternary System 4 2,43
3.1 X-Ray Diffraction Patterns for Thermal
Crystallization of Ge Se Te Films 58,59
3.2 TEM Photomicrograph (e.) and Selected Area
TED (b) for 500 A Ge Se Te„n Film Annealed 20 40 40
at 1450C for 30 Min. 61,62
3.3 Volume Fraction of Crystallization Products
for Ge„-Se ..Te .,, Films vs. Annealing 20 40 40
Temperature 69,70
3.4 Crystallite Size vs. Annealing Temperature for
Ge20Se40Te40 FilmS 74'75
3.5 T ,T and T* in Te-Ge+Se System 78,79 m g
I^MI m

■■ ■ ■> mmmmm^»"! » ■ ' ••• •-'^*mmmm*ii^m*^inm\,<\ i i vmmmmwmmmmm HpatnomPRni^wi iiii "■ i"i I»I "•■ - mim» »>
Figure
4.1
4.2
4.3
4.4
4.5
VI LIST OF FIGURES (CONT.)
Title
T , T and Annealing Temperature for Ge-Te, g x
Ge-Se and Ge-Te Se Binaries
Optical Gap E^, vs. Fraction Ge for Ge-Te, 04
Ge-Se and Ge-Te„ .Se. _ Binaries U . o U . o
O Electrical Conductivity at 25 C vs. Fraction Ge
for Ge-Te, Ge-Se and Ge-Te Se Binaries
P- and N-Type Regions for Sputtered Amorphous
Films in the Ge-Se-Te Ternary
Isoresistivity Lines for Sputtered Amorphous Films
in the Ge-Se-Te Ternary
Pag^
84,85
86,87
88,89
90,91
92,93

Wr" ^mmmtmmmm ———-
I'll
UST OF TABLES
Table Title Page
2.1
3.1
Composition, Method of Glass Preparation
and Glass Transition Temperature for
Ge-Se-Te Alloys
X-Ray Data for Thermal Crystallization of
Sputtered Amorphous Ge„nTe Se Films:
Intensities
18 - 22
68
3.2 X-Ray Data for Thermal Crystallization of
Sputtered Amorphous Ge Te Se Films:
Peak Breadths 72,73
■ n ■ .«M^tidMilMl J

i^mmm* i« . ■ i i mi 11 «« "■■■j i », ii in i UMI MI i i ■ ii iimuijpiini | m nm"m^^^^mm *^m^*m*m^m*^vm ii.ni|i« IIIII IM«
1
I. INTRODUCTION AND SUMMARY OF MAJOR ACCOMPLISHMENTS
1.1 Introdi'ction
The overall emphasis in this research program has been the correlation
of amorphous chalcogenide alloy composition and atomic structure on the one
hand, and with thermal stability, electronic structure, and electrical and ootical
properties on the other hand. The Fourth and Fifth Semiannual Technical
Reports analyzo, respectively, two separate aspects of this problem: 1« the
role of chemical clustering and ordering tendencies in controlling thermal
and electronic properties; and 2, the role of thin film depositional parameters,
illumination, and annealing in controlling the structural state and thus the
electronic properties (primarily the optical properties) of amorphous films. No
overall synthesis of composition - property relations for this immense new
class of electronic and optical materials can be imagined prior to the establish-
ment of these two fundamental types of information. In the present report, the
role of chemical clustering and ordering is assessed for a prototypical three-
component chalcogenide system, Ge-Se-Te. This system was chosen because
it spans a wide range of materials parameters: T varies from ~0 C (for pure Te)
to ~4250C (for GeSe ), while E ., the photon energy at which the optical ab-
sorption coefficient aLtains the value 10 cm , varies from -0.8 eV (for Te)
to~2.4 eV (for GeSe ). D.C. conductivity, broadly speaking, correlates with
optical gap, although the subtle differences between the conductivity "gap"
(twice the electrical activation energy) and the optical gap form the basis for
interpreting the electronic band structure as a function of alloy composition
Mi -^a^MMBM

III-lll«! ■ '— ' —'■■ - '• ■ dH ■'' • ■■-- ........I P> ■■ ■■■ HI ■■^l
and state of annealing as presented in the Final Technical Report. Thermo-
power. on the other hand, is an extremely sensitive function of composition
and the degree of annealing, shifting from p-type to n-type with annealing
for some of the Ge and Se-rich alloys.
In addition to having a wide range of property variations, most of these
ternary alloys can be relatively well characterized structurally. Pure
51 amorphous Ge, for example, is well described by the Polk Model" , while
the binary Te-Se amorphous phases consist of copolymer 2-connected rings
and chains. GeTe and GeSe are usually assumed to be structural ana-
loges to SiO , although the hard evidence for these assumptions obtained
47 48 50 under the present research program ' and elsewhere is very recent. The
issue of the structure of amorphous GeTe and the GeTe-GeSe alloys was
examined in detail in our Third Semiannual Technical Report. Several colla-
borative efforts between ECD and their laboratories are currently under way to
resolve the issue of the 3-fold model vs. the 2-fold Te and 4-fold Ge model.
Thus the property trends toward higher T 's and larger band gaps with
the substitution of Se for Te take place (again, with the possible exception of
the less understood GeTe-GeSe structures) along isomorphous series whose
structure depends, for the most part, on the Ge:X ratio rather than on the
Se:Te ratio. Since the number of valence electrons per atom, n , varies con- e
tinuously from 6 for the chalcogens Se and Te to 4 for pure Ge, this system
encompasses the entire range of average valence electron concentration which
leads to covalently bonded polymeric alloys. Values of n higher than 6 lead
M—ittfc^-i»^^......^..—..._.. .._._

mfr^^v-^^mmm mmmm^rmmi^m^m^m ■' ■-"" 11 im.wmmiu
to molecular materials with low thermal stability and unstable amorphous
structures while values of n lower than 4 lead generally to metallicly e
bonded materials with low glass forming tendencies. We have felt it
necessary to survey the properties of more complex ternary amorphous chal-
cogenide systems in order to obtain c?n overview of all of the factors which
determine thermal stability and electronic properties, and these studies
will be reviewed in the Final Technical Report. The present report, however,
represents the most thorough study, to our knowledge, of a ternary chalcoge-
nide system, and thus will be used as the starting point in attempting to
analyze the more complex ternary systems.
In concluding this introduction, it should bo noted that the technique of
rf sputtering to deposit amorphous thin films has been a cornerstone of the
technical approach we have utilized in these studies. When conductivities
and vapor pressures vary over 10 decades or more at a given temperature,
most other techniques of thin film deposition are inadequate for preparing
homogeneous films ranging between 300A (for transmission electron micros-
copy) to lOOmn (for calorimetry and IR reflectivity studies) in thipkness.
Flash evaporation, slow thermal evaporation, co-evaporation, dc sputtering
and other techniques have been successfully applied to some ranges of these
sample requirements by ourselves (for cross-checking purposes) and by others.
Many of these latter techniques do present certain advantages compared to
rf sputtering, most noticeably in the area of oxygen, nitrogen and argon con-
tamination, which can, of course, be essentially eliminated by evaporation
^-•■^- -

^•^nflWPBWWP^^^^P«. mi "PW^-—-—«P-« vwni^mmmwmmm mMmmmnm^w
under UHV condiüons. However it has been our goal to prepare amorphous
filus of as wide a variety of compositions as possible and to characterize
these films in terms of properties like optical gap and glass transition tempera-
ture, which are largely insensitive to trace impurities.
A further word on the rf sputter deposition of multi-component chalco-
genide alloys is . :quired to characterize compositional fidelity of the sput-
tered films with respect to the nominal hot-pressed cathode compositions.
We have used electron microprobe to analyze films sputtered along the Ge-Te bina-
ry join and along *he GeSe2-GeTe2 pseudo-binary join. The accuracy of these
experiments was somewhat limited by the difficulty of obtaining homogeneous
bulk materials for use as reference standards. However, taking these diffi-
culties into consideration we can simply summarize the results of these
studies by stating that the measured concentrations of the elemental com-
ponents were within 1 - 2% of the stated compositions, depending on con-
centration. For example a thin film of GeSeTe or Ge Se Te would
be expected to have the composition Ge33>3±1 Se33>3±1 Te^ 3±1. The ac-
tual analysis for one sample of that film was ^34+^^^^, where the
±1% now represents the accuracy of the analysis itself. This is a typical
result, indicating the difficulty of ascertaining highly accurate knowledge of
chemical composition using this method of analysis. We thus relied on the
nominal composition as the measure of film composition throughout these
studies, recognizing that this assumption introduces a small uncertainty into
the results thereby obtained. Furthermore, o-jr analysis of the role of dc bias
tan

lliIMW '■ ' i»> ■■mi tm ""■ " "■ -""' II..IP* .1 II.WIIIBIIIIB ii mill i I«II i .III^I
mmmtmmmmmKmBU
!
in determining both argon entrappment and stoichiometric deviations for
sputtered GeTe^ which will be presented in the Final Technical Report,
provides an additional warning regarding small compoFitional fluctuations
from sputtered sample to sample which may arise from differnces of induced
dc bias depending on minute details of sputterino procedure and substrate
type. These differnces tend to be troublesome only for materials like
GeSe2 whose properties depend so sensitively on stoichiometry and whose
high resistivity accentuates the possibility of self-biasing effects.
nuiMimii i

—-———- ■ II I I 111 ,. I I 1 " —' «•< *« «""' mmm* -w^m^m^m
1.2 Summary of Major Accomplishments
1. Measurements of T versus composition in the Ge-Se-Te system 9
have revealed that the T singularity, which occurs at the fully cross- 9
linked di-chalcogenide composition (GeSe2) in the Ge-Se binary system,
does not extend along the GeTe - GeSe2 line of chalcogen saturation
in the ternary system, but rather deviates progressively towards Ge as
Te is substituted for Se. This tendency appears to reflect the compe-
titive effects of bond strength, as measured by band gap, and connected-
ness, as measured by the 8-N rule, in determining T . In the Ge-Te
system, theGe-Ge bonds are stronger than the Ge-Te bonds, while
In the Ge-Se system the reverse is true. Thus the highest T in the y
Ge-Te system presumably occurs at Ge (although this cannot be experi-
mentally verified bacause T occurs below T between GeTe and Ge) x y ^
whereas the highest value of T in the Ge-Se system occurs at GeSe , g *
2. A region of liquid immiscibility was discovered in the GeSe2-GeTe2-Te
subsystem of the Ge-Se-Te ternary system. Tie lines appear to radiate
from a GeSe -rich liquid toward a range of Te-rich Te-Se liquids. This
immiscibility leads to the formation of 2-phase glasses for certain compo-
sltions in this region, and the T 's and T 's of each phase can be sepa- g x
rately measured by scanning calorimetry.
3. This immicibility tendency is trmed "primary immiscibility" since it
can be simply predicted as a topological consequence of the thermodyrnic re-
quirement of forming the lowest energy set of covalent chemical bonds. Thus

r " < ■ ».mi^mmmmjmm*r~^ —m^m^mi i , i u ii^mmmmmmmr***"^ PWIV*^^'*1 ' ! ••"-^vvawvaMBH
Ge Se Te or GeSe Te can '^ regarded as a mixture of GeSe and
Te , which are constructed of Ge-Se and Te-Te chemical bonds respectively.
Only by physirally separating these two phases can one eliminate Se-Te,
Ge-Te, Se-Se, and Ge-Ge bonds whose presence results in a demon-
strable decrease in overall bonding energy. Of course entropic effects
are significa it, so that, for example, the GeSe -rich phase of Ge Se Te
contains roughly 13 atomic percent Te.
4. The chemical bonding origins of this immiscibility indicate that the
phase separating glasses containing the most Te-rich low T phase should g
lie along the join connecting Te and GeSe , e.g., Ge Se Te . Pure
liquid Te cannot be supercor/ed by any known method to form a glass,
presumably because of homogeneous nucleation of crystals during the
quench. Thus the separation of a very Te-rich liquid at temperatures well
below the Te melting point leads to the possibility for homogeneous nucle-
ation of Te crystals ir that liquid. We have observed copious nucleation
of tiny Te crystals upon heating sputtered amorphous films of Ge Se Te ,
and we tentatively associate this phenomenon with the separation of a Te-
rich liquid which spontaneously nucleates and crystallizes without the
requirement of the familiar surface nucleation sites which characterize
the nucleation and crystallization of most other telluride glass samples.
Indeed, unlike other telluride alloys, the volume fraction of Te crystals
depends on time and temperature alone, and not at all on film thickness.
We feel that this observation may be unique among amorphous chalcogenide
1
MHMMMMB 4laMi|M .^MMBMk

imiri^mrm^~~w**~^*—*,^^**'~*'*m .1 • IIW.I. IJIIII« I imtm^u . »■....., 11 lWll"»i
8
films, and may have practical consequences for situations requiring the
presence of electrically conducting particles in an essentially non-con-
ducting matrix.
5. The electrical and optical measurements of amorphous alloy phases
in the Ge-Se-Te ternary system supply abundant evidence for chemical
ordering for well annealed sputtered films of composition GeTe and
GeSe . Each of these alloys can be modeled by the SiO structure with 2 2
tetrahedral Ge and 2-fold chalcogen, a structure which contains only
one chemical bond type (i.e., Sl-O, Ge-Se, Ge-Te, etc.). Along the
join Ge-SeTe the optical and electrical gaps both peak sharply for
annealed films at the di-chalcogenide GeSeTe composition, indicating
a high degree of chemical order for that alloy as well. Here, however,
both Ge-Se and Ge-Te bonds are concluded to be present, and, thus the
alloys are disordered with respect to the distribution of these two bond
types but are ordered with respect to the exclusion of the other 4 possible
bond types (Ge-Ge, Se-Se, Te-Te and Se-Te). These results confirm
our earlier speculation concerning local order in the amorphous GeSe -
GeTe alloy system, and support our earlier conclusion that these pseudo-
3 binary alloys do not phase separate.
6. The thermopower of unannealed and annealed sputtered amorphous Ge-
Se-Te films has been surveyed extensively, resulting in the discovery of a
wide variety of n-type amorphous chalcogenide alloys among the annealed
Se-rich and Ge-rich ternary alloy sputtered film samples. Numerous
examples of initially p-type sputtered alloys which become n-type upon
--

— — r ii mmi'mm fmMmtmmi M..»II I . HI ■wvva^n^naw^lMl ii ii .«:ii.i iiwmfmvm*rr
annealing at or below T have been discovered, leading to a wide variety
of new electronic device possibilities. In addition to exposing these
potential technological developments, the thermopower measurements
have served a highly useful scientific role in characterizing the majority
charge carriers as a function of alloy composition, state of annealing,
and temperature.
mm ma^m

mm^wmfmm^K^tmmmmm'wmm """■■■, ,L "■ ■ I - miMIIB IMIWOJIMH
10
2. GLASS FORMATION AND PHASE SEPMRATION IN THE GeSe-GeTü-Se-Te SYSTEM
2.1 Introduction
The chalcogen and chalcogenide glasses are well known to exhibit
covalent bonding, and the valency satisfaction model of Mott is the
standard point of departure in interpreting electrical or optical properties
of these glasses. This model, and the nearly equivalent random cova-
2 lent model, assumes that each constituent atom in the glass forms 8-N
covalent bonds whore N is the number of valence electrons. The identi-
fication of these bonds in the Mott model is left vague, while the random
covalent model assumes that a random statististical distribution of all
possible covalent bond types will occur. By contrast, various ordered co-
3 valent models have also been proposed which consider the effect of
relative bond strengths in calculating the distribution of bond types, and
can lead to complete chemical ordering at certain stoichiometnc ratios
such as UeSe . SeTe, etc.
X-ray structural studies of chalcr^-nide glasses using the Radial Distri-
bution Function (RDF) technique confirm the covalent nature of the chemical
4 bonds, both with regard to bond length and with regard to average coordi-
nation number as predicted by the 8-N rule for each atom. Thus the valency
satisfaction model, which was created to account for the absence of impurity
band conduction in amorphous chalcogenide alloys, is thoroughly confirmed
by the X-ray studies which have been performed.
Unfortunately the X-ray studies do not successfully address the question
of chemical ordering, and the observed RDF functions can bo fitted by a variety of
models including chemically ordered covalent models, random covalent models.
I——llll I

mr ' ' ' "wu'««»
11
and even completely phase separated models, so long as each elemental
component retains its 8-N coordination. An additional problem arises by
the inability of RDF analysis to distinguish whether the 8-N coordination
applies for individual atoms or whether cm average 8-N coordination applies
wheie N is the average valence number per atom. For example RDF analysis
cannot yet disnnguish between a 4 fold Ge - 2 fold Te structure for amorp-
hous GeTe versus a 3 fold Ge - 3 fold Te structure. Hopefully more sophis-
ticated diffraction experiments will resolve these questions, but in the
meantime other measurements will play some role for determining nearest
neighbor bonding within the constraints of covalent bonding models.
The Ge-Te-Se system can be decomposed into two sub-systems:
Ge-GeSe2 - GeTe2 and GeSe2 - GeTe2 - Se - Te along the line of so-called
3 "chalcogen saturation", GeSe2 to GeTe2. While this study is primarily con-
cerned with the behavior of glasses in the latter, "excess chalcogen" sub-
system, some measurements from the former "chalcogen deficient" sub-system
are presented as well. The chalcogens Se and Te h?ve S2p4 valence elec-
tron configuration and thus form 2 covalent bonds each. Ge is S2?2, or S?3,
when hybridized, thus forming 4 covalent bonds tretrahedrally distributed in
6 7 8 space. Both Se and Te form isomorphous hexagonal crystals with Se
and Ten polymeric chains along their C axes, and these chain structures
n
3 are preserved in the glasses, although Se glass contains a substantial pro-
10 portion of Se8 rings as well. As Ge is added to Se or Te glass, these chains
become cross linked in the sense that each Ge atom uses its i:xir bonds to
connect two chalcogen chains. If Ge retains its four-fold coordination, and

'*m-mimmmmmmm*Hmm-~~~"™<»'**m>>' < ■ •••^•^mmr^^^^imm^mmmmmmmmmmmm'nmmmm^mm^mmmmimi^-^' < * «*m
12
Se and Te retain their two-fcld coordination, and no Ge-Ge bonds are
formed, then this cross linking process becomes fully saturated at the
GeX compositions which then contain only Ge-X bonds. These compo-
sitlons are thus called chalcogen saturated, in that no chalcogen-chal-
cogen bonds exist for the completely ordered case.
The concept of average coordination number or average connectedness
is useful in understanding this cross linking process and the effects which
accompany the addition of further germanium beyond that necessary for
chalcogen saturation, i.e. in understanding the chalcogen deficient por-
tion of the Ge-Te-Se system. In this study, C = 8 - N, where N is the
average number of valence electrons per atom, will be Interchangeably termed
average connectedness or average coordination number. C provides a
measure of the degree to which the glass forms a three dimensional net-
work and provides some index of the strength of that network. For example,
for N = 7, 0=1, we have an unconnected network or a molecular solid, "uch
as 01 , etc. For N = 6, we have 0=2 which leads to chains as in the
cases of Se and Te. Of course for O = 2 we can have unconnected structures
like Se0 rings, but these are a perturbation of the simple theory and will be 8
disregarded for simplicity at this stage of description.
Examples of glasses with N = 5 and 0 = 3 are amorphous As and Sb, and
binary materials like GeTe and GeSe. The question for the binary materials
is whether the value of O is the average of half of the atoms having 0 = 4
(Ge) and half having 0=2 (Se, Te) or whether each atom has 0=3. Some
MMMM —-^ -

hwjmmmmmmmmmmmm**-- ■'^" P ■■' '
13
12 thermal measurements from our laboratories" in the Ge-Te system indi-
cate a strong possibility for the 3-3 rather than the 4-2 network for amorp-
hous GeTe hut the question remains unresolved.
— 13 14 The group of glasses with N^ 4, C = 4 include amorphouu Ge, Si,
SiC15 and appear to have the highest glass transition temperatures for a
1 6 given value of bond strength. Higher values of C appear to be unattain-
able, since 4 covalent bonds per atom lead to the highest possible number
of bonding valence electrons per atom(8).
Tiere appears to be a trade-off between bond strength and connectedness
in determining the value of T for a given material. Rockstad and de Neuf- g
ville16 have shown that at constant bond strength, T increases with C,
while at constant N, T increases with bond strength. These competing g
effects would be expected to be operative in complex systems like Ge-Te-Se
and indeed are to be expected in binary systems like Ge-Se where C changes
all the way from 2(Se) to 4(Ge) and the bond strength also varies strongly
with composition.
The theoretical relationship between network connectedness, bond strength
and T has only bee.i analyzed in a few simple cases, and no general ana- g
lysis of the problem is known to the author. For C = 2 materials such as
Se, analogies can be made to the behavior of organic polymers where Tg can be de-
rived in some simple cases by knowledge ri the chain length and the pre-
17 sence or absence of side groups. The plasticizing by Se8 rings
bears sufficient analogies to effects in organic systems that some
rig 18
orous analysis is possible. For these materials, viscous flow does
mm

«■ ■■■mji ii w^mimim*
14
not require breaking any covalent bonds; the chains shear past each other
by segmental motions during viscous flow. Since T is defined as the g
temperature at which the viscosity ^1 = 1013 Poise (in e.g.s. units),
clearly T can be viewed in terms of a viscosity effect.
Semi-quantitative models for viscous flow exist for the tetrahedral
random network liquids like Ge02 and Si02.19 Here the licuid has no
weak bonds, so that some rearrangements among the strong covalent bonds
are required for viscous flow. The viscosity in such cases ap ioars to be
thermally activated with a single activation energy which closely approxi-
mates the bond energy.
The intermediate cases between chain-like polymers (Se and Te ) and n n
fully cross-linked tetrahedral networks (GeSe2 and GeTe2) clearly represent
some sort of an average of these two limiting cases. That is, as the cross-
linking component Ge is added to Se or Te the viscosity will predictably
rise and T will increase. 9
The only crystalline compound in the Ge-Te system is GeTe, which has
a distorted NaCl structure and is thus not bonded covalently in contrast to
GeTe glass. GeSe has a comparable crystal structure, involving an
— .-

P«W*P»«"^WP~^"IU IH ■lUIIHN . lllll|^PW^W^^^WPWW^WW*WIW!*W^W^P^W|ii^iPWWPW^"^W^I^,^^*WB^Wi^WP^P^^W»^MWW immmiwmmmimmm
15
orthorhorrbic distortion of the NaCl structure. GeSe has a distorted
20 version of the Cdl structure, and is thus more ionically than cova-
■
lently bonded.
Ordering tendencies are significant in the Ge-Se and Ge-Te systems
while they are less predominant in the Se-Te system. The heat of forma-
tion of GeSe crystals is 9.85 k cal/gm atom vs. 4.0 k cal/gm atom
12 for GeTe. These ordering tendencies persist in the Ge-Te glasses but
have not been quantitatively determined for the Ge-Se glasses. In Section
2.5.1 of this Report the energies of the possible covalent bond
types will be calculated using the Pauling electronegativity criterion in
lieu of more quantitative experimental information.
Ordering and clustering tendencies are always intimately related in
structural chemistry, because each type of departure from a totally random
structure implies the possibility of departures in the other direction: chemi-
cally ordered configurations tend to cluster relative to other chemically
ordered configurations leading to regions of clustering separating regions
of chemical order.24 Thus phase separation is to be expected in any multi-
component amorphous system, and many references to phase separation in
25,26,27,28 chalcogenide systems have appeared in the literature.
By phase separation liquid-liquid immiscibility is implied, where the
mm» tm

"" —-—W^—P^w—.^—»»i«w™»~*^W-W—■
10
immiscibility should rigorously be a sub-li^uidus metastable phenomenon.
However the rigorous definition is not particularly useful since liquidus
temperatures are not well known in multi-component systems, so phase
separation and liquid immiscibility will be used here interchangeably.
In spite of all these qualitative observations of phase separation end
28 even 2-T behavior in one system, no thorough study of one single chal-
cogenide system has ever been reported which attempts to define the
immiscibility tie lines and interpret the immiscibility tenaency in chemical
bonding terms.
MOM

•^*m~~i itm'i-i ■*v~^*mmtmi i i mimmf^^^mmi > ■ > * ■". mm.m*mm~m*mmmvmmmim*mmnmmmm***im^'{^*mm'**1IIH
17
2.2 Limits of Glass Formation
This study concerns the properties of amorphous semiconducting
alloy phases in a portion of the Ge-Te-Se ternary system. The primary
emphasis has been placed upon the compositional dependence of the
glass transition temperature. In order to obtain fully amorphous sampl ;S,
a variety of experin.-.itel techniques were utilized. The results of these
efforts are listed in Table 2.1, which identifies the alloy compositions
Investigated, indicates what method or methods were successfully utilized
to produce fully amorphous samples if any, end tabulates the glass transi-
tion temperature or temperatures obtained by DSC. In addition, these
Investigated compositions are mapped in the Ge-Se-Te ternary system in
Figure 2.1.
Note that five categories of alloys are represented in Table 2.1. These
categories are as follows:
1. No amorphous phase obtained by any method
2. Homogeneous glass obtained
a. Single value of T indicating no phase separation
b. T < T , so T cannot be measured x g g
c. Two values of T , Tg, and Tg_, indicating phase separation g 1 ^
d. Tx < Tg but Tx > Tg ; Tg cannot be measured but Tg
can be measured.
In general no glass formation (category 1) means only that the
amorphous phase was not obtained by the methods employed. In
i_

■'■ 1 " ■■ ■" ""•- ~*^mr~^^mm^^^^ '^^mmm
18
TABLE 2.1
COMPOSITION, METHOD OF GLASS PREPARATION AND GLASS
TRANSITION TEMPERATURE FOR Ge-Te-Se ALLOYS
Method of Preparing Glass
Composition {%) Water
Quench
Spray
Cooling
rf
Sputtering
T 9
(0c)
T X
Ge Te Se (0c) t
70 30 - X - 352
60 40 - X - 268
SO 50 - X - 232
45 55 - X Cry.
40 60 - X - 208
36.7 63.3 - X - ■ 220
33.3 66.7 - X 230
66.7 33.3 - X . Cry.
30 70 - X 213
25 75 - X 190
22 78 - x • 162
20 80 - X 159
17 83 "
X
X .145
148
15 85 X Cry.
m*ma*—mmmm

m ii"« .'^m^mmmmmrmrmm -^PWWWWW« N.iiiapMnnvtm im im nwmmmHm*^imiimmmimmmmmnmmm^~> *>» m ■■■PI^W^I
Composition (%)
Ge
10
7.5
5
2
90
92.5
95
98
100
Se
90 10
80 20
70 30
60 40
50 50
40 60
25 75
16 84
12 88
10 90
8 92
4 96
19
TABLE 2.1 CONT.
Method of Preparing Glass
Water
Quench
Spray
Cooling
x
x
X
rf
Sputtering
x
x
X
X
(0c)
105
Cry.
100
Cry.
Cry.
Cry.
Cry.
Cry.
Cry.
Cry.
57
75
65
59
56
55
54
47
I x
(0c)
aiaaa
WW"I^P—"—»~^WPB«WWW
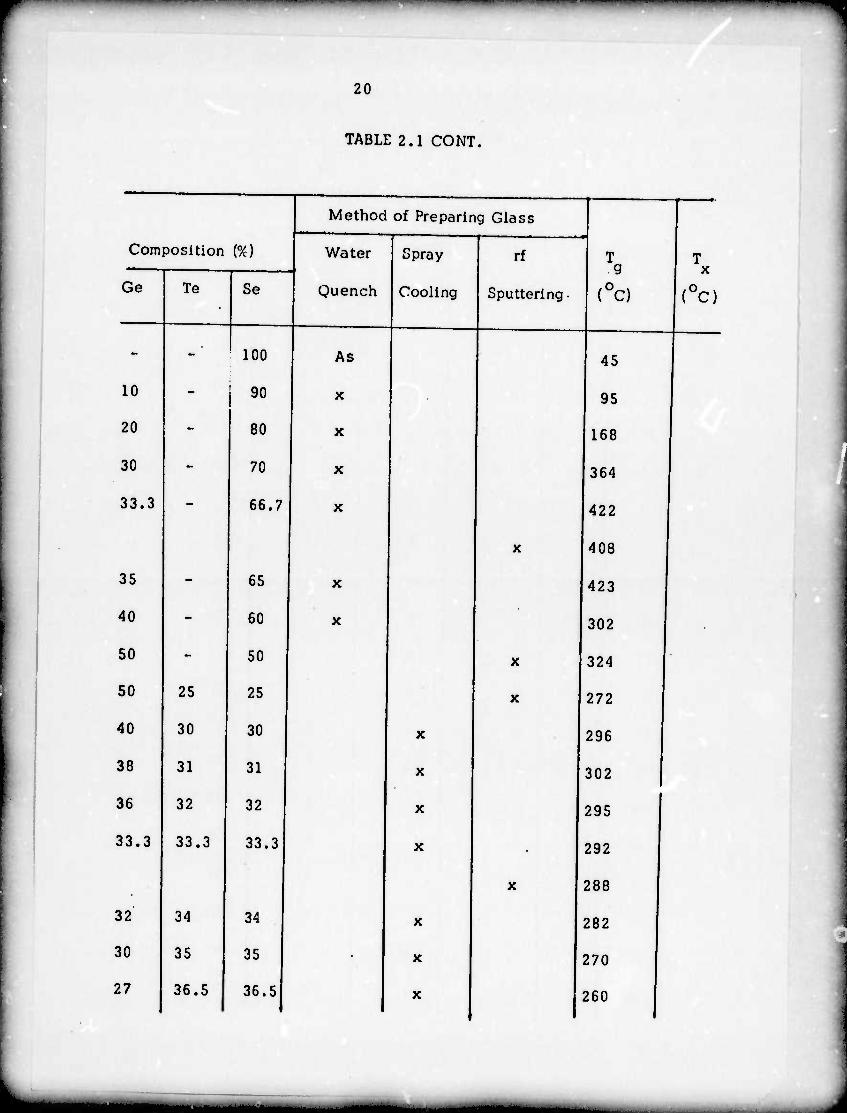
20
TABLE 2.1 CONT.
Method of Preparing Glass
Composition (%) Water Spray
Cooling
rf
Sputtering
T g
(0c)
T
Ge Te Se Quench (0c)
- 100 As 45
10 - 90 X 95
20 - 80 X 168
30 - 70 X 364
33.3 66.7 X
X
422
408
35 - 65 X 423
40 60 X " 302 .
50 - 50 X 324
50 25 25 X 272
40 30 30 X 296
38 31 31 X 302
36 32 32 X 295
33.3 33.3 33.3 X
X
292
288
32 34 34 X 282
30 35 35 X 270
27 36.5 36.5 X 1 260
■ mm

■iiiamai iniua i <i iiiiiin , J. mmm^m**mmmmmm—^*m ' ' i' ' m ii immmimimmtmi
21
TABLE 2.1 CO NT.
Method of Preparing Glass
T g
Composition (%) Water Spray rf T X
Ge Te Se Quench Cooling Sputtering , (0c) (0c)
25 37.5 37.5 X 236
22 39 39 X 208
354
230
360
20 40 40 X
*
340
142
350
18 41 41 X
320 334
16 42 42 X
284
165
340
15 42.5 42.5 X 10⁵
292
157
330
10 45 45 X 110
280
180
5 47.5 47.5 X 86
33.3 60 6.7 X 242
33.3 53.3 13.3 X 217
33.3 50 16.7 X 254
33.3 46.7 20 X 260

ji ii mil mmmmn.mrmrmtm^r^rm ^^^^mmmm* 1' ■■•■^■«I.I
22
TABLE 2.1 CO NT.
Composition {%)
Ge
33.3
25
25
45
20
20
15
15
10
30
25
20
20
15
15
10
10
Te
40
65
55
25
75
60
80
75
80
5
10
15
10
20
10
25
10
30
10
Se
Method of Preparing Glass
26.7
10
20
30
5
20
5
10
10
65
65
65
70
65
75
65
80
65
85
Water
Onench
x
x
X
X
X
X
X
X
X
X
X
X
X
X
X
Spray
Cooling
rf
Sputtering (0c)
282
201
210
208
168
169
138
140
Cry.
375
252
190
175
145
135
105
102
82
78
(0c)
■M - ■ -

" " ".""» U 'll ■ »■ I 1 II Mil • i mtiimm-tmi^^^ifm 1' " mt
23
Fig. 2.1
Mapping of preparation method and investigated alloys
in the Ge-Te-Se system where: circles represent
materials quenched from the liquid state, triangles
represent spray cooled materials and squares represent
sputtered materials.
- mmm _>^MMBM

""' ' — - ' ..... IP ..... —~ ..«..^. w—
24
■i^iMMi

—»««MWinmnpimHimMnHwii> i n mm^w^^mKmfmmmtmmßmummfmfmmmffmrmm''"- *>"" ""^-m
25
some cases, i.e. pure Te and Te rich alloys, neither spraying nor r.f.
sputtering at 25 C sufficed to give an amorphous sample, although both
9 30 evaporatioi and r.f. sputtering on LN cooled substrates can produce
the amorphous phase. A distinction is often drawn between amorphous
alloys produced by quenching, spray-cooling or splat cooling of the liquid
phase (called glarses) as contrasted to alloys which cannot be prepared
as glasses by continuous cooling of the liquid phase and must be evapo-
rated or sputtered, etc. to form the amorphous solid phase (called non-
crystalline solids). In this system that distinction appears to be arbitrary,
in the sense that T 's obtained on amorphous sputtered films (outside the
phase-separating regime) are in good agreement with T 's obtained on sprayed
or quenched glasses where the two values can be directly compared.
The distinction between category 2a and category 2b appears to reflect
significantly different behavior. In the case of amorphous films which
crystallize before reaching T , T is not experimentally observaH?. Addi-
tionally, the physical properties of such films depend on the annealing
history and no fully annealed state is available, since annealing at T is g
the normal prescription for eliminating the defects incorporated in amorphous
31 films during deposition.
Glasses produced in category 2c result in fine scale phase separated
materials exhibiting a two T phenomena. That is, each phase has a
distinctive glass transition temperature and crystallization temperature.
These materials lie entirely within the Ge-Te-Se ternary system and are
. ■Mi MMi

«müMiippai^'nH.auiii ji «iiiiiiiM mi^ . i immnKppi^ i w . i timmmmmf'^i^'™'' ■ "immm-rmF^mmmimmi^mm'i'i'1
26
thermodynamically bounded by a single phase homogeneous glass typical
of category 2a.
A special case of category 2c is observed in category 2d where one
amorphous phase nucleates and crystallizes spontaneously as soon as
compositional fluctuations exceed some limit. As temperature is increased,
concentration fluctuations develop within the homogeneous amorphous phase,
which eventually coalesce into separate phases. At this point the metastable
Te-rich phase finds itself in the vicinity of f*, its homogeneous nucleation
temperature, and rapidly crystallizes (see Section 3.4).
2.3 Compositional Dependence of T g
2.3.1 Binary Systems
Glass transition temperature data for amorphous materials observed in
the Ge-Te system are plotted in Figure 2.2. The Te rich portion of the dia-
gram exhibits typical single phase homogeneity with steadily increasing glass
transition temperatures as a function of increasing Ge content until the
stoichiometric composition GeTe» is reached. For a two component system
the amorphous phase at T must be homogeneous if T changes wi+h composi-
25 3 tion. ' At GeTe., T becomes less than T which limits DSC observation
2 x g
of the T at higher Ge concentrations. This observation conflicts with our g
3 earlier measurement of T for the alloy Ge.^Te.^, which result is now con-
g 38 62
sidered to be in error.
32 Fig. 2.3 combines existing glass transition data of Nemilov and
33 Feltz, Büttner et. al. with current data for glass transition temperatures
as a function of composition for high Se compositions in the Ge-Se binary
system. It is noted that the data obtained by Feltz, Büttner et. al. were
MK:

11 '" ■■' mw**^m*^*f~~~—>**w*mm*^**^—^i^mimimQ
27
Flg. 2.2
Metastable portion of Ge-Te phase diagram where Tg
is represented by circles and Te represented by squares.
mm —

mi^mmmimmmimmmmmil^~~m <" ll1"""
28
(Do)3dniVd3dlAI31
MMnH

. i in .-vWWMlii . \.mv tmirmmfmm 11 ■ ^-r- ' < < Ul ■ l m^m^mm
29
Fig. 2.3
Glass transition temperature in the Ge-Se binary system:
solid circles from this study; open circles from reference 28;
squares from reference 39.

PHWunv^iii ■■ iipnii ij wi Mi iiM ^r^mmm ***~~i~^m~m*****^i^immmmmmm*mmmmm mmmmmmm**-**
30
o o o o o o o o LD ^f n (N
CM ■
O
0)
Do)3aniVH3dlAI31
mm

ii' - i *~*mimimmtmi* i.nüiLmimm^i^f mill iiniiiB>. ' " ' •""•
31
taken by differential thermal analysis measurements at 40C/min. scan-
ning rates or less. The glass transition temperature peaks at or near
the toichiometric composition GeSe . Similar results have been reported
by Kawamoto and coworkers for the Ge-S system and by Myers and Felty
at As S in the As-S system. These binary T singularities occur at chal- 2 J 9
cogen saturated compositions where complete chemical ordering (i.e.,
Ge-Se bonds only) can occur, and where the cnalcogen rings and chains
can become fully cress linked by the cross linking additive (i.e. Ge in
this case). When additional Ge is added to the chalcogen saturated or fully
cross linked GeSe. composition, a decrease in T is observed. 2 g
Existing data has been extended in this system by means of r.f. sputtering to
include the Ge Se composition. T values for pure GeSe were mea-
sured on samples obtained both by liquid quenching and by r.f. sputtering.
These T data, which are listed in Table 3.1, are in relatively good agree-
ment, and the lower T value for the sputtered film may be attributable to
a slight deviation of stoichiometry associated with the sputtering process.
It is interesting to note that as Ge is added to pure Se, T increases g
more rapidly than when Ge is added to pure Te, as can be seen by a com-
parison of Figures 3.2 and 3.3. This portion of both systems has been
viewed in terms of the cross linking of the chalcogen chains, and this
cross linking thus appears to be more effective in the Ge-Se system than in
the Ge-Te system.
ammmm ■-■■ ■*■»

32
The compositional dependency of T for Che Se-Te system is plotted in
Figure 2.4. The glass transition temperature increases gradually in the Se
rich portion of the Se-Te system with increasing Te content toward a
shallow maximum at approximately TeSe^ From TeSe2 to TeSe, Tg gradu-
ally decreases. The glass forming region is reduced in the Te rich portion
of this system as compared to that of Ge-Te system. As amorphous TeSe and
crystalline Te were the only sputtered compositions in this system, it is not
known how much additional Te could be added to TeSe and still yield a glass
o which is stable at 25 C.
2.3.2. Pseudo-Binary Systems
The compositional dependence of the glass transition temperature in the
pseudo-binary GeTe2-GeSe2 system is plotted in Figure 2.5 These results
have been previously published. This is a chemically and structurally
simple system in the sense that both end members presumably share the
36 „37 fully cross linked random network structure observed for Si02 , Ge(D2
and similar glasses. Again, the typically smooth monotonic increase of Tg
with the addition of GeSe2 is suggestive of single phase homogeneity. The
non-linearity of T with composition in the vicinity of pure GeSe2 indicates
that the addition of a small amount; of GeTe2 substantially decreases the
glass transition temperature. This is analogous to the lowering of the Si02
glass transition temperature with addition of small amounts of Ge02 . 38

33
Fig. 2.4
Glass transition temperature in the Se-Te binary system,
■■■■Mk^*lM__M

r 34
r
(
CD C/)
o
00 ■ o
■ o
CO _ • z o LÜ
-J LJJ
in (n o z
o ^r h-
■
o < GC
CO LL
o
CM o
(2
0.)ayniva3di/\i3i
. --—^^-

1
35
Fig. 2.5
Glass transition temperature in the GeTe2-GeSe2
psudo-binary system from reference 3.
I
,—___ -J

36
D«)3dniVH3dlAI3i

37
The glass transition temperature decreases continuously from GeSe
toward GeTe in the pseudo-binary system GeSe-GeTe. These data are
plotted in Figure 2.6. Again at GeTe, T is less than T , making T un- x g g
obtainable with calorimetric techniques, so that T volues between GeTe
and Ge SeTe are extrapolated.
The compositional dependence of T along the chalcogen rich portion
of the pseudo binary system Ge-SeTe is an example of a glass forming
system exhibiting two glass transition temperatures. These data are plot-
ted in Figure 2.7. Within the miscibility gap, two distinct glass transitions
are noted; one of substantially lower temperature than the other. The two-
phase region is completely surrounded by a single phase homogeneous
glass. The two-phase region between TeSe and GeTeSe returns to a single
homogeneous phase at both end members. Both phases show a sharp increase
In T from Sele with addition of Ge. In the steeply varying regime between
TeSe and GeTeSe, the addition of Ge to either phase increases the degree
of cross-linking with a resulting rise in glass transition temperature.
2.3.3. Ternary System
Within the single phase region T isotherms are drawn to indicate
regions of constant temperature glass transitions. This can be seen in
Figure 2.8 where these isotherms show a continuous decline in T radiating
from the T maximum of 4220C at the stoichiometric composition GeSe . g -
This decline is very steep at first, becomes more gradual and then becomes
■Mi

38
Fig. 2.6
Glass transition temperature, represented by circles,
and crystallization temperature, represented by boxes,
in the GeTe-GeSe psudo binary system.
——-

f 39
o o 9 o CO
o o CO
o O LO o CNJ CM
0)
Do)3dniVd3dlAI31

•minm m^v<Mmmf «in iw < i < .<• miai ■ ■.
40
Fig. 2.7
Glass transition temperature and crystallization temp-
erature showing the two-phase region of the Ge,,TeSe-
TeSe psudo-blnary system where Tg Is represented by
solid circles and Tx hy open circles.
^■K

■■'V ■ ■■ ' ' ■ 'r^ymm^mmnmm • i a ■■ i
^1 41
.0)
D.)3HniVd3dlAI3i
■MBB

i MI i Min nmi i i— ii "*|| J '■ v.^^m**~~*~**9*im*** ■I " I . ■ ■!■ 11 .■ . . !■■ p|| H (
42
Fig. 2.8
Glass transition temperature isotherms and tie lines
in the Ge-Te-Se ternary system.

■ " ' '■ ■■■l ~~~—~^^mm
-'—■-■■'■ ■-■--■*■■ --'

_ -„_., i ^ „ ,—, ■——' ■ "■ ■ ■ ' • 'm
44
nearly flat within the chalcogen-rich regions of the system. The T g
maxima for an increasing Te/Se ratio start at GeSe , and curve away 2
from the chalcogen saturated GeSe -GeTe pseudobinary, perhaps curving
towards GeTe, although the line of T maxima crosses into the T < T 9 x g
regime at a composition of roughly Ge, Te Se . 45 45 10
The curvature of the isotherms near the Ge-Se join between Se and
Ge25"Se75 are consist:ent wit*1 the lower slope of T vs. Ge content in
this portion of the Ge-Se system as compared to the Ge-Te system.
2.4 Evidence for Phase Separation
2.4.1 Construction of Tie lines
No T Isotherms are plotted in the two phase region, although, in
a sense, the tie lines are T isotherms, lines along which both values
of T are invariant. The compositions of the coexisting glassy phases
in this portion of the ternary system are plotted so as to best fit the pair
of T values at the boundaries of the two phase and homogeneous glass
forming regions at the end points of the tie lines. In practice this pro-
cedure was simplified by using tie lines which radiate from GeSe , which
appeared to fit the data as well as any other set of tie lines. The compo-
sitions used to define these tie lines lie along the join Ge-TeSe within
the two-phase region; higher accuracy might have been obtained by using Ä C
a modified version of the method of Mazurin and plotting tie lines between
compositions which share the same values of Tg and Tg within the two-
phase region.

1P*****^^^n*^r^^Kmmmmmm^mw^*9^l*rm . im iiiR.iiwiiii^ui min ■ ii ii-^ ii«i— Mwtni^^m^^^m^m^tfrmi^^m^mmmmmmmmmm^m^mm-
45
In the two-phase region, tie lines are used to connect the compositions
of the two "coexisting" glassy phases obtained by the particular quenching
method employed. These are thus not truly isothermal liquid-liquid "tie-
lines" in the thermodynamic sense, since the liquid-liquid equilibrium is
frozen during quenching at some particular composition values (corresponding
to some unknown temperature). If all samples could be equilibrated at some
T > any Tg2, say at 400OC/ for a long time (without crystallization which is
probably not possible) and then quenched to 250C with no further com-
positional changes, then the coexisting compositions thus obtained from
the two Tg data points would give the coexisting isothermal (400OC) liquid-
liquid phase equilibrium.

■ "" ' ■,l" ■■■"• ■«""^■w ^H^^^-^B^
46
2«5 Discussion and Conclusions
2.5.1 Analysis of T vs X Behavior in the GeSe-GeTe-Se-Te System
Primary emphasis has been placed on relating the compositional de-
pendence of glass transition temperatures, phase separation behavior, and
thermal crystallization to achieve some basic insight into the role cf
chemical ordering and network connectedness8 in the glass forming region
of the Ge-Te-Se system.
From calculations of bond strengths and random network connectedness
for various stoichiometri^ compositions within the ternary system, it is
possible to estimate relative f '•. The glass transition temperatures, phase
separating tendencies and crystallization behavior of amorphous Ge-Te-Se
alloys can best be understood by reference to the bond energies of the six
possible covalent types: Ge-Ge. Se-Se, Te-Te, Ge-Se, Ge-Te and Se-Te.
Energies of individual bond strengths utilizing the Pauling electronegativity
criterion are calculated below.
Table of Bond Energies
A. homopolar single bonds
ond type bond energy
(K cal/EA bond)
Ge-Ge 37.6
Se-Se 44.0
Te-Te 33.0
B. heteropolar single bonds
1. Pauling Electronegativity Scale
MMMMtH Mi •MM^hMlttUu^i^H

^w""^"»""--"- ~mmmmimiimmmmim^m ^mmmmm^inmmmm^**1*****-^-
47
1
element electronegativity
Ge 1.8
Se 2.4
Te 2.1
Assuming the arithmetic mean approximates the geometric mean, Pauling
calculates the bond energy (E ) as Ao
EftD = 1/2 (ERA and EnJ + 23 (X - Xj2
AB AA BB A B
Calculating the heteropolar single bonds gives:
bond energy
bond type
Ge-Se
Ge-Te
Se-Te
AB
(K cal/bond)
49.08
37.37
40.57
Rearranging the six bond types by descending energies results in tne
following order:
bond energy
bond type (K cal/bond)
Ge-Se 49.08
Se-Se
Se-Te
Ge-Ge
44
40.57
37.6
mmmm .^a^aaHaaaMB, J

"•"»■————••■^»W^^M-WPW« *mim*mmmmmnmimmm "
48
bond type
Ge-Te
Te-Te
bond energy
(K cal/bond)
37.37
33
or
In the Ge-Te and Ge-Se chalcogen systems, T singularities occur at
near stoichiometric compositions. These singularities are strongly
suggestive of an SiQ,, type tetrahedral random network of covalent bonds
involving a high degree of chemical ordering. These binary system T g
singularities occur at chalcogen saturated compositions where the chal-
cogen rings and chains have become cross-linked by Ge. Additional
amounts of Ge beyond this saturation limit result in either a sharp de-
crease in Tg/ as in the case of the Ge-Se system at GeSe2 or termination
of the Tg effect (i.e. Tx < Tg). as in the case of the GeTe system at GeTe2
The critical concentration of Ge wh.ch is sufficient to completely cross-link
the chalcogen polymer chains appears at GeX^ assuming no bonds between
like atoms.
It is need I. Figure 2.2 that In the Ge-Te system the maximum Tg does
not occur a. the same s.olchlometry as the only binary crystaUlne pha'se.
This singularity in Tg does not correspond to the stable crystalline phase
as in the case of GeSe.,, indicating teat the glassy solid state does not al-
ways correspond to the structural chemical properties of the crystalline
state.
Viscosity at T is. by definition, »I - lO13 poise .
■HlMBte«— —■Mt^MlMMMliliaM*—ililliiMiiifiili iiÜMltirtMMI i

pvwxmK anw^^m^lipm^H^OT^ I I im*m*imm*mm*m-^^*^^^mt' >••>> > « i|miliill^w«>«OTWpimH^ai^H|aB|*««aHHPW-»i IMIUBI n.ia i ■ nil ■ I«
49
In an Si02 type liquid, tht covalent bonds must be broken to permit viscous
flow. But viscosity, in the region of high viscosity, is most affected by
weak links of low chemical bond energy. Based on the calculation of chemi-
cal bond energies, in the case of the fully cross-linked GeTe -GeSe pseudo-
binary system, Ge-Te bonds (37.07 K cal) are considered weaker than Ge-Se
bonds (49.08 K cal). This gives riue to the non-linearity in T as GeSe g 2
is approached from GeTe seen in Figure 3.5.
In addition to cross-linking of the chalcogen atoms by the Ge atoms,
the role of structural dissimilarities within a single component can lead
to a significant contribution toward compositional dependencies of the
glass transition temperature. This is seen in the Te-Se system where Se 8
molecules tend to lower viscosity as compared to Se chains. A. Eisen- 18
berg calculates T to be equal to -100 C for a pure chain Se liquid com-
posed of equal chain lengths, while the actual T of amorphous Se con- g
taining a mixture of chains and rings is 45 C. Since pure Tr has no ring
components, Se or possible Se Te0 are the only stable rings in the o fa 2
binary Se-Te glasses. .The shallow peak observed at or near TeSe in the
Te-Se binary system as shown in Figure 3.4, may possibly be explained in
terms of ring-chain effects by assuming that the T matrix corresponds to
the composition at which the ring (plastisizer) concentration increases
rapidly with increasing Se.
In the Ge-Te system T increases with Ge content in the observable 9
range of T as shown in Figure 3.2. The addition of Ge to Te increases 9
both the bond strength and the connectedness.

•■■^^■•^^■^■■■w I'll "^'•"i"*!
50
continuously from pure Te to pure Ge. Thus C varies from 2 at pure Te
to 4 at pure Ge, while Te-Te bonds (33 K cal) are replaced by Ge-Te bonds
(37.4 K cal) between Te and GeTe .
A progressive reduction of the monomer Se ring component by the
addition of Ge atoms would tend to increase T . However, the observed g
rise in glass transition temperature in the Ge-Se system in Figure 3.3 is well
past the limit which could be attributable merely to the elimination of
rings. This observed increase in T is consistent with the model of g
progressive cross linking of chalcogen polymer chains with Ge in 4-fold
coordination introducing a chain cross-linking point. A direct analogy
can b3 made between the Ge-Se system and the Ge-Te system in terms
of cross-linking effects. In Ge-Te, T rise3 linearly with atomic percent
Ge between TegoGe 0 and Te66 gGe^-j (GeTe2). while in the same por-
tion of the Ge-Se system T increases very non-linearly. In fact at g
10 percent Ge, the T in the Ge-Te system is -•105OC while the T in the g g
Ge-Se system is ~840C. These compositions have the same connectedness
and the Se system has uniformly stronger bonds, so this result is sur-
prising. Nor can the elimination of Se rings with progressive Ge additions
be invoked as a source of the discrepancy since the elimination of rings
should cause T to increase more rapidly ;vith increasing Ge. Perhaps g
clustering of the Ge atoms into fully cross-linked highly viscous regions
separated by fluid Se-rlch regions is the operative mechanism here. Glass
transition Isotherms In the homogeneous portion of the ternary Ge-Te-Se
system In Figure 2.3 reflect the same cross-linking effects of Ge which
■Hk_*. BM

■■^■^^^ •^^mmmm*m^^*m.ii
51
occur in the binary systems. Glass transition temperatures are increasing
non-linearly from the chalcogen members toward the fully cross-linked
GeTe - GeSe pseudo-binary join as the network connectedness increases.
Along this pseudo-binary join GeTe -GeSe„ of constant connectedness, T 2 2 g
increases toward the higher bond strength GeSe . For intermediate com-
positions (i.e. compositions within the single phase regions but not falling
along binary or pseudo-binary joins) effects of bond strength and network
connectedness both contribute to determining the value of T . The obser- g
vable T maximum occurs at 422 C at GeSe where C = 2.66 and the bond g 2
strength (Ge-Se) is 49.08 K cal/bonds. Thus bond strength effects dominate
C effects at this composition. With the addition of further Ge atoms to
GeSe , weaker Ge-Ge bonds are added as C is increased. At first the bond
strength effect dominates the C effect, and T decreases. Perhaps be- g
tween GeSe and Ge this process is reversed and T again rises, but the g
present results do not address this possibility.
In addition to the increase in C from 2.66 at GeTe to 4 at Ge, the
effect of adding Ge atoms to GeTe is compounded by the increase in bond
strength (EL _ > E_. ). Both these effects predict an increase in T Ge-Ge Ge-Te g
beyond GeTe0 toward Ge but since T < T in this regime, this prediction 2 x g
cannot be experimentally verified. In the ternary system, the T maximum g
occurs at GeSe while the ternary T maxima are decreasing and moving away 2 g
from the line of chalcogen saturation as the Se/Te ratio decreases. This
line defines the balancing condition between the bond energy effect and the
connectedness effect. Interpretation of directionality of these balancing

• ' '■ ' ■ " lll^WW^^
52
condition maxima is difficult in the chalcogen deficient portion of the
system duo to insufficient data, but preliminary results indicate a maxima
radiating out from GeSe2 and terminating at Ge. The complexity of con-
necting this lino of T maxima has some analogy to the T behavior ob- 9 g
served in the Si-Te-As system11 where the T maxima occur on a ridqe g
connecting Si-Te tc As.
2.5.2 Analysis of Ordering and Separating Tendencies
The region of liquid immiscibility or phase separation within the
chalcogen-rich region of the Ge-Te-Se system exhibits for the most part
a two Tg glass forming regime. With the possible exception of the homo
geneous nucleation results of Ge^Te^Se^ the two phase region is well
behaved in terms of two phase glass formation. Most compositions
studied within this region consisted of a low temperature amorphous phase
whicn exhibited a Tg1 and fttj distinct from the high temperature phase.
A rough calculation can be made to determine the energy of Ge Te Se 20 40 40
in the randomly bonded and phase separated state. These assumptions will
give an appropriate estimate for the thermodynamic tendency to form GeSe
plus Te clusters versus a completely randomly bonded glass at low temperatures
(i.e. considering enthalpy only and ignoring entropy effects).
There are four orbitals per Ge
two orbitals per Se
two orbitals per Te

' ■■■ "III II
53
Number of orbitals in Ge^^Te^Se^ 20 40 40
(0.20)(4) = 0.8 Ge orbitals
{0.40)(2) = 0.8 Se orbitals
(0.40)(2) = 0.8 Te orbitals
Total orbitals/a torn = 2.4
Total number of bonds/atom = 0rbitals x bounds
1 atoms orbitals
2.4 x 1/2 = 1.2
of these 1.2 bonds there are
/ .8\ ' .8' (2.4/ \2A,
\ 1.2j Ge-Ge bonds etc.
Bond energy for a random model of Ge„„Te^Se.„ 20 40 40
Ge-Ge = (1/9)(1.2)(37 .6 K cal/bond) ■ 5.01 K cal/bond
Ge-Te = (2/9)(l .2)(37.37 Kcal/bond) ■ 9.97 K cal/bond
Ge-Se = (2/9)(1.2)(49.08 K cal/bond) = 13.09 Kcal/bond
Se-Se = (1/9) (1.2) (44.0 Kcal/bond) = 5.87 K cal/bond
Se-Te = (2/9) (1.2) (4 0.57 K cal/bond) = 10.82 Kcal/bond
Te-Te = (1/9) (1.2) (33 .0 Kcal/bond) = 4.40 K cal/bond
Total bond energy per g atom = 49.15 K cal
Bond energy for a clustered model of Ge„,Je Se,,, consisting of ordered 20 40 40
GeSe and Te clusters
Ge-Se = 39.26 K cal/bond
Te-Te = 13.20 K cal/bond
Total energy per g atom = 52.46 K cal
^mmm
*^mmimimim*i*mmm^^~*tmmmmmmmqi*m — ■ "■ i P"W»W»«WH^WWW^^W^WP^W^^WWW^flP»
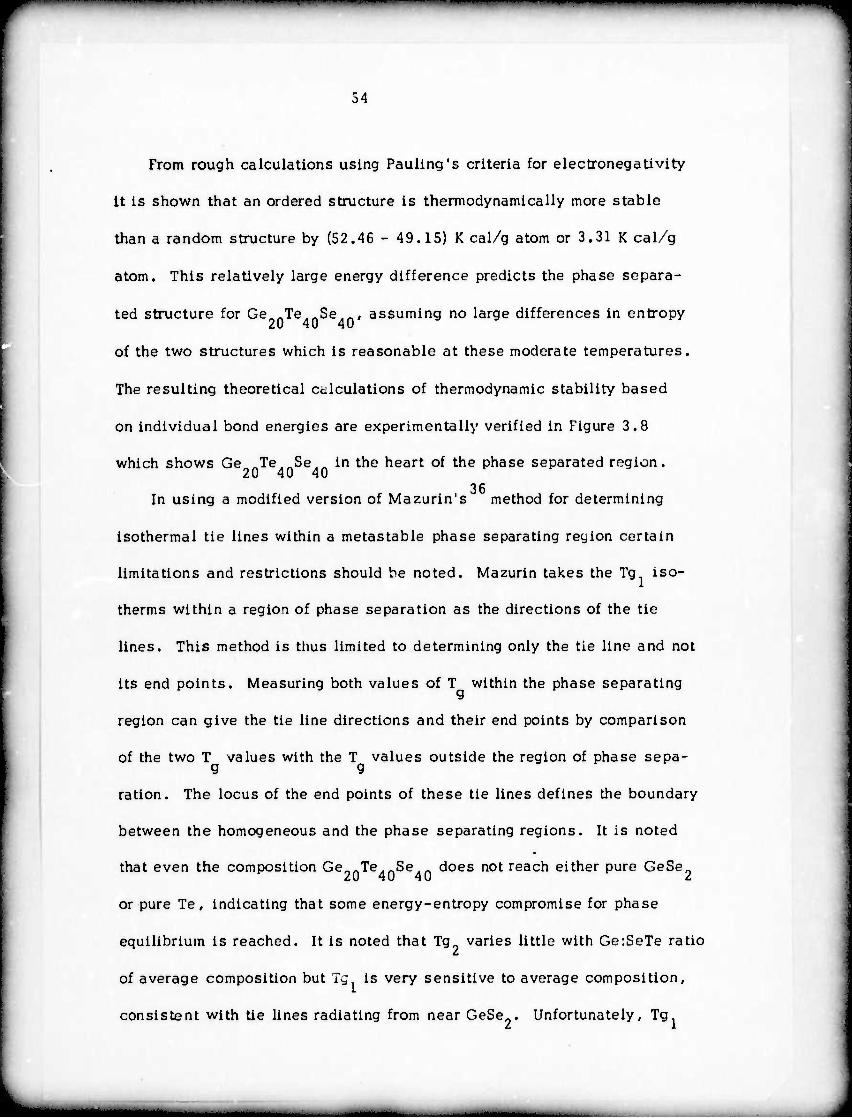
From rough calculations using Pauling's criteria for electronegativity
it is shown that an ordered structure is thermodynamically more stable
than a random structure by (52.46 - 49.15) K cal/g atom or 3.31 K cal/g
atom. This relatively largo energy difference predicts the phase separa-
ted structure for Ge Te So , assuming no large differences in entropy
of the two structures which is reasonable at these moderate temperatures.
The resulting theoretical Cclculations of thermodynamic stability based
on individual bond energies are experimentally verified in Figure 3.8
which shows Ge „Te „Se in the heart of the phase separated region. 20 40 40
In using a modified version of Mazurin's method for determining
isothermal tie lines within a metastable phase separating region certain
limitations and restrictions should be noted. Mazurin takes the Tg iso-
therms within a region of phase separation as the directions of the tie
lines. This method is thus limited to determining only the tie line and not
its end points. Measuring both values of T within the phase separating
region can give the tie line directions and their end points by comparison
of the two T values with the T values outside the region of phase sepa- g g
ration. The locus of the end points of these tie lines defines the boundary
between the homogeneous and the phase separating regions. It is noted
that even the composition Ge Te Se does not reach either pure GeSe
or pure Te, indicating that some energy-entropy compromise for phase
equilibrium is reached. It is noted that Tg varies little with Gc:ScTe ratio
of average composition but T^ is very sensitive to average composition,
consistent with tie lines radiating from near GeSe . Unfortunately, Tg
"^miiwmmmw^^^mt. . \i. ■ — -- — ■ 'w ' " ■•-■ ■ ■ '■ " " •" Vf^pnBMH
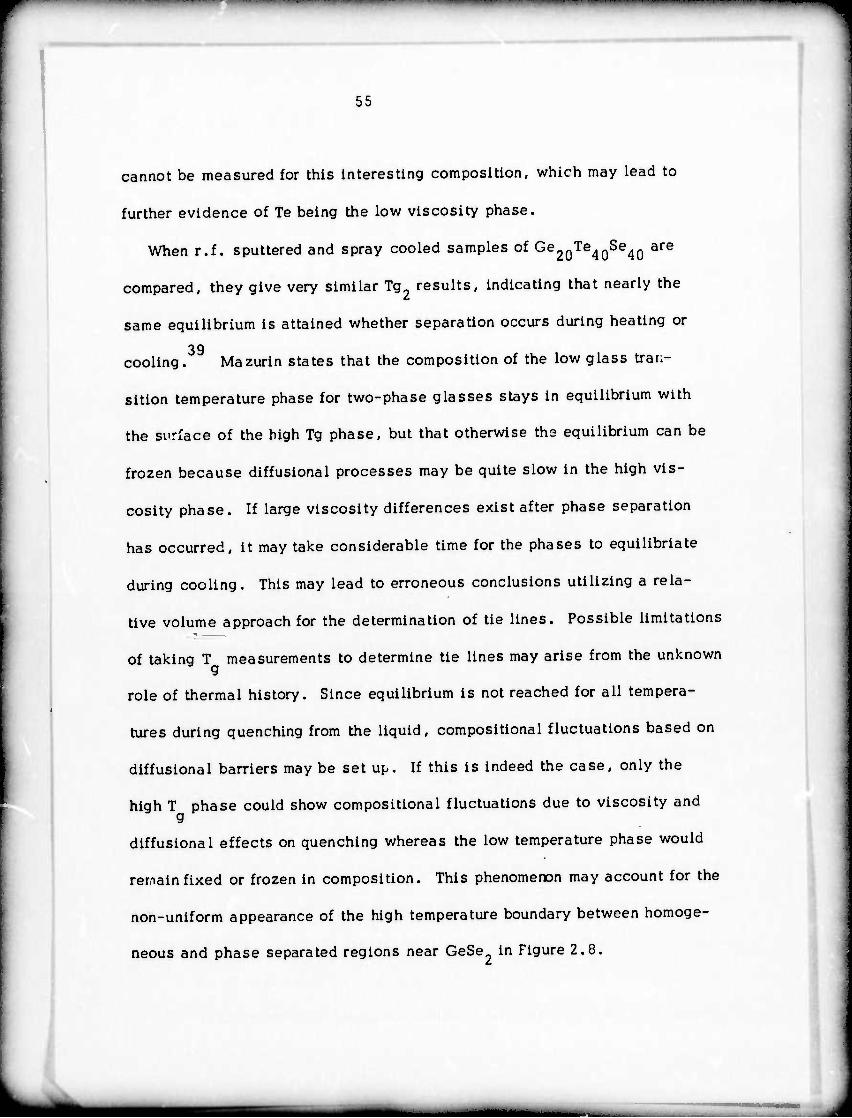
55
cannot be measured for this interesting composition, which may lead to
further evidence of Te being the low viscosity phase.
When r.f. sputtered and spray cooled samples of Ge20Te40Se40 are
compared, they give very similar Tg results, indicating that nearly the
same equilibrium is attained whether separation occurs during heating or
39 cooling. ' Mazurin states that the composition of the low glass tran-
sition temperature phase for two-phase glasses stays in equilibrium with
the surface of the high Tg phase, but that otherwise th- equilibrium can be
frozen because diffusional processes may be quite slow in the high vis-
cosity phase. If large viscosity differences exist after phase separation
has occurred, it may take considerable time for the phases to equilibriate
during cooling. This may lead to erroneous conclusions utilizing a rela-
tive volume approach for the determination of tie lines. Possible limitations
of taking T measurements to determine tie lines may arise from the unknown g
role of thermal history. Since equilibrium is not reached for all tempera-
tures during quenching from the liquid, compositional fluctuations based on
diffusional barriers may be set up. If this is indeed the case, only the
high T phase could show compositional fluctuations due to viscosity and g
diffusional effects on quenching whereas the low temperature phase would
remain fixed or frozen in composition. This phenomenon may account for the
non-uniform appearance of the high temperature boundary between homoge-
neous and phase separated regions near GeSe in Figure 2.8.
..

PI,,,,,, ....,.,_.. u, ., , ,, ,, ,. PI ■■»•■•w>piw^w»*>i^^«HmiMn*TCRP<PMw«Bpm " i i n*m'^mmm^*^*~" —■ ■ , , ..«..,.,—,.
56
3. CRYSTALLIZATION OF SPUTTERED Ge0„Se>inTeil„ 20 40 40
3.1 IntroQuction
Examination of material along the Ge-TeSe pseudo binary join led to
the composition Ge2oTe40Se40' an unusual example of a material which
forms very fine (~100A) crystallites when cooled from the melt. The presence
of these crystals was determined from X-ray diffraction patterns and ecu Id
not be observed by the appearance in optical microscopy of a metallurgically
polished and etched surface which was typical of a homogeneous glass.
Crystallization on this scale suggests internal nucleation which has not
been previously reported for bulk chalcogenide materials. This composition
falls in the midst of the two-phase region with two T materials lying on
either side along the Ge-TeSe join. Since Ge Te^Se,.^ lies along the 20 40 40
GeSe2-Te join, it is perhaps indicative of the most extreme case of phase
separation if indeed, GeSe2 is the separating phase. This composition
could not be rendered amorphous using the spray cooling technique although
vitreous samples with slightly higher (22%) and slightly lower (18%) Ge
content could be prepared by spray cooling. This result supported the view
that homogeneous nucleation of Te crystals was occurring during cooling.
When samples prepared by r.f. sputtering were examined with the DSC to
determine the low temperature phase glass transition (Tg ) only Tx was
observed. X-ray analysis revealed these to be very fine Te crystals (-60A).
The thermal evolution of these internally nucleated crystals led directly to
a detailed X-ray investigation including the study of kinetics of Te pre-
cipitation and particle growth as a function of annealing temperature.

«■■«pipilHPwnppiiBmnmnpHianBH ii J ivmn »mim w»n^^w~—— • - -wmm^m»
57
A side-light of phase separation in glass forming systems is its close
phenomenological association with ' .-ontrolled" or "catalyzed" crystalli-
40 zation. While glass forming liquids rarely can be supercooled sufficiently
41 2T
to reach T* "« T^/2, before reaching T * —^ where T* is the temperature
for homogeneous nucleation of crystals, the process of phase separation of
a homogeneous liquid often leads to the situation where one or both liquid
phases are sufficiently supercooled below the liquidus of the separated phase's
composition that T* is achieved and homogeneous nucleation can occur. This
highly interesting effect lies at tLe heart of the Pyroceram technology42 de-
veloped at Corning Glass Works in the ISSO's and igeO's.
The phase separating process produces ideally dispersed and non-inter-
acting droplets for a study of homogeneous nucleation since free surface
nucleation can only affect a minor portion of the droplets involved. The
observation of phase separation and the nucleation of tellurium crystallization
on an ultra-fine scale for the composition GeonTe^Se,0 appeared to be a 20 40 40
unique example of such behavior in chalcogenide systems and was there-
fore deemed to be worthy of the detailed study of the kinetics of tellurium
nucleation and crystallization which is described in this Section.
3'2 Qualitative X-ray and TEM Observations of Crystallization Behavior
Results of the X-ray diffraction data taken from a single substrate of
sputtered Ge^Te^Se^ at Increasingly higher temperatures are shown in
Figure 3.1 . X-ray diffraction traces of the substrate annealed at 1 250C for
30 minutes revealed no evidence of crystallization. The Bragg reflections
of hexagonal Te increased in height and sharpened in breadth at each annealing
i ■Hi

*^m^^m m^ma^rw*i^^*Tmmm^~ • «" n "■wp^BW>n»i|«i^^^HP^^jpi ■"'^MPtaMHH
58
n
Fig. 3.1
X-ray diffraction patterns of a 3.2/1 GennTe „Se 20 40 40
sputtered fllrr. after a sarles of 30 minute annealing
cycles at the following temperatures: —---as
deposited; 125 C;
2250C.
150OC; 1750C;
.. — 11 ■ ir * ■ -1 ■ n
HI— Mil —^

Mmtmw^m w^* —^—————^^—~—■••»»««■■«•■«■■»»•■^■iWW^iB
59
200
150 z
> C < oc K 00 oc <
i/) z 5 100
30 40 DEGREES 29
60
J

*^m*^^^m~ H^U ■OT«>«IHIl llll INi^pmiHqa!- 1 '"«I ... <»..., ... IM i« , m ii m
60
o o temperature from 150 C - 275 C. Only slight orie itational effects appear
to accompany crystal growth, with all reflections increasing continuously
in Intensity with progressively higher temperature annealing. Temperatures
were kept considerably below the high temperature phase glass transition
o temperature of 340 C.
The extreme breadth of these Bragg reflections indicate a very small
tellurium crystallite size. To confirm this result we sputtered a 300^
thin film of GeonSe/.-Te.r. onto a carbon coated Ni TEM grid. We then 20 40 40
annealed the substrate at 145 C for 30 minutes and examined it by TEM,
obtaining the image shown in Figure 3.2a and the diffraction pattern shown
in Figure 3.2b. The crystallite size calculated from the dimension of a
typical diffracting (dark) particle in Figure 3.2a is 70L Since these particles
are significantly smaller than the film thickness, they may have nucleated
inside the film ratlier than at the film surface. As we shall see from the
results to be presented in Section 3.3.2, this particle size compares favorably
with the size of the coherently diffracting regions in the 3 - 5um thick films
crystallized at the same temperature and analyzed by X-ray diffraction. This
agreement in crystallite size independent of film thickness provides a strong
Indication that the Te crystallites have indeed nucleated at many closely
spaced points internal to the film itself.
r .a» —m^mm

■"■" "■•■■" ll""JI I . —" ^vnBw^^r<npn«^>^lB'^~<-v—i-an-pipanap^^iVMW^^^nniw^a^^a
61
Fig. 3.2
TEM photomicrograph and TED for ~ 500 A Ge„ Te Se 20 40 40
film annealed at 145 C for 30 minutes.
^ -

~— I^W"^^^«—^--■^«p^pn —w^^^ II 11« III II .11
62
amzy* • • • • • ;•• •
02 u
:■•••■'
P . 1
• .-A
''f. •
i • . . . • r *. • i
v •• • . • '• ■' 9
» » ■
.
(a) TEM photograph of Ge2o Se40 Te40 annealed at 145 C for 30 minutes.
Crystallite particle size is ^ 68A.
*;
(b) Selected area diffraction from (a) showing crystalline Te pattern.
Reoroduced If«"

in« ■•■nipi ma i i wii »^r»««"T^^"™wipiii,).. ■' ■ m^~^^^^*~*w*m~m^mrmm*<m >•• m m iiii*mi—m^*^r*mm
63
3.3 Study of Structural Evolution
3.3.1 Volume Fraction Calculations
From the X-ray diffraction data, it was possible to calculate volume
fraction of crystals by measuring the area under the d'ffraction peaks; and
to determine the crystallite size from measurements of peak breadths. To
calculate the volume fraction of crystalline phases, the ratio of the inte-
grated X-ray intensities for a given phase at a given temperature to the
intensity from the corresponding reflection in the fully crystalline state is
multiplied by the crystalline volume fractions in the fully crystalline
state, i.e.
a) Volume fraction of Te crystals as a function of temperature =
(Te area),,.
(Te area) fully crystalline
x 0.45
b) Volume fraction of GeSe crystals as a function of temperature =
(GeSe2 area)
(GeSe. area), .. ... 2 fully crystalline
x 0.55
c) Volume fraction of glass = 1 - (v.f. Te + v.f. GeSe ) where the fully
crystalline fractions are calculated as follows
Molecular Weight Molecular volume =
jL = 6.25 g/cm
Crystalline Density
3
3 3 cm _g cm g mole mole
PGeSe2 = 4-6J-g/cm
Molar volume Te0 = 2(-r4r7)(127.60) = 40.84 cm3/mole
—

■ ' ■■'
64
Molecular weight of GeSe
- 75.59 + (78.96)2
■ 230.49 g/mole
Molar vclume GeSe,,
= 230.49 4.68
■ 49.26 cm /mole
Total molar volume = volume GeSe + volume Te ■ 2
= 40.84 + 49.26= 90.10 cm3
Volume fraction:
40.84 Te == -9ÖJÜ = 45-3%
1
GeSe = 49,26 = 54 70/ 2 90.10 * '//c
3.3.2 Particle Size Calculations In addition to volume fraction calculations, it is possible to determine
average particle size of crystalline phases from X-ray diffraction data. The
widths of various Bragg reflections at one half maximum intensity were
measured as a function of annealing temperature. The crystalline particle
size was calculated by use of the Scherrer formula:
0.94X
where ;
t ■ BcosS
B
t = particle size diameter in A
X = wavelength of X-ray in A
6 = angle of incidence
-__ —"■— ■-■-'-

■ "■"•" ii ■ i ■■ i -^n^mm- HPUP^" i > HH
65
B ■ broadening of diffraction line in radians.
To determine B, the instrumental broadening must be subtracted from
the measured broadening by some appropriate method; the method of 43
Warren was used in this study. To determine the broadening due to
particle size effect alone, the instrumental broadening B , was taken s
the Bragg reflection breadth of a silicon powder standard extrapolated
a function of 20 within the region of interest. According to Warren, the
calculated peak breadth B, is related to the measured breadth, B , by:
as
as
m
„2 „ 2 2 B = B - B .
m s
This method of crystallite size determination is shown in the following
example for a Te{101) reflection annealed at 250OC for 60 minutes. The
base line drawn beneath the Bragg reflection is taken to be the lower limit
or base intensity while the peak is taken as the upper limit or maximum
intensity.
Maximum intensity = 98%
Base intensity = 14%
Intensity at 1/2 maximum = 56%
A2e(101) = ^O75026 at 27.602e
A2e(hkl) fr0m Si standard at 27.602e 0.156O2e
■JH

~v- • .intmmmmm'^vrkmnniii i njia^n^wovi,!! i m ' ■ anii m i i i i ■ nB^ra«pm>*«Pm««mBnmi*i*P^«^^on^"^^"«anwRPaMm
66
B2 = B 2 - B 2
m s
B = Kl.075O2e)(0.01745 rad/degl 2
- r(0.156O2e)(0.0174 5 rad/deg)] 2
B = 0.01856 rad
I m 0-94X BcosQ
m (0.94)(1.542Ä)
(0.01856)(cos 13.8°)
= 80.4Ä
This is in good agreement with the upper limit of the Ge Te Se tie 20 40 40
line in Figure 3.8.
3.3.3 Integrated Bragg Peak Intensity Results
X-ray diffraction of bulk thin film of Ge^Se^Te^ and of sputtered
samples indicated that Te crystallites are not nucleated on the surface but
are internally nucleated with random orientations. These observations were
confirmed by TEM observations as described in Section 3.2, To monitor
the nucleation, growth, and ripening of these Te crystals, a quantitative
X-ray study was carried out with a series of amorphous sputtered
mmamtm

IIP ui j u^inimmmm ■ imwmm i m*Mum\m^i\*»m^^m*^m^m***^mmmmmmm*mi^m^^mmmmm
67
film samples held at progressively higher annealing temperatures. The
integrated intensities and breadths of the Te (100), (101), (003) and GeSe
(111), (103) Bragg reflections were chosen to determine particle size,
shape and volume fraction during thermal crystallization. Table 3.1 givos
the relative integrated X-ray intensities of these peaks related to those of
o the fully crystalline state at 375 C.
A measurable increase in Te diffraction intensity accompanies the
precipitation of GeSe at 375 C, The volume fraction as a function of
annealing temperature is taken from the average of individual (hkl) reflections.
52 The comparison of the A.S.T.M. standard powder pattern reflection intensi-
ties for Te and GeSe to the measured X-ray intensities verifies the random
orientation of the crystallites present.
The volume fraction of each phase is shown in Figure 3.3 as a function of
annealing temperature. It can be seen that Te reaches a saturation volume frac-
tion of roughly 0.34 between 175 C and 275 C until nucleation of GeSe crystals
occurs. The increase in the volume fraction of Te crystals upon nucleation
and growth of GeSe crystals can now quantitatively be evaluated and pro-
vides a measure of the Te content of the high T glassy phase of Ge^S«5 „Te.,,. g 20 i0 40
A rough calculation for the atomic percent of Te in ghe GeSe -rich
o amorohous phase of Ge.-Te .„Se.,, at 350 C can be made from the volume
20 40 40
fraction data before and after GeSe crystallization shown in Figure 3.3. The
amount of Te in the GeSe -rich phase is simply the difference between the
lower saturation level of Te crystallites between 200 and 350 C and the

I P1"' PWW ^v ■ ■■■ —"^^ ■ ■' ■ munai ■ I«I i
68
to
z
CO
a .-1
o 9
CO o
01
Ü M
O IX K o < Q ui a u H H n. W
u, O Z o < 9 "J < H CO
IX O
< 2 cc H ■ H cc O
<
<
cc
o o m CM f—l o O O O o o o o •
o II ■*-' m 9 ■
»-i »—« I-«
» ■ (M i 4> -^».
c/3 P4 o o *J ■ *-« O O o o o o o o o in c o rt •-< r~*
0» c »—< i > *-* rj o •-» t^. iß o o B CO
o o
CO o n lO ■«r CM r^ o 10
0) o
1 • to
• oo 00 r»
• 00 cn
• 00
■ o
II ^H »—• o o o o o o o o o o
o ■M o o o o o o o o o f—< *—' f-4 f* r-t *~< f-H f—• r-l <-* l-t
J H o
o T oo
■ CM •-• 00 r-i CM • •
*-< CM <M n •-* v o in M o •-< r-< i-4 r-i •-* •^ i—* r-l CM
In ro at o o o o O o o o m »-< • p 4)
«r
& (U
1 U -^ •—« CM
J3 P4 o o o o o o o o i: p^ • < CO
«1
H 1 u g^ c». r-t o f-* in CM 00
c CO T CM o CN CD 00 ^ 0) o 1 • • • • • • c
o <—t CM n n CM CM m
fl ■ i r-« t^ CM C7I o i^ m ro f~*
X o (M
• in UJ
• lO
• • • • ■o f-4 CM CO n ro ro ro 'J" I ■ ro H
1 o 00 <M cn o lO C7> ro m o UI CM 00 o T cn CM CO
c •-< • • • • • • • • r-A n T ■v Ul CO m u>
"u 4)
01 "2 1 "u 0 03 I 0. U •o 1 1 41 H
O
4) C *4
Ü
a. ■ c
3 | (A
ff O o •** >, C ^.^ f ^H c 3
1 1 o
S UI
y ■ «
CM 4>
c <
« o
y
o o u-> in o i/) o o in *
4) H
CO 4) in 1^ CM m ev f~* • f» o »-* f-4 CM (N CM CO ro ro
.MMMHMHMI ■Ml

I' I
69
Fig. 3.3
Volume fraction of crystallization products for Ge 20
Te .Se _ films as a function of annealing temperature.
mm MMMMaaw^MHakdM

"" " i ■ i I ■! i ■•! i^ 1 I i nil ■ - ■■"- ' ^^^^mm^'^^'^^mmmmmmmmmmmmmmmmmmi^^^^^'^
1 70
VOLUME FRACTION
o
m
m
> (Jl H O C a
o o
u o
o ■ X • -< </) (/) • H^ > 1- M
o s -<
H
—
_^iM^aMBH

^m^*amiwmw^i^mmmmm*t* mi A mmm-^mwmfmmmmr^^tmm ■ i ^
71
upper saturation level of Te crystals nucleated by crystallization of GeSe 0 2
at 375 C. This calculation is as follows:
Atom fraction of crystalline Te at 350 C
atom fraction \l volume fraction of Te crystallized |
Te in Ge2oTe40Se40 II volume faction of Te in A Ge„„T3_Se_
'20 40 40
(0-4) '^77 =0-30 ^0.45/
By difference, the composition of the residual glass phase at
350 C contains 0.4 - 0.3 = 0.1 gm atoms of Te, i.e. , Ge Te Se ,
corresponding to Ge28 .e1^ #3Se57 i when normalized to 100 atomic percent,
This value is in close agreement with the composition of the high T GeSe -
rich glass calculated by the tie-line method.
3.3.4 Particle Size Evolution vs. Annealing Temperature
The nucleation growth of Te and GeSe2 crystallites as a function of
annealing temperature from particle size determinations of peak breadths
are shown in Table 3.2 . By direct comparison of the particle size for
Bragg reflections in Te and GeSe2 it is noted that no strong shape assymetry
accompanies primary crystallization or grain coarsening. The particle sizes
corresponding to these reflections are plotted in Figure 3.4 as a function of
annealing temperature. Very rapid growth of the Te crystallites occurs be-
tween 135 C to 150 C in the same range where the Te volume fraction is
Increasing rapidly. Between 200OC and 350OC the particle size increases
slightly while, as we have seen in Figure 3.3, the crystalline Te volume,
fraction stays roughly constant. GeSe2 nucleates at 3750C leading to a
rapid increase in Te particle size.

- ...__ .... .., ■ ,l,|i imiwrm,^m^m^mm^^^rmmimmm.mmm^m^m
72
CD <
CO H
u
3
n
0)
a; 0 CO p O X c ir O
< Q u ■ UJ H H P IX w u, O 2 O P
— < H CO R cc U
<
en u X H ■ o B
0
< DC
I X
o o CO CM
^H o o o o e O o O rv c
II m «r
P4 f—1
Q ,
■ Cvj
Ü 1 ■—i CO »—< o o
ij 1 »-4 o o e o o o o o o (0 c Ü £9 r^ 1 c m ID > m
o CNJ o r-H N CO c a
8 1 CO o ro >o »r CN t^ c
o o in LD 00 CO r^ CO en co
■ o
II ^H
f-t o o o O o o o o o o o o o o o o o o o o »—1 ^— 1—1 f—< f^ i-H i-H l-H l-H ,-H i-H
dl H o
o T ao fN f—t CO ~ CN crt
CVJ (Nl m I-* T o IT) CN o r-*
" " ~ eg
_ "in 4-1
PO en o o o o o O o O in
■ c D CM «
fc CO
s Ü _ •—t CN
ü »—» o o o o o o o O u f 00
(A ^^ IV ,—1 o i-H in CM 00
C ro TT IN o eg ai 00 tv
0) O 1 • • • • • • • 4-» o rg m ro CM CN TJ* c 1—■
>~ (0
1 01 ""^ 1^ IN en o l-H LO m -H
X H o CNJ LD ID ID t^ Ol T CT1
■a '— ■—< CN ro ro CO PO ro V | (0 E 1 o CO CVJ CD O ID cn ro in
o m rg 00 o *r <T1 CM ro C ■i • • • • • • ■ •
■" m T T in ro LO ID
^ g 1 1 'u
5 0
tn a) a. B -c 01 a 5
0 c E K 9 ■
U c IS ■
I 0 o HH
| 01 10 g
1 C
H o •
■
* CN
OJ CO GJ
c < 0) w
8 ! in in O in O o in
Q * a r». CM U") rv T iv Ü »« CN (N CM CO ro 'ro

•*mm*mmfmiw*m*m ■" '■■ •"' m^nfVI^
73
o 0
1.1
<
CO
w
3
T (1)
to o
o H
o d) o CO
o ■ CL
o <: Q M K w H H
Ou CO
u o
o < n < H CO >-l
cc u <
H sc H or. o R < H < Q
< I X
CM
V VI CO C) ■ 4-« Ü
•o CO + (D B i o> a» H (0 Q 1
0) > < 10
#-4
in m (Nl ip in ID ID ID
0
in on ai cn T CO t--
6 0 E
ro
ü
DO CD IB CD CD ID ID 0
i c ra in n i
JU 4-1 rj
"(3 0
in C
C/3 C) O O 0 0 O O O 'T
in Ü in •
C c o »-, • o >, u ■
t
>i ■a
E 0) t^ CO M* in • T T 0
_3 *-* E
d) 00 O 0 in f-H CM 10
0 H m •—< ro ro CO CO ro «r
> CK O 4-» C
T3 in ■A (N
0) 0 QJ 0 O g 0 CO 0 O 0 0 0 0 O 0 u (1) *-< en (D 4-1 C
-o
CQ
c 0)
c
11 U
0 un
Ü
0)
ro r-~
CH ro fO H IX JS tu T CO 0 m 0 ro •^r 0) > X 3 H
LO 0 CD ID N 00 0 0
< CN *r CD ID t~ ID 1^ 0
in
fO 0
O 0 O O 0 0 0 0 0
0 ^r »—« ■
CO ■ 0)
Ü •-^ O 0 O O 0 0 0 0 0
C r-4 t-4
v1 O
(0 ■ 0 0
CO O
1 ID
T3
11
u 0 1
00
0 ID
CD CO 0
CD O
t—t
* I 4-i
G S1
0
ro
0 CO *r CD ID •& in O C)
■ r-4
u.
2 c 3
H 0
cn
in 1
0
in
ro
ro in
in
0
CO
cn O
H CO < (u ^^ INJ t^ f«- f^ CD CD O > p—< i i
■3 0 0
cn
■er 0 ID
0
ro
CM
CO
CO
CM CM O in in
CM in 1^ ID OD ID CO O 1 ''"'
en
«
ai —4
c —4 ^-, (0 IM
a 1
u O in m 0 in O 0 uo J| 4) 0 in t^ r\j m t-^ f-4 >r r~- H C f~* CM CM CM ro CO ro l/J
c < < I H *
... ..■,■..- ..

74
Fig. 3.4
Crystallite size as a function of annealing temperature
for Ge20Se40Te40 films.
mmaitmmmmm.

75
600
150 200 250 300
TEMPERATURE CO
350
SSi.

>«'"•-——-^r-
76
3 .4 Discussion and Conclusions
To understand the rather unique crystallization behavior of Ge Se Te ,
44 one must recall Luo's unsuccessful efforts to splat cool pure Te liquid to
form the amorphous state. Even holding the splat-receiving surface at liquid
nitrogen or liquid helium temperature had no effect on the structure of the
resulting cr/sta'line splatted products. Of course no pure metallic liquid
has been splatted to form an amorphous solid, and liquid Te has many metallic
45 properties. Furthermore, sputtered and evaporated amorphous tellurium films
crystallize in the viciniiy of 0 C, and, if we take this temperature as an
approximation of T , then T /T "«0.4. Because typical values of T*/T * g m g g
0.5, where T* is the critical temperature for homogeneous nucleation, T* lies
above T , and a liquid being cooled from T toward T would be expected to g m g
nucleate and crystallize at T* unless the viscosity of the liquid T* is suffi-
ciently high to inhibit the nucleation rate. Similar effects would be expected
In super cooled Te-rich alloy liquids whether obtained by cooling of a homo-
geneous liquid phase or by separation of a Te-rich liquid phase during the
cooling of some ov.her liquid alloy which undergoes phase separation upon
crossing into a region of liquid immiscibillty.
This latter possibility apparently occurs during the cooling of liquid
Ge Se Te , which separates a liqrid Te-rich phase which rapidly crystal-
lizes. Analogous behavior presumably occurs as initially homogeneous sput-
tered amorphous films of Ge .Se.-Te. are heated above about 125 C, and
Te crystals are formed on a very fine scale (~50A or less) within the film.
_——B^—,

UHU I.» i »m. in» ii ■• '' ' *a"*wiipmmp«iiv^«<inpnan "
77
The agreement between particle size and volume fraction measurements on
400A thick TEM samples and 4mn thick X-ray diffraction samples annealed
at the same temperature indicates that the crystals form at a uniform rate
throughout the film thickness, and are not preferentially nucleated at the
surface. This result contrests with the observations of Moss and deNeuf- 53
ville who observed surface nucleation of Te crystals on sputtered films
0f Te83Gei7 and Te81Gei5S2Sb2 When theSe films were annealed in the
vicinity of T , In that case transmission electron diffraction (TED) and reflec-
tion electron diffraction (RED) indicated Te crystals at a much lower annealing
temperature than X-ray diffraction, proving the role of surface nucleation.
Indeed, chalcogenide glasses in general have been shown to nucleate crystals
mostly at free surfaces, and the present observations represent an unusual
contrast to this normal result.
In order to understand the uniqueness of the crystallization behavior of
Ge20Se40Te40 in comParlson to alloys containing slightly more or slightly less
Ge (which can be sprayed to form two-phase glasses), it is useful to further
examine qualitatively the compositional dependence of 7 , T* and T in the g m
ternary Ge-Se-Te system in the vicinity of Te. In Figure 3 we show such a
schematic plot for homogeneous Te-rich alloys which indicates that T* de-
creases and Tg Increases as the Ge and Se content of the alloy increases.
46 As T* approaches T , a new effect enters into the theory of homogeneous nucle-
ation, the rate of aggregation of unstable equilibrium clusters due to viscosity
effects. For T* near T this effect rapidly reduces the nucleation rate, rendering
Invalid the correlation of T* with Tm which we have assumed. As the Te content of the
mmmmamm

PPH»PP|W^^WWWW»^,,»T ii'HI KL^^mm^m« ■- L niuaii. iiv*aimm*n*v*M^wwi i i .1 ■ i imm
78
Fig. 3.5
Schematic representation of T , liquidus m
temperature, T , glass transition tempera-
ture, and T* (T* - T 72), homogeneous nucle-
ation temperature, all versus Ge+Se content
in Te-Ge+Se system.
*mm ■MHMMiMa

mm*mmmmmm*m*w ■ mjmmm^mi i mn*mimLmv^***mmmfwim**^**^^*mmii*mimmm* i
79
800
M
5 H
□ a,
U H
700 -
600 -
500 -
400 -
300 -
200 -
100 -
Te .02 ,04 .06 .08 .10
ATOM FRACTION Se, Ge
A

i in<iwi\t^m*^imm~mmfmm-mmm mwmmm
89
Te-rich amorphous phase in the immiscibility portion of the GeSe -GeTe -
Se-Te sub-system is also a sensitive function of the average composition
of the phase-separating alloy, it is thus understandable that the probability
of homogeneous nucleation of To crystals is itself a very sensitive function
of average alloy composition.

,»«——. iia^ww^ww w^^m^^ma^^mmi^^mmmmm
81
4. ELECTRICAL AND OPTICAL PROPERTIES OF AMORPHOUS PHASES IN THE Ge-Se-Te SYSTEM
4.1 Introduction
In other papers we have described optical, electrical, and thermo-
47 48 electric properties of the Ge-le and GeTe -GeSe binaries in detail.
Here we will summarize these properties for sputtered films in the entire
Ge-Te-Se ternary system. The GeTe -GeSe pseudobinary line in this
system is particularly interesting because it represents the line of stoichio-
metric compositions for four-fold coordinated Ge and two-fold coordinated
chalcogen atoms. That is, it is possible to obtain chemical ordering along
this line in the sense that all bonds are between Ge and chalcogen atoms.
Binaries in the other direction, such as the Ge-Te and Ge-Se binaries, are
also interesting, because striking changes in properties with composition
can result as atoms from two different columns of the periodic table are
mixed.
4.2 Summary of Electrical and Optical Properties
Here we summarize properties both for films as-deposited on room
temperature substrates and for annealed films. For materials which have
a T the films were heated to a temperature near T where the optical and
electrical properties were independent of annealing temperature (see Fig. 2.13
of the 3rd Semiannual Technical Report). For the Ge-rich materials which have no
T , choice of an annealing temperature is somewhat arbitrary, although it is
limited by the crystallization temperature. Also, the crystallization temperature

"■■Il ' ' '■••• •• ' I «>. ■■ *~mmmmmmmm*mi^m^Kmwm tmmmi **m
82
itself is somewhat ambiguous since the crystallization rate is a thermally
activated process. Figure 4.1 shows glass transition temperatures and
crystallization temperatures for the Ge-Te and Ge-Se binaries. The glass
transition temperature was determined in a scanning calorimeter at a rate
of 20 deg/min. Crystallization temperatures are approximate temperatures
obtained on a convenient laboratory time scale (of the order of seconds or
minutes). For the physical properties ascribed to an annealed state in
this discussion, we chose annealing temperatures that increased with in-
creasing Ge-content, as indicated in Fig. 4.1.
Figure 4.2 shows the optical gap E04 (defined as the photon energy
at which the absorption coefficient is lO4™"1) vs. fraction of germanium
for the Ge-Te, Ge-Se, and Ge- Te^Se^) binaries. Just as a strong
peak at GeTe2 was found for annealed materials in the Ge-Te binary, so
also are such peaks found in the Ge-Se and Ge-(Te Se ) binaries. Un-
annealed materials have smaller optical gaps and show the same general
qualitative bahavior as the annealed materials, except that the peaks near
the stoichiometric compositions are not sharp. On the Ge-rich half of the
binary, all three binaries have optical gaps which lie below a linear line
connecting the endpoints; this will be discussed for the Ge-Te binary in
the Final Technical Report for this contract.
. The conductivity at room temperature is shown for the same binaries
in Fig. 4.3. This plot is similar to an inverted optical gap plot, and
reflects the fact that the major variations of conductivity with composition
■art m^mmmm

pi ' ' '**mmmm WTntmrnm^mmir •^^mmmmm ■■' m mm W^R^OT^
83
Fig. 4.1
Glass transition temperature T , crystallization
temperature T , and the annealing temperature
employed in this work for the germanium-rich por-
tion of the Ge-Te, Ge-Se, andGe-(Se Te )
binaries. Transition temperatures were determined
in a calorimeter scanned at a rate of 20 deg/min.

■-•' -"1,>-""—
84
500
400
O 300
p < □ 200 a.
M H
100
T (Ge-Se) g
Ge-Te
.' T (Ge-Te) g
l Se
Se0.5Te0.5
Te
1 Annealing Temperatures
X 0.33 0.5
FRACTION GERMANIUM
Ge
^- .^ .*AM

- ■,! NK.IIi i.iLM iiiiMPinnwiiia ^•■»^■IIWW^I!«»«^»»"™««"""1 ' u i"J'^«!HW«w>« " ' ■ '
85
Fig. 4.2
Optical gap E (photon energy at which the absorp-
4 -1 tion coefficient is 10 cm ) vs. fraction of germanium
for annealed films in the Ge-Se, Ge-(Se Te ), and
Ge-Te binaries. The discontinuity in the line for the
Ge-(Se Te ) system corresponds to the phase
separating region.
mt —. .. '■"

■«P»Hll""l"W^^^"i«w'^"i "■■^•"•"-■■»wrJWIP
86
04
(eV)
0.33 0.5
FRACTION GERMANIUM (x)
Ge
^■MHH umalm —-- — ■"—e-

, '■ ■''■■ mm ■^^^ wmm^ma
87
Fig. 4.3
Electrical conductivity at 25 C vs. fraction of ger-
manium for annealed films in the Ge-Se, Ge-(Se Te ),
and Ge-Te binaries. The discontinuity in the line for the
Ge-(Se Te ) system corresponds to the phase separa-
ting region.

Jin i injtimim^~~~ ■■■ i ■WMMM^H«*"«^*« l • ai i ^BW^Pi^^P^iWW^PW ^^^
88
Ü o to
T -10 B u
G
0.33 0.5
FRACTION GERMANIUM (x)
Ge
mm.

m^**^^~~*mm~T^~-^~~
i 89
are dominated by the variations of the gap.
4.3 Discussion
The extrema in various physical properties at GeTe , GeTeSe, and
GeSe2 are associated w'th the structure, the bond strengths, and the
ionic components of the bonds for the various alloys. This was discussed
by Rockstad and deNeufville for the Ge-Te binary.47 Let X = Te , Se ,
orTeSe. Based on the observed extrema we infer the following. The
structure of annealed amorphous GeX2 is a fully cross-linked covalently bonded
structure, with Ge in 4-fold coordination and Se and/or Te in 2-fold coordination,
in analogy with vitreous silica. The only bonds in this structure are
bonds between Ge and chalcogen atoms. Compositions to Mther side of
GeX2 have excess Ge or excess chalcogen with respect to GeX , and hence
must have Ge-Ge or X-X bonds as well as Ge-X bonds. Because of the ionic
component of the Ge-X bonds, the effective bond strength is greater for
GeX2 than for other compositions, giving rise to the maxima in the optical
gaps and to extrema in other phvsical properties.
Based on the electrical, thermoelectric, and optical data, we believe
that the dominant room temperature dc conduction in the Ge-rich portion of
the ternary takes place near the Fermi level by hopping in localized states.
Addition of up to about 10% of Te and/or Se adds more localized states in the
gap, which results in a larger hopping conductivity in the case of Te additions.
For more than 30% of Te and/or Se, the dominant conduction takes place
in either the valence or conduction band. For these alloys with more than 30%

*^^m^ • • ' ■n'-i< mull iiiiiu » ■.. J i IJII P^TC^<^^'
SI
Te or Se the densities of localized states in the gap between the valence
and conduction bands are considerably smaller than the density of localized
states for Go. This observation is apparently the result of the bonding
flexibility introduced by tellurium or selenium as opposed to the inflexible
tetrahedral bonds of germanium.
Although the germanium tellurides were found to be p-type in both the
unannealed and annealed states, except for greater than 60% Ge-contents,
we found that replacement of Te by Se brought abou. a tendency toward
negative thcrmopowers (S) and negative slopes of the S vs. 1/T plots for
the annealed state,;. The unannealed states of these materials were never-
theless p-type.
Figure 4.4(a) and (b) shows the p-type and n-type regions of the ternary for
unannealed and annealed films. Compositions included in this study are
indicated in the figures. It is interesting that p-type behavior persists to
larger Se:Te ratios along the GeTe-GeSe pseudobinary than along the GeTe0-
GeSe pseudobinary. Note also the sizable composition rcnge where un-
annealed alloys are p-type but annealed alloys are n-type. Iso-resistivity
lines for the ternary are shown in Figure 4.5(a) and (b). For annealed alloys
there is a sharp peak in resistivity along the GeTe -GeSe pseudobinary
line and a vallt/ centering near Ge Te . The resistivities in the vicinity
of GeSe and Se have a relatively high degree of uncertainty both because
of difficulty in measuring them and because, for such high resisUvity materials,
the sample resistances are very sensitive to impurities and contacts. Also,
.._

■ ■i i ■ ^^nv^ii g i i mrm^mammi^^^ i i ^^^^^ ^m^mmm- ■ ■■
91
Fig. 4.4
P- and n-type regions for sputtered amorphous
films in the Ge-Se-Te ternary.
(a) Unannealed films deposited on substrate
o held near 25 C.
(b) Annealed films
The regions in the vicinity of selenium ar? unde-
termined.
in in— i i—i i wm_~Jttmma I

■^liViPi^v^^w^v^WMHi^ai^pailii^^viPQ^pnw^qnaBPVHliiMVH^piMVT^wqMnBipHiiMffWMi i i ii miiß\u*^^mmm^ti mumiw*t.mm^w~''^^^^^**i^*^^^m^m^^m*mm^—m*mi*^m^mmmim
92
UNANNEALED
ANNEALED
•*mm ■

P" i ■ mi" iiiiiunwuni ii.ipw««p^^wwp»«w^«(w»«ipi»flpi»ra «i«iipniiw""«i«ii i « IUHJWMH»™ I JI M . . , lKiiiii\^mmmi^^*<^mmm^^mmmmmmm'^~^mmmm**m
93
Fig. 4.5
Isoresistivity lines for sputtered amorphous films
in the Ge-Se-Te ternary.
(a) Unonnealed films.
(b) Annealed films.
Broken lines for high resitivity materials indicate
materials whose resistivities have unce tainties
as high as one to three decades, as discussed in
the text.
^J

U.1^ !•.■ 1.1 >l. I.. ■■ I 1 ■ I w^^^aWBWWWPBi - "
94
UNANNEALED FILMS RESISTIVITY (ohm-cm)
I.6XI05 lO6
I08 I010 I012 10'* I0'6
ANNEALED FILMS RESISTIV.TY (ohm-cm)
2X 10

■ " ' ' ■ ■' "■" ^mm
95
these high resistivities at room temperature are estimated from high tempest
extrapolations. Homogeneous annealed alloys are unobtainable in the phasr,
separating region.
4.4 Summary and Conclusions
Extrema in electrical and optical properties were found along the entire
GeTe2-GeSe2 line of the Ge-Te-Se ternary, for annealed films. These
extreme are associated with the strength (and partial ionic character) of
the germanium-chalcogen bond and the fact that along this pseudobinary
line all bonds can be between Ge and chalcogen atoms, with Ge in four-fold
and the chalcogen in two-fold coordination. The sfructure is presumeo simi-
lar to that of vitreous silica, as exemplified by the Evans-King random net- 49
work model.
N-type thermopowers were discovered for annealed alloys from a large
region of the ternary, suggesüng the possibility of abricating amorphous
chalcogenide semiconductor devices employing n-type as well as p-type
layers. By control of annealing steps, either n- or p-type conduction can
be obtained in the same composition for a sizeable range of compositions.
Two factors were discovered which give a general trend from p- to
n-type conduction: 1) annealing of the sputtered films increases the tendency
toward n-type behavior, particularly for alloys containing selenium; and ■)
increasing the Se:Te ratio increases the tendency toward n-type behavior in
the annealed alloys.
ure
mm

■ III P" II ■■■. JIIPI I > I ■•!» I I "I HI I ■ IIUIIIPIIIIJIUIII 1 1
qp
BIBLIOGRAPHY
1. N. F. Mott, Advan. Phys. JJD, 49 (1967)
2. A. Bienenstock, Y. Betts and S. R. Ovshinsky, J. Non-Crystalline
Solids 2, 347 (1970,
3. J. P. de Neufville, J. Non-Crystalline Solids 8-10, 85 (1972).
4. V. Betts, A. Bienenstock and S. R. Ovshinsky, J. Non-Crystalline
Solids 4, 554 (1970).
5. F. Betts, A. Bienenstock, D. T. Keating and J. P. de Neufville,
J. Non-Crystalline Solids 7, 417 (1972).
6. L. Pauling, Nature of the Chemical Bond Cornell University Press,
Ithaca, N.Y. (1960).
7. Ralph W. G. Wyckoff, Crystal Structures. Volume 1 and Volume 2,
Interscience Publishers, New York (1964).
8. A. F. Wells, Structural Inorganic Chemistry. Oxford University Press,
Oxford, England (1962).
9. H. Keller and J. Stuke, Phys. Stat. Sol. 8, 831 (1965).
10. J. Schottmiller, M. Tabak, G. Lucovsky and A. Ward, J. Non-Crystal-
line Solids 4, 80 (1970).
11. J. P. deNeufvillc, D. Sarrach, R. Seguin end J. Tyler, Bull. Amer.
Cer. Soc, March (abs.) (1972).
12. J. P. deNeufville and D. Sarrach, Bull. Amer. Phys. Soc. J_8, 421
(abs.) (1973).
13. N.J. Shevchik and W. Paul, J. Non-Crystalline Solids. 8-10. 381 (1972),
mmm MMM ^mm

pwp»"'"«1'i'' ■iwmiBwwiqB^iBUpuppKi^w^pmppp^ppp »»■PPl««P-^^^W"i™"lWMmi»BP»~""»~^>',™PI "■ — ■ i •■ •-
97
14. S. C. Moss and J. F. Graczyk, Proc. Intern. Conf. Physics of Semi-
conductors, Cambridge, Mass, 658 (1970).
15. E. A. Fayen, Abstract submitted to Fifth International Conference
on Amorphous and Liquid Semiconductors.
16. H. K. Rockstad and J. P. deNeufville, Abstract submitted to Fifth
International Conference on Amorphous and Liquid Semiconductors.
17. A. Eisenberg, personal communication (1973).
18. A. Eisenberg, Polymer Letters I, 177 (1963).
19. J. P. deNeufville, C. H. Drummond and D. Turnbull, Phys. and Chem.
Glasses JJ., 186 (1970).
20. N. K. Abrikosov, V. F. Bankina, L. V. Poretskaya, L. E. Shelimova,
and E.V. Skudnova, Semiconducting II-IV. IV-VI and V-VI Compounds,
Monographs is Semiconductor Physics, Plenum Press, New York (1969).
21. R. Messier and R. Roy, Mat. Res. Bull. 6, 749 (1971).
22. F. A. Shunk, Constitution of Binary Alloys, Second Supplement. 394,
McGraw-Hill, New York (1969).
23. M. Hansen, Constitution of Binaiy Alloys, 1188-1189, McGraw-Hill,
New York (1958).
24. J. E. Morral, Pb.P« thesis, Dept. of Metallurgy and Materials Science,
Mass. Inst. Tech., Cambridge, Mass. 02:139 (1968).
25. M. B. Myers and J. S. Berkes, J. Non-Crystalline Solids 8-10. 804
(1972).
26. J. J. Mecholsky, G. R. Snnivasan, C. T. Moynihan and P. B. Macedo,
J. Non-Crystalline Solids JJ., 331 (1973).
■Mi

wm*rrmr^****mr*mmmmim* IHM 11 miv
98
27. R. Roy and V. Caslavaska, Solid State Commun. 7, 1467 (1969).
28. C. T. Moynihan, P. B. Macedo, I. D. Aggarwal and U. E. Schnaus,
J. Non-Crystalline Solids 6, 322 (1971).
30. R. A. Powell and W. E. Spicer, Bull. Amer. Phys. Soc. 18, 390 (1973).
31. Second Semiannual Technical Report, Contract DAHC 15-70-C-0187,
Advanced Research Projects Agency, Washington, D.C. (1970).
32. S. V. Nemilov, Zh. Prikl. Khimii No. 37, 1020 (1964).
33. A. Felz, H. J. Buttner, F. J. Lippmann and W. Maul, J. Non-Crystal-
line Solids 8-10, 64 (1972).
34. Y. Kawdmoto and S. Tsuchihashi, J. Amer. Ceram. Soc. 54., 131 (1971).
35. M. B. Myers and E. J. Felty, Mater. Res. Bull. 2, 535 (1967).
36. R. Mozzi and B. E. Warren, J. Appi. Cryst. 2, 164 (1969).
37. E. Lorch, J. Phys. (C) 2, 229 (1969).
38. E. F. Riebling, J. Amer. Ceram. Soc. 5X, 406 (1968).
39. O. V. Mazurin and M. V. Streitsina, J. Non-Crystalline Solids ^l, 199
(1972).
40. R. D. Maurer, Symposium on Nucleation and Crystallization in Glasses
and Metals, P. 5, The American Ceramic Society, Columbus, Ohio (1962^.
41. D. Turnbull, J. Appl. Phys. 21, 1022 (1950).
42. S. D. Stookey, U.S. Patent 2, 920, 971 (1960).
43. B. E. Warren, X-ray Diffraction, Addison-Wesley (1969).
44. A. L. Luo and P. Duwez, Appl. Phys. Letters 2., 21 (1963).
45. J. E. Enderby and E. W. Ceilings, J. Non-Crystalline Solids 4, 161 (1970).
_ —..—^

- -. ■ ■.^.-; ■ ■ ■■ ■ :J i^TWirr*«^»*^
99
46. W. B. Hillig in Symposium on Nucleation and Crystallization in Glasses
and Melts (American Ceramic Society, Columbus, Ohio, 1962) p. 77.
47. H. K. Rockstad and J. P. deNeufville, Proceedings of the 11th Inter-
national Conference on the Physics of Semiconductors. (Polish
Scientific Publishers, Warsaw, 1972), p. 542.
48. H. K. Rockstad and R. Flasck, "Transport and Optical Properties of
Amorphous (GeTe ) (GeSe ) Alloy Films", to be submitted for pub.'i-
cation. See also Appendix II, Final Technical Report of ARPA Contract
DAHC15-70-C-0187.
49. D. L. Evans and S. V. King, Nature 212. 1353 (1966).
50. G. Lucovsky (personal communication, 1973) has been able to characterize
the I.R. Spectra of these two alloys in terms of the exnected scaling of
the oscillater strengths observed for restiallin vibrations in SiO .
51. D. E. Polk, J. Non-Crystalline Solids 5, 365 (1971).
52. Powder Diffraction File, Inorganic Volume No. PiJIb-5, lOiRB (Joint committee
on Powder Diffraction Standards, Philadelphia, Pa., 1967).
53. S. C. Moss and J. P. deNeufville, Mat. Res. Bull. 7, 423 (1972).

![Multidimensional Persistence in Biomolecular Data › users › xiakelin › paper › P22.pdf · computational biology,[51,81–83] and nanoparticles.[84,85] The most successful](https://static.fdocuments.in/doc/165x107/5f0c78267e708231d4358f10/multidimensional-persistence-in-biomolecular-data-a-users-a-xiakelin-a-paper.jpg)

![CosmologywithFuture Gravitational Wave Observations · 2018-07-26 · Using the fits to numerical simulations of binary black hole mergers in [92,93], we provide estimates of the](https://static.fdocuments.in/doc/165x107/5ec932e5f7d8d31ad751448e/cosmologywithfuture-gravitational-wave-observations-2018-07-26-using-the-fits.jpg)