
Research On Fuel Compensation Control of High- pressure ...
17
Research On Fuel Compensation Control of High- pressure Common-Rail Diesel Engine Based On Crankshaft Segment Signals Yuhua Wang Kunming University of Science and Technology Guiyong Wang ( [email protected] ) Kunming University of Science and Technology Guozhong Yao Kunming University of Science and Technology Lizhong Shen Kunming University of Science and Technology Shuchao He Kunming Yunnei Power CO., LTD Research Article Keywords: crankshaft, diesel, algorithm, module Posted Date: November 2nd, 2021 DOI: https://doi.org/10.21203/rs.3.rs-989414/v1 License: This work is licensed under a Creative Commons Attribution 4.0 International License. Read Full License
Transcript of Research On Fuel Compensation Control of High- pressure ...

Research On Fuel Compensation Control of High-pressure Common-Rail Diesel Engine Based OnCrankshaft Segment SignalsYuhua Wang
Kunming University of Science and TechnologyGuiyong Wang ( [email protected] )
Kunming University of Science and TechnologyGuozhong Yao
Kunming University of Science and TechnologyLizhong Shen
Kunming University of Science and TechnologyShuchao He
Kunming Yunnei Power CO., LTD
Research Article
Keywords: crankshaft, diesel, algorithm, module
Posted Date: November 2nd, 2021
DOI: https://doi.org/10.21203/rs.3.rs-989414/v1
License: This work is licensed under a Creative Commons Attribution 4.0 International License. Read Full License

Scientific Reports | 1
www.nature.com/scientificreports
OPEN Research on Fuel Compensation Control of High-pressure Common-Rail Diesel Engine Based on Crankshaft Segment Signals Yuhua Wang1, Guiyong Wang1*,Guozhong Yao1,Lizhong Shen1 ,Shuchao He2,
1Yunnan Province Key Laboratory of Internal Combustion Engines, Kunming University of Science and Technology, Kunming 650500, China.
2Yunnan Key Laboratory of Plateau Emission of Internal Combustion Engines,Kunming Yunnei
Power CO., LTD, 650200, P. R. China.
*Corresponding. author email: [email protected]
Abstract:
This paper studies the high-pressure common-rail diesel engine fuel supply compensation based on
crankshaft fragment signals in order to improve the uneven phenomenon of diesel engine fuel supply
and realize high efficiency and low pollution combustion. The experiments were conducted on a diesel
engine with the model of YN30CR. Based on the characteristics of crankshaft fragment signals, the
proportional integral (PI) control algorithm was used to quantify the engine working nonuniformity and
extract the missing degree of fuel injection. The quantization method of each cylinder working
uniformity and algorithm of fuel compensation control (FOC) based on crankshaft fragment signal were
established, and the control strategy of working uniformity at different operating conditions was put
forward. According to the principle of FOC control, a FOC control software module for ECU was
designed. The FOC software module was simulated on ASCET platform. The results show that:
Compared with the traditional quantization method, the oil compensation information extracted from
crankshaft fragment signal has stronger anti-interference and more accurate parameters. FOC
algorithm can accurately reflect the engine's working nonuniformity, and the control of the
nonuniformity is reasonable. The compensation fuel amount calculated by FOC is high consistency with
the fuel supply state of each cylinder set by experiment, which meets the requirement of accurate fuel
injection control of common-rail diesel engine.
Abbreviations FOC Fuel compensation control ECU Electronic Control Unit PI Proportional integral IIR infinite impulse response

www.nature.com/scientificreports/
Scientific Reports | 2
Introduction
Increasingly serious energy consumption and environmental pollution problems, diesel engines need to use accurate electronic control technology to meet increasingly strict emission regulations and fuel consumption standards1-7. In recent years, the technology of high pressure common-rail diesel injection system has been improving, and the problem of fuel quantity calibration of fuel injection system becomes more prominent8-13.
It is important to control the fuel quantity accurately to improve the performance of diesel engine14-17. The nonuniform fuel supply deteriorates the fuel injection control so that the diesel engine cannot produce the same torque in all cylinders even if the injection time is the same, the torque contribution of different cylinders is different18,19.
The nonuniformity of engine is a common problem. The misfire fault of engine is an extreme condition of non-uniformity of internal combustion engine20-27. However, the real-time control of internal combustion engine working nonuniformity is not as important as misfire detection28-32. The instantaneous speed measurement of engine is very convenient, economical, reliable, and does not cause interference33-39. Instantaneous speed is closely related to cylinder pressure and drive torque acting on the crankshaft. At present, there are four methods to diagnose the working uniformity of internal combustion engine by analyzing instantaneous speed fluctuation signal: Reconstruction method of split cylinder torque40-41;
Waveform analysis method42;Multi-feature synthesis method43;Linear observer method based on DFT44-
47. However, these methods involve the structural parameters of internal combustion engine, the model is complex, and the amount of calculation is large, which will lead to calculation error and poor real-time performance to a certain extent48. This method is mainly used for misfire diagnosis with low real-time performance, but can not be used for real-time control of engine working nonuniformity.
The basic principle of quantification of internal combustion engine working uniformity is that the engine works at steady state condition, the working nonuniformity of engine is quantified by measuring the working parameters related to the working cycle phenomenon of engine. These parameters include engine cylinder pressure, engine crankshaft instantaneous speed, engine exhaust temperature, engine exhaust noise, engine supercharger instantaneous speed, engine block vibration and so on. Among these parameters, the instantaneous speed measurement of engine crankshaft is the most convenient, economical and reliable49-51. Therefore, using this parameter to quantify the uniformity of internal combustion engine has a great advantage. The measurement principle and process of engine crankshaft fragment signal52 and instantaneous speed are basically the same. Crankshaft fragment signal is a direct measurement parameter, and its signal acquisition is more convenient, economical and reliable. From the point of engine working cycle, the concept of crankshaft segment signal is a simplification and refinement of crankshaft instantaneous speed signal53.
Crankshaft fragment signals acquisition and analysis. Crankshaft fragment signal acquisition and processing. The crankshaft and camshaft signals were collected synchronously in the experiment. The purpose of collecting the camshaft signal was to determine the phase of the crankshaft signal accurately. The layout of the experimental acquisition system is shown in Figure 1.
Figure 1 The Experimental acquisition system
A four-cylinder four-stroke high-pressure common-rail diesel engine of the model “YN30CR” was used in the experiment. The circuit design was carried out in the external ECU circuit of single chip microcomputer, and the module signal of magnetoelectric sensor is converted into square wave signal first. Then the digital I/O port on the MCU is used to collect crankshaft incremental signal and crankshaft fragment signal. Through experimental calculation, the length of crankshaft fragment signal was determined as 5 incremental crankshaft signals. The waveform of crankshaft fragment signal with 1 and 5 times crankshaft increment signal respectively is shown in Figure 2. In the FOC control of a four-cylinder engine, the sampling section is lowered according to the above method. Each cycle consists of 24 crankshaft Angle segments is shown in Figure 3.
www.nature.com/scientificreports/
Scientific Reports | 3
(a) A crank shaft incremental signal is taken (b) Five crankshaft incremental signals are the signal
as the crank shaft fragment signal length ΔT length of crankshaft fragment TS
Figure 2. Crankshaft fragment signals containing different crankshaft delta signals
Figure 3. A working cycle is divided into 24 Angle segments
The DFT and its inverse transform can be used to extract the lowest second-order synthetic waveform below the firing frequency in the study of crankshaft fragment signals. In the software module of ECU, such computation is quite large, so it is not possible to use the same method to extract the lowest order synthetic waveform. The solution is digital bandpass filtering for standard deviation signal dMe. The 0.5-order and 1-order waveforms of the standard deviation signal dMe are extracted respectively, and then synthesized in phase to obtain the lowest 2-order synthetic waveform. The digital filter used is IIR digital Butterworth filter for band-pass filtering. The characteristic of Butterworth filter is that although the transition band is not very steep, it has the characteristics of maximum flat amplitude in pass band and stop band, which meets the needs of FOC band-pass filter.
Using LabVIEW's Digital Filter Design (Filter Design) to design the IIR parameters, the transfer function of the IIR Butterworth digital filter of the crankshaft segment signals of the second order is obtained.
-2 -4
-1 -2 -3 -4
0.00034421 0.0006884Z 0.00034421Z( )
1 3.92555566Z 5.80000050Z 3.82254895Z 0.94821739ZH z
(1)
Into a difference equation
4 4 2 0 3
2 1 0
0.00034421 0.00068842 0.00034421 3.92555566
5.80000050 3.82254895 0.94821739
y x x x y
y y y
(2)
The transfer function of the first-order crankshaft segment signal is obtained -2 -4
-1 -2 -3 -4
0.00039699 0.00079398Z 0.00039699Z( )
1 3.85702600Z 5.66275721Z 3.74833351Z 0.94444439ZH z
(3)
Into a difference equation
4 4 2 0
3 2 1 0
0.00039699 0.00079398 0.00039699
3.85702600 5.66275721 3.74833351 0.94444439
y x x x
y y y y
(4)
Digital band-pass filtering is carried out for the standard deviation signal dMe. The half-order and first-order waveforms of the standard deviation signal dMe are extracted respectively, and then synthesized in phase to obtain the lowest second-order synthetic waveform. The effect of band-pass filtering is shown in Figure 4.
(a) Bandpass filtered input signal dMe

www.nature.com/scientificreports/
Scientific Reports | 4
(b) Band pass filtering results of 0.5 order waveform
(c) Band pass filtering results of first order waveformFigure 4. Results of two digital bandpass filters
Characteristic analysis of crankshaft segment signals. At the condition of engine working nonuniformity, the signal spectrum of crankshaft fragment shows the characteristics of the amplitude of the low-order non-dominant harmonic (0.5, 1 and 1.5) significantly increased. This is a completely different feature from that in the uniform working state [52]. In order to further illustrate the above characteristics, a four-cylinder diesel engine was used in the experiment to transform the signal from time domain to frequency domain through the DFT. In the experiment, 1, 2 and 3 cylinders were used for normal oil supply, and only the fourth cylinder was cut off. The 0.5, 1, 1.5 and 2 order were selected, and the amplitude of the second-order spectrum at each rotational speed was normalized. It is observed that the relative magnitude of the four order spectrum amplitudes and their second-order spectrum amplitudes at each speed, as shown in Figure 5. The first four orders of DFT spectrum amplitudes of no-load rotating speeds at uniform operation are also normalized is shown in Figure 6.
Figure 5. Normalized spectral amplitude Figure 6. Normalized spectrum amplitude
at each rotational speed of each speed
Below 2000r/min, the half order spectral amplitude of each rotational speed is almost equal to the second order spectral amplitude of this rotational speed, and the half order spectral amplitude of 1500r/min rotational speed is higher than its second order spectral amplitude. At high speed, the spectral amplitude of 0.5, 1 and 1.5 order harmonics is no longer obvious. This characteristic is not consistent with low and medium speeds. Because under the condition of high speed and no load, the impact of reciprocating inertia moment of each cylinder is significant, the nonuniformity operation caused by single cylinder fuel break is no longer reflected in the fluctuation of speed.
It is observed that the variation of amplitude of low-order amplitude spectrum at low speed is the most characteristic of nonuniformity engine operation. Therefore, the engine working uniformity is judged by the change degree of low-order amplitude spectrum of engine crankshaft fragment signal at low speed. The smaller the relative ratio of the low-order amplitude to the second-order amplitude, the more uniform the engine working condition; the larger the relative ratio of low-order amplitude to second-order amplitude, the more nonuniformity the engine works.
When the rotational speed exceeds 1300r/min, the amplitude of the first-order harmonic component is obviously higher than that of the second-order harmonic component, even at uniform working conditions. In particular, the first-order amplitude of 1700r/min and 1900r/min has exceeded the second-order amplitude, which is not significantly different from the condition of nonuniformity work. Therefore, the quantitative detection of nonuniformity work cannot be carried out when the average speed exceeds 1300r/min. Because the distortion will occur over 1300r/min speed, so that the uniform working condition is misdiagnosed as the uneven working condition. The magnitudes of the low-order non-dominant harmonic components below the firing frequency are related to engine nonuniformity. For a Z-cylinder engine, the lowest order Z/2 harmonic components lower than the firing frequency can reflect the nonuniformity state of the engine.
Working nonuniform quantization and FOC control principle
Nonuniformity signal waveform analysis and extraction. In steady-state engine condition, the waveform of crankshaft fragment signals in Angle domain, each working cycle has the same waveform. Therefore, a single working cycle is analyzed for waveform is shown in Figure 7.

www.nature.com/scientificreports/
Scientific Reports | 5
Figure 7. Definition of characteristic parameters of crankshaft fragment signals in Angle domain
In the steady-state condition where each cylinder works uniformly, at the same phase position in the work interval of each cylinder, the rising degree or falling degree of crankshaft fragment signal per unit angle is basically the same, on the contrary, at the nonuniformity working conditions, the degree of rise or fall is different.
To characterize the above concepts, define a parameter called position 𝜑𝑗 of the crankshaft segment signal deviation 𝑒(𝜑𝑗). 𝑒(𝜑𝑗)is the difference between the crankshaft segment signal value at position 𝜑𝑗 and the compression top dead center 𝜑0 of i cylinder.
0( ) [ ( ) ( )]j je T T (5)
According to the variation trends of crankshaft segment signals, it is known that in the falling range 𝑒(𝜑𝑗) of crankshaft segment signals the value is negative.
Put the first cylinder small Angle range crankshaft segment signals of rising or falling degree is defined as the crankshaft angle signal parameters, using 𝛥𝐼𝑖(𝜑𝑗).
)()( jji eI (6)
Then, the sum of the Angle product parameters of the crankshaft segment signals in the whole i-cylinder crankshaft
segment signals drop range is defined as the crankshaft segment signals drop product diI .
deI
p
jdi 0
)( (7)
Where 𝜑𝑝 is the crankshaft angle at the peak and valley position of the crankshaft segment signal in the i-th cylindersection, 𝜑 is the top dead center of cylinder i compression.
The crankshaft segment signals rising product 𝐼𝑢𝑖 of the crankshaft segment signals rising interval of i-th cylinder can also be defined.
deI
pjui
0
)( (8)
Where: 𝜑𝑝 is the crankshaft angle at the peak and valley position of the crankshaft segment signal in the i-th cylindersection. 𝜑 is the ignition sequence of i-th cylinder and the compression top dead center of the next cylinder. However,
it should be noted that the calculation base point of angular product density of crankshaft segment signal here is p .
)( je )]()([ pj TT (9)
The main operating interval of the combustion gas pressure torque of each cylinder in this cylinder is the descending product 𝐼𝑑𝑖 or ascending product 𝐼𝑢𝑖 of crankshaft fragment signal in the work interval of the i-th cylinder in Figure. 7. The difference can be compared to indicate the degree of unevenness of each cylinder. The nonuniformity degree of each cylinder can be indicated by comparing the difference between rising and falling intervals. For a Z-cylinder engine, the lowest order Z/2 harmonic components lower than the firing frequency can reflect the nonuniformity state of the engine. Therefore, Z/2 harmonic components of the lowest order below the firing frequency are extracted to replace the original crankshaft fragment signals. For a 4-cylinder engine, the two harmonic components below the firing frequency are half order and first order.
The crankshaft fragment signal waveform under the uneven oil supply condition of the fourth cylinder part is shown in Figure 8(a). The lowest two order synthetic waveforms of order 0.5 plus 1 were obtained by DFT and IDFT, as shown in Figure 8(b). The amplitude of the 0.5 order harmonic is higher than the 1st order harmonic. Therefore the change of the lowest second order synthetic waveform becomes simpler each cylinder compared to the original crankshaft segment signals. In Figure. 8(b), the waveform trend of the work interval of each cylinder reflects the comprehensive torque action result of the cylinder. The first cylinder is completely in the decline range, indicating that under the action of the cylinder torque, the crankshaft has been accelerating in the range of the lowest second order, which reflects the strong effect of the torque, but also reflects the relatively large fuel supply.
(a) Crankshaft segment signals waveform
www.nature.com/scientificreports/
Scientific Reports | 6
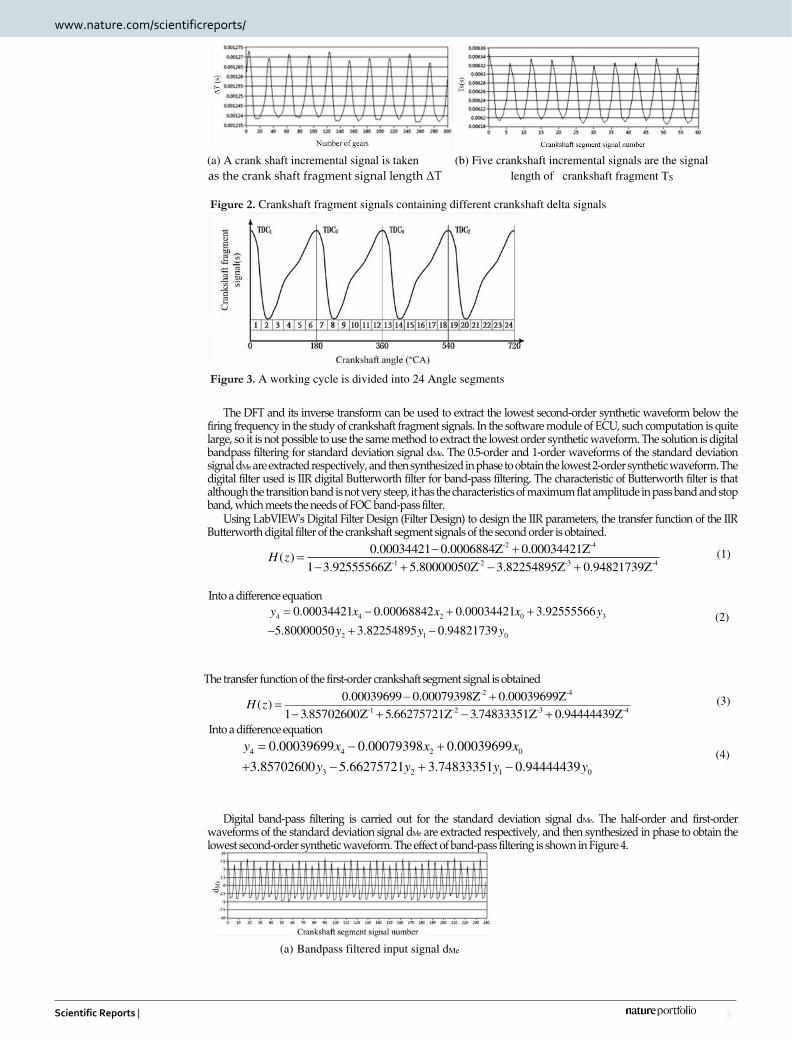
(b) Synthesized waveforms of 0.5 order and 1 order
Figure 8. Parameter extraction of crankshaft fragment signal waveform
According to Figure 8(a), the difference of fuel supply obtained from the lowest 2 order waveform analysis is completely consistent. The curve decline degree of the first cylinder is higher than that of the rise degree, indicating that the first cylinder accelerates more, decelerates less and supplies more fuel under the action of torque. The case of the fourth cylinder is obviously less acceleration, deceleration degree, this cylinder is the least amount of oil supply, is the main reason for the uneven work of each cylinder. FOC control calculation based on PI control principle. The fuel compensation control (FOC) is carried out by using PID control principle. The control goal of each cylinder is that the lowest Z/2 order synthetic waveform does not rise or fall, namely, the amplitude of the synthetic waveform of 0.5 order and 1 order components is 0. It is assumed that the oil quantity is controlled after each sampling, and the control
signal deviation at the angular position k is
0
2 2
( ) [ ( ) ( )]k Z k Ze T T (10)
Where 0 is the compression top dead center of cylinder I. 𝛥𝑇𝑍2(𝜑𝑘) is the amplitude of the lowest Z/2 order
synthetic waveform at the angular position0 , and 𝛥𝑇𝑍2(𝜑0) is the amplitude of the lowest Z/2 order synthetic
waveform at the angular position0 . According to the PID control principle, the total fuel supply is :
)]()([)()()( 1
0
kkD
k
j
jIkPk eeKeKeKu (11)
Where 𝐾𝑃 is proportional coefficient; 𝐾𝐼 is the integral coefficient; 𝐾𝐷 is the differential coefficient. Since the feedback control is carried out only once in each working cycle of the engine, there is no need for differential
control, so Equation 12 can be abbreviated as: 𝑢(𝑘) = 𝐾𝑃𝑒(𝑘) + 𝐾𝐼 ∑ 𝑒(𝑗)𝑘𝑗=0 (12) Where k is the sampling serial number, k = 0,1,2... 𝑢(𝑘) is the control value at the Kth sampling time; 𝑒(𝑘) is the input deviation at the Kth sampling time
The control output of Equation 13 is the total control quantity. To calculate the compensation oil quantity, the difference between two adjacent controls should be calculated:
)()]1()([
)()1()()(
)1()()(
1
00
keKkekeK
jeKkeKjeKkeK
kukuku
IP
k
j
IP
k
j
IP
(13) If there are m sampling points in the action range of a cylinder division, the sum of the control deviation for
the cylinder division is
m
k
IP
m
k
IP
m
k
FOC
keKemeK
keKkekeKkuQ
1
1
1
1
1
)()]0()1([
)()]1()([)(
(14) Where: 𝑄𝐹𝑂𝐶 is the compensation control oil quantity of FOC, and it is also the quantitative parameter of uneven cylinder division of the engine.
If sampling is carried out every 6°CA, there are 30 sampling points in the operating range of the whole cylinder, and the sum of the control deviation is
29
1
[ (29) (0)] ( )FOC P I
k
Q K e e K e k
(14)
Where: 𝑄𝐹𝑂𝐶 is the compensation control oil quantity of FOC, and it is also the quantitative parameter of unevencylinder division of the engine.
If sampling is carried out every 6°CA, there are 30 sampling points in the operating range of the whole cylinder, and the sum of the control deviation is
29
1
[ (29) (0)] ( )FOC P I
k
Q K e e K e k
(15)
Where: "K=29"means the last samplingpoint of the cylinder, and "k=1" means the second samplingpoint of the cylinder.

www.nature.com/scientificreports/
Scientific Reports | 7
Because 𝑄𝐹𝑂𝐶 is only the sum of the control deviation quantity, it does not represent the actual compensated fuel quantity in the end. The final compensated fuel quantity is the product of the integral value 𝑄𝐹𝑂𝐶 of the control deviation quantity and the weight value W of the fuel quantity.
The weight is divided into two types: oil weight Wq and speed weight Wn, and the final weight W is obtained by multiplying these two weights:
q nW W W (16)
Therefore, the final actual compensation oil value isQ=𝑄𝐹𝑂𝐶W (17)
Control strategy of sub-cylinder fuel Compensation based on working condition. The nonuniform operation of the engine is most obvious at low idle. Therefore, FOC for cylinder uniformity should be mainly applied to the engine at low idle speed. Considering the vehicle ride comfort, with the increase of rotational speed and load, the engine oil compensation control should be gradually weakened, rather than interrupted by sudden change. Therefore, the control area of FOC can be divided into three parts according to the current fuel injection volume and speed of the engine: closed-loop control area, open-loop control area and invalid area are shown in Figure 9.
Figure 9. Control areas are divided according to fuel injection volume and average speed
In the closed-loop control area, the system detects the nonuniformity of each cylinder and carries out PI integral to calculate the compensation oil amount of each cylinder, and also corrects the oil injection amount of each cylinder with the latest calculation results. In the closed-loop control area, the detection function of cylinder uniformity can be triggered only when the engine is in a stable condition.
In the open loop control area, there are eight sub-partitions, which can be grouped into two broad categories:the first type is that both speed and oil quantity are in the open loop zone, as shown in Figure. 10 (0x32, 0x33, 0x22 and 0x23). The second type is that only one of the speeds and oil quantity is in the open loop region, and the other is in the closed loop region.
The control mode of open loop control area is also divided into two kinds,In the first type of region, when the engine speed-oil quantity is in 0x32 region, the nearest point to the closed-loop region is point A, so its integral value Q_FOC is the integral value of point A. In the first type of region, when the engine speed-oil quantity is in 0x32 region, the nearest point to the closed-loop region is point A, so its integral value 𝑄𝐹𝑂𝐶 is the integral value of point A. Similarly, the integral values of points B, C and D will be used for the integral values of 0x33, 0x23 and 0x22 open loop regions. In the second type of region, when the engine's rotational speed-oil quantity is at point F, the point nearest to it in the closed loop region is point F ', so the integral value of point F is applied to the integral value of point F '. Similarly, E is the integral of E' prime.
Therefore, in the closed-loop control area, FOC should calculate the integral value 𝑄𝐹𝑂𝐶 , and the calculation process should be as short as possible to meet the real-time requirements of control. In the closed-loop control area, there is no need to calculate the weight W, that is, the weight corresponding to speed and oil quantity is set to 1. In the open-loop control region, FOC only needs to calculate the weight, not the integral value, and its integral value only needs to call the integral value of a point in the nearest closed-loop region, and this call process is very fast.
Oil weight Wq and speed weight Wn are calculated according to the characteristics of linear change, and the specific calculation formula is
cg
cg
c
gg
gc
cg
c
q
qqqqq
qqq
qqqqq
W
max_max_
max_max_
max_
max_min_
min_min_
min_min_
min_
1
(18)

www.nature.com/scientificreports/
Scientific Reports | 8
cg
cg
c
gg
gc
cg
c
n
nnnnn
nn
nnn
nnnnn
nn
W
max_max_
max_max_
max_
max_min_
min_min_
min_min_
min_
1
(19)
Where: q is the current oil quantity; n is the current average speed; 𝑞𝑚𝑖𝑛_ 𝑐 is the minimum oil quantity in the control state; 𝑞𝑚𝑖𝑛_ 𝑔 is the minimum oil quantity in the management state; 𝑞𝑚𝑎𝑥_ 𝑐 is the maximum oil yield in the control state; 𝑞𝑚𝑎𝑥_ 𝑔 is the maximum oil yield in the management state; 𝑛𝑚𝑖𝑛_ 𝑐 is a set point for FOC control of low idle speed; 𝑛𝑚𝑖𝑛_ 𝑔for FOC management low idle speed set point speed; 𝑛𝑚𝑎𝑥_ 𝑔 is the maximum speed of the management state; 𝑛𝑚𝑎𝑥_ 𝑐 is the maximum speed of the control state.
In the invalid working area, the system stop all functions of balancing the uniformity of the cylinders, that is, no testing or modification shall be carried out. The FOC will be frozen or its function will be closed if the engine fuel and speed are not in the range of speed-oil in the open and closed loops. The system will not carry out signal processing for crankshaft fragments that consumes computing resources.
Control strategy simulation experiment verification According to the quantified parameters of working uniformity of each cylinder, the balance control of working
uniformity of each cylinder is carried out. The basic idea of the control is to control FOC by oil compensation aiming at the torque balance of each cylinder. In the design, LabVIEW software was used for system design and parameter setting, and electronic control software was developed based on ASCET.
The FOC algorithm is shown in Figure10. The FOC control algorithm is divided into two parts: data preprocessing and controller.
Figure 10. Structure of working uniformity control algorithm
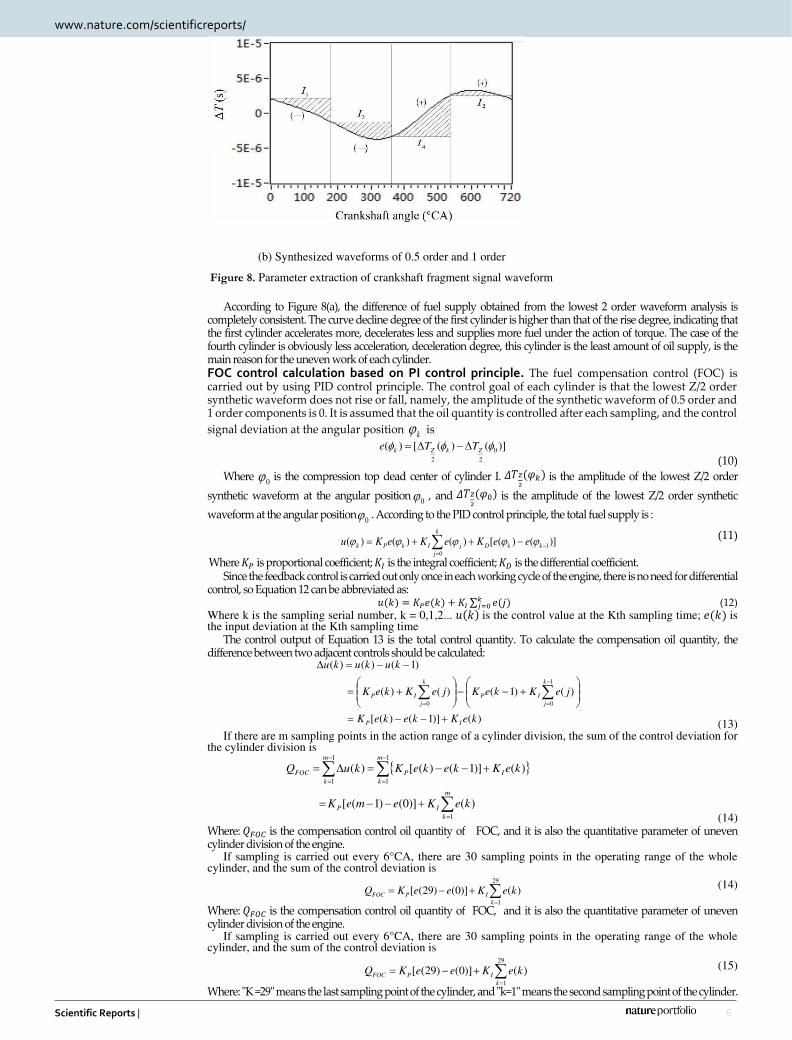
According to the quantization method of working nonuniformity and FOC control strategy, FOC electronic control software module was developed based on ASCET software. Simulation was carried out on the software platform, and the calculation results of fuel quantity compensation for diesel engine working unevenness under different working conditions were preliminally verified. Figure. 11 and 12 are the simulation experiment results at uniform working conditions.
(a) Deviation normalized signal dMe (b) spectrum
(c) The two bandpass filters are added d) Compensation fuel quantity
0.12
0.46
-0.3
-0.05
0 1 2 3 4
-0.3
0.0
0.3
Fu
el q
uan
tity(
mg)
Cylinder number
www.nature.com/scientificreports/
Scientific Reports | 9
Figure 11. Simulation results of uniform operation(800r/min、0N·m)
(a) Deviation normalized signal dMe (b) spectrum
(c) The two bandpass filters are added d) Compensation fuel quantity
Figure 12. Simulation results of uniform operation (1000r/min、40N·m)
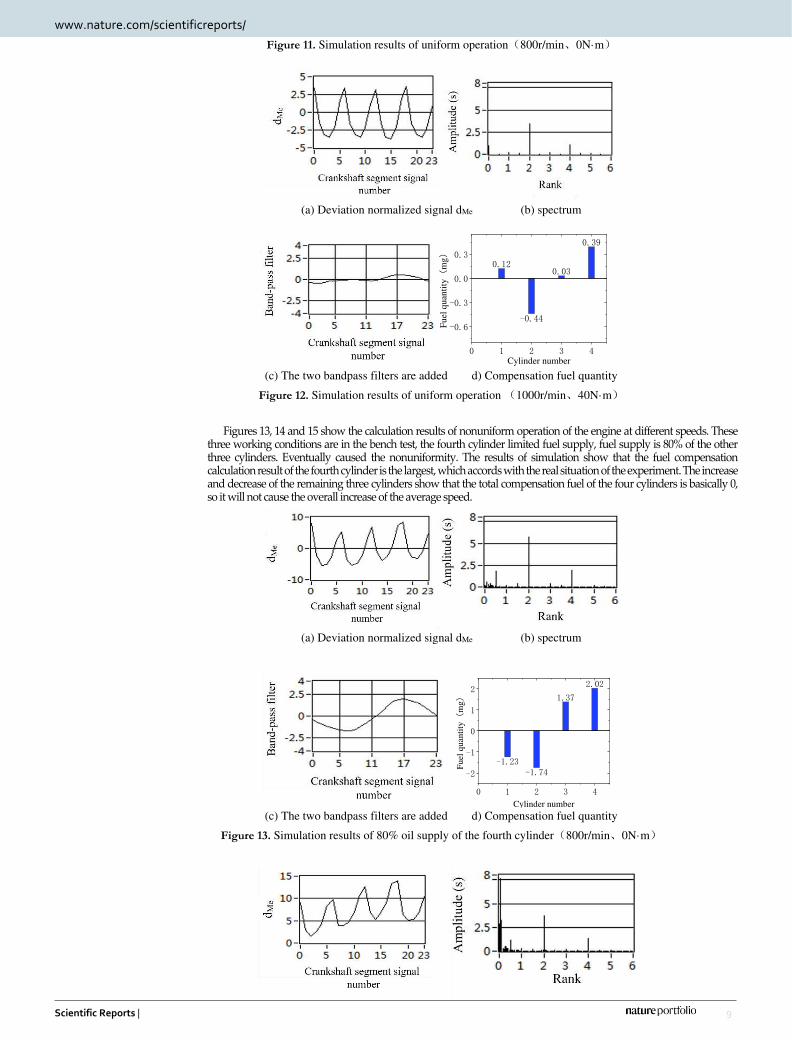
Figures 13, 14 and 15 show the calculation results of nonuniform operation of the engine at different speeds. These three working conditions are in the bench test, the fourth cylinder limited fuel supply, fuel supply is 80% of the other three cylinders. Eventually caused the nonuniformity. The results of simulation show that the fuel compensation calculation result of the fourth cylinder is the largest, which accords with the real situation of the experiment. The increase and decrease of the remaining three cylinders show that the total compensation fuel of the four cylinders is basically 0, so it will not cause the overall increase of the average speed.
(a) Deviation normalized signal dMe (b) spectrum
(c) The two bandpass filters are added d) Compensation fuel quantity
Figure 13. Simulation results of 80% oil supply of the fourth cylinder(800r/min、0N·m)
0.120.03
0.39
-0.44
0 1 2 3 4
-0.6
-0.3
0.0
0.3
Fuel
quan
tity(
mg)
Cylinder number
-1.23
1.37
2.02
-1.74
0 1 2 3 4
-2
-1
0
1
2
Fu
el q
uan
tity(
mg)
Cylinder number

www.nature.com/scientificreports/
Scientific Reports | 10
(a) Deviation normalized signal dMe (b) spectrum
(c) The two bandpass filters are added d) Compensation fuel quantity
Figure 14. Simulation results of 80% oil supply of the fourth cylinder(900r/min、0N·m)
(a) Deviation normalized signal dMe (b) spectrum
(c) The two bandpass filters are added d) Compensation fuel quantity
Figure 15. Simulation results of 80% oil supply for cylinder 4(1000r/min、0N·m)
The simulation calculation results are still accurate after the cylinder number is changed and the oil supply is restricted for the first, second or third cylinder respectively is shown in Figure. 16, 17 and 18. The maximum value of compensating fuel can always correspond to the specific cylinder set in the experiment test. This remains true after changing the engine load. he larger load of 40N-m at 800r/min speed, and the remaining two operating conditions are no load is shown in Figure 16
(a) Deviation normalized signal dMe (b) spectrum
-0.62
0.64
1.63
-1.27
1 2 3 4
-2
-1
0
1
2
Fuel
quan
tity(
mg)
Cylinder number
-0.53
0.77 0.79
-0.82
1 2 3 4-1.0
-0.5
0.0
0.5
1.0F
uel
qu
anti
ty(
mg)
Cylinder number

www.nature.com/scientificreports/
Scientific Reports | 11
(c) The two bandpass filters are added d) Compensation fuel quantity
Figure 16. Simulation results of 90% oil supply for the first cylinder(800r/min、40N·m)
(a) Deviation normalized signal dMe (b) spectrum
(c) The two bandpass filters are added d) Compensation fuel quantity
Figure 17. Simulation results of 90% oil supply for the second cylinder(800r/min、0N·m)
(a) Deviation normalized signal dMe (b) spectrum
(c) The two bandpass filters are added d) Compensation fuel quantity
Figure 18. Simulation results of 90% oil supply for cylinder 3(800r/min、0N·m)
1.76
-1.16
-0.08-0.05
0 1 2 3 4
-1
0
1
2
Fuel
quan
tity(
mg)
Cylinder number
-1.12
0.45 0.450.69
0 1 2 3 4
-1
0
1
Fuel
quan
tity(
mg)
Cylinder number
0.43 0.48
-1
0.4
0 1 2 3 4
-1
0
1
Fuel
quan
tity(
mg)
Cylinder number
www.nature.com/scientificreports/
Scientific Reports | 12
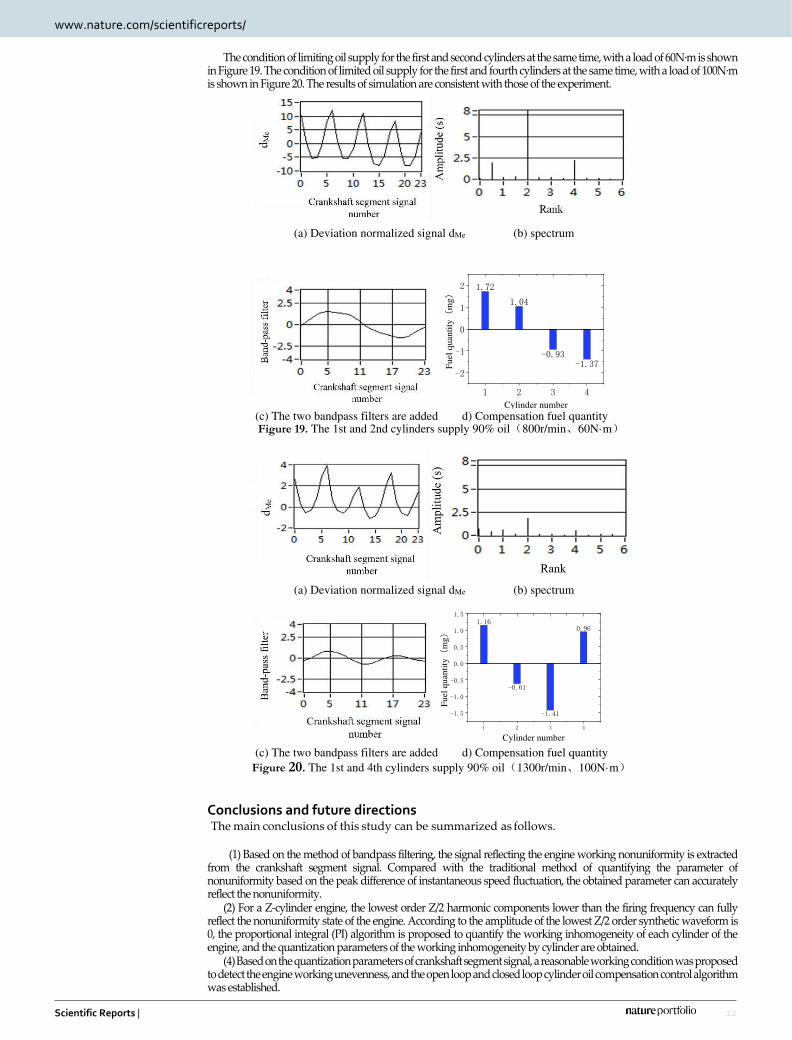
The condition of limiting oil supply for the first and second cylinders at the same time, with a load of 60N·m is shown in Figure 19. The condition of limited oil supply for the first and fourth cylinders at the same time, with a load of 100N·m is shown in Figure 20. The results of simulation are consistent with those of the experiment.
(a) Deviation normalized signal dMe (b) spectrum
(c) The two bandpass filters are added d) Compensation fuel quantityFigure 19. The 1st and 2nd cylinders supply 90% oil(800r/min、60N·m)
(a) Deviation normalized signal dMe (b) spectrum
(c) The two bandpass filters are added d) Compensation fuel quantity
Figure 20. The 1st and 4th cylinders supply 90% oil(1300r/min、100N·m)
Conclusions and future directions The main conclusions of this study can be summarized as follows.
(1) Based on the method of bandpass filtering, the signal reflecting the engine working nonuniformity is extracted from the crankshaft segment signal. Compared with the traditional method of quantifying the parameter of nonuniformity based on the peak difference of instantaneous speed fluctuation, the obtained parameter can accurately reflect the nonuniformity.
(2) For a Z-cylinder engine, the lowest order Z/2 harmonic components lower than the firing frequency can fully reflect the nonuniformity state of the engine. According to the amplitude of the lowest Z/2 order synthetic waveform is 0, the proportional integral (PI) algorithm is proposed to quantify the working inhomogeneity of each cylinder of the engine, and the quantization parameters of the working inhomogeneity by cylinder are obtained.
(4) Based on the quantization parameters of crankshaft segment signal, a reasonable working condition was proposed to detect the engine working unevenness, and the open loop and closed loop cylinder oil compensation control algorithm was established.
1.72
-0.93-1.37
1.04
1 2 3 4
-2
-1
0
1
2
Fu
el q
uan
tity(
mg)
Cylinder number
1.16
-1.41
0.96
-0.61
1 2 3 4
-1.5
-1.0
-0.5
0.0
0.5
1.0
1.5
Fuel
quan
tity(
mg)
Cylinder number

www.nature.com/scientificreports/
Scientific Reports | 13
(5) The simulation results show that the compensation fuel quantity calculated by FOC is consistent with the fuel supply state of each cylinder set by experiment,FOC algorithm based on crankshaft fragment signal is an effective oil compensation control method for engine working nonuniformity.
References
1. Wang,Z.,Wang,X.,Guo,S.,L,J.,Wang,Y.,Kong,M.,Shuai,S. (2020) Review and outlook of aftertreatment technologies to satisfy ultra-low emission regulations for heavy-duty diesel engines. Environmental Engineering 38, 159-167(2002).
2. Imtenan, S., Varman, M., Masjuki, H.H., Kalam, M.A., Sajjad, H. and Arbab, M.I. et al. Impact of low temperature combustion attaining strategies on diesel engine emissions for diesel and biodiesels. A review. Energy Conversion &Management 80, 329-356(2014). https://doi.org/10.1016/j.enconman.2014.01.020.
3. Venu, H., Subramani, L. and Raju, V.D. Emission reduction in a DI diesel engine using exhaust gas recirculation (EGR) of palm biodiesel blended with TiO2 nano additives. Renew. Energ. 140, 245-263 (2019). https://doi.org/10.1016/j.renene.
4. 2019.03.0785. Hazar, H., Tekdogan, R. and Sevinc, H. Investigating the effects of oxygen enrichment with modified zeolites on the
performance and emissions of a diesel engine through experimental and ANN approach. Fuel 303, 121318,(2021).https://doi.org/10.1016/j.fuel.2021.121318.
6. Tan,P.,Wang,D.,Lou,D., Wang,D.,Lou,D. and Hu,Z. (2018) Progress of control technologies on exhaust emissions for agricultural machinery.34(07):1-14. Transactions of the Chinese Society of Agricultural Engineering.(2018).
7. Song, M.L., Zheng, W.P. and Wang, Z.Y. Environmental efficiency and energy consumption of highway transportation systems in China. International journal of production economics. 181, 441-449(2016) https://doi.org/10.1016/j.ijpe.2015.09.030.
8. Ning, W., Zhao, L. and Bei, Z. Analysis of the Impact of China's Energy Consumption Structure on Energy Security. International conference on advances in energy, environment and chemical science (AEECS 2021).https://doi.org/10.1051/e3sconf/202124501054
9. Niklawy, W., Shahin, M., Amin, M.I. and Elmaihy, A. Modelling and experimental investigation of high – pressure common
rail diesel injection system. IOP Conference Series: Materials Science and Engineering 973, 12013-12037 (2020). 10. 9 Liu, D., Li, X., Shang, H., Xie, L., Chen, Y. and Chang, J. Combustion performance and fuel injection timing adaptability
of a lateral swirl combustion system for direct injection diesel engines. Fuel 296, 120663(2021).https://doi.org/10.1016/j.fuel.2021.120663
11. Huang,J., Xu,H., Sun,S., and Wang,D. Influence of fuel injection system's optimization on performance of diesel engine and its injection parameter re-optimization. Journal of Dalian Maritime University 43, 103-108(2017).
12. Karthic, S.V., Senthil Kumar, M., Nataraj, G. and Pradeep, P. An assessment on injection pressure and timing to reduce emissions on diesel engine powered by renewable fuel. J. Clean. Prod. 255, 120186(2020). https://doi.org/10.1016/j.jclepro.2020.120186
13. Bai, Y., Lan, Q., Fan, L.Y., Ma, X.Z. and Liu, H. Investigation on the fuel injection stability of high pressure common rail system for diesel engines. Int. J. Engine Res. 22, 616-631, (2021) https://doi.org/10.1177/1468087419856981.
14. Nikzadfar, K. and Shamekhi, A.H. More than one decade with development of common-rail diesel engine management systems: a literature review on modelling, control, estimation and calibration. P. I. Mech. Eng. 229, 1110-1142, (2015) https://doi.org/10.1177/0954407014556114.
15. Sun,H., Li,S. Sliding mode control method for diesel engine fuel quantity actuator with disturbance estimation. Control theory and application 035, 1568-1576(2018). https://doi.org/10.7641/CTA.2018.80346
16. Yan, F. and Wang, J. Common rail injection system iterative learning control based parameter calibration for accurate fuel injection quantity control. Int. J. Auto. Tech.-Kor. 12, 149-157(2011). https://doi.org/10.1007/s12239-011-0019-7
17. Han, X., Lin, X. and Li, D. (2017) A study on the control strategy for the transient fuel injection quantity in starting process of a light diesel engine. Automotive Engineering(2017) https://doi.org/10.19562/j.chinasae.qcgc.2017.01.004.
18. Liu, F.S., Hu, R., Li, Y.K., Yang, Z.M. and Xu, H.M. Effects of fuel temperature on injection performance of an EUP system.P. I. Mech. Eng. D-J. Aut. 233, 671-686, (2019) https://doi.org/10.1177/0954407017746280.
19. D. Szpica. Research on the influence of LPG\/CNG injector outlet nozzle diameter on uneven fuel dosage. Transport-Vilnius33, 1-11(2016) https://doi.org/10.3846/16484142.2016.1149884.
20. Hoang, A.T. Applicability of Fuel Injection Techniques for Modern Diesel Engines. Proceedings of the 2019 1st internationalconference on sustainable manufacturing, materials and technologies. Haldorai, A., Onn, C.C., Ramu, A. eds. 1st International Conference on Sustainable Manufacturing, Materials and Technologies (ICSMMT).
21. Liu,J.,Ma,B.,Jiang,Z. Probabilistic Diagnosis of Diesel Engine Misfire Based on the Noisy-Max Model and Vibration Signal from Adjacent and Opposite Cylinders. Transactions of Csice v.38;No.192, 84-92(2020)
22. Xu,X.,Zhang,N.,Yan,Y.and Qin,L. Intelligent Diagnosis Method of Diesel Engine based on Fast Online Support TensorMachine. Journal of mechanical 054, 30-37 (2018)
23. Jia,J.,Jia,J.,Jia,X.,Mei,J.,Zeng,R. and Zhang,S. Misfire Fault Diagnosis of Diesel Engine Based on Wavelet and Deep Belief Network. Automotive Engineering v.40;No.288, 838-843 (2018).
24. Zhang,K.,Tao,J., Qin,C. Diesel Engine Misfire Diagnosis with Deep Convolutional Neural Network Using Dropout and Batch Normalization. Journal of Xi'an Jiaotong University. 53(8)(2019)
25. Liu,J.,Gao,Z.,Zhang,P.,Song,Q. Diagnosis of Misfire Fault of Diesel Engines Based on Segment Angular Acceleration and Neural Network. Chinese Internal Combustion Engine Engineering.40(1) (2019 )
26. Chen, J. and Randall, R.B. Improved automated diagnosis of misfire in internal combustion engines based on simulationmodels. Mech. Syst. Signal Pr. 64, 58-83(2015) https://doi.org/10.1016j.ymssp.2015.02.027
27. Macian, V., Lujan, J.M., Guardiola, C. and Perles, A. A comparison of different methods for fuel delivery unevenness detection in Diesel engines. Mechanical Systems & Signal Processing 20, 2219-2231(2006)https://doi.org/10.1016/j.ymssp.2005.04.001.
28. Wang, Z., Fu, X., Wang, D., Xu, Y., Du, G. and You, J. A multilevel study on the influence of natural gas substitution rate on combustion mode and cyclic variation in a diesel/natural gas dual fuel engine. Fuel 294, 120499, (2021) https://doi.org/10.1016/j.fuel.2021.120499.
29. Song, Q.X., Gao, W.Z., Zhang, P., Liu, J.K. and Wei, Z.Q. Detection of engine misfire using characteristic harmonics of angular acceleration. P. I. Mech. Eng. D-J. Aut. 233, 3816-3823, (2019) https://doi.org/10.1177/0954407019834104.
30. Hmida, A., Hammami, A., Chaari, F., Ben Amar, M. and Haddar, M. Effects of misfire on the dynamic behavior of gasolineEngine Crankshafts. Eng. Fail. Anal. 121, (2021) https:// //doi.org/10.1016/j.engfailanal.2020.105149.
31. Liu, Z.W., Wu, K., Ding, Q. and Gu, J.X. Engine Misfire Diagnosis Based on the Torsional Vibration of the Flexible Coupling in a Diesel Generator Set: Simulation and Experiment. Journal of vibration engineering & technologies 8, 163-178, (2020) https:// //doi.org/10.1007/s42417-019-00097-1.

www.nature.com/scientificreports/
Scientific Reports | 14
32. Syta, A., Czarnigowski, J. and Jaklinski, P. Detection of cylinder misfire in an aircraft engine using linear and non-linear signal analysis. Measurement 174, (2021) https:// //doi.org/10.1016/j.measurement.2021.108982.
33. Wolff, S., Schapel, J.S. and King, R. Application of Artificial Neural Networks for Misfiring Detection in an Annular PulsedDetonation Combustor Mockup. J. Eng. Gas Turb. Power 139, (2017) https:// //doi.org/10.1115/1.4034941.
34. Zhi,X., Li, Z., Guo, C. and Hu et al. On-line indicated torque estimation for internal combustion engines using discrete observer. Computers and electrical engineering. 100-11 (2017) https://doi.org/10.1016/j.compeleceng.2017.01.002
35. Daniel, P.G. and Jiménez-Espadafor, F.J. Torsional system dynamics of low speed diesel engines based on instantaneous torque: Application to engine diagnosis. Mech. Syst. Signal Pr. 116, 858-878 (2019)https://doi.org/10.1016/j.ymssp.2018.06.051.
36. Yu,Y.,Chen,Y. Evaluation of the Health of Marine Diesel Engines Based on Instantaneous Angular Speed and MachineLearning. Chinese Internal Combustion Engine Engineering v.41;No.204, 107-112(2020).
37. Gu, L.C., Tian, Q.Q. and Ma, Z.W. Extraction of the instantaneous speed fluctuation based on normal time-frequency transform for hydraulic system. P. I. Mech. Eng. C-J. Mec. 234, 1196-1211, (2020) https://doi.org/10.1177/0954406219891187
38. Hu, Y., Zhou, R.P. and Yang, J.G. Research on the Fault Diagnosis Technology of Diesel Engine Based on the Instantaneous Speed. In: 8th International Conference on Damage Assessment of Structures (DAMAS 2009), 547-552.https://doi.org/10.4028/www.scientific.net/KEM.413-414.547
39. Popovic, S.J. and Tomic, M.V. (2014) Possibilities to identify engine combustion model parameters by analysis of the instantaneous crankshaft angular speed. Therm. Sci. 18, 97-112, https://doi.org/10.2298/TSCI120907006P
40. Macian, V., Lujan, J.M., Guardiola, C. and Perles, A. A comparison of different methods for fuel delivery unevenness detection in Diesel engines. Mech. Syst. Signal Pr. 20, 2219-2231, (2006) https://doi.org/ 10.1016/j.ymssp.2005.04.001.
41. Ali, S.A. and Saraswati, S. (2015) Reconstruction of cylinder pressure using crankshaft speed fluctuations. In: InternationalConference on Industrial Instrumentation & Control. (2015)
42. Ostman, F. and Toivonen, H.T. Adaptive Cylinder Balancing of Internal Combustion Engines. Ieee T. Contr. Syst. T. 19, 782-791(2011)
43. Jiang,S and Luo,Y An Analysis Method for Engine Ignition Waveform Based on Wavelet Threshold Denoising and Secondary Empirical Mode Decomposition. Automotive Engineering, 380-386 (2015)
44. Liu,S., Du,R. and Yang,S. Misfire Detection for Internal Combustion Engines by Speed Fluctuation Signals(3)--Method of Multiple Feature Integration. Transactions of csice, 63-66 (2000)
45. Macian, V., Lujan, J.M., Guardiola, C. and Yuste, P. DFT-based controller for fuel injection unevenness correction in turbocharged diesel engines. Ieee T. Contr. Syst. T. 14, 819-827(2006)
46. Zhang, Z. and Yang, G. Interval observer-based fault detection in finite frequency domain for discrete-time fuzzy systems. Neurocomputing 310, 38-45,(2018) https://doi.org/10.1016/j.neucom.2018.05.020
47. Pei, S.C., Yeh, M.H. and Luo, T.L. Fractional Fourier series expansion for finite signals and dual extension to discrete-time fractional Fourier transform. Ieee T. Signal Proces. 47, 2883-2888, (1999) https://doi.org/10.1109/78.790671.
48. Yin, J.H., De Pierro, A.R. and Wei, M.S. Reconstruction of a compactly supported function from the discrete sampling of its Fourier transform. Ieee T. Signal Proces. 47, 3356-3364, (1999)10.1109/78.806079
49. Niu, Q.Y., Fan, C., Wang, X.C., Zhao, Y.W. and Dong, Y.C. Research on the Parameter Calibration of the Internal-combustion Engine Work Process Simulation Model. In: advanced design technology, PTS 1-3. Gao, J. ed. International Conference on Advanced Design and Manufacturing Engineering (ADME 2011), 953.
50. Wang, Y.W., Dong, D.W. and Yan, B. Influence Mechanism and Law of Sensor Working Clearance on Instantaneous Engine Speed Measurements. Transactions of CSICE 32, 466-473(2014)
51. Wen, C., Meng, X., Xie, Y., Liu, R. and Fang, C. (2021) Online measurement of piston-assembly friction with wireless IMEP method under fired conditions and comparison with numerical analysis. Measurement 174(2021)
52. Charchalis, A. and Dereszewski, M. Monitoring of instantaneous angular speed of the crankshaft for control of the ship engine performance changes. Diagnostyka 4, 53-58(2011)
53. Wang, Y., Wang, G., Yao, G. and Shen, L. Research on the Characteristics of Operating Non-Uniformity of a High-Pressure Common-Rail Diesel Engine Based on Crankshaft Segment Signals. IEEE Access PP(99), 1(2021)https://doi.org/10.1109/ACCESS.2021.3075963.
Acknowledgements This work was supported by the National Natural Science Foundation of China with the Program 52066008. In addition, we would like to thank all the colleagues and anonymous reviewers who helped to improve the paper. Author contributions. Y.W, G.W. wrote the main manuscript text, G.W, G.Y. ,S.H., and L.S. prepared figures all authors reviewed the
manuscript.
Competing interests The authors declare no competing interests.
Additional information Correspondence and requests for materials should be addressed to G.W
Reprints and permissions information is available at www.nature.com/reprints.
Publisher’s note Springer Nature remains neutral with regard to jurisdictional claims in published maps and institutional affiliations.
Open Access This article is licensed under a Creative Commons Attribution 4.0 International License, which permits use, sharing, adaptation, distribution and reproduction in any medium or
format, as long as you give appropriate credit to the original author(s) and the source, provide a link to the Creative Commons licence, and indicate if changes were made. The images or other third party material in this article are included in the article’s Creative Commons licence, unless indicated otherwise in a credit line to the material. If material is not included in the article’s Creative Commons licence and your intended use is not permitted by statutory regulation or exceeds the permitted use, you will need to obtain permission directly from the copyright holder. To view a copy of this licence, visit http://creativecommons.org/licenses/by/4.0/.
© The Author(s) 2021

Supplementary Files
This is a list of supplementary �les associated with this preprint. Click to download.
0orderDFTspectrumamplitudeofeachspeed.xlsx
Cylinder4airreductionNoloadSpectrumamplitudeofeachspeed.xlsx
Cylinderpressurespectrumanalysis1400rpmexternalcharacteristics.xlsx
Oilcutoffofcylinder4NoloadSpectrumamplitudeofeachorderateachspeed.xlsx
Uniformwork800DFTspectrumamplitudeofeachload.xlsx
UniformworkNoloadDFTspectrumamplitudeateachspeed.xlsx