
Research on Corporate Hedging Theories: A Critical Review ...
56
Working paper 05-04 June 2005 Research on Corporate Hedging Theories: A Critical Review of the Evidence to Date Thouraya Triki ∗ *Department of Finance and Canada Research Chair in Risk Management, HEC Montreal First Draft (April 21 st , 2005, this draft, May 20 th , 2005) ABSTRACT This paper provides a critical review of three common problems facing researchers when implementing tests of corporate hedging theories: (1) how to identify hedgers in the population considered? (2) how to measure corporate hedging and finally, (3) what possible determinants should be considered in the test and, how to measure them? We identify the most popular approaches in the literature to tackle these issues and show that each approach offers its advantages but has also its own limits. More importantly, we show that the different variables used to measure corporate hedging rationales could proxy for more than one argument at a time. Accordingly, results drawn from the tests should be interpreted with caution. Considering the additional arguments developed recently to justify corporate hedging, and the greater availability of data on such activity, we argue that the need for cleaner proxies in the risk management literature is more important than ever. Keywords: Corporate hedging theories, tests, hedger identification, measures of corporate hedging, determinants of corporate hedging. JEL classification: G 18, G 30. ∗ I am very grateful to my supervisor, Georges Dionne, and to Narjess Boubakri for their helpful comments and suggestions. Please send all correspondence to: HEC Montréal, Canada Research Chair in Risk Management, 3000, Chemin de la Côte-Sainte-Catherine, Montreal, Quebec, Canada, H3T 2A7 (Fax): +514 340-5019 (E-Mail): [email protected] 1
Transcript of Research on Corporate Hedging Theories: A Critical Review ...

Working paper 05-04 June 2005
Research on Corporate Hedging Theories: A Critical Review of the Evidence to Date
Thouraya Triki∗*Department of Finance and Canada Research Chair in Risk Management, HEC Montreal
First Draft (April 21st, 2005, this draft, May 20th, 2005)
ABSTRACT
This paper provides a critical review of three common problems facing researchers when implementing
tests of corporate hedging theories: (1) how to identify hedgers in the population considered? (2) how
to measure corporate hedging and finally, (3) what possible determinants should be considered in the
test and, how to measure them? We identify the most popular approaches in the literature to tackle
these issues and show that each approach offers its advantages but has also its own limits. More
importantly, we show that the different variables used to measure corporate hedging rationales could
proxy for more than one argument at a time. Accordingly, results drawn from the tests should be
interpreted with caution. Considering the additional arguments developed recently to justify corporate
hedging, and the greater availability of data on such activity, we argue that the need for cleaner proxies
in the risk management literature is more important than ever.
Keywords: Corporate hedging theories, tests, hedger identification, measures of corporate hedging, determinants of corporate hedging. JEL classification: G 18, G 30.
∗I am very grateful to my supervisor, Georges Dionne, and to Narjess Boubakri for their helpful comments and suggestions. Please send all correspondence to: HEC Montréal, Canada Research Chair in Risk Management, 3000, Chemin de la Côte-Sainte-Catherine, Montreal, Quebec, Canada, H3T 2A7 (Fax): +514 340-5019 (E-Mail): [email protected]
1

Introduction The last two decades have witnessed a dramatic increase in the number of research studies seeking to
explain why firms hedge. This literature mainly focused on non-financial firms because the financial
ones are considered as users and providers of hedging instruments and consequently could have
different factors affecting their risk management strategies. On the theoretical side, several arguments
have been put forward to explain why corporate risk management activities are value-enhancing. These
explanations rely mainly on the introduction of some frictions to the Modigliani and Miller (1958)
framework1. The predicted power of these theories was tested in numerous papers but, unfortunately,
there is not yet a unique, well accepted framework that practitioners can rely on when setting their risk
management strategies. It should be mentioned that empirical examination of hedging theories has been
hindered by the lack of quality data on corporate hedging in widely used databases and publicly
available documents. Fortunately, this situation is improving, largely because of the mandatory
disclosure of information on risk management in annual reports and other financial statements amended
by the new regulation. However despite this improvement in data availability, information on corporate
hedging is still harder to get than other financial data.
When conducting a test of corporate hedging theories, one should realize that having data on risk
management operations does not eliminate all the problems associated with the implementation of the
test. Indeed, additional issues have to be solved in order to get things done. Technically speaking the
following three questions must be answered: (1) how to identify hedgers in the population considered?
(2) how to measure corporate hedging and finally, (3) what possible determinants should be considered
in the test and, how to measure them? Of course, the plethora of papers that investigated risk
management determinants provided their own answers to these questions and sometimes more than
one.
The objective of this paper is to review the different solutions provided during the last two decades in
the risk management literature to the questions above mentioned. We think that, by reviewing previous
work on this topic, we can improve the quality of future tests on risk management determinants. In the
present context, these tests are important for two main reasons. First, the number of firms hedging their
risks is constantly increasing. Indeed, according, to the 1998 Wharton survey of financial risk
management by US non-financial firms conducted by Bodnar et al. (1998), more than 50% of
2

respondent firms used derivatives in 1998 compared to 41% in 1995 and 35% in 1994. We think that it
is time to understand why firms are so attracted by corporate hedging especially that, better quality
data, needed for the tests is more available. Second, new rules regulating risk management were
recently introduced2 and we expect additional regulation on this activity in the near future. Recall that
risk management affects considerably the firm’s performance and consists usually in off-balance sheet
operations which could be more easily manipulated by managers. Accordingly, it is probable that new
requirements on the disclosure and the setting of risk management operations will be introduced in
order to avoid financial scandals and abuses. A better understanding of the factors affecting corporate
hedging will help provide an adequate regulation for this activity. Our goal in this paper is to provide
researchers with a reference that shows the advantages and drawbacks of previous approaches in order
to help them avoid some pitfalls associated with the implementation of corporate hedging theories tests.
We draw two main conclusions from our review of the literature on risk management determinants.
First, there is still a lot of work to do in order to improve measures of corporate hedging as well as
variables proxying the rationales for corporate risk management. Several variables presently used in the
tests proxy for more than one argument. This complicates the interpretation of the results and makes
tests less powerful. Also, recently, new explanations for corporate hedging, based on internal corporate
governance mechanisms and country-specific characteristics, were offered in the literature. Thus, in
addition to the traditional theories for which proxies should be improved, we have to define new
proxies for these arguments. Therefore, the need for cleaner proxies in the risk management literature is
more important than ever.
Second, there is a lot of confusion surrounding the interpretation of results reported in tests of risk
management determinants. In the introduction of almost every paper we read, there was a reference to
the little consensus regarding the validity of corporate hedging theories and the mixed empirical results
reported by tests of these theories. We think it is important to remember, when comparing results from
these papers, that often these tests are not investigating identical empirical questions. Using
discrepancies in results between a paper that investigates the determinants of the decision to hedge and
another paper that investigates the determinants of the hedging ratio to invalidate risk management
theories is incorrect. Such behaviour does not recognize that these two corporate decisions might have
1 See for example the seminal articles of Stulz (1984), Smith and Stulz (1985), Stulz (1990), DeMarzo and Duffie (1991; 1995), Breeden and Viswanathan (1998), Froot, Scharfstein and Stein (1993) and Morellec and Smith (2002). 2 Refer to section 303A.07 (D) of the final NYSE corporate governance rules available in the NYSE’s listed company manual.
3

different factors affecting them. Several papers provide support for this argument: Mardsen and Prevost
(2005) for all risks, Haushalter (2000) for commodity risk and Allayannis and Ofek (2001) for currency
risk. Also, one should remember that all the tests of corporate hedging theories do not consider the
same type of risk. It is possible that risk management of foreign exchange risk (FX hereafter) is
determined by factors different from the ones affecting risk management of interest rate risk (IR
hereafter) or commodity risk (CR hereafter). Howton and Perfect (1998), Bartram, et al. (2004) and
Nguyen and Faff (2003) provide support for this argument. Accordingly, results should be compared
only if they concern the same decision and risk type.
Finally, one intriguing fact that hits us when reviewing papers that tested empirically corporate hedging
theories during the 1985-2005 period is the lack of recent datasets in the tests. Over the twenty papers
written between 2000 and 2005, only two papers [Nguyen and Faff, 2003; Bartram et al., 2004] use
data concerning year 2000 and beyond. This fact is surprising because data became more available and
richer during these previous years thanks to the disclosure requirements set by regulators. We think it is
interesting to test corporate hedging theories with more recent datasets in order to verify the stability in
time of risk management determinants.
The remainder of the paper is structured as follows. Section I reviews the different approaches used in
the literature to identify hedgers. In section II we describe the most popular measures for corporate
hedging. Section III contains the different arguments proposed in the literature to explain why firms
hedge as well as the most common variables proxying these rationales. Section IV concludes the paper.
I. How to identify hedgers?
A major issue when implementing a test of risk management determinants is how to identify “hedgers”
in the population considered. Basically, three main approaches were explored in the literature: direct
surveys, keyword search of public documents and private datasets.
(Insert Table I here)
A. The survey approach
In the absence of information about risk management activities, earlier papers conducted surveys to
identify hedgers. The most commonly asked question in these surveys is whether the firm uses
4

derivatives instruments during a given period3 [Block and Gallagher, 1986; Nance, Smith and
Smithson, 1993; Jalilvand, 1999; Bodnar, Jon and Macrae, 2003]. Surveys usually provide rich data
that is sometimes impossible to get by other means. For example the researcher can ask questions about
the motivations behind the risk management operations in the firm. Also, if the researcher has a
privileged contact within the firms surveyed or sends the questionnaire through official organizations,
things can go pretty fast.
Unfortunately, results reported with this approach probably suffer from the non-response bias typical of
survey samples. Indeed, hedgers may have greater incentive to respond to these surveys than non-
hedgers. Consequently, there is no guarantee that the sample of respondents companies reflects
properly the characteristics of the considered population. This problem is very important mainly when
the tests results are needed for legislation purposes. Haulshalter (2000) shows that the non-respondent
firms in his survey have fewer assets than the firms that made it to his sample. This finding confirms
the existence of a sampling bias in survey data. Furthermore, answers to risk management surveys are
usually provided by the firm’s CEO, CFO or treasurer, which make them affected by their perception
of the firm. It is important to remember also that, in most cases, there is no way to verify the reliability
of the answers provided by the survey.
B. The keyword search approach
“Hedgers” could also be identified by searching the firm’s financial documents (annual and quarterly
reports…) for keywords like risk management, hedging, derivatives, options, futures, swap…etc. As
Table I shows, this approach is used by 42% of the papers we reviewed. The annual reports can be
searched on the SEC website for companies listed in US exchanges and SEDAR website for Canadian
public companies. They are also available on the NAARS files available on Lexis-Nexis [Mian, 1996],
Disclosure database [Dolde and Mishra, 2002] as well as data provided by Thompson Research [Lel,
2004]. The keyword search approach became popular recently thanks to the availability of richer data
on risk management activity in the firms’ annual reports.
However, a potential problem related to this method is that it may underestimate the number of
hedgers. Indeed, firms that hedge their risks but do not disclose this information in their public
3 Haushalter (2000) also conduct a survey in which he asks the respondents to provide the proportion of their production being hedged.
5

documents will be classified as non-hedgers. This will add noise to the results. Also, this approach is
time consuming when the sample size is large.
In the United States, the increase in data availability is encouraged by the FASB disclosure
requirements. The first step toward more transparency about firms’ derivative usage was provided by
SFAS 105, Disclosure of Information about Financial Instruments with Off-Balance-Sheet Risk and
Financial Instruments with Concentrations of Credit Risk. SFAS 105 required firms to disclose
information about financial instruments, not just derivatives, which create off-balance risk as well as
credit risk from financial transactions for fiscal years starting after June 15th, 1990. Among others,
firms are required to report information about the face, contract, or notional amount of these
instruments as well as information about their credit and market risk. Firms are not however required to
disclose information concerning the direction of the hedge. SFAS 107, disclosures about Fair Value of
Financial Instruments, issued in late 1991, put additional disclosure requirements about the fair value
of financial instruments in the statement of financial position, for which it is practicable to estimate fair
value. SFAS 107 was effective for fiscal years ending after December 15, 1992 except for firms whose
total assets is less than 150 Millions $, for whom the requirement is effective for fiscal years ending
after December 15, 1995. In 1994, the FASB issued SFAS 119, Disclosure about Derivative Financial
Instruments and Fair Value of Financial Instruments, which improved considerably the quality of data
on corporate hedging available in annual reports. This statement requires firms to disclose information
about amounts, nature, and terms of their derivatives instruments that are not subject to Statement 105
because they do not result in off-balance risk. SFAS 119 also requires firms to disclose whether the
instruments are held for hedging or for other purposes. More importantly, it requires firms to
disaggregate information about their financial instruments with off-balance risk by class, business
activity, risk, or other category that is consistent with their management of those instruments. SFAS
119 was effective for fiscal years ending after December 15, 1994, except for firms with less than $150
million in total assets. These firms must comply with SFAS 119 for fiscal years ending after December
15, 1995.
C. The private dataset approach
The third approach proposed in the literature to identify “hedgers” consists in using already collected
information about risk management activities. Commonly, the firms mentioned in the datasource are
identified as hedgers. Two possible alternatives were explored in previous research. The first
alternative consists in getting data from investment companies, brokers or analysts who compiled
6
information about corporate hedging for their own interests. As Table I shows, Tufano (1996), Dionne
and Garand (2003), Dionne and Triki (2004, 2005), and Brown, Crabb and Haushalter (2003) work
with detailed data relative to a sample of gold mining firms that was collected by a Canadian analyst
called Ted Reeve. Mr. Reeve compiled, between 1991 and 1999, the data when he used to cover
precious metals firms for Scotia Capital. Like in the survey case, there is no way to verify the reliability
of the data but the fact that it was collected by a person who has insider information gives it credibility.
The second alternative explored in this approach consists in using paying databases such as the
“Database of users of derivatives” [Gay and Nam, 1998; Lin and Smith, 2003; Knopf, Nam and
Thornton, 2002; DaDalt, Gay and Nam, 2002], the “Handbook of users of off-balance sheet
instruments” [Fok, Carroll and Chiou, 1997]4 or the “Corporate Risk Management Handbook”
[Borokhovich et al., 2004]. The first two publications are offered by Swaps Monitor Publications and
provide, among others, information about the notional amounts and market values of interest rate,
currency and commodity derivatives. The Interest rate and currency edition of these databases covers
3400 companies (including 1698 corporations) while the commodity edition covers 550 companies
(including 457 corporations). The advantage of the database version is that it provides the notional
values by instrument type and by category. It also assigns a “-1” code to hedgers for whom the notional
amount is unavailable. This codification should reduce errors when discriminating between hedgers
and non hedgers. Unfortunately, Swaps Monitor Publications ceased to provide these products in 1997
which will limit the sampling period for someone who wants to work with these datasources. Also, data
available in these databases concerns only American companies. The “Corporate Risk Management
Handbook” provides details, for S&P 500 companies, on the notional amounts of each type of
derivatives5. There is however two limits associated with this source. First, the handbook is no longer
produced. The company, Risk, only published it for 2 years which limits considerably the sample size
and sampling period. Second, it provides data for only large companies included in the S&P 500. This
will probably lead to a size bias in the results.
A couple of remarks are noteworthy here. First, when discriminating between the hedgers and non-
hedgers groups, attention should be given to the ex-ante exposure of the firms. Only firms with
exposure to risk that decide to hedge (or not to hedge) should be included in the sample. This control
should eliminate noise in the results because it excludes from the analysis firms that might have the 4 These databases were provided by Swaps Monitor Publications. The database of users was supplied as excel files. The Handbook of users contained the same information but was published as a book. 5 We are very grateful to Betty Simkins for information concerning this datasource.
7

incentive to hedge but do not do it since they have no ex-ante exposure. Géczy, Minton and Schrand
(1997) control for FX exposure by considering in their sample only firms that report pre-tax foreign
income, foreign sales, foreign denominated debt or non-zero foreign tax expense. Graham and Rogers
(2002) and Rogers (2002) also control for ex-ante exposure to FX and IR risks by using similar
variables. Second, when identifying hedgers, one should make sure that the firms included in the
“hedgers” group are actually reducing their risk and not speculating. This could be achieved by reading
the documents where the keyword is found and make sure that the firm mentions that it is using the
derivatives in order to hedge its exposure and not for trading purposes. Fortunately, SFAS 119 requires
companies to disclose such information which should facilitate this task (this requirement applies
however only for fiscal years ending after December 1995). Of course, the check is harder when
hedgers are identified through a survey because managers might be reluctant to admit that they employ
derivatives to speculate rather than reduce the firm’s risk.
II. How to measure corporate hedging?
Providing an adequate measure for corporate hedging is an essential ingredient in a successful test of
risk management theories. Several alternatives were proposed in the literature but four of them are the
most popular: the dummy variable indicating derivatives usage (discrete measure), the gross notional
value of derivatives contracts, the net notional value of derivatives contracts and finally the delta
percentage (continuous measures). As Table II shows, it is common in this literature to use more than
one measure of corporate hedging to conduct the tests. Indeed, almost 30% of the papers reviewed use
more than a single variable to measure the extent of risk management in the firm.
(Insert Table II here)
A. Discrete measures of corporate hedging
The most common approach to measure corporate hedging consists in a dummy variable indicating
whether the firm uses derivatives. Fourteen of the papers reviewed between 1985 and 2005 have
recourse to this variable: eight papers use it alone, and six papers use it in combination with other
measure(s). Several versions of the dummy variable were introduced in previous studies. For example,
Nance, Smith and Smithson (1993), Fok, Carroll and Chiou (1997) and Jalilvand (1999) define
derivatives usage as the holding of any type of derivatives; Géczy, Minton and Schrand (1997) define
derivatives users as firms employing FX derivatives and Whidbee and Wohar (1999) restrict
derivatives usage to FX or IR derivatives.
8

A dummy variable is a very appealing measure for corporate risk management activities because it is
very simple to construct, but it has two major limits. First, it does not provide quantitative information
about the hedging level in the firm. Consequently, a firm hedging 5% of its exposure will make up the
population of hedgers just the same as a firm that fully hedges. This should make the distinction
between hedgers and non hedgers more difficult since a firm that hedges 5% of its exposure is more
likely to have characteristics similar to a non-hedger than to a firm that is practicing full hedging
[Judge, 2003]. Second, the dummy variable approach supposes that derivatives usage is a synonym of
risk management which is not always true. Firms can manage their risks not only with derivatives, but
also through operational and financing transactions. For example a firm can decide to reduce its FX
risk by reducing the number of factories it holds abroad and replacing them by local facilities. A natural
consequence of equating hedging with derivatives usage is to underestimate the number of non-hedgers
because every firm that is managing its risks by any tool other than derivatives is identified as a non-
hedger. According to Judge (2003), one solution to alleviate this problem is to introduce variables that
indicate the existence of other risk management strategies but this way of doing still does not solve the
problem for naturally hedged companies because there will be no indication of hedging activities.
Another limit that makes the dummy variable approach controversial is that the latter captures
information only about the decision to hedge. It is not guaranteed that arguments explaining such
decision are also significant explanations of the hedging extent. As mentioned earlier, Haushalter
(2000), Allayannis and Ofek (2001) and Mardsen and Prevost (2005), among others, showed
substantial differences between the determinants of the decision to hedge and determinants of the hedge
ratio.
Furthermore, recall that derivatives usage is not always a synonym of risk reduction. In some cases,
managers hold positions on derivatives, under the guise of hedging, in order to outperform the market
in case their expectations are realized. In a similar situation derivatives usage could increase the firm’s
risk instead of reducing it.
B. Continuous measures of corporate hedging
More recent papers propose the gross notional value of derivatives contract held for non-trading
purposes (scaled by the firm’s size) as a measure for corporate hedging. Interestingly, Table II shows
that this variable is considered alone in only three of the ten papers that used it. Earlier papers combine
it with the fair value of the derivatives contracts held [Berkman and Bradbury, 1996; Howton and
9

Perfect, 1998] while more recent papers combine it with a dummy variable indicating derivatives usage
[Allayannis and Ofek, 2001; Dolde and Mishra, 2002; Nguyen and Faff, 2003; Lel, 2004].
The gross notional value has several advantages over the dummy variable. Most importantly, it
provides quantitative information about the level of risk management. This makes tests of hypotheses
on the determinants of the amount of corporate hedging possible. However, the gross notional value
might overestimate the risk management activities in the firm when the latter holds offsetting contracts.
Indeed, to calculate this variable we sum up the different notional values of derivatives contracts held
by the firm regardless of the position taken (short or long). Allayannis and Ofek (2001) point out an
additional problem in the gross notional value when measuring corporate hedging of the FX risk. They
highlight that firms do not report derivatives holdings by individual currency and seem first to net
positions on these currencies before aggregating them. Such aggregation will introduce a measurement
error in the data.
In order to avoid the problems associated with the gross notional value, Graham and Rogers (2002) and
Rogers (2002) propose the absolute value of the net position held by the firm on derivative contracts
for non-trading purposes (scaled by the firm’s size) as a measure for corporate hedging. This variable
should provide a cleaner measure of the risk management activities compared to the dummy and the
gross notional value variables. However, Judge (2003) argue that, unless the firm size is a good proxy
of the firm’s exposure to the risk studied, it is not clear whether this variable provides an appropriate
measure of the extent of corporate hedging undertaken (this argument is true also for the gross notional
value variable when it is scaled by a measure of the firm’s size). Additionally, the net notional value of
derivatives does not distinguish between the different derivatives contracts. This may lead us to
conclude that a firm having a $90 millions long position in options and a $50 millions short position in
futures-a net position of $40 millions- is having the same risk management strategy than a firm having
a long position of $40 millions only in the forward markets. A risk management strategy implies
decisions concerning both the amount of risk to hedge and the instruments employed to hedge, and the
net position gives no information about the second point. It is worth noting that the dummy variable
and the gross notional value also suffer from this limit. Furthermore, the two papers that used the net
notional value to measure corporate hedging [Rogers, 2002; Graham and Rogers, 2002] sum up net
values from different risks (IR risk and FX risk). By doing so, they suppose that the risk management
of these two risks are affected by the same factors which has been shown not to be the case [Mardsen
and Prevost, 2005; Haushalter, 2000; Allayannis and Ofek, 2001]. Finally, despite the fact that they
provide quantitative information about the level of risk management in the firm, the gross and net
10

notional value variables consider only transactions on derivatives when evaluating the extent of
corporate hedging. This will lead to the same problems discussed earlier for the dummy variable when
equating risk management with derivatives usage.
The fourth approach proposed in the literature to measure risk management activities is the delta
percentage. The delta percentage is defined as the delta of the risk management portfolio held by the
firm divided by its expected production and provides a continuous measure of corporate hedging. The
delta percentage was first introduced by Tufano (1996) and more recently used by Dionne and Garand
(2003) and Dionne and Triki (2004, 2005)6. Unlike the previously mentioned variables, the delta
percentage intervenes in its calculation information relative both to the level of hedging and to the
instruments selected to hedge. More importantly, it recognizes that risk can be managed not only
through derivatives transactions but also through financing operations.
Unfortunately the delta percentage is not perfect and presents some problems that limit its attraction.
First, its calculation requires very detailed data concerning the derivatives transactions and financing
operations realized by the firm. These details are hardly obtainable from publicly available sources.
Thus, its usage remains limited to the gold mining industry for which such detailed data is available.
Consequently, until now, the delta percentage provided industry specific results. As pointed out by
Géczy, Minton and Schrand (1997, p 1325) “by construction, industry specific studies diminish cross-
sectional variation in the firm’s exposures, but they do so at the expense of cross-sectional variation in
the potential incentives to hedge”. Furthermore, even for the gold mining industry where Ted Reeve
compiled the data required for the calculation of the delta percentage, the sampling period must end in
1999 because Mr. Reeve stopped conducting his surveys after this date.
An additional limit of the delta percentage concerns the scaling variable in its calculation, i.e. the
expected production of gold. This variable is appropriate for scaling only if the production level in a
given period is very similar to the firm’s gold sales because, technically, it is the amount of gold sold
and not the amount produced that is exposed to price fluctuations [Judge, 2003]. Finally, recall that for
a given date, the delta percentage is calculated without any consideration for the hedging operations
happening beyond a three years window because projected production after this point is generally not
available. Such practice should underestimate the level of risk management activities in the firm.
6 Brown, Crabb and Haushalter (2003) use the changes in the value of the delta percentage as a dependent variable because they are interested in explaining variation in the hedging ratio.
11

Few other measures for corporate hedging were proposed in the literature but their popularity remains
limited. In addition to the gross notional value, Berkman and Bradbury (1996), Howton and Perfect
(1998) and Mardsen and Prevost (2005) use, for example, the fair value of the derivatives contracts
held by the firm scaled by its market value7. The fair value is defined as the absolute value of the net
gain or loss on all the derivatives contracts held by the firm. This measure is potentially noisy because
it is affected by the movement of the risk variable being hedged and the time elapsed since the
inception of the contracts used to hedge. Indeed, if the time elapsed and/or the movement of the risk
variable being hedge are insignificant, the fair value of the contract could be small even if the firm
hedges extensively its risks. Furthermore, the fair value suffers from the problems arising when
equating risk management with derivatives usage discussed earlier.
Overall, each of the four measures mentioned in this section has its advantages but also its own limit
which means that none of them is perfect. Usually, it is the data availability that conditions the usage of
one or the other of these variables to measure corporate hedging.
III. What factors affect corporate hedging and how to measure them?
Several explanations were proposed as motives for corporate hedging. Some of them are backed by
theoretical models while the introduction of others is encouraged simply by common sense. The most
cited arguments justifying corporate hedging are the reduction of the financial distress costs, the tax
liability, the underinvestment costs as well as the satisfaction of managerial risk aversion. Recently,
explanations based on corporate governance and macro economic characteristics were introduced. In
the following we will describe the most popular arguments included in tests of risk management
theories as well as the variables proxying them. Particularly, we will explain the advantages and
drawbacks related to the usage of these proxies.
A. Taxes
The tax argument, first introduced by Smith and Stulz (1985), suggests that if the firm faces a convex
tax function, because hedging reduces the variability of the taxable income, by Jensen’s inequality the
firm will end up with a lower tax liability. Consequently, for a convex tax function, as long as hedging
costs do not exceed its benefits, hedging increases after tax firm value. This prediction was confirmed
7 Interestingly, both the Mardsen and Prevost (2005) and Berkman and Bradbury (1996) papers use data relative to New Zealand companies. We are inclined to think that either information about fair value is easily obtainable in this country or that fair values are a standard approach for researchers in New Zealand.
12

by results reported among others in Nance, Smith and Smithson (1993). Over the twenty papers that
controlled for the tax argument, eleven papers include one variable, six papers include two variables,
two papers include three variables and one paper includes four variables as proxy for the tax incentive
to hedge.
As Table III shows, the most popular measure of the tax function convexity is the amount of the tax
loss carryforwards (TLCF hereafter) [Nance, Smith and Smithson, 1993; Tufano, 1996; Fok, Carroll
and Chiou, 1997; Knop, Nam and Thornton, 2002….etc] or a dummy variable indicating the presence
of such item in the firm’s balance sheet [Berkman and Bradbury, 1996; Mian, 1996; Mardsen and
Prevost, 2005…etc].
These two variables are very easy to construct and need simple inputs available in widely used
databases like COMPUSTAT. Also, it is true that these tax shields extend the convex portion of the tax
function [Graham and Smith, 1999]. However, variables based on TLCF suppose implicitly that firms
with such tax shields face a convex tax function which is not always true. Graham and Rogers (2002)
find that TLCF are uncorrelated with the tax function convexity. They conjecture that variables based
on this tax shields are probably better proxies for a low marginal tax rate and/or financial distress costs
than for the tax convexity. Additionally, Graham and Smith (1999) argue that these proxies are too
simple to capture incentives resulting from the tax convexity and may even lead to erroneous
conclusions. Indeed, existing net operating losses or any other tax provisions will provide a tax
disincentive to hedge for firms expecting to loose money because hedging reduces the “right tail”
outcomes and consequently the chance that the firm uses these existing losses.
A second measure that is commonly proposed for the tax function convexity is a dummy variable
indicating whether the firm’s pre tax income is expected to be in the progressive region of the tax
code8. Beware that this variable could proxy other aspects of the firm. Indeed, firms whose income is
8 The US tax code imposes in general for each taxable year on the taxable income of every corporation a tax amount equals to: (A) 15 percent of so much of the taxable income as does not exceed $50K, (B) 25 percent of so much of the taxable income as exceeds $50K but does not exceed $75K, (C) 34 percent of so much of the taxable income as exceeds $75K but does not exceed $10M, (D) 35 percent of so much of the taxable income as exceeds $10M. In the case of a corporation which has taxable income in excess of $100K for any taxable year, the amount of tax determined under the preceding sentence for such taxable year shall be increased by the lesser of (i) 5 percent of such excess, or (ii) $11,750. In the case of a corporation which has taxable income in excess of $15M, the amount of the tax determined under the foregoing provisions of this paragraph shall be increased by an additional amount equal to the lesser of (i) 3 percent of such excess, or (ii) $100K. Under this tax code, the region with the most important progressive region concerns incomes between 0-100K$.
13

largely in the progressive region are usually more likely to suffer from financial distress and are also
smaller. An additional weakness of this variable is that income is measured post hedging
Variables based on the investment tax credits (ITC hereafter) or foreign investment tax credits (FTC
hereafter) could also serve as measures for the tax function convexity. Graham and Smith (1999) show
however that these two provisions have only a modest effect on the convexity of the tax function.
Commonly, the amounts of these tax shields [Nance, Smith and Smithson, 1993; Fok, Carroll and
Chiou, 1997; Bartram et al., 2004] or a dummy variable indicating their presence [Mian, 1996; Bartram
et al., 2004] are used. Variables based on the ITC are controversial because they may proxy for some
aspects of the firm’s investment opportunities. Indeed, only certain categories of assets give rise to ITC.
Also, instead of measuring the tax function convexity, variables based on FTC can proxy the presence
of foreign operations and, consequently, exposure to currency risk.
It is noteworthy that the three previously mentioned variables are measures of the tax function
convexity, thus providing information about the existence of a tax advantage but not about the level of
this advantage. Graham and Smith (1999) propose a simulation procedure that quantifies the tax
savings resulting from a decrease in the volatility of the taxable income when the firm uses risk
management. Their methodology provides a precise measure of the tax incentive to hedge.
Interestingly, the calculation of their variable allows the introduction of the different provisions in the
tax code. The simulation approach presents however two minor limits. First, Graham and Smith (1999)
treat all firms listed in COMPUSTAT identically by applying the American legislation and tax code to
their whole sample. Second, the simulations are repeated 50 times to generate this variable which could
be insufficient when dealing with simulations. Dionne and Triki (2004) remedy to these limits by
applying for each firm in their sample the tax code of its home country and by repeating the simulations
1000 times9.
(Insert Table III here)
B. Financial distress costs
If financial distress is costly, firms are better off with hedging activities because they reduce its
probability. According to Smith and Stulz (1985), financial distress costs provide a possible
9 Dionne and Garand (2003) use the model that Graham and Smith (1999) propose to explain the convexity-based tax savings from hedging in order to predict the values of this variable for their sample. Considering that the adjusted R2
14

explanation of why firms hedge. Assuming a fixed investment policy, they argue that hedging can
decrease the present value of financial distress costs even if hedging is costly. Consequently, hedging
increases shareholders’ wealth because it decreases the expected value of direct bankruptcy costs and
the loss of debt tax shield. Twenty four papers among the thirty two reviewed control for the financial
distress costs motive: six papers use one proxy, twelve papers use two proxies, five papers use three
proxies and one paper uses five proxies to control for this argument.
Leverage is the most popular measure for financial distress costs10. As table IV shows, it is included as
an explanatory variable in all but one of the reviewed papers that control for this argument. Measuring
the financial distress costs with leverage relies on the implicit assumption that firms with important
gearing in their capital structure are more likely to face financial distress. Berkman and Bradbury
(1996), Haushalter (2000), Gay and Nam (1998), Rogers (2002) and Graham and Rogers (2002)
reported evidence suggesting a positive relation between leverage and corporate hedging while Nance,
Smith and Smithson (1993), Géczy, Minton and Schrand (1997), Tufano (1996) and Allayannis and
Ofek (2001) report an insignificant coefficient for this variable. Dionne and Garand (2003) propose a
combination of leverage and liquidity to proxy financial distress costs. Their variable is set equal to one
for firms with a debt and a quick ratio, respectively, above and below the industry’s median. Firms with
important gearing in their capital structure and low liquidity ratios are more likely to face high distress
costs.
A major concern with leverage is that it ignores possible variations in the exogenous bankruptcy costs
across firms and fails to address the possibility that these costs might affect the firm’s gearing. Indeed,
firms facing low exogenous financial distress costs can choose a high leverage. Despite having an
important gearing (synonym of a greater probability of financial distress), these firms have few
incentive to hedge. Additionally, several researchers argue that leverage should not be modelized as an
exogenous variable when testing corporate hedging theories. If financial distress is costly and debt
presence in the capital structure allows fiscal advantages or a reduction in the agency costs, risk
management can increase the debt capacity because it reduces the probability of financial distress. The
idea that risk management increases the debt capacity is developed in Stulz (1996), Leland (1998) and
Graham and Rogers (2002). Modelizing the risk management and the debt decisions as simultaneous
reported for the Graham and Smith (1999) model is 8.2%, one would have some reserves concerning the capacity of the Dionne and Garand (2003) variable to capture properly the value of the tax savings from hedging. 10 Whidbee and Wohar (1999) use the ratio of the firm’s market value of equity to its total value. This is an inverse measure of leverage.
15

could complicate the model and the estimation procedure. For example Dionne and Triki (2004) had to
develop a sophisticated method that relies on Gauss-Hermite quadrature rules in order to estimate their
system of simultaneous equations.
Variables based on the interests’ payments could also serve as measures for the financial distress costs.
Commonly, the interest coverage ratio is included to control for these costs [Gay and Nam, 1998;
Nance, Smith and Smithson, 1993; Berkman and Bradbury, 1996…etc]. The idea is that firms with a
low interest coverage ratio are less likely to honour the promised payments on their debt because they
do not generate enough cash from their operations. It is true that firms that do not generate enough cash
from their operations have a greater probability to be financially constrained but this does not mean that
they are automatically in distress. It is possible that these firms generate enough cash from their
financing operations or have important cash buffers that allow them to meet their outstanding financial
responsibilities. Consequently, a low interest coverage ratio is not always an indication of financial
distress. Tufano (1996) and Haushalter (2000) use the operating costs of production to measure
financial distress costs on the ground that firms with low operational costs are less likely to suffer from
financial distress. This is also a measure of financial distress that is based on the operational efficiency
of the firm.
Several papers propose the credit rating on the firm’s long term debt as a measure for financial distress
costs [Jalilvand, 1999; Géczy, Minton and Schrand, 1997]. Credit ratings are the result of qualitative
and quantitative analysis focusing on the credit quality of the firm and its underlying financial
commitments. They consequently provide a good indication concerning the probability of financial
distress. Unfortunately, this variable probably introduces a size bias in the results because larger firms
are more likely to have their debt rated. Furthermore, credit ratings are ordinal measures that provide
less information about financial distress than continuous variables.
Finally, Brown, Crabb and Haushalter (2003) use changes in the ratios included in the calculation of
the Altman Z-score to proxy changes in the probability of financial distress. We think that the Altman
Z-score is an excellent alternative to capture information about the firm’s financial distress probability.
The advantage of such proxy is that it summarizes information available in different ratios which gives
it a multivariate aspect. Of course, this measure is not perfect since we have no guarantee that the
estimated equation contains the relevant ratios and coefficients to measure the financial distress in the
sample considered.
16

Roughly speaking, the different variables above mentioned provide mainly information about the
probability of financial distress rather than the costs associated with such problem. In order to tackle
this issue, Graham and Rogers (2002) combine leverage with the firm’s market to book ratio. They
multiply both variables in order to capture information both about the probability of financial distress
(captured by leverage) and the costs of distress (captured by the market to book ratio). We think it is
important to develop variables in this spirit with a special attention to measures of distress costs.
(Insert Table IV here)
C. Underinvestment costs
The underinvestment problem describes situations where shareholders forego positive net present value
projects because the gains accrue mainly to bondholders [Myers, 1977]. Firms with important
investment opportunities who are financially constrained suffer the most from this problem. Hedging
can alleviate the underinvestment issue by increasing the number of states in which shareholders are
residual owners. This could be achieved by shifting cash from states in which cash flows are sufficient
to face the firm’s financial commitments to states where cash flows are insufficient to meet the firm’s
obligations. Furthermore, Froot, Scharfstein and Stein (1993) (FSS hereafter) show that, when the cost
of external financing is more important than the cost of internal financing, hedging can mitigate the
underinvestment problem because it ensures the availability of more internally generated funds that
could be used to undertake the firm’s investment opportunities. Morellec and Smith (2002) and Lin and
Smith (2003) also establish a positive relation between hedging and the firm’s investment opportunities
when they consider simultaneously the financing, investment and risk management decisions.
Commonly, papers include indicators of the firm’s investment opportunities to control for this
argument because the underinvestment problem affects more severely firms with an important
investment set. Over the twenty five papers that controlled for this argument, nine use one proxy,
eleven use two proxies, four use three proxies and one uses five proxies for underinvestment costs.
As table V shows, the most popular measure for the firm’s investment opportunities is the book to
market [Géczy, Minton and Schrand, 1997; Gay and Nam, 1998; Graham and Rogers, 2002; Lel,
2004…etc] or its inverse (the market to book) [Mian, 1996; Jalilvand, 1999; Allayannis and Ofek,
2001…etc]. In the papers we reviewed, this variable is rarely included alone in the tests. The rationale
for using the market to book (or book to market) ratio is that the observed market value of the firm
represents an assessment of the value of its assets in place and the value of its investment opportunities.
When scaled by the value of the assets in place (which give us the market to book ratio), this variable
17

should provide a clear idea about the value of the firm’s investment opportunities. However, Lin and
Smith (2003) conjecture that since different firms have different structures of assets in place, a high
market to book (low book to market) is not automatically an indication of more valuable investment
opportunities.
The second most popular measure for the firm’s investment opportunities, in the papers reviewed, is
the amount of research and development expenses (R&D hereafter) scaled by the firm’s size [Nance,
Smith and Smithson, 1993; Fok, Carroll and Chiou, 1997; Gay and Nam, 1998; Knop, Nam and
Thornton, 2002, etc…]. This variable is used on the grounds that R&D expenditures provide a
reasonable indicator of future projects development. Empirically, Nance, Smith and Smithson (1993),
Gay and Nam (1998), Graham and Rogers (2002) report a positive and significant coefficient for this
variable while Howton and Perfect (1998) find an insignificant one. In the same spirit, Tufano (1996),
Dionne and Garand (2003), and Dionne and Triki (2004) use the exploration and acquisition
expenditures while Haushalter (2000) uses the investment expenditures to measure the firm’s
investment opportunities. These variables are included because gold mining (oil and gas) companies
usually expend either internally by prospecting new mines (pits) or externally through acquisitions.
Given the nature of their samples, their variables are more appropriate than the R&D expenditures.
FSS (1993) argue that R&D expenditures could also proxy for the extent of information asymmetry
about the firm’s project quality or the financial constraints facing the firm. Indeed, firms with few
intangible assets and large amount of R&D expenditures usually have harder time to get external
financing because they have no guarantees to offer in order to back up their contractual engagements.
Moreover, Gay and Nam (1998) conjecture that the relation between R&D expenses and hedging might
be driven by agency costs. Indeed, bad managers could hide their true quality by devoting more money
to R&D or by mimicking the risk management strategies of good quality managers. In this case they
will be attracted by hedging in order to mask their real quality and the quality of their projects.
Furthermore, the fact that the disclosure of R&D expenditures is not mandatory could lead to a sample
selection bias because firms that spend large amounts in R&D activities are more likely to disclose
such information.
Several papers include liquidity measures to proxy for the firm’s investment opportunities. Liquidity-
based variables rest on the assumption that firms are more likely to forego positive net present value
projects and thus suffer from underinvestment when their cash holdings are low. Jalilvand (1999) and
Allayanis and Ofek (2001) use the dividend yield on the ground that firms could pile up more liquidity
18

by cutting their dividend payments, Borokhovich et al. (2004) use the quick ratio while Nguyen and
Faff (2003) use both the current ratio and the ratio of cash and cash equivalents to the firm’s size.
Unfortunately, a negative coefficient reported for these liquidity measures could have another
explanation than being an indication of an underinvestment problem. Indeed, firms may simply reduce
their hedging activities through derivatives because they prefer to adopt a retention strategy. In this
case, the hedge ratio will be negatively associated to the firm’s liquidity measure.
Rajgopal and Shevlin (2002) propose an interesting approach to control for the firm’s investment
opportunities set. They use factor analysis to construct what they call the “investment opportunity set
score” (IOS). Their variable combines information about the firm’s market to book and exploration
costs. We think it is interesting to develop new variables in this spirit because they combine
information about different aspects of the firm’s investment opportunities and are less likely to suffer
from measurement errors.
It is worth noting that the FSS (1993) model does not suggest that it is the existence of growth
opportunities that is a determinant of corporate hedging but rather the risk of not undertaking them
because of the high cost of external financing. It follows that a test of risk management determinants
should include not only proxies for the firm’s investment opportunities but also variables indicating its
capacity to undertake them. Different approaches were proposed in the literature to correct for this
argument. For example, Géczy, Minton and Schrand (1997) multiply their measure of the firm’s
investment opportunities (market to book) by a measure of the external cost of financing (leverage).
This variable was subsequently used in Lel (2004) and Bartram et al. (2004). Interestingly, Graham and
Rogers (2002) use this variable to measure the financial distress costs where the leverage proxies the
probability of financial distress and the market to book proxies the distress costs. This shows clearly
that one should be careful when interpreting results drawn from this variable. Gay and Nam (1998)
control for the FSS (1993) argument by including a dummy variable that equals one for firms reporting
simultaneously a low level of cash and a high level of growth opportunities, zero otherwise. Haushalter
(2000) includes a dummy variable equals to one if the firm’s debt ratio is above the sample median and
its current ratio ranks below the sample median (zero otherwise) as a proxy for financial constraint.
Finally, Howton and Perfect (1998) and Nguyen and Faff (2003) control partially for the FSS argument
by including variables that approximate only the capacity of the firm to undertake the investments.
Howton and Perfect (1998) use the ratio of cash flow to total assets while Nguyen and Faff (2003) use
a liquidity ratio and the current ratio. Overall, despite differences in the methodologies, the reported
evidence in these papers provides support for the FSS (1993) argument.
19

(Insert Table V here)
D. Managerial risk aversion
Managers are usually less diversified than regular shareholders because they have their human capital,
present and future compensations tied to the firm’s value. Consequently, they will require additional
compensation if they feel exposed to a high level of risk through the firm. Hence, managerial risk
aversion provides an incentive for corporate hedging because risk management could lower equilibrium
managerial compensation.
According to Smith and Stulz (1985), managers will hedge less as long as their expected utility is a
convex function of the firm’s value, even though their expected utility is a concave function of their
personal wealth. Therefore, we expect managers with important options holdings to hedge less because
options create a convex relation between the managers’ utility and the firm’s value. Tufano (1996),
Rajgopal and Shelvin (2002) and Rogers (2002), among others, provide support for this hypothesis.
However, in a more recent paper, Carpenter (2000) shows that options compensation does not
automatically lead to more risk seeking. According to her model, stock options create two opposing
effects on managerial wealth. First, as the volatility of the firm stock returns increases, the payoffs from
options become more important. This effect should, ceteris paribus, incite managers to hedge less.
Second, as the stock price decreases, the payoffs from options become less important. This effect
should incite risk adverse managers to increase their hedging in order to avoid a drop in the share price.
Interestingly, Carpenter (2000) shows that managers who are paid with stock options could hedge more
when the second effect prevails. The hypotheses drawn from her model were confirmed by results
reported in Knopf, Nam and Thornton (2002), Géczy, Minton and Schrand (1997) and, Gay and Nam
(1998).
Smith and Stulz (1985) also show that compensation packages that lead to a concave function between
the managers’ expected utility and the firm’s value should encourage managers to hedge more.
Accordingly, managers holding a significant fraction of the firm’s shares should engage more actively
in risk management.
Commonly, variables proxying separately for incentives from the stock compensation and the options
compensation are included in the tests. As table VI shows, managerial risk aversion is less popular
than the tax, financial distress and underinvestment costs explanations. Only seventeen of the reviewed
papers controlled for this argument: eleven papers control both for incentives from stock and options
20

compensations, three papers control only for incentives from the stock compensation and three papers
control only for incentives from options compensation. In the following, we will first discuss traditional
variables proposed in the literature to control for these arguments then we will discuss a new approach
based on the option pricing theory.
D.1. Incentives from stock compensation
Ideally, one should construct a variable that measures the proportion of the total manager’s wealth
invested in the firm’s common equity to control for incentives related to stock compensation.
Unfortunately, information about the managers’ total wealth is impossible to get unless you work for
the IRS. With this problem in mind, several alternatives measures were proposed in the literature.
The value of the common shares held by the firm’s directors and officers [Dionne and Triki, 2004] or a
logarithm specification of this variable [Tufano, 1996; Géczy, Minton and Schrand, 1997; Gay and
Nam, 1998; Haushalter, 2000] are the most common proxies for incentives related to stock
compensation. The major concern with these variables is that they suppose the total managerial wealth
to be constant across managers in all firms and that the latter is not affected by the size of the
management team. This assumption is not true. A reported positive relation between stock ownership
and corporate hedging could be influenced by the size of the management team (larger teams are more
likely to carry important stock holdings). In this case, the observed relation will be a statistical artefact
of firm size being misspecified [Tufano, 1996]. Knop, Nam and Thornton (2002) and Rogers (2002)
restrict their attention to the CEO shareholding on the ground that the latter has the ultimate power in
an important decision such as corporate hedging. Their approach eliminates the bias of the management
team size. However, if the risk management is a group rather than an individual decision, the number of
common shares held by the CEO will not capture adequately the incentives generated from stock
compensation. This will lead to a misspecified model.
Table VI shows that the fraction of common shares held by insiders could also be used to control for
incentives from the manager’s stock compensation. This variable provides a cleaner proxy than the
number of shares because it measures the importance of managerial shareholding in the firm and
therefore the degree of managerial diversification. Note that the definition of insiders varies across
papers: Jalilvand (1999) for example considers the top five officers in the firm; Berkman and Bradbury
(1996) consider the directors group while Nguyen and Faff (2003) and Mardsen and Prevost (2005)
extend their analysis to all the directors and officers in the firm. Like the number of common shares,
this variable suffers from the size of the management team bias because larger teams are more likely to
21

hold an important fraction of the firm’s outstanding shares (this limit does not apply when the focus is
on the CEO shareholding like in the Allayannis and Ofek (2001) case). Furthermore, recall that the
fraction of common shares held by insiders is a common measure of the extent to which managers and
shareholders’ interests are aligned. Consequently, it may measure the intensity of agency problems
between managers and shareholders rather than managerial risk aversion.
D.2. Incentives from options compensation
To control for incentives related to options compensation, several papers use the number of options
held by insiders [Tufano, 1996; Gay and Nam, 1998; Haushalter, 2000; Dionne and Triki, 2004]. Once
again, the results will suffer from the size of the management team bias (except for the case where only
the CEO is considered). In order to correct for this limit, Haushalter (2000) uses the number of options
held per director and officer and the number of options held per officer. Note that these variables are
very sensitive to the definition of the insider group considered.
A major concern with the number of options held by insiders (or a modified version of this variable) is
that it treats equally the risk taking incentives generated from the different options held. It is important
to remember that the sensitivity of the manager’s wealth to changes in the risk of the firm’s equity is
more important when the options held are deep in the money compared to cases where the options are
out of the money. Accordingly, the number of options provides a noisy measure of the incentive
generated by options because it ignores the characteristics of the options held. Also, Knop, Nam and
Thornton (2002) argue that variables based on the number of options provide crude approximations of
the incentive resulting from options compensation because they do not consider the two opposing
effects that result from this form of compensation.
Nguyen and Faff (2003) and Allayannis and Ofek (2001) consider a scaled version of this variable. The
scaling denominator in their case is the total number of the firm’s shares outstanding. An important
limit in the scaled version is that it supposes implicitly that each option held is equivalent to holding a
share of the firm. This assumption is not always true. Even if the options are exercisable, it is possible
that it is not financially interesting to exploit them. In this case, the variable used in the test will be
hardly interpretable.
Table VI shows that the value of the options held by the CEO [Haushalter, 2000; Dionne and Triki,
2005] and the natural logarithm of the market value of shares obtainable upon the exercise of the
options held by the CEO or the D&O [Géczy, Minton and Schrand, 1997; Knop, Nam and Thornton,
22

2002] are possible measures for the incentives generated by options-based compensation. These
variables describe more adequately the financial incentive generated by options because they consider
the payoffs from these instruments rather than their holding. One important detail to remember is that
the market values of the options held are usually calculated with the dividend adjusted Black and
Scholes model. This model is not appropriate when pricing executive stock options.
D.3. The Delta and Vega
A more adequate measure for the incentive generated by the manager’s stock and options
compensations are the Delta (sensitivity of the stock and option portfolio to changes in the price of the
firm’s stock) and Vega (sensitivity of the option portfolio to changes in the volatility of the firm’s stock
price). These measures are a direct application of the option pricing theory. Importantly, the Vega
captures the convex effect stock options compensation has on the relation between the manager’s
wealth and the firm’s value. Core and Guay (2002) developed a one-year approximation to calculate
these Greeks. Their approach is attractive because (1) it is based on the incomplete information
typically available in proxy statements and (2) it yields measures of sensitivities that are both unbiased
and highly correlated (more than 95%) with the values obtained from a complete dataset concerning
prior grants. The Delta and Vega measures were used by Knop, Nam and Thornton (2002), Graham
and Rogers (2002) and, Rogers (2002)11. Overall, the empirical evidence reported in these papers
supports the Smith and Stulz (1985) model predictions. Rogers (2002) states however that using the
Delta and Vega in a ratio form (Vega to Delta) is more advantageous than examining them separately.
By combining the two measures we won’t need to specify separate models for risk taking and for value
increasing incentives. Note that the economic interpretation of such ratio is also more intuitive because
it measures the CEO risk-taking incentive per dollar of value-increasing incentives from option and
stock holdings.
Using the Delta and Vega separately or on a ratio form is not without controversy. First, to calculate the
Delta and Vega for a given fiscal year according to the Core and Guay (2002) approach, one needs
detailed information about the value and the number of options already granted by the firm as well as
the characteristics of the options granted during the considered year. This data is available in recent
proxy statements but is hardly obtainable for earlier periods because companies were not obliged to
disclose this kind of information. To comply with the requirements of the Core and Guay (2002)
approach, one will have no other choice than dropping the earlier years in his sample. Such practice
23
could lead to a sampling bias in the results. Second, Core and Guay (2002) rely on the dividend-
adjusted Black & Scholes model to estimate the sensitivities of the stock and option portfolios to stock
return and stock return volatility. As mentioned earlier, this model is not appropriate for valuation
when we deal with executive stock options (ESO). As stated in Rajgopal and Shevlin (2002), the partial
derivatives used to calculate the sensitivities, likely overstates the real values of the ESO risk incentive
(Vega) and the ESO wealth effect (Delta).
Some authors stress out the need to modelize incentives related to the manager’s compensation as a
choice variable when implementing a test of risk management determinants because risk also affects
the compensation decision. For example, the managers may require more options-based compensation
when the firm’s risk is important. Rogers (2002) and Rajgopal and Shevlin (2002) model the CEO risk-
taking incentives and hedging simultaneously. Their results show however that the negative association
between the two variables is mainly driven by CEO risk-taking incentive providing a motive for
managers to hedge less.
(Insert Table VI here)
E. Information Asymmetry
According to Stulz (1990), corporate hedging could reduce either the overinvestment or
underinvestment costs resulting from the non-observability of managerial actions. The effectiveness of
such policy in reducing these costs is in general, inversely related to the volatility of the cash flows
generated by the firm. DeMarzo and Duffie (1991) also modelize information asymmetry as a
determinant of corporate hedging. In their model, risk management reduces the noise in the firm’s
dividend stream which let shareholders better off. This is true even when hedging is costly. Breeden
and Viswanathan (1998) consider a different source for information asymmetry that concerns the
management competence. In their model, risk management reduces the noise in the learning process
concerning the manager’s capacities and corporate hedging is adopted mainly by high qualified
managers to signal their superior abilities. Only seven papers from the thirty two reviewed controls for
this argument.
Table VII shows that the percentage of the firm’s shares held by institutions is the most popular
measure of information asymmetry [Géczy, Minton and Schrand, 1997; Graham and Rogers, 2002;
11 Rajgopal and Shevlin (2002) use only the Vega in their tests.
24

Rogers, 2002; Dionne and Triki, 2004, 2005]. This variable is included in regressions on the grounds
that institutions have privileged information and the resources to monitor the firm’s management. Also,
institutions are themselves subject to strict disclosure requirements that oblige them to report
periodically information about their investments. Accordingly, institutional shareholding should
facilitate processing of information concerning the firm’s operations and financials on the market. It is
true that institutions have privileged information because firms used to provide important information
to select securities analysts and/or institutional investors before disclosing it to the general public but
the Regulation Fair Disclosure amended by the Securities and Exchange Commission (SEC) on 2000
prohibited such practice. Therefore, it is possible that institutional shareholding became a less effective
proxy for information asymmetry after this period. It is important to notice that a negative coefficient
reported for this variable could have another explanation than being an indication of a lower incentive
to hedge in order to reduce information asymmetry costs. Indeed, institutions are usually well
diversified and might find useless to manage the risk at the firm level. Consequently, they will
encourage a reduction in the hedging ratio.
Another proposed measure in the literature for information asymmetry is the number of financial
analysts following the firm [Géczy, Minton and Schrand, 1997]. When the firm is under greater public
scrutiny, it should suffer less from information asymmetry. Consequently, information asymmetry
should decrease with the number of analysts following its operations and so does the incentive to
hedge. Beware here that a positive coefficient for this variable could be interpreted either as evidence
supporting the reduction of information asymmetry cost motive or as indication that analysts choose to
follow firms with fewer earnings surprises.
DaDalt, Gay and Nam (2002) conjecture that earnings related measures of information asymmetry are
closer to the spirit of theoretical models that linked corporate hedging to information asymmetry. The
first measure they consider is called “the analysts forecast accuracy” and is defined as the absolute
value of the average earnings forecast error. To generate this variable, they first calculate the mean
analyst earnings forecast. Next, they substract from it the actual earnings per share declared by the firm
and they normalize this difference by the firm’s stock price. Lin and Smith (2003) use a variant of this
variable to proxy for information asymmetry. The second measure used in DaDalt, Gay and Nam
(2002) is the dispersion in analysts’ earnings forecast. According to them, analysts are unable to
provide a precise and unanimous forecast of the firm’s earnings when there is a lack of information
about it. Variables based on the forecasting errors provide an interesting approach to measure
25

information asymmetry. The only concern when using them is that you never know whether the
forecasting errors are caused by a higher level of information asymmetry or by other factors.
Haushalter (2000) conjectures that firms whose debt is rated have undergone more scrutiny and
consequently suffer less from information asymmetry. He uses a dummy that equals one if the firm's
debt is rated by S&P, zero otherwise as a measure for information asymmetry. The major issue with
this variable is that it could introduce a sampling bias. Recall that financially healthy and / or large
companies are more likely to undergo the rating procedure.
(Insert Table VII here)
F. Corporate governance characteristics
Risk management theory provides explanations for corporate hedging that are based on agency
conflicts between managers, shareholders and debtholders. Accordingly, corporate governance
characteristics should affect the risk management policy because corporate governance is the market
solution to these agency problems. This recent literature primarily focuses on how the board
independence and the ownership structure of the firm affect corporate hedging. As table VIII shows,
only eight papers controlled for the firm’s ownership structure and six papers controlled for the board’s
characteristics.
F.1. Ownership concentration
Firms characterized by a high ownership concentration are less likely to suffer from agency conflicts
and, consequently, should hedge mainly in order to maximize their values. Also, large shareholders
have the resources and incentives to exercise strict monitoring on the managers’ activities thus reducing
management incentive to hedge for their own interests. The most commonly used variable to control
for the firm’s ownership structure is the percentage of shares held by blockholders. Interestingly, the
definition of blockholders varies a lot across papers. For example, Tufano (1996) considers as a
blockholder a non managerial shareholder holding more than ten percent of the firm’s shares and
Mardsen and Prevost (2005) consider shareholders holding more than five percent of the firm’s shares.
Beware that managerial blockholding could serve also as a measure for the agency conflict intensity.
Haushalter (2000) use the number of outside blockholders. We think that his variable is less appropriate
than the one previously mentioned because a large number of blockholders is not always synonym of
ownership concentration. For example, if the firm has one hundred blockholders holding each five
26

percent of the firm’s shares, it will have an ownership structure that is less concentrated than a firm
having one blockholder holding fifty percent of its shares.
Table VIII shows that the percentage of shares held by the firm’s CEO [Whidbee and Wohar, 1999],
insiders [Fok, Carroll and Chiou, 1997], outsiders [Whidbee and Wohar, 1999; Knop, Nam and
Thornton, 2002] or institutions [Whidbee and Wohar, 1999; Fok, Carroll and Chiou, 1997] are possible
measures for the firm’s ownership concentration. Results obtained with these variables should be
interpreted with caution because institutional shareholding could also proxy the intensity of information
asymmetry [Géczy, Minton and Shrand, 1997; Rogers, 2002; Graham and Rogers, 2002] and the
shareholdings of insiders/outsiders could also proxy for the agency conflict intensity. In a more recent
paper, Lel (2004) uses dummy variables indicating the presence of an inside blockholders, outside
blockholders, institutional blockholders as well as a variable measuring the wedge between the voting
rights and the cash flow rights for the largest managerial blockholder. He argues that this last variable
provides the cleanest measure of the severity of separation and control. His evidence suggests that the
presence of an insider blockholders decreases the likelihood that the firm hedges while the presence of
an outside blockholder or / and an institutional blockholder increases such probability.
The major concern with variables based on the number of common shares held by several entities is
that they suppose that the firm has a single class of shares offering the same voting rights. After all, it is
the voting rights and not the cash flows rights that are relevant when investigating control through
shareholding. To overcome this limit, Borokhovich et al. (2004) use the fraction of total voting rights
held respectively by insiders, blockholders and by banks to control for the firm’s ownership structure.
The originality of their approach lies not only on the fact that they use voting rights instead of cash
flow rights but also on the fact they consider banking shareholding as a possible determinant of the
hedging extent.
(Insert Table VIII here)
F.2. Board characteristics
Explanations based on the board characteristics were recently introduced in tests of corporate hedging
theories and mainly focus on the independence of the board of directors. This new stream in the
literature is encouraged by the increased fiduciary responsibilities assigned by the regulation to the
board of directors as well as the increasing awareness that the monitoring of a manager determines the
relation between his wealth and the firm’s value and consequently its behaviour toward risk.
27

Particularly, the agency theory assigns an important monitoring role to outside directors because they
are not influenced by the firm’s management and may have the expertise that management lacks.
Accordingly, board independence should play an important role in the firm’s risk management
activities.
Whidbee and Wohar (1999) were the first to link the decision to use derivatives to the board
independence as measured by the proportion of outside directors sitting on it. Their evidence suggests
that the managers’ decision to hedge with derivatives is influenced by outside directors’ membership in
the board only at low levels of insiders’ shareholdings. This is primarily caused by the fact that
managers who own a small fraction of the firm’s equity face a greater probability to be disciplined after
a poor performance. This situation will usually incite them to seek more hedging. The fraction of
outside directors sitting on the board was subsequently used by Dionne and Triki (2004) and Mardsen
and Prevost (2005). Borokhovich et al include a modified version of this variable. They consider the
difference between the number of outside and inside directors as a fraction of the board size. The
evidence reported in Dionne and Triki (2004) and Mardsen and Prevost (2005) suggests a passive role
for outside directors in the decision to hedge and the extent of hedging while the Borokhovich et al.
(2004) findings suggest an active role for outside directors in the decision concerning the extent of
hedging IR risk. The major difficulty when measuring the board independence consists in
discriminating between outside and inside directors.
Table IX shows that other characteristics of the board of directors were also proposed as possible
explanations for the decision to hedge. For example Borokhovich et al. (2004) include the board size
and a dummy variable indicating the presence of a bank executive on the board. Their evidence
suggests that these two characteristics have no effect on the firm’s derivatives usage. More recently,
Dionne and Triki (2005) extended the literature linking the board characteristics to the risk
management policy by considering variables proxying not only the board independence but also its
financial background. They explore multiple definitions for the board financial knowledge.
Particularly, they examine the effect of the audit committee characteristics on the hedging extent. The
variables included in Dionne and Triki (2005) mainly indicate whether the company complies with the
requirements of the SEC and the NYSE in the matter of independence, financial knowledge and
composition. Dionne and Triki (2005) report evidence suggesting that the financial education of the
directors sitting on the board and on the audit committee is a relevant determinant of corporate
hedging.
28

The literature linking the board characteristics to corporate hedging is still in its infancy. Until now, the
work done in this topic mainly uses standard variables that were exploited in other literatures. We think
that new variables specific to the risk management literature will be developed in the near future.
(Insert Table IX here)
G. Country-specific characteristics
The informational and institutional environments in which firms operate can affect considerably their
risk management policies. The traditional approach in investigating the existence of a country effect
consists in surveying derivatives usage among firms in distinct countries in order to detect different
practices among them. Commonly, surveys compare US firms’ practices to those of a set of firms in a
different country. Bodnar and Gebhardt (1999) apply a matched-industry procedure to their samples of
US and German firms, and conclude that German firms hedge more with derivatives than their US
counterparts. Using a weighting methodology that corrects for differences in size and industry, Bodnar,
De Jong and Macrae (2003) show that derivatives usage is more popular among Dutch firms when
compared to US firms. This finding holds for all the size and industry classes they consider. They
conjecture that this difference results from the greater exposure of Dutch firms to FX risk, the
difference in orientation between the US and Dutch economies as well as the presence of a legal
structure that is more protective of shareholders rights in the US12. The problem with the survey
approach is that it permits only to detect differences in corporate hedging across countries but not to
find the driving force behind these differences. Also, even if one wants to find explanations for such
differences it is not possible to consider more than one explanation at a time. This is not appropriate
considering the multivariate aspect of the risk management decision.
Lel (2004) and Bartram et al. (2004) propose, in multivariate frameworks, country-specific
determinants for corporate hedging. To the best of our knowledge, these papers are the only ones
providing macro economic explanations for the decision to hedge13. Lel (2004) considers the financial
market development as well as the legal and economic characteristics of the country as possible
12 Several additional papers surveyed the risk management practices outside the US [Berkman, Bradbury and Magan, 1997; Alkeback and Hagelin, 1999; De Ceuster, et al., 2000; Loderer and Pichler, 2000]. We decided to limit our discussion to surveys conducted by Bodnar and Gebhardt (1999) and Bodnar, De Jong and Macrae (2003) because they are the only ones that control for the similarity of the questions asked and for the firm’s characteristics. Such control is important because it increases the likelihood that the observed results might be caused by institutional differences rather than firm characteristics. However, it is worth noting that all the previously mentioned papers reported evidence suggesting that firms outside the US have different risk management practices than their American counterparts. 13 Lel (2004) considers FX derivatives usage while Bartram et al. (2004) consider all types of derivatives usage.
29

explanations for corporate hedging while Bartram et al. (2004) consider four explanations based on the
access to derivatives market, the economic development of the country, the country risk and finally the
legal environment.
It is obvious that the degree of financial market development in a country affects the firm’s hedging
policy because it conditions both its choice of instruments (the firms will hedge with the available
instruments only) and its hedging cost. Particularly, firms in emerging economies are more likely to
hedge because their countries have greater macro economic risk. Lel (2004) uses the country GDP per
capita, the ratio of domestic credit provided by the banking sector to GDP, three dummy variables
indicating respectively the presence of a derivatives exchange market, whether the country is classified
as a bank-based economy and whether the country has a floating currency regime; and finally the
percentage of banks assets that at least 50% foreign owned as proxies for the degree of financial market
development. We think that variables based on macro economic indicators such as the GDP are more
appropriate to measure economic development in the country rather than financial market development.
Bartram et al. (2004) control for the development of the derivative market by including the average
daily turnover net of inter-dealer double counting in the FX and IR derivatives market scaled by the
country nominal GDP. This variable quantifies the size of the derivative market and is more
appropriate than the dummy variable indicating the presence of such market already used in Lel (2004).
For the country legal and economic characteristics, Lel (2004) uses indices describing the shareholders
and debtholders rights, a variable describing the degree of law and tradition in the country as well as
variables that capture information about the integrity of the legal system and the importance of the
market for corporate control. His results suggest that firms operating in a country characterized by a
developed financial market, strong governance legislation are more likely to engage in corporate
hedging. Bartram et al. (2004) use the GDP per capita and a dummy indicating OECD membership to
proxy for economic development. They also include indices based on previous research to proxy for the
country risk and legal environment. Their results suggest that the size of the derivatives market and the
level of financial and economic risk in the country affect the decision to hedge. Their results do not
show however that the legal environment matters.
Lel (2004) and Bartram et al. (2004) both consider risk management data for ADRs to conduct their
tests. Studying ADRs is interesting in terms of common reporting. Unfortunately, such data might
suffer from a selection bias because it is more likely that well performing international firms offer
ADRs [Pagano, Roell and Zechner, 2002].
30

H. Substitutes to hedging with derivatives
Firms can and do use techniques other than derivatives to manage their risks. Three substitutes to
hedging with derivatives were considered in the literature: risk management through financing
activities, risk management through operating activities and finally the presence of liquidity buffers.
Note that the two first alternatives are substitutes for hedging with derivatives while the third one is a
substitute for hedging regardless of the instruments used to hedge. Over the nineteen papers that
controlled for the existence of substitutes to hedging with derivatives: four papers use one variable,
seven papers use two variables, four papers use three variables, three papers use four variables and one
paper uses five variables to proxy for this argument
Petersen and Thiagarajan (2000), show that firms with a greater flexibility in their operating costs are
less likely to hedge. Few papers control for risk management through operations mainly because it is
very difficult to measure such activity [Fok, Carroll and Chiou, 1997; Tufano, 1996; Lel, 2004]. The
standard approach in the literature, when controlling for risk management through operations, is to
include a diversification measure of the firm’s activities. The idea is that well diversified firms need in
lower extent derivatives to hedge because they are less exposed to risk. Diversification is measured by
different ways in the literature. Lel (2004), for example, uses a dummy variable equals one if the firm
has at least one other business segment with a different SIC code, 0 otherwise14 while Fok, Carroll and
Chiou (1997) use a dummy indicating whether the firm is defined as a multinational. Tufano (1996)
and Haushalter (2000) measure the firm’s diversification with continuous variables. The former
includes the percentage of the firm’s assets outside the mining sector while the latter includes the
fraction of total revenues generated from oil and gas production. These variables are certainly
appropriate measures for diversification but do not provide information about the changes in the firm’s
operations aimed to reduce its risks. In the Tufano (1996) or Haushalter (2000) case, a more adequate
measure would be the changes in the amount of gold (oil) produced given that firms usually adjust their
production in order to reduce their exposure to CR.
Financing operations could also reduce the need for hedging with derivatives. Nance, Smith and
Smithson (1993) were the first to discuss the usage of preferred stocks and convertible debt as
substitutes to hedging with derivatives. Indeed, compared to regular debt, external financing in the
form of preferred stocks or convertible debt reduces the probability of financial distress and
31

consequently the need for hedging with derivatives. Nance, Smith and Smithson (1993) include the
book value of preferred shares and the book value of convertible debt (both scaled by the firm’s size) to
control for risk management through financing operations. Their variables became standard in the
literature and were subsequently used by Gay and Nam (1998), Géczy, Minton and Schrand (1997),
Fok, Carroll and Chiou (1997) and Howton and Perfect (1998)15. Jalilvand (1999) includes a dummy
variable indicating the usage of convertible debt by the firm. His variable provides unfortunately less
information about the importance of these financing operations than the Nance, Smith and Smithson
(1993) variable.
Firms carrying important liquidity buffers are more likely to engage in retention strategies which
should lower their demand for hedging with derivatives. Furthermore, financial slack decreases the
probability of financial distress and consequently the incentive to hedge in order to reduce the costs
associated with such problem. The literature has generally developed among two main lines when
controlling for this substitute to hedging with derivatives. One strand has recourse to direct accounting
measures of liquidity. The most popular measures considered in the literature are the current ratio
[Nance, Smith and Smithson, 1993; Fok, Carroll and Chiou, 1997] and the quick ratio [Géczy, Minton
and Schrand, 1997; Tufano, 1996; Rajgopal and Shevlin, 2002; Dionne and Triki, 2004…etc.]. Usually
a negative coefficient for these variables is interpreted as being an indication that liquidity buffers are
substitutes to hedging with derivatives. This interpretation ignores that some firms have higher demand
for liquidity which may lead to a higher hedging level and liquidity ratio [Borokhovich et al., 2004].
The second strand in the literature focuses on the source behind the observed liquidity. It supposes that
lower dividend payments could help the firm build liquidity cushions. Consequently, hedging will be
negatively associated to the firm’s dividend payments. The common approach consists in including the
dividend yield [Nance, Smith and Smithson, 1993; Fok, Carroll and Chiou, 1997; Knopf, Nam and
Thornton, 2002; Nguyen and Faff, 2003…etc.] or the dividend payout ratio in the regressions
[Berkman and Bradbury, 1996; Géczy, Minton and Schrand, 1997; Jalilvand, 1999; Rajgopal and
Shevlin, 2002]. Lel (2004) uses a modified version of the dividend yield. His variable is set equal to
one if the firm’s dividend yield is greater than the median value for the sample, 0 otherwise. It is worth
noting that a negative coefficient for the dividend yield could have another interpretation than being an
14 Fok, Carroll and Chiou (1997) use a measure of diversification as control for the firm’s exposure. Their variables equals the number of two-digit SIC codes assigned to a company. 15 Lel (2004) controls only for convertible debt usage while Knop, Nam and Thornton (2002) controls only for financing through preferred shares.
32

indication that hedging and liquidity are substitutes. Indeed, well established firms are more likely to
pay high dividends and are also more likely to have low variance cash flows. Such firms will have less
need for hedging and this will lead to a negative relation between their hedging ratio and dividend
yield.
Papers that investigated the risk management determinants of the FX risk also consider the issuance of
foreign denominated debt as a substitute to hedging with derivatives. Géczy, Minton and Schrand
(1997) argue that such strategy might be cheaper than a series of short term forward contracts for
example because it exposes the firm to a lower basis risk. Lel (2004) uses the foreign denominated debt
ratio while Bartram et al. (2004) include a dummy indicating the presence of such debt in the firm’s
capital structure. Overall, the reported results in both papers suggest that foreign denominated debt is
not a substitute for currency derivatives.
(Insert Table X here)
I. Exposure and variation
Firms with volatile cash flows or greater fraction of their revenues exposed to the risk considered
should be more attracted by hedging activities. Among the papers reviewed, thirteen consider the firm’s
exposure as a rationale for corporate hedging.
Interestingly, the firm’s exposure is included mainly in papers that focus on the FX risk. The most
popular proxies for exposure to the FX risk are the foreign sales to total sales ratio [Géczy, Minton and
Schrand, 1997; Allayannis and Ofek, 2001; Graham and Rogers, 2002; Lel, 2004] and the dummy
variables indicating either the presence of foreign operations or foreign income16 [Howton and Perfect,
1998; Jalilvand, 1999]. We think that variables indicating the presence of foreign income or foreign
operations are less informative than the continuous ones previously mentioned. Table XI shows that the
exchange rate volatility [Mardsen and Prevost, 2005], the foreign asset to total asset ratio [Géczy,
Minton and Schrand, 1997], the total trade to total production ratio [Allayannis and Ofek, 2001] are
also possible proxies for the firm’s exposure to FX risk. Dolde and Mishra (2002) propose a more
complex methodology to measure the firm’s exposure to FX risk. Their variable is set equal to one for
firms whose stock return sensitivities to major exchange rates are superior to the sample median, and
their ratio of foreign income to total sales and volatility of the cumulative translation account are non
16 Bartram et al. (2004) use a dummy variable that equals one if the firm reports foreign assets, income or sales, 0 otherwise.
33

null, 0 otherwise. This variable captures information about transaction, translation and operating
exposure which makes the interpretation of its coefficient complicated. In this case, it is hard to know
which exposure component is behind the observed result.
Table XI shows that control for exposure to IR risk could be achieved by including the interest rate
volatility [Mardsen and Prevost, 2005] or the floating debt to total debt ratio [Graham and Rogers,
2002]. Note that the interest rate volatility is more appropriate to measure macro economic exposure to
IR rather than the firm specific exposure to this risk. Finally, Rajgopal and Shevlin (2002) control for
exposure to oil and gas prices by including the ratio of sales from these commodities to total sales
while Brown, Crabb and Haushalter (2003) include the change in the spot gold price and the change in
the implied volatility of the gold futures contract to control for exposure to the gold price.
(Insert Table XI here)
J. Size
If hedging costs are inversely proportional to the firm size, smaller firms should have a higher hedging
ratio because the reduction in financial distress costs is more important in their case. Also, according to
the FSS (1993) model, firms facing expensive external financing are more likely to hedge. Since small
firms usually suffer from information asymmetry and face higher transaction costs when searching
external financing, they are more likely to hedge. However, if the hedging costs are fixed, larger firms
should engage more actively in risk management because it corresponds to an expensive activity that
smaller firms can not afford. Larger firms might also hedge in a greater extent because they have more
complicated and geographically dispersed operations and consequently a greater need to hedge. Block
and Gallagher (1986), Berkman and Bradbury (1996), Mian (1996), Nance, Smith and Smithson
(1993), Géczy, Minton and Schrand (1997) and, Haushalter (2000) all report evidence suggesting a
positive relation between hedging and size. Their results confirm the scale economies argument
justifying hedging activities.
Table XII shows that the most popular measure of the firm’s size is its market value [Nance, Smith and
Smithson, 1993; Mian, 1996; Tufano, 1996; Haushalter, 2000], or its natural logarithm [Gay and Nam,
1998; Jalilvand, 1999; Whidbee and Wohar, 1999; Knop, Nam and Thornton, 2002; Mardsen and
Prevost, 2005]. The definition of market value differs a lot across the papers. In second position comes
34

the book value of total assets or its natural logarithm [Fok, Carroll and Chiou, 1997; Brown, Crabb and
Haushalter, 2003; Allayannis and Ofek, 2001; Rajgopal and Shevlin, 2002; Lin and Smith, 2003; Lel,
2004]. Notice that size could measure not only the scale economies argument, but also the firm’s
financial distress costs [Berkman and Bradbury, 1996], or the extent of information asymmetry
[Rogers, 2002].
(Insert Table XII here)
IV. Conclusion and possible extensions
This paper has reviewed three important problems associated with the implementation of corporate
hedging theories tests. We start with the first question pertaining to the different methodologies used in
the literature to discriminate between hedgers and non-hedgers. We identify three different approaches
to achieve this task. The first approach consists in surveying directly the companies. The second
approach consists in searching the firm’s public documents for keywords like “risk management”,
“hedging”, “derivatives”, “swaps”, “options”…etc. Thanks to the mandatory disclosure requirements
set by regulators recently, we expect this approach to become the standard way of doing in the
literature. The third approach consists in using proprietary data. We describe two possible alternatives
explored in the literature for this approach: data collected by professionals like financial analysts,
brokers, bankers; and data available in paying databases like the database of users of derivatives, the
handbook of users of off-balance sheet instruments and the corporate risk management handbook.
The second question we review concerns measures of corporate hedging. We discuss the four most
popular measures proposed in the literature for corporate hedging: the dummy variable indicating
derivatives usage, the gross notional value of derivatives contracts, the net notional value of derivatives
contracts and finally the delta percentage. We describe for each measure the advantages and limits
related to its usage. Notice, that the choice of one measure or another for corporate hedging is in a great
extent conditioned by the data availability.
The third part of this paper reviews the different arguments justifying corporate hedging as well as the
most popular variables used to proxy for them. Basically, there are five traditional arguments that keep
coming in the papers: the reduction of the tax liability, the reduction of the financial distress costs, the
reduction of the underinvestment costs, the size effect and finally managerial risk aversion. We also
discuss other explanations for corporate hedging that are based on information asymmetry, corporate
governance characteristics, country-specific characteristics, the firm’s exposure to risk and finally the
35

existence of substitutes to hedging with derivatives. We show that multiple variables could be used to
proxy for each of these arguments and describe the advantages and limits of these proxies. More
importantly, we show that some of these proxies could measure more than one argument at a time.
Accordingly, results from the tests should be interpreted with a lot of caution.
In summary, the review showed that an impressive amount of work has been done in the risk
management literature but that there is still a lot of work to do in order to improve the quality of
corporate hedging theories tests. We think that the need for cleaner proxies in this literature is more
important than ever because richer datasets and new arguments are waiting to be explored.
We also think that tests of corporate hedging theories should focus on the following additional
problems in the future: the determinants of integrated risk management strategies, the joint
determination of the decision to hedge and the extent of hedging, and finally the determinants of
instruments choice in a hedging strategy.
The first empirical question is motivated by the increasing popularity of integrated risk management
and the growing debate claiming the necessity to adopt a portfolio approach when managing the firm’s
risks. According to Doherty (2000) such strategy is designed to support optimal investment and is more
cost effective. We think that it is interesting to check whether the hedging of a portfolio of risks is
affected by the same factors than the hedging of a single risk.
The necessity to examine jointly the decision to hedge and the extent of hedging is motivated by the
fact that these two decisions are interdependent. Indeed, we usually observe the hedging ratio only if
the firm decides to hedge. Therefore, it is important to incorporate this interdependence in the research
design when testing corporate hedging theories.
Finally, since risk management implies both decisions on the extent of hedging and the instruments
used to hedge, we should not limit our attention only to the first aspect of this policy. Thus, we think
that future research should try to investigate not only the determinants of the hedging ratio or the
decision to hedge but also why firms choose certain instruments and not others to hedge. This task is in
a great extent facilitated by the availability of better quality data on corporate hedging.
36

References
Alkeback, Per and, Niclas Hagelin, 1999, Derivative usage by non-financial firms in Sweden with an
international comparison, Journal of International Financial Management and Accounting, Vol.10,
Iss.2, 105-120.
Allayannis, George and, Eli Ofek, 2001, Exchange rate exposure, hedging, and the use of foreign
currency derivatives, Journal of International Money and Finance, Vol.20, Iss.2, 273-296.
Bartram, Sohnke, Gregory Brown and, Frank Fehle, 2004, International evidence on financial
derivatives usage, Working Paper, Lancaster University, University of North Carolina at Chapel Hill
and University of South Carolina.
Berkman, Henk and, Michael Bradbury, 1996, Empirical evidence on the corporate use of derivatives,
Financial Management, Vol.25, Iss.2, 5-13.
Berkman, Henk, Michael Bradbury and, Stephen Magan, 1997, An international comparison of
derivatives use, Financial Management, Vol.26, Iss.4, 69-73.
Block, Stanley and, Timothy Gallagher, 1986, The use of interest rate futures and options by corporate
financial managers, Financial Management, Vol.15, Iss.3, 73-78.
Bodnar, Gordon, Abe de Jong and, Victor Macrae, 2003, The impact of institutional differences on
derivatives usage: A comparative study of US and Dutch firms, European Financial Management,
Vol.9, 271-297.
Bodnar, Gordon and, Günther Gebhardt, 1999, Derivatives usage in risk management by US and
German non-financial firms: a comparative survey, Journal of International Financial Management
and Accounting, Vol.10, Iss.3, 153-187.
Bodnar, Gordon, Gregory Hayt and, Richard Martson, 1998, 1998 Wharton survey of financial risk
management by US non-financial firms, Financial Management, Vol.27, Iss.4, 70-91.
Borokhovich, Kenneth, Kelly Brunarski, Claire Crutchley and, Betty Simkins, 2004, Board
composition and corporate use of interest rate derivatives, The Journal of Financial Research, Vol. 27,
Iss.2, 199-216.
37

Breeden, Douglas, and S. Viswanathan, 1998, Why do firms hedge? An asymmetric information
model, Working Paper, Duke University.
Brown, Gregory, Peter Crabb and David Haushalter, 2003, Are firms successful at selective hedging?,
Working Paper, The University of North Carolina at Chapel Hill and Northwest Nazarene University.
Carpenter, Jennifer, 2000, Does option compensation increase managerial risk appetite?, The Journal of
Finance, Vol.55, Iss.5, 2311-2331.
Core, John, and Wayne Guay, 2002, Estimating the value of employee stock option portfolios and their
sensitivities to price and volatility, Journal of Accounting Research, Vol.40, Iss.3, 613-630.
DaDalt, Peter, Gerald Gay and, Jouahn Nam, 2002, Asymmetric information and corporate derivatives
use, The Journal of Futures Markets, Vol.22, Iss.3, 241-267.
De Ceuster, Mark, Eddy Laveren and, Jozef Lodewyckx, 2000, A survey into the use of derivatives by
large non-financial firms operating in Belgium, European Financial Management, Vol. 6, Iss.3, 301-
318.
DeMarzo, Peter, and Darrel Duffie, 1991, Corporate financial hedging with proprietary information,
Journal of Economic Theory, Vol.53, Iss.2, 261-286.
Dionne, Georges and, Martin Garand, 2003, Risk management determinants affecting firm’s values in
the gold mining industry: new empirical results, Economics Letters, Vol.79, 43-52.
Dionne, Georges and, Thouraya Triki, 2004, On risk management determinants: what really matters?,
Working Paper 04-04, Canada Research Chair in Risk Management and HEC Montréal.
Dionne, Georges and, Thouraya Triki, 2005, Risk management and corporate governance: the
importance of independence and financial knowledge for the board and the audit committee, Working
Paper 05-03, Canada Research Chair in Risk Management and HEC Montréal.
Doherty, Neal, 2000, Integrated risk management: techniques and strategies for reducing risk, McGraw
Hill Press.
Dolde, Walter and, Dev Mishra, 2002, Firm complexity and FX derivatives use, Working Paper,
University of Connecticut and Memorial University of Newfoundland.
38
Fok, Robert, Carolyn Carroll and, Ming Chiou, 1997, Determinants of corporate hedging and
derivatives: a revisit, Journal of Economics and Business, Vol.49, Iss.6, 569-585.
Froot, Kenneth, David Scharfstein, and Jeremy Stein, 1993, Risk management: coordinating corporate
investment and financing policies, The Journal of Finance, Vol. 48, Iss.5, 1629-1658.
Gay, Gerald and, Jouahn Nam, 1998, The underinvestment problem and corporate derivatives use,
Financial Management, Vol.27, Iss.4, 53-69.
Géczy, Christopher, Bernadette Minton and, Catherine Schrand, 1997, Why firms use currency
derivatives?, The Journal of Finance, Vol.52, Iss.4, 1323-1354.
Graham, John and, Daniel Rogers, 2002, Do firms hedge in response to tax incentives?, The Journal of
Finance, Vol.57, Iss.2, 815-839.
Graham, John and, Clifford Smith Jr, 1999, Tax incentives to hedge, The Journal of Finance, Vol. 54,
Iss.6, 2241-2262.
Haushalter, David, 2000, Financing policy, basis risk, and corporate hedging: evidence from oil and
gas producers, Journal of Finance, Vol. 55, Iss.1, 107-152.
Howton, Shawn and, Steven Perfect, 1998, Currency and interest rate derivatives use in US firms,
Financial Management, Vol.27, Iss.4, 111-121.
Jalilvand, Abolhassan, 1999, Why firms use derivatives: evidence from Canada, Canadian Journal of
Administrative Sciences, Vol.16, Iss.3, 213-228.
Judge, Amrit, 2003, Why do firms hedge? A review of the evidence, Working Paper, Middlesex
University.
Knopf, John, Jouahn Nam and, John Thornton Jr, 2002, The volatility and price sensitivities of
managerial stock option portfolios and corporate hedging, The Journal of Finance, Vol.57, Iss.2, 801-
813.
Lel, Ugur, 2004, Currency risk management, corporate governance, and financial market development,
Working Paper, University of Indiana.
Leland, Hayne, 1998, Agency costs, risk management, and capital structure, The Journal of Finance,
Vol.53, Iss.4, 1213-1244.
39

Lin, Chen-Miao and, Stephen Smith, 2003, Hedging, financing and investment decision: a theory and
empirical test, Woking Paper, Georgia State University and Federal Reserve Bank of Atlanta.
Loderer, Claudio and, Karl Pichler, 2000, Firms, do you know your currency risk exposure? Survey
results, Journal of Empirical Finance, Vol.7, Iss.3-4, 317-344.
Mardsen, Alastair and, Andrew Prevost, 2005, Derivatives use, corporate governance, and legislative
change: an empirical analysis of new Zealand listed companies, Journal of Business Finance and
Accounting, Vol.32, Iss.1, 255-295.
Mian, Shehzad, 1996, Evidence on corporate hedging policy, Journal of Financial and Quantitative
Analysis, Vol.31, Iss.3, 419-439.
Morellec, Erwan, and Clifford Jr Smith, 2002, Investment policy, financial policies, and the control of
the agency conflicts, Working Paper No FR 02-16, The Bradley Policy Research Center.
Myers, Stewart, 1977, Determinants of corporate borrowing, Journal of Financial Economics, Vol.5,
Iss.2, 147-175.
Nance, Deana, Clifford Smith Jr and, Charles Smithson, 1993, On the determinants of corporate
hedging, The Journal of Finance, Vol. 48, Iss.1, 267-284.
Nguyen, Hoa and, Robert Faff, 2003, Further evidence on the corporate use of derivatives in Australia:
the case of foreign currency and interest rate instruments, Australian Journal of Management, Vol.28,
Iss.3, 307-317.
Pagano, Marco, Ailsa Roell and, Josef Zechner, 2002, The geography of equity listing: why do
companies list abroad?, The Journal of Finance, Vol.57, Iss.6, 2651-2692.
Petersen, Mitchell and, Ramu Thiagarajan, 2000, Risk measurement and hedging: with and without
derivatives, Financial Management, Vol.29, Iss.4, 5-30.
Rajgopal, Shivaram and Terry Shevlin, 2002, Empirical evidence on the relation between stock option
compensation and risk taking, Journal of Accounting and Economics, Vol.33, Iss.2, 146-171.
Rogers, Daniel, 2002, Does executive portfolio structure affect risk management? CEO risk-taking
incentives and corporate derivatives usage, Journal of Banking and Finance, Vol.26, Iss.2-3, 271-295.
40

Smith, Clifford, and René Stulz, 1985, The Determinants of firms' hedging policies, Journal of
Financial and Quantitative Analysis, Vol.20, Iss.4, 391-405.
Stulz, René, 1984, Optimal hedging policies, Journal of Financial and Quantitative Analysis, Vol.19,
Iss.2, 127-140.
Stulz, René, 1990, Managerial discretion and optimal financing policies, Journal of Financial
Economics, Vol.26, Iss.1, 3-28.
Stulz, René, 1996, Rethinking risk management, Journal of Applied Corporate Finance, Vol.9, Iss.3,
8-24.
Tufano, Peter, 1996, Who manages risk? An empirical examination of risk management practices in the
gold mining industry, The Journal of Finance, Vol. 51, Iss.4, 1097-1137.
Whidbee, David and, Mark Wohar, 1999, Derivative activities and managerial incentives in the
banking industry, Journal of Corporate Finance, Vol.5, Iss.3, 251-276.
41

Table I: Methodologies used to identify hedgers This table summarizes the different approaches used in the papers reviewed to identify hedgers in the population they consider Authors Name Year of
Apparition / Publication
Country How hedgers are identified
Block and Gallagher 1986 US Survey Nance, Smith and Smithson 1993 US Survey Berkman and Bradbury 1996 New Zealand Keyword search Mian 1996 US Keyword search Tufano 1996 US-Canada Private data provided by Ted Reeve Fok, Carroll and Chiou 1997 US Handbook of users of off-balance sheet instruments Géczy, Minton and Schrand 1997 US Keyword search Howton and Perfect 1998 US Keyword search Gay and Nam 1998 US Database of users of derivatives Jalilvand 1999 Canada Survey Haushalter 2000 US Survey Allayannis and Ofek 2001 US Keyword search Rajgopal and Shevlin 2002 US Keyword search Rogers 2002 US Keyword search DaDalt, Gay and Nam 2002 US Database of users of derivatives Knopf, Nam and Thornton 2002 US Database of users of derivatives Graham and Rogers 2002 US Keyword search Dolde and Mishra 2002 US Keyword search Bodnar, Jon and Macrae 2003 US-Netherlands Survey Nguyen and Faff 2003 Australia Keyword search Dionne and Garand 2003 US-Canada Private data provided by Ted Reeve Brown, Crabb and Haushalter
2003 Canada-US Private data provided by Ted Reeve
42

Lin and Smith 2003 US Database of users of derivatives Borokhovich et al. 2004 US Corporate Risk management Handbook Dionne and Triki 2004 US-Canada Private data provided by Ted Reeve Bartram et al. 2004 48 countries Keyword search Lel 2004 34 countries Keyword search Mardsen and Prevost 2005 New Zealand Keyword search Dionne and Triki 2005 US-Canada Private data provided by Ted Reeve
43

Table II: Summary of variables used to measure corporate hedging This table summarizes the different measures of corporate hedging used in the papers reviewed. % stands for percentage, MV for market value, TA for the book value of total assets, All for all categories of risks, CR for commodity risk, FX for foreign exchange risk and, IR for interest rate risk. Authors Name Year of
Apparition /
Publication
Variable(s) used Risk(s) considered
Nance, Smith and Smithson
1993 Dummy=1 if derivatives used All
Tufano 1996 Average delta% over the year CR (gold) Mian 1996 Dummy=1 if derivatives used All, IR, FX Berkman and Bradbury 1996 Fair value of the contract/MV, gross notional value/MV All Fok, Carroll and Chiou 1997 Dummy=1 if derivatives used All Géczy, Minton and Schrand
1997 Dummy=1 if derivatives used FX
Howton and Perfect 1998 Fair value of the contract/MV, gross notional value/MV All, IR, FX Gay and Nam 1998 Gross notional value /TA All Jalilvand 1999 Dummy=1 if derivatives used All Whidbee and Wohar 1999 Dummy=1 if derivatives used FX or IR Haushalter 2000 % of production hedged, dummy variable=1 if derivatives used CR (oil and gas) Allayannis and Ofek 2001 Gross notional value /TA, dummy variable=1 if derivatives used FX Knopf, Nam and Thornton
2002 Gross notional value / TA All
Dolde and Mishra 2002 Gross notional value/sales, dummy=1 if derivatives used FX Rogers 2002 Net notional value/TA IR + FX Graham and Rogers 2002 Net notional value/TA IR + FX Rajgopal and Shevlin 2002 Quantity of reserves hedged/quantity of proven reserves held by the firm CR (oil and gas) Lin and Smith 2003 Dummy=1 if derivatives used All Dionne and Garand 2003 Delta% at the quarter end CR (gold) Nguyen and Faff 2003 Gross notional value/MV, dummy variable=1 if derivatives used IR, FX Brown, Crabb and Haushalter
2003 The quarter to quarter change in the delta percentage CR (gold)
44

Bartram et al. 2004 Dummy =1 if derivatives used All, FX, IR, CR Lel 2004 Dummy=1 if derivatives used, gross notional value /TA FX risk Dionne and Triki 2004 Delta% at the quarter end CR (gold) Borokhovich et al. 2004 Gross notional value/sales IR Dionne and Triki 2005 Delta% at the quarter end CR (gold) Mardsen and Prevost 2005 Fair value of the contract/MV, gross notional value/MV, dummy
variable=1 if derivatives used All
45
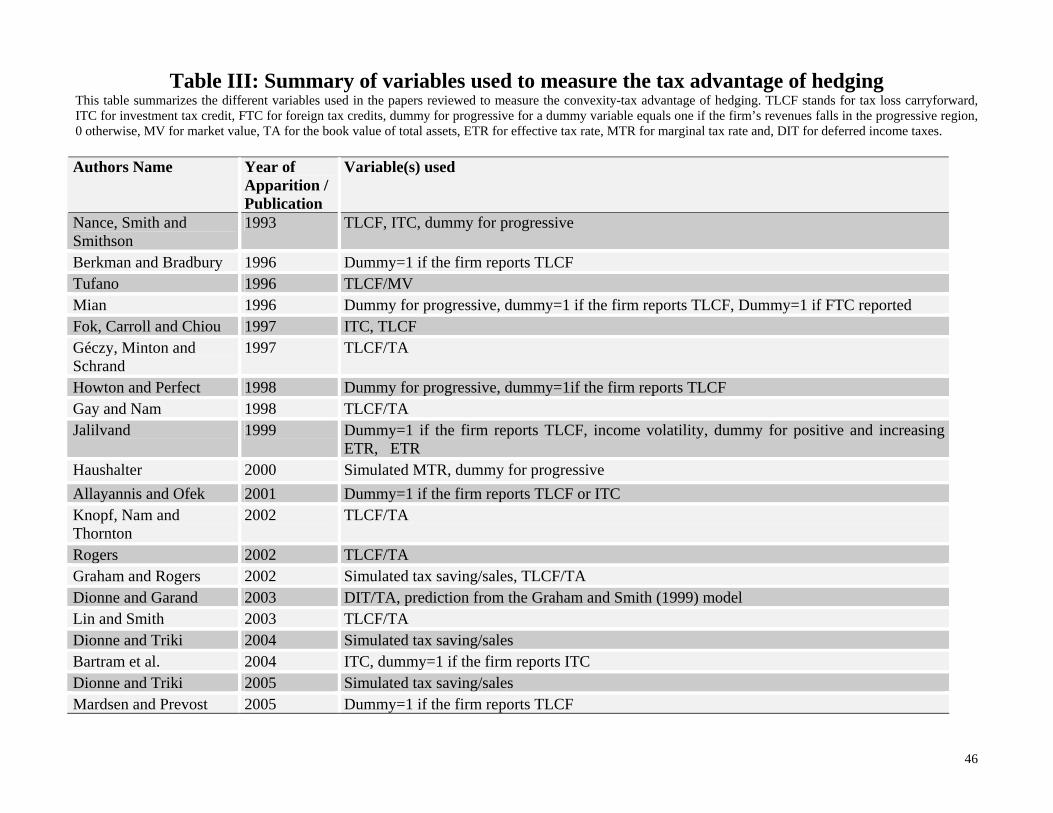
Table III: Summary of variables used to measure the tax advantage of hedging This table summarizes the different variables used in the papers reviewed to measure the convexity-tax advantage of hedging. TLCF stands for tax loss carryforward, ITC for investment tax credit, FTC for foreign tax credits, dummy for progressive for a dummy variable equals one if the firm’s revenues falls in the progressive region, 0 otherwise, MV for market value, TA for the book value of total assets, ETR for effective tax rate, MTR for marginal tax rate and, DIT for deferred income taxes. Authors Name Year of
Apparition / Publication
Variable(s) used
Nance, Smith and Smithson
1993 TLCF, ITC, dummy for progressive
Berkman and Bradbury 1996 Dummy=1 if the firm reports TLCF Tufano 1996 TLCF/MV Mian 1996 Dummy for progressive, dummy=1 if the firm reports TLCF, Dummy=1 if FTC reported Fok, Carroll and Chiou 1997 ITC, TLCF Géczy, Minton and Schrand
1997 TLCF/TA
Howton and Perfect 1998 Dummy for progressive, dummy=1if the firm reports TLCF Gay and Nam 1998 TLCF/TA Jalilvand 1999 Dummy=1 if the firm reports TLCF, income volatility, dummy for positive and increasing
ETR, ETR Haushalter 2000 Simulated MTR, dummy for progressive Allayannis and Ofek 2001 Dummy=1 if the firm reports TLCF or ITC Knopf, Nam and Thornton
2002 TLCF/TA
Rogers 2002 TLCF/TA Graham and Rogers 2002 Simulated tax saving/sales, TLCF/TA Dionne and Garand 2003 DIT/TA, prediction from the Graham and Smith (1999) model Lin and Smith 2003 TLCF/TA Dionne and Triki 2004 Simulated tax saving/sales Bartram et al. 2004 ITC, dummy=1 if the firm reports ITC Dionne and Triki 2005 Simulated tax saving/sales Mardsen and Prevost 2005 Dummy=1 if the firm reports TLCF
46
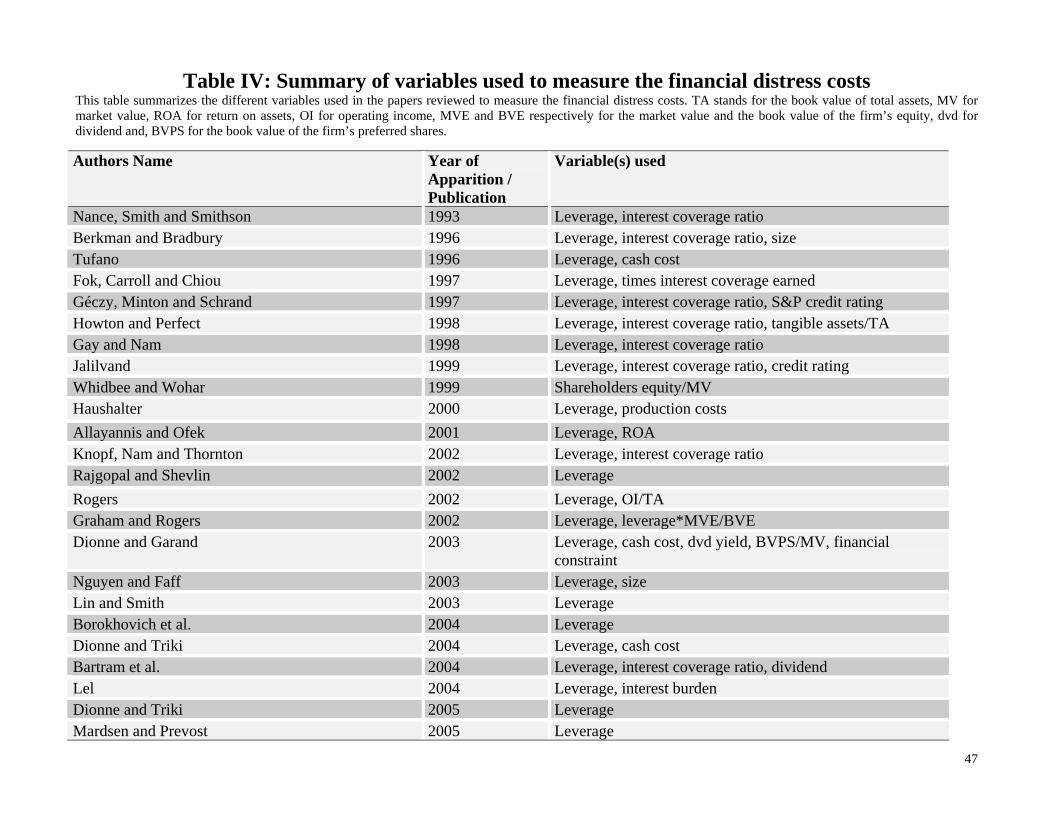
Table IV: Summary of variables used to measure the financial distress costs This table summarizes the different variables used in the papers reviewed to measure the financial distress costs. TA stands for the book value of total assets, MV for market value, ROA for return on assets, OI for operating income, MVE and BVE respectively for the market value and the book value of the firm’s equity, dvd for dividend and, BVPS for the book value of the firm’s preferred shares.
Authors Name Year of Apparition / Publication
Variable(s) used
Nance, Smith and Smithson 1993 Leverage, interest coverage ratio Berkman and Bradbury 1996 Leverage, interest coverage ratio, size Tufano 1996 Leverage, cash cost Fok, Carroll and Chiou 1997 Leverage, times interest coverage earned Géczy, Minton and Schrand 1997 Leverage, interest coverage ratio, S&P credit rating Howton and Perfect 1998 Leverage, interest coverage ratio, tangible assets/TA Gay and Nam 1998 Leverage, interest coverage ratio Jalilvand 1999 Leverage, interest coverage ratio, credit rating Whidbee and Wohar 1999 Shareholders equity/MV Haushalter 2000 Leverage, production costs Allayannis and Ofek 2001 Leverage, ROA Knopf, Nam and Thornton 2002 Leverage, interest coverage ratio Rajgopal and Shevlin 2002 Leverage Rogers 2002 Leverage, OI/TA Graham and Rogers 2002 Leverage, leverage*MVE/BVE Dionne and Garand 2003 Leverage, cash cost, dvd yield, BVPS/MV, financial
constraint Nguyen and Faff 2003 Leverage, size Lin and Smith 2003 Leverage Borokhovich et al. 2004 Leverage Dionne and Triki 2004 Leverage, cash cost Bartram et al. 2004 Leverage, interest coverage ratio, dividend Lel 2004 Leverage, interest burden Dionne and Triki 2005 Leverage Mardsen and Prevost 2005 Leverage
47

Table V: Summary of variables used to measure the underinvestment costs This table summarizes the different variables used in the papers reviewed to measure the underinvestment costs. R&D stands for research and development expenditures, B/M for the book to market ratio, CF for the value of the firm’s cash flows, MV for market value, M/B for the market to book ratio, PPE for capital expenditures for property, plant and equipment, CAR for cumulative abnormal returns, dvd for dividend, TA for the book value of total assets and, IOS for investment opportunities set score. Authors Name Year of
Apparition / Publication
Variable(s) used Control for the FSS argument
Nance, Smith and Smithson 1993 R&D/MV, B/M Berkman and Bradbury 1996 Earnings/price, Asset growth/CF Tufano 1996 Explorations expenditures/MV, acquisition
expenditures/MV
Mian 1996 M/B Fok, Carroll and Chiou 1997 R&D/MV, B/M Géczy, Minton and Schrand 1997 R&D/sales, PPE/MV, B/M Yes Gay and Nam 1998 R&D/MV, B/M, Tobin's Q, price/earnings, market
adjusted CAR Yes
Howton and Perfect 1998 R&D/sales, CF/TA Whidbee and Wohar 1999 Dvd/MV Jalilvand 1999 M/B, dvd yield Haushalter 2000 Investment expenditures/MV Yes Allayannis and Ofek 2001 R&D/sales, M/B, dvd yield Graham and Rogers 2002 B/M, R&D/TA Rogers 2002 B/M, R&D/TA, capital expenditures/TA Rajgopal and Shevlin 2002 IOS (factor analysis M/B, explorations costs) Knopf, Nam and Thornton 2002 R&D/TA, M/B Brown, Crabb and Haushalter 2003 Change in the M/B Dionne and Garand 2003 Explorations expenditures/MV, acquisition
expenditures/MV
Nguyen and Faff 2003 M/B, liquidity, current ratio Lin and Smith 2003 R&D/TA Lel 2004 B/M Yes
48

Dionne and Triki 2004 Explorations expenditures/MV, acquisition expenditures/MV
Bartram et al. 2004 M/B Yes Borokhovich et al. 2004 quick ratio, B/M Dionne and Triki 2005 Exploration expenditures/VM
49

Table VI: Summary of variables used to measure managerial risk aversion This table summarizes the different variables used in the papers reviewed to measure managerial risk aversion related to stock and stock options compensations. % stands for percentage, Ln for the natural logarithm operator, CS for common shares, D for directors, O for officers, D&O for directors and officers, MV for market value and, # for number. Authors Name Year of
Apparition / Publication
Variables proxying incentives from
stock compensation
Variables proxying incentives from options
compensation
Berkman and Bradbury 1996 % CS held by D Tufano 1996 Ln(MV D&O CS) # D&O options Géczy, Minton and Schrand
1997 Ln(MV D&O CS) Ln(MV D&O CS obtainable upon exercise)
Gay and Nam 1998 Ln(MV D&O CS) # D&O options Jalilvand 1999 % CS held by top 5 O Haushalter 2000 Ln(MV D&O CS ), % CS held by
D&O # D&O options, # options per D&O, # options per O, MV CEO options/CEO salary + bonus
Allayannis and Ofek 2001 % CS held by the CEO # CEO options/CS outstanding Graham and Rogers 2002 Delta/ (CEO salary + bonus) Vega/CEO salary + bonus Knopf, Nam and Thornton
2002 Ln(MV CEO CS), Ln(Delta) Ln(# CEO options), Ln(MV of CEO CS obtainable upon exercise), Ln(Vega)
Rajgopal and Shevlin 2002 Vega Rogers 2002 Ln(MV CEO CS) Vega/Delta, # CEO options Nguyen and Faff 2003 % CS held by D&O # D&O options/CS outstanding Bartram et al. 2004 Dummy =1 if stock options are reported in the proxy
statement Borokhovich et al. 2004 # top 5 O options/total salary + bonus Dionne and Triki 2004 MV D&O CS # D&O options Dionne and Triki 2005 # CEO CS MV of CEO options Mardsen and Prevost 2005 % CS held by D&O
50

Table VII: Summary of variables used to measure information asymmetry This table summarizes the different variables used in the papers reviewed to measure the extent of information asymmetry about the firm. % stands for percentage, CS for common shares, # for number, Ln for the natural logarithm operator and, TA for the book value of total assets. Authors Name Year of
Apparition / Publication
Variable (s) used
Géczy, Minton and Schrand
1997 % CS held by institutions, # of analysts following the firm
Haushalter 2000 Dummy equal=1 if the firm's debt is rated by S&P Graham and Rogers 2002 % CS held by institutions Rogers 2002 % CS held by institutions, Ln(TA) Lin and Smith 2003 Analysts forecast accuracy Dionne and Triki 2004 % CS held by institutions Dionne and Triki 2005 % CS held by institutions
51

Table VIII: Summary of variables used to measure concentration of the ownership structure This table summarizes the different variables used in the papers reviewed to measure the firm’s ownership concentration. % stands for percentage, CS for common shares, # for number, Ln for the natural logarithm operator and, MV for market value. Authors Name Year of
Apparition / Publication
Variable (s) used
Tufano 1996 % CS held by non managerial blocks (>10%) Fok, Carroll and Chiou 1997 % CS held by insiders, % CS held by institutions Whidbee and Wohar 1999 % CS held by CEO, % CS held by outsiders, % CS held by institutions Haushalter 2000 # outside blockholders (>5%) Knopf, Nam and Thornton
2002 % CS held by outsiders (>5%)
Borokhovich et al. 2004 % votes held by insiders, % votes held by blockholders(>5%),% votes held by banks Lel 2004 Dummy=1 if inside blockholders (>10%), dummy=1 if outside blockholders,
dummy=1 if institutional blockholding, wedge, % managerial shareholding, Ln(MV managerial shareholdings)
Mardsen and Prevost 2005 % CS held by blockholders (>5%)
52

Table IX: Summary of variables used to measure the board characteristics This table summarizes the different variables used in the papers reviewed to measure the board characteristics, % stands for percentage and, COB stands for chief of the board. Authors Name Year of
Apparition / Publication
Variable (s) used
Whidbee and Wohar 1999 % outsiders in the board Dionne and Triki 2004 % outsiders in the board, dummy COB=CEO Lel 2004 Index in the spirit of Gompers et al (2003) Borokhovich et al. 2004 Outsiders-insiders /board size, board size, dummy=1 if bank executive in the board Mardsen and Prevost 2005 % outsiders in the board, outside directors*dummy if Tobin’s Q > sample median Dionne and Triki 2005 Too many variables to fit in a table
53

Table X: Summary of variables used to measure substitutes to hedging with derivatives This table summarizes the different variables used in the papers reviewed to measure substitutes to hedging with derivatives. BVCD stands for the book value of convertible debt, BVPS for the book value of preferred shares, dvd for dividend, Ln for the natural logarithm operator, MV for market value, TA for the book value of total assets, CD for convertible debt and, FDD for foreign denominated debt.
Authors Name Year of
Apparition / Publication
Variable (s) used
Nance, Smith and Smithson 1993 BVCD/MV, BVPS/MV, current ratio, dvd yield Tufano 1996 diversification, quick ratio Berkman and Bradbury 1996 Ln(quick ratio), dvd payout ratio, quasi equity Fok, Carroll and Chiou 1997 BVCD/MV, BVPS/MV, current ratio, dvd yield, dummy=1 if the firm is defined
as a multinational corporation Géczy, Minton and Schrand 1997 BVCD/MV, BVPS/MV, quick ratio, dvd payout ratio Gay and Nam 1998 BVCD/MV, BVPS/MV Howton and Perfect 1998 Quick ratio, BVPS/TA, BVCD/TA Jalilvand 1999 Quick ratio, dvd payout, dummy=1 if the firm uses CD Haushalter 2000 Dvd payout ratio, diversification, cash holdings Rajgopal and Shevlin 2002 Dvd payout, quick ratio Knopf, Nam and Thornton 2002 Dvd yield, BVPS/TA Graham and Rogers 2002 Dvd yield, quick ratio Nguyen and Faff 2003 Dvd yield Dionne and Garand 2003 Quick ratio Lin and Smith 2003 Quick ratio Lel 2004 Dvd dummy, BVCD/TA, FDD ratio, diversification Dionne and Triki 2004 Quick ratio Bartram et al. 2004 Quick ratio, dummy=1 if the firm issued FDD Mardsen and Prevost 2005 Ln(current ratio), dvd yield
54

Table XI: Summary of variables used to measure the firm’s exposure This table summarizes the different variables used in the papers reviewed to measure the firm’s exposure. MV stands for market value, FX for foreign exchange risk, FI for foreign income, FS for foreign sales, FA for foreign assets and, TA for the book value of total assets. Authors Name Year of
Apparition / Publication
Variable (s) used
Fok, Carroll and Chiou 1997 Unrelated diversification Géczy, Minton and Schrand 1997 Pre-tax FI/sales, FS/sales, FA/TA Howton and Perfect 1998 Dummy=1 if the firm reports FI Jalilvand 1999 Dummy=1 if the firm reports foreign operations, dummy=1 if the firm operates
in a high risk exposure industry Whidbee and Wohar 1999 The absolute value of 12-month GAP/MV, commercial and industrial loans/MV,
unused commitments/MV Allayannis and Ofek 2001 FS/sales, total trade/total production Dolde and Mishra 2002 FX exposure Graham and Rogers 2002 Floating debt/total debt, FS/sales Rajgopal and Shevlin 2002 Oil and gas sales/sales Brown, Crabb and Haushalter 2003 Change in the spot gold price, change in the implied volatility of the gold futures
contract Bartram et al. 2004 Dummy =1 if the firm reports FA, FI or FS
Lel 2004 FS/sales Mardsen and Prevost 2005 Interest rate volatility, exchange rate volatility
55

Table XII: Summary of variables used to measure size This table summarizes the different variables used in the papers reviewed to measure the firm’s size. MV stands for market value, TA for the book value of total assets, Ln for the natural logarithm operator and, MVE for the market value of equity. Authors Name Year of Apparition /
Publication Variable (s) used
Nance, Smith and Smithson 1993 MV Mian 1996 MV Tufano 1996 MV, reserves Fok, Carroll and Chiou 1997 MV, TA, sales Géczy, Minton and Schrand 1997 MV Gay and Nam 1998 Ln(MV) Howton and Perfect 1998 MVE Jalilvand 1999 Ln(MV) Whidbee and Wohar 1999 Ln(MV) Haushalter 2000 MV Allayannis and Ofek 2001 Ln(TA) Graham and Rogers 2002 Ln(TA) Knopf, Nam and Thornton 2002 Ln(MV) Rajgopal and Shevlin 2002 Ln(TA) Brown, Crabb and Haushalter 2003 Change in TA Dionne and Garand 2003 Reserves Lin and Smith 2003 Ln(TA) Bartram et al. 2004 Ln(MV) Borokhovich et al. 2004 Ln(MVE) Dionne and Triki 2004 Ln(sales) Lel 2004 Ln(TA) Mardsen and Prevost 2005 Ln(MV)
56


