
Automatic Annotation of Actigraphy Data for Sleep Disorders Diagnosis Purposes

Research on Automatic Diagnosis Based on ANN Well Conditions Fault
ZhengJia Wu1,a, ShaoXiong Huang 2,b and YueSheng Luo3,c
1,2 Mechanical and Material College of Three Gorges University
3 Kunming Survey and Design Institute of China Hydropower Consulting Group
[email protected], [email protected], c [email protected]
Keywords: Pump Indicator Diagram; Finite-Difference; Neural Network; Fault Diagnosis Abstract:This thesis combines the extraction of geometric characteristics and the neural network, which supplies a method that can define the operating conditions relatively accurately through the diagram feature parameter of the rod pumping system pump and avoids setting up and solving complex nonlinear dynamic equation while also achieving the automatic diagnosis functions of the malfunctions of oil wells. According to the analysis of the error results, we identify the accuracy and effectiveness of this model. Besides, we test the neural network which we have just set up by using the real-time data, and the test results indicate the validity of the method in this thesis.
Introduction
In view of the existing low degree of automation fault diagnosis of oil wells in oil industry,we need an effective automatic diagnosis technology to improve the accuracy of the sucker rod pumping oil system failure diagnosis, which is of great significance to avoid the blindness of down hole operation and to keep the normal oilfield production system. The BP neural network is one of the artificial neural network models. It uses error back propagation algorithm or its change form of network model. It is mainly used for function approximation, pattern recognition, classification, and data compression and data mining. It is one of the most successful neural network model used in equipment fault diagnosis [1].
This paper used the finite difference algorithm, for pump indicator diagrams; established automatic diagnosis model of fault type which determines the working condition of oil well through geometric characteristic parameters of the pump based on neural network.
Working condition of oil well real-time signal feature extraction
Real-time suspension point indicator diagram Suspension point indicator diagram refers to a sucker rod pumping oil system of the ground of
the polished rod displacement and load of closed graph. As shown in figure 1, it is a real-time suspension point indicator diagram of a well. Graphic on the upper part refers to the up stroke of the pumping system. The second half of the graphics refers to the down stroke of the pumping system. According to a senior worker’s judgment, the indicator diagram illustrates the gas breakdown of the well.
It is more convenient to acquisition polished rod data because the polished rod is on the ground part of the pumping system. People traditionally think they can analyze the working conditions of down-hole pump with ground indicator diagram, but in fact it is very difficult to make accurate judgment with ground indicator diagram alone, and sometimes it can not judge down-hole pump working condition. This is because the well depth ranges from several hundred to several thousand meters. In the process of passing to the ground, the plunger load changes by thousands of meters of sucker rod string. There is a big difference between the load displacement diagram of down-hole
International Conference on Information Science and Computer Applications (ISCA 2013)
© 2013. The authors - Published by Atlantis Press 33

pump and the ground indicator diagram because of the elastic deformation of sucker rod string and liquid column, inertia force, etc factors [2]. So people have been trying to get a diagram that can effectively reflect the state of the pump indicator diagram, underground pump indicator diagrams. Due to the finite difference method is a kind of mature and effective way to solve the approximate solution of ordinary differential equations [3]. It close to a rectangular wave better, thus, won't make signal distortion. So, this article will use the finite difference method to solve the suspension point Gibbs wave equation to get pump indicator diagrams scattered point data.
Figure 1: Indicator Diagram of Suspension Point
Finite difference method to extract the pump indicator diagrams scattered point data For suspension point Gibbs wave equation of sucker rod pumping system:
2 22
2 2
( , ) ( , ) ( , )u x t u x t u x ta c
t x t
(1)
Use Newton forward difference formula and Newton central difference formula to get the derivative type are as follows:
, 1 ,,
2, 1 , , 1
,2 2
21, , 1,
,2 2
( )
2( )
2( )
i j i ji j
i j i j i ji j
i j i j i ji j
u uu
t xu u uu
t xu u uu
x x
(2)
According to Hooke law, the displacement transfer model and load transfer model in the finite difference algorithm are as follows:
Displacement transfer model: 1,, 1,
i ji j i j
F xu u
EA
(3)
Load transfer model: , 1,,
i j i ji j
u uF EA c A x
x
(4)
34
In it, E is rod elastic modulus, A is shaft cross-sectional area, c is viscous damping coefficient, is stem density.
When using this algorithm, the data of boundary conditions is the ground indicator diagram scatter data. We calculate the number of cycles according to the size of rod string combination. For example, the rod string is composed of two kinds of different bar diameter rod. The length of the
two kinds of rods respectively are 1L and 2L , the rod material elastic modulus 1E and 2E ,
cross-sectional area 1A and 2A .
So, we should use the method introduced before to calculate the equivalent value E of the modulus of elasticity in the junction. If the rod materials are the same, we needn’t to calculate the equivalent value. Before solving the equations, first calculate pole unit step at all levels of the total integral
value equation 1I and 2I : 1 1int( / )I L x ; 2 2int( / )I L x ;In it, int means integer; x means
the sampling step.
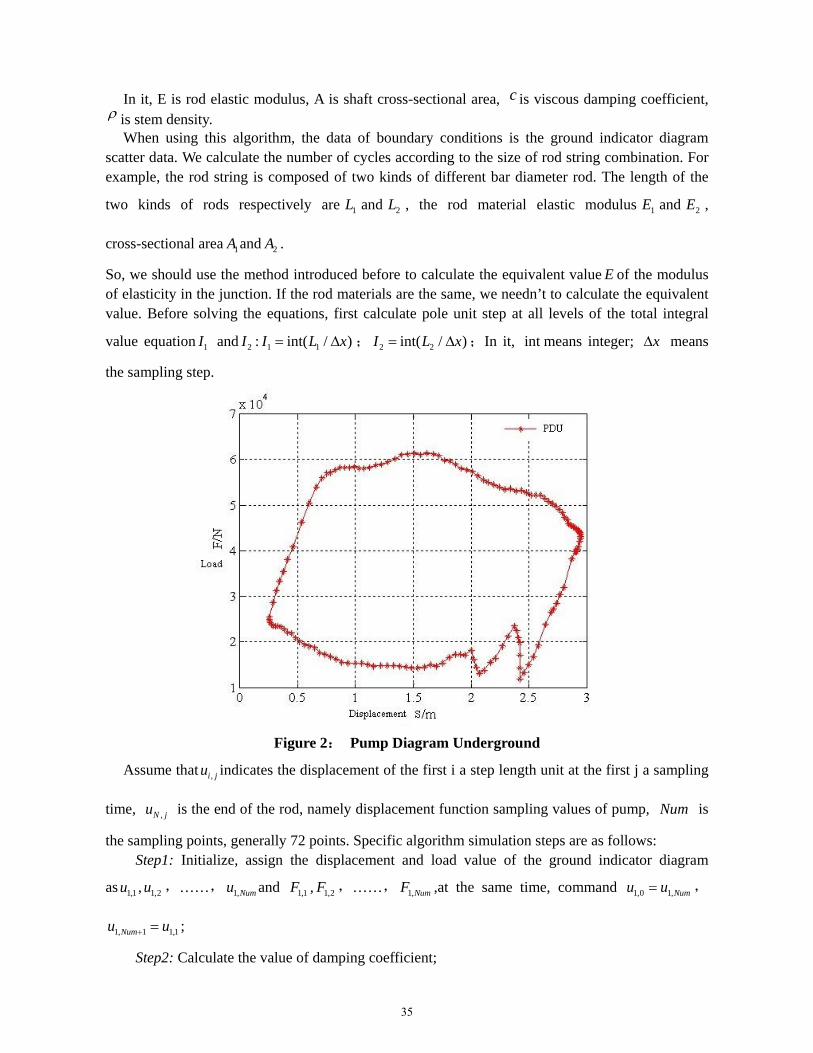
Figure 2: Pump Diagram Underground
Assume that ,i ju indicates the displacement of the first i a step length unit at the first j a sampling
time, ,N ju is the end of the rod, namely displacement function sampling values of pump, Num is
the sampling points, generally 72 points. Specific algorithm simulation steps are as follows: Step1: Initialize, assign the displacement and load value of the ground indicator diagram
as 1,1u , 1,2u ,……, 1,Numu and 1,1F , 1,2F ,……, 1,NumF ,at the same time, command 1,0 1,Numu u ,
1, 1 1,1Numu u ;
Step2: Calculate the value of damping coefficient;
35

Step3: According to the formula 1,2, 1,
jj j
r r
F xu u
E A
, calculate 2, ju , command 2,0 2,Numu u ,
2, 1 2,1Numu u ;
Step4: Calculate ,i ju and ,i jF of 3i to 1I , when 1i I , ,i ju and ,i jF are the displacement and
load values of the first level rod’s end; Step5: Make the displacement and load values of the first level rod’s end as the initial value of
the second level rod. Do as step2 and step3, until the end of the last level, we can get the displacement and load values of the pump;
Step6: According to calculated discrete values, draw out the pump indicator diagrams. (figure2).
The characteristic parameters extraction of pump indicator diagrams Intuitive geometric features can effectively describe the characteristics of pump indicator
diagrams [4]. The geometric features of graphics that can be extracted are: pump indicator diagrams enclosed area, closed curve perimeter, closed curve and the area of the image edge of four angles, as well as the closed curve in the center of mass.
As shown in table 1 they are no steel pump indicator diagrams geometric parameters. Specific calculation steps are as follows:
① Normalize the displacement load data of the pump indicator diagrams, get the coordinates of the centroid of closed figures;
②Determine the open and close point of the traveling valve and fixed valve according to pump indicator diagrams the slope threshold method, calculate the area of the four angles surrounded by closed curve and the image edge;
③Calculation of the closed curve by the scattered data area and perimeter. Table 1: geometric feature of pump diagram
Area of the closed Curve
Perimeter of Curve
Abscissa of Center
Ordinate of Center
Area of the upper left
Corner
Area of the upper right
Corner
Area of the
bottom right
Corner
Area of the
lower left
Corner
0.726 3.184 0.545 0.465 0.059 0.106 0.051 0.058
The establishment of signal characteristics of the standard fault library
According to references [5], a total of 18 kinds of faults are extracted in this paper, as shown in table 2, and standard dimensionless pumping diagram graphics are omitted in this paper. With the help of digital graphic processing software Engauge Digizer, import the schematic pumping diagram provided in the references into the software, extracting the discrete data, finally calculate the geometrical characteristics parameters of the 18 kinds of standard fault pump indicator diagrams such as table 3.
36

Table 2: 18 kinds of Fault
Number Fault types Number Fault types
1 Provide liquid less than 10 Pump on touch
2 Oil is thick 11 Under the pump to touch
3 The well sand production 12 Wax precipitation
4 Gas effect 13 Sucker rod break off
5 Airlock 14 Even with drawstring spray
6 Fixed valve leakage 15 Leakage of tubing
7 Travelling valve leakage 16 The piston sticking
8 Double valve leakage at the same time 17 Liquid hammer
9 Plunger out working barrel 18 Stroke loss effect
Table 3: Pump Diagram Characteristics of Standard Fault
Number
Area of the
closed Curve
Perimeter of Curve
Abscissa of Center
Ordinate of Center
Area of the upper
left Corner
Area of the upper
right Corner
Area of the
bottom
right
Corner
Area of the
lower left
Corner
1 0.38 3.45 0.44 0.64 0.06 0.07 0.47 0.02
2 0.85 3.48 0.5 0.53 0.03 0.03 0.05 0.05
3 0.71 4.66 0.5 0.49 0.11 0.03 0.13 0.03
4 0.52 3.35 0.46 0.62 0.08 0.01 0.37 0.03
5 0.33 3.3 0.45 0.64 0.11 0.02 0.53 0
6 0.71 3.25 0.49 0.57 0.03 0.04 0.14 0.08
7 0.79 3.61 0.51 0.47 0.08 0.05 0 0.07
8 0.68 3.01 0.5 0.47 0.08 0.11 0.04 0.08
9 0.69 3.44 0.48 0.41 0.05 0.21 0.04 0.01
10 0.7 3.69 0.48 0.53 0.12 0 0.16 0.02
11 0.66 3.62 0.49 0.49 0.13 0.02 0.19 0
12 0.79 3.76 0.49 0.58 0.04 0.05 0.06 0.06
13 0.62 4.46 0.49 0.52 0.14 0.02 0.03 0.18
14 0.66 3.42 0.49 0.49 0.15 0.04 0.14 0.01
15 0.72 3.47 0.48 0.49 0.03 0.13 0.03 0.1
16 0.11 3.5 0.63 0.28 0.8 0 0.09 0
17 0.6 3.75 0.47 0.54 0.05 0.1 0.25 0
18 0.56 3.56 0.49 0.49 0.13 0.1 0.12 0.09
The establishment of the neural network model
Neural network fault diagnosis model based on BP The selection and the right preprocessing of the input vector of the neural network are as
important as the correct classification of samples. We should choose the information that can the most reflect the differences between different samples of working condition as input vector of the network. This paper extracted geometric features from 18 different fault types of no steel pump
37

indicator diagrams and identified them as pump indicator diagrams, thus made them as the input vector of the network.
Generally considered, priority of three layers BP network should be given when designing. Set the Kolmogorov theorem based on neural network theory, the number of hidden layer node can
refer to formula: 0.5( )m p q a , in which m means hidden node number, p means input layer
node number, q means output layer node number, a means constant between 1-10.The number of
hidden node in this article is 15. Output layer is the target variable, and pump in the gas state pump power figure characteristics is the output layer in this article, for example, the [0 0 0 1 0] means pump air failure inside.
This article uses the tansig function as hidden layer transfer function, the purelin function as output layer transfer function. For training function, adaptive learning vector algorithm can adaptively adjust to increase the stability, improve the speed and accuracy, so this paper selects the momentum and adaptive gradient descending traingdx training function.
As shown in figure 4, it is the neural network model structure of which the fault types are determined by the geometric features of standard fault library pump indicator diagrams. The neural network model structure including input (input - layer) pump power figure eight geometric parameters, the hidden layer (hide - layer) or internal structure, the output (output layer) which fault type.
Figure 4: Automatic Diagnosis Model
Results and analysis of automatic diagnosis model On the basis of the above model, the use of Matlab2010 software algorithm program is compiled,
using the training data to the network model for training and learning. Figure 5 is the simulation error figure of the network model which is obtained by using Matlab. The figure 5 shows that all the relative error between the predicted and the measured values is within 5. This indicates that fault diagnosis types of samples determined by this model is very close to the actual fault type results, the prediction precision is higher, so it can be used as the basis for oil well real-time condition automatic fault diagnosis.
38

Figure 5: Network Testing Error Chart
Use the above model, convert the ground indicator diagram provide in the instance into pump indicator diagrams and diagnose the failure types, then come to the conclusion that the well failure belongs to gas impact failure. It further shows that the model has an accurate diagnosis function of the fault type, a function of automatic diagnosis of fault type.
Conclusion
Finite difference algorithm is a kind of algorithms that can very solve differential equations effectively, at the same time, the neural network with its strong ability of pattern recognition, has been more and more widely used in fault diagnosis. This article uses the finite difference algorithm to solve the Gibbs wave equation of sucker rod pumping system and ensures that the distortion of the signal transmission; uses the geometric characteristics of dimensionless pump indicator diagrams as the input of neural network, the fault types as network output, then establishes a fault type automatic diagnosis network model. Using the measured data to test the established neural network, the test results show that this method has higher calculation accuracy and use value.
References
[1] Gu Lichen,Zhang Youyun, Qiu Damou. Research on Sensor Failure Detection and Diagnosis Based on Neural Network. Journal of Xi’an Jiao Tong University. 2002(09)
2 Ji Ang. Fault Diagnosis System of Sucker Rod Pump Wells Based on the Analysis of Pump Indicator Diagrams. Dalian university of technology, 2011
[3] Jia Hongyan. Application of Numerical Solution of Ordinary Differential Equations in the Modeling. Xin Xiang College Journal (Natural Science Edition). 2009 (6)
[4] Yu Guoan, Peng Yong. Automatic Fault Diagnosis of Pumping Unit Downhole Based on Pattern Recognition Techniques. Journal of Xi'an Petroleum Institute, 1990 (03)
[5] Yang Yang. The Remote Self-Diagnostic System of Pumping Unit based on Analysis of Indicator Card. Dalian university of technology, 2008
39


![Automatic Computer Aided Diagnosis of Breast Cancer in ...€¦ · Automatic Computer Aided Diagnosis of Breast Cancer in Dynamic Contrast Enhanced Magnetic ... [38]. Research into](https://static.fdocuments.in/doc/165x107/5fed569fc69d0e2eda06e93e/automatic-computer-aided-diagnosis-of-breast-cancer-in-automatic-computer-aided.jpg)