Research October 2014 - cfib-fcei.ca · CFIB BC Municipal Spending Watch 2014 2 Municipalities are...
25
www.cfib.ca Research October 2014 BC Municipal Spending Watch 2014 7th Edition: Trends in Operating Spending, 2000-2012 Edward Ketcheson, Public Policy and Entrepreneurship Intern A BC family of four could have saved, on average, $8,356 in municipal taxes over the past 12 years if municipal councils had kept their operating spending to the rate of inflation and population growth. Although recent years have seen a noticeable slowdown in municipal operating spending growth, this slowdown is overshadowed by the 55 per cent increase in overall operating spending that has occurred over the last dozen years, representing $8.5 billion in excess spending. Overspending of this magnitude is fiscally unsustainable. Introduction The BC Municipal Spending Watch analyzes the sustainability of municipal finances by ranking municipalities based on their operating costs and their rate of operating spending growth over the past 12 years. From 2000 to 2012 (the latest data available), BC’s population grew by 15 per cent while inflation-adjusted municipal operating spending increased by 55 per cent, or more than three and a half times population growth (see Figure 1). Figure 1 BC Municipal Operating Spending Growth (Adjusted for Inflation) and Population Growth, 2000–2012 Source: Ministry of Community, Sport and Cultural Development; BC Stats, Population Estimates; BC Stats, CPI. 55% 15% 0% 10% 20% 30% 40% 50% 60% 2000 2002 2004 2006 2008 2010 2012 Operating Spending Growth (Excluding Capital Expenditures and adjusted for inflation) Population Growth
-
Upload
nguyentuyen -
Category
Documents
-
view
214 -
download
0
Transcript of Research October 2014 - cfib-fcei.ca · CFIB BC Municipal Spending Watch 2014 2 Municipalities are...

www.cfib.ca
Research October 2014
BC Municipal Spending Watch 2014 7th Edition: Trends in Operating Spending, 2000-2012 Edward Ketcheson, Public Policy and Entrepreneurship Intern
A BC family of four could have saved, on average, $8,356 in municipal taxes over the past 12 years if municipal councils had kept their operating spending to the rate of inflation and population growth. Although recent years have seen a noticeable slowdown in municipal operating spending growth, this slowdown is overshadowed by the 55 per cent increase in overall operating spending that has occurred over the last dozen years, representing $8.5 billion in excess spending. Overspending of this magnitude is fiscally unsustainable.
Introduction
The BC Municipal Spending Watch analyzes the sustainability of municipal finances by ranking municipalities based on their operating costs and their rate of operating spending growth over the past 12 years. From 2000 to 2012 (the latest data available), BC’s population grew by 15 per cent while inflation-adjusted municipal operating spending increased by 55 per cent, or more than three and a half times population growth (see Figure 1).
Figure 1 BC Municipal Operating Spending Growth (Adjusted for Inflation) and Population Growth, 2000–2012
Source: Ministry of Community, Sport and Cultural Development; BC Stats, Population Estimates; BC Stats, CPI.
55%
15%
0%
10%
20%
30%
40%
50%
60%
2000 2002 2004 2006 2008 2010 2012
Operating Spending Growth (Excluding Capital Expenditures and adjusted for inflation)
Population Growth

CFIB BC Municipal Spending Watch 2014
www.cfib.ca
2 2
Municipalities are unable to run a budget deficit, which means that any operating spending growth beyond population and inflation are likely paid for by raising taxes and/or fees on residents and businesses. Past research done by CFIB has shown that increases in taxes and fees are often transferred disproportionally to small businesses1
.
Increasing the taxes and/or fees on small businesses has negative consequences for the entire province. According to government statistics, small businesses account for more than half of BC’s private sector employment and more than a quarter of its economic output2
. Increasing the tax burden on small businesses makes it more difficult for them to operate, negatively impacting BC’s economy. Thus, unsustainable increases in municipal spending are unfavourable for small businesses as well as for residents.
This is why CFIB is advocating for responsible spending from municipal governments. Small business owners have expressed through CFIB surveys that increases in municipal spending should be kept to the rate of inflation and population growth3
. CFIB recommends that municipalities keep spending increases to this level.
1 Kastelen, Kimball. 2013. The BC Municipal Property Tax Gap Report. 2 Government of BC, Small Business Profile 2013. 3 Armstrong, Matthew and Jones, Laura.British Columbia Municipal Spending Watch.
Outline Section 1: Introduction (pg 1-2) Section 2: Key Findings (pg 3-6) Section 3: Municipal Revenue Trends, 2000-2012 (pg 7-8) Section 4: Municipal Spending Trends, 2000-2012 (pg 8-9) Section 5: Municipal Spending Trends by Region (pg 10-15) Section 6: Conclusions and Recommendations (pg 16) Section 7: Sources (pg 17) Section 8: Appendices (pg 18-25)

CFIB BC Municipal Spending Watch 2014
www.cfib.ca
3 3
Key Findings
Highlights
Only eight out of 151 municipalities in BC have kept operating spending in line with inflation and population growth over the past 12 years. No large municipalities (population of 25,000 and over) made the list.
In 2000, BC municipal operating spending per capita stood at $863. In 2012, that dollar amount increased to $1,163 per person when adjusted to inflation, representing a 35 per cent increase in operating spending per capita from 2000.
In 2012, the cost of local government per capita was highest in the region of Northern BC at $2,324 and lowest in Thompson Okanagan at $1,411.
The region of Vancouver Island had the highest operating spending growth over the past 12 years of all regions examined at 49 per cent, adjusted for inflation and population growth.
Lake Cowichan is the best overall performer in BC (see Table 2).
Stewart is the worst overall performer in BC (see Table 3).
BC’s major centres, Vancouver and Victoria increased their operating spending by 33 and 37 per cent respectively from 2000 to 2012, after adjusting for inflation and population growth (see Table 1). Together, it represents about 1.9 billion in excess spending over the past 12 years.
Recent trends demonstrate a continuing slowdown in operating spending growth in BC municipalities compared to previous years, although short and long term operating spending are still above the rate of inflation and population growth.
A Note on Municipal Rankings
In this report, municipal performance is assessed by ranking municipalities against one another. The rank is calculated in such a way that it is evenly split between two different measures: a municipality’s 2000 to 2012 spending increase and its 2012 per-person spending level, placing an equal importance on a municipality’s long-term spending trend and its latest spending level. Both measures are important and distinct from one another. For example, a municipality may have had a low increase in its spending from 2000 to 2012 but at the same time it may have a high per-person operating cost. In this case, the municipality will be rewarded for its good long-term spending trend and penalized for its poor per-person spending level. In general, a municipality with a large, positive spending trend and a high current spending level will receive a poor rank and a municipality with a low spending level and low or negative trend will receive a good ranking. See Appendix 1 for a more detailed discussion of the report’s methodology.

CFIB BC Municipal Spending Watch 2014
www.cfib.ca
4 4
Largest Municipalities
Campbell River is the best performing of BC’s largest municipalities with a rank of 18 (see Table 1). It has had the second lowest growth in real operating spending per capita from 2000 to 2012 amongst the largest cities at 18 per cent. It also has a below average per capita spending level. Surrey, the second-best performing large municipality, is ranked 23rd overall and has the lowest per capita spending level among the largest cities at $931. Its real operating spending growth from 2000 to 2012 of 42 per cent is equivalent to the large city average. Penticton is ranked worst amongst BC’s largest municipalities with a rank of 119. However, the city has been making a continued effort to improve its finances (see Case Study: City of Penticton). West Vancouver is the second worst performing large municipality with a rank of 117. It has the second highest per capita operating spending of the largest cities at $2,076 and has seen a 50 per cent increase in its real operating spending per capita from 2000 to 2012.
4 City of Penticton, Annual Report 2012.
Best Ranked Municipalities
Lake Cowichan is the best ranked municipality in BC, up from fourth place last year (see Table 2). The municipality has a 2012 per capita operating spending of $945 and is one of the few BC municipalities to have decreased its 2000 to 2012 real operating spending per capita, reducing it by three per cent. Qualicum Beach and Rossland should also be commended for keeping their 2000 to 2012 per capita real operating spending growth to the level of inflation and population growth. Armstrong is the provinces’ second best ranked municipality, up from sixth last year. Even though the municipality has experienced a 19 per cent increase in its real spending per capita from 2000 to 2012, it achieves its strong rank due to having a low 2012 operating spending per capita of $768.
Worst Ranked Municipalities
Stewart is once again BC’s worst overall spender (see Table 3). The municipality had the largest 2012 per capita spending levels of all BC municipalities at $5,771 per person and despite a population decline of 25 per cent over the last 12 years, real operating spending per capita grew by 141 per cent. (see Appendix 3). Whistler and Fort Nelson were the next worst ranked. Whistler has the second highest operating spending per capita in the province at $5,444 despite experiencing a relatively low 2000 to 2012 real operating spending growth of 38 per cent. Fort Nelson (Northern Rockies) has the province’s fourth highest increase in operating spending per capita from 2000 to 2012 at 136 per cent and a per capita spending level of $3,481.
Another municipality of concern is Sooke5
5 Sooke incorporated in December 1999 to become the District of Sooke. Operations began in 2000 with the introduction of a skeletal budget.
. While having among the lowest levels of operating spending per capita in all of BC at $758, it also possesses the highest spending
Case Study: City of Penticton
In 2009, Penticton conducted a core service review in an effort to examine its spending habits and improve its use of taxpayer dollars. From this review significant changes were implemented which resulted in the elimination of union positions, reduction of salaries, and wage freezes for managerial positions. The city also adopted ‘zero-based’ budgeting, and for three years straight the city has posted a 0 per cent tax increase4
.

CFIB BC Municipal Spending Watch 2014
www.cfib.ca
5 5
growth in BC over the past 12 years at 260 per cent, adjusted for inflation and population growth.
Table 1
How BC’s Largest Municipalities Spend (population 25,000 and above) Listed from Best to Worst (by Overall Provincial Rank)
Municipality
Overall Provincial Rank (1=Best, 151=Worst)
Last Year Rank
2000-2012 Real Operating Spending per
Capita Growth (%)
2012 Operating Spending per
Capita ($)
1 Campbell River 18 26 18 1,233 2 Surrey 23 35 42 931 3 Burnaby 24 19 24 1,241 4 Mission 33 38 28 1,226 5 Langley City 37 37 32 1,190 6 North Cowichan 39 42 42 1,061 7 Saanich 42 32 37 1,158 8 Port Coquitlam 43 34 37 1,167 9 Richmond 44 45 27 1,348 10 Nanaimo 49 29 28 1,367 11 Port Moody 50 49 28 1,367 12 Chilliwack 51 39 53 981 13 Prince George 58 67 27 1,540 14 Maple Ridge 59 47 52 1,130 15 Delta 66 59 29 1,569 16 New Westminster 68 62 14 1,839 17 Kamloops 72 53 35 1,525 18 Coquitlam 73 40 48 1,344 19 Vernon 82 82 63 1,254 20 Vancouver 86 97 33 1,782 21 North Vancouver District 89 90 51 1,493 22 Langley District Mun. 91 96 66 1,248 23 Kelowna 92 108 44 1,619 24 North Vancouver City 93 76 48 1,593 25 Abbotsford 94 95 67 1,275 26 Victoria 105 105 37 1,962 27 Langford 113 79 108 966 28 West Vancouver 117 111 50 2,076 29 Penticton 119 118 45 2,230 Average: 42 1,404
The “overall rank” assigned to each municipality is an equally-weighted combination of two indicators: (1) 2000 - 2012 real operating spending per capita growth, or percentage growth in operating spending over the past 12 years, adjusted for inflation and population growth; and (2) 2012 operating spending per capita

CFIB BC Municipal Spending Watch 2014
www.cfib.ca
6 6
Table 2
BC’s 10 Best Ranked Municipalities Listed from Best to Worst (by Overall Provincial Rank)
Municipality
Overall Provincial Rank (1=Best, 151=Worst)
Last Year Rank
2000-2012 Real Operating Spending per
Capita Growth (%)
2012 Operating Spending per
Capita ($)
1 Lake Cowichan 1 4 -3 945 2 Armstrong 2 6 19 768 3 Qualicum Beach 3 2 0 1,089 4 Fruitvale 4 7 25 731 5 Salmo 5 5 17 877 6 Parksville 6 1 6 1,069 7 Coldstream 7 11 35 593 8 Spallumcheen 8 8 31 743 9 Kaslo 9 12 7 1,209 10 Rossland 10 13 -1 1,354 The “overall rank” assigned to each municipality is an equally-weighted combination of two indicators: (1) 2000 - 2012 real operating spending per capita growth, or percentage growth in operating spending over the past 12 years, adjusted for inflation and population growth; and (2) 2012 operating spending per capita
Table 3
BC’s 10 Worst Ranked Municipalities Listed from Worst to Best (by Overall Provincial Rank)
Municipality
Overall Provincial Rank (1=Best, 151=Worst)
Last Year Rank
2000-2012 Real Operating Spending per
Capita Growth (%)
2012 Operating Spending per
Capita ($)
1 Stewart 151 151 141 5,771 2 Whistler 150 149 38 5,444 3 Fort Nelson (Northern
Rockies) 149 150 136 3,481
4 Silverton 148 128 131 3,483 5 Sooke 147 146 260 758 6 Wells 146 141 79 3,670 7 Valemount 145 110 113 2,972 8 Masset 144 145 59 3,826 9 Tahsis 143 144 31 4,114 10 Granisle 142 147 63 3,386 The “overall rank” assigned to each municipality is an equally-weighted combination of two indicators: (1) 2000 - 2012 real operating spending per capita growth, or percentage growth in operating spending over the past 12 years, adjusted for inflation and population growth; and (2) 2012 operating spending per capita

CFIB BC Municipal Spending Watch 2014
www.cfib.ca
7 7
Municipal Revenue Trends, 2000 - 2012
In 2012, municipal revenue in BC totalled $8 billion6. As shown in Figure 2, the majority of municipal revenues stem from property taxes (48 per cent). About one third of revenues are from the sale of services such as business licences. Other sources of revenues include government transfers (8 per cent), which refers to the transfer of funds from higher levels of government to lower levels of government, developer contributions (7 per cent), which are costs a developer needs to pay to connect a new community to municipal infrastructure, and investment income (2 per cent). Small business owners are particularly affected by taxes on business property because they are taxed at a much higher rate than residents, despite not consuming municipal services at the same rate7. In 2012, BC businesses paid, on average, 2.7 times more on municipal property tax than on a residential property of equal value8
Real municipal revenues from government transfers increased by 139 per cent over the past 12 years (see Figure 3). While local governments argue that the large increases in municipal spending are due to ‘government downloading’, or the transfer of responsibility from provincial governments to municipal governments, it is clear from the charts that municipalities have been given much support from higher levels of government to administer the programs they have passed down. Another source of municipal revenue that has more than doubled over the 12 years is sales of services, which encompasses everything from parking fees to business licences. This is an easy way for local governments to raise revenues without causing too much criticism, but the effects of raised fees hurts small businesses tremendously.
. Raising property taxes on businesses is a politically easier alternative than raising residential property taxes due to less potential for voter backlash.
Figure 2
Sources of Municipal Revenue, 2012
Source: Ministry of Community, Sport, & Cultural Development. 2012. Local Gov’t Stats. Revenue. Sch401_2012; BC Stats, CPI.
6 Ministry of Community, Sport, & Cultural Development. 2012. Local Government Statistics 7MMK Consulting Inc., City of Vancouver - Consumption of Tax-Supported Municipal Services, Volume 1 – Main Report 8Kastelen, Kimball. The BC Municipal Property Tax Gap
Own Purpose Taxation, 48%
Sales of Services, 32%
Government Transfers, 8%
Developer Contributions,
7%
Investment Income, 2%
Other, 2%

CFIB BC Municipal Spending Watch 2014
www.cfib.ca
8 8
Figure 3
Growth of Revenue Sources, Adjusted for Inflation, 2000 – 2012
Source: Ministry of Community, Sport, & Cultural Development. 2012. Local Gov’t Stats. Revenue. Sch401_2000 -2012; BC Stats, CPI.
Municipal Spending Trends, 2000 – 2012
Aggregate municipal operating spending in BC totalled 5.8 billion in 2012. Over 40 per cent of this was spent on general government and protective services (see Figure 4).
A large portion of operating spending is spent on wages and benefits (e.g. 60 per cent in Vancouver9 and 62 per cent in Victoria10
In a past study done by CFIB, it was found that there is a large disparity between public sector and private sector salaries, wages and benefits. CFIB’s Wage Watch Report found that in BC, there was an average wage premium of 11.8 per cent for public sector workers, which balloons to 35.1 per cent when public sector benefits are included
). Unfortunately, unlike provinces such as Alberta and Quebec where the provincial government collects, aggregates, and publishes data on municipal salaries and benefits as well as the number of employees a municipality has, the BC government does not require such information. This makes it more challenging to have an expense breakdown in order to figure out what exactly the money is being used for.
11
Figure 4 outlines the growth in spending by expenditure category. ‘Other services’ experienced the highest increase at 133 per cent over the past 12 years even after adjusting for inflation (see Figure 5). Such services include cemeteries, airports, wharves and docks, and other utilities (e.g. telephone, gas and electricity)
.
12
’.
With the exception of social services, the inflation-adjusted growth in all spending categories has widely exceeded BC’s population growth of 15 per cent from 2000 to 2012.
9 City of Vancouver, 2012 Annual Financial Report. 10 City of Victoria, 2012 Annual Report. 11 Mallett, Ted. Wong, Queenie. Canadian Federation of Independent Business. 2008. Wage Watch: A Comparison of Public-sector and Private-sector Wages 12 Provincial Guidance. Community, Sport and Cultural Development.
49%
104%139%
493%
61%
Own Purpose Taxation
Sales of Services Government Transfers
Developer Contributions
Total Revenue

CFIB BC Municipal Spending Watch 2014
www.cfib.ca
9 9
Figure 4
Allocation of Municipal Spending, 2012
Source: Ministry of Community, Sport, & Cultural Development. 2012. Local Gov’t Stats, Expenditure. Sch402_2012. Figure 5
Growth of Spending, by Expenditure Category, Adjusted for Inflation, 2000 – 2012
Source: Ministry of Community, Sport, & Cultural Development. 2000-2012. Local Gov’t Stats, Expenditure. Sch402_2000-2012; BC Stats, CPI.
13%
29%
4%1%4%11%
20%
15%
3%General Government
Protective Services
Solid Waste Mgmt and Recycling
Health, Social Services and Housing
Development Services
Transportation and Transit
Parks, Recreation and Culture
Water and Sewer Services
Other Services
-67%
38%
48%
57%
65%
75%
75%
84%
133%
-70% -20% 30% 80% 130%
Health, Social Services and Housing
General Government
Transportation and Transit
Protective Services
Development Services
Solid Waste Mgmt and Recycling
Parks, Recreation and Culture
Water and Sewer Services
Other Services

CFIB BC Municipal Spending Watch 2014
www.cfib.ca
10 10
Municipal Spending Trends by Region
2000-2012 Municipal Operating Spending Statistics
This section examines British Columbia’s municipal spending trends by the following geographic regions: Vancouver, Coast & Mountains
Vancouver Island
Thompson Okanagan
Kootenay Rockies & Cariboo Chilcotin Coast
Northern British Columbia
These regions are the same defined geographic areas used by the Government of British Columbia. For balance, “Kootenay Rockies” and “Cariboo Chilcotin Coast” have been combined.
Figure 6 compares real operating spending growth at the regional level to that of population growth over the last 12 years. Even when operating spending is adjusted to inflation, it still greatly outpaces population growth. The regions of Northern BC and Kootenay Rockies & Cariboo Chilcotin Coast have had growth in real operating spending per capita over the 2000 to 2012 period despite the municipalities in these regions having had a declining population, on average.
Figure 6
BC Regional Real Operating Spending Growth and Population Growth, 2000 – 2012
Source: Ministry of Community, Sport, & Cultural Development. 2000-2012. Local Gov’t Stats, Expenditure. Sch402_2000-2012; BC Stats, Population Estimates 2000-2012; BC Stats, CPI.
66%62%
51%
37%
32%
16%
7%4%
-1%
-7%-10%
0%
10%
20%
30%
40%
50%
60%
70%
Van. Coast & Mountains
Van. Island Thomp-Oak Koot-Rock & Carib-Chil
North BC
Real Operating Spending Growth Population Growth

CFIB BC Municipal Spending Watch 2014
www.cfib.ca
11 11
Vancouver, Coast & Mountains
Whistler and Lions Bay are the worst performers in the region (see Table 4). Whistler has by far the highest operating spending per capita in the region at $5,444. Lions Bay experienced the region’s largest growth in real operating spending per capita from 2000 to 2012 at 134 per cent. The third worst performing municipality in the region, West Vancouver has the region’s second highest operating spending per capita at $2,076.
BC’s largest municipality, Vancouver’s population has increased by 12 per cent since 2000 (see Appendix 4) while its real operating spending per capita has increased by 33 per cent. Vancouver’s overall rank improved by 11 spots from last year’s report.
Powell River was the only municipality in the region that was able to keep its operating spending to inflation and population levels during the past 12 years.
Table 4
Municipalities by Overall Provincial Rank, Vancouver, Coast & Mountains Listed from Best to Worst (by Overall Provincial Rank)
Municipality
Overall Provincial Rank (1=Best, 151=Worst)
Last Year Rank
2000-2012 Real Operating Spending per
Capita Growth (%)
2012 Operating Spending per
Capita ($)
1 Gibsons 13 14 10 1,235 2 Anmore 20 55 41 869 3 Surrey 23 35 42 931 4 Burnaby 24 19 24 1,241 5 Powell River 29 17 -8 1,807 6 Mission 33 38 28 1,226 7 Pemberton 36 52 19 1,406 8 Langley City 37 37 32 1,190 9 Port Coquitlam 43 34 37 1,167 10 Richmond 44 45 27 1,348 11 Port Moody 50 49 28 1,367 12 Chilliwack 51 39 53 981 13 Bowen Island 55 57 33 1,417 14 Maple Ridge 59 47 52 1,130 15 White Rock 63 54 40 1,363 16 Delta 66 59 29 1,569 17 New Westminster 68 62 14 1,839 18 Squamish 69 69 36 1,472 19 Coquitlam 73 40 48 1,344 20 Harrison Hot Springs 85 120 38 1,686 21 Vancouver 86 97 33 1,782 22 Kent 87 88 64 1,255 23 North Vancouver District 89 90 51 1,493 24 Township of Langley 91 96 66 1,248 25 North Vancouver City 93 76 48 1,593 26 Abbotsford 94 95 67 1,275 27 Hope 98 86 59 1,473 28 Sechelt 103 46 70 1,356 29 Pitt Meadows 112 104 89 1,266 30 West Vancouver 117 111 50 2,076 31 Lions Bay 135 148 134 1,349 32 Whistler 150 149 38 5,444 Regional Average: 44 1,506

CFIB BC Municipal Spending Watch 2014
www.cfib.ca
12 12
Vancouver Island While the cost for the operations of the local government in Sooke13
is relatively low per capita ($758), real operating spending per capita growth skyrocketed by 260 per cent from 2000 to 2012, the largest increase in the region and in BC (see Table 5). The second worst ranked municipality in the region is Tahsis where municipal operating spending has reached $4,114 per capita, the highest in the region and third worst in the province.
Victoria ranked 105th in this year’s report, the same position it held last year. Its real municipal operating spending per capita has increased by 37 per cent since 2000.
Overall, municipalities in the Vancouver Island region have had, on average, the highest rate of real operating spending growth per capita from 2000 to 2012. Lake Cowichan and Qualicum Beach are the only municipalities in the region that have kept spending to inflation and population growth from 2000 to 2012. Due to this and its low per capita operating spending, Lake Cowichan is now the best performing municipality in the province, up from fourth place in the previous year. Table 5
Municipalities by Overall Provincial Rank, Vancouver Island Listed from Best to Worst (by Overall Provincial Rank)
Municipality
Overall Provincial Rank (1=Best, 151=Worst)
Last Year Rank
2000-2012 Real Operating Spending per
Capita Growth (%)
2012 Operating Spending per
Capita ($)
1 Lake Cowichan 1 4 -3 945 2 Qualicum Beach 3 2 014 1,089 3 Parksville 6 1 6 1,069 4 Port McNeill 12 9 29 890 5 Comox 16 23 29 1,013 6 Campbell River 18 26 18 1,233 7 Duncan 22 60 23 1,199 8 Ladysmith 28 24 27 1,218 9 Port Alberni 30 21 7 1,560 10 Highlands 34 41 54 786 11 Port Hardy 35 18 10 1,529 12 Courtenay 38 30 25 1,315 13 North Cowichan 39 42 42 1,061 14 Saanich 42 32 37 1,158 15 Cumberland 46 28 51 976 16 Nanaimo 49 29 28 1,367 17 Sidney 53 33 32 1,387 18 Central Saanich 67 51 46 1,302 19 Oak Bay 75 70 36 1,592 20 Gold River 80 81 14 1,992 21 North Saanich 83 65 64 1,236 22 Metchosin 88 123 103 622 23 View Royal 90 74 80 1,012 24 Esquimalt 95 89 52 1,550 25 Port Alice 97 122 25 2,023 26 Colwood 104 106 97 932 27 Victoria 105 105 37 1,962 28 Langford 113 79 108 966 29 Belcarra 125 98 106 1,465 30 Tofino 129 127 67 2,218 31 Alert Bay 132 130 42 2,802 32 Ucluelet 139 138 73 2,691 33 Tahsis 143 144 31 4,114 34 Sooke 147 146 260 758 Regional Average: 49 1,442
13 See footnote 5 14 Figures shown as ‘0’ could be due to rounding

CFIB BC Municipal Spending Watch 2014
www.cfib.ca
13 13
Thompson Okanagan
Valemount is the worst performing municipality in the region and the sixth worst in the province (see Table 6). It has the region’s highest operating spending per capita at $2,972. Sicamous is the second worst ranked municipality in the region. It has had the region’s largest increase in spending from 2000 to 2012 at 151 per cent.
As a whole, municipalities in Thompson Okanagan have, on average, the lowest local government operating cost per capita compared to the other four regions. However, no municipality in the Thompson Okanagan region was able to keep its spending in line with inflation and population growth, although Midway was able to keep its spending somewhat close to that benchmark.
Table 6
Municipalities by Overall Provincial Rank, Thompson Okanagan Listed from Best to Worst (by Overall Provincial Rank)
Municipality
Overall Provincial Rank (1=Best, 151=Worst)
Last Year Rank
2000-2012 Real Operating Spending per
Capita Growth (%)
2012 Operating Spending per
Capita ($)
1 Armstrong 2 6 19 768 2 Fruitvale 4 7 25 731 3 Coldstream 7 11 35 593 4 Spallumcheen 8 8 31 743 5 Chase 11 10 22 972 6 Enderby 14 3 20 1,118 7 Ashcroft 21 15 15 1,311 8 Midway 27 20 6 1,549 9 Oliver 31 36 35 1,101 10 Salmon Arm 32 22 33 1,141 11 Princeton 48 50 36 1,244 12 Greenwood 54 78 20 1,591 13 Keremeos 64 91 60 1,044 14 Kamloops 72 53 35 1,525 15 Peachland 74 58 50 1,356 16 Lake Country 76 87 56 1,256 17 Logan Lake 77 66 39 1,571 18 Cache Creek 78 68 27 1,770 19 Merritt 79 80 44 1,496 20 Vernon 82 82 63 1,254 21 Kelowna 92 108 44 1,619 22 Osoyoos 102 93 66 1,384 23 Grand Forks 110 113 34 2,154 24 Summerland 118 125 63 1,913 25 Penticton 119 118 45 2,230 26 Lumby 121 119 114 1,202 27 Sicamous 141 132 151 1,892 28 Valemount 145 110 113 2,972 Regional Average: 46 1,411

CFIB BC Municipal Spending Watch 2014
www.cfib.ca
14 14
Kootenay Rockies & Cariboo Chilcotin Coast
Silverton is the worst ranked municipality in the region and third worst in the province (see Table 7). Along with having a high operating spending per capita, Silverton has recorded the region’s largest increase in real operating spending per capita from 2000 to 2012 at 131 per cent. The second worst in the region was Wells, with the region’s largest operating spending per capita at $3,670.
Overall, the municipalities within the Kootenay Rookies & Cariboo Chilcotin Coast region had, on average, the lowest real operating spending growth per capita from 2000 to 2012 (tied with the Northern BC region). Rossland and 100 Mile House are the only municipalities in the region that have kept their spending in line with population and inflation growth over the past 12 years.
Table 7
Municipalities by Overall Provincial Rank, Kootenay Rockies & Cariboo Chilcotin Coast Listed from Best to Worst (by Overall Provincial Rank)
Municipality
Overall Provincial Rank (1=Best, 151=Worst)
Last Year Rank
2000-2012 Real Operating Spending per
Capita Growth (%)
2012 Operating Spending per
Capita ($)
1 Salmo 5 5 17 877 2 Kaslo 9 12 7 1,209 3 Rossland 10 13 -1 1,354 4 Montrose 15 16 30 985 5 Creston 17 27 17 1,234 6 100 Mile House 26 44 -7 1,770 7 Warfield 41 31 43 1,059 8 Castlegar 45 43 18 1,508 9 Quesnel 52 48 14 1,638 10 Fernie 60 84 5 1,926 11 Nakusp 62 85 22 1,639 12 Clinton 65 61 27 1,596 13 Trail 71 75 18 1,819 14 Cranbrook 81 99 44 1,515 15 Elkford 96 77 17 2,134 16 Williams Lake 99 101 37 1,845 17 Sparwood 108 117 35 2,068 18 Invermere 115 102 60 1,861 19 Nelson 120 126 11 2,870 20 Slocan 124 143 79 1,896 21 Radium Hot Springs 127 115 32 2,767 22 Kimberley 128 131 65 2,251 23 New Denver 130 129 105 1,603 24 Revelstoke 133 135 74 2280 25 Lillooet 134 124 110 1717 26 Golden 137 136 110 1806 27 Wells 146 141 79 3670 28 Silverton 148 128 131 3483 Regional Average: 43 1,871

CFIB BC Municipal Spending Watch 2014
www.cfib.ca
15 15
Northern British Columbia Stewart is the worst ranked municipality in the region and in BC. This municipality is also the region’s worst culprit in terms of its 2012 operating spending per capita ($5,771) and its real operating spending per capita growth from 2000 to 2012 (141 per cent). Fort Nelson (Northern Rockies) is Northern BC’s second worst performing municipality. It had the region’s second highest growth in operating spending per capita from 2000 to 2012 at 136 per cent and also has the region’s third highest 2012 operating spending per capita at $3,481.
On average, the local governments in Northern British Columbia have the highest operating cost per capita among the regions examined (see Table 9). However, real operating spending growth per capita from 2000 to 2012 is the lowest among the five regions (tied with the Kootenay Rookies & Cariboo Chilcotin Coast). Northern BC stands out from the other regions as 22 out of 29 municipalities have undergone a population decrease from 2000 to 2012, yet most of these municipalities increased their spending over that period.
Three municipalities in the region, Prince Rupert, Tumbler Ridge and Taylor, kept their operating spending growth well below the benchmark of population growth and inflation over the 2000 to 2012 period.
Table 8
Municipalities by Overall Provincial Rank, Northern British Columbia Listed from Best to Worst (by Overall Provincial Rank)
Municipality
Overall Provincial Rank (1=Best, 151=Worst)
Last Year Rank
2000-2012 Real Operating Spending per
Capita Growth (%)
2012 Operating Spending per
Capita ($)
1 Terrace 19 25 11 1,384 2 Vanderhoof 25 83 37 1,028 3 Port Clements 40 103 22 1,397 4 Houston 47 56 25 1,418 5 Prince Rupert 56 63 -11 2,159 6 Tumbler Ridge 57 72 -48 2,782 7 Prince George 58 67 27 1,540 8 New Hazelton 61 112 24 1,606 9 Smithers 70 64 22 1,733 10 Fort St. James 84 94 33 1,758 11 Port Edward 100 142 13 2,246 12 Taylor 101 114 -42 3,197 13 Mackenzie 106 100 36 2,001 14 Hazelton 107 92 24 2,219 15 Fort St. John 109 107 49 1,836 16 Fraser Lake 111 109 55 1,844 17 Burns Lake 114 73 64 1,739 18 Chetwynd 116 139 49 2,077 19 Pouce Coupe 122 116 77 1,858 20 Dawson Creek 123 133 40 2,522 21 McBride 126 137 67 2,136 22 Sayward 131 140 43 2,690 23 Kitimat 136 121 59 2,658 24 Telkwa 138 71 112 1,881 25 Hudson's Hope 140 134 62 3,217 26 Granisle 142 147 63 3,386 27 Masset 144 145 59 3,826 28 Fort Nelson (Northern
Rockies) 149 150 136 3,481
29 Stewart 151 151 141 5,771 Regional Average: 43 2,324

CFIB BC Municipal Spending Watch 2014
www.cfib.ca
16 16
Conclusions and Recommendations
Municipal operational spending is considered to be sustainable when it is at or below the rate of inflation and population growth15
CFIB believes there is still time for municipalities to adopt more sustainable spending practices before it is too late. Ultimately, it will require strong political leadership.
. However, over the past 12 years most British Columbia municipalities have spent well in excess of sustainable levels. While the overall rate of spending growth continues to slow, only a minority of BC municipalities have demonstrated real restraint. Overspending by local governments leads to high taxation, putting pressure on local commerce and stifling job growth. For local governments the choice is clear: address overspending now or leave a greater burden for future governments to deal with down the road.
CFIB recommends that:
1. Municipal operating spending increases be limited to the rate of population growth and
inflation.
2. In all cases, core services must be identified and core service reviews conducted to ensure effective fiscal management.
3. Public sector compensation should be aligned with the private sector. According to the latest CFIB research, British Columbia currently has a 35.1 per cent gap between these sectors when combining wages and benefits16
4. Increase transparency of reporting municipal financial data. While data is collected and reported on an annual basis by the BC Government, the quality and coverage of the data could use improvement. For example, the province should collect and publically report the data on the number of employees and the total amount spent on wages, salaries and benefits at the municipal level on a regular basis. This practice is already in place in Alberta
. CFIB recommends freezing public sector wages until private sector wages catch up and reach parity with those of the public sector.
17 and Quebec18. In order to better inform the public as to where their tax dollars are being spent, improving accountability in the process, employment and salary numbers should be broken down by function and included in the annual reports submitted to the province by municipal governments19
5. All municipalities support the mandate and abide by the recommendations of BC’s new Municipal Auditor General. CFIB is encouraged that the provincial government has followed through on its commitment to create an independent Auditor General for Local Government (AGLG), as recommended in previous iterations of this report. However, the success and effect of this new office will rely on the cooperation and recognition of municipal governments. Therefore, we urge municipalities to commit to working constructively with the AGLG to reverse the unsustainable spending trends outlined in this report.
.
15 Based on CFIB survey data. Armstrong, Matthew and Jones, Laura. British Columbia Municipal Spending Watch. 16 Mallett, Ted. Wong, Queenie. Canadian Federation of Independent Business. 2008. Wage Watch: A Comparison of Public-sector and Private-sector Wages 17 Government of Alberta, Ministry of Municipal Affairs. 2012. Municipal Financial and Statistical Data. Financial Activities by Type/Object; General Statistics 18 Gouvernement du Québec, ministère des Affaires municipales et de l’occupation du territoire, Rapport financier des organismes municipaux. Analyse de la rémunération 19 Armstrong, Matthew and Jones, Laura. British Columbia Municipal Spending Watch.

CFIB BC Municipal Spending Watch 2014
www.cfib.ca
17 17
Sources
Armstrong, Matthew and Jones, Laura. Canadian Federation of Independent Business. 2008. British Columbia Municipal Spending Watch. http://www.cfib-fcei.ca/english/article/229-bc-municipal-spending-watch.html City of Penticton, Annual Report 2012. http://www.penticton.ca/assets/City~Hall/Documents/2012%20Annual%20Report.pdf City of Vancouver, 2012 Annual Financial Report. http://vancouver.ca/files/cov/2012-annual-financial-report.pdf City of Victoria, 2012 Annual Report. http://www.victoria.ca/assets/Departments/Communications/Documents/CoV_Annual_Report_2013_e2.pdf Gouvernement du Québec, ministère des Affaires municipales et de l’occupation du territoire, Rapport financier des organismes municipaux http://www.mamrot.gouv.qc.ca/finances-indicateurs-de-gestion-et-fiscalite/information-financiere/profil-financier-et-autres-publications/rapport-financier-des-organismes-municipaux/ Government of Alberta, Ministry of Municipal Affairs. Municipal Financial and Statistical Data. http://www.municipalaffairs.alberta.ca/municipal_financial_statistical_data.cfm Government of British Columbia. 2012. British Columbia Municipal Police Unit Agreement http://www.pssg.gov.bc.ca/policeservices/shareddocs/police-agreement-municipal-police-unit-2012.pdf Government of British Columbia, BC Stats. 2012. CPI BC, Vancouver, Victoria. http://www.bcstats.gov.bc.ca/StatisticsBySubject/Economy/ConsumerPriceIndex.aspx Government of British Columbia, BC Stats. 2012. Population of BC. http://www.bcstats.gov.bc.ca/StatisticsBySubject/Demography/PopulationEstimates.aspx
Government of British Columbia, Ministry of Community, Sport and Cultural Development. 2013. Provincial Guidance. http://www.cscd.gov.bc.ca/lgd/infra/library/municipal_lgde_help_manual_sec5b.pdf Government of British Columbia, Ministry of Community, Sport, & Cultural Development. 2012. Local Government Statistics. http://www.cscd.gov.bc.ca/lgd/infra/municipal_stats/municipal_stats2012.htm Government of British Columbia, Ministry of Jobs, Tourism and Skills Training. 2013. Small Business Profile. www.resourcecentre.gov.bc.ca/pdf/SB_Profile_2013.pdf
Government of British Columbia, Ministry of Justice. 2013. Police Resources in British Columbia, 2012 http://www.pssg.gov.bc.ca/policeservices/shareddocs/statistics/PoliceResourcesBC2012.pdf
Kastelen, Kimball. Canadian Federation of Independent Business. 2013. The BC Municipal Property Tax Gap: A Glimmer of Hope for Small Business. http://www.cfib-fcei.ca/english/article/5246-the-2013-municipal-property-tax-gap-report-a-glimmer-of-hope-for-small-business-in-bc.html
Mallett, Ted and Wong, Queenie. Canadian Federation of Independent Business. 2008. Wage Watch. http://www.cfib-fcei.ca/cfib-documents/rr3077.pdf
MMK Consulting Inc. 2007. City of Vancouver - Consumption of Tax-Supported Municipal Services, Volume 1 – Main Report. http://fairtaxcoalition.com/pdf/ConsumptionStudyReport.pdf
http://www.pssg.gov.bc.ca/policeservices/shareddocs/police-agreement-municipal-police-unit-2012.pdf�

CFIB BC Municipal Spending Watch 2014
www.cfib.ca
18 18
Appendix 1
Methodology
The Municipal Spending Watch rankings are based on an equal weighting of growth in inflation-adjusted operating spending per capita (2000 to 2012) and 2012 operating spending per capita20
Capital expenditures, such as infrastructure building, are excluded from the report. This report only looks at local government operating spending. Policing costs have been included in this year’s report (see Appendix 2). An implication of this inclusion is that this year’s report is not comparable to previous editions of the BC Municipal Spending Watch, since policing costs were excluded in previous editions.
. In order for the ranking system to be more intuitive, this year’s report changes the ranking system so that the best performing municipality is given a rank of one. In previous editions of this report, the worst ranked municipality was given a rank of one.
In total, 151 municipalities are covered in this report. Barriere, Canal Flats, Clearwater, Lantzville, Sun Peaks, West Kelowna and Queen Charlotte were not included in this report since many of these municipalities are newly incorporated and do not have data stretching back to 2000. Zeballos has been excluded from this year’s report as the municipality has a very small population that has decreased substantially since 2000. Lytton has also been excluded since, at the time this report was written, the municipality had not yet submitted their 2012 financial records to the BC Ministry of Community, Sport and Cultural Development for verification. Municipalities are divided into the following geographic regions:
Vancouver, Coast & Mountains
Vancouver Island
Thompson-Okanagan
Kootenay-Rockies & Cariboo-Chilcotin Coast
Northern British Columbia
This report analyzes BC municipal spending statistics from 2000 to 2012, the most recent year available. Unless otherwise stated, data on municipal revenues and expenditures have been obtained from the Ministry of Community, Sport and Cultural Development. Figures and tables on municipal spending represent CFIB calculations based on this data.
Similar to past reports, the year 2000 is used as the base year for comparing operating spending. This inevitably includes spending patterns during both economic upturns and economic downturns over
20A standardized index is created for each indicator (between 0 and 100). A municipality with the highest real operating spending per capita growth is given a score of 0 while the municipality with the lowest 2000 – 2012 real operating spending per capita growth is given a score of 100. All other municipalities are given a proportionate score within that range. The same exercise is applied to the indicator for the 2012 operating spending per capita. The average of the two scores is then converted to a percentage score which is subsequently ranked against the other municipalities.

CFIB BC Municipal Spending Watch 2014
www.cfib.ca
19 19
the past 12 years. Municipal operating spending is calculated using total municipal expenditures, excluding capital spending21
Municipal population growth rates and provincial inflation growth rates are calculated based on BC Stats data from 2000 to 2012. The population figures have been updated from previous reports to obtain more recent estimates. All municipalities have been allocated the provincial inflation rate with the exception of those municipalities within the Greater Vancouver Region and the Capital Region, as separate inflation values exist for these two regions. To evaluate the degree of sustainable spending growth, CFIB considers population growth and inflation to be a reasonable benchmark for optimal spending increases based on survey responses from small business owners in BC
.
22
.
Appendix 2
A Note on Policing Costs
Although excluded from past reports, policing costs have been included in this year’s report. The reason for the previous exclusion is that most BC municipalities do not have an independent police force but rather contract out to the RCMP. Due to this, municipalities have argued that they have little control over their policing costs since the federal government, not the municipality, negotiates policing wages. However, although municipalities that contract out to the RCMP may not have much control over their contracts, they do have control over the number of police officers they hire23
According to the BC Ministry of Justice, a municipality is responsible for its own police services once it reaches a population of 5,000
. CFIB sees this as a credible reason to include policing costs in these calculations.
24
Once a municipality has reached a population of 5,000, it has the choice of forming an independent department, contracting with an existing department or contracting with the provincial government for RCMP services. As of 2012, there are 74 BC municipalities that were given responsibility for providing their own police services, 12 which have chosen to be policed by an independent force (Vancouver, Victoria, Saanich, Central Saanich, Oak Bay, Delta, Abbotsford, New Westminster, West Vancouver, Nelson and Port Moody; Esquimalt shares services with Victoria). These 12 municipalities are responsible for 100 per cent of their policing costs and are governed by their own policing board. Of the remaining 62 municipalities that are policed by the RCMP, those with a population of 5,000-14,999 are responsible for 70 per cent of their policing costs. Municipalities with a population over 14,999 are responsible for 90 per cent. The federal government pays for the remaining portions.
. Before reaching a population of 5,000, municipalities are policed by the provincial RCMP. The province pays for 70 per cent of the associated costs while the federal government pays for the remaining 30 per cent. A portion (less than 50 per cent) of the provincial component is recovered through a municipal Police Tax.
21In the case of West Vancouver, transportation and transit expenses have also been excluded from operating spending due to special circumstances in these expenses after 2000. This is addressed in the previous editions of this report. Due to changes in accounting practices, starting from 2008, amortization is excluded from total expenses. 22 Based on CFIB survey data. Armstrong, Matthew and Jones, Laura. British Columbia Municipal Spending Watch 23 Government of British Columbia. 2012. British Columbia Municipal Police Unit Agreement 24 Government of British Columbia, Ministry of Justice. 2013. Police Resources in British Columbia, 2012
CFIB BC Municipal Spending Watch 2014
www.cfib.ca
20 20
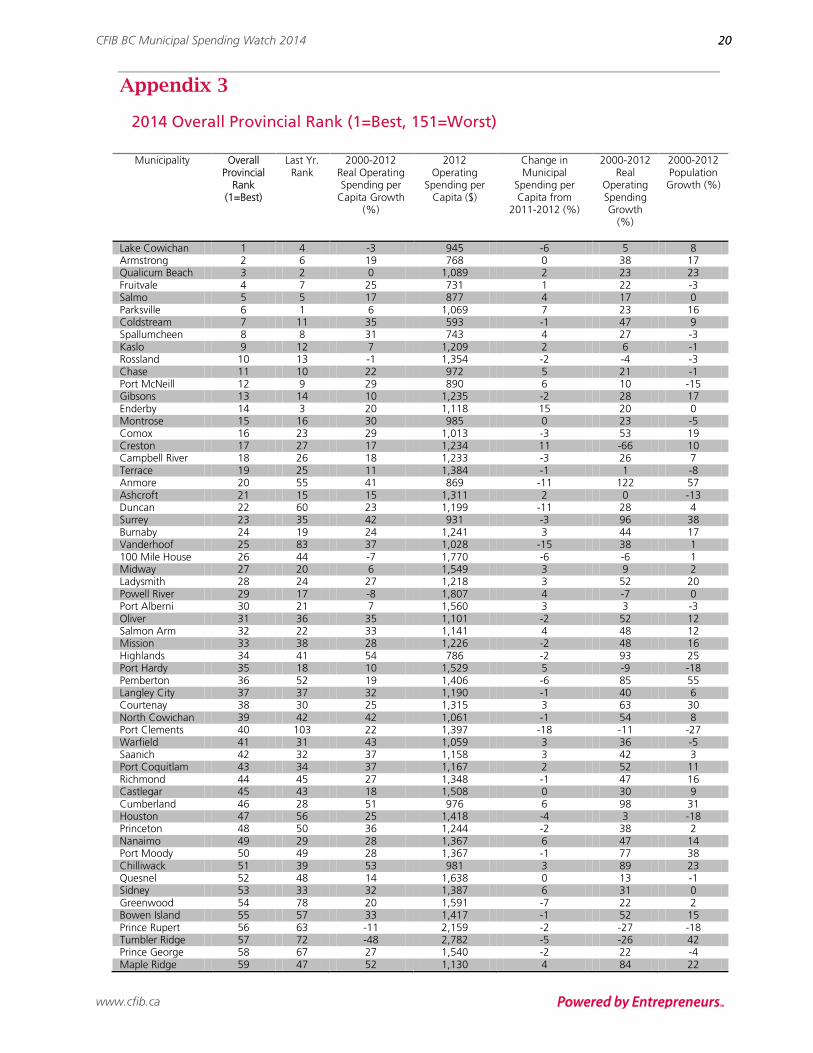
Appendix 3
2014 Overall Provincial Rank (1=Best, 151=Worst)
Municipality Overall Provincial
Rank (1=Best)
Last Yr. Rank
2000-2012 Real Operating Spending per
Capita Growth (%)
2012 Operating
Spending per Capita ($)
Change in Municipal
Spending per Capita from
2011-2012 (%)
2000-2012 Real
Operating Spending Growth
(%)
2000-2012 Population Growth (%)
Lake Cowichan 1 4 -3 945 -6 5 8 Armstrong 2 6 19 768 0 38 17 Qualicum Beach 3 2 0 1,089 2 23 23 Fruitvale 4 7 25 731 1 22 -3 Salmo 5 5 17 877 4 17 0 Parksville 6 1 6 1,069 7 23 16 Coldstream 7 11 35 593 -1 47 9 Spallumcheen 8 8 31 743 4 27 -3 Kaslo 9 12 7 1,209 2 6 -1 Rossland 10 13 -1 1,354 -2 -4 -3 Chase 11 10 22 972 5 21 -1 Port McNeill 12 9 29 890 6 10 -15 Gibsons 13 14 10 1,235 -2 28 17 Enderby 14 3 20 1,118 15 20 0 Montrose 15 16 30 985 0 23 -5 Comox 16 23 29 1,013 -3 53 19 Creston 17 27 17 1,234 11 -66 10 Campbell River 18 26 18 1,233 -3 26 7 Terrace 19 25 11 1,384 -1 1 -8 Anmore 20 55 41 869 -11 122 57 Ashcroft 21 15 15 1,311 2 0 -13 Duncan 22 60 23 1,199 -11 28 4 Surrey 23 35 42 931 -3 96 38 Burnaby 24 19 24 1,241 3 44 17 Vanderhoof 25 83 37 1,028 -15 38 1 100 Mile House 26 44 -7 1,770 -6 -6 1 Midway 27 20 6 1,549 3 9 2 Ladysmith 28 24 27 1,218 3 52 20 Powell River 29 17 -8 1,807 4 -7 0 Port Alberni 30 21 7 1,560 3 3 -3 Oliver 31 36 35 1,101 -2 52 12 Salmon Arm 32 22 33 1,141 4 48 12 Mission 33 38 28 1,226 -2 48 16 Highlands 34 41 54 786 -2 93 25 Port Hardy 35 18 10 1,529 5 -9 -18 Pemberton 36 52 19 1,406 -6 85 55 Langley City 37 37 32 1,190 -1 40 6 Courtenay 38 30 25 1,315 3 63 30 North Cowichan 39 42 42 1,061 -1 54 8 Port Clements 40 103 22 1,397 -18 -11 -27 Warfield 41 31 43 1,059 3 36 -5 Saanich 42 32 37 1,158 3 42 3 Port Coquitlam 43 34 37 1,167 2 52 11 Richmond 44 45 27 1,348 -1 47 16 Castlegar 45 43 18 1,508 0 30 9 Cumberland 46 28 51 976 6 98 31 Houston 47 56 25 1,418 -4 3 -18 Princeton 48 50 36 1,244 -2 38 2 Nanaimo 49 29 28 1,367 6 47 14 Port Moody 50 49 28 1,367 -1 77 38 Chilliwack 51 39 53 981 3 89 23 Quesnel 52 48 14 1,638 0 13 -1 Sidney 53 33 32 1,387 6 31 0 Greenwood 54 78 20 1,591 -7 22 2 Bowen Island 55 57 33 1,417 -1 52 15 Prince Rupert 56 63 -11 2,159 -2 -27 -18 Tumbler Ridge 57 72 -48 2,782 -5 -26 42 Prince George 58 67 27 1,540 -2 22 -4 Maple Ridge 59 47 52 1,130 4 84 22

CFIB BC Municipal Spending Watch 2014
www.cfib.ca
21 21
Municipality Overall Provincial
Rank (1=Best)
Last Yr. Rank
2000-2012 Real Operating Spending per
Capita Growth (%)
2012 Operating
Spending per Capita ($)
Change in Municipal
Spending per Capita from
2011-2012 (%)
2000-2012 Real
Operating Spending Growth
(%)
2000-2012 Population Growth (%)
Fernie 60 84 5 1,926 -6 4 -1 New Hazelton 61 112 24 1,606 -16 3 -17 Nakusp 62 85 22 1,639 -6 14 -7 White Rock 63 54 40 1,363 2 46 4 Keremeos 64 91 60 1,044 -7 80 13 Clinton 65 61 27 1,596 1 28 1 Delta 66 59 29 1,569 1 30 1 Central Saanich 67 51 46 1,302 5 47 1 New Westminster 68 62 14 1,839 1 37 19 Squamish 69 69 36 1,472 0 67 23 Smithers 70 64 22 1,733 2 16 -5 Trail 71 75 18 1,819 -1 14 -3 Kamloops 72 53 35 1,525 4 46 8 Coquitlam 73 40 48 1,344 10 69 15 Peachland 74 58 50 1,356 5 66 11 Oak Bay 75 70 36 1,592 3 34 -2 Lake Country 76 87 56 1,256 -1 100 28 Logan Lake 77 66 39 1,571 4 22 -12 Cache Creek 78 68 27 1,770 4 22 -4 Merritt 79 80 44 1,496 1 40 -2 Gold River 80 81 14 1,992 0 -3 -15 Cranbrook 81 99 44 1,515 -3 49 4 Vernon 82 82 63 1,254 3 82 12 North Saanich 83 65 64 1,236 8 69 3 Fort St. James 84 94 33 1,758 -2 13 -15 Harrison Hot Springs
85 120 38 1,686 -12 59 16
Vancouver 86 97 33 1,782 -3 49 12 Kent 87 88 64 1,255 2 91 16 Metchosin 88 123 103 622 -12 100 -1 North Vancouver District
89 90 51 1,493 0 53 1
View Royal 90 74 80 1,012 6 138 32 Langley District Mun.
91 96 66 1,248 -1 101 21
Kelowna 92 108 44 1,619 -6 74 21 North Vancouver City
93 76 48 1,593 6 62 10
Abbotsford 94 95 67 1,275 1 93 15 Esquimalt 95 89 52 1,550 3 48 -3 Elkford 96 77 17 2,134 5 11 -6 Port Alice 97 122 25 2,023 -11 -13 -31 Hope 98 86 59 1,473 5 51 -5 Williams Lake 99 101 37 1,845 -1 29 -6 Port Edward 100 142 13 2,246 -31 -12 -22 Taylor 101 114 -42 3,197 -8 -28 25 Osoyoos 102 93 66 1,384 3 86 12 Sechelt 103 46 70 1,356 20 103 19 Colwood 104 106 97 932 0 124 14 Victoria 105 105 37 1,962 0 47 8 Mackenzie 106 100 36 2,001 3 -15 -37 Hazelton 107 92 24 2,219 6 4 -16 Sparwood 108 117 35 2,068 -3 31 -2 Fort St. John 109 107 49 1,836 1 81 22 Grand Forks 110 113 34 2,154 0 32 -1 Fraser Lake 111 109 55 1,844 2 39 -10 Pitt Meadows 112 104 89 1,266 6 130 21 Langford 113 79 108 966 16 231 59 Burns Lake 114 73 64 1,739 18 72 5 Invermere 115 102 60 1,861 9 65 3 Chetwynd 116 139 49 2,077 -17 43 -4 West Vancouver 117 111 50 2,076 5 51 0 Summerland 118 125 63 1,913 0 72 5 Penticton 119 118 45 2,230 3 53 5 Nelson 120 126 11 2,870 1 18 6

CFIB BC Municipal Spending Watch 2014
www.cfib.ca
22 22
Municipality Overall Provincial
Rank (1=Best)
Last Yr. Rank
2000-2012 Real Operating Spending per
Capita Growth (%)
2012 Operating
Spending per Capita ($)
Change in Municipal
Spending per Capita from
2011-2012 (%)
2000-2012 Real
Operating Spending Growth
(%)
2000-2012 Population Growth (%)
Lumby 121 119 114 1,202 7 115 0 Pouce Coupe 122 116 77 1,858 8 60 -10 Dawson Creek 123 133 40 2,522 -2 55 10 Slocan 124 143 79 1,896 -18 74 -3 Belcarra 125 98 106 1,465 20 85 -10 McBride 126 137 67 2,136 -9 36 -19 Radium Hot Springs
127 115 32 2,767 11 85 40
Kimberley 128 131 65 2,251 4 63 -1 Tofino 129 127 67 2,218 7 127 36 New Denver 130 129 105 1,603 7 92 -6 Sayward 131 140 43 2,690 -11 15 -20 Alert Bay 132 130 42 2,802 8 7 -25 Revelstoke 133 135 74 2,280 -3 63 -6 Lillooet 134 124 110 1,717 14 74 -17 Lions Bay 135 148 134 1,349 -24 115 -8 Kitimat 136 121 59 2,658 16 22 -24 Golden 137 136 110 1,806 -1 93 -8 Telkwa 138 71 112 1,881 44 112 0 Ucluelet 139 138 73 2,691 1 79 3 Hudson's Hope 140 134 62 3,217 15 53 -6 Sicamous 141 132 151 1,892 27 118 -13 Granisle 142 147 63 3,386 -12 31 -19 Tahsis 143 144 31 4,114 3 -38 -52 Masset 144 145 59 3,826 2 39 -12 Valemount 145 110 113 2,972 49 77 -17 Wells 146 141 79 3,670 11 75 -2 Sooke 147 146 260 758 2 372 31 Silverton 148 128 131 3,483 54 98 -14 Fort Nelson (Northern Rockies)
149 150 136 3,481 -15 195 25
Whistler 150 149 38 5,444 -7 56 13 Stewart 151 151 141 5,771 5 80 -25

CFIB BC Municipal Spending Watch 2014
www.cfib.ca
23 23
Appendix 4
Overall Provincial Rank, in Alphabetical Order (1=Best, 151=Worst)
Municipality Overall
Provincial Rank
(1=Best)
Last Yr. Rank
2000-2012 Real Operating Spending per
Capita Growth (%)
2012 Operating
Spending per Capita ($)
Change in Municipal
Spending per Capita from
2011-2012 (%)
2000-2012 Real
Operating Spending
Growth (%)
2000-2012 Population
Growth (%)
100 Mile House 26 44 -7 1,770 -6 -6 1 Abbotsford 94 95 67 1,275 1 93 15 Alert Bay 132 130 42 2,802 8 7 -25 Anmore 20 55 41 869 -11 122 57 Armstrong 2 6 19 768 0 38 17 Ashcroft 21 15 15 1,311 2 0 -13 Belcarra 125 98 106 1,465 20 85 -10 Bowen Island 55 57 33 1,417 -1 52 15 Burnaby 24 19 24 1,241 3 44 17 Burns Lake 114 73 64 1,739 18 72 5 Cache Creek 78 68 27 1,770 4 22 -4 Campbell River 18 26 18 1,233 -3 26 7 Castlegar 45 43 18 1,508 0 30 9 Central Saanich 67 51 46 1,302 5 47 1 Chase 11 10 22 972 5 21 -1 Chetwynd 116 139 49 2,077 -17 43 -4 Chilliwack 51 39 53 981 3 89 23 Clinton 65 61 27 1,596 1 28 1 Coldstream 7 11 35 593 -1 47 9 Colwood 104 106 97 932 0 124 14 Comox 16 23 29 1,013 -3 53 19 Coquitlam 73 40 48 1,344 10 69 15 Courtenay 38 30 25 1,315 3 63 30 Cranbrook 81 99 44 1,515 -3 49 4 Creston 17 27 17 1,234 11 -66 10 Cumberland 46 28 51 976 6 98 31 Dawson Creek 123 133 40 2,522 -2 55 10 Delta 66 59 29 1,569 1 30 1 Duncan 22 60 23 1,199 -11 28 4 Elkford 96 77 17 2,134 5 11 -6 Enderby 14 3 20 1,118 15 20 0 Esquimalt 95 89 52 1,550 3 48 -3 Fernie 60 84 5 1,926 -6 4 -1 Fort Nelson (Northern Rockies)
149 150 136 3,481 -15 195 25
Fort St. James 84 94 33 1,758 -2 13 -15 Fort St. John 109 107 49 1,836 1 81 22 Fraser Lake 111 109 55 1,844 2 39 -10 Fruitvale 4 7 25 731 1 22 -3 Gibsons 13 14 10 1,235 -2 28 17 Gold River 80 81 14 1,992 0 -3 -15 Golden 137 136 110 1,806 -1 93 -8 Grand Forks 110 113 34 2,154 0 32 -1 Granisle 142 147 63 3,386 -12 31 -19 Greenwood 54 78 20 1,591 -7 22 2 Harrison Hot Springs
85 120 38 1,686 -12 59 16
Hazelton 107 92 24 2,219 6 4 -16 Highlands 34 41 54 786 -2 93 25 Hope 98 86 59 1,473 5 51 -5 Houston 47 56 25 1,418 -4 3 -18 Hudson's Hope 140 134 62 3,217 15 53 -6 Invermere 115 102 60 1,861 9 65 3 Kamloops 72 53 35 1,525 4 46 8 Kaslo 9 12 7 1,209 2 6 -1 Kelowna 92 108 44 1,619 -6 74 21 Kent 87 88 64 1,255 2 91 16 Keremeos 64 91 60 1,044 -7 80 13 Kimberley 128 131 65 2,251 4 63 -1

CFIB BC Municipal Spending Watch 2014
www.cfib.ca
24 24
Municipality Overall Provincial
Rank (1=Best)
Last Yr. Rank
2000-2012 Real Operating Spending per
Capita Growth (%)
2012 Operating
Spending per Capita ($)
Change in Municipal
Spending per Capita from
2011-2012 (%)
2000-2012 Real
Operating Spending
Growth (%)
2000-2012 Population
Growth (%)
Kitimat 136 121 59 2,658 16 22 -24 Ladysmith 28 24 27 1,218 3 52 20 Lake Country 76 87 56 1,256 -1 100 28 Lake Cowichan 1 4 -3 945 -6 5 8 Langford 113 79 108 966 16 231 59 Langley City 37 37 32 1,190 -1 40 6 Township of Langley
91 96 66 1,248 -1 101 21
Lillooet 134 124 110 1,717 14 74 -17 Lions Bay 135 148 134 1,349 -24 115 -8 Logan Lake 77 66 39 1,571 4 22 -12 Lumby 121 119 114 1,202 7 115 0 Mackenzie 106 100 36 2,001 3 -15 -37 Maple Ridge 59 47 52 1,130 4 84 22 Masset 144 145 59 3,826 2 39 -12 McBride 126 137 67 2,136 -9 36 -19 Merritt 79 80 44 1,496 1 40 -2 Metchosin 88 123 103 622 -12 100 -1 Midway 27 20 6 1,549 3 9 2 Mission 33 38 28 1,226 -2 48 16 Montrose 15 16 30 985 0 23 -5 Nakusp 62 85 22 1,639 -6 14 -7 Nanaimo 49 29 28 1,367 6 47 14 Nelson 120 126 11 2,870 1 18 6 New Denver 130 129 105 1,603 7 92 -6 New Hazelton 61 112 24 1,606 -16 3 -17 New Westminster 68 62 14 1,839 1 37 19 North Cowichan 39 42 42 1,061 -1 54 8 North Saanich 83 65 64 1,236 8 69 3 North Vancouver City
93 76 48 1,593 6 62 10
North Vancouver District
89 90 51 1,493 0 53 1
Oak Bay 75 70 36 1,592 3 34 -2 Oliver 31 36 35 1,101 -2 52 12 Osoyoos 102 93 66 1,384 3 86 12 Parksville 6 1 6 1,069 7 23 16 Peachland 74 58 50 1,356 5 66 11 Pemberton 36 52 19 1,406 -6 85 55 Penticton 119 118 45 2,230 3 53 5 Pitt Meadows 112 104 89 1,266 6 130 21 Port Alberni 30 21 7 1,560 3 3 -3 Port Alice 97 122 25 2,023 -11 -13 -31 Port Clements 40 103 22 1,397 -18 -11 -27 Port Coquitlam 43 34 37 1,167 2 52 11 Port Edward 100 142 13 2,246 -31 -12 -22 Port Hardy 35 18 10 1,529 5 -9 -18 Port McNeill 12 9 29 890 6 10 -15 Port Moody 50 49 28 1,367 -1 77 38 Pouce Coupe 122 116 77 1,858 8 60 -10 Powell River 29 17 -8 1,807 4 -7 0 Prince George 58 67 27 1,540 -2 22 -4 Prince Rupert 56 63 -11 2,159 -2 -27 -18 Princeton 48 50 36 1,244 -2 38 2 Qualicum Beach 3 2 0 1,089 2 23 23 Quesnel 52 48 14 1,638 0 13 -1 Radium Hot Springs
127 115 32 2,767 11 85 40
Revelstoke 133 135 74 2,280 -3 63 -6 Richmond 44 45 27 1,348 -1 47 16 Rossland 10 13 -1 1,354 -2 -4 -3 Saanich 42 32 37 1,158 3 42 3 Salmo 5 5 17 877 4 17 0 Salmon Arm 32 22 33 1,141 4 48 12 Sayward 131 140 43 2,690 -11 15 -20

CFIB BC Municipal Spending Watch 2014
www.cfib.ca
25 25
Municipality Overall Provincial
Rank (1=Best)
Last Yr. Rank
2000-2012 Real Operating Spending per
Capita Growth (%)
2012 Operating
Spending per Capita ($)
Change in Municipal
Spending per Capita from
2011-2012 (%)
2000-2012 Real
Operating Spending
Growth (%)
2000-2012 Population
Growth (%)
Sechelt 103 46 70 1,356 20 103 19 Sicamous 141 132 151 1,892 27 118 -13 Sidney 53 33 32 1,387 6 31 0 Silverton 148 128 131 3,483 54 98 -14 Slocan 124 143 79 1,896 -18 74 -3 Smithers 70 64 22 1,733 2 16 -5 Sooke 147 146 260 758 2 372 31 Spallumcheen 8 8 31 743 4 27 -3 Sparwood 108 117 35 2,068 -3 31 -2 Squamish 69 69 36 1,472 0 67 23 Stewart 151 151 141 5,771 5 80 -25 Summerland 118 125 63 1,913 0 72 5 Surrey 23 35 42 931 -3 96 38 Tahsis 143 144 31 4,114 3 -38 -52 Taylor 101 114 -42 3,197 -8 -28 25 Telkwa 138 71 112 1,881 44 112 0 Terrace 19 25 11 1,384 -1 1 -8 Tofino 129 127 67 2,218 7 127 36 Trail 71 75 18 1,819 -1 14 -3 Tumbler Ridge 57 72 -48 2,782 -5 -26 42 Ucluelet 139 138 73 2,691 1 79 3 Valemount 145 110 113 2,972 49 77 -17 Vancouver 86 97 33 1,782 -3 49 12 Vanderhoof 25 83 37 1,028 -15 38 1 Vernon 82 82 63 1,254 3 82 12 Victoria 105 105 37 1,962 0 47 8 View Royal 90 74 80 1,012 6 138 32 Warfield 41 31 43 1,059 3 36 -5 Wells 146 141 79 3,670 11 75 -2 West Vancouver 117 111 50 2,076 5 51 0 Whistler 150 149 38 5,444 -7 56 13 White Rock 63 54 40 1,363 2 46 4 Williams Lake 99 101 37 1,845 -1 29 -6