RESEARCH MEMORANDUM - Digital Library/67531/metadc62553/m2/1/high... · RESEARCH - MEMORANDUM ......
82
i -- . < -. . RESEARCH - MEMORANDUM AN ANALOG STUDY OF TEE RELATIVE IMPORTANCE OF VAEUOUS FACTORS AFFECTING ROLL COUPUNG By Joseph Weil and Richad E. Day
Transcript of RESEARCH MEMORANDUM - Digital Library/67531/metadc62553/m2/1/high... · RESEARCH - MEMORANDUM ......

i
-- . < - . .
RESEARCH - MEMORANDUM
AN ANALOG STUDY OF TEE RELATIVE IMPORTANCE OF
VAEUOUS FACTORS AFFECTING ROLL COUPUNG
By Joseph Wei l and Richad E. Day
By Joseph Weil and Richard E.
An analog ~ t u d y of the roll-coupling problem has been made f o r a representative swept-wing and t a i l l e s s delta-wing configuration. The Investigation, made primmily for subsonic flight conditions, included the determination of the effects of wide m i a t i o n s In many of the per- t inent aeroaynam;ic derivatives on the motions developed in rolling maneuvers. The influence of lmge changes Fn princfpel axis inclination and mass distribution i s a l so considered.
I
Y
The results indicated that as f i rs t predicted in W A TN 1627 the relationship between the longi tudinal and directional stability is of paramount Fmportance. For most current designs an opt- condition exists when the natural frequencies in pitch end yaw are approximately equal. Increases in pitch danging had a pronounced favorable effect in reducing the ap l i tudes of the motions encountered and were, in general, considerably more effective than correspondbg increases in yaw damping.
Practfcal redistribution of mass produced on ly re la t ively minor changes i n the overall results.
It w-as found that the anplitude of the motions developed fo r a given aileron deflection depends t o a Wge ex ten t on the duration of the maneuver (change i n bank angle). Limited studies indicated that 90' r o l l maneuvers would he considerably less cr i t ica l than 3 6 9 O ro118. The eagle of attack of the principal exis has an bportant bearing on the behavior, pa r t i cubr ly in the absence of other dis-t;Urbtng functions. If the ini- t ia l angle of attack i s maFntEtined constant, a reduction in al t i tude w i l l delay cr i t ical condi t ions to a hTgher roll r a t e but the ma;rdmum ampli- tudes may be only slightly affected.
Small inadvertent stabilizer inguts can greatly affect the magni- tude of the motions developed.
It is di f f icu l t t o generalize on the effects of Mach mer varia- t ion because this vasiable affects many of the control lhg parameters.
2 NACA RM ~ 5 6 ~ 0 6
I . .
Utilizing simple concepts proved useful in assessing the qualitative effects of m ~ l n y of the aeroaynamic and inertia parameters and changes in flight condition. The calculated lower resonant frequency generally cor- c responded to the average roll velocity at which the more serious motions could be expected.
1
It is indicated that rational design procedure can avoid the probleni of serious roll coupling at supersonic speeds and minimize the problem in the subsonic speed range for the configurations of the type considered.
Until recently'the motions of a rigid airplane with deflected ailerons could be adequately predicted in most instances from the classic three- degree-of-lateral freedom solutions (for example, ref. 1). That the longitudinal modes can exer t a powerful effect on the overall motions of the rolling aircraft was first demonstrated theoretically in 1948 (refs. 2 and 3); however, not until 1954 were strong manifestations of coupled motions in rolling maneuvers experienced on a full-scale airplane (ref. 4). .
Following the flight experiences described in reference 4, a five- degree-of-freedom analog study was initiated by,staff members of the NACA Langley Lsboratory and NACA High-speed Flight Station to determine whether the actual.flight motions could be calculated and also to deter- mine the effects of variations in certain of the stability parremeters. Some of the results of these preliminary studies were reported briefly in references 5 and 6.
An -log investigation of several generalized amlase configura- tions encompassing a considerably broader scope than the work of refer- ences 5 and 6 has recently been completed at the NACA High-speed Flight Station. In this study wide variations in many of the pertinent aerody- namic derivatives were investigated at subsonic and supersonic speeds. The effects of large changes in principal axis inclination and mass dis- trfbutfon are a l s o included.
The pri- purpose of this paper is to summarize the information obtained from the analog calculations and to compwe the results with the trends predicted from a slrghtly modified version of reference 2.
b wing span, ft

3
b
.
lift coefficient, - Y f t &V%
rolling-moment coefficient, R o l l i n g moment $?V%b
pitching-moment coefficient, Pi tching moment &V%E
yawing-moment
lateral-force
Coefficient, yawing moment p S b
$V25 coefficient , Irttersl force
w i n g mean aerodynamic chord, f t
acceleration ~e to gravity, ft/sec2
pressure altitude, ft
stabilizer deflection, deg
moment of inertia of airplase about X-axis, slug-ft2
moment of inertia of rotating engine parts about X-axis, s lug-ft2
product of inertia referred t o X- ana Z-axes, slug-#
moment of inertia of airplane about Y-axis, slug-ft2
moment of inertia of ah-plane about Z-axis, slug-ft2
Mach m e r
p i t chhg mment, ft-lb
airplane mass, W slugs
yawing moment, f t - lb
r o l l i n g velocity, radfans/sec
average r o l u velocity, radians/sec
steady ro l l ing velocity, radians/sec
E’
__

4 - NACA RE4 ~ 5 6 ~ 0 6
% E
pitching velocity, radians/sec
y a m velocity, raafans/sec
wing area, sq f%
time, sec
h e airspeed, ft/sec
airplane weight, lb
body axes of airplane
angle of attack of atrplane body axis, radians or deg
angle of attack at zero lift, radians or deg
initial angle of attack of airplane body axis, deg
initial angle of attack of principal axis, deg
angle of sideslip, radians or deg
increments from initial conditions, radians or deg
t o t d aileron deflection (positive for right r o l l s ) , radfans Qr deg
rudder deflection, radians or deg
angle between body axis and principal X-axis, positive when reference a x l s i s above pr inc ipd axis at the nose, deg
fract ion of c r i t i c a l daqin@; i n p i t ch of nonrolling aircraft, - E M q
f ract ion of c r i t f c a l damping i n yaw of nonrolling a i rc raf t ,
L
’#

NACA m ~ 5 6 ~ 0 6 n 5
rsp increment in angle of bask, deg L % rotational velocity of en@;- rotor, r a w / s e c
% nondlmensional undmped natural frequency in yaw of nonrolUng a i r c r a f t
CmdL’ ems. MS indicates derivative with respect t o c x subscript - m
Motion Studies
The basic time histories, won which the analysis of this report is based, were calculated in r e a l tFme using a five-degree-of -freedom approach (forward speed assumed constant). he funaamentd e p t i o n s used t o c d - - culs;te the motions are shown i n table I. These equations were solved by

means of a Goodyear Electronic Differential Analyzer ( W A ) .l The Fnftial conditions used i n the calculations simulated either t r m d level flight 1
or constant g accelerated flight. Aileron deflection was generally the sole control input used i n the calculations.
?
Several thousand time histor ies were run off i n the cow3e of the general study. The initial calculations were made w i t h the sFmple aileron input of figure 1( a) ( input A). A ramp-the input of 50' per second w a s used until the desired control angle w a s reached. A t the nominal bank angle (usually 360') the control was returned t o zero at 50° per second. It was found in a number of instances thak t h i s simple aileron input pro- duced unreal is t ic resul ts ( for example, f ig . l ( b ) ) because it fa i led t o =rest the roll ing motion a f t e r the aileron & returned t o neutral. To obtain a more realist ic evaluation.in ' these instances it was necessary t o use a control st ick in conjunction wlth the analog, as shown i n figure 2. A typical control input us ing the stick (input B) i s shown i n figure l ( c ) . It should be noted that the inputs A and B were sFmilar unt i l the point of corrective control. Ln the lat ter Instance, the oper- a tor attempted to s top the ro l lwg motion as rapidly as possible.
A n h e r of approaches were t r i ed i n 811 ef for t to =r ive at the most significant parameters fo r summary purposes. It'was finally decided that the maximum positive and negative excursions in angle of attack and side- s l ip ( f i g . l ( c ) ) p lo t t ed against the average rol,l rate obtained i n a given maneuver might provide the best overall representation. The average r o l l ?
velocity i s defined. as the bank angle a t control reversal divided by the time required to reach this angle. The bank angle was determined from the direction cosine m3 (table I).
Simplified Analysis
Throughout the analog program reference 2 served as a valuable guide notwithstanding the fact tha t the analysis of reference 2 assumed constant roll r a t e and made other simplifying assumptions. It was thought desir- able, however, t o account for engine gyroscopic effects and t o use the
actual value for the ra t io IZ - 'x instead of assuming unity. IY
Another approach i n considering the effects of engine momentum on rol l ing maneuvers i s presented i n reference 7.
It is shown i n appendix A tha t inciusion of :the previously mentioned modifications to the theory of reference 2 r e su l t s i n an increment t o the
%he GEDA equipment was made available through the cooperation of the Air Force Flight T e s t Center.
L)

panmeters used to define the stability chart , and also l m r s the hori- zontal boundary s l ight ly (appendix A and f ig . 3) . The basic menninp of
between a boundary and axis indicates a divergent condition. The r o l l velocity at which the effect ive s tabi l i ty first becomes unstable f o r a condition of zero damping i s referred t o as the resonant frequency and is given by the following equations
L figure 3 is identical to that discussed i n reference 2 in that the region
i
applicable where the ver t ical boundary is first intersected as the r o l l velocity is progressively increased, and
applicable where the horizontal boundary is first fnterseded. L.
Note that eqwtions (1) and (2) are identical t o equationa 10 and ll of appendix A3 however, the notation po of reference 2 was retained
of this paper. I in the appendix whereas the average r o l l velocity is used i n the remainder
s c m
Two basic f ighter airplme configurations me included in this study. One configuration had the mass and aerodynamic dmracteristics represen- ta t ive of current swept-wing airplane types, w h i l e the other used param- eters estFmated f o r a t a i l l e s s delta-wing type. All the rolling maneuvers for the swept-wing airplane included in this paper were calculated for a Mach number of 0.7, whereas the delta configuration i s presented f o r M = 0.8 and M = 1.2. Unless otherwlse indicated, the basic aerodynamic and mass pwameters shown i n table I1 were used in the calculations. The aerodynamic derivatives were based on wind-tunnel results, flight tes t s , and theory. The derivatives used (with the exception of Cz ) were assumed
invariant w i t h angle of attack. Table I1 presents the vmiation of P
czB - with a used for the several basic flight conditions.
For each configuration a series of calculations were made with sue- .. cessive increments in aileron deflection using the basic derivatives of
8 I
NACA RM ~ 5 6 ~ 0 6
table SI. Additional series were obtalned by varying the stability deriva- t ives Cma and CnP ad. the damping derivatives and Cnr over a rather wide range. The effects of roll direction and duration and ini t ia l angle of attack were also considered fo r each basic condition.
c%
To obtain a bet ter insight into the mechanism of roll coupling, additional information was obtalned f o r the swept-wing configuration with arbi t rary variations in yawing moment due t o rolling dihedral effect C , principal axis inclination, altitude, and -8 distribution. The
importance of relatively small inadvertent stabilizer inputs was also determined.
c%J 2P
PmSENTATION OF msms
A summarry of the figures presenting the results of t h i8 investigation are :
Effects of: Cma a t various levels of C n . . . . . . . . . . . . . . ' B Roll direction . . . . . . . . . . . . . . . . . . . . . . Roll duration . . . . . . . . . . . . . . . . . . . . . . Damping i n yaw . . . . . . . . . . . . . . . . . . . . . . Damping in p i tch . . . . . . . . . . . . . . . . . . . . . Inadvertent stabilizer input . . . . . . . . . . . . . . . I n i t i a l angle of attack and
principal axis inclination . . . . . . . . . . . . . . . Altitude . . . . . . . . . . . . . . . . . . . . . . . . . Yaw due t o r o l l . . . . . . . . . . . . . . . . . . . . . . Dihedral effect . . . . . . . . . . . . . . . . . . . . . Mass distribution . . . . . . . . . . . . . . . . . . . . specific design . . . . . . . . . . . . . . . . . . . . . Analysis of coupling problem on
DISCUSSION
Inaividual Effects
Figures
4 to 16 17 and 18 19 to 21 22 to 25 26 to 33
34 and 35
36 to 4-0 41
42 and 43 44
45 t o 47
7
48
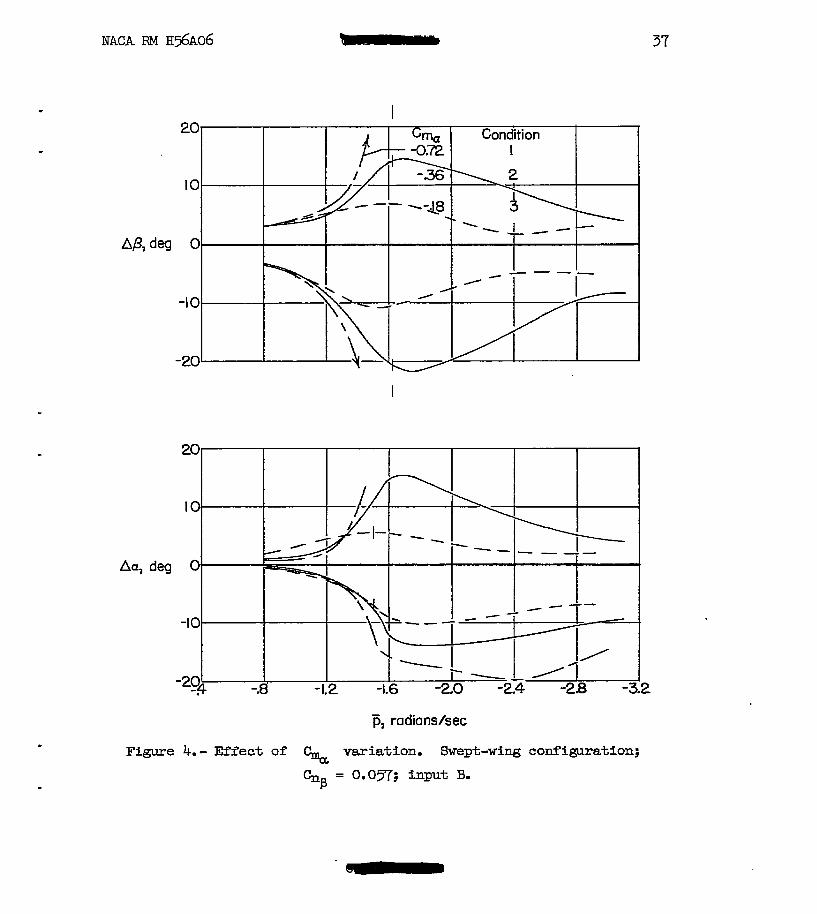
Importance of C&,, CnB relationship. - Figures 4 t o 6 present a summary of the effects of variations i n at three levels of C
fo r the swept-wing configuration. The data of f i g u r e a 4 t o 6 present na
NACA FM ~ 5 6 ~ 1 3 6 - 9
the envelopes of the maximum angle of sideslip and angle of attack excur- sions from trim (fig. I( c) ) aa a function of average ro l l ve loc i ty in n-1 360' left r o m n maneuvers. The results Fndlcate that the mue of C& has a profound effect on the calculated amplitudes at all levels of a i rect ional s tabi l i ty . Moreover, the value of (& at which the smallest angles are obtained appears t o increase as is increased. The average ro l l ve loc i ty at which the peak amplitudes OCCUT wauld appear t o v~uy in a somewhat erratic fashion. To analyze the trends shown, the s-le t h e q of reference 2 (modified as indicated in appendlx A) was util ized. In figure 7 the nonaFmensional frequency parameters in pitch and yaw are plotted with suitable terms aaded t o account for engine gyro- scopic effects. For any given flight conaition, variation Fn the r o l l velocity wlll trace out a curve wbich for the values of the aerodynamics and- engine momentum considered is very close t o a straight line. For conditions fa-2 between the coordinate axes 4 the ver t ical neutral s t ab i l i t y boundazy (region A) the s-le theory predicts pr" a directional divergence, w h e r e a s conditions between the coorainate d s and the horizontal neutral stabil i ty boundary (region B) me prlmtl3.W Fnaicative of a pitch divergence. It should be noted that, Inasmch as the physical and inertia characteristics were assumed constant, the slopes of the lines sham in figure 7 are f o r a l l p r a c t i c a l purposes dependent on the r a t i o of C& t o Cnp- Each condition in figures 4 t o 6 is num- bered and represented i n figure 7 by a l ine. The several "Lances of identical vp ra t ios axe indicated by a coIIIM)n reference mriber. It can now be seen that the farther from the origin the representative l ine intersects the boundaries of figure 7, the worse the coupled motions. Thus, conditions 1 and 5 w h i c h represent the most extreme rat ios of natural frequency i n yaw and pitch also are characterized by the least desfrable motions. The average r o l l veloci ty a t which the lower undaqed resonant frequency f o r the nonrolling airplane occurs (equation 1 or 2) is shown ticked on the curves in figures 4 t o 6 . It seems that this frequency in general occurs fairly close to the r o l l velocity at which maximum excur- sions occur. For a given r a t io of t o CnS the higher the r o l l velocity for resonance, the greater the maximum amplitude of the motions for the more extreme conditions 2 and 4. Condition 3, which has a more desirable proportioning of stability, does not show thfs t rend to any degree.
The effect of increasing % at constant i s a l so evident i n figures 4 t o 6 and the results follow the foregoing analysis.
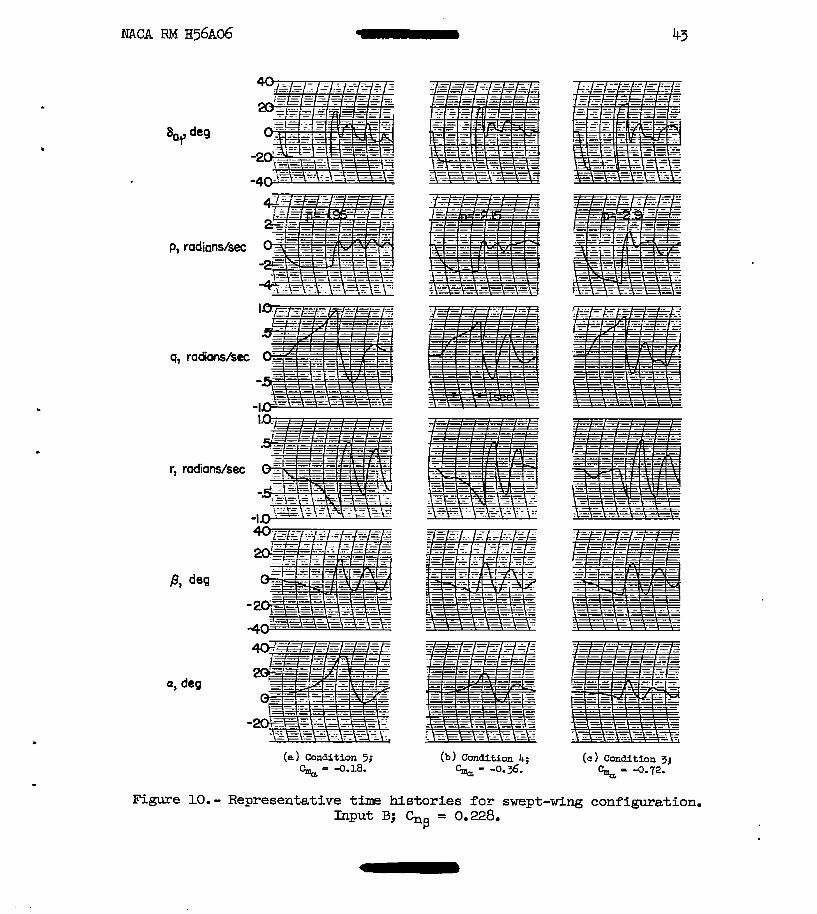
Representative time histories f o r aileron deflections at which near peak amplitudes were obtained me shown for each cabinat ion of Cma,

10 NACA RM ~ 5 6 ~ 0 6
and C in f igures 8 t o 10. I n nearly all instances the maximum e x m - sions occur during the recovery phase of the maneuver. Although the J
recovery is perhaps not mathematically definable, the results of fig- ures 4 t o 6 were not particularly sensitive to the exact control manip- ulations used during recovery, and repeat runs produced very l i t t l e d
sca t te r on the s u m n a r y plots. For conditions 1 and 2 which produced an intersection in the upper portion of the &Fagram of figure 7 the predom- inant angle-of-attack change during the constant aileron portion of t h e maneuver was negative, whereas for conditions 4 and 5 the predominant angle-of-attack change w-as positive. The in i t i a l s ides l ip motion was always negative, although the yawing velocity histories verried marrkedly.
nP
A series of runs was made i n which individual terms were e lh ina t ed singly fromthe equations of table I. The results are shown i n figures 11 and 12 for the two most extreme conditions, 1 and 5 ( f igs . 4 and 6).
For condition 1, which represents a condition having a CnS value which i s much too low in re la t ion t o kt it is evident that elimination of the pq term in t he .i. equation effectively de-couples the motion ( f ig . 11( c ) ) . When the pr term in the a equation is removed, however, l i t t l e e f f e c t i s shown. The elimination of the pp term in the dt d
equation shows an effect similar t o omission of the pq term.
For condition 5, which represents a condition having a Cn value P II
much too high relative to Cma, removal of the pr term has the primmy de-coupling effect (f ig. 12). It i s seen, moreover, that the removal of the pq or pp terms produces an unfavorable effect for condition 5 .
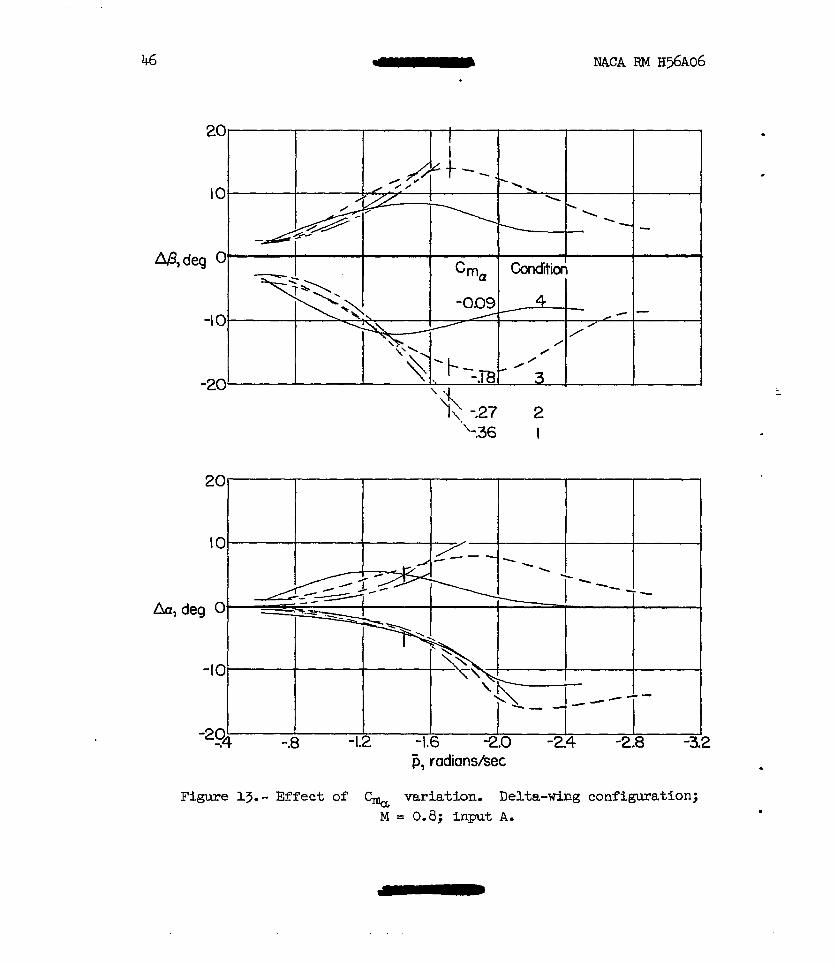
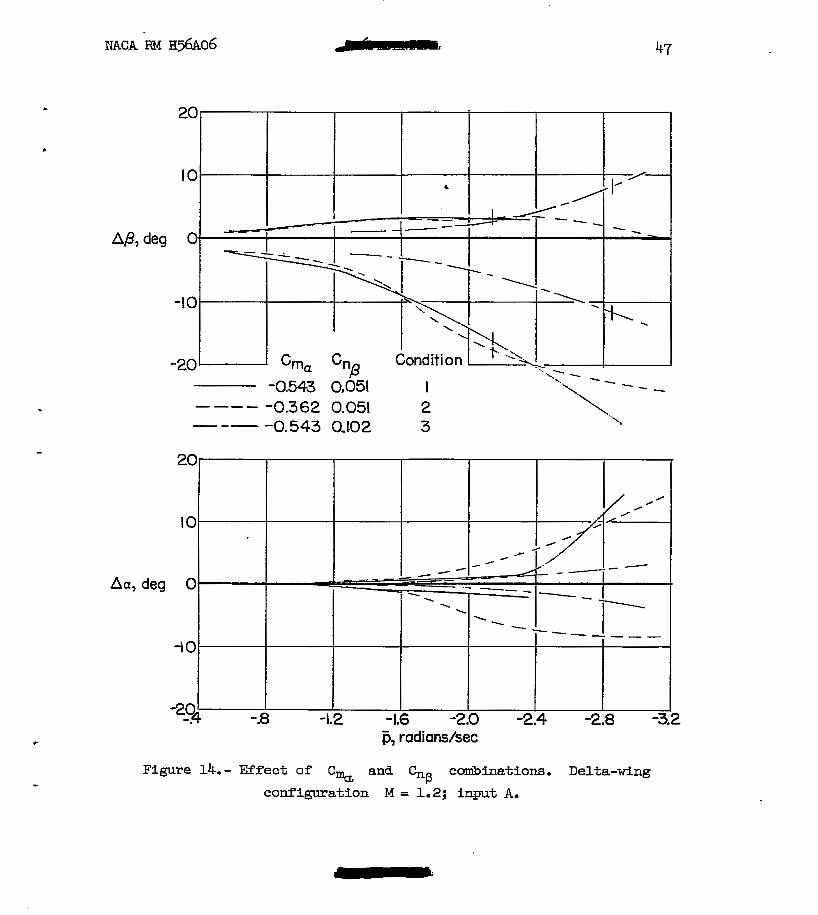
The importance of the Cma, Cnp relationship for the delta-wing configuratfon at M = 0.8 and M = 1.2 is i l lus t ra ted in figures 13 and 14. S tab i l i ty diagrams for these conditions me presented as f ig- ures 15 and 16. F r o m a close inspection of figures 13 t o 16 it i s seen that the major points brought out in the discussion of the swept-wing configuration me substantiated for the delta-wing configuration.
For the M = 0.8 condition (figs. 13 and 15 ) the expected favorable effect of reducing C% from -0.36 t o ,-0.18 (condition 1 t o condition 3 ) is evident, although the magnitude of the motions is s t i l l qu i t e Wge fo r the latter case. When the value of Cma is flurther reduced t o -O.o(3,
a considerable reduction i n the p e a amplitudes is obtained probably because of the decrease i n lower resonant frequency.
I
A t M = 1.2, doubling the basic value of CnB resul ted in an appre- ciable improvement because of a more desirable proportioning of s t ab i l i t y I
(conditions 1 and 3, f ig . 16) and because of the increased st&ili ty level.

Detailed coqmisons of the several configurations discussed should be made only in the Ught of the different initial conditions present ( table I I ) . The effects of some of these vmiKbles will be treated in later sections of this paper.
. Y
Effect of roll direction.- The effect of r o l l direction is summarized in f igure 17 f o r the swept-wing configuration at CnB levels of 0.057 and 0.114 per radian. The data indicate that in lef t r o l l s with the lower C, the peak motions occur at a somewhat lower average r o l l rate and are 30 percent k g e r than corresponding right r o l l s . For c a p of 0.114 a s f m i k trend is indicated but is less marked.
B'
The s-le theory of reference 2 modified t o include the engine terms has been applied to the conditions of figure 17. The s t ab i l i t y chart ( f ig . 18) s h m that f o r the lower CnS the representative line f o r t he l e f t r o l l intersects in a slightly less desirable location than the corresponding line f o r the right r o l l . For the higher Cnp the two lines are coincident. The lower resonant frequencies for the undemped conditions axe indicated by the ticks ( f ig . 17) and it is appazent that the increase in resonant frequency calculated f o r the right r o l l s cor- re la tes fairly well Kith the motion studies. .
It should be mentioned that Ellthough the lef t roUs of figure 1-7 m e seen t o be somewhat more c r i t i ca l than the corresponding right ro l l s , a rider of factors could cause the reverse t o be true. Among these factors w o u l d be directiqn of engine rotation, and the values of J
Cnp, and perhaps Initial angle of attack. For all conditions considered i n this paper however, t h e l e f t r o l l is the mre c r i t i c a l and all of the remaining results are presented for lef t r o l l s .
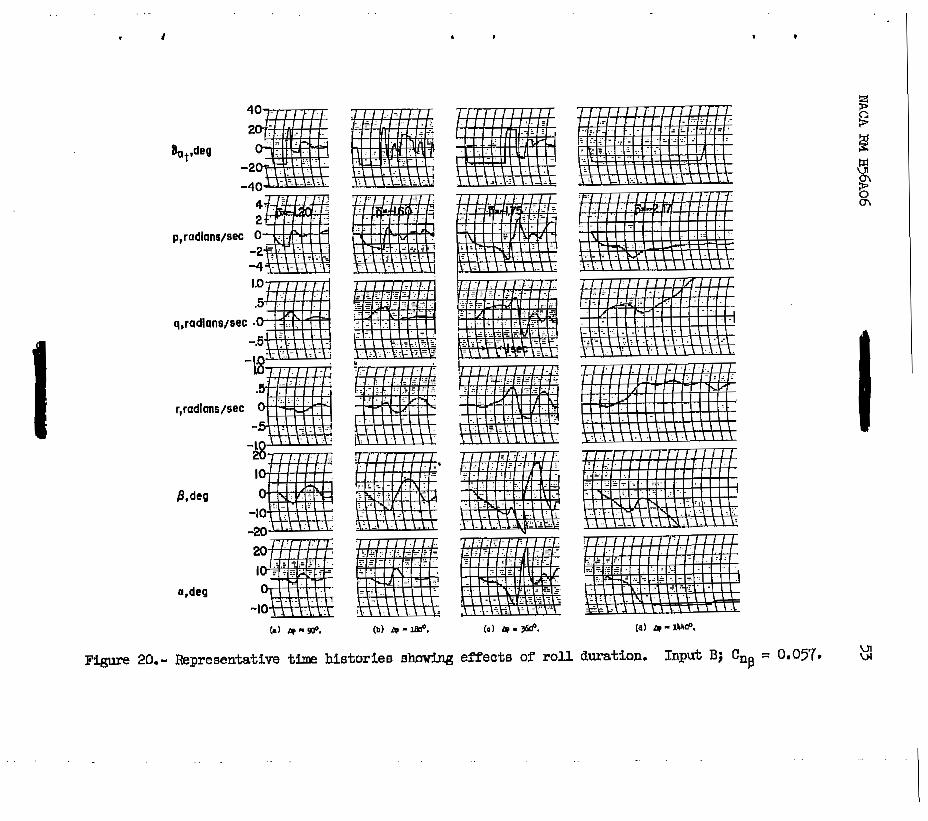
Effect of r o l l duration.- A sumnary of the effects of r o l l duration is shown f o r the swept-wing configuration in figure 19. It is seen that the maximum amplitudes calculated for the 90' and 180° maneuvers axe much
. lower than for the 36Q0 ro l l s . This is not surprising i f the motions are considered t o be the manifestation of an effective reduction in stabil i ty or actual instabil i ty, thus the time duration (change in bank angle) would be expected t o be a deteminfng factor in the notion build up. Represent- ative time histories axe sham in figure 20 f o r goo, 180°, 360°, and 14b0 maneuvers. The possible effects of r o l l duration are clearly evident particularly f o r the 1hk0 maneuver i n w h i c h angles of attack and angles of sideslip of very large magnitude are obtained. In most instances, however, the amplitudes attained i n the 360' r o l l s were comparable w i t h those calculated f o r 14b0 rolls, pmticular ly when the recovery phase
- i is included.
According t o simple theory (appendix B ) it can be shown that the rate of divergence f o r en unstable condition w i l l be directly proportioned

WCA RM ~ 5 6 ~ 0 6
to the ro l l ve loc i ty and also be adversely dfected when the intersection of the determining l ine with the s tabi l i ty boundary occurs at large dis- tances from the "neck" of the diagram. Thus the magnitude of the motions might be expected to bu i ld up quite rapidly for the delta-wing configu- ration (condition 1, fu. 16) at supersonic speeds. Time histor ies showing the effect of bank angle are presented in figure 21 fo r the delta- w i n g configuration at M = 1.2. A 3600 r o l l is seen t o produce a violent maneuver w i t h sideslip angles greater than 20° and large a excursions. The 180° maneuver s t i l l develops 17.5O of sideslip and 26' i n & (f2g). Even the 90' maneuver, fo r t h i s condition, is accompanied by 12' of side- s l ip bu t the a, amplitudes are considerably reduced.
1
Effect of damping in yaw.- The influence of changes i n kr is sumarized i n figure 22 for the swept-wing configuration f o r a leve l of 0.057. A tenfold increase in Cnr reduces the peak J3 motions appreciably but hae very l i t t l e effect on the maximum angle-of-attack amplitudes. A value of kr 100 times the basic value produced no sig- nificant additional decrease i n the maximum fl anrplitudes although a reduction i n the a motion is evident. Moreover, particularly for the highest dxtnpLng ratio, the peak amplitudes were materially increased at the lower ro l l r a t e s . A s t ab i l i t y diagram of the type used previously d
is shown as figure 23. From the simple theory it might be expected that a more significant improvement would exis t for the two conditions of increased denping i n yaw. Note also that the peak amplitudes of figure 22 #
occur near the same,average r o l l rate, whereas the results of figwe 23 might lead one to bel ieve the mEwdmum excursions w i t h increased dnmping would occur at appreciably higher r o l l rates.
Recalling the results of figure l l ( b ) , the elimination of the rp term i n the 4 equation did not al ter the baaic level of the motion for conditions intersecting the vertical divergence boundary. For conditions intersecting the horizontal divergence boundary (fTg. 12(b)) elimination of the rp term was very effective.
Figures 24 and 25 show the effects of increasing C 4 by factors of 10 and 100 for the extreme conditione 1 a d 5 ( f igs . 4 and 6 ) . The results indicate that the increases Fn Cnr haxe a more significant e f f ec t i n reducing the motions for condition 5 than for condition 1.
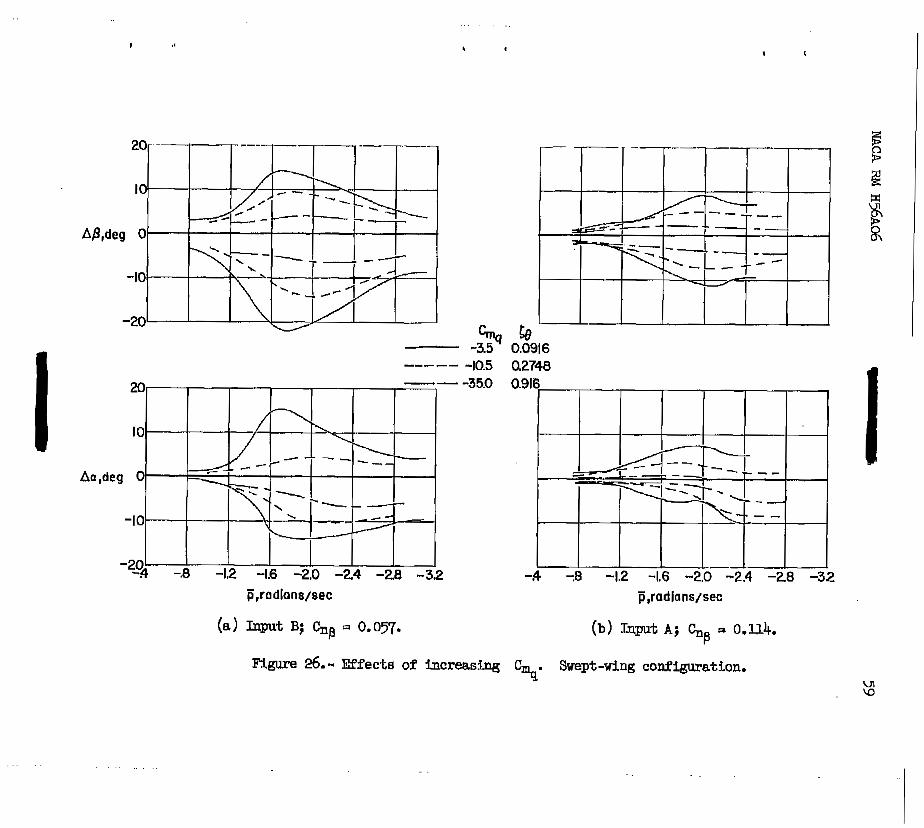
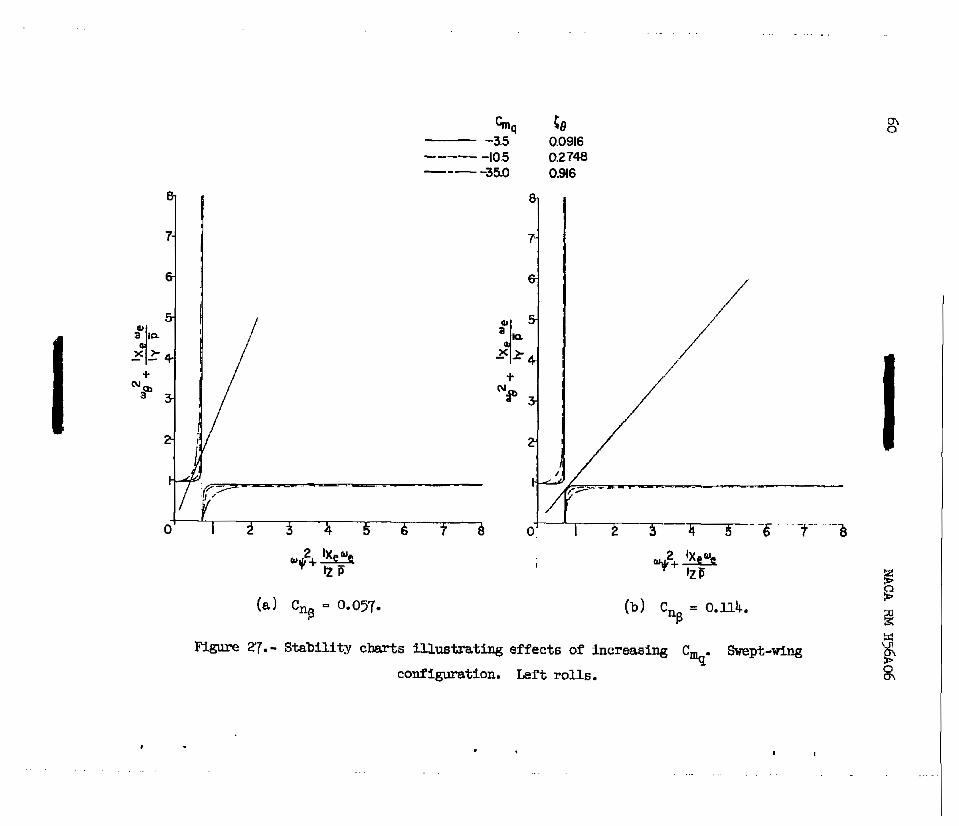
Effect of damping in pitch.- The effects of increasing the basic damping in p i tch for the swept-wing configuration are sunmaxized in f i g - ure-26-for two levels of c ~ It- is seen that a threefold increase i n

NACA RM ~ 5 6 ~ 0 6 - 13
pitch (f8 = 0.27 resu l t s in an appreciable reduction fn the fl motions and so= reduction in the a anrplitudes. A tenfold increase i n $ ((e = 0.9) produces a =ked improvement a t each s t ab i l i t y level. The s tabi l i ty char ts of figure 27 show the effect on the diver-
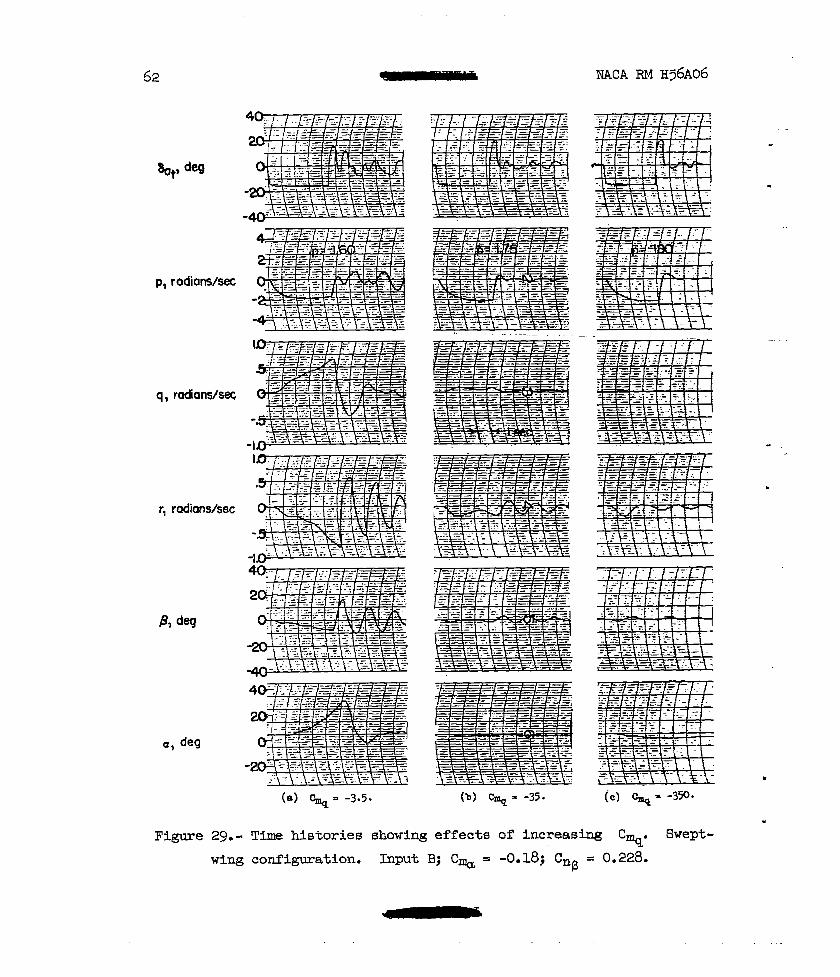
fa i r ly wel l with the trends presented in figure 26. The resul ts of the time histories of figures 28 and 29 show the favorable effects of increases i n % of 10 and 100 times the basic value on the mtions f o r the two extreme basic conditions examined i n the preceding paragraph.
1 a
I gence boundazies of increasing the pitch damping. These results correlate
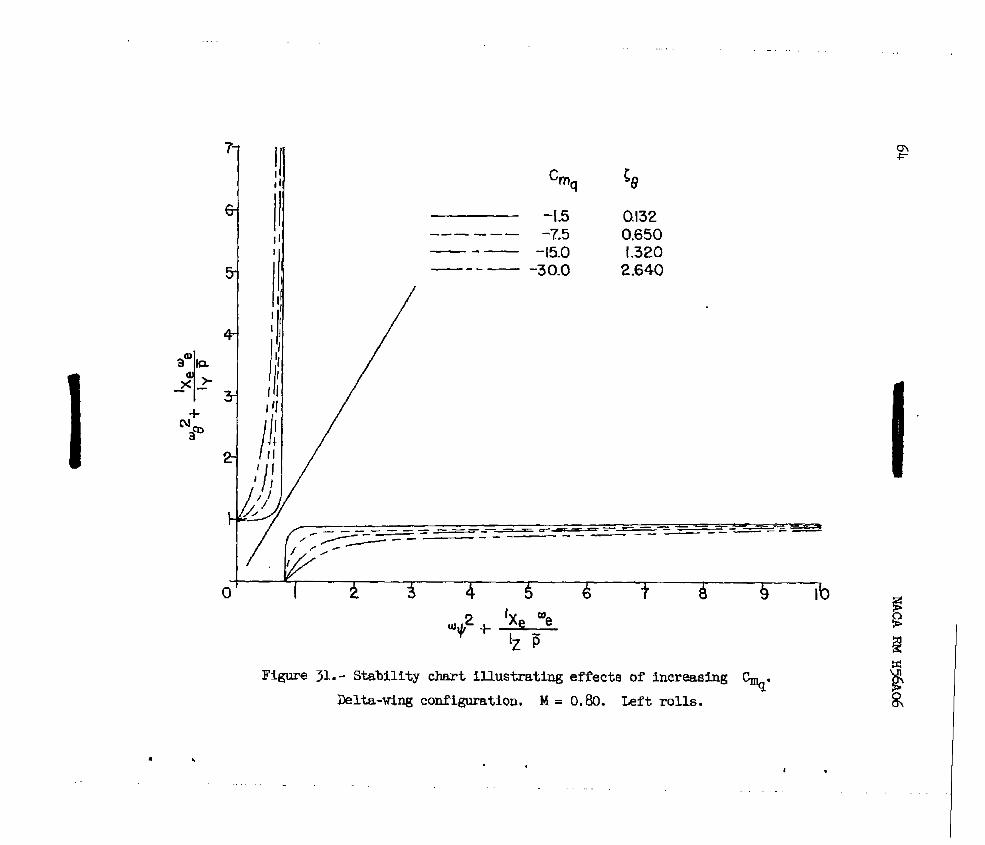
In figure 30 the effects of variations in pitch danq?ing axe pre- sented for the delta" configuration at a Mach m e r of 0 -8. At t h i s Mach rider increasing the l eve l of % shared a considerable improvement but was not quite a~ effective as f o r the swept-wbg con- figuration. The s t ab i l i t y dfnaram is presented in figure 31 for thia flight condition.
A t a Mach number of 1.2 the resul ts shown in figure 32 indicate a relat ively s m a l l effect of increasing QQ u n t i l an extremely large level is assumed. It is believed this condition is caused by the inter-
relative- b g e val~e of the ordinate. It IS seen (fig. 33) that for this condition moderate increases in Cq would be q c t e d t o have only a slight favorable effect.
. section of the basic determinant line with the divergence boundmy a t a
- Effect of atabil izer input. - In the previaus section the inporkant
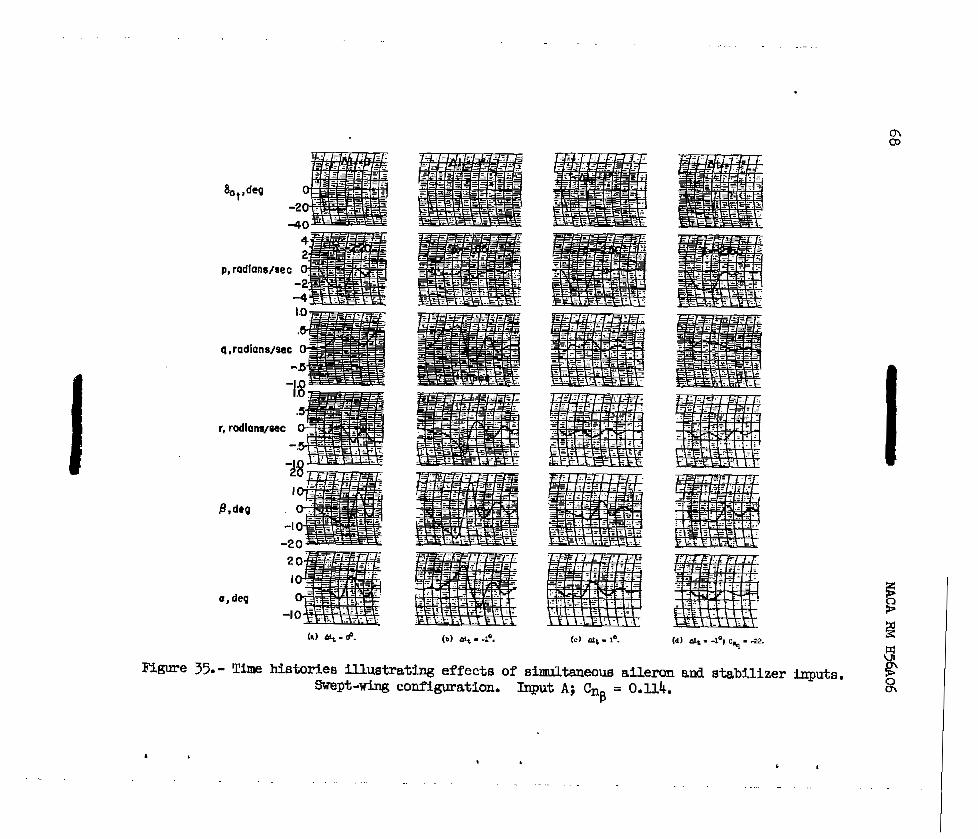
effects of pitch damping were discussed. Inasmuch as these changes are attributable t o reductions in the pit- velocity, it might be reasoned that even small stabi l izer inputs Wing the r o l l s could likewise have ag brgortant effect on the results. Figure 34 presents a summary of resul ts for simultaneous s tabi l izer and aileron fnputs for C, = 0.114. The type of s tab i l izer input used is illustrated in the representative time histories of figure 35- It is evident: that lo of drplane nose-up s tabi l izer resul ts in a 50-percent increase in the mplftudes of the p motions and also produces LEirge increases in the a excursions, whereas a stabilizer input of the apposite sense has a k g e alleviating
B
%e m i n g ratio considering o w + is shown in the figures
- and the lift-curve slope. Thus, for the swept wing airplane (figs. 26
because th i s value was used i n calculating the boundaries shown. O f course, the total angle of attack damping ra t io is also dependent on C q
and 27) the total damping r a t i o will be about 0.16 higher than co, whereas fo r the delta wing configuration (figs. 30 and 33) the t o t a l w i n g ra t io w i l l be about 0.17 higher a t M = 0.8 and 0.07 higher a t M = 1.2. . -

14 - NACA RM 1156~06
effect ( f ig . 34) . The reason for these trends is, of course that the negative stabilizer increases the pitching velocity (fig. 35j while the positive input appreciably reduces the pitching rate. Reference 8 pre- - sents f l ight data showing similar effects of stabilizer inputs. When the basic pitch damping i s Increased about sixfold, much less c r i t i ca l mt ions are experienced for the unfavorable stabilizer input (symbols, f ig. 34). II
Data not presented indicated that somewhat m e posi t ive s tabi l izer inputs than shown in f igure 34 were undesirable. This was at t r ibuted t o the fac t that large negative pitching rates were produced.
It should be noted that, whereas negative stabilizer input agQra- n t e d t h e motions i n t h i s instance, conditions i n which the basic pitching velocity were negative o r instances i n which "conqlementary" s idesl ip were present might be made more c r i t i c a l with positive stabilizer inputs (table I).
It should also be pointed out that large changes i n pitch- moment due to s ides l ip could also have a decided effect on the chmacteristics.
Effect of initial angle of attack.- The effects of initial angle of attack for the swept-wing configuration axe presented in f igure 36 fo r a principal axis inclination of lo at two levels of direct ional s tabi l i ty . Data are presented at a = 5O, lo, and - 3 O or at angles of attack of the principal axis of 24' and Oo. The resul ts shown i n figure 36 indicate that the peak excursions OCCUT at about the same r o l l r a t e for negative and positive conditions of angle of attack with the amplitudes appearing as newly mirror a g e s of each other. This is even more evident in the representative time history plots of figures 37(a) and 37(b), which i l l u s - t ra te the expected diametric opposite nature of the motions. For t h i s flight condition the major disturbing €'unction is produced by the angle of attack of the principal axis through the % term and the I= terms i n the equations of table I (C3 = Cngq = 0). mu, when the principal
exis i s l ined up with the relative wind, easenC,iEtlly no motion is produced. If, however, a small yawing moment is introduced by assuming C 9 = -0.05, then relatively large peak3 amplitudes axe obtained, par t icular ly in regazd to s ides l ip motions (symbols, f ig . 3 6 ) . This is not too surprising if it is considered that near fr = 1.6 r aams / sec an effective insta- b i l i t y i s present fo r the CnP = 0.057 condition. Thus a relat ively small out-of-trim movement could be expected t o produce a sizable effect.
3-
3The yawing moment introduced would have produced about Ap = 2O for a roll r a t e of 1.6 radians if a three-degree-of-freedom uncoupled motion i s assumed.

NACA RpiI ~ 5 6 ~ 0 6 0 15
Similar t r e n h on a s o " k reduced scale are indicated for cnP = 0 x 4 ( f ig . 3 6 ) .
L
A sumna3y plot is presented in figure 38 fo r a principal axis incl i - Y nation of 5O. The overall effects are, as might be expected, w5th the
greatest amplitudee recorded f o r conditions having the W g e s t initial angle of the principal axis. In figure 39 the results of figures 36 and 38 are compared by plotting the maximrnn values shown for any conditions as functions of the initial angle of attack of the principal ax is . The imgortance of t he Letter parameter in correlating the results is at once evident upon inspection of figure 39. The amplitudes were in each case a mil.li.rmun &en c"p = oO.
It should be mentioned tha t if rolling performance at initial g levels of 1 or greater is considered t o be of prFmEtry importance, then 8 moderately large nose-down inclination of the principal axis (posi- ti.ve E) would be beneficial because it would reduce ap.
It is believed that if an appreciable v e u e of or is
present, the angle of attack (f ig . 39) at which min- motions occur would be shifted, depending on the sign and mnanftude of the additional disturbing functions.
.
. The sensi t ivi ty t o change in the Wtial angle of attack is i l lus - t ra ted f o r the delta-wing configuration a t a Mach m e r of 1.2 (fig. 40). Data me presented for initid angles of attack of 2.0' and 3.9' (cp = OO 1.g0) . O n f*st inspection tt seem surprising that such a large motion would be obtained f o r the case of 9 = Oo at high r o l l rate. However, a small value of Cn8% wa8 used (table II) which
provided the necessazy disturb- function. When Cns was assumed
zero (symbols, f ig . 40), essentially no cz or p motions were obtained. %
Effect of a l t i t u k . - The influence of a b g e alt i tude change on the motions developed in rolls i s splown in figure 41. Data m e presented for the swept-wing -lane Cn = 0.057) at initial angles of attack of 2O and 5O and alt i tudes of 10,000 fee t and 32,000 feet . . It should be noted that the initial angles of attack of 2O and 5O correspond to l eve l flight conditions at 10,000 feet and 32, OOO feet, respectively. It is evident from the results that the major effect of decreasing altitude (at constant Fnitial a) is t o d e w the bufldup of large motions t o a higher averwe r o l l velocity. F r o m the loads standgoint, of course, much more cri t ical condftions could be obtained a t the lower alt i tude
lower resonant frequency calculated from equation (I) is noted by ticks
( s
-
- because of the two- and one-half-fold increase i n dyllEtmic pressure. The

f o r each a l t i tude and it is appment that the hc rease i n average roll velocity at which largest c0uplb.g effects occur is predicted rather w e l l from the simple theory. It might be mentioned that the decrease in maxFmum amplitude at the lower altitude is possibly attr ibutable to the 60 percent increase i n dmping r a t i o in pitch C q assumed invaziant with altitude). a (
Effect of yawing moment due to ro l l . - For most of the calculations a value of C 9 = 0 w a s aElsumed fo r the swept-wlng configuration. Fig- ure 42 shows the effects of -@;e arbitrazy increases in c”p for
CnP = 0.057 and 0.114. For. the lower value of % an increase in C
t o 0.10 is seen t o reduce appreciably the s ize af the motions obtained. A further increase t o 0.20 produces rather violent motions at a relat ively low r o l l rate. For a value of Cn = 0.114 an increase in C t o
either value has a deleterious effect on the aaxm amplitudes.
”p
B %
It was mentioned in the discussion of initial angle-of-attack effects that changes i n C or C w h i c h might al leviate the motions for
certain a. could aggravate the coupling problem for other initial angles of attack. Figure 43 shows the effects of introducing a value of Cnp = 0.10 (Cnp = 0.057) i n roLlFn@; maneuvers performed at = 5° and -3O. For a. = 5’ the favorable effect of increasing cnp is c
clearly shown (f igs . 43( a) and (b) ) and probably results f m m the large change in the yawing velocity buildup. When the r o l l is made at = - 3 O , however, the positive Cnp is seen t o aggravate the motion appreciably.
llp ngat
Effect of C2 .- A number of C2 variations were investigated for B
the basic swept-wing configurations (Cna = 0.057). Figure M(a) illus- t ra tes the effect of doubling the ordinates of the C variation wf th
OL (table 11). No appreciable change i n the aq l i t ude of the motions i s indicated.
ZB
Unswept-wing configurations are generally characterized by much smaller variation in C2 with a than are swept-wing configurations. It was decided, therefore, t o study the effects on the r o l l coql ing problem for three constant levels of C Figure 44( b ) presents the
resul ts for C values of 0, -0.063, and -0.126 per radian. The data
indicate that as the level of i s increased the peak motions occur
at a sl ight ly higher rol l ra te , but the peak amplitudes m e not much reduced. Another aspect of the problem resu l t s from the conibination of
B
28
28

high dihedral effect and adverse sideslip which reduces the average r o l l velocity attaFnable f o r a given aileron deflection (fig. 44). Thus, for - the highest C2 level if meximLllzl aileron deflection is limited t o 30'
B (although -14O of sideslip would be obtained), the angle-of-attack excur-
-1.60 radians per second (fig. @(b)). 8 sions would be greatly reduced at the mxinmm obtainable roll rate of
Effect of mass distribution.- The irqmrtance of the mass distribu-
tion puameter is treated in this section. In figure 45 data
me presented i l lustrating the effects obtained in changing from a
configuration with i ts mass concentrated a long the Fuselage Iy T_ - Ix = 0.9
=Z
AZ t o a conditLon of mre equi table dis t r ibut ion - IX = 0.2. In this
IZ study the inertia in yaw Iz was held constant (table In).
For a Cn level of 0.057 it would appear that reducing the mass B concentration along the fuselage, such that IY - 'X is reduced -om
IZ - 0.90 t o 0.50, results in a sl-t decrease in the peak amplitude of the motions and &ZL increase in the rol l ve loc i ty at which these peak values occur. A further reduction in the inertia r a t i o t o 0.20 appears t o
theory, a s tab i l i ty p lo t has been prepared (f ig . 46). The lower resonant frequency is hdica ted by the ticks on figure 45. As has been demon- strated previously i n this paper, the slnq?le theory adequartely predicts
the trends. AB the MESS distribution factor - IX is reduced, the
resonant frequency is of course raised and the intersection of the sta- b i l i t y line is changed from one ind ica thg an appreciable B divergence t o an intersection tangent to the CL divergence aide of the boundary. A series of representative tine histories shuwing the basic chazacter of the motions for near peak cozrpling conditions i s presented as fig- ure 47. Note that the large value of IX associated with the lowest iner t ia ra t io reduces the r o l l i n g acceleration t o such a d e s e e that a much higher aileron deflection i s required to obtain a given average r o l l r a t e in the 360° maneuvers. Otherwise, the general character of the motions developed is quite similar.
.I Improve the situation appreciably. To compare these trends with s-le
=Z
For the Cn level of 0.114 ger radian, the s u m m y plot ( f ig . 45) B indicates very l i t t l e d i f f e rence in the iner t ia range from 0.5 t o 0.9. Moreover, for the conation of most equal mass distribution, IY - IX = 0.2,
IZ
NACA RM ~ 5 6 ~ 0 6 18
the result a are seen t o b sLlghtly worse than f o r the other conditions. The reason f o r this condltion can be eq la ined w i t h the a id of the sta- bi l i ty char t of figure 46. For this s tabi l i ty level , as the mass i s pro- gressively more evenly distributed, the characteristic stability l i n e intersects further in the a divergence side of the boundary.
General Design Considerations
In the foregoing analysis vaxious individual effects have been examined relat ive to the r o l l coupling problem a t several flight condi- t ions. A contempormy swept-wing airplane designed fo r Mach nunibers near 1.7 i s now examined b r i e f ly t o assess the r o l l coupling problem and also t o determine how the results of the previous sections apply to the airplane.
It should be noted in the airplane design under consideration (tail C of ref. 8) the ver t ical tail size w a s primarily dictated by s t a t i c s t a b i l i t y considerations at design supersonic Mach ntzmber. The longitudinal s t ab i l i t y corresponded t o a s t a t i c m g i n of about 10 percent at subcrit ical speeds w i t h the usual W g e increase in stability occurring at transonic speeds.
Firs t , a r o l l s t a b i l i t y diagram is constructed (fig. 48(a)), t o illu6- c
t ra te the e f fec t of Mach number on the s t ab i l i t y proportioning. The deriv- atives used were taken from unpublished data ( t a b l e N). The s t ab i l i t y diagram indicates that a t M = 0.73 the proportioning of longitudinal t o . direct ional s tabi l i ty is near optimum, whereas a t M = 0.93 and M = 1.26 the n o m 1 rearward aerodynamic-center shift produces a less desirable intersection. The flight envelope of the airplane is presented as fig- ure 48(b). The solid lines represent lines of constant lower resonant frequency (calculated from data of table. IV) and the dashed l ine indicates the mEurimum capabili t ies of the ai lerons in re la t ion to the average roll velocity obtainable in 360° rolls from i n i t i a l l g flight.
For t h i s airplane, in almost the entire supersonic flight range, the average roll rates available are considerably l m r than the roll velocity a t which the most violent maneuvers might be expected. A t moderate sub- sonic speeds the ailerons are capable of producing roll r a t e s i n which ser ious rol l coupling could be obtained; however, the desirable propor- tioning of longitudinal and direct ional s tabi l i t ies would be expected t o have an alleviating effect on the amplitudes of the motions.
The use of figure 48 f o r a quick assessment of the roll coupling problem i s obvious. It should be realized, however, that conditions fal l ing s l ight ly to the r ight of the available aileron power l i n e can also produce large motions as indicated in previous sections of t h i s paper. This condition i s particularly important when the increase in dynamic pressure i s considered. Preparation of a figure similar to f igure 46 at

NACA RM ~ 5 6 ~ 0 6 19
.
a number of g levels supplemented by a knowledge of principal axis incl i - nation would appear t o be a logical first step Fn a r r i v k g at c r i t i c a l conditions fo r detailed analog calculations.
As indicated in reference 8, a comprehensive r o l l investigation of the a i rpbne (full aileron 360° r o l l s ) has been w e p a r t i c u r - a t the flight conditions shown by the symbols i n figure 48. A t supersonic speeds, no serious coupling problem has been encountered In f l ight . A t M = 0.73, although no violent m e u v e r s were experienced, the motions obtained were fair ly large and were sensitive to inadvertent longitudinal control motions. A t M = 0.93 f a i r ly large motions were also. obtained and calculations indi- cated that, had slightly higher aileron deflections been available, a rather serious maneuver might have been encountered.
It would appem tha t the airplane of reference 8 is acceptable f r o m the overall r o l l coupling standpoint. W e d on the resul ts of figures 26 and 34, however, a substantial Increase in pitch d a q t n g would materially Improve the situation at subsonic speeds both f o r r o l l s made w i t h and without inadvertent s tab i l izer inputs. At supersonic speeds the aileron power was considered more than adepate by the pilot, although the average r o l l rates were slightly lower than a t subsonic speeds.
To summzize, then, it w d d appeaz that present design practice (adequate s ta t ic d i rec t iona l s tab i l i ty at design high-speed Mach nmiber and moderate longi tudlnd s tabi l i ty at subcritical speeds) would probably furnish a good s t a r t i n g p o b t in obta- acceptable motions in rollFng maneuvers. It might be desirable, however, t o insure the presence of & ~ 1
adequate margin between the lower resonant frequency and the average r o l l velocity obtainable from the ailerons at supersonic speeds. In this con- nection it should be s.tated that the ailerons should be designed so that excessive roll rates are not attainable particularly at srrpersonic speeds. Fina l ly , U a pitch mer producing a t o t a l damping r a t i o on the order of 0.7 to 1.0 at subcri t ical qeeds is used, the tendency for serious roll coupling ef'fects in this speed rmge w i l l be minimized.
A f a i r l y ccmgrehensive five-de-e-of-freedom analog st- of the r o l l coupling problem for a gene ruzed swept-wing and far a tailless delta-wing airplane configuration has been cqple ted and the followtng conclusions are in order:
1. The various aeroaynamic and M i a pertlameters considered indi- cated:
( a ) The relationship of the longi tudind and afrectfonal stabilities is of paramount importance. An optimum condition exists wken the resonant frequencies in p i t ch and yaw are approximately equal.

20 NACA RM ~ 5 6 ~ 0 6
(b) Incresses i n pitch damping had a pronounced favorable effect in reducing the amplitudes of the motions encountered and were, in general, considerably more effective than corresponding changes i n yaw damping.
( c ) Changes i n mass distribution i n the pract ical range produced only re la t ively s m a l l effects.
(a) Alterations in the yawing mment due t o rolling Cap although sometimes producing favorable effects would not be useful in alleviating the coupling problem throughout the -le-of-attack range.
( e ) chasges i n the ro l l ing moment aUe t o s ides l ip pazameter could produce significant lmprovements under certaiu condLtions. cz$
2. A study of the effects of flight condition revealed that:
(a) The amplitude of ’ the motions develqped depends t o a lmge extent on the duration of the maneuver. Limited studies indicated that 900 r o l l maneuvers w o u l d be considerably less critical than 360° rol ls .
(b) Small, inadvertent s tabi l izer inpts can e e a t l y affect the motions that would otherwise be obtained.
( c ) The engine gyroscopic terms can cause r o u in one direction to be somewhat more c r i t i c a l than corresponding roUa in the opposite direc- tion.
(a) The i n i t i a l angle of attack of the principal axis has an impor- tant bearing on the amplitude of the motions, p&iculzxly i n the absence of other disturbing functions.
( e ) For a given initial angle of attack a reduction in al t i tude will delay cri t ical conditions to a higher roll. rate, but the maximm amgli- tudes may be affected only slightly.
( f ) The effects of var ia t ions in Mach llumber cannot easfly be gener- alized since there are l i k e l y t o be changes i n most of the controlling parameters.
3. Utilizing simple concepts proved usef’ul i n assessing the q W i - ta t ive effects of many of the aerodynamic and i ne r t i a parameters and changes i n flight condition. The calculated lower resonant frequency generally corresponded t o the average ro l l ve loc i ty at which the more serious motions could be expected.
8

4. It is reasoned that ra t iona l d e s i g n procedure can avoid the problem of serfou r o l l coupling at supersonic speeds and mizimize the - problem at subsonic speeds fo r the configurations of the type considered.
8 High-speed Flight Station, National Advisory Committee f o r Aeronautics,
Edwazds, C a l i f . ; Deceniber 20, 1955.

22
APPENDTX A
NACA RM ~ 5 6 ~ 6
If the equations at the top of page 9 of NACA TN 1627 (ref. 2) are
IX, the equations become i n the notation of reference 2
written t o include the engine inertia terms and actual value of 17, - IY
where
.
e angle of pitch relative to f l ight-path direction, radians
tf angle of yaw relat ive t o flight-path direction, radians
PO steady rolling velocity, radians/sec
Then, as in NACA TN 1627, assuming
t ' = p o t and D=-=-- d 1 d d t ' po d t
equations (1) and ( 2 ) become

The determinant of c
equations (3) and (4) is
The determinant mey be expanded t o give the quartic
d + b $ + c I ? + d D + e = O
The divergence boundary is obtained by setting the coefficient e = 0
- if fe = Cs = 0 then equation ( 5 ) becomes
from which it can be sham
IGUe if oQ2 + %% is plotted as ordinate and %* + - as abscissa,
IYPO *z?O
24 - NACA RM -A06
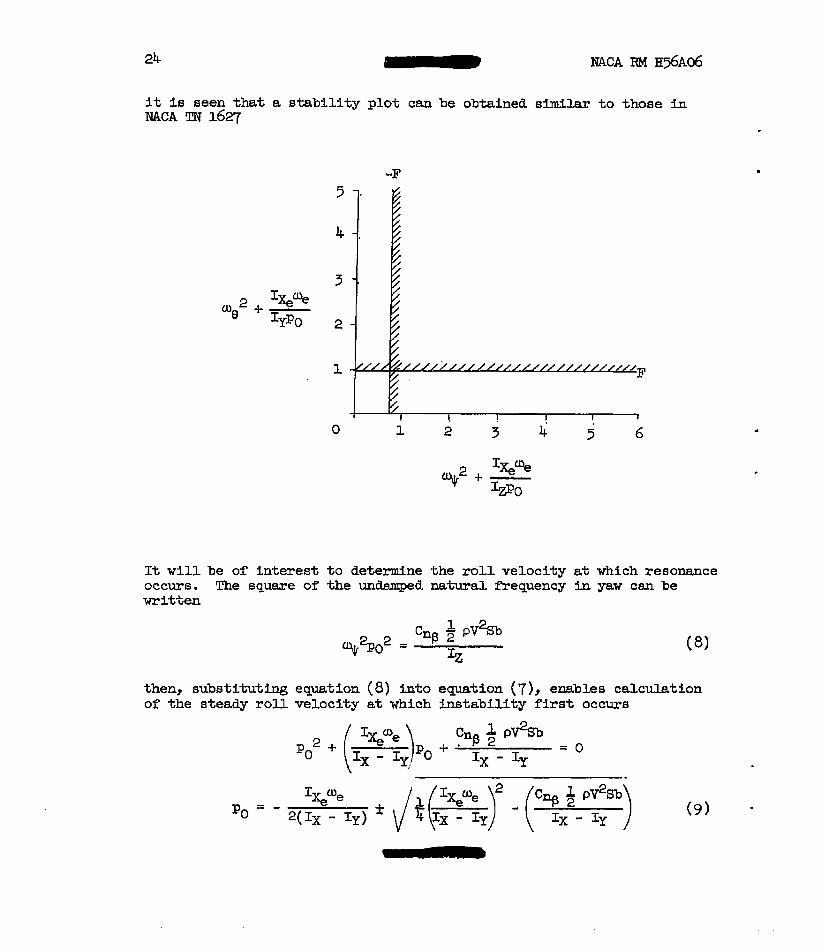
it is seen that a s tab i l i ty p lo t can be obtained similar t o those in WCA 9 3 1627
-F
It w i l l be of i n t e re s t t o determine the roll velocity at which resonance occurs. The s q w e of the w e d aatural frequency in yaw can be written
then, substituting equation (8) into equation (7 ) , enables calculation of the steady ro l l ve loc i ty at which instability first occurs
= o

T
Inasmuch as the engine term inside the radlcal is usually e m a l l relative - t o the directional stabil i ty term, equation ( 9 ) can be simglified t o
applicable when the &irectional divergence boundary is Fnterseded f irst as r o l l velocity is progressively Fncreased. S l m i b r l y it can be shown
applicable when the pitch divergence boundary is ffrst crossed.
These equations indicate that left ro- ill have a s e t lower resonant frequency than right r o l l s for right-hand engine rotation.
For the practical condition of finite damping in pitch and yaw, it - appears the boundmies can be calculated as i f engine terms were neglected (ref. 2) and then used with the modified parameters t o account for the engine - inertia. effects.
.A

26 NACA RM ~ 5 6 ~ 0 6
The effects of roll r a t e and the basic praportioning of longitudinal t o d i r ec t iona l s t ab i l i t y on divergence r a t e can be examined by t reat ing a simple condition of zero -in@; and by neglecting the engine terns of equations 1 and 2 of appendix A. If these assumptions are made, the determinant of equations 3 and 4 of appendix A can be expanded t o give
w
a & + c D 2 + e = 0
mere
This equation can be solved as a quadratic i n $ as follows:
2 mT)2 - + - We2F + FF'
The value of the positive real root D of the preceding equation w i l l determine the nondimensional t i ne to double amplitude i n accordance with the f o m l a
v 2 = 0.693 osi t ive real root
where t t 2 i s the nondimnsional tine to double q l i t u d e .

Consider the specified points i n the unstable portion of the following s t ab i l i t y chmt
-F 7
€
5
4
3
2
1
0 1 2 3 4 5 6 7
If -F = 0.71 and F' = 0.95 then the positive r e d root f o r the points considered will be a~ p
6.0
follows :
Positive real root 1 t '2 1 0.228
319
357
:q 1.94

28 __u NACA RM ~ 5 6 ~ 0 6
Thus it would be expected that i f the vertical displacement of the three points considered is caused, for e m l e , by C& w i a t i o n ( t h e ra te of roll therefore being identical) the higher the location of the point in the unstable region the greater the ra te of divergence.
If on the other hand the s tabi l i ty level of both Cm, and Cnp
are altered such that a given point in the unstable region is attained at a different roll rate, it would appear that the rate of divergence would be proportioned t o roll r a t e inasmuch as
where t 2 is the time t o double amplitude meqsured in seconds.

WCA RM H56A06 29
1. Bird, John D., and Jaquet, Byron M.: A S t u d y of the Use of Experi- 8 mental Stability Derivatives fn the Calculation of the Ia teral
Disturbed Motions of a Swept-Wing Airplane and Comparison With FUght Results. NACA Rep. lO3 lY 1951. (Supersedes NACA TN ml3- )
2. P h i l l i p s , William H.: Effect of Steady R o w on Longitud3nal and Directional Stability. NACA TW 1627, 1948.
3. White, R. J., Uddenberg, R. C. , Murray, D., and Grabam, F. D. : The Dyaamic Stabi l i ty and Control Equatione of a Pivoted-Wbg S q ~ e r s o n i c P i l o t k & s A3rcraft, With Damwash, Wake and Interference Effects Included. Doc. No. D-8510, Boeing &craft Co., Jan. 9, 1948.
4. .NACA High-Speed Flight Station: Flight Ekperience With Two High-Speed A i r p l a n e s Ea- Violent Iateral-Longitudinal C o u p l i n g Fn Aileron R O U S - NACA RM H55AI-3, 1955.
5. Weil, Joseph, Gates, Ordway B., Jr., Banner, Richazd D., and Kuhl, Albert E. : Flight Exprience of Inertia C o u p l i n g in RoJ7ing Maneu- vers. . NACA RM D5El’lby 1955.
6 . Gates, Ordway B., Jr., Weil, Joseph, a d W o o d J i n g , C. E.: Effect of Automatic Stabilization on the Sideslip and Angle-&-Attack D f s t u r b - ances in R o l l i n g Maneuvers . WCA €34 I35E25bY 1955.
7. Gates, Ordway B., Jr., and WoodlFng, C. H.: A Theoretical h l y s f s of the Effect of Engine Angular Momentum on Iongitudhal and Birec- t i ona l Stability i n Steady Rolling Maneuvers. EACA RM r55GO5, 1955.
8. Finch, Thomas W. , Peele, James R., and. w, Rfchard E. : Flight Iwes- t igat ion of the Effect of Vertical-Tail Size on the R o l l i n n Behav- i o r of a S t r e p t - W f n g A i r p l a n e Having Lateral-LongituaFnal Couplfng. NACA RM H55L28aY 1956.

u 0
Ge, Be angles betveen the bcdy axia and earth gravity axis
. . .

NACA FM H56A06 - 31
M = 0.7 M = 1.2 M = 0.8
Basic flight condition
h p , f t - . . . 40,000 40,000 92,000
1 pV2, lb/sq ft . . V, ftlsec . . . . .
5.0 %,deg.. . . . . 1,165 TT7 6gO
1.0 1.33 1.0 no, g . . . . . . . 3.9 8.0
(po, deg . . . . . . 0 0 0 deg 0 1.0 0.8
2 395 175 197
. . . . . %’ Physical characteristics
E , f t . . . . . . . s, s q f t . . . . . b,f%. . . . . . . rn, slugs . . . . . Ix, slug-ft2 . . . Iy, slug-ft2 . . . Iz, slug-ft2 . . . I,, Slug-f@ . . . I&Ue, slug-ft2 . . E, deg . . . . . .
u = 3 36.6 377 745
10,976
57,100
64,975
942
17,554 1.0

-e Qrirativss for baeic illght -ti-
%+, por redinn. . . . . . . . . . . . 0 0
-,par- . . . . . . . . . . . . 3.88 2.78
cq,perradisn . . . . . . . . . . . . -3.5 -1.9 cw&parw . . . . . . . . . . . . 4 %
cplt, p r r.bi.n . . . . . . . . . . . . -1.0
Cqt,perr.bim . . . . . . . . . . . . 4. Is -1.5 4.5
-pa-radlrn . . . . . . . . . . . . 0 0 Cg.pcrr.btan . . . . . . . . . . . . 0 0 *pmradian . . . . . . . . . . . . -0.63 -0.140 kg, per &en . . . . . . . . . . . . 0.057 0.070
cn&,smrradirn . . . . . . . . . . . . 0 0
c&, psrradisll . . . . . . . . . . . cw per r- . . . . . . . . . . . . o r p , par . . . . . . . . . . . . orrr par radian . . . . . . . . . . . . efg, psr lnd iu l . . . . . . . . . . . . cyB, perrdlan . . . . . . . . . , . . C l g , rmrr.dien . . . . . . - . . . . . czr' rn rBbicn . . . . . . . . . . . . CIL, per radLan . . . . . . . . . . .
0
* 0
0
4.d 0
4-eY
o.oSn 0.W
-0.014 t
0 0
4-57
0
-0.195
0.070 0 . m
C I frer radian. . . . . . . . . . . . Is,
C I P pg radi.n . . . . . . . . . . . . C,$ par redlnu . . . . . . . . . . . .
*19 1

T NACA RM H S C 6 33
TABLE IV
M
0.6 -7 .a =9 1.0 1.2 1.4
0.100 0 loo 0 100 . l l o 0 114 .lo3 9 6 3 I
Note: The physical and mas8 characteristics used to calculate figure 48 were the characteristics of the swept-wing airplane of table 11.

34 I NACA PJd HSAOG
. .. . . ..
.

NACA RM H ~ A O ~

. . . . .
Divergence
Figure 3.- Representative chart defining stabWty boundaries.
I
NACA RM ~ 5 6 ~ 0 6
AQ, deg
I
37
- p, radians/sec
Figure 4.- Effect of % variation. Swept-wing configuration;
c a p = 0.057; input B.

NACA RM ~ 5 6 ~ 0 6
% Condition
Aa, deg
- p, rodions/sec
Figure 5.- Effect of C% variation. Swept-wing configuration;
CnP . = 0.114; input B.

NACA RM H56AO6 u 39
2c
I C
AB, deg C
-I c
Aa7 deg
.
Figure 6.- Effect of C& variation. Swept-wing configuration;
Cnp = 0.228; input B e

71 ‘ E t 0
4/
O+ I 2 3 4 5 6 t 8 9 16 1
Z P 2+*
Figure 7.- Stability boundaries for swept-wing configuration. Left rolls.
.. . .. . . . . . . . .. . - . . . . . . . . . .

T NACA RM 1356~06 Ilr
sot, d@g
p, mdimdsec
q, radiandsec
r, rodians/sec
8, de0
(b) Condition 2; ' cm, = 4-36.
Figure 8.- Representative time histories for swept-wing configuration. Input B; Cn = 0,057. B

42
”
e
NACA RM ~ 5 6 ~ 0 6

44 NACA RM H S A 0 6
Figure 11.- Relative importance of various terms in equations of motions. Swept-wing configuration. Input B) Cma, = -0.72; CnB = 0.057.

NACA RM H56A06
.
46 NACA RM ~ 5 6 ~ 0 6
'1? -27 2 '136 I
jj, radianshec
Figure 13.- Effect of & variation. Delta-wing configuration; M = 0.8; input A.
NACA RM ~ 5 6 ~ 0 6
20
10
0 b
-I 0
A a , deg
- 2 o L -0.543 0,051 I -0.362 0.051 2 -0.543 0,102 3
""
"-
p, rodians/sec
Figure 14.- Effect of Cma and C, combinations. Delta-wLng P configuration M = 1.2; input A.

. . .
I I

I .
3 4 9
Figure 16.- Stability bouradary for delta-* configuration. M 9 1.2. Left rolls.
. .

. . . .
ul 0
Left "" Rlght
si, radlans/sec B,radlans/sec
(a) Input B; hp = '0.057. (b) Irrpue A; Cnp = 0.114.
Figure 17.- Effect of mU. airection. I Swept-wing configuration.
. . . . . . . . . .

. . .

.. . .
p, radlans/sec
(a) Input B; C, = 0.057. B Figure 19.- W e c t of r o l l duration.
. . . . . . . . . . . . . . .
@,radtons/sec
(b) 33pt A; C, = 0.114. B Swept-wing configuration.
. . . . . . . . . .
I

5'1.
q, radians
r, radions/sec
NACA RM H56AO6
. .. "
t
Figure 21.- Representative time histories showing roll duration effects. Delta-wing configuration. Input A; M = 1.2.

NACA RM H56AC6 55
p, radionshec

NACA RM ~ 5 6 ~ 0 6
cn, 59 -0.095 0.033 8 -0.95 0.338 _””
--- -9.5 3.38
Figure 23.- Stability chart illustrating effects of increasing Cnr. Swept-wing configuration. Left rolls.

c
NACA RM ~ 5 6 ~ 0 6 - 57
Figure 24.- Time histories sharing effect of increasing Cnr. Swept- wing configuration. Input B; % = -0. '72; kp = 0.057.

- NACA RM ~ 5 6 ~ 0 6
. . .
( a ) C& -0.095. (b) % m -0.95. ( c ) c+ = -9.5.
Figure 25.- Time histories shoKing effects of increasing Cnr. Swept- wing configuration. Input B; cmcl, = -0.18; Cnp = 0.228.
.
1
. . . . . .
c, -35y "_ - -10.5 -35.0
ks GI -3.5 0.0916 10.5 0.2748 35.0 0.916
""_ - "- -
(a) Cnp 0.057. (b) C = 0.114.
Hgure 27.- Stabi l i ty charts illustrating effects of increasing C Swept-wing
configuration. Left rolls. ms'
cn 0
I

NclcA RM H m 0 6
p, radians/sec
q, radiandqc
r, radians/sec
(a) L+ = -3.5-
* Figure 28.- Time histories
wing configuration.
(4 % = -350.
I ~harln@; effects of increasfng C Swept - nh' ~ p t B; = -0.72; C, = 0.057. B
62 I NACA RM ~ 5 6 0 6
. . ..
Figure 29.- T i m histories showing effect8 of increasing C Swept- ms‘ w i n g configuration. Input B; C% = -0.18; CnP = 0.228.

M C A RM H56A06
AQ
.
-20- % ' 8 - 1.5 0.132 -7.5 0 650
I .3 20 """
"- - 15.0 -30.0 - "- 2.640
-2.8 -3.2
p, radionshec
Figure 30.- Effect of increasing %. D e l t a - w i n g confLguration.
M = 0.80; input A.
1 I//
.~ . . . . . . . . .
o\ e
cmq ‘8
-1.5 0.132 -7.5 0.650
-15.0 1.320 2 640
““”
“-
” - -
Figure 31.- Stability chart illustrating effects of incresshg hlta-wing configuration. M = 0.80. Left ro l l s .
. . .

T NClCA RM E56A06
- p,radians/sec
Figure 32.- Effects of increasing %. Delta-nLng configuration. M = 1.20; fiput A.

.. . . .
f
I - 0.7 a036 -7 .O 0356
-14.0 1.01 2 -70.0 35 6
”“”
”- - - ”
_ c ””“ ”””””
Figure 3’5.- Stability chart illustrating effects of increasing 9‘
Delta-wing configuration. M = 1.20. kft rolls.
. . . . .

NACA RM ~ 5 6 ~ 0 6 - 67
AQ
"
0' "- I ""- - r
0 "I Cmq=-22
p,radions/sec
Figure 34.- Effects of s" taneous a i leron and stabil izer inputs. Swept-wing configuration. C, = 0.U-4; input A. P
m
. . . .. . .
. .. . . . . . . . . . . . . - . . . . .

1
”””
”-
20
IO
ha,deg 0
-10
-20 -4 78 -12 -16 -2.0 -2.4 -2,8 -3.2
0 0
- 0.05
-A -B -1.2 -1.6 -20 -2.4 -28 -3.2 P,radlons/sec p, radionwsec.
(a 1 -ut B; cnp a 0.0~. (b) Bput A; C, = 0.114.
Figure 36.- Wects of varying Initial angle of atlack. Swept-- configuration. E = 1’.
B

- NACA RM ~ 5 6 ~ 0 6
p, rodionspec
q , radians/
r , rodians/
.. .
.. .
Figure 37.- Time histor ies showing effects of different initial angles of attack. Swept-wing configuration. E = 1'.

I
30 I I I I I I I
-1
.. ."..

NACA RM ~ 5 6 ~ 0 6
APmax, deg
-20 f / ’I /
Figure 39.- Varia t ion of peak motions with initial angle of at tack of principal axis. Swept-wing configuration.

OT WCA RM ~ 5 6 ~ 0 6 73
p, radionwsec
Figure 40.- Effects of initial angle of attack. Delta-wing configura- tion. M = 1.2.

. .
4 F
Aa
p, radions/aec p,radlans/sec
(a) q, = 2'. (b) = 9.
Figure 41.- meet of alt i tude. Swegt-wing configuration. rxrput B; = 0.057.
.

20
10
-I 0
-20 c”p 0 0. I 0.2
”””
-”
XI
10
Aa,deg 0
-10
-20 -4 -B -1.2 -1.6 -2.0 -2.4 -28 -3.2 -A -B -1.2 -L6 -20 -24 -2.8 -3.2
p,radlans/sec p, radians/sec -
Figure 42.- Effects of Increasiag %, , Swept-wSng configuration.
.. .

Figure 43.- Time histories showing effecte of C!,, P
d
I increase a t two values o f initial angle o f
m 8
attack. Swept-wing configuration. Cn!3 = 0-057-
6 cn
. . . . . . . .

Bask ($ (Table I1 1
””” Twice baslc CL, 0’
””- -0.063

p, rodlans/sec
(a) Input B; kB = 0.057.
""" 50 .7 I "- I
P,radians/sec

I I 1 I
0 I
GS 0.057
,114 """
.50 71
/ /
/ I
/ /
/
90

80 NACA RM H B 0 6
40 20
8, + .dag 0 -20 -40
4 2
pl radlanslsec 0 - 2 -4 I .o .5
q radians /sec 0 -.s -1.0 18 .5
r , radlanwsec 0 -.s
2 8 10 0
-10 -20 X)
IO 0
-10
(a) - O . P . lz
(b) e I 0.p. r, ( c ) - 0.71. (a) p - 0.w.
Figure 47.- Time histories showing effects of variations i n mass distri- bution. Swept-wing configuration. CnP = 0.057.

60
5 0
40
hp, f t 30
20
IO
0
(a) %ability chart Illustrating effect8 of M.
(b) Flight envelope ehawlng lines of constant lower resonant fie- qmncy and aileron capabilities.
Swept-wing configuration. Initial level flight.