
RESEARCH LABORATORY A Foreign Object Damage Event Detector
27
James A. Turso QSS Group, Inc., Cleveland, Ohio A Foreign Object Damage Event Detector Data Fusion System for Turbofan Engines NASA/TM—2004-213192 August 2004 ARL–TR–3201 AIAA–2004–4047 U.S. ARMY RESEARCH LABORATORY Jonathan S. Litt U.S. Army Research Laboratory, Glenn Research Center, Cleveland, Ohio https://ntrs.nasa.gov/search.jsp?R=20040110831 2019-04-04T11:16:08+00:00Z
Transcript of RESEARCH LABORATORY A Foreign Object Damage Event Detector

James A. TursoQSS Group, Inc., Cleveland, Ohio
A Foreign Object Damage Event DetectorData Fusion System for Turbofan Engines
NASA/TM—2004-213192
August 2004
ARL–TR–3201AIAA–2004–4047
U.S. ARMY
RESEARCH LABORATORY
Jonathan S. LittU.S. Army Research Laboratory, Glenn Research Center, Cleveland, Ohio
https://ntrs.nasa.gov/search.jsp?R=20040110831 2019-04-04T11:16:08+00:00Z

The NASA STI Program Office . . . in Profile
Since its founding, NASA has been dedicated tothe advancement of aeronautics and spacescience. The NASA Scientific and TechnicalInformation (STI) Program Office plays a key partin helping NASA maintain this important role.
The NASA STI Program Office is operated byLangley Research Center, the Lead Center forNASA’s scientific and technical information. TheNASA STI Program Office provides access to theNASA STI Database, the largest collection ofaeronautical and space science STI in the world.The Program Office is also NASA’s institutionalmechanism for disseminating the results of itsresearch and development activities. These resultsare published by NASA in the NASA STI ReportSeries, which includes the following report types:
• TECHNICAL PUBLICATION. Reports ofcompleted research or a major significantphase of research that present the results ofNASA programs and include extensive dataor theoretical analysis. Includes compilationsof significant scientific and technical data andinformation deemed to be of continuingreference value. NASA’s counterpart of peer-reviewed formal professional papers buthas less stringent limitations on manuscriptlength and extent of graphic presentations.
• TECHNICAL MEMORANDUM. Scientificand technical findings that are preliminary orof specialized interest, e.g., quick releasereports, working papers, and bibliographiesthat contain minimal annotation. Does notcontain extensive analysis.
• CONTRACTOR REPORT. Scientific andtechnical findings by NASA-sponsoredcontractors and grantees.
• CONFERENCE PUBLICATION. Collectedpapers from scientific and technicalconferences, symposia, seminars, or othermeetings sponsored or cosponsored byNASA.
• SPECIAL PUBLICATION. Scientific,technical, or historical information fromNASA programs, projects, and missions,often concerned with subjects havingsubstantial public interest.
• TECHNICAL TRANSLATION. English-language translations of foreign scientificand technical material pertinent to NASA’smission.
Specialized services that complement the STIProgram Office’s diverse offerings includecreating custom thesauri, building customizeddatabases, organizing and publishing researchresults . . . even providing videos.
For more information about the NASA STIProgram Office, see the following:
• Access the NASA STI Program Home Pageat http://www.sti.nasa.gov
• E-mail your question via the Internet [email protected]
• Fax your question to the NASA AccessHelp Desk at 301–621–0134
• Telephone the NASA Access Help Desk at301–621–0390
• Write to: NASA Access Help Desk NASA Center for AeroSpace Information 7121 Standard Drive Hanover, MD 21076

James A. TursoQSS Group, Inc., Cleveland, Ohio
A Foreign Object Damage Event DetectorData Fusion System for Turbofan Engines
NASA/TM—2004-213192
August 2004
National Aeronautics andSpace Administration
Glenn Research Center
Prepared for the40th Joint Propulsion Conference and Exhibitcosponsored by AIAA, ASME, SAE, and ASEEFort Lauderdale, Florida, July 11–14, 2004
ARL–TR–3201AIAA–2004–4047
U.S. ARMY
RESEARCH LABORATORY
Jonathan S. LittU.S. Army Research Laboratory, Glenn Research Center, Cleveland, Ohio

Acknowledgments
The authors gratefully acknowledge the guidance provided by Dr. Chuck Lawrence, NASA Glenn ResearchCenter, Structures and Acoustics Division, for providing much-needed expertise in turbofan engine
rotor structural model development.
Available from
NASA Center for Aerospace Information7121 Standard DriveHanover, MD 21076
National Technical Information Service5285 Port Royal RoadSpringfield, VA 22100
Trade names or manufacturers’ names are used in this report foridentification only. This usage does not constitute an officialendorsement, either expressed or implied, by the National
Aeronautics and Space Administration.
Available electronically at http://gltrs.grc.nasa.gov

NASA/TM—2004-213192 1
A Foreign Object Damage Event Detector Data Fusion System for Turbofan Engines
James A. Turso QSS Group, Inc.
Cleveland, Ohio 44135
Jonathan S. Litt U.S. Army Research Laboratory
Glenn Research Center Cleveland, Ohio 44135
A Data Fusion System designed to provide a reliable assessment of the occurrence of Foreign Object Damage (FOD) in a turbofan engine is presented. The FOD-event feature level fusion scheme combines knowledge of shifts in engine gas path performance obtained using a Kalman filter, with bearing accelerometer signal features extracted via wavelet analysis, to positively identify a FOD event. A fuzzy inference system provides basic probability assignments (bpa) based on features extracted from the gas path analysis and bearing accelerometers to a fusion algorithm based on the Dempster-Shafer-Yager Theory of Evidence. Details are provided on the wavelet transforms used to extract the foreign object strike features from the noisy data and on the Kalman filter-based gas path analysis. The system is demonstrated using a turbofan engine combined-effects model (CEM), providing both gas path and rotor dynamic structural response, and is suitable for rapid-prototyping of control and diagnostic systems. The fusion of the disparate data can provide significantly more reliable detection of a FOD event than the use of either method alone. The use of fuzzy inference techniques combined with Dempster-Shafer-Yager Theory of Evidence provides a theoretical justification for drawing conclusions based on imprecise or incomplete data.
Nomenclature A Amplitude of oscillation, State Space Model System Matrix, fused event set A i Source i event set Am Reconstructed approximation component of wavelet-analyzed signal at scale m BE Belief Dm Reconstructed detail component of wavelet-analyzed signal at scale m DTWTD Discrete-time wavelet transform detail coefficient DTWTA Discrete-time wavelet transform approximation coefficient
δ Deviation from steady state operating condition f Frequency in Hz m Dyadic scale of wavelet-decomposed signal, basic probability assignments (bpa) n Wavelet time delay in number of samples PROB Probability PL Plausibility
h,δy,δxδ ˆˆˆ Estimated state variables, output, and health parameters
Y(f) Discrete Fourier Transform of y(n)
m,nψ Wavelet at scale m and translation n
φ Null set
nmφ , Wavelet scaling function at scale m and translation n

NASA/TM—2004-213192 2
I. Introduction Although ingestion of birds and ice has occasionally resulted in uncontained rotor events in commercial jet
transport,1 in the vast majority of cases bird ingestion does not affect the safe outcome of a flight and may, in fact, go unnoticed by the flight crew.2 However ingestion does pose a risk of Foreign Object Damage (FOD), and even in a case where there is no apparent damage to an engine as observed from the cockpit, latent effects (e.g. cracks that can be propagated by high cycle fatigue3) may be present; thus it is important to be aware of its occurrence, if possible. A system that detects foreign object impact has two potential uses, depending on the level of certification achievable. The first, and simplest to implement from a certification standpoint, reports to the ground crew that a foreign object was ingested and initiates a maintenance action. The second is harder to certify because it requires providing an indicator to the pilot, but is potentially more beneficial from a safety point of view because it addresses the issue of pilot response to an event. This use is suggested by the numerous cases of bird ingestion contributing to accidents, some of them fatal.4 Specific pilot procedures have been developed for situations where ingestion is suspected, and forensic analysis has repeatedly shown that they would have been the appropriate actions to take in cases where rejected takeoffs motivated by bird ingestion resulted in accidents.5 When a multi-engine aircraft flies through a flock of birds, potentially damaging more than one engine, the pilot needs to understand the status since his resulting actions may be different depending on the number of engines involved. Most FOD events occur close to the ground when the flight crew’s attention is focused on flying the plane. Only after the crew stabilizes the aircraft at a safe altitude should they take action on the engine.2, 5 Once the aircraft is stable, the reduced workload in the cockpit environment provides better circumstances under which the crew can analyze the situation, and they would benefit greatly by having full knowledge of the engines involved and the likelihood of the event based on data, and this is the type of information such a system could provide. Either of these two uses provides justification for the development of a FOD detection system. This paper will not address how the system should be used beyond this; the objective was to make the reader aware of the utility such a system can provide.
The critical consequence of foreign object ingestion is engine surge, potentially resulting in the loss of power. The flight crew can recognize foreign object ingestion through a combination of instrument readings and sensory cues. These include such symptoms as a thud or bang, a fire warning, a visible flame coming out of the engine, vibration, yaw of the airplane caused by thrust imbalance, high Exhaust Gas Temperature (EGT), change in the spool speeds, smoke/odor in cabin bleed air, and Engine Pressure Ratio (EPR) change. It is important to note that for impact-type FOD (due to ice, birds, runway debris, etc.), the damage is primarily to the fan and front part of the engine, with the extent of the damage determined by the geometry, angle of impact, hardness, relative speed, etc. of the object. This is quite different from ingestion of volcanic ash, which may severely affect the hot section of the engine while producing no visible damage to the cooler portions in the front.6
Given that many of the potential symptoms of FOD are not unique to that event, an automatic system for FOD detection should take information from multiple sources to provide confidence in its diagnosis. Just like a pilot does, this system must fuse the information in a way that provides a measure of the likelihood of foreign object ingestion in order to determine any corrective action. Additionally, since several of the potential symptoms are described in terms of human senses, alternate information sources need to be developed, and they should utilize the standard engine sensor suite (or a very similar suite) to address issues such as certification and retrofit. Naturally the processing requirements may vary from the current systems simply due to the fact that additional signal processing is being added to execute these algorithms on line.
Effective diagnostic system development requires identification and extraction of the essential signal features necessary for a timely, accurate assessment of the state of the system being monitored. For a given malfunction or event (e.g., a FOD event) this requires identification of the key components affected by the event, the parameters and appropriate signals to be analyzed, and the essential features within the signals that provide the minimum information necessary to arrive at a diagnosis i.e., reducing the dimensionality of the raw data. In this work we address impact-type events and have chosen to fuse data from a Gas Path Analysis (GPA) with rotordynamic structural effects to provide an indication of the presence of FOD. Changes in component efficiencies, high and low spool speeds, as well as changes in other engine parameters have been determined/observed during foreign object damage FOD events.7, 8 In some cases, these parameter changes alone may not be conclusive proof that a FOD event has occurred. Incorporation of structural vibration signals provides a means to aid in positive identification of a FOD event. To successfully apply available sensor fusion techniques, the same event should be detected using sensors that have significantly different physical characteristics (e.g., thermocouples compared to accelerometers) and rely on measuring physically different parameters (e.g., temperature vs. acceleration).9, 10 Fusing gas path performance parameter estimates with structural response information acquired during a FOD event could provide
NASA/TM—2004-213192 3
conclusive evidence that a FOD event had occurred. For example, model mismatch or sensor bias11 could conceivably result in gas path performance parameter estimate changes similar to those experienced during a FOD event. Similarly, vibration signals alone may possess FOD-like characteristics depending on the maneuver e.g., a rapid change in thrust demanded from the engine would result in temporary impulse-like force imbalances which are transmitted through the engine structure. The combination of available evidence i.e., specific changes in gas path performance parameter estimates combined with application of state-of-the-art signal processing techniques applied to structural vibration signals (e.g, wavelet analysis12, 13), could provide the “finger print” necessary to positively identify a FOD event. In the present investigation we are detecting impact events, so we assume that the component most affected by a FOD event in a turbofan engine is the fan, with any damage incurred resulting in changes in fan efficiency and efficiency rate of change.8 Fan structural changes resulting from a FOD event could manifest themselves as abrupt, short duration changes in the vibration signal due to the object’s impact upon the fan disk, extracted using wavelet analysis, as well as changes in the amplitude of vibration and the amplitude of vibration rate of change due to FOD event-induced rotor imbalance.
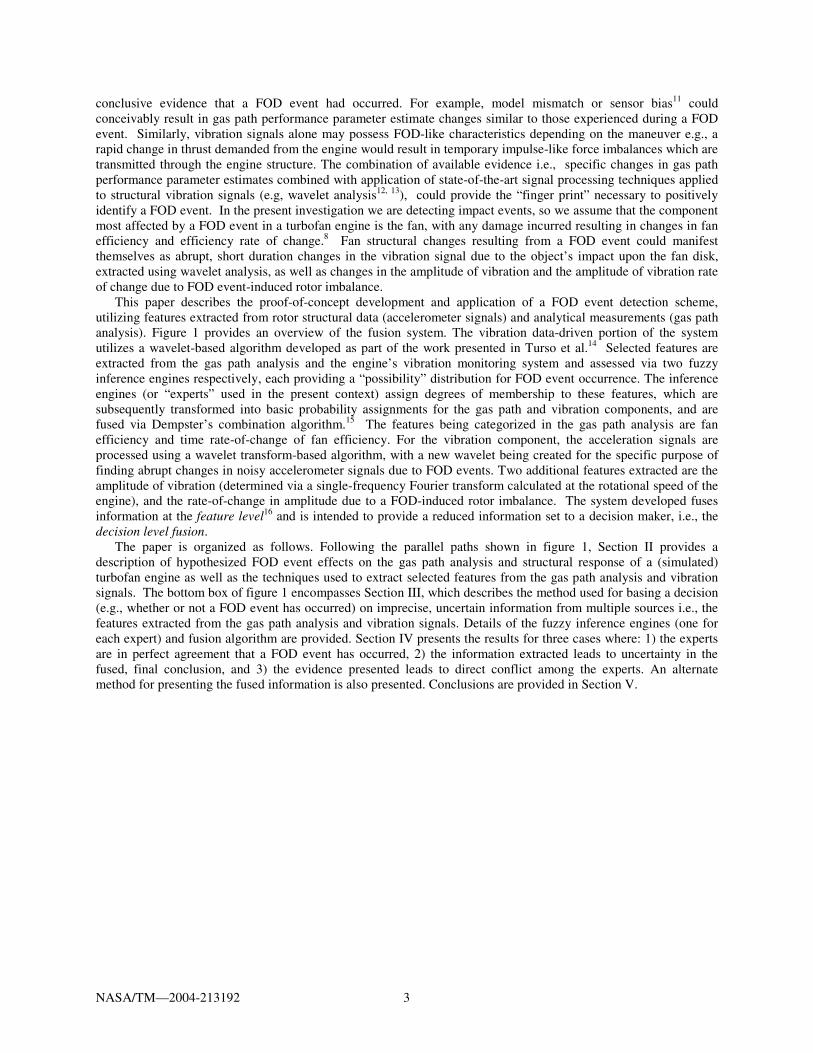
This paper describes the proof-of-concept development and application of a FOD event detection scheme, utilizing features extracted from rotor structural data (accelerometer signals) and analytical measurements (gas path analysis). Figure 1 provides an overview of the fusion system. The vibration data-driven portion of the system utilizes a wavelet-based algorithm developed as part of the work presented in Turso et al.14 Selected features are extracted from the gas path analysis and the engine’s vibration monitoring system and assessed via two fuzzy inference engines respectively, each providing a “possibility” distribution for FOD event occurrence. The inference engines (or “experts” used in the present context) assign degrees of membership to these features, which are subsequently transformed into basic probability assignments for the gas path and vibration components, and are fused via Dempster’s combination algorithm.15 The features being categorized in the gas path analysis are fan efficiency and time rate-of-change of fan efficiency. For the vibration component, the acceleration signals are processed using a wavelet transform-based algorithm, with a new wavelet being created for the specific purpose of finding abrupt changes in noisy accelerometer signals due to FOD events. Two additional features extracted are the amplitude of vibration (determined via a single-frequency Fourier transform calculated at the rotational speed of the engine), and the rate-of-change in amplitude due to a FOD-induced rotor imbalance. The system developed fuses information at the feature level16 and is intended to provide a reduced information set to a decision maker, i.e., the decision level fusion.
The paper is organized as follows. Following the parallel paths shown in figure 1, Section II provides a description of hypothesized FOD event effects on the gas path analysis and structural response of a (simulated) turbofan engine as well as the techniques used to extract selected features from the gas path analysis and vibration signals. The bottom box of figure 1 encompasses Section III, which describes the method used for basing a decision (e.g., whether or not a FOD event has occurred) on imprecise, uncertain information from multiple sources i.e., the features extracted from the gas path analysis and vibration signals. Details of the fuzzy inference engines (one for each expert) and fusion algorithm are provided. Section IV presents the results for three cases where: 1) the experts are in perfect agreement that a FOD event has occurred, 2) the information extracted leads to uncertainty in the fused, final conclusion, and 3) the evidence presented leads to direct conflict among the experts. An alternate method for presenting the fused information is also presented. Conclusions are provided in Section V.
NASA/TM—2004-213192 4
II. Signal Conditioning and Feature Extraction from Gas Path and Vibration Sensor Measurements
A. Gas Path Analysis Feature Extraction via Kalman Filter Estimation
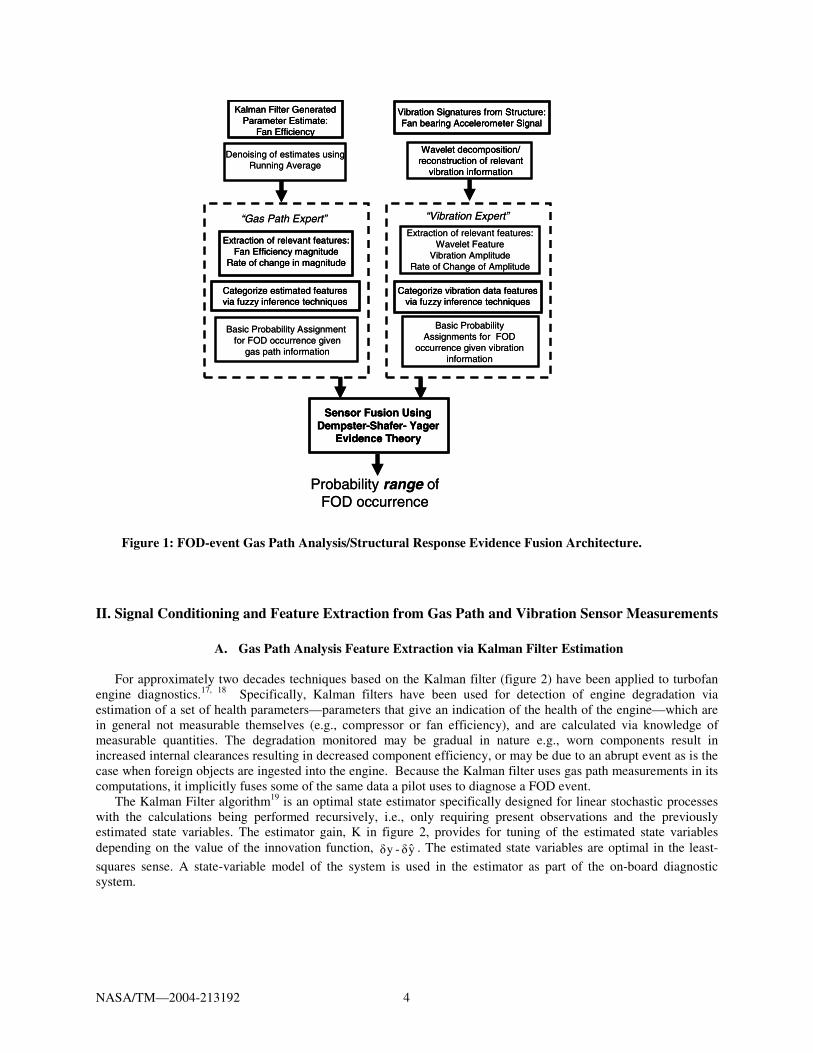
For approximately two decades techniques based on the Kalman filter (figure 2) have been applied to turbofan engine diagnostics.17, 18 Specifically, Kalman filters have been used for detection of engine degradation via estimation of a set of health parameters—parameters that give an indication of the health of the engine—which are in general not measurable themselves (e.g., compressor or fan efficiency), and are calculated via knowledge of measurable quantities. The degradation monitored may be gradual in nature e.g., worn components result in increased internal clearances resulting in decreased component efficiency, or may be due to an abrupt event as is the case when foreign objects are ingested into the engine. Because the Kalman filter uses gas path measurements in its computations, it implicitly fuses some of the same data a pilot uses to diagnose a FOD event.
The Kalman Filter algorithm19 is an optimal state estimator specifically designed for linear stochastic processes with the calculations being performed recursively, i.e., only requiring present observations and the previously estimated state variables. The estimator gain, K in figure 2, provides for tuning of the estimated state variables depending on the value of the innovation function, yδ-yδ . The estimated state variables are optimal in the least-
squares sense. A state-variable model of the system is used in the estimator as part of the on-board diagnostic system.
Categorize estimated featuresvia fuzzy inference techniques
Kalman Filter GeneratedParameter Estimate:
Fan Efficiency
Vibration Signatures from Structure: Fan bearing Accelerometer Signal
Sensor Fusion UsingDempster-Shafer- Yager
Evidence Theory
Probability range of FOD occurrence
Wavelet decomposition/ reconstruction of relevant
vibration information
Denoising of estimates using Running Average
Categorize vibration data featuresvia fuzzy inference techniques
Basic Probability Assignmentfor FOD occurrence given
gas path information
Extraction of relevant features:Fan Efficiency magnitude
Rate of change in magnitude
Extraction of relevant features:Wavelet Feature
Vibration AmplitudeRate of Change of Amplitude
“Gas Path Expert” “Vibration Expert”
Basic Probability Assignments for FOD
occurrence given vibration information
Categorize estimated featuresvia fuzzy inference techniquesCategorize estimated featuresvia fuzzy inference techniques
Kalman Filter GeneratedParameter Estimate:
Fan Efficiency
Kalman Filter GeneratedParameter Estimate:
Fan Efficiency
Vibration Signatures from Structure: Fan bearing Accelerometer Signal
Vibration Signatures from Structure: Fan bearing Accelerometer Signal
Sensor Fusion UsingDempster-Shafer- Yager
Evidence Theory
Sensor Fusion UsingDempster-Shafer- Yager
Evidence Theory
Probability range of FOD occurrence
Wavelet decomposition/ reconstruction of relevant
vibration information
Wavelet decomposition/ reconstruction of relevant
vibration information
Denoising of estimates using Running Average
Categorize vibration data featuresvia fuzzy inference techniques
Categorize vibration data featuresvia fuzzy inference techniques
Basic Probability Assignmentfor FOD occurrence given
gas path information
Extraction of relevant features:Fan Efficiency magnitude
Rate of change in magnitude
Extraction of relevant features:Fan Efficiency magnitude
Rate of change in magnitude
Extraction of relevant features:Wavelet Feature
Vibration AmplitudeRate of Change of Amplitude
“Gas Path Expert” “Vibration Expert”
Basic Probability Assignments for FOD
occurrence given vibration information
Figure 1: FOD-event Gas Path Analysis/Structural Response Evidence Fusion Architecture.

NASA/TM—2004-213192 5
When using the Kalman filter as a health parameter estimator, the health parameters are interpreted as additional state variables to be estimated. These additional state variables are typically assumed to be constants, with the corresponding entries in the system matrix of the state-space system representation set to zero. The resulting state space representation is
[ ]
[ ] [ ][ ]δu(t)Dδh
δxMCδy(t)
δu(t)0
B
δh
δx
00
LA
(t)hδ(t)xδ
+
=
+
=
&&
(1)
with [ ]TTT δhδx referred to as the augmented state vector, and δu(t), δy(t), and δh(t) are the control input,
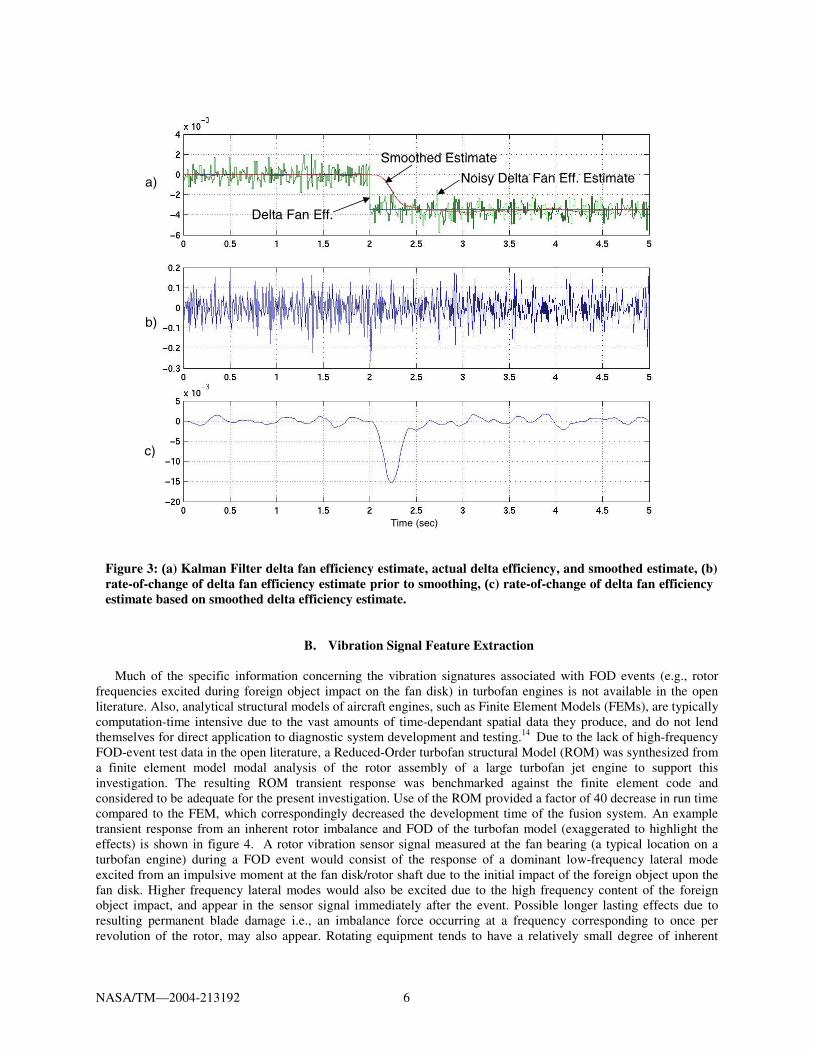
output, and health parameter deviations from nominal values respectively. The specific health parameter (or parameters) used by the fusion system is dictated by the component (or components) most likely to be affected by a FOD event. It has been shown that fan efficiency, as well as fan flow capacity, are likely to be affected by a FOD event8 thus, for the present investigation, fan efficiency is the health parameter of interest. We assume that the larger the impact, the larger the deviation in the health parameter values. The features extracted from the efficiency estimate are the denoised versions of the estimated fan efficiency and the rate-of-change of the fan efficiency. For a FOD event, significant changes in the efficiency and rate-of-change in efficiency are expected to be coincident. Figure 3 presents an example of the estimated efficiency, which shows the effect of sensor noise on the estimate. The other feature used by the fusion system, rate of change of efficiency, requires taking the derivative of a noisy signal, which results in an amplification of the noise rendering this feature unusable in the present context. Thus, a means is required for effectively denoising the efficiency estimate prior to calculating its rate of change. Figure 3 also shows the efficiency estimate after denoising using a running average. The noise level is significantly decreased, which allows for easier detection of significant changes in the efficiency rate-of-change. The time lag introduced by the running average (approximately 0.5 seconds) is considered acceptable given the present application, with the tolerable time lag ultimately dictated by the end use of the system.
∫+
+ +
+
+
yδ
yδ
uδ
+ -
hδxδ
Optimal Estimator Gain [ ]K
[ ]B
[ ]D
[ ]MC
00
LA
hδxδ&
&
∫+
+ +
+
+
yδ
yδ
uδ
+ -
hδxδ
Optimal Estimator Gain [ ]K
[ ]B
[ ]D
[ ]MC
00
LA
hδxδ&
&
Figure 2: Overview of the Kalman Filter parameter estimator.
NASA/TM—2004-213192 6
B. Vibration Signal Feature Extraction
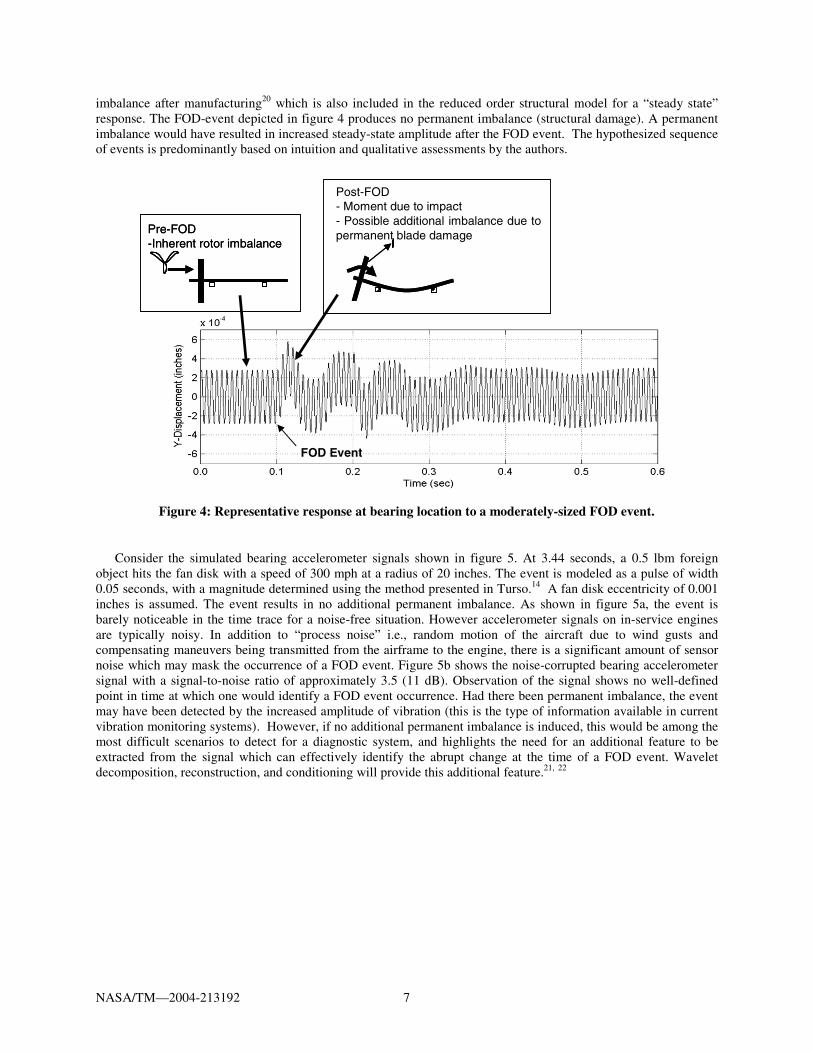
Much of the specific information concerning the vibration signatures associated with FOD events (e.g., rotor frequencies excited during foreign object impact on the fan disk) in turbofan engines is not available in the open literature. Also, analytical structural models of aircraft engines, such as Finite Element Models (FEMs), are typically computation-time intensive due to the vast amounts of time-dependant spatial data they produce, and do not lend themselves for direct application to diagnostic system development and testing.14 Due to the lack of high-frequency FOD-event test data in the open literature, a Reduced-Order turbofan structural Model (ROM) was synthesized from a finite element model modal analysis of the rotor assembly of a large turbofan jet engine to support this investigation. The resulting ROM transient response was benchmarked against the finite element code and considered to be adequate for the present investigation. Use of the ROM provided a factor of 40 decrease in run time compared to the FEM, which correspondingly decreased the development time of the fusion system. An example transient response from an inherent rotor imbalance and FOD of the turbofan model (exaggerated to highlight the effects) is shown in figure 4. A rotor vibration sensor signal measured at the fan bearing (a typical location on a turbofan engine) during a FOD event would consist of the response of a dominant low-frequency lateral mode excited from an impulsive moment at the fan disk/rotor shaft due to the initial impact of the foreign object upon the fan disk. Higher frequency lateral modes would also be excited due to the high frequency content of the foreign object impact, and appear in the sensor signal immediately after the event. Possible longer lasting effects due to resulting permanent blade damage i.e., an imbalance force occurring at a frequency corresponding to once per revolution of the rotor, may also appear. Rotating equipment tends to have a relatively small degree of inherent
a)
c)
b)
Delta Fan Eff.
Noisy Delta Fan Eff. Estimate
Smoothed Estimate
Time (sec)
a)
c)
b)
Delta Fan Eff.
Noisy Delta Fan Eff. Estimate
Smoothed Estimate
a)
c)
b)
a)
c)
b)
Delta Fan Eff.
Noisy Delta Fan Eff. Estimate
Smoothed Estimate
Time (sec)
Figure 3: (a) Kalman Filter delta fan efficiency estimate, actual delta efficiency, and smoothed estimate, (b) rate-of-change of delta fan efficiency estimate prior to smoothing, (c) rate-of-change of delta fan efficiency estimate based on smoothed delta efficiency estimate.
NASA/TM—2004-213192 7
imbalance after manufacturing20 which is also included in the reduced order structural model for a “steady state” response. The FOD-event depicted in figure 4 produces no permanent imbalance (structural damage). A permanent imbalance would have resulted in increased steady-state amplitude after the FOD event. The hypothesized sequence of events is predominantly based on intuition and qualitative assessments by the authors.
Consider the simulated bearing accelerometer signals shown in figure 5. At 3.44 seconds, a 0.5 lbm foreign object hits the fan disk with a speed of 300 mph at a radius of 20 inches. The event is modeled as a pulse of width 0.05 seconds, with a magnitude determined using the method presented in Turso.14 A fan disk eccentricity of 0.001 inches is assumed. The event results in no additional permanent imbalance. As shown in figure 5a, the event is barely noticeable in the time trace for a noise-free situation. However accelerometer signals on in-service engines are typically noisy. In addition to “process noise” i.e., random motion of the aircraft due to wind gusts and compensating maneuvers being transmitted from the airframe to the engine, there is a significant amount of sensor noise which may mask the occurrence of a FOD event. Figure 5b shows the noise-corrupted bearing accelerometer signal with a signal-to-noise ratio of approximately 3.5 (11 dB). Observation of the signal shows no well-defined point in time at which one would identify a FOD event occurrence. Had there been permanent imbalance, the event may have been detected by the increased amplitude of vibration (this is the type of information available in current vibration monitoring systems). However, if no additional permanent imbalance is induced, this would be among the most difficult scenarios to detect for a diagnostic system, and highlights the need for an additional feature to be extracted from the signal which can effectively identify the abrupt change at the time of a FOD event. Wavelet decomposition, reconstruction, and conditioning will provide this additional feature.21, 22
Pre-FOD -Inherent rotor imbalance
FOD Event
Post-FOD - Moment due to impact- Possible additional imbalance due to permanent blade damagePre-FOD
-Inherent rotor imbalancePre-FOD -Inherent rotor imbalancePre-FOD -Inherent rotor imbalance
FOD Event
Post-FOD - Moment due to impact- Possible additional imbalance due to permanent blade damage
Post-FOD - Moment due to impact- Possible additional imbalance due to permanent blade damage
Figure 4: Representative response at bearing location to a moderately-sized FOD event.

NASA/TM—2004-213192 8
C. FOD event Detection using Wavelet Analysis of Rotor Bearing Vibration Signals Over the past decade the discrete time wavelet transform (DTWT) has been applied to a wide range of signal
analysis problems e.g., de-noising of signals as well as time localization and reconstruction of short duration changes.13, 21, 22 The DTWT is considered to be a viable candidate for the present study due to the nature of the signal characteristic of interest i.e., an abrupt change in a bearing vibration signal due to a FOD event, corrupted by noise.
The DTWT is the discrete-time counterpart of the continuous-time wavelet transform (CWT)
dta
tΨ)y(ta
1)CWT(a, ∫
−= ττ (2)
whereΨ(t) is the basic or mother wavelet and aa)//τ)-Ψ((t are the wavelet basis functions which are scaled
via the parameter a (by compressing or stretching the mother wavelet) and shifted in time by τ . The operation performed in Equation 2 on the original signal y(t) may be interpreted as the correlation of the signal y(t) with
aa)//Ψ(t , shifted by τ/a.22 Thus, the CWT computes the component of y(t) that is similar to aa)//Ψ(t . If
little (or no) similarity exists between the two, then the CWT will be small (or zero). Larger values of CWT indicate better correlation.
In discrete-time the wavelet transform takes the form
)nτkψ(ay(k)an)DTWT(m, ok
mo2
m
o −= ∑ −− (3)
where m is the scale (degree of dilation) and n corresponds to the net translation in time (in terms of the sample time τo) of the wavelet at a specific scale. Thus wavelet transformation provides a means to locate the occurrence of
a)
b)
a)
b)
Figure 5: Bearing Accelerometer output signal corresponding to a FOD event. (a) Noise free system response. (b) System response with process and sensor noise.
NASA/TM—2004-213192 9
events of varying frequency content in time. The base value of scaling parameter ao and the time shift τo are typically set equal to 2 and 1 respectively for computational efficiency, analogous to the Fast Fourier Transform23 (FFT).
The coefficients corresponding to the low-frequency portion of the input signal (the approximation coefficients) and the high-frequency detail coefficients at a given scale in a wavelet decomposition are provided by successive low pass and high pass filtering operations respectively.22 Reconstruction of the approximations and details at a specified scale m is performed via the corresponding inverse wavelet transform
)(kψn)DTWTD(m,(k)Dn
nm,m ∑= (4)
∑=n
nm,m (k)φn)DTWTA(m,(k)A (5)
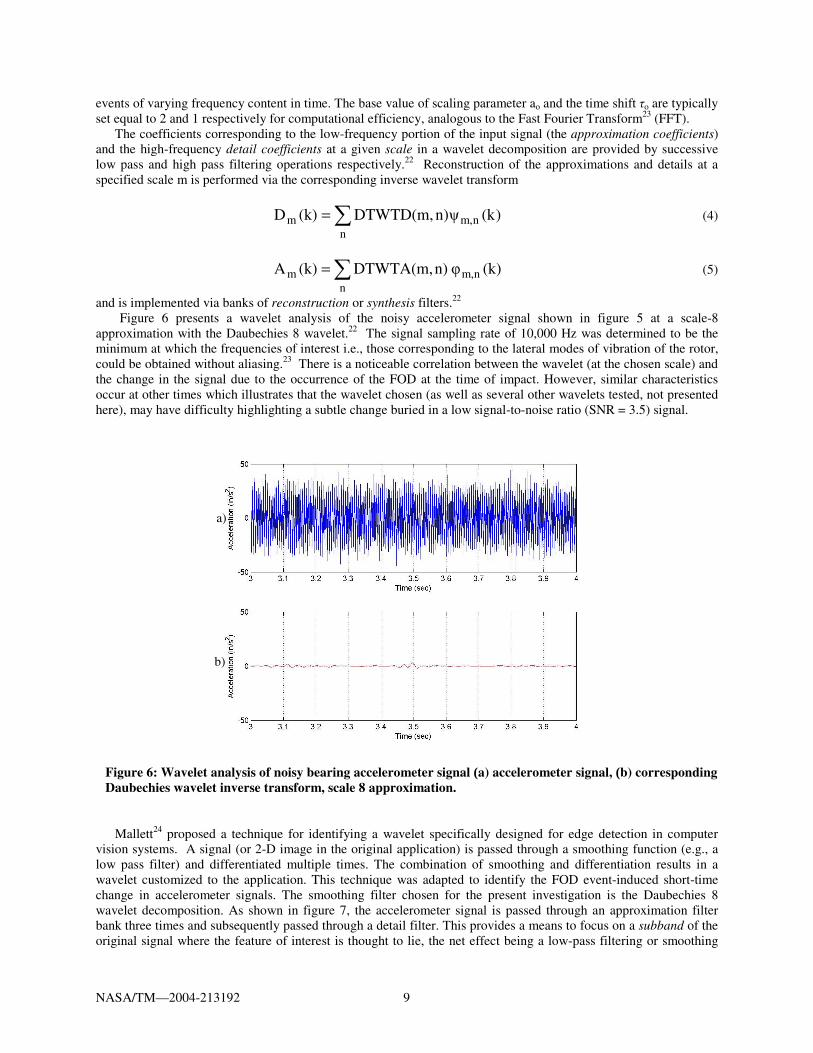
and is implemented via banks of reconstruction or synthesis filters.22 Figure 6 presents a wavelet analysis of the noisy accelerometer signal shown in figure 5 at a scale-8
approximation with the Daubechies 8 wavelet.22 The signal sampling rate of 10,000 Hz was determined to be the minimum at which the frequencies of interest i.e., those corresponding to the lateral modes of vibration of the rotor, could be obtained without aliasing.23 There is a noticeable correlation between the wavelet (at the chosen scale) and the change in the signal due to the occurrence of the FOD at the time of impact. However, similar characteristics occur at other times which illustrates that the wavelet chosen (as well as several other wavelets tested, not presented here), may have difficulty highlighting a subtle change buried in a low signal-to-noise ratio (SNR = 3.5) signal.
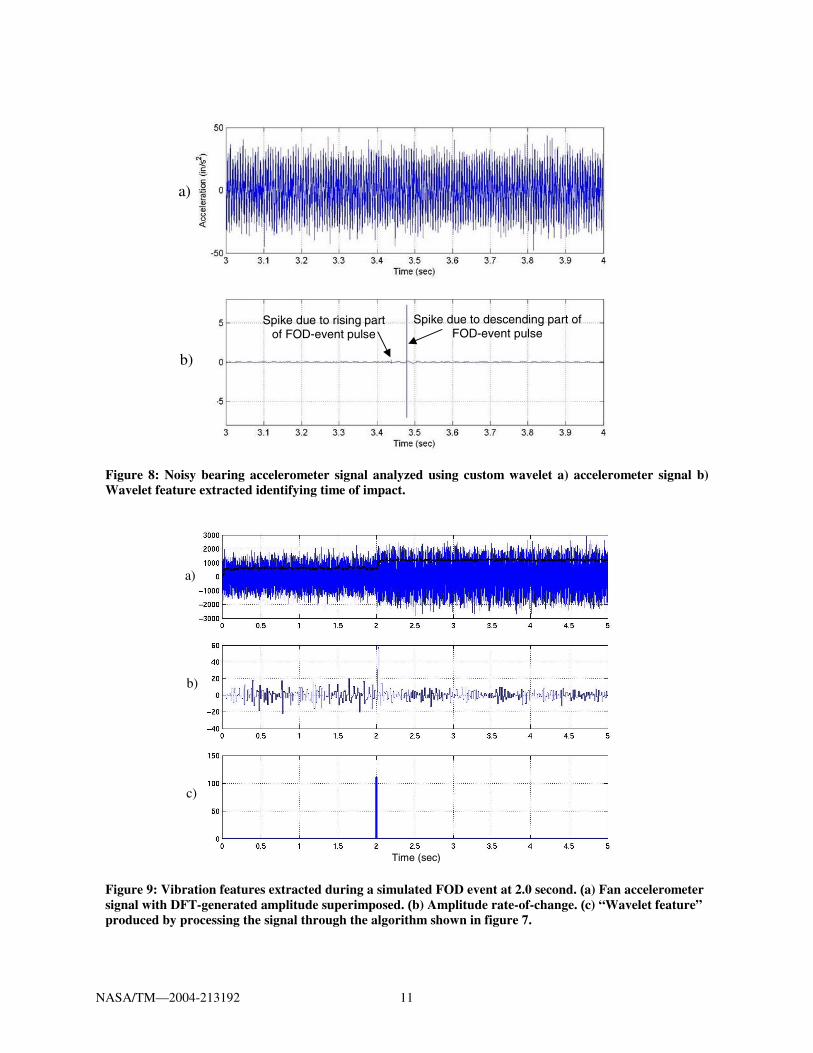
Mallett24 proposed a technique for identifying a wavelet specifically designed for edge detection in computer vision systems. A signal (or 2-D image in the original application) is passed through a smoothing function (e.g., a low pass filter) and differentiated multiple times. The combination of smoothing and differentiation results in a wavelet customized to the application. This technique was adapted to identify the FOD event-induced short-time change in accelerometer signals. The smoothing filter chosen for the present investigation is the Daubechies 8 wavelet decomposition. As shown in figure 7, the accelerometer signal is passed through an approximation filter bank three times and subsequently passed through a detail filter. This provides a means to focus on a subband of the original signal where the feature of interest is thought to lie, the net effect being a low-pass filtering or smoothing
a)
b)
a)
b)
Figure 6: Wavelet analysis of noisy bearing accelerometer signal (a) accelerometer signal, (b) corresponding Daubechies wavelet inverse transform, scale 8 approximation.

NASA/TM—2004-213192 10
operation. The result is differentiated three times to produce the feature used by the structural expert (i.e., structural component fuzzy inference engine) in the next step of the fusion process.
Figure 8 presents the wavelet decomposition of the same accelerometer signal shown in figure 6, using the custom wavelet described above. The exact time of the event is precisely determined using this technique. Indeed, the event is modeled by imposing a pulse whose magnitude is a function the of foreign object impact characteristics presented in Turso,14 on the fan disk. The two spikes shown in figure 8 result from the rising and descending parts of that pulse “filtered” through the mechanical (i.e., rotor-bearing) system. The event input profile to the model (i.e., the pulse input described above) was considered to be appropriate for a significant, structurally damaging event, i.e., where the foreign object absorbs virtually none of the energy of impact, resulting in complete and immediate transfer of energy to the fan disk. This would be the case for hard objects such as ice, for example. For other scenarios, pulses of lower magnitude or with non-infinite rising (or descending) slopes may require higher-order differentiation for detection.
HD
LD
HR
LR
Fan Bearing Accelerometer
Signal
LD
LR LR
Scale 1 Detail
Scale 1 Approximation
Scale 3 Detail
HD
LD
LR
HR
Low Pass Reconstruction FIR Filter
Low Pass Decomposition FIR Filter
High Pass Decomposition FIR Filter
High Pass Reconstruction FIR Filter
Downsampleby a Factor of 2
Upsampleby a Factor of 2
LD
LR
HD HR3
3
dt
)(dWavelet Feature
To Fuzzy Inference Engine
HDHD
LDLD
HRHR
LRLR
Fan Bearing Accelerometer
Signal
LDLD
LRLR LRLR
Scale 1 Detail
Scale 1 Approximation
Scale 3 Detail
HD
LD
LR
HR
Low Pass Reconstruction FIR Filter
Low Pass Decomposition FIR Filter
High Pass Decomposition FIR Filter
High Pass Reconstruction FIR Filter
Downsampleby a Factor of 2
Upsampleby a Factor of 2
HDHD
LDLD
LRLR
HRHR
Low Pass Reconstruction FIR Filter
Low Pass Decomposition FIR Filter
High Pass Decomposition FIR Filter
High Pass Reconstruction FIR Filter
Downsampleby a Factor of 2Downsample
by a Factor of 2
Upsampleby a Factor of 2
Upsampleby a Factor of 2
LDLD
LRLR
HDHD HRHR3
3
dt
)(d3
3
dt
)(dWavelet Feature
To Fuzzy Inference Engine
Figure 7: Wavelet transform-based vibration feature extraction implemented using an analysis and synthesis FIR filter bank.
NASA/TM—2004-213192 11
Spike due to rising part of FOD-event pulse
Spike due to descending part of FOD-event pulse
a)
b)
Spike due to rising part of FOD-event pulse
Spike due to descending part of FOD-event pulse
a)
b)
Figure 8: Noisy bearing accelerometer signal analyzed using custom wavelet a) accelerometer signal b) Wavelet feature extracted identifying time of impact.
Time (sec)
a)
b)
c)
Time (sec)
a)
b)
c)
Figure 9: Vibration features extracted during a simulated FOD event at 2.0 second. (a) Fan accelerometer signal with DFT-generated amplitude superimposed. (b) Amplitude rate-of-change. (c) “Wavelet feature” produced by processing the signal through the algorithm shown in figure 7.

NASA/TM—2004-213192 12
If a permanent imbalance results from a FOD event, two other features extracted from the accelerometer signal may assist in the diagnosis. These are the vibration amplitude and rate-of-change of amplitude determined from the magnitude of a single-frequency discrete Fourier transform,23
( ) ∑∞=
∞=
−=n
-n
nfj2)ey(nfY π (6)
The analysis frequency corresponds to the rotational speed of the rotor and would practically be obtained from a once-per-revolution signal used to gauge engine rotational speed. Large amplitudes accompanied by high amplitude-rates-of-change would be indicators that a FOD event has occurred. An example of the three features obtained from the fan bearing accelerometer signal is shown in figure 9 for a simulated FOD event (using the combined-effects model mentioned earlier) at 2.0 seconds.
III. Evidence Fusion Based On Imprecise Information
The majority of diagnostic system development utilizes simulated data, at least in the initial phases. For many components in the initial phase of design, the only dynamic data available is provided by simulation models. Even when actual data is available for diagnostic system development, the data many times is not acquired under in-service conditions. Thus the diagnostic system must be robust to model uncertainty as well as to uncertainties due to usage and off-design operation; it must provide a diagnosis based on imprecise information. The system should have the capability to fuse together multiple sources of evidence in order to enhance confidence in the diagnosis. Until recently many of these systems have utilized Bayesian-based probabilistic methods such as Bayesian Belief Networks and Bayesian Hypothesis Testing.15 Use of a Bayesian method implies that the conditional probabilities required are determined via testing, i.e., the probabilities that observations made given the occurrence of certain events are based on actual data (or well-understood distributions presented in the literature) and precisely known. This many times is not the case due to the prohibitive costs of running the necessary tests or the rarity of the event. Indeed, as mentioned previously, the component may not even exist for the diagnostic system being designed. A means for reducing the available evidence, i.e., the features extracted from sensors via Kalman filters, or vibration signals described earlier, and developing a measure of the possibility of FOD occurrence is required. The output of the system will be imprecise as well, providing a range of probabilities (upper and lower bounds) in lieu of a crisp or exact output which, in the present context, could provide a misleading impression of the state of the system. Data or sensor fusion, is the process by which raw data is obtained from several sensors, based in significantly different phenomenology observing the same event, and converted to a measure of how likely the event is to occur.25 The measure may be the basis for a decision or may simply be for informational purposes. The fusion may be performed at the raw data level, feature level, or decision level, or combinations of each. Typically, raw data is reduced to a compact set of features, which provides an efficient means for expert diagnosis. The features are fused by an “expert,” in this case a fuzzy logic-based inference system,26,27 into a diagnosis (opinion) based on the evidence available. Each expert’s opinion is in turn fused by combining the “weight of evidence” provided by each expert via an appropriate rule. Consider as an example the “gas path expert” shown in figure 10. The estimated fan efficiency deviation and rate-of-change of efficiency deviation, i.e. features, are input into the set of fuzzy membership functions that categorize the evidence as indicating a low, medium, or high likelihood of FOD event occurrence. Each degree of membership is combined using a multiplicative AND operation, with the mean of maximum defuzzification operation providing a FOD, NOFOD, or UNCERTAIN expert decision. Design of membership functions and aggregation rules are based on expert knowledge.27 In a probabilistic decision setting, with say, the a posteriori probability of FOD occurrence being determined via Bayes’ law, a crisp probability of a FOD event, PROB(FOD), would imply that PROB(NOFOD) = 1-PROB(FOD). In the context of evidence theory however, there may be evidence that supports both propositions due to incomplete knowledge of the system. In the latter case, all of the possibilities must be accounted for and converted into “basic probability assignments” (bpa), otherwise known as probability masses, which are essentially sets of probabilities which contain the actual probabilities. The output of the fuzzy aggregation rules therefore form a “possibility” distribution15, 28, 29 from which the bpa are determined, and obey a rule analogous to that required of crisp probabilities m(FOD) + m(NOFOD) + m(UNCERTAIN) = 1.0. Transformation from fuzzy degree of membership, to possibility assignment, to bpa is described in Vachtsevanos29 and Yen.30 The fuzzy inference engine for the gas path expert is shown in figure 10.

NASA/TM—2004-213192 13
For the vibration expert portion of the fusion, the same process is performed to arrive at the bpa. The vibration expert fuzzy inference engine is shown in figure 11.
If Eff is HIGH AND Delta_Eff is HIGH THEN Output is FODIf Eff is LOW AND Delta_Eff is LOW THEN Output is NOFOD
If Eff is MED AND Delta_Eff is MED THEN Output is UNCERTAIN
.
.
.
HIGH
LOW
MED
Efficiency deviation
estimate in
Rate of change of Efficiency deviation in
GAS PATH FEATURES IN
Feature set degree of membership in{FOD, NOFOD, UNCERTAIN} Categories
Membership functions
Fuzzy rule base
FEATURE SET DEGREE OF MEMBERSHIP OUT TO BASIC PROBABILITY ASSIGNMENT (bpa) CALCULATION
Figure 10: Gas path expert membership functions and implication operations.
If Amplitude is HIGH AND Amplitude_Diff is HIGH AND Wavelet isHIGH THEN Output is FOD
If Amplitude is LOW AND Amplitude_Diff is LOW AND Wavelet isLOW THEN Output is NOFOD
If Amplitude is MED AND Amplitude_Diff is MED AND Wavelet isLOW THEN Output is UNCERTAIN.
.
.
HIGH
LOW
MED
Vibration amplitude
in
Rate of change of vibration amplitude
in
STRUCTURAL FEATURES IN
Wavelet featurein
Feature set degree of membership in{FOD, NOFOD, UNCERTAIN} Categories
Membership functions Fuzzy rule base
FEATURE SET DEGREE OF MEMBERSHIP OUT TO BASIC PROBABILITY ASSIGNMENT (bpa) CALCULATION
Figure 11: Vibration expert membership functions and implication operations.

NASA/TM—2004-213192 14
The final step in the fusion requires combining the bpa provided by each expert. The original method used in evidence theory is Dempster’s rule of combination15
K1
)(Am)(Am
mAAA
2211
(A)1,2i
−
⋅
=∑
=∩ j (7)
for 0A ≠ and 0m )(φ1,2 = and
∑=∩
⋅=φAA
2211
i
)(Am)(AmKj
(8)
The bpa mi (aka probability masses or belief structures31) represent the degree or weight of evidence that supports a given proposition. In the present context the bpa are designated as m(FOD), m(NOFOD), m(UNCERTAIN). Another interpretation for the belief structure could be the proposition: “a FOD event has occurred. Given the evidence based on the features extracted from the data, the bpa are m(T), m(F), m(T,F),” i.e., some of the evidence supports that a FOD event has occurred, some that a FOD event has not occurred, or some supports either proposition. The subscripts denote the sources (or experts) assigning the weights to the evidence. There may be more than two sources. The factor K in the denominator of Equation 7 is used to remove the effect of conflicting expert opinions, essentially ignoring the conflict, which, as Shafer points out32 may result in an erroneous diagnosis. Dempster’s rule was later modified by Yager32 to incorporate conflict among experts as additional uncertainty—removing the 1-K term in the denominator of Equation 7 and adding K onto mass corresponding to the uncertain set. This provides a more prudent means for incorporating conflicting opinions which, in actuality, would lead to decreased confidence (i.e., greater uncertainty) in the final decision. In order to effectively process the features extracted, each with its own respective processing time delays and duration, the fusion algorithm requires that the features are provided to the fuzzy classifier in a pseudo synchronous fashion, i.e., the transient values of the features are “latched” at their maximum values in order to ensure that all of the information is ultimately processed by the fusion. For the present study, a fusion horizon, the data window over which the fusion is performed, is five seconds. For final implementation, several overlapping data windows may be used to ensure adequate signal coverage for the event of interest.
IV. Evidence Fusion Applied to Simulated FOD Events
The data fusion process presented in figure 1 was applied to simulated data from a combined-effects gas path/vibration model of a large turbofan engine.14, 33 The event occurs at cruise conditions under multivariable closed-loop control, demonstrating the fusion system’s ability to differentiate between conditions resulting purely from the FOD event and those due to the response of the controller. Figures 12 through 14 present the bpa determined by a) the vibration expert, b) the gas path expert, and c) the result of the fusion of the two using Yager’s modification to Dempster’s rule of combination. The results in figure 12 correspond to a simulated FOD-event occurring at 2 seconds due to a 0.5 lbm hard object hitting the fan blade at a relative speed of 300 mph at a radius of 20 inches. The simulated data was also used to calculate the gas path and vibration features shown in figures 3 and 9. As shown in the figure both experts consider the features observed to be conclusive evidence of FOD, with all of the probability mass assigned to m(FOD) within one second of the event. The majority of the delay is due to the calculation of the fan efficiency estimate running average, required to provide a smooth rate-of-change feature calculation. The fluctuation observed in the bpa for the experts and fusion immediately after the event is due to the combined effect of noise and event severity on the fuzzy classification of the features. The fuzzy membership functions (shown in figures 10 and 11) are curves of various slopes, with regions of small and high slope depending on the values of the features. As the features transition from values corresponding to NOFOD (zero slope) to regions corresponding to FOD (again, zero slope), the larger slopes result in greater sensitivity to variations in the features, i.e. greater sensitivity to noise.

NASA/TM—2004-213192 15
Figure 13 shows the fusion corresponding to a somewhat more benign FOD event. The foreign object hits the fan at the same position and speed as before, with a mass of 0.35 lbm. Neither expert commits to a decision regarding a FOD event, which is illustrated by the non-zero masses for the UNCERTAIN and NOFOD categories several seconds after the event. The structural expert provides somewhat less confidence than the gas path expert that a FOD event has occurred, and the fused m(FOD) is slightly higher than the two individual experts. Thus, from the point of view of the overall system, this can still be viewed as reinforcement since the experts agree that there is not enough evidence to declare that a FOD event has occurred. Even though no definitive answer is reached, this shows that the experts are in agreement on the limits of their ability to diagnose with confidence. The observed delay in arriving at the final fusion is primarily due to the effect of noise in the classification of the features (which, as described previously, would have a more pronounced effect for less significant events), the algorithm processing time, and the subsequent redistribution (recalculation) of the bpa. As shown in figure 9a, the final value of the vibration amplitude feature may be slightly affected by noise at times after the event has occurred. This may have a slight effect on the final fusion value, however the final value of the structural expert’s bpa is overwhelmingly dominated by the change in amplitude due to the event, and to a much lesser extent, the noise.
m(UNCERTAIN)
m(FOD)m(NOFOD)
a)
b)
c)
Time (sec)
m(UNCERTAIN)
m(FOD)m(NOFOD)
a)
b)
c)
Time (sec)
m(UNCERTAIN)
m(FOD)m(NOFOD)
a)
b)
c)
m(UNCERTAIN)
m(FOD)m(NOFOD)
m(UNCERTAIN)
m(FOD)m(NOFOD)
a)
b)
c)
Time (sec)
Figure 12: Basic probability assignments determined by (a) the vibration expert, (b) the gas path expert, and (c) the fusion. Strong evidence supporting FOD.

NASA/TM—2004-213192 16
Figure 14 presents the results of the fusion where there are conflicting opinions among the experts, i.e., the gas path analysis suggests that a FOD event has definitely occurred, while the features observed by the vibration expert indicate that there is virtually no evidence supporting the occurrence of a FOD event. The non-zero m(UNCERTAIN) essentially indicates that it is at least plausible that a FOD event could have occurred. Thus, for example, the fusion output presented in figures 13 and 14 may be put in terms of the Belief that a FOD event has occurred (BE(FOD)) and Plausibility that a FOD event could have occurred (PL(FOD)) given the evidence observed. BE(FOD) is defined as the mass resulting from evidence directly supporting FOD occurrence, i.e., m(FOD), while PL(FOD) is defined as the mass not supporting m(NOFOD), i.e., 1 – m(NOFOD). Figure 15 shows the evidence fusion of figures 13 and 14 in terms of the belief that a FOD event has occurred and the plausibility that a FOD event has occurred. The actual probability of FOD occurrence (PROB(FOD)) is bounded by the belief and plausibility where BE(FOD) is considered to be the lower bound and PL(FOD) is considered to be the upper bound. In the case where BE(FOD) equals PL(FOD), PROB(FOD) = PL(FOD) = BE(FOD). Thus, one could say that the fusion shown in figure 12 results in PROB(FOD) = 1.0 i.e., m(NOFOD) = 0.0, PL(FOD) = 1 – m(NOFOD) = BE(FOD) = m(FOD) = 1.0.
Time (sec)
m(UNCERTAIN)
m(FOD)m(NOFOD)
a)
b)
c)
Time (sec)
m(UNCERTAIN)
m(FOD)m(NOFOD)
Time (sec)Time (sec)
m(UNCERTAIN)
m(FOD)m(NOFOD)
m(UNCERTAIN)
m(FOD)m(NOFOD)
m(UNCERTAIN)
m(FOD)m(NOFOD)
a)
b)
c)
a)
b)
c)
a)
b)
c)
Figure 13: Basic probability assignments determined by (a) the vibration expert, (b) the gas path expert, and (c) the fusion. Marginal evidence supporting FOD.

NASA/TM—2004-213192 17
m(UNCERTAIN)
m(FOD)m(NOFOD)
a)
b)
c)
Time (sec)
m(UNCERTAIN)
m(FOD)m(NOFOD)
a)
b)
c)
Time (sec)
m(UNCERTAIN)
m(FOD)m(NOFOD)
a)
b)
c)
m(UNCERTAIN)
m(FOD)m(NOFOD)
m(UNCERTAIN)
m(FOD)m(NOFOD)
a)
b)
c)
Time (sec)
Figure 14: Basic probability assignments determined by (a) the vibration expert, (b) the gas path expert, and (c) the fusion. Conflicting Evidence.
BE(FOD)PL(FOD)
a)
b)
Time (sec)
BE(FOD)PL(FOD)
a)
b)
BE(FOD)PL(FOD)
a)
b)
Time (sec)
Figure 15: Post-fusion Plausibility and Belief functions for (a) Marginal evidence supporting FOD (refer to figure 13), and (b) Conflicting Evidence (refer to figure 14).

NASA/TM—2004-213192 18
V. Conclusions
The FOD event data fusion system developed combines feature-based evidence from multiple sources, thereby making an assessment more reliable and enhancing confidence in a diagnosis. This system provides a feature-level fusion and does not provide a “crisp” diagnosis or, for that matter, a policy for corrective action. The information set (i.e., the range of probabilities of FOD occurrence) provided by the feature-level fusion would be used by a decision-level fusion for diagnosis and corrective action depending on the policy adopted – neither of which is addressed in this paper. The fusion is shown to provide a reliable assessment for two “experts” in agreement i.e., where both see the evidence as strongly supporting the possibility of FOD occurrence. Where uncertainty or ignorance exists about the features being observed, the experts provide an uncertain assessment, with the uncertainty quantified by the plausibility and belief of occurrence (which would both be equal to 1.0 in the previous scenario). For situations where the fusion shows direct conflict among experts i.e., one of the experts concludes that a FOD event has definitely occurred and the other concludes that a FOD event has not occurred, this uncertainty band my be quite large, with the results indicating that one (or more) of the sensors providing information may be malfunctioning. Although two sources, or “experts,” fed opinions into the fusion for the present investigation, more sources of opinion16 (i.e., sources generating mass assignments based on categorization of the evidence) could easily be incorporated. The effectiveness of the fusion system relies heavily on the design of the fuzzy classifier (i.e., the membership functions) which, as mentioned previously, is designed using expert knowledge. In the case of the present design, the designer was confident of what feature values (calculated based on simulation results) would constitute a high likelihood of a FOD-event and a low likelihood of FOD event. The exact shape of the membership functions, which dictate the performance (e.g., response characteristics) of the fusion algorithm at intermediate feature values, was at the discretion of the designer, and may not represent the optimal shape for the application considered. The membership functions may be easily adjusted to provide more accurate feature classification in the event that empirical data is available and analysis of the data suggests that a redesign is necessary.
The use of fuzzy inference techniques combined with the Dempster-Shafer-Yager Theory of Evidence provides a theoretical justification for drawing conclusions based on imprecise or incomplete data, which can be easily adapted to other applications. The method presented provides a prudent technique for decision making in situations where there is significant uncertainty beyond that which would be encountered using probabilistic methods i.e., test data to support the generation of probabilities and probability distributions is not, nor ever will be, available and only “expert” opinions are available.
References
1Society of Automotive Engineers, “Uncontained Turbine Engine Rotor Events Data Period 1984 Through 1989,” SAE SP–1270, 1998.
2Airplane Turbofan Engine Operation and Malfunctions Basic Familiarization for Flight Crews, [online report], URL:
http://www.faa.gov/certification/aircraft/engine_special_topics.htm [cited 12 May 2004]. 3Mattingly, J.D., Heiser, W.H., Pratt, D.T., Aircraft Engine Design, Second Edition, American Institute of Aeronautics and
Astronautics, Reston, VA, 2002. 4Eschenfelder, P., “Wildlife Hazards to Aviation,” ICAO/ACI Airports Conference, Miami, FL April 24, 2001. 5Turbofan Engine Malfunction Recognition and Response Final Report, [online report], URL:
http://www.faa.gov/certification/aircraft/engine_special_topics.htm [cited 12 May 2004]. 6Grindle, T.J., Burcham, F.W., “Engine Damage to a NASA DC–8–72 Airplane from a High-Altitude Encounter with a
Diffuse Volcanic Ash Cloud,” NASA/TM—2003-212030, August 2003. 7Kerr L.J., Nemec T.S., Gallops, G.W., “Real-Time Estimation of Gas Turbine Engine Damage Using a Control Based
Kalman Filter Algorithm,” ASME 91–GT–216, International Gas Turbine and Aeroengine Congress and Exposition, Orlando, FL, June 3–6, 1991.
NASA/TM—2004-213192 19
8Luppold, R.H., Roman, J.R., Gallops, G.W., Kerr L.J., “Estimating In-Flight Performance Variations Using Kalman Filter
Concepts,” AIAA–89–2584, AIAA 25th Joint Propulsion Conference, Monterey, CA, July 10–12, 1989. 9Klein, Lawrence A., Sensor and Data Fusion Concepts and Applications, 2nd Ed., SPIE Press Vol. TT35, 1999. 10Doebelin, Ernest O., Measurement Systems Application and Design, 5th Ed., McGraw Hill Publishing, New York, 2004. 11Kobayashi, T., Simon, D.L., “Application of a Bank of Kalman Filters for Aircraft Engine Fault Diagnostics,” Proceedings
of the ASME Turbo Expo 2003, Power for Land, Sea, and Air, June 16–19, 2003, Atlanta, GA. 12Lim, Meng Hee and M. Salman Leong, “Diagnosis for Loose Blades in Gas Turbines Using Wavelet Analysis,”
Proceedings of the ASME Turbo Expo 2003, Power for Land, Sea, and Air, June 16–19, 2003, Atlanta, Georgia. 13Juluri, Naresh and S. Swarnamani, “Improved Accuracy of Fault Diagnosis of Rotating Machinery Using Wavelet De-
Noising and Feature Selection,” Proceedings of the ASME Turbo Expo 2003, Power for Land, Sea, and Air, June 16–19, 2003, Atlanta, Georgia.
14Turso, J., Lawrence, C., Litt, J., “Reduced-Order Modeling and Wavelet Analysis of Turbofan Engine Structural Response
due to Foreign Object Damage (FOD) Events,” NASA/TM–2004–213118, 2004. 15Thomopoulos, Stelios C.A., “Decision and Evidence Fusion in Sensor Integration,” Control and Dynamic Systems, Vol. 49,
1991. 16Volponi, A.J., Brotherton, T., Luppold, R., Simon, D.L., “Development of an Information Fusion System for Engine
Diagnostics and Health Management,” Proceedings of the 39th Combustion/27th Airbreathing Propulsion/21st Propulsion Systems Hazards / 3rd Modeling and Simulation Joint Subcommittee Meeting, Colorado Springs, Colorado, December 1–5, 2003.
17Volponi, A.J.,“Sensor Error Compensation in Engine Performance Diagnostics,” ASME 94–GT–58, International Gas
Turbine and Aeroengine Congress and Exposition, The Hague, Netherlands, June 13–16, 1994. 18Simon, Dan and Donald L. Simon, “Kalman Filtering With Inequality Constraints for Turbofan Engine Health Estimation,”
NASA/TM—2003-212111. 19Gelb, A. (Ed.), Applied Optimal Estimation, MIT Press, Cambridge, MA, 1999. 20Ehrich, Fredric F., Handbook of Rotordynamics, Krieger Publishing Company, Inc., Malabar, Fl, 1999. 21Chan, Y.T., Wavelet Basics, Kluwer Academic Publishers, Boston, MA, 1995. 22Abbate, A., DeCusatis, C., Das, P., Wavelets and Subbands Fundamentals and Applications, Birkhauser Publishing, Boston,
USA, 2002. 23Proakis, J.G., Rader, C.M., Ling, F., Nikias, C.L., Advanced Digital Signal Processing, Macmillan Publishing Co., New
York, 1992 24Mallat, S., Hwang, W.L., “Singularity Detection and Processing With Wavelets,” IEEE Transactions on Info. Theory,Vol.
38, No. 2, 1992. 25Dempsey, P.J., Afjeh, A.A., “Integrating Oil Debris and Vibration Gear Damage Detection Technologies Using Fuzzy
Logic,” NASA/TM—2002-211126, NASA Glenn Research Center, Cleveland, OH, 2002. 26MATLAB Fuzzy Logic Toolbox User’s Guide, The Mathworks Inc., Natick, Mass, 2001. 27Berkan, R., Trubatch, S., Fuzzy Systems Design Principles Building Fuzzy IF-THEN Rule Bases, IEEE Press, Piscataway,
NJ, 1997. 28Zadeh, L.A., “A Simple View of the Dempster-Shafer Theory of Evidence and its Implication for the Rule of
Combination,” AI Magazine, Summer, 1986.

NASA/TM—2004-213192 20
29Vachtsevanos, G., Kang, H., Cheng, J., Kim, I., “Detection and Identification of Axial Flow Compressor Instabilities,”
Journal of Guidance, Control, and Dynamics, Vol. 15, No. 5, 1992. 30Yen, J., “Generalizing the Dempster-Shafer Theory to Fuzzy Sets,” IEEE Transactions on Systems, Man, and Cybernetics,
Vol. 20, No. 3, 1990. 31Klir, G.J., Yuan, B., Fuzzy Sets and Fuzzy Logic Theory and Applications, Prentice Hall Publishing, Upper Saddle River,
NJ, 1995. 32Inagaki, T., “Interdependance Between Safety-Control Policy and Multiple-Sensor Schemes via Dempster-Shafer Theory,”
IEEE Transactions on Reliability, Vol. 40, No. 2, 1991. 33Parker, K. Guo, T., “Development of a Turbofan Engine Simulation in a Graphical Simulation Environment,” NASA/TM—
2003-212543, August 2003.

This publication is available from the NASA Center for AeroSpace Information, 301–621–0390.
REPORT DOCUMENTATION PAGE
2. REPORT DATE
19. SECURITY CLASSIFICATION OF ABSTRACT
18. SECURITY CLASSIFICATION OF THIS PAGE
Public reporting burden for this collection of information is estimated to average 1 hour per response, including the time for reviewing instructions, searching existing data sources,gathering and maintaining the data needed, and completing and reviewing the collection of information. Send comments regarding this burden estimate or any other aspect of thiscollection of information, including suggestions for reducing this burden, to Washington Headquarters Services, Directorate for Information Operations and Reports, 1215 JeffersonDavis Highway, Suite 1204, Arlington, VA 22202-4302, and to the Office of Management and Budget, Paperwork Reduction Project (0704-0188), Washington, DC 20503.
NSN 7540-01-280-5500 Standard Form 298 (Rev. 2-89)Prescribed by ANSI Std. Z39-18298-102
Form Approved
OMB No. 0704-0188
12b. DISTRIBUTION CODE
8. PERFORMING ORGANIZATION REPORT NUMBER
5. FUNDING NUMBERS
3. REPORT TYPE AND DATES COVERED
4. TITLE AND SUBTITLE
6. AUTHOR(S)
7. PERFORMING ORGANIZATION NAME(S) AND ADDRESS(ES)
11. SUPPLEMENTARY NOTES
12a. DISTRIBUTION/AVAILABILITY STATEMENT
13. ABSTRACT (Maximum 200 words)
14. SUBJECT TERMS
17. SECURITY CLASSIFICATION OF REPORT
16. PRICE CODE
15. NUMBER OF PAGES
20. LIMITATION OF ABSTRACT
Unclassified Unclassified
Technical Memorandum
Unclassified
1. AGENCY USE ONLY (Leave blank)
10. SPONSORING/MONITORING AGENCY REPORT NUMBER
9. SPONSORING/MONITORING AGENCY NAME(S) AND ADDRESS(ES)
National Aeronautics and Space AdministrationWashington, DC 20546–0001andU.S. Army Research LaboratoryAdelphi, Maryland 20783–1145
National Aeronautics and Space AdministrationJohn H. Glenn Research Center at Lewis FieldCleveland, Ohio 44135– 3191
Available electronically at http://gltrs.grc.nasa.gov
August 2004
NASA TM—2004-213192ARL–TR–3201AIAA–2004–4047
E–14691
26
A Foreign Object Damage Event Detector Data Fusion System forTurbofan Engines
James A. Turso and Jonathan S. Litt
Sensor fusion; Diagnostics; Foreign object damage
Unclassified -UnlimitedSubject Categories: 07 and 63 Distribution: Nonstandard
WBS–22–303–30–721L161102AF20
Prepared for the 40th Joint Propulsion Conference and Exhibit cosponsored by AIAA, ASME, SAE, and ASEE,Fort Lauderdale, Florida July 11–14, 2004. James A. Turso, QSS Group, Inc., Cleveland, Ohio 44135; andJonathan S. Litt, U.S. Army Research Laboratory, NASA Glenn Research Center. Responsible person, James A. Turso,organization code 5530, 216–433–6095.
A Data Fusion System designed to provide a reliable assessment of the occurrence of Foreign Object Damage (FOD) ina turbofan engine is presented. The FOD-event feature level fusion scheme combines knowledge of shifts in engine gaspath performance obtained using a Kalman filter, with bearing accelerometer signal features extracted via waveletanalysis, to positively identify a FOD event. A fuzzy inference system provides basic probability assignments (bpa)based on features extracted from the gas path analysis and bearing accelerometers to a fusion algorithm based on theDempster-Shafer-Yager Theory of Evidence. Details are provided on the wavelet transforms used to extract the foreignobject strike features from the noisy data and on the Kalman filter-based gas path analysis. The system is demonstratedusing a turbofan engine combined-effects model (CEM), providing both gas path and rotor dynamic structural re-sponse, and is suitable for rapid-prototyping of control and diagnostic systems. The fusion of the disparate data canprovide significantly more reliable detection of a FOD event than the use of either method alone. The use of fuzzyinference techniques combined with Dempster-Shafer-Yager Theory of Evidence provides a theoretical justification fordrawing conclusions based on imprecise or incomplete data.


![arXiv:2006.15056v2 [cs.CV] 29 Jun 2020 · arXiv:2006.15056v2 [cs.CV] 29 Jun 2020. Weakly supervised object detector Cross -supervised object detector Figure 1: A comparison between](https://static.fdocuments.in/doc/165x107/5f8db0697148ae4b5c37cc67/arxiv200615056v2-cscv-29-jun-2020-arxiv200615056v2-cscv-29-jun-2020-weakly.jpg)


