Research is available at conformant HTML version of this...
13
Geographic Differences in Persistent Organic Pollutant Levels of Yellowfin Tuna Sascha C.T. Nicklisch, Lindsay T. Bonito, Stuart Sandin, and Amro Hamdoun Marine Biology Research Division, Scripps Institution of Oceanography, University of California, San Diego, La Jolla, California, USA BACKGROUND: Fish are a source of persistent organic pollutants (POPs) in the human diet. Although species, trophic level, and means of produc- tion are typically considered in predicting fish pollutant load, and thus recommendations of consumption, capture location is usually not accounted for. OBJECTIVES: Yellowfin tuna (Thunnus albacares) are harvested from across the world’s oceans and are widely consumed. Here, we determined geo- graphic variation in the overall mass, concentration, and composition of POPs in yellowfin and examined the differences in levels of several POP con- geners of potential relevance to human health. METHODS: We sampled dorsal muscle of 117 yellowfin tuna from 12 locations worldwide, and measured POP levels using combined liquid or gas chromatography and mass spectrometry according to U.S. Environmental Protection Agency standard procedures. RESULTS: POP levels varied significantly among sites, more than 36-fold on a mass basis. Individual fish levels ranged from 0.16 to 138.29 ng/g wet weight and lipid-normalized concentrations from 0:1 to 12:7 lM. Levels of 10 congeners that interfere with the cellular defense pro- tein P-glycoprotein, termed transporter interfering compounds (TICs), ranged from 0.05 to 35.03 ng/g wet weight and from 0:03 to 3:32 lM in tuna lipid. Levels of TICs, and their individual congeners, were strongly associated with the overall POP load. Risk-based analysis of several carcinogenic POPs indicated that the fish with the highest levels of these potentially harmful compounds were clustered at specific geographic locations. CONCLUSIONS: Capture location is an important consideration when assessing the level and risk of human exposure to POPs through ingestion of wild fish. https://doi.org/10.1289/EHP518 Introduction Persistent organic pollutants (POPs) are hazardous environmen- tal chemicals that bioaccumulate in animals and are routinely detected in humans (CDC 2009, 2015). Although global efforts to reduce their production and usage have resulted in corre- sponding declines in their environmental levels, reservoirs of these pollutants remain in the world’s oceans (Lohmann et al. 2006). Fish can accumulate high amounts of these compounds as compared with other foods (Schecter et al. 2006b, 2010a) and thus consumption of seafood is an important route of human exposure to POPs. A better understanding of the factors govern- ing levels of POPs in fish is essential to predict and reduce exposure. Since POPs accumulate in fat and are eliminated slowly, the species and trophic level of fish have been previously used as indicators of relative pollutant load (Connolly and Pedersen 1988; Kelly et al. 2007). However, POP levels can also vary dra- matically even within a single species or at a given trophic level, limiting the utility of these predictions. For instance, recent food basket surveys have shown that canned sardines, a relatively low trophic level species (Froese and Pauly 2000), can have higher levels of hexabromocyclododecanes (HBCDDs), organochlorine pesticides (OCPs), polybrominated diphenyl ethers (PBDEs), polychlorinated biphenyls (PCBs), and perfluorinated compounds (PFCs) than cod or salmon (Schecter et al. 2010c, 2010b, 2010a). Similarly, whereas it has been shown that pollutant levels also vary by species of fish, with the highest levels detected in oily fish (Knutsen et al. 2008; Smith and Gangolli 2002), differences in POP levels can also be detected within the same species based on means of production. For example, the levels of many POPs were higher in farmed versus wild salmon (Hites et al. 2004a). A factor that may govern fish pollutant level is the patchy distribution of pollutants in the world’s oceans. For less migra- tory fish species that remain in single regions for most of their life, this would be reflected in pollutant variation depending on location of capture. For example, high variation in the levels of OCPs, PBDEs, and PCBs were observed in wild skipjack (Ueno et al. 2003, 2004, 2005) depending on where they were captured. However, given the limited geographic scale of these studies, it seems plausible that even greater variation in POP levels would be observed when examining fish harvested from across the world’s oceans. This geographic variation is impor- tant to address, because it has broad implications for assessment of health risks associated with POP exposure through consump- tion of fish. Tuna are one of the most widely harvested fish in the world and among the top two fish species consumed in the United States, along with salmon (Loke et al. 2012). Among the tunas, yellowfin(Thunnus albacares) are the second most harvested species after skipjack (ISSF 2017). More than 1,200,000 metric tons of yellowfin are caught annually, accounting for 27% of the global tuna catch (ISSF 2017). Yellowfin are relatively large predatory fish, and most are sold as fresh or frozen fillets. Yellowfin are distributed globally, but have shorter ranges than bluefin(Block et al. 2011), and thus might be expected to reflect geographic trends in POP level variation. Here, we measured POP levels in wild-caught yellowfin tuna from across the world’s oceans and determined their wet weight and lipid-normalized concentrations. From these data we calculated the levels of specific POP congeners that we recently demonstrated to be inhibitors of transporter proteins act as important cellular defense in humans (Nicklisch et al. 2016), termed TICs. The results of this study demonstrate the important role of geographic origin on total pollutant level of fish and reveal a close association between TICs and overall POP load. Address correspondence to A. Hamdoun, Marine Biology Research Division, Scripps Institution of Oceanography, University of California, San Diego, 9500 Gilman Dr., La Jolla, CA 92093-0202 USA. Telephone: (858) 822-5839. Email: [email protected] Supplemental Material is available online (https://doi.org/10.1289/EHP518). The authors declare they have no actual or potential competing financial interests. Received 16 May 2016; Revised 13 September 2016; Accepted 20 September 2016; Published 26 June 2017. Note to readers with disabilities: EHP strives to ensure that all journal content is accessible to all readers. However, some figures and Supplemental Material published in EHP articles may not conform to 508 standards due to the complexity of the information being presented. If you need assistance accessing journal content, please contact [email protected]. Our staff will work with you to assess and meet your accessibility needs within 3 working days. Environmental Health Perspectives 067014-1 A Section 508–conformant HTML version of this article is available at https://doi.org/10.1289/EHP518. Research
Transcript of Research is available at conformant HTML version of this...
Geographic Differences in Persistent Organic Pollutant Levels of Yellowfin TunaSascha C.T. Nicklisch, Lindsay T. Bonito, Stuart Sandin, and Amro Hamdoun
Marine Biology Research Division, Scripps Institution of Oceanography, University of California, San Diego, La Jolla, California, USA
BACKGROUND: Fish are a source of persistent organic pollutants (POPs) in the human diet. Although species, trophic level, and means of produc-tion are typically considered in predicting fish pollutant load, and thus recommendations of consumption, capture location is usually not accountedfor.OBJECTIVES: Yellowfin tuna (Thunnus albacares) are harvested from across the world’s oceans and are widely consumed. Here, we determined geo-graphic variation in the overall mass, concentration, and composition of POPs in yellowfin and examined the differences in levels of several POP con-geners of potential relevance to human health.METHODS: We sampled dorsal muscle of 117 yellowfin tuna from 12 locations worldwide, and measured POP levels using combined liquid or gaschromatography and mass spectrometry according to U.S. Environmental Protection Agency standard procedures.RESULTS: POP levels varied significantly among sites, more than 36-fold on a mass basis. Individual fish levels ranged from 0.16 to 138.29ng/g wet weight and lipid-normalized concentrations from 0:1 to 12:7 lM. Levels of 10 congeners that interfere with the cellular defense pro-tein P-glycoprotein, termed transporter interfering compounds (TICs), ranged from 0.05 to 35.03 ng/g wet weight and from 0:03 to 3:32 lM intuna lipid. Levels of TICs, and their individual congeners, were strongly associated with the overall POP load. Risk-based analysis of severalcarcinogenic POPs indicated that the fish with the highest levels of these potentially harmful compounds were clustered at specific geographiclocations.CONCLUSIONS: Capture location is an important consideration when assessing the level and risk of human exposure to POPs through ingestion of wildfish. https://doi.org/10.1289/EHP518
IntroductionPersistent organic pollutants (POPs) are hazardous environmen-tal chemicals that bioaccumulate in animals and are routinelydetected in humans (CDC 2009, 2015). Although global effortsto reduce their production and usage have resulted in corre-sponding declines in their environmental levels, reservoirs ofthese pollutants remain in the world’s oceans (Lohmann et al.2006). Fish can accumulate high amounts of these compoundsas compared with other foods (Schecter et al. 2006b, 2010a)and thus consumption of seafood is an important route of humanexposure to POPs. A better understanding of the factors govern-ing levels of POPs in fish is essential to predict and reduceexposure.
Since POPs accumulate in fat and are eliminated slowly, thespecies and trophic level of fish have been previously used asindicators of relative pollutant load (Connolly and Pedersen1988; Kelly et al. 2007). However, POP levels can also vary dra-matically even within a single species or at a given trophic level,limiting the utility of these predictions. For instance, recent foodbasket surveys have shown that canned sardines, a relatively lowtrophic level species (Froese and Pauly 2000), can have higherlevels of hexabromocyclododecanes (HBCDDs), organochlorinepesticides (OCPs), polybrominated diphenyl ethers (PBDEs),polychlorinated biphenyls (PCBs), and perfluorinated compounds(PFCs) than cod or salmon (Schecter et al. 2010c, 2010b, 2010a).Similarly, whereas it has been shown that pollutant levels also
vary by species of fish, with the highest levels detected in oilyfish (Knutsen et al. 2008; Smith and Gangolli 2002), differencesin POP levels can also be detected within the same speciesbased on means of production. For example, the levels of manyPOPs were higher in farmed versus wild salmon (Hites et al.2004a).
A factor that may govern fish pollutant level is the patchydistribution of pollutants in the world’s oceans. For less migra-tory fish species that remain in single regions for most of theirlife, this would be reflected in pollutant variation depending onlocation of capture. For example, high variation in the levels ofOCPs, PBDEs, and PCBs were observed in wild skipjack(Ueno et al. 2003, 2004, 2005) depending on where they werecaptured. However, given the limited geographic scale of thesestudies, it seems plausible that even greater variation in POPlevels would be observed when examining fish harvested fromacross the world’s oceans. This geographic variation is impor-tant to address, because it has broad implications for assessmentof health risks associated with POP exposure through consump-tion of fish.
Tuna are one of the most widely harvested fish in the worldand among the top two fish species consumed in the UnitedStates, along with salmon (Loke et al. 2012). Among the tunas,yellowfin (Thunnus albacares) are the second most harvestedspecies after skipjack (ISSF 2017). More than 1,200,000 metrictons of yellowfin are caught annually, accounting for 27% of theglobal tuna catch (ISSF 2017). Yellowfin are relatively largepredatory fish, and most are sold as fresh or frozen fillets.Yellowfin are distributed globally, but have shorter ranges thanbluefin (Block et al. 2011), and thus might be expected to reflectgeographic trends in POP level variation.
Here, we measured POP levels in wild-caught yellowfintuna from across the world’s oceans and determined their wetweight and lipid-normalized concentrations. From these datawe calculated the levels of specific POP congeners that werecently demonstrated to be inhibitors of transporter proteinsact as important cellular defense in humans (Nicklisch et al.2016), termed TICs. The results of this study demonstrate theimportant role of geographic origin on total pollutant level offish and reveal a close association between TICs and overallPOP load.
Address correspondence to A. Hamdoun, Marine Biology ResearchDivision, Scripps Institution of Oceanography, University of California, SanDiego, 9500 Gilman Dr., La Jolla, CA 92093-0202 USA. Telephone: (858)822-5839. Email: [email protected] is availableonline (https://doi.org/10.1289/EHP518).The authors declare they have no actual or potential competing financial
interests.Received 16 May 2016; Revised 13 September 2016; Accepted 20
September 2016; Published 26 June 2017.Note to readers with disabilities: EHP strives to ensure that all journal
content is accessible to all readers. However, some figures and SupplementalMaterial published in EHP articles may not conform to 508 standards due to thecomplexity of the information being presented. If you need assistance accessingjournal content, please contact [email protected]. Our staff will workwith you to assess andmeet your accessibility needswithin 3workingdays.
Environmental Health Perspectives 067014-1
A Section 508–conformant HTML version of this articleis available at https://doi.org/10.1289/EHP518.Research
Methods
Tuna CollectionDorsal, white muscle filets of yellowfin tuna (Thunnus albacares)were collected from all four major yellowfin stocks, including theAtlantic Ocean, Eastern Pacific Ocean, Western Pacific Ocean,and Indian Ocean stocks (ISSF 2017). The 12 capture locations(see Figure S1) included the North Pacific Ocean (NPO), NorthEast Pacific Ocean (NEPO), Gulf of Mexico (GOM), South EastPacific Ocean (SEPO), Northwest Atlantic (NWAO), NortheastAtlantic Ocean (NEAO), South East Atlantic Ocean (SEAO),Indian Ocean (IO), South China Sea (SCS), North China Sea(NCS), Northwest Pacific Ocean (NWPO), and the SouthwestPacific Ocean (SWPO). The target size class for sampling was100 cm, roughly 1–2 y old (Kikkawa and Cushing 2002), and thesampled fish had a mean standard length of 92:91± 21:98 cm,with a range of 52:32–139:5 cm. Only fork length measurementwas available for fish from the IO. Tuna were captured either bytrolling or longline. A coordinate for the capture site wasrecorded for each fish, accurate to within 100 km.
Pollutant AnalysisTuna muscles were sent to AXYS (AXYS Analytical Services Ltd.)for analysis. POPs were measured according to the following U.S.Environmental Protection Agency (EPA) methods for OCPs: 608,625, 1625, 8081, 8270; PBDEs: 1614, 625, and PCBs: 1668, 8270.Analysis of OCPs was performed on a DB-5 capillary chromatogra-phy column coupled to a high-resolution mass spectrometer(HRMS). The concentrations of all 209 PCB congeners were deter-mined by high-resolution gas chromatography (HRGC) on an SPB-
Octyl column coupled to a high-resolution mass spectrometer(HRMS). Analysis of the PBDE congeners was performed usingHRGC on a DB-5HT capillary column coupled to an HRMS.
All 117 tuna from the 12 sites were screened for 29 OCPs, 11of these sites (109 tuna) were also screened for 209 PCBs, and ateight of these sites (79 tuna) were analyzed for nine PBDEs(Tables 1 and 2; see also Figure S1). Total POP levels weredefined as the sum of all OCPs, PBDEs, and PCBs measured infish from the eight sites with full coverage. One fish from theGOM had 4.8-fold higher total POP levels than any other fish andwas more than two times the interquartile range within the GOMsample group, and thus was excluded from further analysis.
In figures where individual POPs were assigned to differentgroups, we grouped PCBs according to their backbone chlorina-tion into mono-, di-, tri-, tetra-, penta-, hexa-, hepta-, octa, andnonachlorinated biphenyls. The OCP congeners were grouped asfollows: DDT (4,4 0-DDT, 2,4 0-DDT, 4,4 0-DDE, 2,4 0-DDE,4,4 0-DDD, 2,4 0-DDD, methoxychlor); Chlordane (oxy-chlor-dane, c-ðtransÞ-chlordane, a-ðcisÞ-chlordane, trans-nonachlor,cis-nonachlor); endosulfan (a-endosulfan, b-endosulfan, endo-sulfan sulfate, heptachlor, heptachlor epoxide); endrin(Aldrin, dieldrin, endrin, endrin aldehyde, endrin ketone);HCH (a-hexachlorocyclohexane, b-hexachlorocyclohexane, c-hexachlorocyclohexane, d-hexachlorocyclohexane). Hexachlo-robenzene (HCB), mirex, and toxaphene were used as singlecompounds.
Statistics and Data AnalysisBlank correction and analyses of pollutant raw data were per-formed according to previous studies (Hites et al. 2004b;
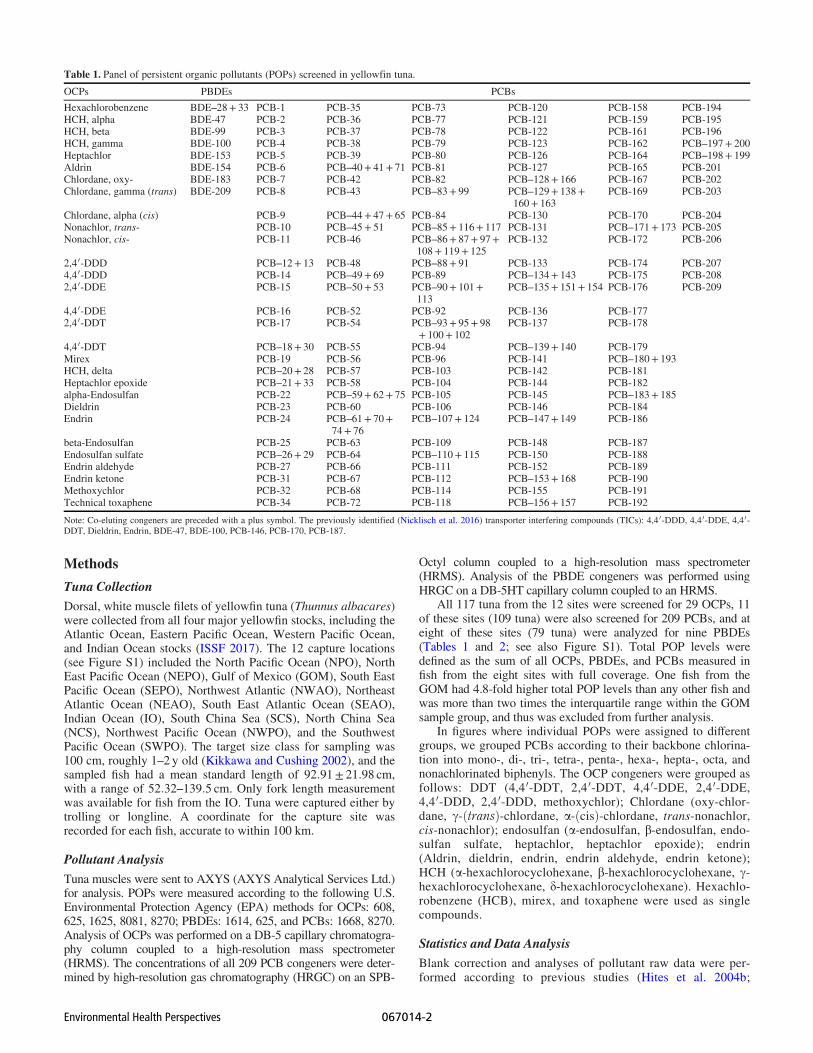
Table 1. Panel of persistent organic pollutants (POPs) screened in yellowfin tuna.
OCPs PBDEs PCBs
Hexachlorobenzene BDE–28+ 33 PCB-1 PCB-35 PCB-73 PCB-120 PCB-158 PCB-194HCH, alpha BDE-47 PCB-2 PCB-36 PCB-77 PCB-121 PCB-159 PCB-195HCH, beta BDE-99 PCB-3 PCB-37 PCB-78 PCB-122 PCB-161 PCB-196HCH, gamma BDE-100 PCB-4 PCB-38 PCB-79 PCB-123 PCB-162 PCB–197+ 200Heptachlor BDE-153 PCB-5 PCB-39 PCB-80 PCB-126 PCB-164 PCB–198+ 199Aldrin BDE-154 PCB-6 PCB–40+ 41+71 PCB-81 PCB-127 PCB-165 PCB-201Chlordane, oxy- BDE-183 PCB-7 PCB-42 PCB-82 PCB–128+ 166 PCB-167 PCB-202Chlordane, gamma (trans) BDE-209 PCB-8 PCB-43 PCB–83+ 99 PCB–129+ 138+
160+ 163PCB-169 PCB-203
Chlordane, alpha (cis) PCB-9 PCB–44+ 47+65 PCB-84 PCB-130 PCB-170 PCB-204Nonachlor, trans- PCB-10 PCB–45+ 51 PCB–85+ 116+ 117 PCB-131 PCB–171+ 173 PCB-205Nonachlor, cis- PCB-11 PCB-46 PCB–86+ 87+ 97+
108+ 119+ 125PCB-132 PCB-172 PCB-206
2,4 0-DDD PCB–12+ 13 PCB-48 PCB–88+ 91 PCB-133 PCB-174 PCB-2074,4 0-DDD PCB-14 PCB–49+ 69 PCB-89 PCB–134+ 143 PCB-175 PCB-2082,4 0-DDE PCB-15 PCB–50+ 53 PCB–90+ 101+
113PCB–135+ 151+ 154 PCB-176 PCB-209
4,4 0-DDE PCB-16 PCB-52 PCB-92 PCB-136 PCB-1772,4 0-DDT PCB-17 PCB-54 PCB–93+ 95+ 98
+100+ 102PCB-137 PCB-178
4,4 0-DDT PCB–18+ 30 PCB-55 PCB-94 PCB–139+ 140 PCB-179Mirex PCB-19 PCB-56 PCB-96 PCB-141 PCB–180+ 193HCH, delta PCB–20+ 28 PCB-57 PCB-103 PCB-142 PCB-181Heptachlor epoxide PCB–21+ 33 PCB-58 PCB-104 PCB-144 PCB-182alpha-Endosulfan PCB-22 PCB–59+ 62+75 PCB-105 PCB-145 PCB–183+ 185Dieldrin PCB-23 PCB-60 PCB-106 PCB-146 PCB-184Endrin PCB-24 PCB–61+ 70+
74+76PCB–107+ 124 PCB–147+ 149 PCB-186
beta-Endosulfan PCB-25 PCB-63 PCB-109 PCB-148 PCB-187Endosulfan sulfate PCB–26+ 29 PCB-64 PCB–110+ 115 PCB-150 PCB-188Endrin aldehyde PCB-27 PCB-66 PCB-111 PCB-152 PCB-189Endrin ketone PCB-31 PCB-67 PCB-112 PCB–153+ 168 PCB-190Methoxychlor PCB-32 PCB-68 PCB-114 PCB-155 PCB-191Technical toxaphene PCB-34 PCB-72 PCB-118 PCB–156+ 157 PCB-192
Note: Co-eluting congeners are preceded with a plus symbol. The previously identified (Nicklisch et al. 2016) transporter interfering compounds (TICs): 4,4 0-DDD, 4,4 0-DDE, 4,4 0-DDT, Dieldrin, Endrin, BDE-47, BDE-100, PCB-146, PCB-170, PCB-187.
Environmental Health Perspectives 067014-2
Schecter et al. 2006b). Briefly, where sample values were belowthe detection limit the values were treated as nondetectable.Most blank measurements were at or below the detection limitsand thus not subtracted from samples. In runs where blank val-ues were above detection limits, only samples with values morethan twice the blank value were reported (after subtraction ofthe blank value). The remaining values were treated as nonde-tectable. The nondetectable values were assigned zero whencalculating the molar concentrations of POPs in the lipid frac-tion of the muscle tissue, and for further statistical analysis, soas not to overestimate the level of pollutant in samples.
To relate the measured POP levels in tuna to effective concen-trations of transporter inhibiting compounds (TICs) from our previ-ous study (Nicklisch et al. 2016), we calculated the lipid-normalizedlevels of total POPs and the 10 TICs across sites (Table 2), assum-ing a lipid mass density of 1 (Young 1986). Sample tissue lipid con-tent was determined gravimetrically (AXYS Analytical ServicesLtd.) and expressed as percent of sample weight. For each normal-ization, we used the respective congener molecular weight derivedfrom the National Institutes of Health (NIH) Pubchem database(https://pubchem.ncbi.nlm.nih.gov/).
To meet assumptions of normality and homogeneity of var-iance, all data were log 10-transformed. For this, sample distribu-tions were initially analyzed using JMP’s normal quantile plotsand then log 10–transformed to approximate the normal distribu-tion. Analysis of variance (ANOVA) was then performed to testthe null hypotheses of equal means between groups. A post hocTukey honest significant difference (HSD) test was conducted toidentify significant pairwise differences between these groups. Wealso validated the significance of differences between mediansusing a Kruskal-Wallis rank sum test on the nontransformed data.Data were analyzed and plotted using JMP Pro version 12 (http://www.jmp.com) and OriginPro 2016 (http://www.originlab.com).
A principal components analysis was conducted to explorecovariance among TICs (Nicklisch et al. 2016) and the total POPlevels in 78 fish for which all 247 POPs were measured (see
Figure S1). We performed the PCA on a covariance matrixbecause all our variables had the same units of measure, and theirlog-transformed data were normally distributed, with similarscales and ranges. Nondetects were treated as zero values. Toaddress any potential effect of nondetects (i.e., missing values),we used the restricted maximum likelihood (REML) estimationmethod for calculating covariance according to JMP Pro version12. The TIC endrin was detected in only three fish from theNEAO and was thus excluded from PCA analysis.
Risk-Based Consumption Advisory CalculationsWe used the U.S. EPA’s modified approach for multiple contami-nants in a single fish species to calculate consumption limits basedon the carcinogenic effects of several POPs, including total PCBs,dieldrin, and toxaphene (Hites et al. 2004a; U.S. EPA 2000).Consumption limits were calculated for 108 tuna from the 11 sites(see Figure S1) where all three of these pollutant classes were mea-sured. Current cancer slope factors (CSFs) were derived from theU.S. EPA’s Integrated Risk Information System (IRIS) database,searched through the NIH Toxnet data network (https://toxnet.nlm.nih.gov/). For PCBs, the more conservative upper-bound slope fac-tor of 2 (mg/kg body weight)/d was chosen. Oral slope factors fordieldrin and toxaphene were 16 and 1.1 (mg/kg body weight)/d. Forall monthly consumption limit calculations, we used the measuredcontaminant concentrations in tuna muscle in mg/kg, an acceptablerisk level (ARL) of 10− 5, an adult consumer body weight of 70 kg,and an average uncooked fish meal size of 227 g (8 oz).
For the nutritional recommendation thresholds, we used theFood and Drug Administration (FDA) and the U.S. EPA jointfish consumption advice (FDA 2014) to consume 340 g (12 oz)of cooked fish a week (DHHS, USDA 2015) the diet recommen-dation from the American Heart Association (AHA) to eat fish atleast two times per week with a single serving size of 99 g(3.5 oz) of cooked fish (AHA 2015; Kris-Etherton et al. 2002). Weused a conversion factor of 1.33 to convert the mass of cooked fish
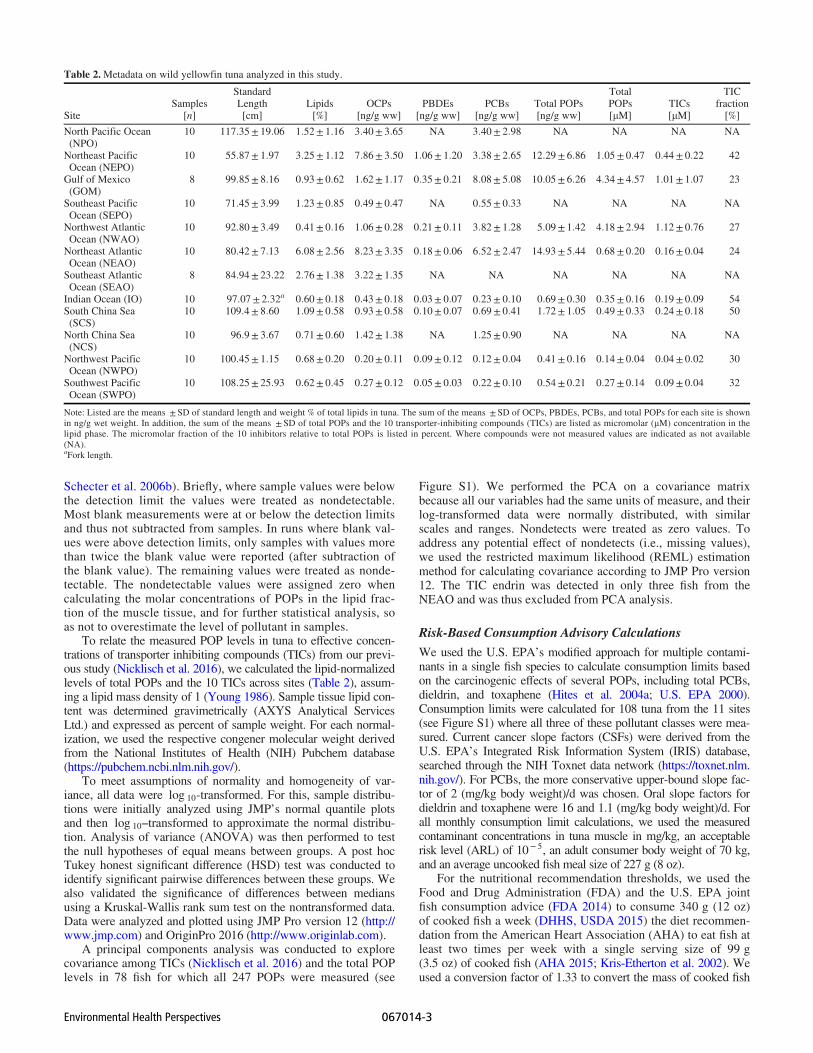
Table 2.Metadata on wild yellowfin tuna analyzed in this study.
SiteSamples
[n]
StandardLength[cm]
Lipids[%]
OCPs[ng/g ww]
PBDEs[ng/g ww]
PCBs[ng/g ww]
Total POPs[ng/g ww]
TotalPOPs[lM]
TICs[lM]
TICfraction[%]
North Pacific Ocean(NPO)
10 117:35± 19:06 1:52± 1:16 3:40± 3:65 NA 3:40± 2:98 NA NA NA NA
Northeast PacificOcean (NEPO)
10 55:87± 1:97 3:25± 1:12 7:86± 3:50 1:06± 1:20 3:38± 2:65 12:29± 6:86 1:05± 0:47 0:44± 0:22 42
Gulf of Mexico(GOM)
8 99:85± 8:16 0:93± 0:62 1:62± 1:17 0:35± 0:21 8:08± 5:08 10:05± 6:26 4:34± 4:57 1:01± 1:07 23
Southeast PacificOcean (SEPO)
10 71:45± 3:99 1:23± 0:85 0:49± 0:47 NA 0:55± 0:33 NA NA NA NA
Northwest AtlanticOcean (NWAO)
10 92:80± 3:49 0:41± 0:16 1:06± 0:28 0:21± 0:11 3:82± 1:28 5:09± 1:42 4:18± 2:94 1:12± 0:76 27
Northeast AtlanticOcean (NEAO)
10 80:42± 7:13 6:08± 2:56 8:23± 3:35 0:18± 0:06 6:52± 2:47 14:93± 5:44 0:68± 0:20 0:16± 0:04 24
Southeast AtlanticOcean (SEAO)
8 84:94± 23:22 2:76± 1:38 3:22± 1:35 NA NA NA NA NA NA
Indian Ocean (IO) 10 97:07± 2:32a 0:60± 0:18 0:43± 0:18 0:03± 0:07 0:23± 0:10 0:69± 0:30 0:35± 0:16 0:19± 0:09 54South China Sea(SCS)
10 109:4± 8:60 1:09± 0:58 0:93± 0:58 0:10± 0:07 0:69± 0:41 1:72± 1:05 0:49± 0:33 0:24± 0:18 50
North China Sea(NCS)
10 96:9± 3:67 0:71± 0:60 1:42± 1:38 NA 1:25± 0:90 NA NA NA NA
Northwest PacificOcean (NWPO)
10 100:45± 1:15 0:68± 0:20 0:20± 0:11 0:09± 0:12 0:12± 0:04 0:41± 0:16 0:14± 0:04 0:04± 0:02 30
Southwest PacificOcean (SWPO)
10 108:25± 25:93 0:62± 0:45 0:27± 0:12 0:05± 0:03 0:22± 0:10 0:54± 0:21 0:27± 0:14 0:09± 0:04 32
Note: Listed are the means ±SD of standard length and weight % of total lipids in tuna. The sum of the means ±SD of OCPs, PBDEs, PCBs, and total POPs for each site is shownin ng/g wet weight. In addition, the sum of the means ±SD of total POPs and the 10 transporter-inhibiting compounds (TICs) are listed as micromolar (lM) concentration in thelipid phase. The micromolar fraction of the 10 inhibitors relative to total POPs is listed in percent. Where compounds were not measured values are indicated as not available(NA).aFork length.
Environmental Health Perspectives 067014-3
to a corresponding mass of uncooked fish (Minnesota Departmentof Health 2016). Monthly dietary intake recommendations werecalculated based on an average of 4.33 weeks per month.
Results
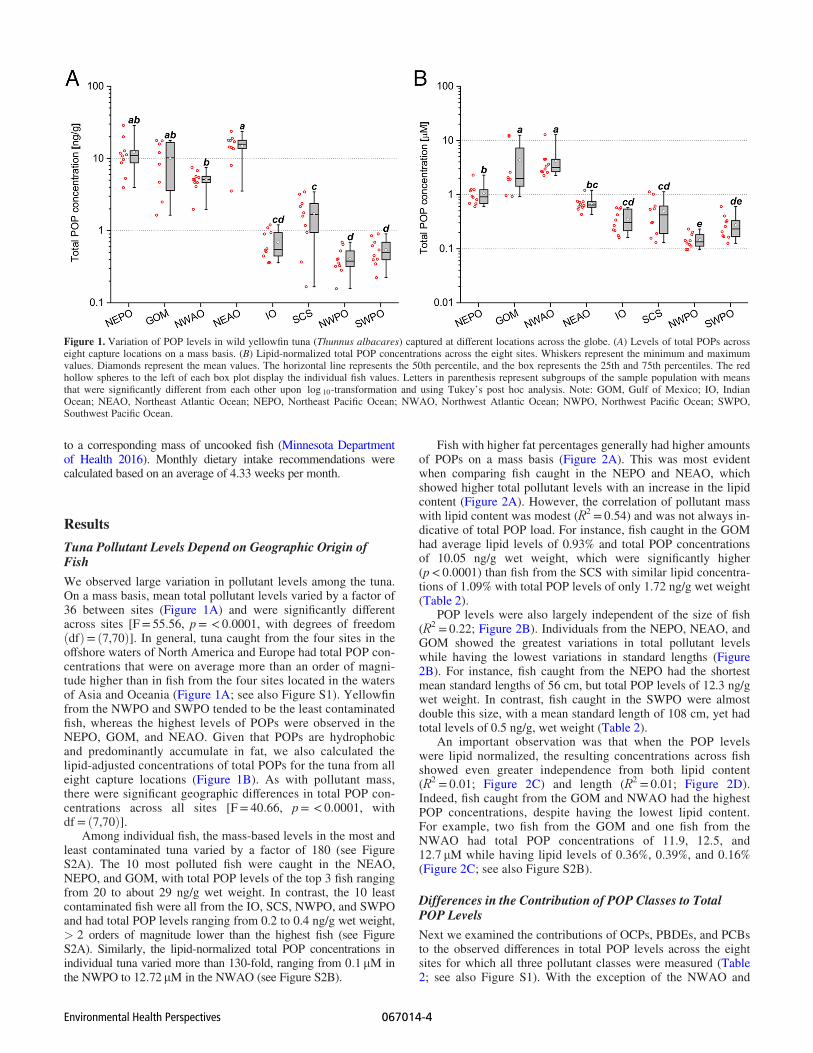
Tuna Pollutant Levels Depend on Geographic Origin ofFishWe observed large variation in pollutant levels among the tuna.On a mass basis, mean total pollutant levels varied by a factor of36 between sites (Figure 1A) and were significantly differentacross sites [F= 55:56, p= <0:0001, with degrees of freedomðdfÞ= ð7,70Þ]. In general, tuna caught from the four sites in theoffshore waters of North America and Europe had total POP con-centrations that were on average more than an order of magni-tude higher than in fish from the four sites located in the watersof Asia and Oceania (Figure 1A; see also Figure S1). Yellowfinfrom the NWPO and SWPO tended to be the least contaminatedfish, whereas the highest levels of POPs were observed in theNEPO, GOM, and NEAO. Given that POPs are hydrophobicand predominantly accumulate in fat, we also calculated thelipid-adjusted concentrations of total POPs for the tuna from alleight capture locations (Figure 1B). As with pollutant mass,there were significant geographic differences in total POP con-centrations across all sites [F= 40:66, p= <0:0001, withdf = ð7,70Þ].
Among individual fish, the mass-based levels in the most andleast contaminated tuna varied by a factor of 180 (see FigureS2A). The 10 most polluted fish were caught in the NEAO,NEPO, and GOM, with total POP levels of the top 3 fish rangingfrom 20 to about 29 ng/g wet weight. In contrast, the 10 leastcontaminated fish were all from the IO, SCS, NWPO, and SWPOand had total POP levels ranging from 0.2 to 0.4 ng/g wet weight,> 2 orders of magnitude lower than the highest fish (see FigureS2A). Similarly, the lipid-normalized total POP concentrations inindividual tuna varied more than 130-fold, ranging from 0:1 lM inthe NWPO to 12:72 lM in the NWAO (see Figure S2B).
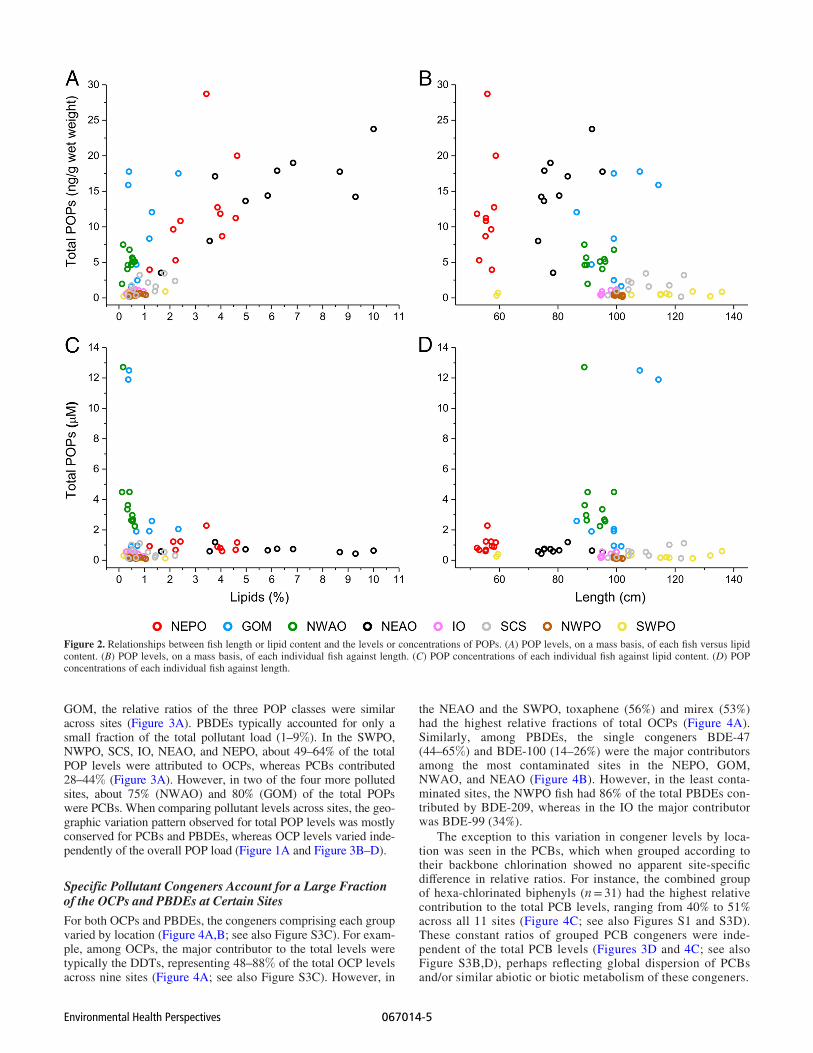
Fish with higher fat percentages generally had higher amountsof POPs on a mass basis (Figure 2A). This was most evidentwhen comparing fish caught in the NEPO and NEAO, whichshowed higher total pollutant levels with an increase in the lipidcontent (Figure 2A). However, the correlation of pollutant masswith lipid content was modest (R2 = 0:54) and was not always in-dicative of total POP load. For instance, fish caught in the GOMhad average lipid levels of 0.93% and total POP concentrationsof 10.05 ng/g wet weight, which were significantly higher(p<0:0001) than fish from the SCS with similar lipid concentra-tions of 1.09% with total POP levels of only 1.72 ng/g wet weight(Table 2).
POP levels were also largely independent of the size of fish(R2 = 0:22; Figure 2B). Individuals from the NEPO, NEAO, andGOM showed the greatest variations in total pollutant levelswhile having the lowest variations in standard lengths (Figure2B). For instance, fish caught from the NEPO had the shortestmean standard lengths of 56 cm, but total POP levels of 12.3 ng/gwet weight. In contrast, fish caught in the SWPO were almostdouble this size, with a mean standard length of 108 cm, yet hadtotal levels of 0.5 ng/g, wet weight (Table 2).
An important observation was that when the POP levelswere lipid normalized, the resulting concentrations across fishshowed even greater independence from both lipid content(R2 = 0:01; Figure 2C) and length (R2 = 0:01; Figure 2D).Indeed, fish caught from the GOM and NWAO had the highestPOP concentrations, despite having the lowest lipid content.For example, two fish from the GOM and one fish from theNWAO had total POP concentrations of 11.9, 12.5, and12:7 lM while having lipid levels of 0.36%, 0.39%, and 0.16%(Figure 2C; see also Figure S2B).
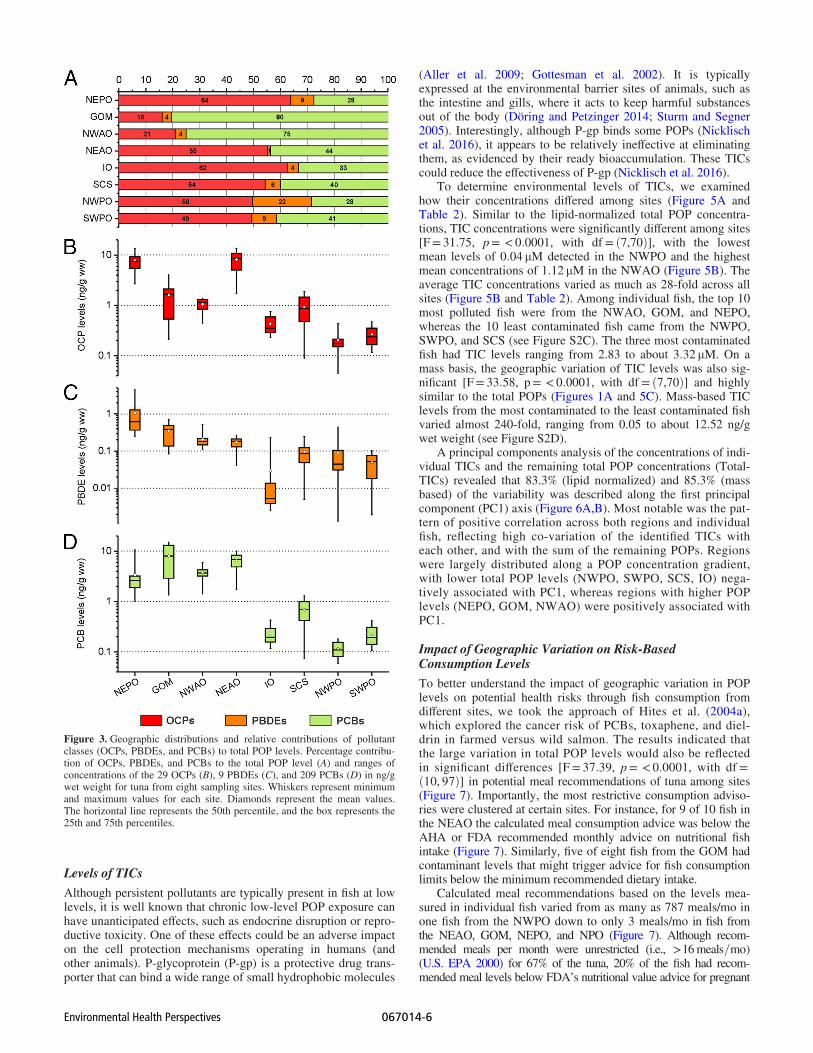
Differences in the Contribution of POP Classes to TotalPOP LevelsNext we examined the contributions of OCPs, PBDEs, and PCBsto the observed differences in total POP levels across the eightsites for which all three pollutant classes were measured (Table2; see also Figure S1). With the exception of the NWAO and
Figure 1. Variation of POP levels in wild yellowfin tuna (Thunnus albacares) captured at different locations across the globe. (A) Levels of total POPs acrosseight capture locations on a mass basis. (B) Lipid-normalized total POP concentrations across the eight sites. Whiskers represent the minimum and maximumvalues. Diamonds represent the mean values. The horizontal line represents the 50th percentile, and the box represents the 25th and 75th percentiles. The redhollow spheres to the left of each box plot display the individual fish values. Letters in parenthesis represent subgroups of the sample population with meansthat were significantly different from each other upon log 10-transformation and using Tukey’s post hoc analysis. Note: GOM, Gulf of Mexico; IO, IndianOcean; NEAO, Northeast Atlantic Ocean; NEPO, Northeast Pacific Ocean; NWAO, Northwest Atlantic Ocean; NWPO, Northwest Pacific Ocean; SWPO,Southwest Pacific Ocean.
Environmental Health Perspectives 067014-4
GOM, the relative ratios of the three POP classes were similaracross sites (Figure 3A). PBDEs typically accounted for only asmall fraction of the total pollutant load (1–9%). In the SWPO,NWPO, SCS, IO, NEAO, and NEPO, about 49–64% of the totalPOP levels were attributed to OCPs, whereas PCBs contributed28–44% (Figure 3A). However, in two of the four more pollutedsites, about 75% (NWAO) and 80% (GOM) of the total POPswere PCBs. When comparing pollutant levels across sites, the geo-graphic variation pattern observed for total POP levels was mostlyconserved for PCBs and PBDEs, whereas OCP levels varied inde-pendently of the overall POP load (Figure 1A and Figure 3B–D).
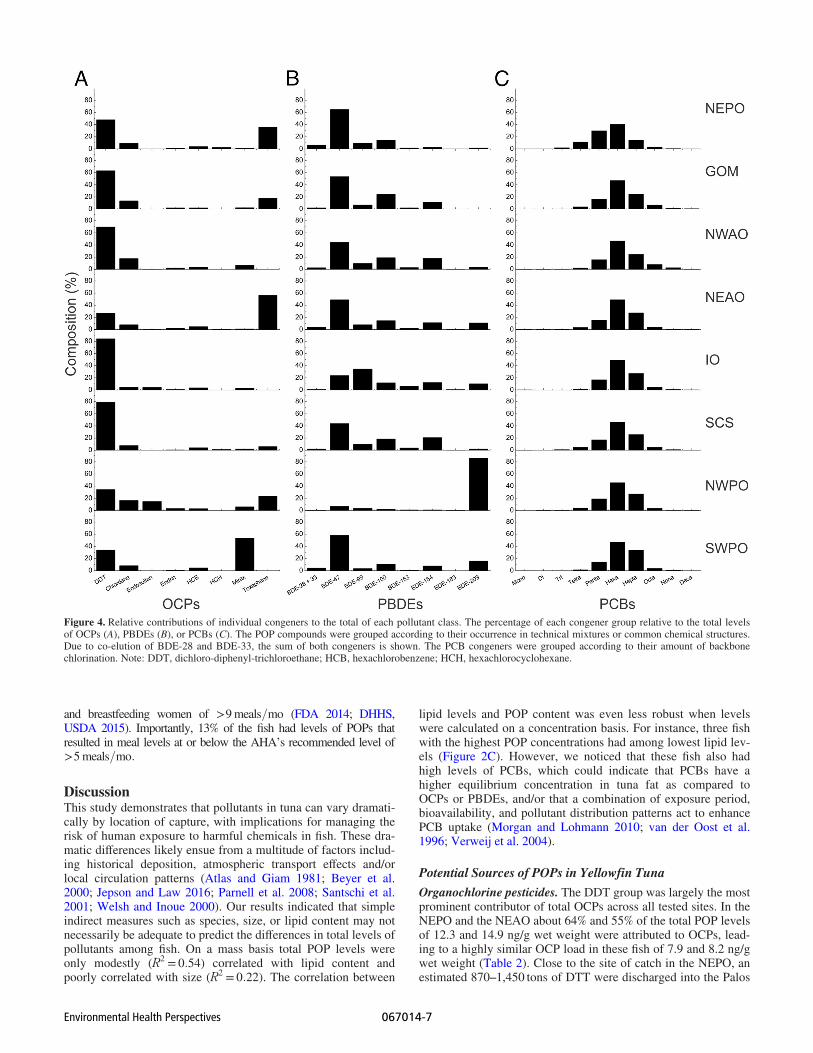
Specific Pollutant Congeners Account for a Large Fractionof the OCPs and PBDEs at Certain SitesFor both OCPs and PBDEs, the congeners comprising each groupvaried by location (Figure 4A,B; see also Figure S3C). For exam-ple, among OCPs, the major contributor to the total levels weretypically the DDTs, representing 48–88% of the total OCP levelsacross nine sites (Figure 4A; see also Figure S3C). However, in
the NEAO and the SWPO, toxaphene (56%) and mirex (53%)had the highest relative fractions of total OCPs (Figure 4A).Similarly, among PBDEs, the single congeners BDE-47(44–65%) and BDE-100 (14–26%) were the major contributorsamong the most contaminated sites in the NEPO, GOM,NWAO, and NEAO (Figure 4B). However, in the least conta-minated sites, the NWPO fish had 86% of the total PBDEs con-tributed by BDE-209, whereas in the IO the major contributorwas BDE-99 (34%).
The exception to this variation in congener levels by loca-tion was seen in the PCBs, which when grouped according totheir backbone chlorination showed no apparent site-specificdifference in relative ratios. For instance, the combined groupof hexa-chlorinated biphenyls (n=31) had the highest relativecontribution to the total PCB levels, ranging from 40% to 51%across all 11 sites (Figure 4C; see also Figures S1 and S3D).These constant ratios of grouped PCB congeners were inde-pendent of the total PCB levels (Figures 3D and 4C; see alsoFigure S3B,D), perhaps reflecting global dispersion of PCBsand/or similar abiotic or biotic metabolism of these congeners.
Figure 2. Relationships between fish length or lipid content and the levels or concentrations of POPs. (A) POP levels, on a mass basis, of each fish versus lipidcontent. (B) POP levels, on a mass basis, of each individual fish against length. (C) POP concentrations of each individual fish against lipid content. (D) POPconcentrations of each individual fish against length.
Environmental Health Perspectives 067014-5
Levels of TICsAlthough persistent pollutants are typically present in fish at lowlevels, it is well known that chronic low-level POP exposure canhave unanticipated effects, such as endocrine disruption or repro-ductive toxicity. One of these effects could be an adverse impacton the cell protection mechanisms operating in humans (andother animals). P-glycoprotein (P-gp) is a protective drug trans-porter that can bind a wide range of small hydrophobic molecules
(Aller et al. 2009; Gottesman et al. 2002). It is typicallyexpressed at the environmental barrier sites of animals, such asthe intestine and gills, where it acts to keep harmful substancesout of the body (Döring and Petzinger 2014; Sturm and Segner2005). Interestingly, although P-gp binds some POPs (Nicklischet al. 2016), it appears to be relatively ineffective at eliminatingthem, as evidenced by their ready bioaccumulation. These TICscould reduce the effectiveness of P-gp (Nicklisch et al. 2016).
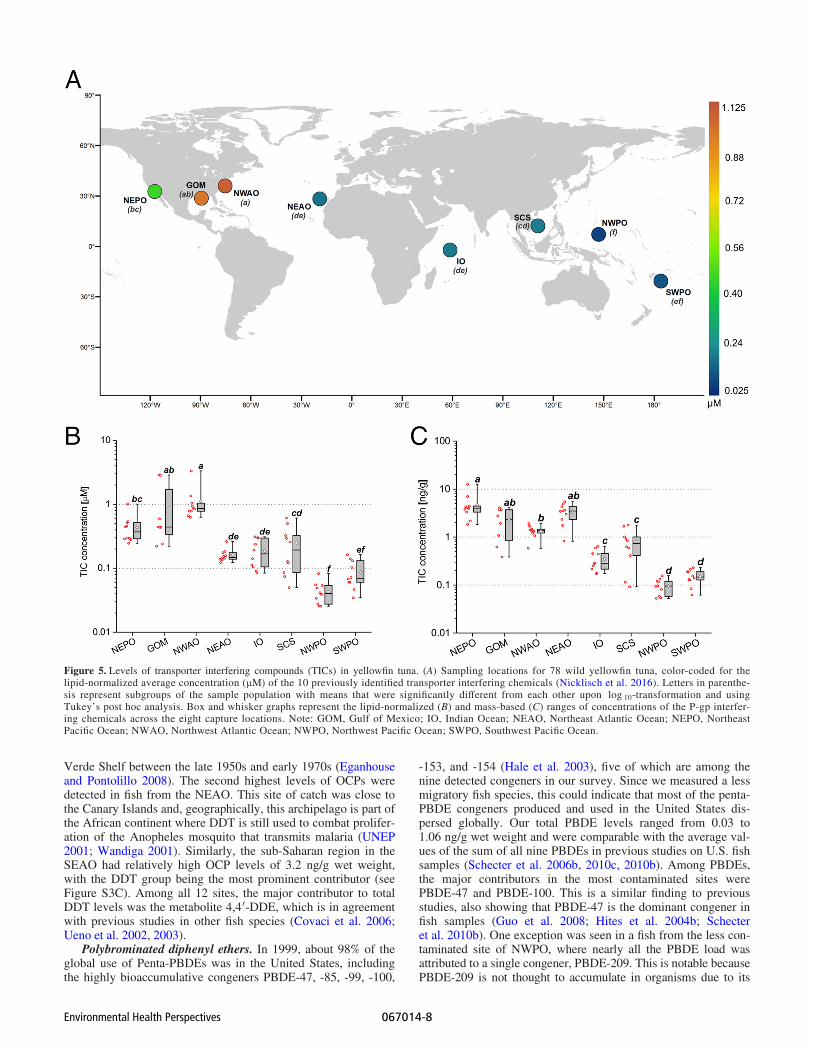
To determine environmental levels of TICs, we examinedhow their concentrations differed among sites (Figure 5A andTable 2). Similar to the lipid-normalized total POP concentra-tions, TIC concentrations were significantly different among sites[F= 31:75, p= <0:0001, with df = ð7,70Þ], with the lowestmean levels of 0:04 lM detected in the NWPO and the highestmean concentrations of 1:12lM in the NWAO (Figure 5B). Theaverage TIC concentrations varied as much as 28-fold across allsites (Figure 5B and Table 2). Among individual fish, the top 10most polluted fish were from the NWAO, GOM, and NEPO,whereas the 10 least contaminated fish came from the NWPO,SWPO, and SCS (see Figure S2C). The three most contaminatedfish had TIC levels ranging from 2.83 to about 3:32lM. On amass basis, the geographic variation of TIC levels was also sig-nificant [F= 33:58, p = <0:0001, with df = ð7,70Þ] and highlysimilar to the total POPs (Figures 1A and 5C). Mass-based TIClevels from the most contaminated to the least contaminated fishvaried almost 240-fold, ranging from 0.05 to about 12.52 ng/gwet weight (see Figure S2D).
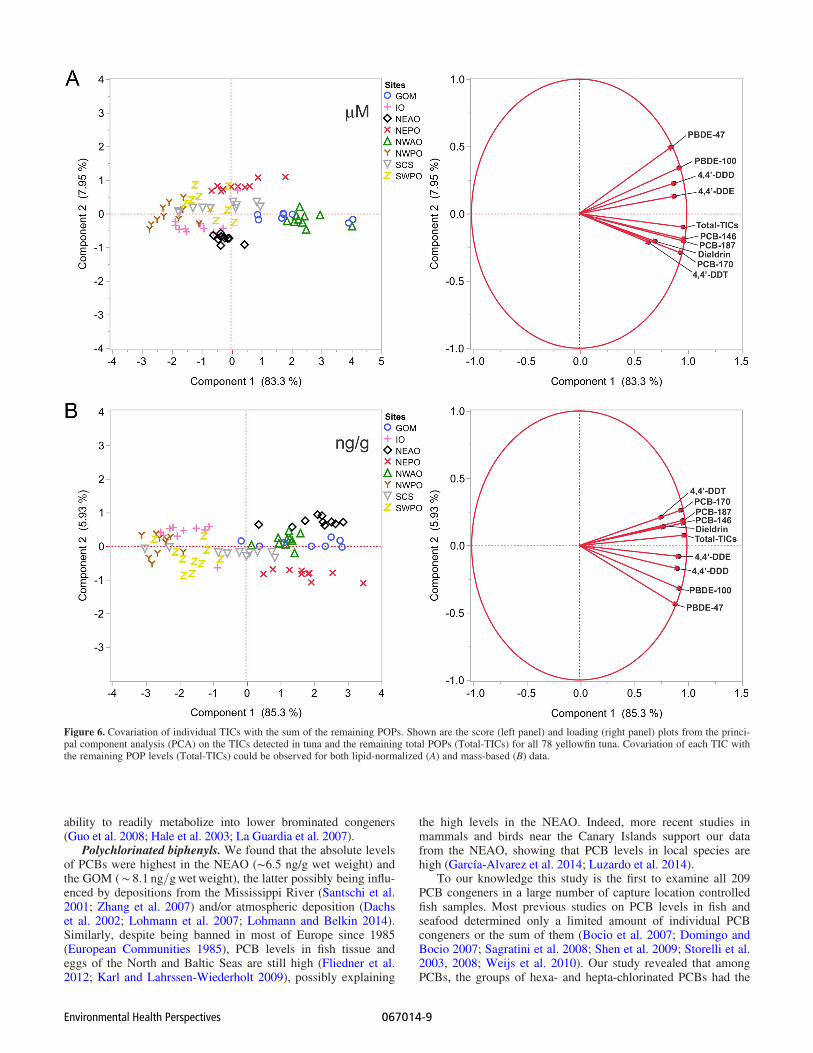
A principal components analysis of the concentrations of indi-vidual TICs and the remaining total POP concentrations (Total-TICs) revealed that 83.3% (lipid normalized) and 85.3% (massbased) of the variability was described along the first principalcomponent (PC1) axis (Figure 6A,B). Most notable was the pat-tern of positive correlation across both regions and individualfish, reflecting high co-variation of the identified TICs witheach other, and with the sum of the remaining POPs. Regionswere largely distributed along a POP concentration gradient,with lower total POP levels (NWPO, SWPO, SCS, IO) nega-tively associated with PC1, whereas regions with higher POPlevels (NEPO, GOM, NWAO) were positively associated withPC1.
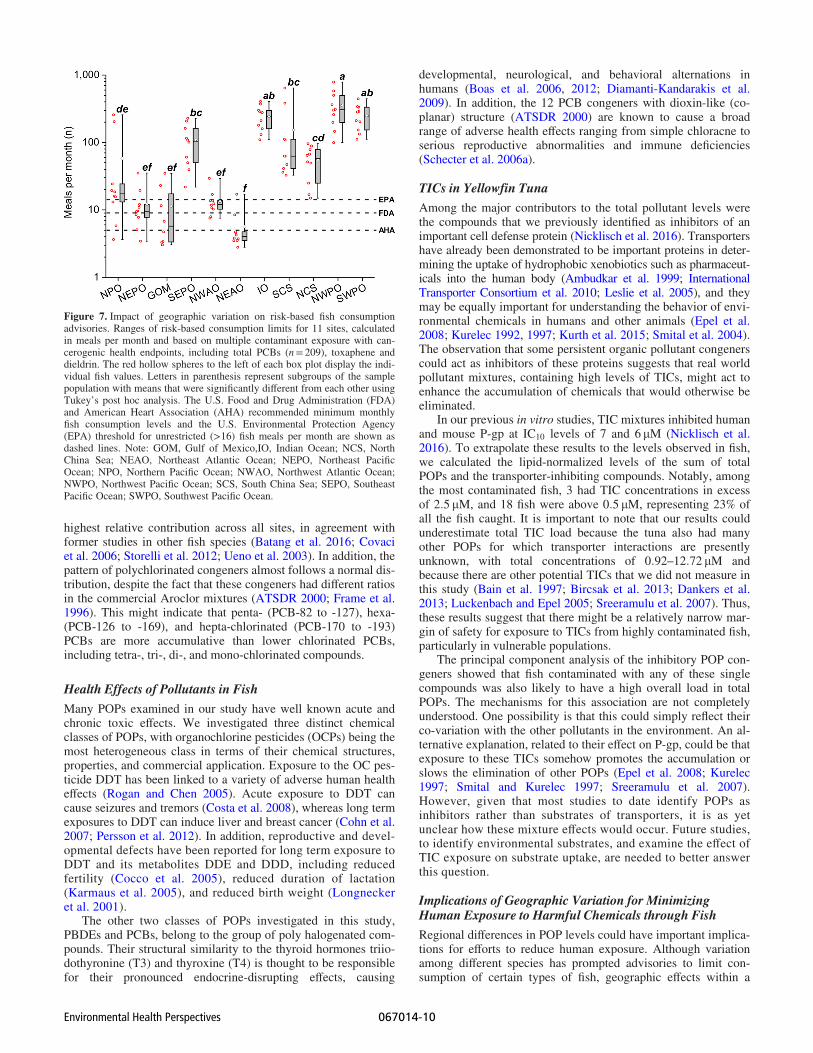
Impact of Geographic Variation on Risk-BasedConsumption LevelsTo better understand the impact of geographic variation in POPlevels on potential health risks through fish consumption fromdifferent sites, we took the approach of Hites et al. (2004a),which explored the cancer risk of PCBs, toxaphene, and diel-drin in farmed versus wild salmon. The results indicated thatthe large variation in total POP levels would also be reflectedin significant differences [F= 37:39, p= <0:0001, with df =ð10, 97Þ] in potential meal recommendations of tuna among sites(Figure 7). Importantly, the most restrictive consumption adviso-ries were clustered at certain sites. For instance, for 9 of 10 fish inthe NEAO the calculated meal consumption advice was below theAHA or FDA recommended monthly advice on nutritional fishintake (Figure 7). Similarly, five of eight fish from the GOM hadcontaminant levels that might trigger advice for fish consumptionlimits below the minimum recommended dietary intake.
Calculated meal recommendations based on the levels mea-sured in individual fish varied from as many as 787 meals/mo inone fish from the NWPO down to only 3 meals/mo in fish fromthe NEAO, GOM, NEPO, and NPO (Figure 7). Although recom-mended meals per month were unrestricted (i.e., >16meals=mo)(U.S. EPA 2000) for 67% of the tuna, 20% of the fish had recom-mended meal levels below FDA’s nutritional value advice for pregnant
Figure 3. Geographic distributions and relative contributions of pollutantclasses (OCPs, PBDEs, and PCBs) to total POP levels. Percentage contribu-tion of OCPs, PBDEs, and PCBs to the total POP level (A) and ranges ofconcentrations of the 29 OCPs (B), 9 PBDEs (C), and 209 PCBs (D) in ng/gwet weight for tuna from eight sampling sites. Whiskers represent minimumand maximum values for each site. Diamonds represent the mean values.The horizontal line represents the 50th percentile, and the box represents the25th and 75th percentiles.
Environmental Health Perspectives 067014-6
and breastfeeding women of >9meals=mo (FDA 2014; DHHS,USDA 2015). Importantly, 13% of the fish had levels of POPs thatresulted in meal levels at or below the AHA’s recommended level of>5meals=mo:
DiscussionThis study demonstrates that pollutants in tuna can vary dramati-cally by location of capture, with implications for managing therisk of human exposure to harmful chemicals in fish. These dra-matic differences likely ensue from a multitude of factors includ-ing historical deposition, atmospheric transport effects and/orlocal circulation patterns (Atlas and Giam 1981; Beyer et al.2000; Jepson and Law 2016; Parnell et al. 2008; Santschi et al.2001; Welsh and Inoue 2000). Our results indicated that simpleindirect measures such as species, size, or lipid content may notnecessarily be adequate to predict the differences in total levels ofpollutants among fish. On a mass basis total POP levels wereonly modestly (R2 = 0:54) correlated with lipid content andpoorly correlated with size (R2 = 0:22). The correlation between
lipid levels and POP content was even less robust when levelswere calculated on a concentration basis. For instance, three fishwith the highest POP concentrations had among lowest lipid lev-els (Figure 2C). However, we noticed that these fish also hadhigh levels of PCBs, which could indicate that PCBs have ahigher equilibrium concentration in tuna fat as compared toOCPs or PBDEs, and/or that a combination of exposure period,bioavailability, and pollutant distribution patterns act to enhancePCB uptake (Morgan and Lohmann 2010; van der Oost et al.1996; Verweij et al. 2004).
Potential Sources of POPs in Yellowfin TunaOrganochlorine pesticides. The DDT group was largely the mostprominent contributor of total OCPs across all tested sites. In theNEPO and the NEAO about 64% and 55% of the total POP levelsof 12.3 and 14.9 ng/g wet weight were attributed to OCPs, lead-ing to a highly similar OCP load in these fish of 7.9 and 8.2 ng/gwet weight (Table 2). Close to the site of catch in the NEPO, anestimated 870–1,450 tons of DTT were discharged into the Palos
Figure 4. Relative contributions of individual congeners to the total of each pollutant class. The percentage of each congener group relative to the total levelsof OCPs (A), PBDEs (B), or PCBs (C). The POP compounds were grouped according to their occurrence in technical mixtures or common chemical structures.Due to co-elution of BDE-28 and BDE-33, the sum of both congeners is shown. The PCB congeners were grouped according to their amount of backbonechlorination. Note: DDT, dichloro-diphenyl-trichloroethane; HCB, hexachlorobenzene; HCH, hexachlorocyclohexane.
Environmental Health Perspectives 067014-7
Verde Shelf between the late 1950s and early 1970s (Eganhouseand Pontolillo 2008). The second highest levels of OCPs weredetected in fish from the NEAO. This site of catch was close tothe Canary Islands and, geographically, this archipelago is part ofthe African continent where DDT is still used to combat prolifer-ation of the Anopheles mosquito that transmits malaria (UNEP2001; Wandiga 2001). Similarly, the sub-Saharan region in theSEAO had relatively high OCP levels of 3.2 ng/g wet weight,with the DDT group being the most prominent contributor (seeFigure S3C). Among all 12 sites, the major contributor to totalDDT levels was the metabolite 4,40-DDE, which is in agreementwith previous studies in other fish species (Covaci et al. 2006;Ueno et al. 2002, 2003).
Polybrominated diphenyl ethers. In 1999, about 98% of theglobal use of Penta-PBDEs was in the United States, includingthe highly bioaccumulative congeners PBDE-47, -85, -99, -100,
-153, and -154 (Hale et al. 2003), five of which are among thenine detected congeners in our survey. Since we measured a lessmigratory fish species, this could indicate that most of the penta-PBDE congeners produced and used in the United States dis-persed globally. Our total PBDE levels ranged from 0.03 to1.06 ng/g wet weight and were comparable with the average val-ues of the sum of all nine PBDEs in previous studies on U.S. fishsamples (Schecter et al. 2006b, 2010c, 2010b). Among PBDEs,the major contributors in the most contaminated sites werePBDE-47 and PBDE-100. This is a similar finding to previousstudies, also showing that PBDE-47 is the dominant congener infish samples (Guo et al. 2008; Hites et al. 2004b; Schecteret al. 2010b). One exception was seen in a fish from the less con-taminated site of NWPO, where nearly all the PBDE load wasattributed to a single congener, PBDE-209. This is notable becausePBDE-209 is not thought to accumulate in organisms due to its
Figure 5. Levels of transporter interfering compounds (TICs) in yellowfin tuna. (A) Sampling locations for 78 wild yellowfin tuna, color-coded for thelipid-normalized average concentration (lM) of the 10 previously identified transporter interfering chemicals (Nicklisch et al. 2016). Letters in parenthe-sis represent subgroups of the sample population with means that were significantly different from each other upon log 10-transformation and usingTukey’s post hoc analysis. Box and whisker graphs represent the lipid-normalized (B) and mass-based (C) ranges of concentrations of the P-gp interfer-ing chemicals across the eight capture locations. Note: GOM, Gulf of Mexico; IO, Indian Ocean; NEAO, Northeast Atlantic Ocean; NEPO, NortheastPacific Ocean; NWAO, Northwest Atlantic Ocean; NWPO, Northwest Pacific Ocean; SWPO, Southwest Pacific Ocean.
Environmental Health Perspectives 067014-8
ability to readily metabolize into lower brominated congeners(Guo et al. 2008; Hale et al. 2003; La Guardia et al. 2007).
Polychlorinated biphenyls. We found that the absolute levelsof PCBs were highest in the NEAO (∼6.5 ng/g wet weight) andthe GOM (∼ 8:1 ng=gwetweight), the latter possibly being influ-enced by depositions from the Mississippi River (Santschi et al.2001; Zhang et al. 2007) and/or atmospheric deposition (Dachset al. 2002; Lohmann et al. 2007; Lohmann and Belkin 2014).Similarly, despite being banned in most of Europe since 1985(European Communities 1985), PCB levels in fish tissue andeggs of the North and Baltic Seas are still high (Fliedner et al.2012; Karl and Lahrssen-Wiederholt 2009), possibly explaining
the high levels in the NEAO. Indeed, more recent studies inmammals and birds near the Canary Islands support our datafrom the NEAO, showing that PCB levels in local species arehigh (García-Alvarez et al. 2014; Luzardo et al. 2014).
To our knowledge this study is the first to examine all 209PCB congeners in a large number of capture location controlledfish samples. Most previous studies on PCB levels in fish andseafood determined only a limited amount of individual PCBcongeners or the sum of them (Bocio et al. 2007; Domingo andBocio 2007; Sagratini et al. 2008; Shen et al. 2009; Storelli et al.2003, 2008; Weijs et al. 2010). Our study revealed that amongPCBs, the groups of hexa- and hepta-chlorinated PCBs had the
Figure 6. Covariation of individual TICs with the sum of the remaining POPs. Shown are the score (left panel) and loading (right panel) plots from the princi-pal component analysis (PCA) on the TICs detected in tuna and the remaining total POPs (Total-TICs) for all 78 yellowfin tuna. Covariation of each TIC withthe remaining POP levels (Total-TICs) could be observed for both lipid-normalized (A) and mass-based (B) data.
Environmental Health Perspectives 067014-9
highest relative contribution across all sites, in agreement withformer studies in other fish species (Batang et al. 2016; Covaciet al. 2006; Storelli et al. 2012; Ueno et al. 2003). In addition, thepattern of polychlorinated congeners almost follows a normal dis-tribution, despite the fact that these congeners had different ratiosin the commercial Aroclor mixtures (ATSDR 2000; Frame et al.1996). This might indicate that penta- (PCB-82 to -127), hexa-(PCB-126 to -169), and hepta-chlorinated (PCB-170 to -193)PCBs are more accumulative than lower chlorinated PCBs,including tetra-, tri-, di-, and mono-chlorinated compounds.
Health Effects of Pollutants in FishMany POPs examined in our study have well known acute andchronic toxic effects. We investigated three distinct chemicalclasses of POPs, with organochlorine pesticides (OCPs) being themost heterogeneous class in terms of their chemical structures,properties, and commercial application. Exposure to the OC pes-ticide DDT has been linked to a variety of adverse human healtheffects (Rogan and Chen 2005). Acute exposure to DDT cancause seizures and tremors (Costa et al. 2008), whereas long termexposures to DDT can induce liver and breast cancer (Cohn et al.2007; Persson et al. 2012). In addition, reproductive and devel-opmental defects have been reported for long term exposure toDDT and its metabolites DDE and DDD, including reducedfertility (Cocco et al. 2005), reduced duration of lactation(Karmaus et al. 2005), and reduced birth weight (Longneckeret al. 2001).
The other two classes of POPs investigated in this study,PBDEs and PCBs, belong to the group of poly halogenated com-pounds. Their structural similarity to the thyroid hormones triio-dothyronine (T3) and thyroxine (T4) is thought to be responsiblefor their pronounced endocrine-disrupting effects, causing
developmental, neurological, and behavioral alternations inhumans (Boas et al. 2006, 2012; Diamanti-Kandarakis et al.2009). In addition, the 12 PCB congeners with dioxin-like (co-planar) structure (ATSDR 2000) are known to cause a broadrange of adverse health effects ranging from simple chloracne toserious reproductive abnormalities and immune deficiencies(Schecter et al. 2006a).
TICs in Yellowfin TunaAmong the major contributors to the total pollutant levels werethe compounds that we previously identified as inhibitors of animportant cell defense protein (Nicklisch et al. 2016). Transportershave already been demonstrated to be important proteins in deter-mining the uptake of hydrophobic xenobiotics such as pharmaceut-icals into the human body (Ambudkar et al. 1999; InternationalTransporter Consortium et al. 2010; Leslie et al. 2005), and theymay be equally important for understanding the behavior of envi-ronmental chemicals in humans and other animals (Epel et al.2008; Kurelec 1992, 1997; Kurth et al. 2015; Smital et al. 2004).The observation that some persistent organic pollutant congenerscould act as inhibitors of these proteins suggests that real worldpollutant mixtures, containing high levels of TICs, might act toenhance the accumulation of chemicals that would otherwise beeliminated.
In our previous in vitro studies, TIC mixtures inhibited humanand mouse P-gp at IC10 levels of 7 and 6lM (Nicklisch et al.2016). To extrapolate these results to the levels observed in fish,we calculated the lipid-normalized levels of the sum of totalPOPs and the transporter-inhibiting compounds. Notably, amongthe most contaminated fish, 3 had TIC concentrations in excessof 2:5 lM, and 18 fish were above 0:5 lM, representing 23% ofall the fish caught. It is important to note that our results couldunderestimate total TIC load because the tuna also had manyother POPs for which transporter interactions are presentlyunknown, with total concentrations of 0:92–12:72lM andbecause there are other potential TICs that we did not measure inthis study (Bain et al. 1997; Bircsak et al. 2013; Dankers et al.2013; Luckenbach and Epel 2005; Sreeramulu et al. 2007). Thus,these results suggest that there might be a relatively narrow mar-gin of safety for exposure to TICs from highly contaminated fish,particularly in vulnerable populations.
The principal component analysis of the inhibitory POP con-geners showed that fish contaminated with any of these singlecompounds was also likely to have a high overall load in totalPOPs. The mechanisms for this association are not completelyunderstood. One possibility is that this could simply reflect theirco-variation with the other pollutants in the environment. An al-ternative explanation, related to their effect on P-gp, could be thatexposure to these TICs somehow promotes the accumulation orslows the elimination of other POPs (Epel et al. 2008; Kurelec1997; Smital and Kurelec 1997; Sreeramulu et al. 2007).However, given that most studies to date identify POPs asinhibitors rather than substrates of transporters, it is as yetunclear how these mixture effects would occur. Future studies,to identify environmental substrates, and examine the effect ofTIC exposure on substrate uptake, are needed to better answerthis question.
Implications of Geographic Variation for MinimizingHuman Exposure to Harmful Chemicals through FishRegional differences in POP levels could have important implica-tions for efforts to reduce human exposure. Although variationamong different species has prompted advisories to limit con-sumption of certain types of fish, geographic effects within a
Figure 7. Impact of geographic variation on risk-based fish consumptionadvisories. Ranges of risk-based consumption limits for 11 sites, calculatedin meals per month and based on multiple contaminant exposure with can-cerogenic health endpoints, including total PCBs (n=209), toxaphene anddieldrin. The red hollow spheres to the left of each box plot display the indi-vidual fish values. Letters in parenthesis represent subgroups of the samplepopulation with means that were significantly different from each other usingTukey’s post hoc analysis. The U.S. Food and Drug Administration (FDA)and American Heart Association (AHA) recommended minimum monthlyfish consumption levels and the U.S. Environmental Protection Agency(EPA) threshold for unrestricted (>16) fish meals per month are shown asdashed lines. Note: GOM, Gulf of Mexico,IO, Indian Ocean; NCS, NorthChina Sea; NEAO, Northeast Atlantic Ocean; NEPO, Northeast PacificOcean; NPO, Northern Pacific Ocean; NWAO, Northwest Atlantic Ocean;NWPO, Northwest Pacific Ocean; SCS, South China Sea; SEPO, SoutheastPacific Ocean; SWPO, Southwest Pacific Ocean.
Environmental Health Perspectives 067014-10
species are usually not accounted for in these advisories.Consistent with the differences in total POP levels, we founddramatic differences in the potential consumption limits thatmight be recommended among sites. Indeed, these differenceswere greater than those previously reported for farmed versuswild salmon (Hites et al. 2004a). Given that fish consumptionhas well appreciated health benefits (Cohen et al. 2005), itseems that identifying and designating where wild fish are cap-tured could be an important tool to minimize fish pollutantrisks. At present, the United States imports more than half ofits total fish supply from other countries (FAO 2014, 2016;NOAA 2014) and fish of different origins can become mixedin the food supply (Jacquet and Pauly 2008; Warner et al.2013). Our study underscores how traceability through thesupply chain, and spatially stratified monitoring of POP lev-els, are necessary for management of fish pollutant risk.
AcknowledgmentsWe thank E. Parnell for his discussion of the statistical analyses.
This work was supported by the National Institutes of Health(grant no. ES021985) and by the National Science Foundation(grant no. 1314480) to A.H., and by a Waitt Foundation grant toA.H. and S.S.
ReferencesAHA (American Heart Association). 2015. Fish and Omega-3 Fatty Acids. http://www.
heart.org/HEARTORG/HealthyLiving/HealthyEating/HealthyDietGoals/Fish-and-Omega-3-Fatty-Acids_UCM_303248_Article.jsp [accessed 4 September 2016].
Aller SG, Yu J, Ward A, Weng Y, Chittaboina S, Zhuo R, et al. 2009.Structure of P-glycoprotein reveals a molecular basis for poly-specificdrug binding. Science 323:1718–1722, PMID: 19325113, https://doi.org/10.1126/science.1168750.
Ambudkar SV, Dey S, Hrycyna CA, Ramachandra M, Pastan I, Gottesman MM.1999. Biochemical, cellular, and pharmacological aspects of the multidrugtransporter. Annu Rev Pharmacol Toxicol 39:361–398, PMID: 10331089,https://doi.org/10.1146/annurev.pharmtox.39.1.361.
Atlas E, Giam CS. 1981. Global transport of organic pollutants: ambient concentra-tions in the remote marine atmosphere. Science 211:163–165, https://doi.org/10.1126/science.211.4478.163.
ATSDR (Agency for Toxic Substances and Disease Registry). 2000. “ToxicologicalProfile for Polychlorinated Biphenyls (PCBs).” Atlanta, GA:ATSDR.
Bain LJ, McLachlan JB, LeBlanc GA. 1997. Structure-activity relationships forxenobiotic transport substrates and inhibitory ligands of P-glycoprotein.Environ Health Perspect 105:812–818, PMID: 9347896.
Batang ZB, Alikunhi N, Gochfeld M, Burger J, Al-Jahdali R, Al-Jahdali H, et al.2016. Congener-specific levels and patterns of polychlorinated biphenyls in ed-ible fish tissue from the central Red Sea coast of Saudi Arabia. Sci TotalEnviron 572:915–925, https://doi.org/10.1016/j.scitotenv.2016.07.207.
Beyer A, Mackay D, Matthies M, Wania F, Webster E. 2000. Assessing long-rangetransport potential of persistent organic pollutants. Environ Sci Technol34:699–703, https://doi.org/10.1021/es990207w.
Bircsak KM, Richardson JR, Aleksunes LM. 2013. Inhibition of human MDR1 andBCRP transporter ATPase activity by organochlorine and pyrethroid insecti-cides. J Biochem Mol Toxicol 27:157–164, PMID: 23169446, https://doi.org/10.1002/jbt.21458.
Block BA, Jonsen ID, Jorgensen SJ, Winship AJ, Shaffer SA, Bograd SJ, et al.2011. Tracking apex marine predator movements in a dynamic ocean. Nature475:86–90, PMID: 21697831, https://doi.org/10.1038/nature10082.
Boas M, Feldt-Rasmussen U, Main KM. 2012. Thyroid effects of endocrine disruptingchemicals. Mol Cell Endocrinol 355:240–248, PMID: 21939731, https://doi.org/10.1016/j.mce.2011.09.005.
Boas M, Feldt-Rasmussen U, Skakkebæk NE, Main KM. 2006. Environmental chem-icals and thyroid function. Eur J Endocrinol 154:599–611, PMID: 16645005,https://doi.org/10.1530/eje.1.02128.
Bocio A, Domingo JL, Falcó G, Llobet JM. 2007. Concentrations of PCDD/PCDFsand PCBs in fish and seafood from the Catalan (Spain) market: estimatedhuman intake. Environ Int 33:170–175, PMID: 17049987, https://doi.org/10.1016/j.envint.2006.09.005.
CDC (Centers for Disease Control and Prevention). 2009. Fourth National Report onHuman Exposure to Environmental Chemicals. Atlanta, GA:CDC.
CDC. 2015. Fourth National Report on Human Exposure to EnvironmentalChemicals, Updated Tables. Atlanta, GA:CDC.
Cocco P, Fadda D, Ibba A, Melis M, Tocco MG, Atzeri S, et al. 2005. Reproductiveoutcomes in DDT applicators. Environ Res 98:120–126, PMID: 15721892,https://doi.org/10.1016/j.envres.2004.09.007.
Cohen J, Bellinger DC, Connor WE, Kris-Etherton PM, Lawrence RS, Savitz DA, etal. 2005. A quantitative risk–benefit analysis of changes in population fish con-sumption. Am J Prev Med 29:325–325, PMID: 16242599, https://doi.org/10.1016/j.amepre.2005.07.003.
Cohn BA, Wolff MS, Cirillo PM, Sholtz RI. 2007. DDT and breast cancer in youngwomen: new data on the significance of age at exposure. Environ HealthPerspect 115:1406–1414, PMID: 17938728, https://doi.org/10.1289/ehp.10260.
Connolly JP, Pedersen CJ. 1988. A thermodynamic-based evaluation of organicchemical accumulation in aquatic organisms. Environ Sci Technol 22:99–103,PMID: 22195516, https://doi.org/10.1021/es00166a011.
Costa LG, Giordano G, Guizzetti M, Vitalone A. 2008. Neurotoxicity of pesticides: abrief review. Front Biosci 13:1240–1249, PMID: 17981626, https://doi.org/10.2741/2758.
Covaci A, Gheorghe A, Hulea O, Schepens P. 2006. Levels and distribution of orga-nochlorine pesticides, polychlorinated biphenyls and polybrominated diphenylethers in sediments and biota from the Danube Delta, Romania. Environ Pollut140:136–149, PMID: 16112310, https://doi.org/10.1016/j.envpol.2005.06.008.
Dachs J, Lohmann R, Ockenden WA, Méjanelle L, Eisenreich SJ, Jones KC. 2002.Oceanic biogeochemical controls on global dynamics of persistent organicpollutants. Environ Sci Technol 36:4229–4237, PMID: 12387392, https://doi.org/10.1021/es025724k.
Dankers ACA, Roelofs MJ, Piersma AH, Sweep FC, Russel FG, van den Berg M, etal. 2013. Endocrine disruptors differentially target ATP-binding cassette trans-porters in the blood-testis barrier and affect Leydig cell testosterone secretionin vitro. Toxicol Sci 136:382–391, https://doi.org/10.1093/toxsci/kft198.
DHHS, USDA (U.S. Department of Health and Human Services, U.S. Department ofAgriculture). 2015. 2015–2020 Dietary Guidelines for Americans. 8th Edition.Washington, DC:DHHS, USDA.
Diamanti-Kandarakis E, Bourguignon JP, Giudice LC, Hauser R, Prins GS, Soto AM,et al. 2009. Endocrine-disrupting chemicals: an Endocrine Society scientificstatement. Endocr Rev 30:293–342, PMID: 19502515, https://doi.org/10.1210/er.2009-0002.
Domingo JL, Bocio A. 2007. Levels of PCDD/PCDFs and PCBs in edible marine spe-cies and human intake: a literature review. Environ Int 33:397–405, PMID:17270272, https://doi.org/10.1016/j.envint.2006.12.004.
Döring B, Petzinger E. 2014. Phase 0 and phase III transport in various organs:combined concept of phases in xenobiotic transport and metabolism. DrugMetab Rev 46:261–282, PMID: 24483608, https://doi.org/10.3109/03602532.2014.882353.
Eganhouse RP, Pontolillo J. 2008. DDE in sediments of the Palos Verdes shelf,California: in situ transformation rates and geochemical fate. Environ SciTechnol 42:6392–6398, PMID: 18800506, https://doi.org/10.1021/es7029619.
Epel D, Luckenbach T, Stevenson CN, MacManus-Spencer LA, Hamdoun A, SmitalT. 2008. Efflux transporters: newly appreciated roles in protection against pol-lutants. Environ Sci Technol 42:3914–3920, PMID: 18589945, https://doi.org/10.1021/es087187v.
European Communities. 1985. Council Directive 76/769/EEC on the approximation ofthe laws, regulations and administrative provisions of the Member Statesrelating to restrictions on the marketing and use of certain dangeroussubstances and preparations. Off J Eur Communities, Chapter 13.
FAO (Food and Agriculture Organization of the United Nations). 2014. The State ofWorld Fisheries and Aquaculture. Rome, Italy:FAO.
FAO. 2016. The State of World Fisheries and Aquaculture 2016. Contributing toFood Security and Nutrition for All. Rome, Italy:FAO.
FDA (US Food and Drug Administration). 2014. What Pregnant Women and ParentsShould Know, https://www.fda.gov/downloads/Food/FoodborneillnessContaminants/Metals/UCM400358.pdf [accessed 12 June 2017].
Fliedner A, Rüdel H, Jürling H, Müller J, Neugebauer F, Schröter-Kermani C. 2012.Levels and trends of industrial chemicals (PCBs, PFCs, PBDEs) in archived her-ring gull eggs from German coastal regions. Environ Sci Eur 24:7,https://doi.org/10.1186/2190-4715-24-7.
Frame GM, Cochran JW, Bøwadt SS. 1996. Complete PCB congener distributionsfor 17 aroclor mixtures determined by 3 HRGC systems optimized for compre-hensive, quantitative, congener-specific analysis. J High Resolut Chromatogr19:657–668, https://doi.org/10.1002/jhrc.1240191202.
Froese R, Pauly D, 2000. FishBase2000: Concepts, Design and Data Sources. LosBanos, Laguna, Phillippines:International Center for Living Aquative ResourcesManagement.
García-Alvarez N, Martín V, Fernández A, Almunia J, Xuriach A, Arbelo M, et al.2014. Levels and profiles of POPs (organochlorine pesticides, PCBs, and PAHs)in free-ranging common bottlenose dolphins of the Canary Islands, Spain. Sci
Environmental Health Perspectives 067014-11
Total Environ 493:22–31, PMID: 24937489, https://doi.org/10.1016/j.scitotenv.2014.05.125.
Gottesman MM, Fojo T, Bates SE. 2002. Multidrug resistance in cancer: role ofATP-dependent transporters. Nat Rev Cancer 2:48–58, https://doi.org/10.1038/nrc706.
Guo Y, Meng XZ, Tang HL, Mai BX, Zeng EY. 2008. Distribution of polybrominateddiphenyl ethers in fish tissues from the Pearl River Delta, China: levels, compo-sitions and potential sources. Environ Toxicol Chem 27:576–582, https://doi.org/10.1897/07-366.
Hale RC, Alaee M, Manchester-Neesvig JB, Stapleton HM, Ikonomou MG. 2003.Polybrominated diphenyl ether flame retardants in the North American envi-ronment. Environ Int 29:771–779, PMID: 12850095, https://doi.org/10.1016/S0160-4120(03)00113-2.
Hites RA, Foran JA, Carpenter DO, Hamilton MC, Knuth BA, Schwager SJ. 2004a.Global assessment of organic contaminants in farmed salmon. Science 303:226–229, https://doi.org/10.1126/science.1091447.
Hites RA, Foran JA, Schwager SJ, Knuth BA, Hamilton MC, Carpenter DO. 2004b.Global assessment of polybrominated diphenyl ethers in farmed and wildsalmon. Environ Sci Technol 38:4945–4949, PMID: 15506184, https://doi.org/10.1021/es049548m.
Giacomini KM, Huang SM, Tweedie DJ, Benet LZ, Brouwer KL, et al. (InternationalTransporter Consortium). 2010. Membrane transporters in drug development. Nat RevDrug Discov 9:215–236, PMID: 20190787, https://doi.org/10.1038/nrd3028.
ISSF (International Seafood Sustainability Foundation). 2017. Status of the WorldFisheries for Tuna. ISSF Technical Report 2016-05B. Washington, DC:ISSF.
Jacquet JL, Pauly D. 2008. Trade secrets: renaming and mislabeling of seafood.Mar Policy 32:309–318, https://doi.org/10.1016/j.marpol.2007.06.007.
Jepson PD, Law RJ. 2016. Persistent pollutants, persistent threats. Science352:1388–1389, https://doi.org/10.1126/science.aaf9075.
Karl H, Lahrssen-Wiederholt M. 2009. Dioxin and dioxin-like PCB levels in cod-liverand -muscle from different fishing grounds of the North- and Baltic Sea andthe North Atlantic. J Verbr Lebensm 4:247–255, https://doi.org/10.1007/s00003-009-0308-5.
Karmaus W, Davis S, Fussman C, Brooks K. 2005. Maternal concentration ofdichlorodiphenyl dichloroethylene (DDE) and initiation and duration of breastfeeding. Paediatr Perinat Epidemiol 19:388–398, https://doi.org/10.1111/j.1365-3016.2005.00658.x.
Kelly BC, Ikonomou MG, Blair JD, Morin AE, Gobas FAPC. 2007. Food web-specificbiomagnification of persistent organic pollutants. Science 317:236–239,https://doi.org/10.1126/science.1138275.
Kikkawa BS, Cushing JW. 2002. Growth of yellowfin tuna (Thunnus albacares) inthe equatorial western Pacific Ocean. In: 15th Meeting of the StandingCommittee on Tuna and Billfish, 22–27 July 2002, Honolulu, Hawai‘i. M�anoa,Hawai‘i:School of Ocean and Earth Science at the University of Hawai‘i.
Knutsen HK, Kvalem HE, Thomsen C, Frøshaug M, Haugen M, Becher G, et al. 2008.Dietary exposure to brominated flame retardants correlates with male blood lev-els in a selected group of Norwegians with a wide range of seafood consump-tion. Mol Nutr Food Res 52:217–227, https://doi.org/10.1002/mnfr.200700096.
Kris-Etherton PM, Harris WS, Appel LJ, (American Heart Association NutritionCommittee). 2002. Fish consumption, fish oil, omega-3 fatty acids, and cardiovas-cular disease. Circulation 106:2747–2757, PMID: 12438303, https://doi.org/10.1161/01.CIR.0000038493.65177.94.
Kurelec B. 1992. The multixenobiotic resistance mechanism in aquatic organisms.Crit Rev Toxicol 22:23–43, PMID: 1352103, https://doi.org/10.3109/10408449209145320.
Kurelec B. 1997. A new type of hazardous chemical: the chemosensitizers of multi-xenobiotic resistance. Environ Health Perspect 105:855–860, https://doi.org/10.1289/ehp.97105s4855.
Kurth D, Brack W, Luckenbach T. 2015. Is chemosensitisation by environmentalpollutants ecotoxicologically relevant? Aquat Toxicol 167:134–142, PMID:26281775, https://doi.org/10.1016/j.aquatox.2015.07.017.
La Guardia MJ, Hale RC, Harvey E. 2007. Evidence of debromination of decabro-modiphenyl ether (BDE-209) in biota from a wastewater receiving stream.Environ Sci Technol 41:6663–6670, PMID: 17969678, https://doi.org/10.1021/es070728g.
Leslie EM, Deeley RG, Cole SPC. 2005. Multidrug resistance proteins: role of P-glyco-protein, MRP1, MRP2, and BCRP (ABCG2) in tissue defense. Toxicol ApplPharmacol 204:216–237, PMID: 15845415, https://doi.org/10.1016/j.taap.2004.10.012.
Lohmann R, Belkin IM. 2014. Organic pollutants and ocean fronts across theAtlantic Ocean: a review. Prog Oceanogr 128:172–184, https://doi.org/10.1016/j.pocean.2014.08.013.
Lohmann R, Breivik K, Dachs J, Muir D. 2007. Global fate of POPs: current andfuture research directions. Environ Pollut 150:150–165, PMID: 17698265,https://doi.org/10.1016/j.envpol.2007.06.051.
Lohmann R, Jurado E, Pilson MEQ, Dachs J. 2006. Oceanic deep water formationas a sink of persistent organic pollutants. Geophys Res Lett 33:L12607,https://doi.org/10.1029/2006GL025953.
Loke M, Geslani C, Takenaka B, Leung P. 2012. An overview of seafood consump-tion and supply sources: Hawai‘i versus U.S. Coll Trop Agric Hum Resour UnivHawai‘i at M�anoa. Econ Issues EI-22:1–9.
Longnecker MP, Klebanoff MA, Zhou H, Brock JW. 2001. Association betweenmaternal serum concentration of the DDT metabolite DDE and preterm andsmall-for-gestational-age babies at birth. Lancet 358:110–114, PMID: 11463412,https://doi.org/10.1016/S0140-6736(01)05329-6.
Luckenbach T, Epel D. 2005. Nitromusk and polycyclic musk compounds as long-term inhibitors of cellular xenobiotic defense systems mediated by multidrugtransporters. Environ Health Perspect 113:17–24, PMID: 15626642, https://doi.org/10.1289/ehp.7301.
Luzardo OP, Ruiz-Suárez N, Henríquez-Hernández LA, Valerón PF, Camacho M,Zumbado M, et al. 2014. Assessment of the exposure to organochlorine pesti-cides, PCBs and PAHs in six species of predatory birds of the Canary Islands,Spain. Sci Total Environ 472:146–153, PMID: 24291140, https://doi.org/10.1016/j.scitotenv.2013.11.021.
Minnesota Department of Health. 2016. How Much is a Serving of Fish? http://www.health.state.mn.us/divs/eh/fish/eating/serving.html [accessed 9 July 2016].
Morgan EJ, Lohmann R. 2010. Dietary uptake from historically contaminated sedi-ments as a source of PCBs to migratory fish and invertebrates in an urban estu-ary. Environ Sci Technol 44:5444–5449, https://doi.org/10.1021/es100450f.
Nicklisch SCT, Rees SD, McGrath AP, Gökirmak T, Bonito LT, Vermeer LM, et al. 2016.Global marine pollutants inhibit P-glycoprotein: environmental levels, inhibitoryeffects, and cocrystal structure. Sci Adv 15:e1600001, https://doi.org/10.1126/sciadv.1600001.
NOAA (National Oceanic and Atmospheric Administration). 2014. Imports andExports of Fishery Products, Annual Summary. Washington, DC:NOAA.
Parnell PE, Groce AK, Stebbins TD, Dayton PK. 2008. Discriminating sources ofPCB contamination in fish on the coastal shelf off San Diego, California (USA).Mar Pollut Bull 56:1992–2002, PMID: 18848709, https://doi.org/10.1016/j.marpolbul.2008.08.023.
Persson EC, Graubard BI, Evans AA, London WT, Weber JP, LeBlanc A, et al. 2012.Dichlorodiphenyltrichloroethane and risk of hepatocellular carcinoma. Int JCancer 131:2078–2084, PMID: 22290210, https://doi.org/10.1002/ijc.27459.
Rogan WJ, Chen A. 2005. Health risks and benefits of bis(4-chlorophenyl)-1,1,1-trichloroethane (DDT). Lancet 366:763–773, PMID: 16125595, https://doi.org/10.1016/S0140-6736(05)67182-6.
Sagratini G, Buccioni M, Ciccarelli C, Conti P, Cristalli G, Giardinà D, et al. 2008.Levels of polychlorinated biphenyls in fish and shellfish from the Adriatic Sea.Food Addit Contam Part B Surveill 1:69–77, PMID: 24784539, https://doi.org/10.1080/19393210802236919.
Santschi PH, Presley BJ, Wade TL, Garcia-Romero B, Baskaran M. 2001. Historicalcontamination of PAHs, PCBs, DDTs, and heavy metals in Mississippi RiverDelta, Galveston Bay and Tampa Bay sediment cores. Mar Environ Res 52:51–79, PMID: 11488356, https://doi.org/10.1016/S0141-1136(00)00260-9.
Schecter A, Birnbaum L, Ryan JJ, Constable JD. 2006a. Dioxins: an overview. EnvironRes 101:419–428, PMID: 16445906, https://doi.org/10.1016/j.envres.2005.12.003.
Schecter A, Colacino J, Haffner D, Patel K, Opel M, Päpke O, et al. 2010a.Perfluorinated compounds, polychlorinated biphenyls, and organochlorine pes-ticide contamination in composite food samples from Dallas, Texas, USA.Environ Health Perspect 118:796–802, https://doi.org/10.1289/ehp.0901347.
Schecter A, Colacino J, Patel K, Kannan K, Yun SH, Haffner D, et al. 2010b.Polybrominated diphenyl ether levels in foodstuffs collected from three locationsfrom the United States. Toxicol Appl Pharmacol 243:217–224, https://doi.org/10.1016/j.taap.2009.10.004.
Schecter A, Haffner D, Colacino J, Patel K, Päpke O, Opel M, et al. 2010c.Polybrominated diphenyl ethers (PBDEs) and hexabromocyclodecane (HBCD)in composite U.S. food samples. Environ Health Perspect 118:357–362,https://doi.org/10.1289/ehp.0901345.
Schecter A, Päpke O, Harris TR, Tung KC, Musumba A, Olson J, et al. 2006b.Polybrominated diphenyl ether (PBDE) levels in an expanded market basketsurvey of U.S. food and estimated PBDE dietary intake by age and sex. EnvironHealth Perspect 114:1515–1520, https://doi.org/10.1289/ehp.9121.
Shen H, Yu C, Ying Y, Zhao Y, Wu Y, Han J, et al. 2009. Levels and congener profilesof PCDD/Fs, PCBs and PBDEs in seafood from China. Chemosphere 77:1206–1211, PMID: 19800652, https://doi.org/10.1016/j.chemosphere.2009.09.015.
Smital T, Kurelec B. 1997. Inhibitors of the multixenobiotic resistance mechanism innatural waters: in vivo demonstration of their effects. Environ Toxicol Chem16:2164–2170, https://doi.org/10.1897/1551-5028(1997)016<2164:IOTMRM>2.3.CO;2.
Smital T, Luckenbach T, Sauerborn R, Hamdoun AM, Vega RL, Epel D. 2004.Emerging contaminants—pesticides, PPCPs, microbial degradation productsand natural substances as inhibitors of multixenobiotic defense in aquaticorganisms. Mutat Res 552:101–117, https://doi.org/10.1016/j.mrfmmm.2004.06.006.
Smith AG, Gangolli SD. 2002. Organochlorine chemicals in seafood: occurrenceand health concerns. Food Chem Toxicol 40:767–779, PMID: 11983271,https://doi.org/10.1016/S0278-6915(02)00046-7.
Environmental Health Perspectives 067014-12
Sreeramulu K, Liu R, Sharom FJ. 2007. Interaction of insecticides with mamma-lian P-glycoprotein and their effect on its transport function. BiochimBiophys Acta 1768:1750–1757, PMID: 17490606, https://doi.org/10.1016/j.bbamem.2007.04.001.
Storelli MM, Barone G, Giacominelli-Stuffler R, Marcotrigiano GO. 2012.Contamination by polychlorinated biphenyls (PCBs) in striped dolphins(Stenella coeruleoalba) from the Southeastern Mediterranean Sea. EnvironMonit Assess 184:5797–5805, PMID: 21960363, https://doi.org/10.1007/s10661-011-2382-2.
Storelli MM, Casalino E, Barone G, Marcotrigiano GO. 2008. Persistent organicpollutants (PCBs and DDTs) in small size specimens of bluefin tuna(Thunnus thynnus) from the Mediterranean Sea (Ionian Sea). Environ Int34:509–513, PMID: 18164060, https://doi.org/10.1016/j.envint.2007.11.006.
Storelli MM, Giacominelli-Stuffler R, Storelli A, Marcotrigiano GO. 2003. Polychlorinatedbiphenyls in seafood: contamination levels and human dietary exposure. FoodChem 82:491–496, https://doi.org/10.1016/S0308-8146(03)00119-5.
Sturm A, Segner H. 2005. P-glycoproteins and xenobiotic efflux transport in fish. In:Biochemistry and Molecular Biology of Fishes, Vol. 3. Mommsen TP, MoonTW, eds. Amsterdam, the Netherlands:Elsevier B.V., 495–533.
Ueno D, Iwata H, Tanabe S, Ikeda K, Koyama J, Yamada H. 2002. Specific accumu-lation of persistent organochlorines in bluefin tuna collected from Japanesecoastal waters. Mar Pollut Bull 45:254–261, PMID: 12398393, https://doi.org/10.1016/S0025-326X(02)00109-1.
Ueno D, Kajiwara N, Tanaka H, Subramanian A, Fillmann G, Lam PK, et al. 2004.Global pollution monitoring of polybrominated diphenyl ethers using skipjacktuna as a bioindicator. Environ Sci Technol 38:2312–2316, https://doi.org/10.1021/es035323k.
Ueno D, Takahashi S, Tanaka H, Subramanian AN, Fillmann G, Nakata H, et al.2003. Global pollution monitoring of PCBs and organochlorine pesticides usingskipjack tuna as a bioindicator. Arch Environ Contam Toxicol 45:378–389,https://doi.org/10.1007/s00244-002-0131-9.
Ueno D, Watanabe M, Subramanian A, Tanaka H, Fillmann G, Lam PK, et al. 2005.Global pollution monitoring of polychlorinated dibenzo-p-dioxins (PCDDs), fur-ans (PCDFs) and coplanar polychlorinated biphenyls (coplanar PCBs) using
skipjack tuna as bioindicator. Environ Pollut 136:303–313, https://doi.org/10.1016/j.envpol.2004.12.036.
UNEP (United Nations Environment Programme). 2001. Final Act of the Conferenceof Plenipotentiaries on the Stockholm Convention on Persistent OrganicPollutants. Stockholm, Sweden:UNEP.
U.S. EPA (U.S. Environmental Protection Agency). 2000. Guidance forAssessing Chemical Contaminant Data for Use in fish Advisories, Vol. 2:Risk Assessment and Fish Consumption Limits. 3rd Edition. Washington,DC:U.S. EPA.
van der Oost R, Opperhuizen A, Satumalay K, Heida H, Vermeulen NPE. 1996.Biomonitoring aquatic pollution with feral eel (Anguilla anguilla) I.Bioaccumulation: biota-sediment ratios of PCBs, OCPs, PCDDs and PCDFs.Aquat Toxicol 35:21–46, https://doi.org/10.1016/0166-445X(96)00002-1.
Verweij F, Booij K, SatumalayK, van derMolenN, van derOost R. 2004. Assessment ofbioavailable PAH, PCB and OCP concentrations in water, using semipermeablemembrane devices (SPMDs), sediments and caged carp. Chemosphere 54:1675–1689, PMID: 14675846, https://doi.org/10.1016/j.chemosphere.2003.10.002.
Wandiga SO. 2001. Use and distribution of organochlorine pesticides. The future inAfrica. Pure Appl Chem 73:1147–1155, https://doi.org/10.1351/pac200173071147.
Warner K, Timme W, Lowell B, Hirshfield M. 2013. Oceana Study Reveals SeafoodFraud Nationwide. Washington, DC:Oceana.
Weijs L, Das K, Neels H, Blust R, Covaci A. 2010. Occurrence of anthropogenic andnaturally-produced organohalogenated compounds in tissues of Black Seaharbour porpoises. Mar Pollut Bull 60:725–731, PMID: 20031175, https://doi.org/10.1016/j.marpolbul.2009.11.022.
Welsh SE, InoueM. 2000. Loop Current rings and the deep circulation in the Gulf of Mex-ico.JGeophysResOceans105:16951–16959, https://doi.org/10.1029/2000JC900054.
Young FVK. 1986. The Chemical & Physical Properties of Crude Fish Oils forRefiners & Hydrogenators. Fish Oil Bull 18(1):19.
Zhang S, Zhang Q, Darisaw S, Ehie O, Wang G. 2007. Simultaneous quantificationof polycyclic aromatic hydrocarbons (PAHs), polychlorinated biphenyls (PCBs),and pharmaceuticals and personal care products (PPCPs) in Mississippi riverwater, in New Orleans, Louisiana, USA. Chemosphere 66:1057–1069, PMID:16884762, https://doi.org/10.1016/j.chemosphere.2006.06.067.
Environmental Health Perspectives 067014-13