Research into the Financing of Technical and Vocational ... · Research into the Financing of...
234
Research into the Financing of Technical and Vocational Education and Training (TVET) in the Pacific Managed by the Australian Council for Educational Research and Scope Global on behalf of the Australian Government Leo Maglen Mark Weston Wall Manaini Rokovunisei March 2014 Country Report Fiji
Transcript of Research into the Financing of Technical and Vocational ... · Research into the Financing of...

Research into the Financing of Technical and Vocational Education and Training (TVET) in the Pacific
Managed by the Australian Council for Educational Research and Scope Global on behalf of the Australian Government
Leo MaglenMark Weston WallManaini Rokovunisei
March 2014
Country ReportFiji

Research into the Financing of Technical and Vocational Education and Training (TVET) in the Pacific
Fiji Country Report Leo Maglen Mark Weston Wall Manaini Rokovunisei March 2014

First published 2015 by Australian Council for Educational Research Ltd 19 Prospect Hill Road, Camberwell, Victoria, 3124, Australia www.acer.edu.au Paperback ISBN [978-1-74286-280-4] EPUB ISBN [978-1-74286-281-1]
© Commonwealth of Australia 2015
With the exception of the Commonwealth Coat of Arms and where otherwise noted all material presented in this document is provided under a Creative Commons Attribution 3.0 Australia (http://creativecommons.org/licenses/by/3.0/au/) licence. The details of the relevant licence conditions are available on the Creative Commons website (accessible using the links provided) as is the full legal code for the CC BY 3.0 AU licence (http://creativecommons.org/licenses/by/3.0/au/legalcode).
This material must be attributed as Research into the Financing of Technical and Vocational Education and Training (TVET) in the Pacific: Fiji Country Report authored by Leo Maglen, Mark Weston Wall and Manaini Rokovunisei (Australian Council for Educational Research) under contract with the Commonwealth of Australia as represented by the Department of Foreign Affairs and Trade who is the copyright owner of the material.
The terms of use for the Commonwealth Coat of Arms are available from the It's an Honour website (http://www.itsanhonour.gov.au/).
Where a copyright owner, other than the Commonwealth, is identified with respect to this material, please contact that third party copyright owner directly to seek permission. The Department of Foreign Affairs and Trade (DFAT) does not guarantee, and accepts no legal liability arising from or connected to, the accuracy, reliability, currency or completeness of any material contained in this publication. DFAT recommends that readers exercise their own skill and care with respect to their use of this publication. This publication and any views or recommendations of third parties that may be included do not necessarily reflect the views of the Australian Government or DFAT or indicate its commitment to a particular course of action.
National Library of Australia Cataloguing-in-Publication entry
Creator: Maglen, Leo, author.
Title: Research into the financing of technical and vocational
education and training (TVET) in the Pacific.
Fiji country report / Leo Maglen, Mark Weston Wall,
Manaini Rokovunisei.
ISBN: 9781742862804 (paperback)
9781742862811 (e-pub)
Subjects: Technical education--Economic aspects--Fiji.
Technical education--Fiji--Finance.
Vocational education--Economic aspects--Fiji.
Vocational education--Fiji--Finance.
Other Creators/Contributors:
Wall, Mark Weston, author.
Rokovunisei, Manaini, author.
Dewey Number:
370.113099611

Research into the Financing of TVET in the Pacific Fiji Country Report
iii
TABLE OF CONTENTS
LIST OF TABLES ................................................................................................. vi
LIST OF FIGURES ................................................................................................ ix
LIST OF ACRONYMS ........................................................................................... xi
PREFACE ........................................................................................................... xiv
ACKNOWLEDGEMENTS ................................................................................... xvi
EXECUTIVE SUMMARY.................................................................................... xvii
PART I: INTRODUCTION ...................................................................................... 1
CHAPTER 1. BACKGROUND AND PURPOSES OF THE STUDY .................. 1
1.1 INTRODUCTION ............................................................................... 1 1.2 RESEARCH OBJECTIVES ................................................................ 2 1.3 STRUCTURE OF THE REPORT ....................................................... 4
CHAPTER 2. RESEARCH APPROACH ........................................................... 5
2.1 DEFINING TVET IN FIJI .................................................................... 5 2.2 DATA REQUIREMENTS ................................................................... 8 2.3 AVAILABLE INFORMATION SOURCES ........................................... 9 2.4 HOW USEFUL ARE THESE INFORMATION SOURCES TO THE
STUDY? .......................................................................................... 11 2.5 APPROACH TO FILLING INFORMATION GAPS ............................ 14 2.6 INDICATIVE QUALITY OF THE INFORMATION COLLECTED ....... 15
PART II: COUNTRY BACKGROUND .................................................................. 19
CHAPTER 3. GOVERNMENT, CULTURE, RELIGION AND GEOGRAPHY ... 19
3.1 GOVERNMENT AND ADMINISTRATION ....................................... 19 3.2 RELIGION AND CULTURE ............................................................. 19 3.3 GEOGRAPHY.................................................................................. 20
CHAPTER 4. DEMOGRAPHY ........................................................................ 21
CHAPTER 5. LANGUAGE LITERACY AND EDUCATION.............................. 23
5.1 LANGUAGE AND LITERACY .......................................................... 23 5.2 EDUCATION SYSTEM .................................................................... 23
CHAPTER 6. ECONOMY AND LABOUR FORCE .......................................... 31
6.1 STAGE OF ECONOMIC DEVELOPMENT ...................................... 31 6.2 KEY INDUSTRIES ........................................................................... 32 6.3 LABOUR FORCE PARTICIPATION AND PROFILE ........................ 35 6.4 MAJOR IMPEDIMENTS TO ECONOMIC GROWTH ....................... 37
CHAPTER 7. THE PUBLIC SECTOR AND PUBLIC FINANCES .................... 39
7.1 THE BUDGET.................................................................................. 39 7.2 THE CLASSIFICATION OF PUBLIC EXPENDITURE ...................... 42 7.3 PUBLIC EXPENDITURE PATTERNS .............................................. 45 7.4 DEVELOPMENT ASSISTANCE ...................................................... 48
PART III: TVET IN CONTEXT .............................................................................. 55
CHAPTER 8. THE TVET SECTOR IN FIJI ..................................................... 55
8.1 COMPOSITION OF THE SECTOR .................................................. 55 8.2 STATISTICAL PROFILE OF TVET .................................................. 67
CHAPTER 9. TVET AND EDUCATIONAL OPPORTUNITIES ........................ 86
9.1 EDUCATIONAL AND OTHER PATHWAYS INTO AND BEYOND TVET ............................................................................................... 86
9.2 ACCESS TO TVET FOR THE DISADVANTAGED .......................... 87
Research into the Financing of TVET in the Pacific Fiji Country Report
iv
9.3 SCHOLARSHIPS ............................................................................. 88
CHAPTER 10. TVET AND ECONOMIC GROWTH AND DEVELOPMENT ..... 90
10.1 THE ROLE OF TVET IN ECONOMIC GROWTH AND DEVELOPMENT .............................................................................. 90
10.2 TVET AND MIDDLE LEVEL OCCUPATIONAL SKILLS ................... 92
CHAPTER 11. QUALITY IN TVET .................................................................. 94
11.1 THE FIJI QUALIFICATIONS COUNCIL ........................................... 94 11.2 TVET TEACHERS AND TEACHER TRAINING ............................... 98 11.3 TVET WORKING ENVIRONMENT .................................................. 99 11.4 QUALITY ASSURANCE ................................................................ 100
PART IV: THE FINANCING OF TVET ............................................................... 103
CHAPTER 12. OVERVIEW OF TVET FINANCING ...................................... 103
12.1 FUNDING OF TVET PROVISION ................................................... 103 12.2 EXPENDITURE ON TVET PROVISION ......................................... 106 12.3 ESTIMATING THE SHARE OF GDP SPENT ON TVET ................. 109
CHAPTER 13. TVET FINANCIAL MECHANISMS ........................................ 111
13.1 OVERVIEW OF HOW FUNDS ARE CHANNELLED INTO TVET .. 111 13.2 MINISTRY OF FINANCE BUDGET PROCESSES ........................ 114 13.3 LINE MINISTRY TRAINING PROVIDERS ..................................... 117 13.4 FNU FINANCIAL MECHANISMS ................................................... 118 13.5 PRIVATE TVET PROVIDERS ....................................................... 122 13.6 DEVELOPMENT PARTNER FUNDING MECHANISMS ................ 122 13.7 FUNDING MECHANISMS FOR THE RCCCE AND CETC ............ 125 13.8 AUSTRALIA-PACIFIC TECHNICAL COLLEGE ............................. 125 13.9 NATIONAL AND DONOR-FUNDED SCHOLARSHIPS .................. 126 13.10 FUTURE ROLE OF FHEC ............................................................. 126
CHAPTER 14. TVET FINANCIAL PATTERNS AND TRENDS ..................... 128
14.1 MINISTRY OF FINANCE BUDGETARY ALLOCATIONS TO TVET128 14.2 FIJI NATIONAL UNIVERSITY ........................................................ 134 14.3 MINISTRY OF EDUCATION VOCATIONAL SCHOOLS ................ 138 14.4 OTHER GOVERNMENT TRAINING PROGRAMS ........................ 144 14.5 PRIVATE TVET PROVIDERS ....................................................... 145 14.6 AUSTRALIA-PACIFIC TECHNICAL COLLEGE ............................. 148 14.7 OTHER REGIONAL TVET PROVIDERS ....................................... 151
CHAPTER 15. EMPLOYER PROVIDED AND FUNDED TRAINING ............. 152
15.1 EXISTING SOURCES OF INFORMATION .................................... 152 15.2 PILOT SURVEY OF EMPLOYER FUNDED TRAINING ................. 153
CHAPTER 16. TRAINING COSTS AND EFFICIENCIES .............................. 156
16.1 UNIT COSTS OF TVET DELIVERY ................................................ 156 16.2 WHO BEARS THESE COSTS AND WHO BENEFITS? .................. 163
PART V: ISSUES AND POLICY CONSIDERATIONS ....................................... 165
CHAPTER 17. ISSUES AND POLICY CONSIDERATIONS .......................... 165
17.1 A SECTOR IN A STATE OF FLUX ................................................ 165 17.2 THE CRUCIAL ROLE OF FHEC .................................................... 166 17.3 THE IMPORTANCE OF INFORMATION ....................................... 166 17.4 RESOURCING THE SECTOR ....................................................... 167
REFERENCES ............................................................................................. 170 ANNEX 1. RESEARCH SCOPE AND OBJECTIVES .................................... 175 ANNEX 2. TEMPLATES FOR LINE MINISTRY TVET PROVIDERS ............ 177 ANNEX 3. TEMPLATES FOR FIJI NATIONAL UNIVERSITY ....................... 181

Research into the Financing of TVET in the Pacific Fiji Country Report
v
ANNEX 4. PRIVATE PROVIDER SURVEY INSTRUMENT .......................... 198 ANNEX 5. ENTERPRISE TRAINING EXPENDITURE SURVEY .................. 201 ANNEX 6. CLASSIFICATION AND CODING SYSTEMS USED IN DATA
COLLECTION AND RECORDING ............................................ 206 ANNEX 7. PERSONS CONSULTED DURING THE FIJI FIELDWORK......... 210 ANNEX 8. MEMBERSHIP OF THE NATIONAL REFERENCE GROUP ....... 212

Research into the Financing of TVET in the Pacific Fiji Country Report
vi
LIST OF TABLES
Table 1.1 Countries participating in the research ............................................... 1 Table 2.1 Summary of available documentary source material on TVET ......... 14 Table 2.2 Indicative quality of non-financial information on TVET sector
programs for the study’s purposes, from all study sources ............... 16 Table 2.3 Indicative quality of TVET sector financial data, from all study
sources ............................................................................................ 17 Table 4.1 Census population of Fiji by ethnicity, 1881 to 2007 ........................ 21 Table 4.2 Urbanisation of the Fijian population, 1996 and 2007....................... 22 Table 5.1 Adult literacy rates in Fiji, by gender, 1996 and 2007 ....................... 23 Table 5.2 Percentages of age groups attending school, 2004-5 to 2010-11 .... 25 Table 5.3 Pupil-teacher ratios in primary and secondary schools, 1998 and
2011 ................................................................................................ 26 Table 5.4 Student enrolments, Grade 1 to Form 7, by gender, 2012 ............... 27 Table 5.5 Line Ministry training provision ......................................................... 30 Table 6.1 Fiji economic indicators, 2008 to 2012 ............................................. 31 Table 6.2 Development indicators, Fiji ............................................................. 32 Table 6.3 Estimated numbers of wage and salary earners, by industry, 1996
and 2007 .......................................................................................... 33 Table 6.4 Composition of GDP by sector, Fiji 2011 (%) ................................... 34 Table 6.5 Labour force (aged 15 and over), 2004-05 and 2010-11 .................. 36 Table 6.6 Unemployment – total, rural/urban and male/female, 2007 .............. 36 Table 6.7 Numbers working for money and subsistence, 2004-5 and 2010-
11 .................................................................................................... 36 Table 6.8 Employment by occupational group, 2004-05 and 2010-11 ............. 37 Table 6.9 Numbers not economically active (aged 15 & over), 2004-05 and
2010-11 ........................................................................................... 37 Table 7.1 Government of Fiji budgets for 2012 and 2013 ................................ 39 Table 7.2 Budget parameters as a percentage of GDP, 2010 to 2015 ............. 40 Table 7.3 Budget estimates and targets, 2010 to 2015 .................................... 42 Table 7.4 Standard expenditure groups ........................................................... 43 Table 7.5 Aggregations of expenditure applied in MoF budget estimates ........ 44 Table 7.6 Government budgetary expenditure, actual 2011 to target 2015
(FJ$ ‘000s) ....................................................................................... 45 Table 7.7 Government budgetary expenditure, actual 2011 to target 2015 (%
of total) ............................................................................................ 46 Table 7.8 Consolidated expenditure estimates for 2013, by sector .................. 47 Table 7.9 ODA to Fiji, 2011 to 2013 ................................................................. 49 Table 7.10 Direct payment programs, 2013 ....................................................... 49 Table 7.11 Grant aid-in-kind and direct payments by agency, 2013 ................... 50 Table 7.12 Grant aid-in-kind by donor and direct payments by lender, 2013 ..... 51 Table 7.13 Australia’s grant aid-in-kind, 2013 .................................................... 53 Table 8.1 FNU TVET courses .......................................................................... 58 Table 8.2 Trade Certificate areas and course duration .................................... 61 Table 8.3 Technician Certificate areas and course duration ............................ 62 Table 8.4 Private TVET providers, by type and status with FHEC, October
2013 ................................................................................................ 66 Table 8.5 Estimates of total numbers enrolled in TVET programs in Fiji in
2012 ................................................................................................ 67 Table 8.6 Estimates of total numbers graduating from TVET programs in Fiji
in 2012 ............................................................................................. 68 Table 8.7 Ministry of Education vocational school course enrolments and
graduations, by field of training, 2012 .............................................. 69

Research into the Financing of TVET in the Pacific Fiji Country Report
vii
Table 8.8 MoYS Youth Training Centres enrolments and graduations, Level 1 training programs, by gender, 2012 .............................................. 75
Table 8.9 MoFF training centres, enrolments and graduations, by gender, 2012 ................................................................................................ 75
Table 8.10 MoA Level 1 training programs, enrolments by gender, 2012 .......... 76 Table 8.11 CATD Level 1 training programs, enrolments and graduations, by
gender, 2012 ................................................................................... 76 Table 8.12 Number of programs provided by FNU in TVET and higher
education, 2012 ............................................................................... 76 Table 8.13 FNU enrolments, all programs, 2010 to 2012 ................................... 77 Table 8.14 FNU graduations, by program, 2010 to 2012 ................................... 77 Table 8.15 Selected private provider enrolments and graduations by
institution, by gender, 2012 .............................................................. 78 Table 8.16 Selected private provider enrolments and graduations by field of
study, by gender, 2012 .................................................................... 78 Table 8.17 APTC enrolments on the Fiji campuses, by school and course,
Stage 1 and Stage 2 to 2012 ........................................................... 80 Table 8.18 Composition of enrolments on APTC’s Fiji campuses, by school
and course, Stage 1 and Stage 2 to 2012 (%) ................................. 81 Table 8.19 Graduations from APTC’s Fiji campuses, by school and course,
Stage 1 and Stage 2 to 2012 .......................................................... 82 Table 8.20 Composition of the graduates from APTC’s Fiji campuses, by
school and course, Stage 1 and Stage 2 to 2012 (%) ...................... 83 Table 9.1 Examples of admission criteria for TVET in Fiji ................................ 87 Table 10.1 Middle level occupational employment, 2004-05 and 2010-11 ......... 92 Table 11.1 Institutions registered with the FHEC, October 2013 ........................ 95 Table 12.1 Indicative funding of TVET provision in Fiji, 2012-13 (FJ$ ‘000s) ... 104 Table 12.2 Summary of expenditure on TVET provision, 2012-13 ................... 107 Table 13.1 Location of TVET programs and activities in MOF budget papers .. 117 Table 13.2 Method A assessment criteria ........................................................ 120 Table 14.1 Expenditure allocations to TVET from government and ODA
sources, 2013 (FJ$ ‘00s) ............................................................... 129 Table 14.2 FNU sources of operating revenue, 2010 to 2012 (FJ$) ................. 135 Table 14.3 FNU recurrent expenditure by function, 2010 to 2012 (FJ$) ........... 136 Table 14.4 Revenue sources of MoE vocational schools, 2012 (FJ$) .............. 138 Table 14.5 Expenditure on MoE vocational schools, 2012 (FJ$) ..................... 140 Table 14.6 MoYS Youth Training Centre revenue sources, 2012 (FJ$) ........... 144 Table 14.7 MoYS Youth Training Centre expenditure, 2012 (FJ$) ................... 144 Table 14.8 MoiTA training program expenditure, 2012 (FJ$) ........................... 145 Table 14.9 DoFF training program expenditure, 2012 (FJ$) ............................ 145 Table 14.10 DoA training program expenditure, 2012, 2012 (FJ$)..................... 145 Table 14.11 APTC training program expenditure by location and function,
2011-2012 (FJ$) ............................................................................ 149 Table 14.12 RCCCE revenue and expenditure, 2012 (FJ$) ............................... 151 Table 15.1 Employer training survey, respondent characteristics .................... 154 Table 15.2 Training programs conducted by survey respondents .................... 155 Table 15.3 Training expenditures and cost recovery by survey respondents
(FJ$) .............................................................................................. 155 Table 16.1 Unit cost calculations by type of TVET provider ............................. 157 Table 16.2 Estimated unit costs of TVET delivery, by selected providers, 2012
(FJ$) .............................................................................................. 158 Table 16.3 Variations in the unit costs of delivery in MoE vocational schools,
2012 (FJ$) ..................................................................................... 159 Table 16.4 FNU estimated costs per student and graduate, all programs –
2010 to 2012 (FJ$) ........................................................................ 161

Research into the Financing of TVET in the Pacific Fiji Country Report
viii
Table 16.5 APTC direct operating cost per unit, by course, 2011-12 (FJ$) ...... 161 Table 16.6 APTC total recurrent cost per unit, by course, 2011-12 (FJ$) ......... 162

Research into the Financing of TVET in the Pacific Fiji Country Report
ix
LIST OF FIGURES
Figure 2.1 Scope of the study: the skills/employment/training matrix for Fiji ..... 6 Figure 3.1 Map of the Fiji Islands .................................................................... 20 Figure 5.1 Fiji education and training system .................................................. 24 Figure 7.1 Budget revenue and expenditure, 2010 to projected 2015 ............. 41 Figure 7.2 Budget revenue and expenditure 2010 to projected 2015 as a %
of GDP .......................................................................................... 41 Figure 7.3 Consolidated expenditure estimates as a percent of total, 2013 .... 48 Figure 7.4 Grant aid-in-kind, by donor and recipient agency, 2013 ................. 52 Figure 8.1 Number of courses offered by MoE vocational schools, by field
of training, 2012 (%) ...................................................................... 69 Figure 8.2 Distribution of MoE vocational school courses by size of
enrolments, 2012 ........................................................................... 70 Figure 8.3 Distribution of MoE vocational school courses by the number of
graduates, 2012 ............................................................................ 70 Figure 8.4 Distribution of MoE vocational schools by number of courses
offered, 2012 ................................................................................. 71 Figure 8.5 Distribution of MoE vocational school enrolments by the number
of courses offered, 2012 ................................................................ 71 Figure 8.6 MoE vocational school enrolments by fields of training, 2012 (%) .. 72 Figure 8.7 MoE vocational school graduations by fields of training, 2012 (%) . 72 Figure 8.8 Distribution of MoE vocational schools by enrolments and
graduations, 2012 .......................................................................... 73 Figure 8.9 Distribution of MoE vocational school enrolments by gender,
2012 .............................................................................................. 73 Figure 8.10 Distribution of MoE vocational school graduations by gender,
2012 .............................................................................................. 74 Figure 8.11 Composition of FNU enrolments, 2010 to 2012 ............................. 77 Figure 8.12 Selected private provider enrolments by field of study, by
gender, 2012 ................................................................................. 79 Figure 8.13 Enrolments on APTC’s Fiji campuses, by course and gender,
2007 to 2012 ................................................................................. 84 Figure 8.14 Graduations from APTC’s Fiji campuses, by course and gender,
2007 to 2012 ................................................................................. 84 Figure 8.15 Enrolments on APTCs Fiji campuses, by course and nationality,
2007 to 2012 ................................................................................. 85 Figure 8.16 Graduates from APTC’s Fiji campuses, by course and
nationality, 2007 to 2012 ................................................................ 85 Figure 11.1 Fiji Qualifications Framework ......................................................... 96 Figure 11.2 FHEC quality assurance and continuous improvement process .. 101 Figure 12.1 Funding of TVET, by institution, 2012-13 ..................................... 105 Figure 12.2 Funding of TVET, by source, 2012-13 ......................................... 105 Figure 12.3 Funding of TVET, by institution and source, 2012-13 .................. 106 Figure 12.4 Expenditure on TVET, by type of provider, 2012-13 (%) .............. 107 Figure 12.5 Expenditure on TVET, by input category, 2012-13 (%) ................ 108 Figure 12.6 Recurrent expenditure on TVET, by institution and input
category, 2012-13 (%) ................................................................. 109 Figure 13.1 Flow of funds into and within the TVET sector in Fiji .................... 113 Figure 13.2 Planning and budget formulation machinery of the Government
of Fiji ............................................................................................ 114 Figure 13.3 Government of Fiji annual budget cycle ....................................... 115 Figure 13.4 Financial delegation and reporting within FNU ............................. 118 Figure 13.5 ODA budget planning process ..................................................... 124
Research into the Financing of TVET in the Pacific Fiji Country Report
x
Figure 13.6 ODA disbursement and monitoring processes ............................. 124 Figure 14.1 Combined budget and grant aid-in-kind allocations to TVET by
function, 2013 .............................................................................. 130 Figure 14.2 Budget allocations to TVET, by ministry and agency, 2013 ......... 131 Figure 14.3 Combined budget and grant aid-in-kind allocations to TVET by
ministry and agency, 2013 ........................................................... 131 Figure 14.4 Composition of public expenditure allocations to TVET, by
function, 2013 .............................................................................. 132 Figure 14.5 Estimated MoF expenditure on TVET as a percentage of total
budget expenditure, 2013 ............................................................ 133 Figure 14.6 Estimated expenditure on TVET programs, as a percentage of
total grant aid-in-kind, 2013 ......................................................... 133 Figure 14.7 Estimated expenditure on TVET as a percentage of combined
budget and grant aid-in-kind, 2013 .............................................. 134 Figure 14.8 FNU sources of operating revenue, 2010 to 2012........................ 135 Figure 14.9 Composition of FNU operating revenue, 2010 to 2012 ................ 136 Figure 14.10 FNU expenditure by function, 2010 to 2012 ................................. 137 Figure 14.11 Composition of FNU expenditure, 2010 to 2012 .......................... 137 Figure 14.12 Revenue sources of MoE vocational schools, 2012 ..................... 139 Figure 14.13 Revenue sources of MoE vocational schools, by school, 2012 .... 139 Figure 14.14 Expenditure on MoE vocational schools, 2012 ............................ 141 Figure 14.15 MoE recurrent expenditure on vocational schools, by school,
2012 ............................................................................................ 142 Figure 14.16 The relationship between recurrent expenditures per vocational
school and the number of students enrolled, 2012 ....................... 142 Figure 14.17 The relationship between recurrent expenditures per vocational
school and the number of vocational programs offered, 2012 ...... 143 Figure 14.18 The relationship between recurrent expenditures per vocational
school and type of program, in single program schools, 2012 ..... 143 Figure 14.19 Private provider funding, by source, 2012 (FJ$) .......................... 146 Figure 14.20 Composition of private provider funding, 2012 (%) ...................... 147 Figure 14.21 Private provider recurrent expenditure, 2012 (FJ$) ...................... 147 Figure 14.22 Composition of private provider recurrent expenditure, 2012 (%) 148 Figure 14.23 APTC Fiji program delivery expenditure, by course, 2011-2012
(FJ$) ............................................................................................ 149 Figure 14.24 Estimated expenditure on APTC’s Fiji operations by function,
2011-2012 (%) ............................................................................. 150 Figure 14.25 Estimated expenditure on APTC’s Fiji operations by input
category, 2011-2012 (%) ............................................................. 150 Figure 16.1 Unit costs of delivery in MoE vocational schools, 2012 (FJ$) ....... 160

Research into the Financing of TVET in the Pacific Fiji Country Report
xi
LIST OF ACRONYMS
ACER Australian Council for Educational Research ACP African, Caribbean and Pacific ADB Asia Development Bank AFL Airports Fiji Ltd APCD Asia-Pacific Centre on Disability APTC Australia-Pacific Technical College AQF Australian Qualifications Framework AQTF Australian Quality Training ATC Air Traffic Control AusAID Australian Agency for International Development* BA Bachelor of Arts BACC Budget Aid Coordination Committee BEd Bachelor of Education BEST Basic Employment Skills Training CATD Centre for Appropriate Technology and Development CAUQ Committee for the Accreditation of University Qualifications CBT Competency-Based Training CEDEFOP European Centre for the Development of Vocational Training CETC Community Education Training Centre CHRIS Computerised Human Resource Information System CPD Continuing Professional Development CPE Continuing Professional Education CSB Cabinet Sub-committee on the Budget CSO Civil Society Organisation CTD Centre for Training and Development CVCE Centre for Vocational and Continuing Education DAC Development Assistance Committee DDC Divisional Development Committee DFAT Department of Foreign Affairs and Trade, Australia DFL Distance and Flexible Learning DoA Department of Agriculture DoFF Department of Fisheries and Forests DSC Development Sub-Committee ECE Early Childhood Education ECD Early Childhood Development EEZ Exclusive Economic Zone EFTS Equivalent Full-Time Students EQA External Quality Assurance ESL English as a Second Language EU European Union EUS Employment and Unemployment Survey FBoS Fiji Bureau of Statistics FCEF Fiji Commerce and Employers’ Federation FCOSS Fiji Council of Social Services FHEC Fiji Higher Education Commission FHTA Fiji Hotel and Tourism Association FIT Fiji Institute of Technology FITVETA Fiji Islands TVET Association FJ$ Fijian Dollar FNTC Fiji National Training Council FNU Fiji National University

Research into the Financing of TVET in the Pacific Fiji Country Report
xii
FQC Fiji Qualifications Council FQF Fiji Qualifications Framework FRC Financial Resources Committee FRCA Fiji Revenue and Customs Authority FTE Full-time Equivalent FTRB Fiji Teachers’ Registration Board FVTTCPD Fiji Vocational and Technical Training Centre for Persons with a
Disability FY Financial Year GDP Gross Domestic Product GNI Gross National Income GoF Government of Fiji HEAB Higher Education Advisory Board HIES Household Income and Expenditure Survey HRD Human Resource Development HRM Human Resource Management IAS International Accounting Standards ICAO International Civil Aviation Organisation ICT Information and Communication Technology IELTS International English Language Testing System IFC International Finance Corporation IHRDP Integrated Human Resource Development Program ILO International Labour Organisation IQA Internal Quality Assurance IR Industrial Relations ISAC Industry Standards Advisory Council ISCO International Standard Classification of Occupations JICA Japan International Cooperation Agency KSA Knowledge, Skills and Attitudes LFPR Labour Force Participation Rate LMI Labour Market Information MCI Marist Champagnat Institute MDG Millennium Development Goal MoA Ministry of Agriculture MoE Ministry of Education, National Heritage and Culture and Arts MoF Ministry of Finance MoFF Ministry of Fisheries and Forests MoIT Ministry of Industry and Trade MoiTA Ministry of iTaukei Affairs MoLIRE Ministry of Labour, Industrial Relations and Employment MoPI Ministry of Primary Industries MoSPNDS Ministry of Strategic Planning, National Development and
Statistics MoWSWPA Ministry of Women, Social Welfare and Poverty Alleviation MoYS Ministry of Youth and Sports MOOE Maintenance and Other Operating Expenditure MPC Macro-Policy Committee MTEF Medium-Term Expenditure Framework NEC National Employment Centre NGO Non-Government Organisation NRG National Reference Group NSHRP National Strategic Human Resource Plan NTP National Tutor Program NTPC National Training and Productivity Centre NZAID New Zealand Agency for International Development

Research into the Financing of TVET in the Pacific Fiji Country Report
xiii
NZPTC New Zealand Pacific Technical College OB Organisational Behaviour ODA Official Development Assistance OECD Organisation for Economic Cooperation and Development PADDLE Pacific Archive for Digital Data for Learning and Education PATVET Pacific Association of TVET PCCPP People’s Charter for Change, Peace and Progress PDC Provincial Development Committee PESDA Pacific Education and Skills Development Agenda PNG Papua New Guinea PSC Public Service Commission PSET Post-School Education and Training QA Quality Assurance QES Quarterly Employment Survey RCC Recognition of Current Competency RBF Reserve Bank of Fiji RCCCE Regional Centre for Continuing and Community Education RED Rural Enterprise Development RDSSED Roadmap for Sustainable Socio-Economic Development RPL Recognition of Prior Learning SEG Standard Expenditure Group SHCS School of Hospitality and Community Services SIDS Small Island Developing States SME Small and Medium Enterprise SMEs Subject Matter Experts SOE State Owned Enterprises SPC Secretariat of the Pacific Community SPSE South Pacific Stock Exchange STT School of Trades and Technology TAFE Technical and Further Education TCF Textile, Clothing and Footwear TCTVET Teacher’s Certificate TVET TPAF Training and Productivity Authority of Fiji TRTC Tutu Rural Training Centre TVET Technical and Vocational Education and Training UNDP United Nations Develop Program UIS UNESCO Institute for Statistics UNESCO United Nations Education, Scientific and Cultural Organisation UoF University of Fiji USP University of the South Pacific VAT Value Added Tax VTC Vivekananda Technical Centre *AusAID was integrated into DFAT in October 2013. Citations of AusAID documents or programs in this report refer to the authorship or structure before that time.

Research into the Financing of TVET in the Pacific Fiji Country Report
xiv
PREFACE
The project Research into the Financing of Technical and Vocational Education and Training (TVET) in the Pacific was managed by the Australian Council for Educational Research (ACER) and Scope Global on behalf of the Australian Government. The project was undertaken between 2012 and 2014 under contract to the Australian Government, initially through AusAID and then the Department of Foreign Affairs and Trade (DFAT).
The study was conducted in seven Pacific countries: Fiji; Kiribati; Papua New Guinea; Samoa; Solomon Islands; Tonga; and Vanuatu. The aims of the research were to produce, in conjunction with host country governments and TVET stakeholders, comprehensive analyses of the systems for financing TVET and discussions of policies through which the financing of TVET could be made more efficient and effective. This volume is one of the seven country reports produced by the study.
I am very appreciative of the assistance provided by Leo Maglen as Research Coordinator, Jim Jones as Operations Manager, and Justin Brown who worked across all seven studies. I am also very appreciative of all the work done by the members of the seven country teams:
Fiji: Leo Maglen (Lead Researcher), Mark Weston Wall (Researcher), Manaini Rokovunisei (National Consultant), Daniel Lafu Taufaga (In-Country Manager)
Kiribati: Prabir Majumdar (Lead Researcher), Teweiariki Teaero (Researcher), Linda Uan (In-Country Manager)
Papua New Guinea: Robert Horne (Lead Researcher), Ken Ngangan (Researcher), Simaima Tavil-Melachon (National Consultant), Meghan Toka and Peter Mulligan (In-Country Managers)
Samoa: Leo Maglen (Lead Researcher), Justin Brown (Researcher), Salā Perive T. Lene (National Consultant), Frances Soon-Schuster (In-Country Manager)
Solomon Islands: Andrea Bateman (Lead Researcher), Elizabeth Cassity (Researcher), Judy Fangalasuu (National Consultant), Bob Pollard (In-Country Manager)
Tonga: Andrea Bateman (Lead Researcher), Justin Brown (Researcher), Meleoni Uera (National Consultant), David Wyler (in-Country Manager)
Vanuatu: Ray Powell (Lead Researcher), Julie Kos (Researcher), Henry Vira (National Consultant), Kathryn Nako (Consultant), Lou Cochrane (In-Country Manager)
The project benefited greatly from the engagement and input from the seven participating national governments, the National Reference Groups established in each country, the relevant DFAT country posts, TVET authorities and providers, NGOs, employers, regional organisations and a range of other TVET stakeholders. Without their contributions and willingness to work with the research teams, the project would not have been possible.

Research into the Financing of TVET in the Pacific Fiji Country Report
xv
I would also like to gratefully acknowledge the assistance provided by the Research Steering Committee chaired by Kaye Schofield, the reviewers of draft reports, and the DFAT managers of the project. The analyses, opinions and conclusions herein do not represent the views of DFAT, national governments, or any other organisation or individual, unless stated otherwise. Phillip McKenzie Project Director ACER

Research into the Financing of TVET in the Pacific Fiji Country Report
xvi
ACKNOWLEDGEMENTS
There are a great number of people who contributed freely of their time and information to help make this study possible. To them all we extend our sincere thanks. They ranged across government ministries, education and training institutions and private TVET providers, state owned enterprises and private corporations. We would like to single out some for a special vote of thanks. This does not, however, in any way diminish our appreciation of the others who contributed. We would like to thank Ms Sinate Mualaulau, Acting Deputy Secretary, MoF Budget Division, for agreeing to give of her valuable attention, at some of the busiest times of the year, to act as the Chair of our National Reference Group, and to meet with us outside that forum on a number of occasions. Her insights, advice and support we found extremely valuable. To all who agreed to serve on our National Reference Group, especially those who were able to attend our meetings, we also extend our appreciation. The support and assistance of the Fiji Higher Education Commission was valuable to our mission. We thank the Director, Mrs Salote Rabuka and her team, for working closely together with us, and the Chair of the Commission, Dr Richard Wah, for his advice and guidance. To those across government ministries who gave of their time and knowledge to assist us in our task, especially those in the Ministry of Finance and the Ministry of Education, we say thank you. The team would also like to thank the principals of the private providers and the CEOs of the state-owned enterprises and private corporations that participated in our fact-finding surveys. Mr Nezbitt Hazelman, CEO of the Fiji Commerce and Employers Federation, and Michael Wong, CEO of the Fiji Hotel and Tourism Association, gave the team valuable insight into industry and employer perspectives on TVET and for that we are most grateful. Tina Seniloli and Lori Banks and their development assistance program colleagues at the Australian High Commission, Suva, provided extensive support and assistance. The team was very ably supported by Scope Global (formerly Austraining International). Particular thanks are due to Daniel Lafu Taufaga for his role as In-Country Manager. Leo Maglen Mark Weston Wall Manaini Rokovunisei

Research into the Financing of TVET in the Pacific Fiji Country Report
xvii
EXECUTIVE SUMMARY
1. This study provides a detailed analysis of the financing of technical and vocational education and training (TVET) in Fiji. The study team commenced its field investigations in August 2013 and completed them in October 2013.
2. The Fijian Country Study Report into the Financing of TVET forms part of a region-wide program Research into the Financing of TVET in the Pacific, initiated under Australia’s international development assistance program in 2011.
3. The aims of the program, as identified by its Research Brief, are to produce, in conjunction with host country governments and TVET stakeholders, a comprehensive empirical analysis of the existing systems for financing TVET in seven Pacific countries (Fiji, Kiribati, Papua New Guinea, Samoa, Solomon Islands, Tonga and Vanuatu), identify key financing issues within the region, and the policy implications they have for the future financing for TVET, to enable it to be more efficient and effective at both national and regional levels.
4. The first task of the study team, outlined in Chapter 2 of the report, was to determine the scope of TVET in Fiji. The broad definition provided in the Research Brief for the purpose of the research is as follows:
Post-secondary education and training programs designed to develop vocational skills. Degree and higher level programs, and subjects delivered as part of general education by secondary schools, are not included in this definition.
5. The next tasks of the study team were to review the full scope of data available on the operations and finances of the TVET sector so defined, to assess its quality in terms of comprehensiveness, reliability, timeliness etc, to identify where gaps appeared and to devise means of covering those gaps within the time and resources of the study.
6. The team found that whilst there is a considerable amount of published and unpublished, material available that directly or indirectly relates to the TVET sector, there are significant gaps in the public record, and access to unpublished data in some instances proved difficult.
7. In order to augment existing information sources, the study team carried out a number of enquiries of its own:
the study team worked closely with MoF to analyse more disaggregated financial information to that published in the annual expenditure estimates;
FNU was given a questionnaire seeking detailed up-to-date data on their TVET operations and finance;
information templates seeking similar information to that from FNU was administered with the assistance of the line-ministries - such as MoE, MoYS, DoA and DoFF, MoLIRE - that have training programs that fall within the scope of the study;
a survey of all private TVET providers was conducted, with the support of FHEC, seeking the same set of information as that asked of the line Ministries;
a questionnaire asking APTC to provide detailed up-to-date information on the operations and finance of its Fijian operations, as part of a wider enquiry of all their operations across the Pacific; and

Research into the Financing of TVET in the Pacific Fiji Country Report
xviii
a small representative survey of employers in the state-owned enterprise and private corporate sectors was conducted, with the support of FBoS and FCEF, seeking information of the extent of the training they provide their employees, and how they fund it.
8. The results of these enquiries, combined with the information available from existing
official sources and previous commissioned studies, are analysed in Part IV of the report. Prior to that, however, Part II summarises country background material necessary in a study such as this, and Part III sets TVET in Fiji in context.
9. Part IV of the report contains five chapters, each focusing on a different aspect of the financing of TVET in Fiji:
Chapter12 summarises the overall financial state of TVET, and concludes that taken together, expenditure on TVET across the sector accounts for around 1.5 to 1.6 percent of GDP;
Chapter 13 traces the intricacy of the financial mechanisms that channel funds to and within the sector;
Chapter 14 looks in detail at the revenue and expenditure patterns within the sector and its component parts;
Chapter 15 describes the study team’s survey of employer training, and analyses what it revealed about the nature of the training organisations provide for their workforces, and how it is resourced; and
Chapter 16 estimates, where possible, the unit costs of TVET provision in Fiji, and discusses their implications for internal and external efficiency of training.
10. Part V of the report draws the strands together, by identifying what the study team
regarded as the key issues, and what their policy implications might be.
The team regarded the sector as still in a state of flux, given the momentous changes that have occurred over the last six or so years. These have not yet been played out, but are presenting opportunities as well as challenges, both of which need careful management and clear leadership.
The emerging role of FHEC is crucial in guiding the sector over the medium to long term. The Commission needs its independence and standing to be enhanced, and for funding adequate to its multiple tasks assured.
Comprehensive, reliable and frequently updated information - about the TVET sector (and PSET more generally), and about the employment and economic environment it interacts with - is at an absolute premium, if FHEC is to fulfill its multiply mandates as regulator, assurer of quality, and funding conduit. Unfortunately these respective information bases are in a parlous state, and are in urgent need of upgrading.
Whilst the standard MoF budget framework is capable of being used to identify and monitor expenditure on TVET, it is operating far from its potential in this respect. This is especially evident with respect to budget allocations to FNU. In annual budget expenditure estimates they are but one part of a one line figure for higher education institutions.
A lack of transparency is also evident with respect to the operations of the national training levy grant scheme. Information about how this absolutely key funding mechanism for TVET, and one special to Fiji in this region, operates is not available publicly.
The funding of APTC’s Fijian operations and elements of Australia’s regional scholarship schemes are the only two components of development partner assistance to the sector. According to MoF sources, no other donor funded

Research into the Financing of TVET in the Pacific Fiji Country Report
xix
programs (grant aid-in-kind) or payments from soft loans are being channeled into the sector. Whilst Australia is the country’s largest development partner, and the only substantial provider of assistance to the sector, all of this so far has been through its regional program, and none has been forthcoming to national providers through its bilateral program.
Tuition fees as an additional source of income for the TVET sector have only limited potential.


Research into the Financing of TVET in the Pacific Fiji Country Report
1
PART I: INTRODUCTION CHAPTER 1. BACKGROUND AND PURPOSES OF THE STUDY
1.1 INTRODUCTION
This report provides a detailed analysis of the financing of Technical and Vocational Education and Training (TVET) in Fiji.
The report forms part of the study Research into the Financing of TVET in the Pacific initiated by the Australian Agency for International Development (AusAID). In April 2012 AusAID contracted the Australian Council for Educational Research (ACER) to conduct the study. ACER is leading a consortium including Scope Global (formerly Austraining International) which is responsible for logistics, in-country support and employment of national consultants) and specialist research consultants.
The research aims to produce, in conjunction with host country governments and TVET stakeholders, a comprehensive empirical analysis of the existing systems for financing TVET in up to seven Pacific countries (Fiji, Kiribati, Papua New Guinea, Samoa, Solomon Islands, Tonga and Vanuatu), identify key financing issues within the region, and identify policies through which future financing for TVET could be made more efficient and effective at both national and regional levels. The overall project ran from 2012 to 2014, with the seven country studies being conducted in two stages. The timing of the fieldwork in participating countries is outlined in Table 1.1. The Fiji country study forms part of Stage Two fieldwork.
Table 1.1 Countries participating in the research
Stage One (fieldwork in 2012) Stage Two (fieldwork in 2013)
Samoa Fiji
Tonga Kiribati
Vanuatu Solomon Islands
Papua New Guinea (Phase 1) Papua New Guinea (Phase 2)
The individual country studies are based on a common conceptual framework and research approach intended to facilitate synthesis and comparative analysis.
This report provides the Fiji country study. It initially comprised a draft report that was reviewed by the National Reference Group (NRG) established by the country team, the Research Steering Committee established by AusAID and later managed by the Australian Government Department of Foreign Affairs and Trade (DFAT), and external reviewers. The revised draft report was presented at a national forum held in Suva in February 2014 before being finalised.

Research into the Financing of TVET in the Pacific Fiji Country Report
2
1.2 RESEARCH OBJECTIVES
Developing vocational and technical skills and enhancing employability are strategic objectives in the Pacific Islands Forum's Pacific Plan for Strengthening Regional Cooperation and Integration (2007), Australia's Port Moresby Declaration (2008) and the Forum Education Ministers' Pacific Education Development Framework (2009).
Background research for the Research Brief developed by AusAID (2011) concluded that, to help achieve skills development and employability objectives, national governments, donors and other TVET stakeholders need a comprehensive understanding of public and private investment in TVET, taking into account the sources of funding, costs of services, size and patterns of expenditure, financing mechanisms, and outcomes delivered. Nevertheless, the research concluded there is a dearth of up-to-date information about these aspects of skill development in the Pacific.
The research is intended to help fill this gap by:
a) identifying the current public and private sources of capital and recurrent funding for TVET and the relevant expenditure from each source;
b) identifying where expenditure is directed, taking account of the participation of females and males, and through what distribution mechanisms;
c) identifying the TVET outcomes provided for the funds allocated, including a comparison of the costs of TVET training between different types of providers, fields and level of training, duration, mode of delivery and geographic location; and
d) assessing the strengths and weaknesses in different contexts of different financing mechanisms being used and identifying financing mechanisms that are more likely to ensure financially sustainable TVET systems.
This is not a study of all aspects of TVET. It is focusing on the financing of TVET. The research is guided by the following over-arching questions:
1) What are the current sources of post-secondary TVET finance? Will they sustain a quality TVET system? Why / Why not?
2) How efficient and effective is the current use of TVET funding? How could it be improved?
The broad definition of TVET provided in the Research Brief for the purpose of the research is as follows:
Post-secondary education and training programs designed to develop vocational skills. Degree and higher level programs, and subjects delivered as part of general education by secondary schools, are not included in this definition.
Chapter 2 of this report details how this definition was applied in the Fijian context, to determine the scope of TVET to be included in the Fijian study.

Research into the Financing of TVET in the Pacific Fiji Country Report
3
The Research Brief asks the study to address at a minimum the following questions: Sources of funding
What are the current public and private sources of capital and recurrent funding for TVET?
What is the relative contribution from each source in terms of the overall funding of TVET?
What is the level of reliance on donor funding?
What is the level of reliance on foreign private funding, and are there strategies in place to limit risks if there is a danger of funding being removed at short notice as investment decisions change?
What non-financial inputs are provided for TVET, from what sources, and what is their estimated value?
Expenditure
What is the overall level of public and private expenditure on TVET?
What is the total government expenditure on TVET as a proportion of total government expenditure and what is the relative contribution of national and provincial governments?
What is TVET’s share of the education sector budget?
To what extent is there a gap between budget allocation to TVET and expenditure?
Where is expenditure directed, and through what allocative mechanisms?
What proportion of expenditure on TVET could be defined as quality related expenditures?
Cost of TVET Services
What is the most useful unit of analysis for assessing the costs of TVET services?
What are the TVET services provided for the recurrent funds expended, and can they be quantified?
What are the comparative costs of TVET between different types of providers?
What proportions of total costs are costs of wages and salaries, materials/consumables, and infrastructure?
What is the cost of capital?
What areas offer the greatest potential for improved cost efficiency?
Financing Mechanisms
What funding mechanisms are currently being used to finance or co-finance TVET?
How efficient and effective are these different mechanisms? To what extent are they responsive to demand from industry, communities and individuals? To what extent are they being used to promote inclusion of groups at risk of labour market and social exclusion?
How successful are these mechanisms in providing the country with a predictable and sustainable source of financing for skills development?
What policy measures are in place to improve diversification and sustainability in funding mechanisms?
Is the existing funding model sustainable if access to TVET is to be expanded?
What changes would ensure more financially sustainable and demand-based national TVET systems?
This report addresses these questions for Fiji to the extent possible with the time and resources available.

Research into the Financing of TVET in the Pacific Fiji Country Report
4
1.3 STRUCTURE OF THE REPORT
The report is structured in five main parts. (The other country reports are using a similar structure.) Chapter 2 completes Part I by providing a detailed description of the research approach used in Fiji, including the data collection instruments that were developed. Part II (Country Background) contains Chapters 3-7 that outline the broad national context of Fiji. In Part III (TVET in Context) Chapters 8 to 11 provide a detailed description of TVET institutions and activities in Fiji, and discuss access to educational opportunities, the contribution of TVET to economic developments, and developments and issues concerning the quality of TVET. Part IV (The Financing of TVET) presents the main findings and analyses from the study. TVET funding and expenditure patterns and trends are presented and analysed in Chapters 12 and 14. The financial mechanisms that channel resources into and throughout the TVET sector are identified and analysed in Chapter 13. Chapter 15 details the study team’s pilot survey on enterprise training and its funding, and in Chapter 16 unit costs of TVET delivery are estimated, and their use in evaluating the efficiency of TVET delivery is assessed. In Part V (Issues and Policy Directions) the overall conclusions of the study are summarised, key issues identified, and broad policy directions identified for consideration by the Government of Fiji, other TVET stakeholders, and development partners. Further details on the study are provided in the annexes. Annex 1 provides the scope and objectives set out in the Research Brief. Annexes 2-5 include the data collection templates developed for different aspects of the study. Annex 6 provides the classification and coding systems used in the data collection and recording. The people and organisations involved in consultations during the fieldwork are listed in Annex 7, and the members of the National Reference Group for the study are provided in Annex 8.

Research into the Financing of TVET in the Pacific Fiji Country Report
5
CHAPTER 2. RESEARCH APPROACH
The research brief for this study of the financing of TVET in Fiji includes the systematic gathering and analysis of information under four broad headings:1
Sources of funding for TVET
Expenditure patterns and trends in TVET
Financial mechanisms for channeling funds to and facilitating expenditure on TVET
Costs of TVET delivery
2.1 DEFINING TVET IN FIJI
The first task was to determine the scope of TVET in Fiji. As noted in Chapter 1, the broad definition provided in the research brief is:
‘post-secondary education and training programs designed to develop vocational skills. Degree and higher level programs, and subjects delivered as part of general education by secondary schools, are not included in this definition.’
In refining this definition for the purposes of the Fiji study, background documents were reviewed and the National Reference Group was consulted. Based upon the general framework developed to guide the overall study, a matrix has been developed that identifies TVET programs by: (a) the skill categories and levels they seek to develop; and (b) by the institutions that offer them. Skill categories and levels are in turn identified according to the qualification levels they are pitched at, and the occupations to which they are directed. The qualification levels are those of the Fiji Qualifications Framework (FQF), developed by the Fiji Higher Education Commission (FHEC) and occupations are classified according to the International Standard Classification of Occupations, (ISCO) 2008 version.2 Institutions identified as providing structured TVET programs are classified according to whether they are public;3 private or regional TVET providers, other Government of Fiji (GoF) line Ministries and agencies that offer TVET-type programs, and employers in the state-owned enterprise (SOE) and private corporate sectors.4 The matrix is shown in Figure 2.1. The scope of the TVET sector in Fiji as used in this study is depicted in green. The parameters of the TVET sector for the purpose of the study are therefore defined by the following: TVET qualification levels
FQF Certificate levels 1, 2, 3 and 4, Diploma level 5 and Advanced Diploma level 6.
ISCO-08 major (first digit) occupational groups serviced by TVET
3. technicians and associate professionals 4. clerical support workers
1 See Annex 1.
2 See Annex 6 for the classification and coding systems used in this study.
3 These include privately-owned schools and centres that are wholly funded by government.
4 Exclusions – police and fire services, nursing and school teacher training, and unstructured training
conducted in the informal, non-wage- economy.

Research into the Financing of TVET in the Pacific Fiji Country Report
6
5. service and sales workers 6. skilled agricultural, forestry and fishery workers 7. craft and related trades workers 8. plant and machine operators, and assemblers
Figure 2.1 Scope of the study: the skills/employment/training matrix for Fiji
level of skills training
(Fiji Qualifications Framework)
occupational skill category [ISCO 08]
TVET providers
training institutions in-house training by
employers in public and
private sectors
public private regional
10 doctoral
1/2 managers/ professionals
*University of Fiji *FNU degree and graduate programs in CAFF, CBHT, CEST, CHE, CMNHS
*USP advanced diploma, degree and graduate programs
9 masters
8 post-graduate cert/dip
7 bachelor degree
6 advanced diploma 3
technicians and associate professionals
* Theological colleges
5 diploma *NTPC at FNU *FNU TVET programs in CAFF, CBHT, CEST, CHE, CMNHS *Tutu Rural Training Centre *2 Forestry and timber training centres
3/4 trade certificate
4 clerical support workers
*80 Vocational Training Schools funded by Ministry of Education *27 Private Registered and Recognised Training Providers under FHEC *Other non-recognised or registered providers
*APTC *USP RCCCE programs *SPC Community Education and Training Centre
*Training levy Method A employers *Training levy Method B employers
5 service and sales workers
6
skilled agricultural, forestry and fishery workers
7 craft and related trades workers
1/2 semi-skilled/ operative
4 clerical support workers
* 4 Ministry of Education Vocational Training Schools *Ratu Mara College *Suva Vocational College Vivekananda Technical Centre *MoYS Youth Training Centres *MoLIRE National Employment Centres *MWSWPA community-based short courses * Min. of iTaukei CATD
5 service and sales workers
8 plant and machine operators, and assemblers
basic manual 9
elementary occupations
* Fiji Vocational Technical Training Centre for Persons with Disabilities
on-the-job training
Note: The sections shaded green are defined as the scope of TVET for the purposes of the study.
TVET provision
Public providers Fiji National University (FNU) - TVET programs conducted through its five colleges
and their constituent schools, departments and divisions FNU - National Training and Productivity Centre (NTPC) Ministry of Education (MoE) – four government-owned vocational schools and
centres MoE - Ratu Mara College MoE - Suva Vocational College MoE – Vinekananda Technical Centre Ministry of Youth and Sports (MoYS) – four youth training centres

Research into the Financing of TVET in the Pacific Fiji Country Report
7
Ministry of Agriculture (MoA) – Tutu Rural Training Centre (run by the Marist Brothers)
Ministry of Forests and Fisheries (MoFF) – a forestry training centre and a timber industry training centre
Ministry of iTaukei Affairs (MoiTA) – Centre for Appropriate Technology Development (CATD)
Ministry of Labour, Industrial Relations and Employment (MoLIRE) - National Employment Centres (NEC) short-course training programs
Ministry of Women, Social Welfare and Poverty Alleviation (MoWSWPA) - community-based short-course training programs
Private providers MoE – 80 privately-owned vocational schools and centres Fiji Higher Education Commission (FHEC) – 26 recognised and/or registered
private training providers
Regional providers that have programs in Fiji Australia-Pacific Technical College (APTC) University of the South Pacific (USP) Centre for Community and Continuing
Education (CCCE) Secretariat of the Pacific Community (SPC) Community Education and Training
Centre (CETC)
Other structured training providers Fiji Vocational Technical Training Centre for Persons with Disabilities (FVTTCPD)
TVET regulators
Fiji Higher Education Commission (FHEC) National Training Levy Grant Scheme – levy collected, managed and disbursed as
grants by FNU National Apprenticeship Training Scheme - managed by NTPC at FNU National Trade Testing - managed by NTPC at FNU
These Government of Fiji (GoF) agencies are included because they play a key role in the regulation of and support for the TVET sector.
FHEC reports to the Minister for Education, and has an overview and quality assurance function for the whole of the post-school education and training sector, of which the TVET sector forms a part, alongside the higher education sector. It has responsibility for the development of the FQF; the recognition and registration of training providers and the accreditation of courses. The National Training Levy Grant Scheme, National Apprenticeship Training Scheme and National Trade Testing have only recently been transferred to FNU. Prior to 2010 they were under the umbrella of the stand-alone Training and Productivity Authority of Fiji (TPAF), the forerunner of NTPC.
Research into the Financing of TVET in the Pacific Fiji Country Report
8
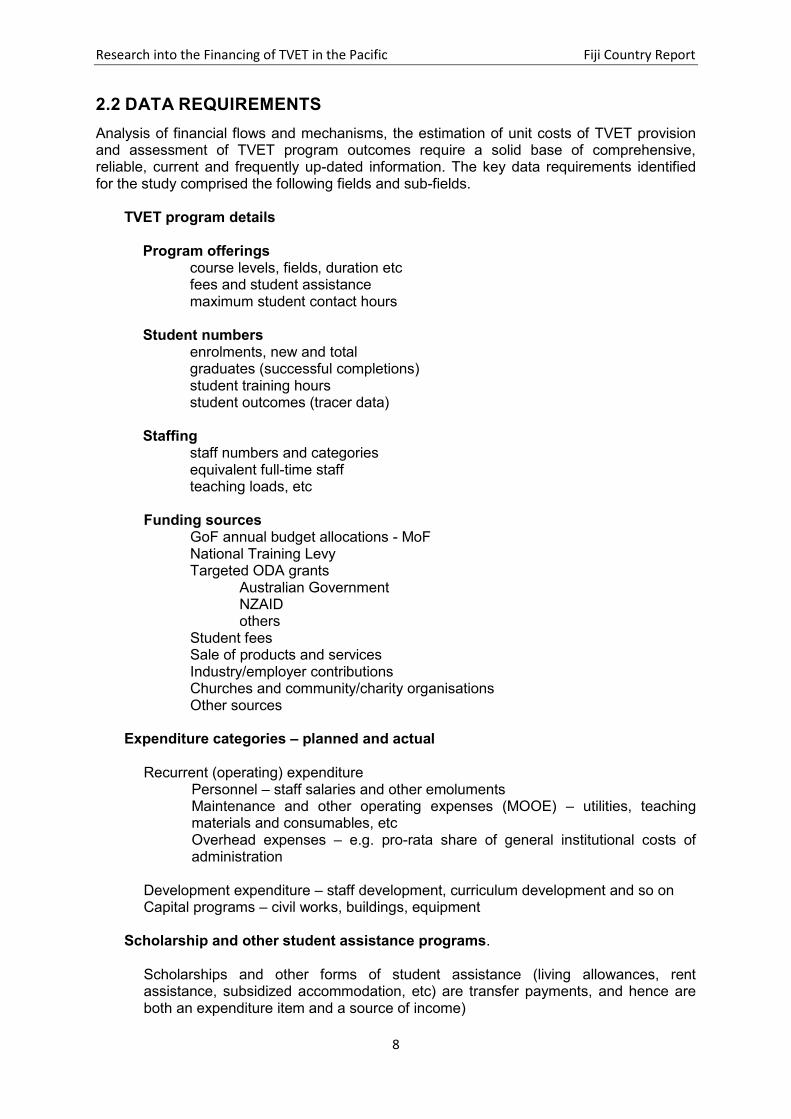
2.2 DATA REQUIREMENTS
Analysis of financial flows and mechanisms, the estimation of unit costs of TVET provision and assessment of TVET program outcomes require a solid base of comprehensive, reliable, current and frequently up-dated information. The key data requirements identified for the study comprised the following fields and sub-fields.
TVET program details Program offerings
course levels, fields, duration etc fees and student assistance maximum student contact hours
Student numbers
enrolments, new and total graduates (successful completions) student training hours student outcomes (tracer data)
Staffing
staff numbers and categories equivalent full-time staff teaching loads, etc
Funding sources
GoF annual budget allocations - MoF National Training Levy Targeted ODA grants
Australian Government NZAID others
Student fees Sale of products and services Industry/employer contributions Churches and community/charity organisations Other sources
Expenditure categories – planned and actual
Recurrent (operating) expenditure
Personnel – staff salaries and other emoluments Maintenance and other operating expenses (MOOE) – utilities, teaching materials and consumables, etc Overhead expenses – e.g. pro-rata share of general institutional costs of administration
Development expenditure – staff development, curriculum development and so on Capital programs – civil works, buildings, equipment
Scholarship and other student assistance programs.
Scholarships and other forms of student assistance (living allowances, rent assistance, subsidized accommodation, etc) are transfer payments, and hence are both an expenditure item and a source of income)

Research into the Financing of TVET in the Pacific Fiji Country Report
9
2.3 AVAILABLE INFORMATION SOURCES5
The team undertook a thorough review of the data that were available for Fiji. The review consisted of an extensive web-based search, and the assembly of existing published and unpublished material obtained from stakeholders over the period July to October 2013. Advice on data availability was also sought from the National Reference Group established for the study. The main purpose of the reviews and consultations was to minimise additional data requests, and to confine any new data collections to filling data gaps. The following list summarises the main sources of available data that were identified.
(a) Published and unpublished documents of Government of Fiji ministries and agencies6
(i) Strategic planning documents
Ministry of National Planning, Fiji’s National Development Policy Framework: Roadmap for Democracy and Sustainable Social and Economic Development 2010-2014, December 2009 Ministry of Strategic Planning, National Development and Statistics, National Strategic Human Resource Plan, 2011-2015, August 2011 Ministry of Education, National Heritage, Culture and Arts, Youth and Sports, 2012-2014 Education Sector Strategic Development Plan Public Service Commission: Strategic Plan, 2011-2014 Fiji Higher Education Commission, Strategic Plan, 2012-2015
(ii) Budget documents
Ministry of Finance, Budget Estimates, 2013 Ministry of Finance, Economic and Fiscal Update – Supplement to 2013 Budget Address, November 2012
(iii) Annual corporate and business plans
Ministry of Strategic Planning, National Development and Statistics, Annual Corporate Plan for Financial Year ended 31 December 2012 Ministry of Finance, Annual Corporate Plan, 2013 Ministry of Education, National Heritage, Culture and Arts, Annual Corporate Plan for Financial Year ended 31 December 2013 Ministry of Education, National Heritage, Culture and Arts, 2013 Annual Business Plan Ministry of Labour, Industrial Relations and Employment, Annual Corporate Plan, 2012
(iv) Annual reports and statistical bulletins
Ministry of Education, National Heritage, Culture and Arts, Youth and Sports, Annual Report, 2012 Ministry of Youth and Sports, Situational Analysis of Youths in Fiji, 2011 Report Fiji Bureau of Statistics, 2008-2009 Household Income and Expenditure Survey (HIES) Fiji Bureau of Statistics, 2010-2011 Employment and Unemployment Survey (EUS), Preliminary Findings, December 2012 Fiji Bureau of Statistics, Key Statistics, December 2012 International Finance Corporation-World Bank Enterprise Survey – Fiji, 2009 http://www.enterprisesurveys.org/Data/ExploreEconomies/2009/fiji#workforce--sector
(v) Official Development Assistance (ODA)
5 A full list of all documents and web-based material cited is contained in the References.
6 Available in hardcopy or as pdf files downloadable from GoF websites.

Research into the Financing of TVET in the Pacific Fiji Country Report
10
Two extremely informative websites describe the nature of ODA to Fiji and the planning and administrative mechanisms involved. http://www.foreignaffairs.gov.fj/trade-policy/international-cooperation/oda-to-fiji http://www.foreignaffairs.gov.fj/trade-policy/international-cooperation/strategic-planning-and-decision-making-machinery-of-government
(b) Published and unpublished documents of major TVET providers
(i) Fiji National University
FNU’s website contains details of TVET program offerings and course fees http://www.fnu.ac.fj Fiji National University, FNU Finance Policies, Adopted 2010 - Revised December 2012 Fiji National University, FNU Strategic Plan 2020;
(ii) Ministry of Education, Department of TVET
Ministry of Education, Strategic Direction of TVET, 2008-2012
(iii) The University of the South Pacific
The University of the South Pacific, Strategic Plan, 2013-2018 University Grants Committee for the University of the South Pacific, Report: 2013-2015 Triennium, September 2012 The University of the South Pacific, Council Approved Annual Plan, 2013, November 2012 The University of the South Pacific, Annual Report, 2012
(iv) Australia-Pacific Technical College
Australia-Pacific Technical College, APTC Annual Report and Plan: Report 1 July 2011 to 31 December 2011; Plan 1 January 2012 to 30 June 2012. Australia-Pacific Technical College, APTC 2012-13 Annual Report and Plan Australia-Pacific Technical College, APTC 6-Monthly Progress Report, June 2012 Australia-Pacific Technical College, APTC Quarterly Activity Report, Quarter 1 (January – March) 2013
(c) Published and unpublished documents of development partners (i) Australian Government
Strategic parameters for development assistance to education sector in the Pacific are set out in:
The Pacific Education and Skills Development Agenda (PESDA), June 2011 Regional Program Annex to PESDA – Discussion Paper, July 2013 The Pacific Education and Skills Development Agenda and Delivery Strategy 2013-2021, August 2013 Pacific Tertiary Education Strategy 2020, Draft 4, 25 June 2012
Details of Australia’s bilateral assistance programs in Fiji are contained in the following documents
The Fiji Annual Program Performance Report 2011, September 2012 Fiji Country Strategy 2012-2014, 2012 Australian aid to Fiji: Working together for better health, better education, better livelihoods, AusAID, March 2013
(ii) Other development partners

Research into the Financing of TVET in the Pacific Fiji Country Report
11
Japan’s ODA: Rolling Plan for the Republic of Fiji, Embassy of Japan in the Republic of Fiji, April 2012
New Zealand - http://www.aid.govt.nz/where-we-work/pacific/fiji European Union - http://eeas.europa.eu/fiji/index_en.htm
(d) Commissioned Reports
Brady P., Gorman A., Johanson R. and Naisele E., Technical-Vocational Skills Development in Fiji, Technical Assistance for Implementation of Pacific Education Strategy: Skills Development, ADB Project No. TRA 38634, for Pacific Islands Forum Secretariat, June 2007 Sharma A. and Naisele E., Technical Vocational Education and Training: ‘The Master Key’ – Review of Functions of FIT, TPAF and Other TVET Providers, for the Ministry of Education, National Heritage, Culture and Arts, June 2008. Price Waterhouse Cooper. Fiji National Budget 2011, December 2010 Review of Australian and New Zealand Support for the University of the South Pacific, 2010-2012, Draft version 3.1, ERF.AusAID, January 2013
(e) Other documents
Robin Nair, Australia-Pacific Technical College (APTC), Submission to Australian Government Independent Review of Aid Effectiveness, June 2011
Robin Nair, Critical Analysis of the Australian-Pacific Technical College (APTC) – undated and unpublished
2.4 HOW USEFUL ARE THESE INFORMATION SOURCES TO THE
STUDY?
What is clear from above is that there is a considerable amount of material available that is relevant to the study of financing TVET in Fiji. The plethora of official websites provide access to a wide range of current information regarding the overall state of the Fiji economy. Strategic planning documents and ministerial annual corporate plans also provide a clear sense of direction for their respective areas of responsibility. However, whilst the importance of TVET in the economic and social development of Fiji is often acknowledged, there is little available at this level that is directly related to the TVET sector and its financing. Indeed, there is little recognition or identification of TVET as a sector, in the manner in which it has been defined in this study. Previous commissioned reports are out-of-date, not only in terms of time lapse, but in the years since the Brady et al and Sharma and Naisele reports, and ADB’s Skilling the Pacific, were written the TVET sector in Fiji has undergone substantial change. FNU was established in 2009 through the amalgamation of five previous stand-alone post-secondary education and training institutes, including the Fiji Institute of Technology (FIT), and with the further absorption of what had been the Training and Productivity Authority of

Research into the Financing of TVET in the Pacific Fiji Country Report
12
Fiji (TPAF) as the National Training and Productivity Centre (NTPC).7 These changes not only rendered FNU virtually the sole public provider of post-school TVET in Fiji, the inclusion of NTPC also brought under the province of the university the country’s apprenticeship training and trade testing schemes and its training levy grant scheme.8 Only limited information about the operations and financing of these three important schemes is so far publicly available from FNU. Recent years have also seen the establishment, within MoE, of the FHEC, with its key role in the development of the FQF, the recognition and registration of all training providers and the accreditation of their training courses. The information FHEC is making publicly available, including concerning its costed medium-term strategic plans, is very useful.
(a) the planning and budgeting environment
MoF publishes annual budget estimates, the most recent being for 2013. They are broken down by budget head (generally a ministry or agency), program and activity. Each activity is further classified into ten standard expenditure groups (SEGs). Annual budget estimates are presented in a rolling five-year medium-term expenditure framework (MTEF). As useful as this budgetary structure and framework is, however, as a source of information on expenditure on training, and on TVET in particular, within ministry and agency budgets, the published estimates are of limited value. In only a few instances is training identified as either a program or an activity. Budget allocations to FNU and its TVET programs are aggregated under a single head, along with MoF allocations to other higher education institutions. FNU’s total annual budget allocation is identifiable only as a single figure for its operating budget and one for its capital appropriation. Chapter 13 looks more closely at MoFs budgetary procedures, and what they reveal about the financing of TVET
(b) donor assistance to the sector
There is a variety of sources of information regarding official development assistance to Fiji ranging from international compendiums such as those maintained by OECD-DAC9 and the World Bank, to reports of individual development partners, to MoF publications such as the Economic and Fiscal Update – Supplement to 2013 Budget Address of November 2012. Generally, however, the sectoral breakdown of aid programs does not extend to the level of TVET, but rather stays at the more general level of education and training. The main exceptions to this are the reports and plans published by the Australian Government for APTC.
(c) TVET provided and/or funded through line Ministries
MoE through its vocational schools, MoYS through its youth training centres, MoPI/DoFF through its forestry training centres and MoLIRE through its training activities linked to its National Employment Centres, are the line Ministries that provide training in addition to their own staff. Information relating to course offerings is readily available, however, up-to-date and comprehensive data relating to student enrolments and graduations, staffing, course duration and financing are generally lacking.
7Republic of the Fiji Islands, The Fiji National University Decree, 2009 (Decree No.39 of 2009, and
Republic of the Fiji Islands, The Fiji National University (Amendment) Decree, 2010 (Decree No.58 of 2010) 8 These three elements of TVET in Fiji were originally lodged with the Fiji National Training Council
(FNTC) the forerunner of TPAF, under Chapter 93 of the Laws of Fiji Fiji National Training, June 1973 9 Organisation for Economic Cooperation and Development, Development Assistance Committee

Research into the Financing of TVET in the Pacific Fiji Country Report
13
(d) TVET provided through FNU
The FNU website and brochures contain details of courses offerings, student fee schedules and other general information. However, at the time of writing (November 2013), FNU had not posted on its website any strategic, corporate or annual plans, nor any annual reports or statistical bulletins. Information that would enable the distinction to be drawn between FNU’s higher education and TVET operations – with respect to course enrolments and graduations, course duration, staffing or expenditure breakdowns – is not as yet publicly available.
(e) private provision of TVET
The training provider recognition and registration processes of the newly established FHEC enables the identification of private training providers in Fiji. A few of these produce annual statistical and financial reports, however, on the whole the publicly available data set for this area of the TVET sector is patchy and incomplete
(f) regional TVET providers
APTC provides extensive data relating to course offerings, enrolments and graduations for the Pacific countries in which it operates, including Fiji. Detailed financial reporting however is not published, but has been made available for the purposes of this study. Information relating to the non-financial aspects of programs run though USP’s Regional Centre for Community and Continuing Education (RCCCE) is accessible, but only limited information regarding its finances are available through USP reporting.
(g) employer provided workforce training
The Fiji Bureau of Statistics (FBoS) has not undertaken surveys of enterprises in recent years and the nature and incidence of workforce training has not been canvassed. Employer groups in Fiji have not surveyed their members on this issue either. However, in 2009 Fiji participated in an International Finance Corporation (IFC) supported enterprise survey program in which 164 Fijian enterprises were included. One area of enquiry was the extent of workforce training.
(h) the regulatory framework for TVET
As part of its process of recognition and registration for training providers FHEC requires those applying to furnish the commission with extensive data relating to the institution’s training programs, enrolments, staffing and finances. This is potentially a rich source of information regarding the TVET sector. As yet, however, FHEC has not published this data in aggregate and summary format. Table 2.1 attempts to summarise the situation across the TVET sector, and across the categories of available material. The summary refers to the availability of data in terms of the study’s particular needs. It does not relate to other aspects of the information included in the documents and reports concerned.

Research into the Financing of TVET in the Pacific Fiji Country Report
14
Table 2.1 Summary of available documentary source material on TVET
descriptive – general, non-quantitative information
current , with useable TVET and financial data
current financial data, but no useable TVET statistics
current , with useable TVET statistics, but without financial data
out-of-date or incomplete, with limited TVET statistics and financial data
no reports available
2.5 APPROACH TO FILLING INFORMATION GAPS
As well as reviewing all available information sources, the study team pursued a six-pronged approach to information gathering. This was based on the data collection framework developed to guide the overall study as adapted to each participating country’s context.
The team sought to work closely with staff in MoF and in MoSPNDS to identify as closely as possible annual appropriations (in MTEF format) for line ministry and agency training programs and activities across the scope of the national budget. Its objective was to estimate the nature and extent of the budgetary contribution to TVET financing.
The team approached directly the two major post-secondary TVET providers - FNU and APTC - for detailed information about their TVET courses, students and staffing and about their revenue sources for and expenditure on TVET. Customised data collection templates were prepared for each institution, upon which to record the data being sought. A copy of the FNU data template is contained in Annex 3
Vocational schools and training centres owned, managed and/or financed directly by the line Ministries MoE, MoYS, MoPI/DoFF and MoLIRE, were not canvassed directly, but information was sought for them through the ministries themselves. Each ministry was provided with a customized data collection template asking for the same type of information as asked of FNU and APTC. A copy of the master template is contained in Annex 2.

Research into the Financing of TVET in the Pacific Fiji Country Report
15
A list of private TVET providers was drawn up by FHEC from organisations seeking recognition and registration through the Commission. These were surveyed directly by the project team, using a survey instrument requesting the same information as that asked of the public and regional TVET providers. A copy of the private provider questionnaire is contained in Annex 4.
A pilot survey was designed and conducted by the team that sought to elicit information from a small selection of employers in the state-owned enterprise (SOE) and private corporate sectors, regarding the nature and amount of training they provide or sponsor for their employees, particularly those employed in the range of occupations and with qualifications within the scope of TVET. A draft survey instrument was approved by FBoS, and a small representative (but not randomly selected) sample of enterprises was drawn up from amongst the membership of the Fiji Commerce and Employers’ Federation (FCEF). The survey was conducted with the support of the FCEF and the Fiji Hotel and Tourism Association (FHTA). A copy of the enterprise training survey questionnaire is contained in Annex 5.
Details of how the survey was conducted, the results it produced and the lessons that were learnt from it, are contained in Chapter 15.
The team conducted an extensive series of meetings and interviews with as many stakeholders and their representatives as time permitted, in order to provide as clear an understanding of the TVET sector, how it is conducted and resourced, as possible. In this aspect of the study the team was greatly helped by the National Reference Group (NRG) that was established to provide guidance and support to the team during its information collecting mission. Details of the NRG, its composition, functions and meetings, are contained in Annex 8, and comprehensive lists of people consulted and institutions visited are contained in Annex 7.
2.6 INDICATIVE QUALITY OF THE INFORMATION COLLECTED
During its mission to identify, collect and collate all relevant information regarding the TVET sector in Fiji, and its resourcing, the study team found that data fall into one or other of the following categories:
data that are readily available in published form;
administratively data – data that already are collected for routine management or administrative purposes, or as a regulatory requirement, but which, although not published, are nonetheless readily accessible on request, with the cooperation of those whose data they are; and
data that are not collected, but which are accessible by the team through specially designed surveys, conducted with the agreement and cooperation of the participants.
Table 2.1 summarises the range and usefulness of category (a) data, and Section 2.5 outlines the way in which the team approached the task of collecting and collating data in categories (b) and (c). Together they enabled the study team to put together a data set that encompasses a spectrum of TVET financing, provision and regulation not previously assembled in Fiji.

Research into the Financing of TVET in the Pacific Fiji Country Report
16
The team’s assessment of the scope of this information base and the quality of its constituent parts is presented in Tables 2.2 and 2.3. The former focuses upon the range of non-financial data required by the study, and the latter upon its financial data requirements. Table 2.2 Indicative quality of non-financial information on TVET sector programs
for the study’s purposes, from all study sources

Research into the Financing of TVET in the Pacific Fiji Country Report
17
Table 2.3 Indicative quality of TVET sector financial data, from all study sources
What is immediately evident from even a cursory view of these two tables is not just the generally high quality of the data the team was able to collect with the cooperation and participation of a wide range of TVET stakeholders, but also the information that is so far conspicuously missing. FNU is the flagship of the sector – it is by far the largest provider of TVET programs in Fiji, and manages of the country’s apprenticeship and training levy-grant schemes. At the time of writing this report, detailed information about the TVET elements of FNU has not been made available to the team.

Research into the Financing of TVET in the Pacific Fiji Country Report
18
The introductory section of the report concludes with the reaffirmation that a key focus of this study is to assist with developing capacity for TVET financial data collection and use. A number of gaps and limitations in the available data in Fiji have been identified. This study has been able to go some way to filling some of these gaps, albeit in a limited and one-off way. In Part V the salient issues that have arisen in the course of investigating the financing of TVET in Fiji are identified and discussed, and broad policy directions for the Government of Fiji, sector stakeholders and development partners, are canvassed. Needless to say, the financing of TVET, in any country, does not occur in a vacuum. To appreciate its scope and potential, and its limitations, its investigation must be grounded in the background of the country, and conducted in the context in which TVET is set. It is to these considerations – background and context – that Parts II and III of this report first turn.

Research into the Financing of TVET in the Pacific Fiji Country Report
19
PART II: COUNTRY BACKGROUND CHAPTER 3. GOVERNMENT, CULTURE, RELIGION AND
GEOGRAPHY
3.1 GOVERNMENT AND ADMINISTRATION
After more than three millennia of tribal rule and some bloody political struggles, Fiji was ceded to the British by paramount chief Cakobou in 1874 (Scarr 1984). The administration quickly formed the Great Council of Chiefs, to advise on how best to govern and preserve the iTaukei or indigenous population. One of the early government decisions, and one that was to have far reaching and unintended consequences, was the policy of bringing in indentured Indian labour to underpin the economy.
In 1970, following nearly 100 years as a colony, the country gained its independence and adopted a constitutional democratic form of government based on the Westminster model, and with two houses of parliament.
A new constitution, the fourth since 1970, has recently been developed under the tenets of the People’s Charter for Change, Peace and Progress (National Council for Building a Better Fiji 2008), and the Roadmap for Democracy and Sustainable Socio-Economic Development 2012-2014 (Ministry of National Planning 2009). Elections were held in 2014.
The Constitution of the Republic of Fiji (2013) establishes a single chamber, 50 member parliament, with the President as the Head of State. After a general election, the prime minister is to be appointed by the president, with the position automatically going to the leader of the party or coalition controlling the parliament. The constitution allows for an executive, a legislature and a judiciary, and the authority and power to make laws for the State is vested in the parliament.
Administratively Fiji consists of four divisions, central, eastern, northern and western, and the dependency of Rotuma. Divisions are further divided into provinces, and each of these has a number of districts that are made up of village units. Central administration is undertaken by 20 or so ministries and 50 national agencies (commissions and authorities). Ministries are headed by ministers and permanent secretaries, with the Permanent Secretary of the Prime Minister’s Office as head of the civil service.
3.2 RELIGION AND CULTURE
Until the mid-1800s, the tribes of Fiji lived a life of faith under the tenets of a rich and complex primitive religion, based on oral tradition and incorporating human sacrifice and cannibalism. With the appearance of Methodist missionaries, and the conversion of the paramount chief Cakobou, the gradual march of world religions into Fiji began. The legacy of the arrival of indentured Indian labourers, commencing in the late 1800s and ending in the early 1900s, has resulted in a multi-faith society whereby 64 percent of the population are Christians, 27 percent Hindu, and the majority of the remainder are Muslim and Sikh (FBoS 2013). Of the various Christian religions, near 80 percent are iTaukei and 54 percent of the total population, are Methodist. Official public holidays in the country include Easter, Christmas, Diwali and the birthday of the Prophet Mohammed.
Today, Fiji is clearly a multi-racial and multi-cultural society. From Melanesian and Polynesian origins, the iTaukei, or original tribal inhabitants, led a communal life based on the yavusa (extended family) and the vanua (land), under the rigid rule of a hierarchy of chiefs. After nearly 100 years of British colonisation, beginning in 1874, including 36 years of immigration, under the Indian indentured labour scheme known as girmet (agreement), the population now comprises iTaukei, Indian, European and Chinese peoples, and other smaller groups.

Research into the Financing of TVET in the Pacific Fiji Country Report
20
In essence, Fijian culture consists of two streams: the iTaukei and the Indo-Fijian. Parts of these intertwine and coincide, but at root the basics of language, music, arts, literature, cuisine, social practices (customs, traditions, habits, mores), religions and dress of the two differ. Earlier commentators used the ‘melting pot’ metaphor to describe Fijian culture, although more thoughtful writers have chosen the ‘salad bowl’. In this version of the story, the largely wholesome and mostly healthy whole is made up of a number of significant, different and complimentary components.
3.3 GEOGRAPHY
The Republic of the Fiji Islands has 332 habitable islands, covering 18,272 km2, set in several different island chains (see Figure 3.1). Located in the South Pacific, between Hawaii in the north and New Zealand in the south, its nearest neighbours are Vanuatu to the west, and Tonga to the East. Of the 100 inhabited islands, the main islands of Viti Levu and Vanua Levu are home to 80 percent of the total population of approximately 860,000.The capital Suva is located on Viti Levu.
Size and central location in the South Pacific make Fiji a regional transport hub and a focal point for regional affairs, with the 22 member country SPC (Secretariat of the Pacific Community), the 16 member country PIF (Pacific Island Forum) Secretariat, the main campus of the 12 country owned USP (University of the South Pacific), and the 10 country coverage UN Sub-regional Office, all located in Suva.
The terrain consists mainly of mountains of volcanic origin with some of the smaller islands based on coral reefs and atolls. Only 11 percent of the total land mass is arable. Fiji’s exclusive economic zone (EEZ) covers 1.3 million sq km, and the International Dateline curves around the flank of the country to the east. Fiji is therefore one of the first countries to experience a new calendar day. The small island of Rotuma, a Fijian dependency and home to some 2,000 people, lies 450 km to the north of Fiji.
Figure 3.1 Map of the Fiji Islands

Research into the Financing of TVET in the Pacific Fiji Country Report
21
CHAPTER 4. DEMOGRAPHY
Since the first census was taken in 1881 the typical intercensul period has been ten years. The most recent census was conducted in 2007, and it remains the most up-to-date source of demographic information for Fiji.
The 2007 census counted the population of Fiji at 837,271 (FBoS 2012). Community service organisations (CSOs) critical of the reliability of the census, put the number at closer to 900,000. The majority of the population, at 56 percent, are iTaukei, 37 percent are Indo-Fijian, and the remaining 6 percent are classified as ‘others’. These are made up of Chinese, European, Part European, Rotuman, other Pacific islanders, and other nationalities. Males comprise 51 percent of the total population, and females 49 percent. Children (0-14 years old) make up 29.1 percent of the population, young adults (15-35 years old) 36.8 percent, and older age groups 34.1 percent.
Table 4.1 shows the shift in ethnic composition over the period 1881 to 2007. There is a decline in iTaukei numbers in the first 60 years (mainly due to imported diseases; see Scarr 1984), and a decline after 1986 in the 40 year dominance of the Indo-Fijian population (attributable to emigration after the 1987 coups).
Table 4.1 Census population of Fiji by ethnicity, 1881 to 2007
Census iTaukei Indian European Part
European Chinese
All Others
Total
Intercensul annual change
(percent)
1881 114,748 588 2,671 771 - 8,708 127,486 -
1891 105,800 7,468 2,036 1,076 - 4,800 121,180 -0.5
1901 94,397 17,105 2,459 1,516 - 4,647 120,124 -0.1
1911 87,096 40,286 3,707 2,401 305 5,746 139,541 1.5
1921 84,475 60,634 3,878 2,781 910 4,588 157,266 1.2
1936 97,651 85,002 4,028 4,574 1,751 5,373 198,379 1.6
1946 118,070 120,414 4,594 6,142 2,874 7,544 259,638 2.7
1956 148,134 169,403 6,402 7,810 4,155 9,833 345,737 2.9
1966 202,176 240,960 6,590 9’687 5,149 12,165 476,727 3.3
1976 259,932 292,896 4,929 10,276 4,652 15,383 588,068 2.1
1986 329,305 348,704 4,196 10,297 4,784 18,089 715,375 2.0
1996 393,575 338,818 3,103 11,685 4,939 22,957 775,077 0.8
2007 475,739 313,798 2,953 10,771 4,704 29,306 837,271 0.7
Source: FBoS 2013

Research into the Financing of TVET in the Pacific Fiji Country Report
22
The ratio of rural to urban population decreased in the intercensul period 1996 to 2007, as shown in Table 4.2.
Table 4.2 Urbanisation of the Fijian population, 1996 and 2007
Year Total
population Rural population Urban population
1996 775,077 415,582 54% 359,495 46%
2007 837,271 412,425 49% 424,846 51%
Source: FBoS 2010

Research into the Financing of TVET in the Pacific Fiji Country Report
23
CHAPTER 5. LANGUAGE LITERACY AND EDUCATION
5.1 LANGUAGE AND LITERACY
The three official languages of Fiji are English, Fijian (Bau) and (Fiji) Hindustani. English was introduced early in the 19th century. It is the language of government and the principal language of literacy. Fijian is comprised of a number of minority languages. However, many of them are endangered, and Bau is now the most widely spoken. Hindi came to Fiji with the girmiteers, beginning in 1879.
Reported literacy rates vary, and measures of literacy are not standardised, however, with the world literacy at approximately 84 percent (UNESCO UIS 2012), Fiji, as shown in Table 5.1, compares favourably.
Table 5.1 Adult literacy rates in Fiji, by gender, 1996 and 2007
Census year Male Female Total
1996 96.6 percent 93.6 percent 95.1 percent
2007 98.7 percent 98.6 percent 98.7 percent
Note: FBoS defines adult literacy as individuals aged 15 and over who can read and write. Source: FBoS, 2010
5.2 EDUCATION SYSTEM
The GoF places great store in education. In addition to the People’s Charter for Change, Peace and Progress (2008), and the Roadmap for Democracy and Sustainable Socio-Economic Development 2012-2014 (2009), the National Strategic Human Resources Plan 2011-2015 (2011), and the Education Sector Strategic Development Plan 2012-2014 (nd) emphasise the means and methods to achieve the aim of making Fiji a knowledge-based society. TVET is given particular attention in these prescriptions, and is acknowledged as a cornerstone of reform in the educational sector and as a means of supporting sustainable development. In keeping with all of this, the new constitution now enshrines the citizen’s right to early childhood, primary, secondary, and further education.
(a) Structure of the education system in Fiji
Education in Fiji rests on a typical four level framework of early childhood, primary, secondary and tertiary education. There are nearly 900 schools and over 700 kindergartens in the country, and 98 percent of these are owned and managed by CSOs (MoE 2013). Tertiary education, usually referred to as higher education in Fiji, covers TVET and university streams. Provision here is by government, private for profit, enterprise and CSO including faith-based institutions. The overall education and training system is shown in Figure 5.1 and further outlined below.

Research into the Financing of TVET in the Pacific Fiji Country Report
24
Figure 5.1 Fiji education and training system
Form 6 (FSLC)
Mainstream
secondary
school
Vocational
schools
Form 5
Form 4
Form 3
Grade 8
Primary school
Grade 7
Grade 6
Grade 5
Grade 4
Grade 3
Grade 2
Grade 1
ECE Kindergarten school
Postgraduate degrees and
diplomas
[FQF levels 8, 9 and 10] USP, UoF
and FNU
Bachelor degree
[FQF level 7][
Diplomas [FQF levels 5 and 6]
Certificates [FQF levels 3 and 4]
FNU and
USP
Bridging – Form 7
free and compulsory
APTC
Theological colleges
FHEC recognised and
registered private training
providers
Other government
ministry and agency
training programs
eg MoFF forestry training
centre
Training programs for out-of-school youth, the unemployed and the disabled [eg, YTCs, CATD, FVTTCPD, NEC employment training]
Community and continuing education
courses [eg RCCCE and CETC]

Research into the Financing of TVET in the Pacific Fiji Country Report
25
(b) Basic education
Christianity, and through it the Bible, was the early engine of literacy in Fiji. The missionaries also introduced formal schooling, as prior to that learning was an informal, day-to-day activity, with a practical and vocational orientation. There are around 720 primary schools, 20 special schools and 170 secondary schools in the country (MoE 2013). Of the latter, all offer some TVET subjects as part of the curriculum, 87 have full TVET programs, and 12 are wholly owned, operated and funded by the MoE. Only two primary schools are government- owned and operated (MoE 2013).
In the main, MoE provides the teachers for all schools, pays their salaries and sets the academic and vocational curriculum. They also make an operating grant to the schools based on a per student funding formula. Salaries for diploma qualified practitioners range between FJ$10,000 per annum up to FJ$23,000 for a degree qualified head of school or principal. Teachers hired by a school management committee frequently earn little more than FJ$100 per week.
Fiji has a 1:8:5 (kindergarten-primary-secondary) education model, with MoE policy prescribing that attendance to Form 6/Grade 12 is compulsory. Form 7/Grade13 is a foundation year for tertiary studies. The most recent figures on school attendance are available in the 2010-11 Employment and Unemployment Survey (EUS) Preliminary Findings (FBoS 2013). These show that attendance at pre-school or kindergarten, which is voluntary, is at just under half of the relevant age group, and that almost universal primary education has been achieved. Table 5.2 also indicates that at the secondary school ages of 14 to 18 years, there has been a significant increase in attendance since the 2004-05 EUS.
Table 5.2 Percentages of age groups attending school, 2004-5 to 2010-11
Age group (years) 2004-05 2010-11 Percent Change
A 0-4 6 1 -79
B 5 (ECE) 35 47 36
C 6-13 (Primary) 96 99 4
D 14-18 (Secondary 82 88 7
E 19-21 (Tertiary) 37 40 7
Source: FBoS 2013
The EUS also identified an estimated 3,500 persons aged 6-17 who were reported to have left school. Most of these were aged 10-14 when they did so. The main reasons for leaving school were:
not interested – 36.2 percent;
cannot afford – 31.9 percent;
disability/illness – 8.3 percent;
family did not allow – 5.0 percent;
to help at home – 2.5 percent;
to work as unpaid family worker – 1.5 percent; and
other reasons – 15.5 percent.
Pupil-teacher ratios for Fiji are shown in Table 5.3. These are a proxy education quality and resourcing indicator. It is worth noting that, on average, over 50 applications were received for each advertised teaching post in 2012 (MoE 2013).

Research into the Financing of TVET in the Pacific Fiji Country Report
26
Table 5.3 Pupil-teacher ratios in primary and secondary schools, 1998 and 2011
Level of schooling 1998 2011
Primary 25.2:1 30.8:1
Secondary 23.0:1 26.5:1
Source: World Bank via Quandl 2014
Recent changes to school administration include:
external, high-stakes, pass/fail examinations at Grades 6 and 8, and Form 4 were cancelled in favour of continuous, school- and class-based assessment in 2009, partly in order to reduce student dropout and push-out rates;
fee-free schooling, bus fares and meal vouchers have also been introduced in order to improve enrolment, persistence and transition numbers;
compulsory attendance up to Form 6 became MoE policy in 2009; and
BEST (the Basic Employment Skills Training) Program, a first step in mainstreaming TVET into the education system, starting with secondary school, was introduced in 2012.
Student enrolments in 2012, from Grade 1 to Form 7, are given in Table 5.4. The terminology ‘Forms 1 and 2’ is gradually being replaced by ‘Grades 7 and 8’.
Key outcomes in education reported by the MoE (2013) for 2012 were:
pre-school enrolment at 9,577 was 57.16 percent of the eligible population;
133,040 students, up 1.3 percent from 2011, were enrolled in the country’s 721 primary and 17 special schools;
student numbers in secondary schools were down 2.6 percent to 68,425, from an estimated eligible population of 79,518;
Form 7 is offered in 152 secondary schools; and
of the 6,483 students who sat Form 7 exams, 75.8 percent passed with 50 percent or more of the mark, and 32 percent passed with at least 63 percent of the mark (thereby allowing for direct entry into a university degree program).

Research into the Financing of TVET in the Pacific Fiji Country Report
27
Table 5.4 Student enrolments, Grade 1 to Form 7, by gender, 2012
Primary School Secondary School Male Female Total Numbers
Grade 1 9,264 8,692 17,956
Grade 2 8,979 8,496 17,475
Grade 3 9,101 8,476 17,577
Grade 4 8,689 8,104 16,793
Grade 5 8,525 8,021 16,546
Grade 6 8,435 7,986 16,421
Grade 7 Form 1 8,183 7,611 15,794
Grade 8 Form 2 8,179 7,797 15,976
Form 3 8,060 7,794 15,854
Form 4 7,265 7,512 14,777
Form 5 7,300 7,525 14,825
Form 6 6,259 7,186 13,445
Form 7 2,729 3,879 6,608
Total - 100,968 99,079 200,047
Source: MoE 2013
(c) Post-school education and training (PSET)
The post-school education and training sector in Fiji (see Chapter 2, Table 2.1) includes:
one public university (FNU);
one private university (UoF);
two regional institutions (USP and APTC);
20 theological colleges;
a range of training centres run by line Ministries;
a regulatory body (FHEC); and
nearly 50 private training providers, of which 27 have been identified as TVET providers.
Each of these is introduced here, and the institutions and agencies of particular relevance to this study are discussed in detail in Chapter 8.
Fiji National University
FNU is an institution that came into formal existence in 2010, with the amalgamation of seven institutions offering PSET programs, some of which have been in existence for over one hundred years. The university comprises five colleges and a centre:
College of Medicine, Nursing and Health Sciences (former Fiji School of Medicine and Fiji School of Nursing);
College of Agriculture, Fisheries and Forestry (former Fiji College of Agriculture);
College of Engineering, Science and Technology (former Fiji Institute of Technology);
College of Business, Hospitality and Tourism Studies;
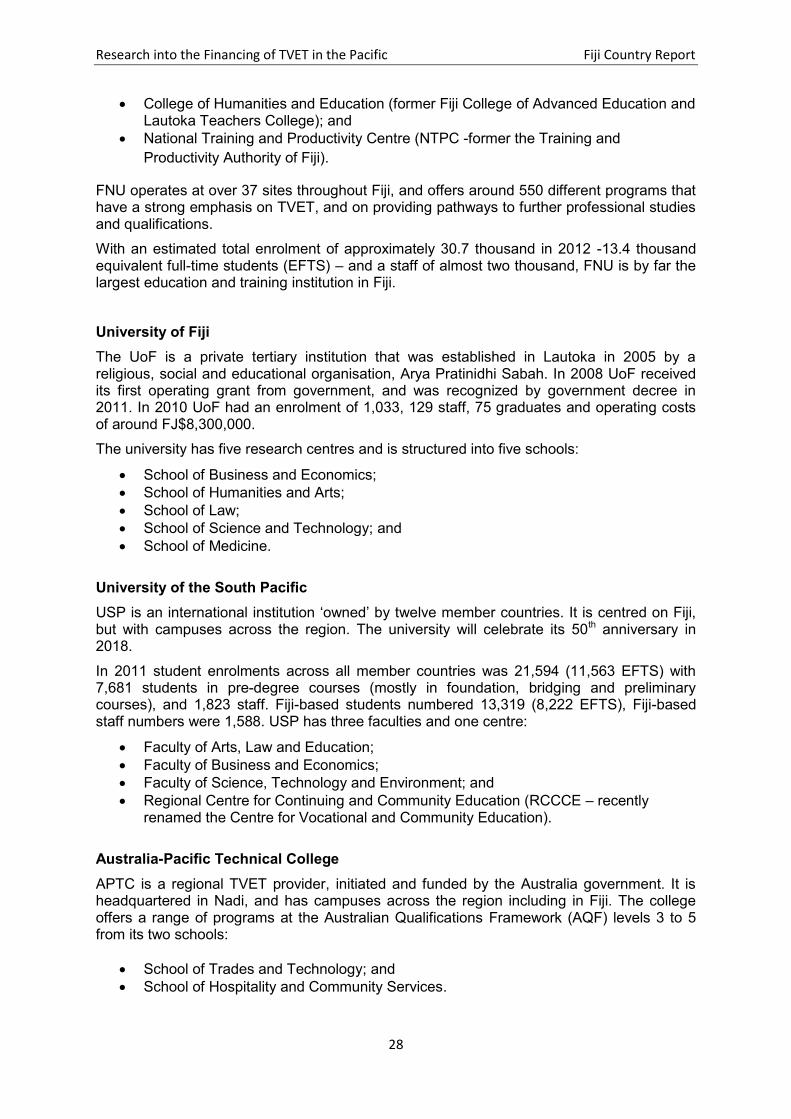
Research into the Financing of TVET in the Pacific Fiji Country Report
28
College of Humanities and Education (former Fiji College of Advanced Education and Lautoka Teachers College); and
National Training and Productivity Centre (NTPC -former the Training and
Productivity Authority of Fiji).
FNU operates at over 37 sites throughout Fiji, and offers around 550 different programs that have a strong emphasis on TVET, and on providing pathways to further professional studies and qualifications.
With an estimated total enrolment of approximately 30.7 thousand in 2012 -13.4 thousand equivalent full-time students (EFTS) – and a staff of almost two thousand, FNU is by far the largest education and training institution in Fiji.
University of Fiji
The UoF is a private tertiary institution that was established in Lautoka in 2005 by a religious, social and educational organisation, Arya Pratinidhi Sabah. In 2008 UoF received its first operating grant from government, and was recognized by government decree in 2011. In 2010 UoF had an enrolment of 1,033, 129 staff, 75 graduates and operating costs of around FJ$8,300,000.
The university has five research centres and is structured into five schools:
School of Business and Economics;
School of Humanities and Arts;
School of Law;
School of Science and Technology; and
School of Medicine.
University of the South Pacific
USP is an international institution ‘owned’ by twelve member countries. It is centred on Fiji, but with campuses across the region. The university will celebrate its 50th anniversary in 2018.
In 2011 student enrolments across all member countries was 21,594 (11,563 EFTS) with 7,681 students in pre-degree courses (mostly in foundation, bridging and preliminary courses), and 1,823 staff. Fiji-based students numbered 13,319 (8,222 EFTS), Fiji-based staff numbers were 1,588. USP has three faculties and one centre:
Faculty of Arts, Law and Education;
Faculty of Business and Economics;
Faculty of Science, Technology and Environment; and
Regional Centre for Continuing and Community Education (RCCCE – recently renamed the Centre for Vocational and Community Education).
Australia-Pacific Technical College
APTC is a regional TVET provider, initiated and funded by the Australia government. It is headquartered in Nadi, and has campuses across the region including in Fiji. The college offers a range of programs at the Australian Qualifications Framework (AQF) levels 3 to 5 from its two schools:
School of Trades and Technology; and
School of Hospitality and Community Services.

Research into the Financing of TVET in the Pacific Fiji Country Report
29
Enrolments in APTC programs offered in Fiji in 2011-2012 totalled 780, and graduations 430. The college operates in close cooperation with local partners in each of its campus countries, and pursues a policy of nationalisation of TVET provision, both within its own operations and in concert with national providers. Theological colleges
The various theological colleges throughout Fiji offer certificate, diploma, undergraduate and postgraduate courses in religion, theology, Islamic studies, biblical studies and/or divinity. Programs are delivered in face-to-face, distance, full-time and part-time modes. A number of the larger institutions are regional providers, and some have residential facilities. A few of the institutions (see Fulton College for example) provide theological programs and more standard academic programs. However there is no theological college that falls within the scope of this study.
Line ministry training centres
Table 5.5 identifies the line Ministries that have training centres and programs. Those that are within the scope of this study are discussed in detail in Chapter 8. Fiji Higher Education Commission
FHEC is a six-member commission appointed in early 2010 under the head of the Higher Education Promulgation 2008. Its overarching role is to safeguard the interests of students, parents, providers and the nation in their investment in education and training. FHEC is working to bring much needed order to the rather complicated arrangements for tertiary education in Fiji. One of their initiatives is the regulation of providers, and this is being achieved through a process of recognition and registration. Under the relevant legislation, it is illegal for an award-conferring institution offering post-secondary education and training to operate in the country without recognition and registration.
Recognition is the first step in the process, and this puts in place a number of steps to ensure that an applying institution possess the features that identify them as the type of institution they purport to be. The FHEC website lists 68 providers/institutions (including the three universities) as recognised, five in process, four declined and two as withdrawn (FHEC 2013).
After recognition, an institution applies for registration. This step includes a site visit and examination of evidence on administration, legal structure, management, learning programs, sites/centres, student numbers, staff numbers and qualifications, infrastructure, finances, student services, and safety and security. FHEC has registered 22 institutions (including APTC and USP), one institution is provisionally registered, one has been declined, 30 are in various stages of processing, and one has withdrawn (FHEC 2013).
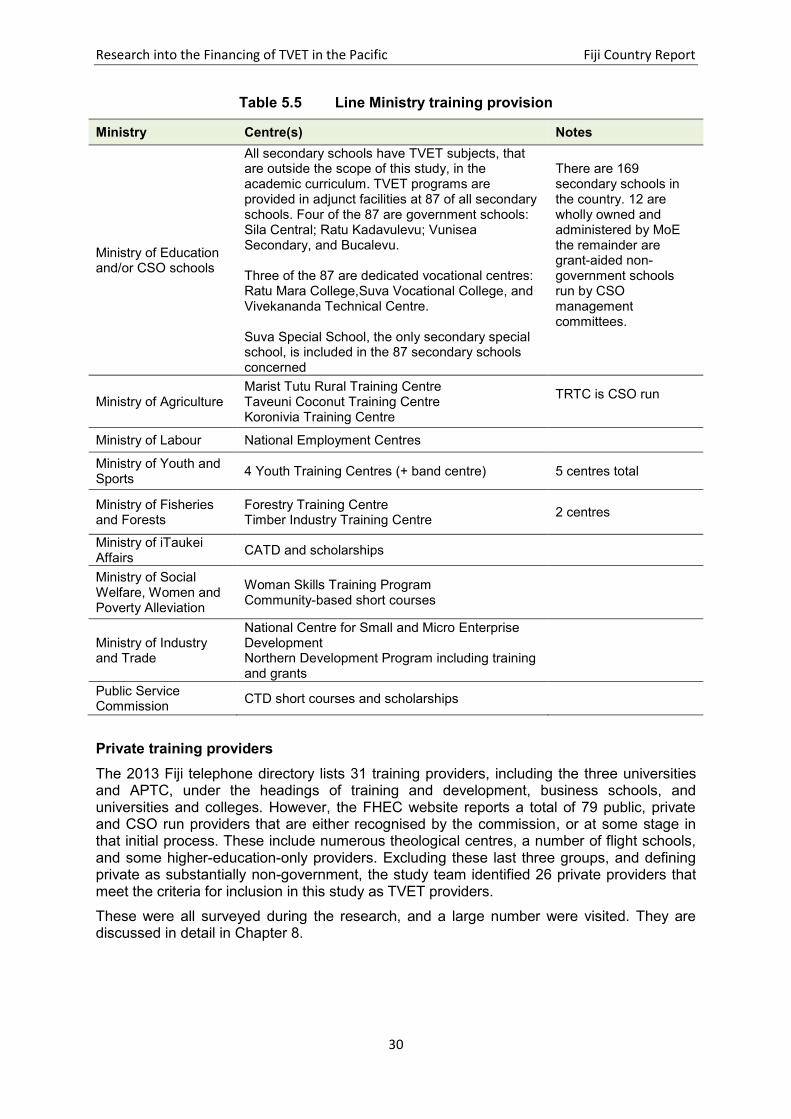
Research into the Financing of TVET in the Pacific Fiji Country Report
30
Table 5.5 Line Ministry training provision
Ministry Centre(s) Notes
Ministry of Education and/or CSO schools
All secondary schools have TVET subjects, that are outside the scope of this study, in the academic curriculum. TVET programs are provided in adjunct facilities at 87 of all secondary schools. Four of the 87 are government schools: Sila Central; Ratu Kadavulevu; Vunisea Secondary, and Bucalevu. Three of the 87 are dedicated vocational centres: Ratu Mara College,Suva Vocational College, and Vivekananda Technical Centre. Suva Special School, the only secondary special school, is included in the 87 secondary schools concerned
There are 169 secondary schools in the country. 12 are wholly owned and administered by MoE the remainder are grant-aided non-government schools run by CSO management committees.
Ministry of Agriculture Marist Tutu Rural Training Centre Taveuni Coconut Training Centre Koronivia Training Centre
TRTC is CSO run
Ministry of Labour National Employment Centres
Ministry of Youth and Sports
4 Youth Training Centres (+ band centre) 5 centres total
Ministry of Fisheries and Forests
Forestry Training Centre Timber Industry Training Centre
2 centres
Ministry of iTaukei Affairs
CATD and scholarships
Ministry of Social Welfare, Women and Poverty Alleviation
Woman Skills Training Program Community-based short courses
Ministry of Industry and Trade
National Centre for Small and Micro Enterprise Development Northern Development Program including training and grants
Public Service Commission
CTD short courses and scholarships
Private training providers
The 2013 Fiji telephone directory lists 31 training providers, including the three universities and APTC, under the headings of training and development, business schools, and universities and colleges. However, the FHEC website reports a total of 79 public, private and CSO run providers that are either recognised by the commission, or at some stage in that initial process. These include numerous theological centres, a number of flight schools, and some higher-education-only providers. Excluding these last three groups, and defining private as substantially non-government, the study team identified 26 private providers that meet the criteria for inclusion in this study as TVET providers.
These were all surveyed during the research, and a large number were visited. They are discussed in detail in Chapter 8.

Research into the Financing of TVET in the Pacific Fiji Country Report
31
CHAPTER 6. ECONOMY AND LABOUR FORCE
6.1 STAGE OF ECONOMIC DEVELOPMENT
Fiji is a middle-income country, with a small open economy. The minimum wage is just over FJ$2.00 per hour, and the current government is proposing a new minimum of FJ$2.55 per hour to be phased in by 2015 (Nasiko 2013). On the UNDP Human Development Index (2012) it is placed 96th out of 187 countries. Although it is one of the more advanced nations in the Pacific, it remains a developing country, with a sizable and persistent trade and current account deficit, a large subsistence agricultural sector, and 31 percent of its population living below the national poverty line (ADB 2013).
Fiji has a ‘doing business’ (DB) rating that places it 60th out of 185 countries evaluated by the World Bank (2013). The country exports sugar, water, garments, timber and gold with most foreign exchange earnings coming from tourism, FJ$1,303.4 million and 660,590 international visitors in 2012 (FBoS 2013); remittances from overseas workers, FJ$305.8 million in 2012 (Whiteside cited in Panapasa 2013); and sugar, FJ$190 million in 2012 (www.sugarinfo.co.uk).
While the 2006 coup, food and fuel price increases in 2008, and the 2009 global financial crisis have tended to hold the economy back, Fiji is nevertheless expected to grow by 3.2 percent this year, up from budget estimate of 2.7 percent (Whiteside 2013). The governor of the Reserve Bank of Fiji (RBF), Mr Barry Whiteside, recently mentioned that he has ‘not seen the numbers looking this good for a long time’ all the while noting that ‘Fiji can do better’ (Whiteside 2013).
Table 6.1 shows the major economic indicators for Fiji over the period 2008 to 2012.
Table 6.1 Fiji economic indicators, 2008 to 2012
Indicator 2008 2009 2010 2011 2012
Per capita GNI, Atlas method ($) 4,030 3,890 3,610 3,720 4,200
GDP growth ( percent change per year) 1.1 -1.3 0.1 1.9 2.5
CPI ( percent change per year) 7.8 3.7 5.5 8.7 4.3
Fiscal balance ( percent of GDP) 0.5 -4.0 -2.1 -1.4 -1.6
Export growth ( percent change per year) 20.4 -32.1 38.9 29.0 5.1
Import growth ( percent change per year) 20.8 -37.3 24.7 23.6 2.2
Current account balance (percent of GDP) -17.4 -5.2 -7.5 -7.0 -6.1
External debt ( percent of GNI) 8.8 8.1 9.2 14.5 No data
Source: ADB 2013 and World Bank 2013
GDP for 2012 was US$4 billion and GDP per capita was US$4,445 (DFAT Fact sheet 2013). The level of investment in the economy was 18 percent of GDP for that year and is estimated at 28 percent for 2013. This is made up of private investment at 13 percent, public at 10 percent and government at 5 percent. In August 2013 foreign exchange reserves stood at 5.2 months of imports or FJ$1.84 billion (Whiteside 2013).
Table 6.2 shows the Fiji performance against a number of development indicators including some Millennium Development Goals.
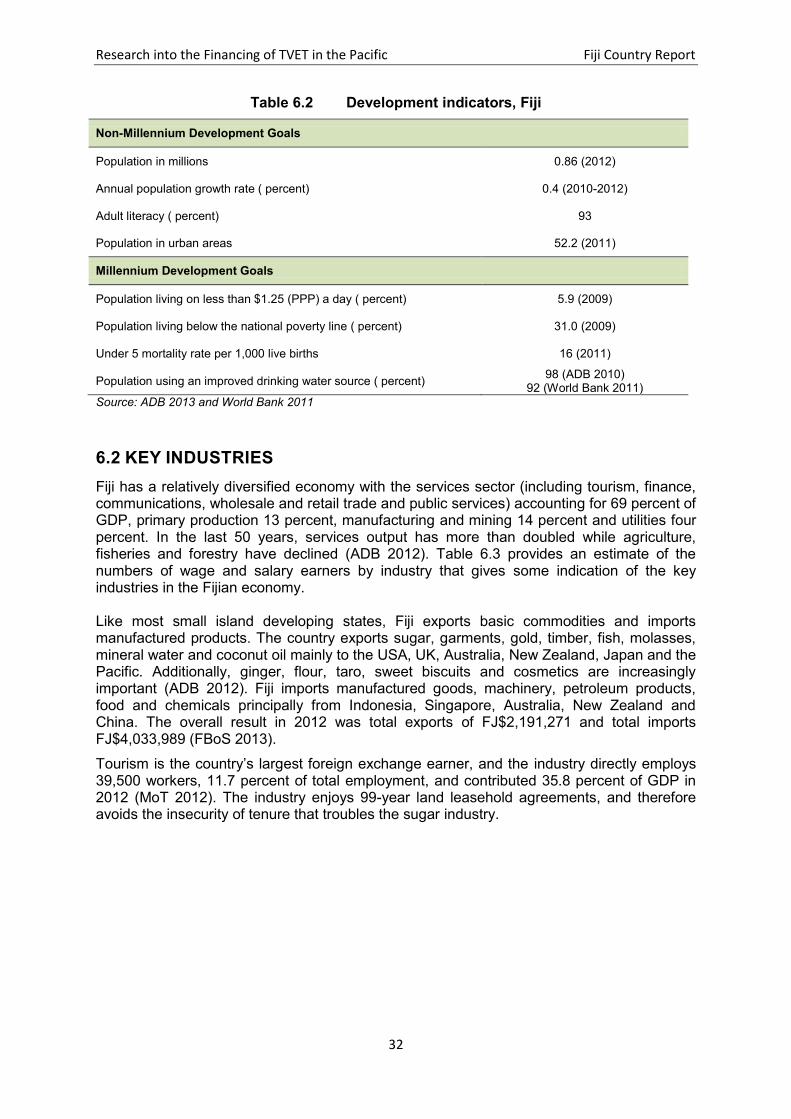
Research into the Financing of TVET in the Pacific Fiji Country Report
32
Table 6.2 Development indicators, Fiji
Non-Millennium Development Goals
Population in millions 0.86 (2012)
Annual population growth rate ( percent) 0.4 (2010-2012)
Adult literacy ( percent) 93
Population in urban areas 52.2 (2011)
Millennium Development Goals
Population living on less than $1.25 (PPP) a day ( percent) 5.9 (2009)
Population living below the national poverty line ( percent) 31.0 (2009)
Under 5 mortality rate per 1,000 live births 16 (2011)
Population using an improved drinking water source ( percent) 98 (ADB 2010)
92 (World Bank 2011)
Source: ADB 2013 and World Bank 2011
6.2 KEY INDUSTRIES
Fiji has a relatively diversified economy with the services sector (including tourism, finance, communications, wholesale and retail trade and public services) accounting for 69 percent of GDP, primary production 13 percent, manufacturing and mining 14 percent and utilities four percent. In the last 50 years, services output has more than doubled while agriculture, fisheries and forestry have declined (ADB 2012). Table 6.3 provides an estimate of the numbers of wage and salary earners by industry that gives some indication of the key industries in the Fijian economy. Like most small island developing states, Fiji exports basic commodities and imports manufactured products. The country exports sugar, garments, gold, timber, fish, molasses, mineral water and coconut oil mainly to the USA, UK, Australia, New Zealand, Japan and the Pacific. Additionally, ginger, flour, taro, sweet biscuits and cosmetics are increasingly important (ADB 2012). Fiji imports manufactured goods, machinery, petroleum products, food and chemicals principally from Indonesia, Singapore, Australia, New Zealand and China. The overall result in 2012 was total exports of FJ$2,191,271 and total imports FJ$4,033,989 (FBoS 2013).
Tourism is the country’s largest foreign exchange earner, and the industry directly employs 39,500 workers, 11.7 percent of total employment, and contributed 35.8 percent of GDP in 2012 (MoT 2012). The industry enjoys 99-year land leasehold agreements, and therefore avoids the insecurity of tenure that troubles the sugar industry.

Research into the Financing of TVET in the Pacific Fiji Country Report
33
Table 6.3 Estimated numbers of wage and salary earners, by industry, 1996 and 2007
Industry 1996 2007
Agriculture, Forestry and Fishing 1,980 1,193
Mining and Quarrying 2,308 101
Manufacturing 24,635 19,620
Electricity and Water 1,864 2,263
Construction 5,728 8,030
Wholesale and Retail Trade and Restaurants and Hotels 20,730 26,048
Transport, Storage and Communication 9,790 9,183
Finance, Insurance, Real Estate and Business Services 7,207 7,787
Community, Social and Personal Services 35,839 42,410
Total 110,081 116,635
Source: FBoS 2012
Nearly a quarter of the population of Fiji, including 16,000 contracted growers, depends upon the sugar industry. It produced 160,000 tonnes of sugar in 2012, for a gross figure of FJ$190 million (www.sugarinfo.co.uk, www.sugaronline.com and FBoS 2013). Most cane is cut by hand, and farmed on leased smallholdings by Indo-Fijian farmers.
Current government policies place a priority on food security programs, import substitution – particularly rice, potato, fruit, vegetable, livestock feed, dairy, beef and lamb – and export promotion and value adding to primary produce (MoF 2012). Investment Fiji, created in 1980, is a statutory organisation and the marketing arm of the GoF. It is charged with promoting, stimulating and facilitating the economic development of the country. The organisation is promoting exports in sugar, fish, coconuts, taro, cassava, copra, pawpaw, ginger, pulses, herbs, garments, mineral water, gold, timber (including mahogany and palm wood furniture), and virgin coconut oil. Sector profiles for exporters and investors have been developed in agriculture, fisheries, forestry, mineral and ground water, tourism, energy, film and ICT (www.investmentfiji.org.fj).
The Ministry of Industry and Trade (MoIT) formulates and implements policies and strategies in investment, trade, business development and consumer protection. It has trade commissions in Taiwan, Los Angeles, Shanghai and is considering an office in Australia. For some years MoIT has promoted a ‘Fiji Made-Buy Fiji’ campaign, and has over 600 products and 70 companies registered. The emphasis is on food, clothing and handicraft and furniture products that are substantially transferred in Fiji, however the range extends to paper goods, buses and skin care products (www.mit.gov.fj).
Fiji’s GDP was reported as US$3.8 billion in 2011 and the composition by sectors is shown in Table 6.4.

Research into the Financing of TVET in the Pacific Fiji Country Report
34
Table 6.4 Composition of GDP by sector, Fiji 2011 (%)
Sector percent of
GDP
Real Estate and Business Services 8
Public Administration and Defence 5
Education 5
Health and Social Work 1
Other Community, Social and Personal Service Activities 3
Agriculture and Forestry 9
Fishing 3
Mining and Quarrying 1
Manufacturing 16
Electricity and Water 2
Construction 3
Wholesale and Retail, Repair of Motor Vehicles, Motor Cycles and Personal and Household Goods
12
Hotels and Restaurants 7
Transport, Storage and Communication 15
Financial Intermediation 10
Source: FBoS 2013 see also MoF 2012
The Fijian economy is divided into the formal, wage, economy on the one hand and the informal economy on the other. The formal economy is based upon the public sector, and large corporations and small and medium-sized enterprises (SME) in the private sector. There are just over 6,500 employers registered in Fiji with NTPC (Batiratu 2013), and the Fiji Commerce and Employers Federation (FCEF) anecdotally reports 500 employers as members. FNU, Fiji Sugar, Air Pacific (now Air Fiji), Flour Mills of Fiji and Carpenters Fiji are commonly accepted as the five largest employers.
The country’s informal economy, generally defined as covering any economic activity or source of income that is not subject to government regulation and taxation, is mostly based upon subsistence farming, barter exchange, and small scale, often family-based micro-businesses – for example: primary produce, roadside stalls, canteens, transport, carpentry, mechanical repairs, handicrafts, sewn goods, shoe-shining, and market vending. In calculating GDP, subsistence farming, informal manufacturing and construction, owner occupied dwellings, and informal community, social and personal service activities are included. Informal forestry, fishing and agriculture activities are not (FBoS 2013). The result is that just 15 percent of GDP is attributable to the informal economy, but most jobs are to be found here (ADB 2008).

Research into the Financing of TVET in the Pacific Fiji Country Report
35
6.3 LABOUR FORCE PARTICIPATION AND PROFILE
The fieldwork indicated a serious shortage of up-to-date information regarding the labour force and employment in Fiji, without which a responsive TVET system, that is industry-led and demand-driven, cannot function effectively. Employment and Unemployment Surveys (EUS) such as those in 2004-05 and 2010-11, the ten-yearly censuses, and an annual employment survey of employers, last reported on in 2007, are not frequent enough or sufficient in their coverage to generate the required data (MoSPNDS 2011).
In acknowledging that more frequent surveys can be difficult to sustain, the MoSPNDS has established, with ILO and UNDP assistance, the Computerised Human Resource Information System (CHRIS). The system allows job seekers and employers to put information online and also contains reports and papers related to LMI (labour market information). Unfortunately CHRIS, like the Integrated Human Resource Development Program for Employment Promotion (IHRDP or IHRDPEP), also established in cooperation with the ILO, does not appear to have thrived.
This parlous state of labour market information (LMI) in Fiji is acknowledged at the highest levels:
Our knowledge of how the formal labour market operates in Fiji is still severely limited. Little analytical work has been undertaken on issues such as the nature and determinants of personal earnings differentials, including the returns to various human resource characteristics such as formal education, informal and formal training, and labour market experience; the extent to which the formal sector labour market is segmented according to institutional (public versus private) and personal (gender) characteristics; the impact of the past educational expansion; and the manner in which younger, more educated recruits are absorbed into the labour market. (MoSPNDS National Strategic Human Resources Plan 2011, p18)
The absence of concrete data almost guarantees that planning, for the fullest and most productive use of Fiji’s human and public resources, remains at the level of broad strategies rather than concrete actions. What information does exist points to problems of underemployment, skills shortages, exclusion, low productivity, and a labour force participation rate (LFPR) that is low by international standards (MoSPNDS 2011).
According to the 1996 Census the labour-force participation rate (LFPR) was at 38.4 percent of the total population (775,077) with unemployment at 3.7 percent. In 2007 the LFPR was 40 percent of the population (837,271) and unemployment was reported at 8.6 percent (MoSPNDS 2011). It is estimated that there are about 20,000 new labour force entrants each year, including approximately 10,000 school leavers, contending for 10,000 jobs in the formal economy (MoSPNDS 2011).
In 2007 women accounted for just over 30 percent (110,033 persons) of those regarded as economically active (ie in the labour force and either employed or looking for employment). This was 26.8 percent of the total female population. Economically active men (216,955 persons) made up over 50 percent of the total male population (FBoS 2013). Workers in poverty, those on less than FJ$60 per week, were mostly women at 44 percent of the economically active female population, with 32 percent of men classified as workers in poverty (FBoS 2013).
The 2010-11 EUS was an in-depth, conventional household sample survey, designed to gather detailed labour force information. The survey follows the 2004-05 EUS. Preliminary findings indicate that the labour force, those aged 15 and over, increased by 41,928 persons between the two surveys. They also show, as can be seen in Table 6.5, that while wage employment decreased in the period, salaried and self-employed respondents increased.
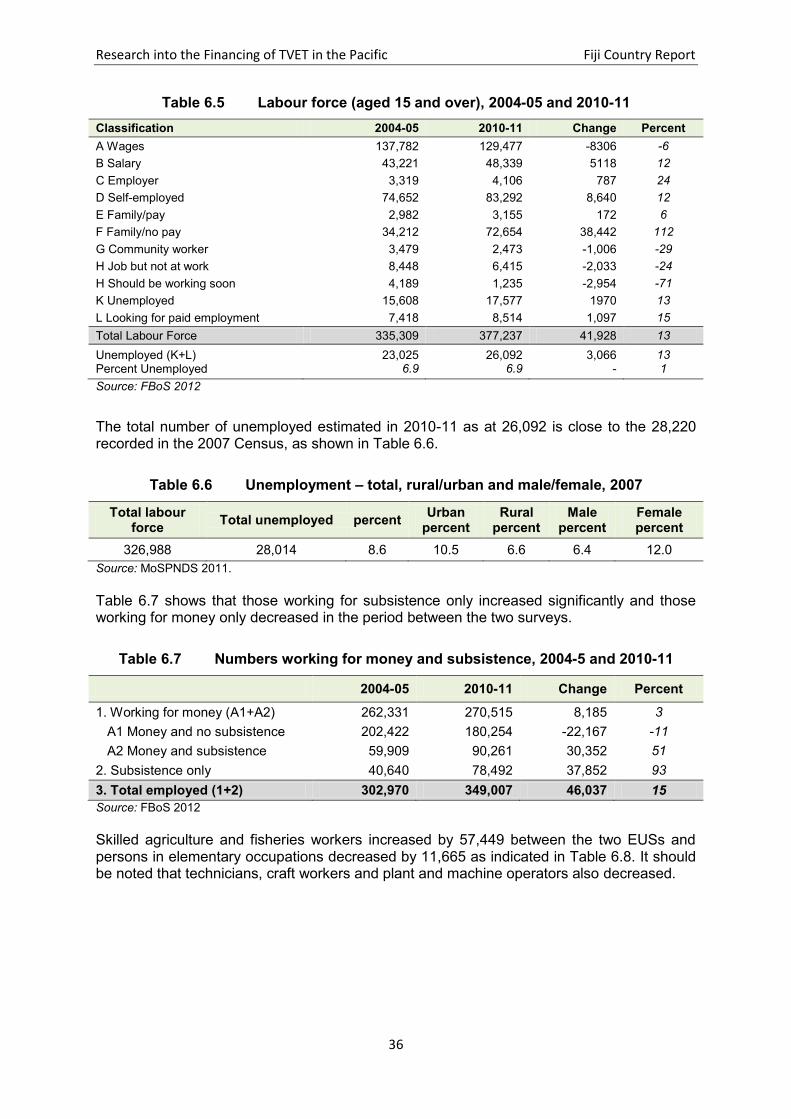
Research into the Financing of TVET in the Pacific Fiji Country Report
36
Table 6.5 Labour force (aged 15 and over), 2004-05 and 2010-11
Classification 2004-05 2010-11 Change Percent
A Wages 137,782 129,477 -8306 -6
B Salary 43,221 48,339 5118 12
C Employer 3,319 4,106 787 24
D Self-employed 74,652 83,292 8,640 12
E Family/pay 2,982 3,155 172 6
F Family/no pay 34,212 72,654 38,442 112
G Community worker 3,479 2,473 -1,006 -29
H Job but not at work 8,448 6,415 -2,033 -24
H Should be working soon 4,189 1,235 -2,954 -71
K Unemployed 15,608 17,577 1970 13
L Looking for paid employment 7,418 8,514 1,097 15
Total Labour Force 335,309 377,237 41,928 13
Unemployed (K+L) Percent Unemployed
23,025 6.9
26,092 6.9
3,066 -
13 1
Source: FBoS 2012
The total number of unemployed estimated in 2010-11 as at 26,092 is close to the 28,220 recorded in the 2007 Census, as shown in Table 6.6.
Table 6.6 Unemployment – total, rural/urban and male/female, 2007
Total labour force
Total unemployed percent Urban
percent Rural
percent Male
percent Female percent
326,988 28,014 8.6 10.5 6.6 6.4 12.0
Source: MoSPNDS 2011.
Table 6.7 shows that those working for subsistence only increased significantly and those working for money only decreased in the period between the two surveys.
Table 6.7 Numbers working for money and subsistence, 2004-5 and 2010-11
2004-05 2010-11 Change Percent
1. Working for money (A1+A2) 262,331 270,515 8,185 3
A1 Money and no subsistence 202,422 180,254 -22,167 -11
A2 Money and subsistence 59,909 90,261 30,352 51
2. Subsistence only 40,640 78,492 37,852 93
3. Total employed (1+2) 302,970 349,007 46,037 15
Source: FBoS 2012
Skilled agriculture and fisheries workers increased by 57,449 between the two EUSs and persons in elementary occupations decreased by 11,665 as indicated in Table 6.8. It should be noted that technicians, craft workers and plant and machine operators also decreased.

Research into the Financing of TVET in the Pacific Fiji Country Report
37
Table 6.8 Employment by occupational group, 2004-05 and 2010-11
Occupational group 2004-05 2010-11 Absolute
Change Percent Change
1 Legislators, senior officials and managers 15,873 19,009 3,136 20
2 Professionals 19,549 24,321 4,772 24
3 Technicians and associated professionals 18,705 15,536 -3,169 -17
4 Clerks 20,184 18,204 -1,980 -10
5 Service workers and shop and market sales 33,242 37,598 4,351 13
6 Skilled agriculture and fishery workers 79,716 137,165 57,449 72
7 Craft and related workers 38,809 33,292 -5,516 -14
8 Plant and machine operators and assemblers 24,807 24,148 -660 -3
9 Elementary occupations 55,455 43,790 -11,665 -21
Total 306,339 353,056 46,717 15
Source: FBoS 2012
Those who were classified as economically not active, including those doing full-time but unpaid household work, are shown in Table 6.9.
Table 6.9 Numbers not economically active (aged 15 & over), 2004-05 and 2010-11
Classification 2004-05 2010-11 Absolute
Change Percent Change
J Household work 128,410 103,676 -24,733 -19
K Retired/pensioner 14,106 10,383 -3,723 -26
L Disabled 3,644 5,115 1,471 40
Others (M, N, O, P) 17,071 17,356 285 2
X Full-time student 77,978 72,477 -5,501 -7
Y NAS school age 449 40 -409 -91
241,657 209,047 -32,611 -13
Source: FBoS 2012
Others (M, N, O, P) are not active due to old age, sickness, not looking for work and other reasons. The significant increase in those reporting as disabled is attributed to better social acceptance of the association. Decreases in full-time household workers are attributed to economic pressures during the period.
6.4 MAJOR IMPEDIMENTS TO ECONOMIC GROWTH
In common with most other small island developing states (SIDS), Fiji’s small population, geographical isolation, narrow industrial base, high infrastructure and transport costs, strong reliance on imports, and susceptibility to natural disasters and vulnerability to external shocks limits private sector employment opportunities (Farchy 2011). The challenges facing the country in recent times have been compounded by political instability, loss of preferential trade arrangements, non-renewal of land leases, natural disasters (including recent cyclones and flooding) and emigration (MoSPNDS 2011).
Emigration and the resultant ‘brain drain’ (Farchy 2011) has led to a loss of skilled labour, as just over 67,000 citizens emigrated from Fiji between 2000 and 2012 (FBoS 2013). International demand for workers in the security, care, nursing and teaching professions has coupled with the push factor of domestic political instability over the past 20 years to

Research into the Financing of TVET in the Pacific Fiji Country Report
38
significantly reduced the country’s supply of competent workers in most professions and trades (Farchy 2011 and MoSPNDS 2011). One study estimates the cost at FJ$44.5 million per year through loss of skills, re-training and position vacancies (MoSPNDS 2011).
Fiji has a large number of state owned enterprises (SOEs) accounting for 20 percent of the country’s total economic assets (ADB 2012). In the period of 2002-2009 SOE profits of US$18.6 million were US$ 5 million less than the government’s investment (ADB 2012). SOEs as monopolies can raise costs, use capital inefficiently and impede service delivery. In 2008, for example, the returns on private investment were almost seven times higher than returns on SOE investments in Fiji. In 2011 the Fiji Sugar Corporation, a major SOE, was delisted from the South Pacific Stock Exchange (SPSE) due to insolvency, based in part on a loss of FJ$175.1 million in 2010 and FJ$36.8 in 2009 (US Department of State and SPSE). The ADB is helping redress the management of SOEs and corporatisation, commercialisation and privatisation, are slowly being explored (ADB 2012).
Poverty was last measured in the 2008-2009 Household Income and Expenditure Survey at 31 percent of the population, and 26 percent of households (FBoS 2013). Recent estimates, including those from the Poverty Eradication Unit of the Office of Prime Minister, put it at 50 percent and even further from the MDG benchmark of 14.5 percent by 2015. The poor and the near poor in Fiji suffer psychological stress; have bad diets and poorer health outcomes; low schooling participation, persistence and completion rates; are more likely to be caught up in criminal activity; and their children are more likely to be poor. The vicious cycle of poverty strains government resources and represents a loss of human capital in the economy.
The issues of culture and tradition, particularly the clan-based sharing of wealth in iTaukei communities and the cultural norm of mutual support (Farchy 2011), and the customary ownership of land (and its inalienability) are seen to dampen individual enterprise and investment in Fiji. Indeed, the lack of secure access to land is considered a binding constraint across most of the economy and has had a particularly negative effect on the sugar industry. With only 10 percent of land available as freehold and the rest either subject to customary tenure or belonging to the state, Indo-Fijians are essentially landless, broad acre farming is difficult, and land hungry industry is severely constrained. Making more land available for productive and social purposes is a major policy initiative by the GoF under the Roadmap for Democracy and Sustainable Socio-Economic Development 2012-2014.
The final constraint on economic growth considered here is the shortage of competent workers in almost all professional and trade areas in Fiji (MoSPNDS 2011). Competent workers have the knowledge, skills and attitudes to make them safe and productive at work, in a job, and able to engage in lifelong learning. Achieving this involves training that is directly coupled to industry-based standards, properly resourced, and subject to rigorous quality assurance (ADB 2008). At its best, competency-based training, driven by job analysis, rather than curriculum prescription, has these characteristics. In addition, training should be linked to employer demand and not state supply, just in time (JIT) and not just in case, flexible and mostly practise-based, and, where possible and safe, it should be conducted on the job.

Research into the Financing of TVET in the Pacific Fiji Country Report
39
CHAPTER 7. THE PUBLIC SECTOR AND PUBLIC FINANCES
7.1 THE BUDGET
MoF publishes annual budget estimates of revenue and expenditure, the latest being for financial year 2013.10 The key documents are the Budget Estimates, and their companion, Economic and Fiscal Update – Supplement to the Budget Address.
Table 7.1 summarises the main budget parameters for 2012 and 2013.
Table 7.1 Government of Fiji budgets for 2012 and 2013
2012 2013
FJ$ thousand
percent of total
FJ$ thousand percent of total
ESTIMATED REVENUE:
Direct Taxes 477,427.40 24.6% 433,750.80 20.6%
Indirect Taxes 1,251,770.00 64.4% 1,418,872.30 67.3%
Cash Grants in Aid 17,960.00 0.9% 16,600.00 0.8%
Others 159,830.40 8.2% 163,411.60 7.8%
Total Operating Receipts 1,906,987.80 98.2% 2,032,634.70 96.4%
Total Investing Receipts 35,819.20 1.8% 75,774.20 3.6%
TOTAL ESTIMATED REVENUE 1,942,807.00 100.0% 2,108,408.90 100.0%
ESTIMATED EXPENDITURE:
Operating 1,462,440.10 70.4% 1,550,989.80 66.6%
Capital 554,431.20 26.7% 722,674.50 31.1%
Value Added Tax 61,058.10 2.9% 53,721.10 2.3%
TOTAL EST. EXPENDITURE 2,077,929.30 100.0% 2,327,385.30 100.0%
Estimated Net Deficit 135,122.30
218,976.40
Debt Repayments 203,314.50
179,997.00
Gross Deficit 338,436.80
398,973.40
Net Deficit As A Percent of GDP 1.90%
2.80%
Nominal GDP 7,223,737
7,744,976
Source: MoF Budget Estimates, 2012 and 2013
The salient features to emerge from Table 7.1 are:
The government has a net operating deficit, and this grew substantially from 2012 to 2013. Debt repayments eased, however, but not sufficiently to prevent the gross debt from increasing. Indeed, it rose from an estimated 1.9 percent of GDP in 2012 to 2.8 percent in 2013.
Indirect taxes, including value added tax (VAT) contribute around two-thirds of government revenue.
The contribution made by official development assistance (ODA) is not fully reflected in the budget estimates, since MoF operates a cash-based accounting system. Grants in Aid come in two forms – cash grants and grant aid-in-kind – and only the former is recorded in the budget estimates. The lion’s share of ODA to Fiji, classified as grant aid-in-kind, falls outside the consolidated annual budget (but see Section 7.2 below).
10
The Fiji financial year runs from January 1 to December 31.

Research into the Financing of TVET in the Pacific Fiji Country Report
40
Total investing receipts - comprising proceeds from the sale of government assets, bank interest and returns on capital investments – make only a small contribution towards meeting investing (capital) expenditure.
Operating (recurrent) expenditure accounts for two-thirds or more of the government budget.
Being a cash-based budgeting system, VAT (on government purchases of goods and services) is listed as an expenditure as well as a revenue item.
As Table 7.2 indicates, both government revenue raising and government spending increased substantially over the period 2010 to 2013, both nominally and as a percentage of GDP, reaching levels of 27 and 30 percent respectively. Over the same period, however, the budgetary deficit declined from 3.5 percent to 2.8 percent of GDP, and government debt fell back from 58 percent to 51.5 percent.
Table 7.2 Budget parameters as a percentage of GDP, 2010 to 2015
Budget Target
2010 2011 2012 2013 2014 2015
Revenue 1,486.5 1,745.7 1,942.8 2,108.4 2,142.2 2,222.6
as a % of GDP 23.6% 28.3% 26.9% 27.2% 26.3% 26.0%
Expenditure 1,706.7 1,961.7 2,077.9 2,327.4 2,345.8 2,350.8
as a % of GDP 27.1% 31.8% 28.8% 30.1% 28.8% 27.5%
Net Deficit -220.1 -206.0 -135.1 -219.0 -203.6 -128.2
as a % of GDP 3.5% 3.5% 1.9% 2.8% 2.5% 1.5%
Debt
3,593.9 3,698.2 3,987.8 4,191.4 4,319.6
as a % of GDP
58.1% 51.2% 51.5% 51.5% 50.5%
Source: Economic and Fiscal Update – Supplement to the Budget Address, 2010 to 2013
The government has signalled its intention to stabilise the budget over the forward estimates, as is evident in Figures 7.1 and 7.2. Its target over 2014 and 2015 is to halt the rise in both revenue-raising and spending, and thereby reduce the government share of GDP.
In recent years, targets have been set annually, but as Table 7.3 shows, meeting targets is another matter. Typically, targets have underestimated actual budgets, on both the revenue and expenditure sides, and the resultant deficit estimates have varied considerably.

Research into the Financing of TVET in the Pacific Fiji Country Report
41
Figure 7.1 Budget revenue and expenditure, 2010 to projected 2015
Source: Table 7.2.
Figure 7.2 Budget revenue and expenditure 2010 to projected 2015 as a % of GDP
Source: Table 7.2.

Research into the Financing of TVET in the Pacific Fiji Country Report
42
Table 7.3 Budget estimates and targets, 2010 to 2015
2010 2011 2012 2013 2014 2015
Revenue estimates
2010 budget 1,486.50 1,673.60 1,854.30
2011 budget
1,745.70 1,733.10 1,804.50
2012 budget
1,942.80 2,048.80 2,168.40
2013 budget
2,108.40 2,142.20 2,222.60
Expenditure estimates
2010 budget 1,706.60 1,841.00 1,996.90
2011 budget
1,961.70 1,925.70 1,971.60
2012 budget
2,077.90 2,162.60 2,288.40
2013 budget
2,327.40 2,345.80 2,350.80
Deficit estimates
2010 budget -220.10 -167.40 -142.60
2011 budget
-216.00 -192.60 -167.10
2012 budget
-135.10 -113.80 -120.00
2013 budget
-219.00 -203.60 -128.20
Budget
Target
Source: Economic and Fiscal Update – Supplement to the Budget Address, 2010 to 2013
7.2 THE CLASSIFICATION OF PUBLIC EXPENDITURE
Annual budget estimates classify government expenditure on a four-tier basis:
Heads
Programs
Activities
Standard expenditure groups (SEGs)
(i) budget heads
The Fiji Budget Estimates, 2013 identifies 40 budget heads. Mostly these correspond to government ministries and agencies, although there are a small number of miscellaneous areas of government expenditure that are also listed as budget heads. A Program Statement accompanies each budget head, to reflect its primary roles and responsibilities. The statement lists the head’s outputs and indicates their links to the overall targeted outcomes of the government.
(ii) programs
The budget estimates for each head are program based – each ministry and government agency’s expenditure estimates are categorised by program. Programs are groups of closely related services provided by the ministry or agency which contribute to a common objective or set of allied objectives.
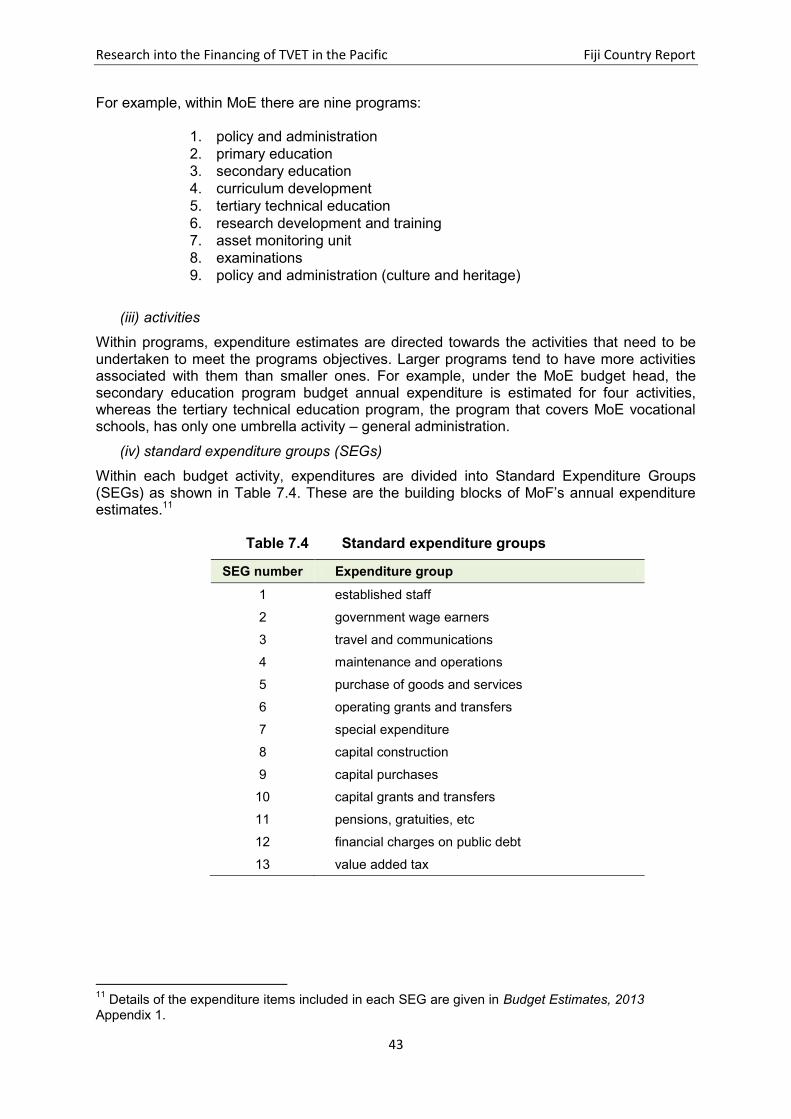
Research into the Financing of TVET in the Pacific Fiji Country Report
43
For example, within MoE there are nine programs:
1. policy and administration
2. primary education
3. secondary education
4. curriculum development
5. tertiary technical education
6. research development and training
7. asset monitoring unit
8. examinations
9. policy and administration (culture and heritage)
(iii) activities
Within programs, expenditure estimates are directed towards the activities that need to be undertaken to meet the programs objectives. Larger programs tend to have more activities associated with them than smaller ones. For example, under the MoE budget head, the secondary education program budget annual expenditure is estimated for four activities, whereas the tertiary technical education program, the program that covers MoE vocational schools, has only one umbrella activity – general administration.
(iv) standard expenditure groups (SEGs)
Within each budget activity, expenditures are divided into Standard Expenditure Groups (SEGs) as shown in Table 7.4. These are the building blocks of MoF’s annual expenditure estimates.11
Table 7.4 Standard expenditure groups
SEG number Expenditure group
1 established staff
2 government wage earners
3 travel and communications
4 maintenance and operations
5 purchase of goods and services
6 operating grants and transfers
7 special expenditure
8 capital construction
9 capital purchases
10 capital grants and transfers
11 pensions, gratuities, etc
12 financial charges on public debt
13 value added tax
11
Details of the expenditure items included in each SEG are given in Budget Estimates, 2013 Appendix 1.

Research into the Financing of TVET in the Pacific Fiji Country Report
44
SEGs 1 and 2 can be further grouped as ‘personnel expenditure’, and SEGs 3, 4, 5 and 7 together make up what is often termed as ‘maintenance and other operating expenditure (MOOE)’. SEGs 8 and 9 are capital expenditures, and SEGs 6 and 10 are, respectively, recurrent and capital grants and transfers, earmarked for other organisations. SEGs 11 and 12 are cross-cutting expenditures, not allocated to any one budget head. SEG 13 is the imputed cost of VAT on a ministry or agency’s purchases of goods and services, and is refunded to FRCA.12 Table 7.5 illustrates the range of aggregate levels of expenditure that are used throughout the MoF budget estimates, and what they comprise.
Table 7.5 Aggregations of expenditure applied in MoF budget estimates
Aggregation SEG
A. Net expenditure
Personnel expenditure 1+2
Maintenance and other operating expenditure (MOOE) 3+4+5+7
Net operating (recurrent) expenditure 1 to 5, +7
Net capital expenditure 8+9
Total net expenditure 1 to 5 + 7 to 9
B. Net expenditure plus transfers
Net operating (recurrent) expenditure 1 to 5, +7
Operating grants and transfers 6
Total allocated net operating expenditure 1 to 7
Net capital expenditure 8+9
Capital grants and transfers 10
Total allocated net capital expenditure 8 to 10
Total allocated net expenditure 1 to 10
C. Consolidated net expenditure
Total allocated net recurrent expenditure 1 to 7
Unallocated net recurrent expenditure 11 + 12
Total net recurrent expenditure 1 to 7 + 11 + 12
Total net capital expenditure 8 to 10
Consolidated net expenditure 1 to 12
D. Consolidated gross expenditure (inclusive of VAT)
Consolidated net expenditure 1 to 12
VAT 13
Consolidated gross expenditure 1 to 13
12
The only budget head that does not contain a separate VAT estimate is No.26 Higher Education Institutions. They pay the tax out of their grants and transfers.

Research into the Financing of TVET in the Pacific Fiji Country Report
45
7.3 PUBLIC EXPENDITURE PATTERNS
MoF budget estimates are made in the context of a five-year medium-term expenditure framework (MTEF), where actual expenditures of two-years before are compared with the revised estimates for one-year before, the estimates for the current year and target expenditures for the following two years. Table 7.6 presents the different aggregate levels of government expenditure within the five-year framework based upon 2013, and Table 7.7 expresses them as percentages of consolidated gross expenditure.
What is noticeable from Table 7.6 and 7.7 is the comparatively large part of the consolidated annual budget that is either returned to the treasury as VAT (2.3 percent in 2013), not allocated to any specific ministerial program or activity (13.6 percent in 2013, but proportionately more in other years) or transferred out of the government’s ministries and agencies (41.4 percent in 2013) to other public and private organisations. Less than half the consolidated annual budget (42.6 percent in 2013) is allocated to the recurrent (operating) expenditures of government ministries and agencies, and their capital programs. Table 7.6 Government budgetary expenditure, actual 2011 to target 2015 (FJ$ ‘000s)
SEG Item Actual 2011 Revised estimate
2012
Estimate 2013
Projection 2014
Projection 2015
(1+2) Personnel 569,262.9 593,009.3 618,001.5 617,726.5 617,726.0
(3+4+5+7)
MOOE 198,951.2 245,224.9 262,597.1 233,939.5 220,993.1
Net operating expenditure 768,214.1 838,234.2 880,598.6 851,666.0 838,719.1
(6) Operating grants and transfers 292,428.3 314,074.4 354,991.7 353,918.8 353,918.8
Total operating expenditure 1,060,642.4 1,152,308.6 1,235,590.3 1,205,584.8 1,192,637.9
(11+12) unallocated recurrent expenditure
299,102.5 311,597.8 315,399.5 314,144.7 305,741.7
Total recurrent expenditure 1,359,744.9 1,463,906.4 1,550,989.8 1,519,729.5 1,498,379.6
(8+9) Net capital 202,400.5 276,623.4 111,864.1 76,800.4 65,806.7
(10) Capital grants and transfers 292,203.3 277,720.4 610,810.3 491,047.4 302,391.2
Total capital 494,603.8 554,343.8 722,674.4 567,847.8 368,197.9
Net total expenditure 970,614.6 1,114,857.6 992,462.7 928,466.4 904,525.8
Total expenditure including transfers but without VAT
1,555,246.2 1,706,652.4 1,958,264.7 1,773,432.6 1,560,835.8
(13) Value added tax 43,979.0 59,679.3 53,721.1 46,759.9 43,168.9
Total expenditure including transfers and VAT
1,599,225.2 1,766,331.7 2,011,985.8 1,820,192.5 1,604,004.7
Consolidated gross expenditure 1,898,327.7 2,077,929.5 2,327,385.3 2,134,337.2 1,909,746.4
Total grants and transfers 584,631.6 591,794.8 965,802.0 844,966.2 656,310.0
Source: MoF Budget Estimates, 2013

Research into the Financing of TVET in the Pacific Fiji Country Report
46
Table 7.7 Government budgetary expenditure, actual 2011 to target 2015 (% of total)
SEG Item Actual 2011 Revised estimate
2012
Estimate 2013
Projection 2014
Projection 2015
(1+2) Personnel 30.0% 28.5% 26.6% 28.9% 32.3%
(3+4+5+7)
MOOE 10.5% 11.8% 11.3% 11.0% 11.6%
Net operating expenditure 40.5% 40.3% 37.8% 39.9% 43.9%
(6) Operating grants and transfers 15.4% 15.1% 15.3% 16.6% 18.5%
Total operating expenditure 55.9% 55.5% 53.1% 56.5% 62.5%
(11+12) unallocated recurrent expenditure
15.8% 15.0% 13.6% 14.7% 16.0%
Total recurrent expenditure 71.6% 70.5% 66.6% 71.2% 78.5%
(8+9) Net capital 10.7% 13.3% 4.8% 3.6% 3.4%
(10) Capital grants and transfers 15.4% 13.4% 26.2% 23.0% 15.8%
Total capital 26.1% 26.7% 31.1% 26.6% 19.3%
Net total expenditure 51.1% 53.7% 42.6% 43.5% 47.4%
Total expenditure including transfers but without VAT
81.9% 82.1% 84.1% 83.1% 81.7%
(13) Value added tax 2.3% 2.9% 2.3% 2.2% 2.3%
Total expenditure including transfers and VAT
84.2% 85.0% 86.4% 85.3% 84.0%
Consolidated gross expenditure 100.0% 100.0% 100.0% 100.0% 100.0%
Total grants and transfers 30.8% 28.5% 41.5% 39.6% 34.4%
Source: Table 7.6
Less than a third (26.6 percent in 2013, but higher in other years) of the consolidated budget is allocated to ministry and government agency personnel expenditure. Ministry and agency maintenance and other operating expenditure (MOOE) claim only between eleven and twelve percent of the annual budget, whilst in 2013 their capital programs were only allocated 4.8 percent of the total (although this was down considerably from the previous year).
These comparatively low figures for personnel, MOOE and capital program expenditure are obviously boosted when operational and capital grants and transfers are taken into account, since they are themselves to be expended primarily in these three areas. Recipients of these grants and transfers range from government-owned authorities and commissions to a variety of semi-autonomous and non-government organisations.13 Operating and capital grants to the three higher education institutions are included.
Table 7.8 and Figure 7.3 give an indication of the distribution of consolidated recurrent expenditure across broad sectors of government in 2013. The salient features of this distribution are:
The distribution is of the consolidated budget, and so includes all grants and
transfers, unallocated expenditure and VAT.
Unallocated expenditure is mainly recurrent (86 percent). As a proportion of total
recurrent expenditure, unallocated recurrent expenditure amounts to almost as much
13
For lists of the major recipients in 2013, see MOF Economic and Fiscal Update – Supplement to the 2013 Budget Address, November 2012, Tables 4.4 and 4.6.

Research into the Financing of TVET in the Pacific Fiji Country Report
47
as the combined allocation to health and other social services (but not education),
economic services and infrastructure.
Education (MoE and higher education institutions) was allocated 21 percent of the
recurrent expenditure budget in 2013, making it the largest recipient outside general
administration. However, its share of capital expenditure, at 1.3 percent of the total, is
the lowest. Correspondingly, the share of the total budget allocation to education
earmarked for recurrent purposes, at 97.1 percent, is the highest for all sectors.
Two-thirds of the capital budget is allocated to the infrastructure sector – to public
works, public utilities, roads, transport and shipping services.
Table 7.8 Consolidated expenditure estimates for 2013, by sector
budget item recurrent capital total percent
recurrent
percent of total budget
recurrent capital total
General administration14
472,454.8 58,083.0 530,537.8 89.1% 30.5% 8.0% 23.3%
Education15
324,545.0 9,550.7 334,095.7 97.1% 20.9% 1.3% 14.7%
Health 142,578.2 14,829.6 157,407.8 90.6% 9.2% 2.1% 6.9%
Other social services16
44,686.2 23,320.1 68,006.3 65.7% 2.9% 3.2% 3.0%
Economic services17
86,833.4 76,765.0 163,598.4 53.1% 5.6% 10.6% 7.2%
Infrastructure18
134,294.1 483,856.0 618,150.1 21.7% 8.7% 67.0% 27.2%
Unallocated 345,609.3 56,270.1 401,879.4 86.0% 22.3% 7.8% 17.7%
Total budget 1,550,989.8 722,674.5 2,273,664.3 68.2% 100.0% 100.0% 100.0%
Source: MoF Budget Estimates, 2013
14
Defence forces and police, the judiciary and corrections, PSC and general government 15
Education, national heritage, culture and the arts, and higher education institutions 16
Housing, social welfare, youth and sports 17
Industry and trade, mining, primary industry, tourism, aviation and communications, local government 18
Public works, public utilities, roads and transport, shipping

Research into the Financing of TVET in the Pacific Fiji Country Report
48
Figure 7.3 Consolidated expenditure estimates as a percent of total, 2013
Note: Recurrent expenditure is shown on the left of the Figure, and capital expenditure on the right. Source: Table 7.8
7.4 DEVELOPMENT ASSISTANCE
Fiji receives assistance from development partners in the following forms
Official development assistance (ODA)
Direct payments
Official development assistance (ODA)
As noted, ODA comes in two forms, cash grants, which are included as revenue in MoF’s cash-based annual budget estimates, and grant aid-in-kind, which is not.19 Table 7.9 shows that of the estimated FJ$174.4 million was estimated received as ODA in 2013, only FJ$16.8 million was in the form of cash grants, and hence was included as budget revenue, whilst the remaining FJ$157.8 million was grant aid-in-kind, 90 percent of all ODA, whilst available for spending on programs and projects in the country, remained ex-budget.
19
The explanation given by MoFfor the way aid-in-kind is treated in the budget estimates is as follows:
The entries shown under the aid-in-kind heading within each activity and in the summary for each Budget head give an approximate indication of aid resources applied by Ministries to various activities outside the financial allocations through the Budget. The figures shown are not precise for several reasons. The financial year of the donor country often differs from that of Fiji and, in many cases, aid proposals will be finalised during the year. The estimates of aid-in-kind include contributions of materials, equipment and staff funded directly by overseas donors and cash contributions from overseas which go directly to organisations or individuals without passing through the Budget. It is emphasised that the figures shown do not represent additional budgetary resources available to the Ministries.
MoF Budget Estimates, 2013, ‘Notes on the Budget Estimates’ page 7
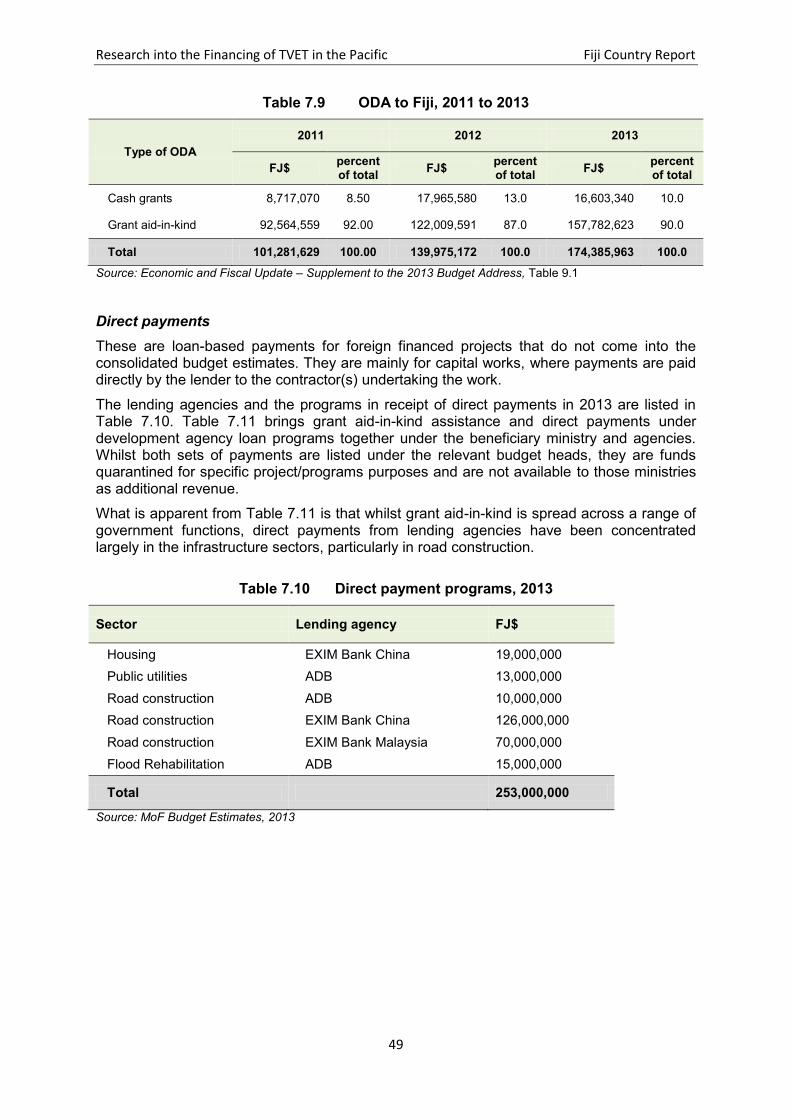
Research into the Financing of TVET in the Pacific Fiji Country Report
49
Table 7.9 ODA to Fiji, 2011 to 2013
Type of ODA
2011 2012 2013
FJ$ percent of total
FJ$ percent of total
FJ$ percent of total
Cash grants 8,717,070 8.50 17,965,580 13.0 16,603,340 10.0
Grant aid-in-kind 92,564,559 92.00 122,009,591 87.0 157,782,623 90.0
Total 101,281,629 100.00 139,975,172 100.0 174,385,963 100.0
Source: Economic and Fiscal Update – Supplement to the 2013 Budget Address, Table 9.1
Direct payments
These are loan-based payments for foreign financed projects that do not come into the consolidated budget estimates. They are mainly for capital works, where payments are paid directly by the lender to the contractor(s) undertaking the work.
The lending agencies and the programs in receipt of direct payments in 2013 are listed in Table 7.10. Table 7.11 brings grant aid-in-kind assistance and direct payments under development agency loan programs together under the beneficiary ministry and agencies. Whilst both sets of payments are listed under the relevant budget heads, they are funds quarantined for specific project/programs purposes and are not available to those ministries as additional revenue.
What is apparent from Table 7.11 is that whilst grant aid-in-kind is spread across a range of government functions, direct payments from lending agencies have been concentrated largely in the infrastructure sectors, particularly in road construction.
Table 7.10 Direct payment programs, 2013
Sector Lending agency FJ$
Housing EXIM Bank China 19,000,000
Public utilities ADB 13,000,000
Road construction ADB 10,000,000
Road construction EXIM Bank China 126,000,000
Road construction EXIM Bank Malaysia 70,000,000
Flood Rehabilitation ADB 15,000,000
Total 253,000,000
Source: MoF Budget Estimates, 2013

Research into the Financing of TVET in the Pacific Fiji Country Report
50
Table 7.11 Grant aid-in-kind and direct payments by agency, 2013
Budget head/ministry Aid-in-kind Direct payments Total
2 Public Service Commission 13,846,398
13,846,398
7 Labour, Industrial Relations and Employment 60,000
60,000
8 Foreign Affairs 1,007,856
1,007,856
17 Bureau of Statistics 25,032
25,032
18 Provincial Development 3,279,621
3,279,621
21 Education 42,097,877
42,097,877
22 Health 32,349,502
32,349,502
23 Housing 1,425,817 19,000,000 20,425,817
24 Social Welfare, Women and Poverty 1,204,335
1,204,335
25 Youth and sport 25,032
25,032
31 Agriculture 18,070,010
18,070,010
32 Forests and Fisheries 234,848
234,848
33 Lands and Mineral Resources 50,000
50,000
34 Industry and Trade 11,991,776
11,991,776
35 Sugar 12,050,000
12,050,000
36 Local Government, Urban and Environment 2,718,462
2,718,462
41 Public Utilities and Energy 17,346,057 13,000,000 30,346,057
42 Fiji Roads Authority
221,000,000 221,000,000
Total 157,782,623 253,000,000 410,782,623
Source: MoF Budget Estimates, 2013
Table 7.12 lists the sources of grant aid-in-kind and direct payments from lending agencies. It shows that whilst Australia was the largest contributor of grant aid-in-kind in 2013, China is a much larger source of assistance when direct payments from lending agencies as well as grant aid-in-kind are taken into consideration.

Research into the Financing of TVET in the Pacific Fiji Country Report
51
Table 7.12 Grant aid-in-kind by donor and direct payments by lender, 2013
Donor/lender
Grant aid-in-kind Direct payments Total
FJ$ percent of total
FJ$ percent of total
FJ$ percent of total
China 37,800,0
00 24.2% 145,000,000 57.3% 182,800,000 44.7%
Australia 87,311,8
35 56.0%
0.0% 87,311,835 21.4%
Malaysia
0.0% 70,000,000 27.7% 70,000,000 17.1%
ADB
0.0% 38,000,000 15.0% 38,000,000 9.3%
EU 11,535,0
32 7.4%
0.0% 11,535,032 2.8%
Japan 8,744,57
9 5.6%
0.0% 8,744,579 2.1%
New Zealand 5,875,89
8 3.8%
0.0% 5,875,898 1.4%
SPC 2,575,51
8 1.7%
0.0% 2,575,518 0.6%
UN 2,078,54
3 1.3%
0.0% 2,078,543 0.5%
Korea 1,411,21
8 0.9%
0.0% 1,411,218 0.3%
Taiwan 450,000 0.3%
0.0% 450,000 0.1%
Total 155,921,
405 100.0% 253,000,000 100.0% 408,921,405 100.0%
Source: MoF Budget Estimates, 2013
Figure 7.4 provides a picture of the relative distribution of grant aid-in-kind by donors, across government ministries and agencies. What this reveals is how diversified is the development assistance to Fiji.
Australia’s program of grant aid-in-kind is shown in Table 7.13. It combines assistance given under bi-lateral, regional and scholarship programs.

Research into the Financing of TVET in the Pacific Fiji Country Report
52
Figure 7.4 Grant aid-in-kind, by donor and recipient agency, 2013
Source: MoF Budget Estimates, 2013

Research into the Financing of TVET in the Pacific Fiji Country Report
53
Table 7.13 Australia’s grant aid-in-kind, 2013
Budget head/program FJ$ percent of total
2 Public Service Commission
Australian Development Scholarship
11,232,902
Australian Regional Development Scholarship 1,648,866
Total
12,881,768
14.8%
8 Foreign Affairs
International Climate Change Adaptation Initiative 936,856
Total 936,856 1.1%
18 Provincial Development
Assistance to Cyclone Season Disaster Preparedness 56,211
Total 56,211 0.1%
21 Education
Future Support to Education – New Access to Quality Education
16,627,319
APTC
21,335,937
Total
37,963,256
43.5%
22 Health
Health Sector Improvement
16,872,775
FNU College of Medicine, Nursing and Health Sciences 2,810,568
Total
19,683,343
22.5%
31 Agriculture
Strengthening the Fiji Papaya Industry 166,760
Pacific Agribusiness Research for Development Initiative 1,066,142
Pacific Horticultural and Agriculture Market Access 2,181,000
Strategies for Floriculture in Indigenous Australian and Pacific Island Communities
206,108
Total 3,620,010 4.1%
34 Industry and Trade
Rural Enterprise Development (RED) 608,956
Fiji Community Development Program 8,572,232
Market Development Facility 2,810,568
Total
11,991,756
13.7%
36 Local Government, Urban development and Environment
Small Island Developing States – Community Based Action 178,635
Total 178,635 0.2%
Total
87,311,835
100.0%
Source: MoF Budget Estimates, 2013


Research into the Financing of TVET in the Pacific Fiji Country Report
55
PART III: TVET IN CONTEXT CHAPTER 8. THE TVET SECTOR IN FIJI
8.1 COMPOSITION OF THE SECTOR
The TVET sector in Fiji, pre-2010
Fiji’s Sixth Development Plan 1971-1975 placed strong emphasis on ‘craft-teaching’ and on training in agriculture in the interests of the long-term development and prosperity of the newly independent country. By 1973 the legislature enacted the Fiji National Training Act [Cap 93] 1973, which established the Fiji National Training Council (FNTC). The council, to become the leading provider of in-service training in the country, had the responsibility for apprenticeship training, trade testing, and administering the national training levy-grant scheme. The Fiji Institute of Technology (FIT), established earlier in 1963 as the Derrick Technical Institute, was already providing pre-service technical and vocational training. FNTC picked up the functions of a national productivity organisation in 1984, and by 2003 was renamed the Training and Productivity Authority of Fiji (TPAF). In 2010 this in turn was rebadged as the National Training and Productivity Centre (NTPC), and merged with the newly established Fiji National University (FNU).
What this has in effect meant is that since its inception in 2010, in addition to being the country’s major provider of post-school education and training (PSET), FNU has taken on the administration of the country’s training levy-grant scheme, with the responsibility for:
collecting the levy from employers;
determining employer status (whether they classify as Method A or Method B employers);
dispensing the funds collected as grants; and
meeting the training needs of employers, though in-service training of employees of the levy-paying employers.
In addition it has the responsibility for managing apprenticeship schemes, trade testing, productivity promotions and so on.
Details of how the training levy-grant works are contained in Chapter 13. Suffice to say, the scheme has been the centrepiece of TVET in Fiji since its inception forty years ago. When the then TPAF closed its doors in late 2010, the authority had issued 350,000 certificates, graduated 4,700 tradesmen and women from the National Apprenticeship Training Scheme, and had, from 1986, released FJ$67 million to employers in training grants.
Before it was absorbed into FNU, FIT was a major provider of TVET in Fiji. In 2009 the institute had 20,000 students and 120 courses, across four campuses. The institute offered mostly trade certificate and diploma courses, and comprised the following schools:
Marine Studies;
Building and Civil Engineering;
General Studies;
Hospitality and Tourism;
Printing and Graphic Design;
Mechanical Engineering;
Automobile Engineering and Road Transport;
Electrical and Electronic Engineering; and
Commerce.

Research into the Financing of TVET in the Pacific Fiji Country Report
56
Along with the FIT and the TPAF, FNU also absorbed the institutions of the Fiji School of Medicine and School of Nursing, the Fiji College of Agriculture, Lautoka Teacher’s College, and the Fiji College of Advanced Education. These last two each offered teacher training, mainly through two-year diploma programs.
Despite having the national training levy scheme as a guaranteed source of funding, and one that served to focus upon the training needs of employers, the TVET sector in Fiji pre 2010 could be characterised as:
offering training that was largely supply-driven and unregulated;
being dominated by FIT and TPAF; with the remainder o offered in a few small (even boutique) line ministry institutions; o supported by a limited number of CSO, faith-based and private providers; o delivered in vocational centres located at some secondary schools as a type
of ‘second-chance’ education; and
being perceived as a relatively low status and non-academic undertaking (ADB 2007).
The latter point is underscored in a study that reported over 60 percent of secondary students in Fiji as aspiring to a set of narrow and outdated white-collar career paths – teaching, civil service, nursing, medicine, engineering and law – a focus which has contributed significantly to the problem of overeducated unemployment observed in the country today (Nilan et al 2006).
Another legacy of the lack of regulation, and possibly of an attempt to improve the status of TVET, was the proliferation of certificates. Certificates of attendance, completion, attainment, trade and higher education, and certificate levels from 1 to 4 and I to IV were common. This is being addressed by the recently established Fiji Higher Education Commission (FHEC). At the time of the fieldwork, the Fiji Qualifications Framework (FQF) was being developed and so was not available for use by the study team when classifying the levels at which programs are offered by training providers.
Over time there have been some efforts by TVET providers to collectively represent themselves, and to collaborate in the planning and provision of TVET. The Fiji Institutes of TVET Association (FITVETA) was formed at a regional conference in 2007 but, apparently, was never realised as an enduring association. The regional Pacific Association of TVET (PATVET) established to promote and lead TVET in the Pacific, and as a forum for national TVET associations, held its last annual general meeting in 2011. Its secretariat, initially hosted by SPC, is now housed in FNU, and the association is being revived.
The TVET sector in Fiji, post-2010
The formal TVET sector in Fiji, as defined within the scope of this study, comprised the following institutional components at the time of writing:
FHEC, discussed below in Chapter 11, and introduced in Chapter 5;
FNU (including NTPC) as the major public provider;
Eighty seven vocational schools almost all of which are adjuncts to secondary schools; four are schools that cater for the disadvantaged – Hilton Special School, Suva Special School, Marist Champagnat Institute, and Veilomani Rehabilitation Centre; and three are vocational centres – Ratu Mara College, Suva Vocational School and Vivekananda Vocational Centre);
MoE, administers the basic employment skills training program (BEST) in Forms 5, 6 and 7 throughout the country;
MoiTA, which operates the Centre for Appropriate Technology and Development (CATD) and administers the iTaukei scholarship scheme;
MoFF, which operates the Forestry Training Centre, and the Timber Industry Training Centre;

Research into the Financing of TVET in the Pacific Fiji Country Report
57
MoYS, which manages the National Youth Training Centre and four smaller youth training centres, including the youth band centre at Valelevu;
MoA, which operates the Taveuni Coconut Training Centre and the Koronivia Training Centre;
MoIT, which runs the National Centre for Small and Micro-Enterprise Development;
APTC, a major regional provider of AQF certificate III and IV and diploma TVET programs, funded under the Australian aid program;
USP (including RCCCE) is a regional provider funded by its 12 Pacific Island Country members and development partners;
some of the larger SOEs, particularly Airports Fiji Limited and Fiji Electrical Authority;
the Marist Tutu Rural Training Centre; and
Twenty six identified private providers, classified as either recognised by or registered with FHEC.
There are a number of other providers mainly offering short-course and non-formal TVET in Fiji. These include:
MoWSWPA, which offers short-courses particularly in micro-enterprise development and funds Suva Special School;
SPC is a regional provider, supported by partnership funding, providing short courses mainly through the Community Education Training Centre;
PSC provides in-service continuing professional development/continuing professional education (CPD/CPE) type courses at their Centre for Training and Development (CTD), and also administers the Multi-Ethnic Affairs Scholarship Scheme, international and local scholarship schemes, the special children scholarship scheme, and the student loan scheme;
MoLIRE opened its NECs (National Employment Centres) in 2010 and provides employment and small business training for the unemployed through partner providers;20 and
Some of the 500 FCOSS member organisations across Fiji, such as the Social Leadership Training Institute (FCOSS 2012), conduct short, care giving, environment, enterprise and personal and community development courses.
Fiji National University
FNU is the major provider of TVET programs in Fiji. The new university is a self-accrediting, statutory organisation (Fiji National University Decree 2009). FNU has five colleges and one centre:
College of Agriculture, Fisheries and Forestry;
College of Business, Hospitality and Tourism;
College of Engineering, Science and Technology;
College of Humanities and Education;
College of Medicine, Nursing and Health Sciences; and
National Training and Productivity Centre.
Each of the FNU Colleges has a number of departments or schools, offering an array of TVET courses, as shown in Table 8.1. The apprenticeship scheme which is administered and monitored by NPTC as part of FNU, and the franchise scheme are also discussed below.
20
There are a total of seven NECs located in Central, Western and Northern divisions, but none in the small isolated islands that make up the Eastern division.

Research into the Financing of TVET in the Pacific Fiji Country Report
58
Table 8.1 FNU TVET courses
FNU College/School/Department TVET courses
College of Agriculture, Fisheries and Forestry
Department of Agriculture Trade Dip and Cert IV Ag, short courses
Department of Fisheries Trade Dip Fisheries
Department of Forestry Trade Dip Forestry or Wood Processing
Department of Animal Science N/A
College of Business, Hospitality and Tourism
School of Hospitality and Tourism
Dept of Food and Beverage Trade Dip, Cert IV and III Restaurant, Bake or Cook
Dept of Front Office and Accommodation Management
Trade Dip, Cert IV and III Office, and Cert IV and III Housekeeping
School of Accounting
School of Economics, Banking and Finance
Dept of Economics
Dept of Banking and Finance
Department of Management, IR and OHS Trade Dip Frontline Mgt or Event Mgt, Cert IV OH&S, Merchandising or Event Mgt
Department of Computer Science and Information Systems
Trade Dip and Cert IV Applied Computing
Department of Office Administration Trade Dip Cert IV and III Office Admin
College of Engineering, Science and Technology
School of Building and Civil Engineering
Architectural Dept
The school offers the following across its departments: Trade Dip Architecture, Building, Civil Eng, Quantity Survey, Land Survey; Cert IV Frontline Spvr, Plumbing, or Carpentry
Civil Engineering Dept
Quantity Surveying Dept
Building Dept
Land Surveying Dept
Carpentry and Joinery Dept
Building Services Dept
School of Electrical and Electronics Engineering
Trade Dip Elec Eng and Cert IV Electrical, Electronics, or Hospitality Eng
School of Mechanical Engineering
Trade Dip Ag Eng, or Mech Eng

Research into the Financing of TVET in the Pacific Fiji Country Report
59
FNU College/School/Department TVET courses
Cert IV Plant, Weld, Refrig, F&T, or Ag Eng
School of Automotive Engineering and Road Transport
Trade Dip Auto Eng, or Tpt Tech
Cert IV Auto Eng (various)
School of Maritime Studies
Trade Dip Marine Eng, Ships Ops, or Nautical Science
Cert IV Marine Eng (various), or Ship Building
Cert III Engine Room (various) Deck Watch, Small Craft, or Ships Ops
School of Applied Sciences
Department of Aviation Studies Cert IV Mech, or Avionics
Department of Printing Technology Cert IV Print Tech
College of Humanities and Education
School of Social Sciences
Dept of Geography and History
Dept of Ethics and Governance Mandatory units for most programs
School of Education
Dept of Community Education Cert III TVET, Aged Care, or Child Care
Dept of Sports Education N/A
Dept of Primary Education N/A
Dept of Secondary Education BEd TVET
School of Communications and Creative Arts
Dept of Media and Journalism
Dept of Communication, Language and Literacy Dip and Cert III Journalism
Dept Film and TV Mandatory units for all programs
Dept of Music, Visual and Performing Arts
Cert IV Film and TV
Cert IV Graphic Design or Screen Print, Cert II Hair and Beauty
College of Medicine, Nursing and Health Sciences
Department of Health Sciences
N/A School of Medical Science
School of Nursing

Research into the Financing of TVET in the Pacific Fiji Country Report
60
FNU College/School/Department TVET courses
School of Oral Health
School of Public Health and Primary Care
National Training and Productivity Centre
Division of Technical Training
Dept of Mechanical Engineering
Departments offer modules of training with credit transfer to College of Engineering, Science and Technology courses. Alternatively participants can sit the national trade test. Modules are also taken by BEST and NEC participants.
Dept of Automotive Engineering
Dept of Electrical and Electronics
Dept of Construction Industry Training
Dept of Marine and Ports
Division of Business and Information Technology
Dept of Information Technology
Dept of Productivity and Quality Non-award, local and international award and professional IT courses
Dept of Quality Awards QA, OH&S and Accounting courses
Division of Executive Management and Hospitality Services
Dept of Occupational Assessment
Dept of Hospitality and Tourism Assessments, IR and OB programs
Dept of Aviation and Travel Cargo and non-award ticketing and sales courses
Dept of Languages & Business Communications Sales, supervision and services short-courses
Dept of Fashion and Design
Dept of Executive Management
ESL, IELTS and business communications courses
Courses in TCF frontline competencies
HRM, marketing and ToT courses
Department of National Trade Testing
Testing in 26 trades at Levels I to III – junior, qualified and advanced tradesperson
National Apprenticeship Training Scheme
Administer training in 22 trade certificate and five technician certificate categories

Research into the Financing of TVET in the Pacific Fiji Country Report
61
Apprenticeship programs
In 1973 FNTC was required by the Fiji National Training Act 1973:
‘to provide, arrange for or regulate the appropriate training, of persons or classes of persons, whether by way of apprenticeship or otherwise, to assist such persons or classes of persons in connection with employment’.
The task was later passed to the TPAF, and then the NTPC. The National Apprenticeship Training Scheme is now administered and monitored by NTPC as part of FNU.
An applicant has to make a direct approach to the employer offering the apprenticeship. Contracts are tripartite, between the apprentice (or guardian if under 18 years of age), the employer and FNU. There is no maximum age and wages are regulated at rather low levels: for example, trade apprentices are paid FJ$1.74 per hour in the first year while technician apprentices are paid FJ$1.94.21
Apprenticeships combine on-the-job and off-the-job training across a four or five year period, and are offered in the areas shown in Tables 8.2 and 8.3.
Table 8.2 Trade Certificate areas and course duration
Trade Certificate area Duration in
years
Aircraft maintenance 5
Automotive electrical 4
Automotive mechanical 4
Boiler making 4
Carpentry 4
Cook 4
Electrical fitter mechanic 4
Electronics 4
Fitting and machining 5
Heavy commercial vehicle mechanic 4
Heavy mobile plant mechanic 4
Industrial sewing machine mechanic 4
Joinery and cabinet making 4
Marine engineering 4
Navigation and seamanship 4
Panel beating 4
Printing 4
Refrigeration and air-conditioning 4
Saw doctor 4
Shipwright 5
Welding and fabrication 4
21
Further details of the apprenticeship scheme are included in Chapter 13.

Research into the Financing of TVET in the Pacific Fiji Country Report
62
Table 8.3 Technician Certificate areas and course duration
Technician Certificate area Duration in
years
Automotive engineering 5
Electrical engineering 5
Mechanical engineering 5
Plant engineering 5
Telecommunication engineering 5
Franchise system
FNU also franchises the provision of TVET courses and programs at the lower certificate levels locally, regionally and internationally. This allows providers who meet certain criteria, including some vocational centres attached to secondary schools, to offer training and possible pathways to FNU. The franchise system also allows some rural and remote students to remain at home while completing initial TVET (ADB 2007). Franchise courses are developed by FNU and delivered by the franchise partner. Support and monitoring is provided by the university.
Other public provision
MoE vocational schools: of the 87 MoE registered vocational schools throughout the country, most are adjuncts to secondary schools, and only three are vocational colleges (Ratu Mara College, Suva Vocational School and Vivekananda Vocational Centre). With the exception of Sila Central, Ratu Kadavulevu, Vunisea and Bucalevue, which are MoE run, schools are managed by civil society and NGO committees with support from MoE (MoSPNDS 2011).
Each school offers two-year vocational training programs in some or all of the following trades:
automotive engineering
welding and fabrication
carpentry and joinery
catering and tailoring
office technology
woodcraft
computing
marine
agriculture
The Certificate II Auto Engineering, Certificate II Carpentry and Joinery and Certificate in Catering and Tailoring, primarily for girls and young women, are the most common courses. Some are franchise programs from FNU and others are based on MoE TVET curricula. Prior to the abolition of the Fiji Junior Examination (Form 4), students who had completed, but mostly not passed, Form 4 were admitted, and on completion could articulate to more advanced training with FNU. This has changed since school attendance to Form 6 was made compulsory. However, in reality, vocational schools have some students from as low as Grade 8 and Form 3 attending full-time.
MoE’s BEST program was introduced in 2012, and is run in Forms 5, 6 and 7 in 124 secondary schools throughout the country.22 Students from 12 schools attend training at FNU, and their fees, FJ$70 per module, are paid by MoE. It is intended that all secondary
22 The BEST program, then called the BETS or Basic Employment Technical Skills program, was
pioneered at Laucala Bay Secondary School in 2011, and launched in Form 5 at 62 schools in 2012.

Research into the Financing of TVET in the Pacific Fiji Country Report
63
schools will offer BEST courses, and they will be compulsory. Students complete nine one-week modules, one per term, over three years, to complete a Level 2 qualification in one of 14 trades.23 The objectives of the program are to introduce secondary school students to basic industry skills, and to raise awareness of the trades as a viable career pathway for school leavers. BEST is seen by MoE as a Fiji-made solution to mainstreaming TVET, and making it a cornerstone of education and training reform.24 Just over 15,000 students participated in 2013. BEST is not intended to replace TVET subjects, such as industrial arts, home economics, office technology and agriculture that are offered in the mainstream secondary curriculum.
The MoiTA Centre for Appropriate Technology and Development (CATD), established in 1985, is located about 40 km from Suva. The centre has 26 staff including six instructors, and 40 trade students. Certificates in agriculture, appropriate technology, entrepreneurship, leadership, and community; and 12 month trade certificates in auto mechanics, carpentry and joinery, plumbing and welding are offered. Applicants for trade training must be iTaukei or Rotuman males, have Form 4 education (exceptions are made), require the documented support of their community, and must undertake to serve their community after training (CATD). The instructor to student ratio, at 1:10, is low and the workrooms and campus are exceptional.
The MoFF Forestry Training Centre and the Timber Industry Training Centre are both near Suva. The Forestry Training Centre’s core program is the two-year forester program. It had 19 students enrolled in 2012. It is fee free, and graduates are bonded to the Ministry for two years. The centre also runs short technical skills training events for logging companies, chainsaw operation courses for emergency services personnel, and community education programs. In the near future it is expected that FNU will take over the forester program. The Timber Industry Centre runs a one-year certificate course in applied woodcraft technology and a waste wood utilisation program. Of the hundreds of applicants for the certificate, drawn from landowner groups/communities, only 14 were selected for training in 2013. The course is also tuition fee free.
The National Youth Training Centre and three smaller youth training centres, (four including the musical band centre at Valelevu), are operated by MoYS. The four specific skills centres run certificate courses in agriculture and carpentry, and short courses in sports administration, small engine maintenance, fibreglass boat repair, seafaring, cabinet making and multi-skills courses. All courses are for school leavers, and the latter course is specifically aimed at young women. Naleba Centre has a ‘youth with special needs’ program, and is planning to host a ‘barefoot college’ campus for rural women. The Ministry also delivers personal development training, mentoring services and facilitates the Duke of Edinburgh Award scheme.
The MoA operates the Taveuni Coconut Training Centre and the Koronivia Training Centre. The Taveuni centre, opened in 2013, is a coconut processing centre and a training facility offering short courses and a FNU Certificate Level 1 course. Courses cover bio-fuel applications, coconut production, copra and soap manufacturing, and by-product use. The Centre has three staff and 10 students per year. Courses are do not charge tuition fees. The Koronivia centre, opened in 2012, has five staff and 10 students per quarter and conducts post-harvest and farm management systems training.
23
The 14 BEST trades are: automotive, electrical, electronics, industrial automation, refrigeration and air conditioning, welding and fabrication, block laying and tiling, plumbing, furniture construction, carpentry, CAD, seafaring, clothes design, and baking and patisserie. 24
Given the scarcity of materials and equipment for teaching TVET subjects in the secondary curriculum, and the small numbers of students in the adjunct vocational schools, delivering BEST to all Form 5, 6 and 7 students, even for only one week per term, will present difficulties, especially in remote areas.

Research into the Financing of TVET in the Pacific Fiji Country Report
64
The MoIT National Centre for Small and Micro Enterprise Development is a government statutory body, designed to promote small and micro enterprise development in priority areas. Funded by the GoF, the Centre enters into partnerships with other government agencies, CSO/NGO, and development assistance partners to focus on livelihood creation. Assistance includes short courses, opportunity identification, business coaching, networking, and grant assistance. A particular focus is on the Northern Development Program and clustering of start-ups such as bee farming. Courses are run on an as-required basis and they are usually cooperatively developed and delivered. None of the courses leads to formal TVET qualifications.
Airports Fiji Ltd (AFL) is a SOE that runs the AFL Aviation Academy, opened in 2010 at Nausori. As one of the best performing SOEs, AFL is expanding all its operations. Included in its plans are moves to become a major regional provider in air traffic control (ATC), and aviation security and rescue training. The organisation has International Civil Aviation Organisation accreditation, and some of the 80 graduates in ATC are already working overseas. The academy offers courses from Certificate I to Diploma, and short programs in specific skills.
The Fiji Electrical Authority (FEA) has 700 staff, and it won the Fiji Business Excellence Award in 2012. It has training operations across the country and runs certificate courses in fitting, generation, switching, line work, system control and mechanics for apprentice level trainees and trainee engineers. The training department also provides training to other government agencies.
The Tutu Rural Training Centre is effectively a partnership between the people of Cakaudrove, the Marists and the government. 76 percent of its income is from external grants, with the MoF funding all course fees (FJ$350,000 in 2010). Donors include Caritas Australia, the Australian Government, and Tutu alumni. Tutu is located 300 km from Suva, on Tavenuni, and was opened in 1969 by the Society of Mary. The Centre’s programs are widely regarded as models of non-formal, flexible, experimental adult education (McGregor et al 2011). The main course is the young farmers program, where up to 50 students alternate between their own farm, and the Centre’s, for five weeks at a time, over a four –year period. Training is aimed at self-employment, programs and nearly 2,000 students have graduated since 1969 (McGregor et al 2011). APTC as a regional TVET provider
APTC is an Australian-funded regional provider of AQF Certificate III and IV, and Diploma level courses. It commenced operations in 2007, and has campuses in five Pacific countries (Fiji, PNG, Samoa, Solomon Islands and Vanuatu). APTC draws its students from across ten Pacific island countries.
APTC Fiji offers AQF Certificate III and some Certificate IV courses in ten hospitality, community services and trades and technology areas. It also offers Certificate IV in Training and Assessment courses and Diploma courses in children and community services, and management.
APTC Fiji has two schools, the School of Trades and Technology (STT) and the School of Hospitality and Community Services (SHCS) operating out of nine campuses located in Suva, Nadi and Rakiraki. In 2013 it offered the following courses.
School of Trades and Technology
Certificate III Automotive Mechanical
Certificate III Engineering – Fabrication
Certificate III Engineering – Mechanical
Certificate III Painting
Certificate III Wall and Floor Tiling

Research into the Financing of TVET in the Pacific Fiji Country Report
65
School of Hospitality and Community Services
Certificate III Home and Community Care
Certificate III Aged Care
Certificate III Children’s Services
Certificate III Disability
Certificate III Youth Work
Diploma Children’s Services
Certificate III Nutrition and Dietetic Assistance
Certificate III Hairdressing
Certificate III Hospitality
Certificate III Hospitality (Lodge)
Certificate III Hospitality (Cookery)
Certificate III Hospitality (Patisserie)
Certificate IV Hospitality
Certificate IV in Training and Assessment
APTC has a number of partnership arrangements with Fijian institutions, including USP, the Public Works Department, NTPC, FNU and the Tanoa Hotels Group. The arrangements include provision of access to APTC’s training facilities and expertise, and assistance with program development.
The long-term sustainability of APTC is enhanced by a nationalisation policy for staff in administrative, training support and training positions. APTC will wherever possible recruit local qualified and experienced staff and is committed to their development. The National Tutor Program (NTP) provides the opportunity for national trainers to work with others in order to improve their practice, and acquire the qualifications and experience necessary to deliver AQTF courses.
In Stage 2, APTC is also contributing to the capability development of TVET institutions in the Pacific, particularly its partner institutions, through the provision of a Pacific-wide leadership program focussed on skills development of TVET managers, Certificate IV in Training and Assessment courses, the National Tutor Program, and other courses provided by the Centre for Professional Development. The Capability Development Framework to support these initiatives was largely developed in2012. In total, 254 Fijians have completed the Certificate IV in Training and Assessment program.
USP RCCCE as a regional TVET provider
The Regional Centre for Continuing and Community Education (RCCCE), recently renamed the Centre for Vocational and Continuing Education (CVCE), provides TVET, professional development, and short course programs. Programs are open to post-secondary students and/or applicants with relevant work experience.
Under the 2013-2018 strategic plan of USP, the Centre is looking to make a social and economic impact, to establish TVET as a pathway to higher education, and to introduce pathways from higher education to TVET.
CVCE has recently added the following programs to its scope:
Certificate in Library & Information Studies (Level 4)
Certificate IV in Office Management
Certificate IV in Human Resource Management
Certificate IV in Project Management
Certificate in Community Development
Certificate IV in Information Technology (Support)
Professional Diploma in Business Management

Research into the Financing of TVET in the Pacific Fiji Country Report
66
CVCE also offers over 160 CPE/CPD short courses, and has a MoU with Sydney Institute of TAFE for QA on its AQF programs.
A number of programs are offered in flexible modes and there are plans to work with Commonwealth of Learning (CoL), Open Polytechnic New Zealand (OPNZ), and USP’s Centre for Flexible Learning (CFL) to translate more face-to-face courses into flexible delivery modes. All CVCE programmes have pathways into higher studies offered by USP.
CVCE is introducing cookery programs, and is well-connected with industry and enterprise stakeholders across the spectrum of its course offerings. This has led to the “reverse integration” of programs such that USP graduates who need workplace skills are directed into courses such as the Certificate IV Office Management. USP also provides TVET teacher training (discussed further in Chapter 11).
Private provision
Table 8.4 lists the 26 private training providers that fall within the scope of the study’s definition of TVET. Their status with FHEC at the time of writing is shown. Private TVET providers are a mixture of for-profit organisations and the training arms of religious bodies, CSOs and NGOs.
Table 8.4 Private TVET providers, by type and status with FHEC, October 2013
# Provider FHEC status Type
1 Asia Pacific College Ltd Recognised Private
2 Caregivers Training Institute Recognised Private
3 Caregivers Services International Registered Private
4 Chevalier Training Centre Recognised Faith-based
5 Cooperative College of Fiji Recognised CSO
6 Dateline Business College Recognised Private
7 DellTech Institute of Computer Education Recognised Private
8 Fiji Voc. Technical Training Centre for Persons with Disabilities In process CSO
9 Institute of Computer Technology Recognised Private
10 Integrated Information Services Ltd (previously Aptech) Recognised Private
11 Keshal’s Business Education Institute Registered Private
12 Lighthouse Vocational Institute Recognised Private
13 Marist Champagnat Institute Recognised Faith-based
14 Montfort Boy’s Town Registered Faith-based
15 Pacifika Institute of Tourism Studies Recognised Private
16 Resource Business Training Centre of the Pacific Recognised Private
17 Service Pro International Tourism and Hospitality Institute Recognised Private

Research into the Financing of TVET in the Pacific Fiji Country Report
67
# Provider FHEC status Type
18 Small Hospitality Training Institute Recognised Private
19 St Louise Development Centre Recognised Faith-based
20 South Pacific Academy of Beauty Therapy Registered Private
21 The Pacific Institute of Technology (previously NZPTC) Recognised Private
22 Style Gallery Institute of Hairdressing, Health & Beauty Therapy Registered Private
23 U-Tech Institute (previously Suva Secretarial) Recognised Private
24 Universal Network of Info Tech Recognised Private
25 Vishaninfotech Recognised Private
26 Workbridge Fiji Recognised Private
8.2 STATISTICAL PROFILE OF TVET
Overall enrolments
The figures shown in Tables 8.5 and 8.6 for overall enrolments in and graduations from TVET programs in 2012 are based on the best available sources. They are, however, only very approximate estimates in some cases, and should be treated with caution. The reason for this is that comprehensive statistics on student enrolments and graduations for the TVET sector (and, indeed, for PSET as a whole) are not available, and the team was unable to fill all the gaps.
Table 8.5 Estimates of total numbers enrolled in TVET programs in Fiji in 2012
Provider
Program level
Total Basic (approximately Cert. 1 and 2)
Advanced (approximately
Cert. 3/4 and Diploma)
FNU: total1
22,212 22,212
FNU: full-time equivalent1
9,736 9,736
MoE vocational schools 2,634
2,634
MoYS training centres 250
250
Other government departments 160
160
Private providers2 3,415
3,415
APTC3
777 777
Other regional providers 250
250
Total with FNU total enrolments 6,709 22,989 29,698
Total with FNU FTE enrolments 6,709 10,513 17,222
1. This estimate assumes that total FNU enrolments are divided between TVET and higher education in the same ratio as are courses. 2. Extrapolated from enrolments in six surveyed providers. 3. Enrolments to 2012 in Stage 2 of APTC operations.

Research into the Financing of TVET in the Pacific Fiji Country Report
68
Table 8.6 Estimates of total numbers graduating from TVET programs in Fiji in 2012
Provider
Program level
Total Basic (approximately Cert. 1 and 2)
Advanced (approximately
Cert. 3/4 and diploma)
FNU: full-time equivalent1
1,563 1,563
MoE vocational schools 948
948
MoYS training centres 238
238
Other government departments 160
160
Private providers2 2,964
2,964
APTC3
431 431
Other regional providers 250
250
Total with FNU graduations 4,560 1,994 6,554
1. This estimate assumes that total FNU graduations are divided between TVET and higher education in the same ratio as are courses. 2. Extrapolated from graduation data for six surveyed providers.
3. Graduations to 2012 in Stage 2 of APTC operations.
Bearing the data limitations in mind, the following summarises the enrolment and graduation situation of the TVET sector in Fiji.
Depending on how FNU enrolments are counted, the estimate for the total enrolments in TVET in 2012 was between about 17,000 and 30,000, with most of the students enrolled in FNU College and NTPC courses.
Assuming that most, if not all, FNU TVET courses are at Certificate level 3 and above, there is a clear divide between FNU and APTC offering advanced level courses and all other public and private providers offering more basic level training programs.
It was not possible to verify the graduation figures for FNU, but it would seem from the data available25 that there is an apparent mismatch between the numbers enrolled and the numbers graduating. The estimates suggest that the dominance of FNU in terms of enrolments does not follow through to the numbers graduating.
The estimates indicate that there are more students graduating from lower level TVET programs than from the more advanced ones; this is the inverse of the pattern of enrolments.
Vocational schools
Table 8.7 shows MoE vocational school enrolments and graduations by CEDEFOP field of training for 2012. The fact that the 87 schools provide a total of 138 courses, across nine fields of training, gives some idea of the difficulties that are experienced in resourcing and quality assurance in this type of TVET provision (ADB 2008).
Figure 8.1 shows the number of courses offered, by fields of training, as a percentage of the total number of courses offered in 2012. Carpentry and joinery, and catering and tailoring are by far the most frequently offered. Carpentry and joinery is considered a field to be relatively easily resourced, and most schools visited had some resources for this area. Welding and computer studies on the other hand are fields that require significant resourcing.
25
Source: FNU Strategic Plan 2020, Figure 5, page 7.

Research into the Financing of TVET in the Pacific Fiji Country Report
69
Table 8.7 Ministry of Education vocational school course enrolments and graduations, by field of training, 2012
CEDEFOP field
Number of
courses offered
Enrolments, February 2012 Graduations for year ended
December 2012
Male Female Total Male Female Total
215 Woodcraft total 1 7 - 7 7 - 7
average per course
7.0 - 7.0 7.0 - 7.0
346 Office technology total 10 10 95 105 42 41 83
average per
course 2.0 11.9 10.5 4.2 4.1 8.3
482 Computer total 2 2 2 4 7 - 7
average per course
2.0 2.0 2.0 7.0 - 3.5
521 Welding total 2 25 - 25 24 - 24
average per course
12.5 - 12.5 12.0 - 12.0
525 Automotive mechanics total 33 767 7 774 215 15 230
average per course
26.4 1.8 23.5 8.0 0.6 7.0
525 Marine studies total 2 - 12 12 5 - 5
average per course
- 12.0 6.0 5.0 - 2.5
582 Carpentry and joinery total 42 630 2 632 168 29 197
average per course
18.0 2.0 15.0 5.1 1.0 4.7
620 Agriculture total 8 78 29 107 28 - 28
average per course
9.8 4.8 13.4 4.7 - 3.5
814 Catering and tailoring total 38 308 607 915 161 191 352
average per course
14.0 18.4 24.1 5.6 5.8 9.3
All courses total 138 1,827 754 2,581 657 276 933
average per course
13.2 5.5 20.7 4.8 2.0 6.8
Source: MoE supplied material.
Figure 8.1 Number of courses offered by MoE vocational schools, by field of training, 2012 (%)
Source: MoE supplied material.

Research into the Financing of TVET in the Pacific Fiji Country Report
70
Figures 8.2 and 8.3 provide the distributions of enrolment and graduation numbers for MoE vocational schools. There were 138 courses distributed across the 87 schools and nine fields of study. MoE was able to provide 2012 enrolment figures for 134 courses and graduation numbers for 116 courses. The average number of enrolments per course was just 21 students, and the average number of graduations per course was 8 students.
Figure 8.2 Distribution of MoE vocational school courses by size of enrolments, 2012
Source: MoE supplied material.
Figure 8.3 Distribution of MoE vocational school courses by the number of graduates, 2012
Source: MoE supplied material.

Research into the Financing of TVET in the Pacific Fiji Country Report
71
The majority of vocational schools offered only one course in 2012, and this is shown in Figure 8.4. As the most offered course is carpentry and joinery, offering a second course at these schools, such as catering and tailoring or automotive mechanics, would generally require an additional teacher.
Figure 8.4 Distribution of MoE vocational schools by number of courses offered, 2012
0 Source: MoE supplied material.
Figure 8.5 shows the distribution of enrolments by the number of courses offered. It would appear that a wide range of courses does not guarantee high enrolment figures.
Figure 8.5 Distribution of MoE vocational school enrolments by the number of courses offered, 2012
Source: MoE supplied material.

Research into the Financing of TVET in the Pacific Fiji Country Report
72
Figure 8.6 indicates vocational school enrolments by fields of training. Agriculture courses have low enrolments and are not offered that widely at vocational schools, despite the potential relevance of such training in many areas. It is not clear whether the low numbers enrolled reflect a lack of student demand or inadequate supply of programs and resources.
Figure 8.6 MoE vocational school enrolments by fields of training, 2012 (%)
Source: MoE supplied material.
Figure 8.7 shows graduations by fields of training for 2012. The large majority of graduations (84%) were in the fields of automotive mechanics, carpentry and joinery, and catering and tailoring.
Figure 8.7 MoE vocational school graduations by fields of training, 2012 (%)
Source: MoE supplied material.

Research into the Financing of TVET in the Pacific Fiji Country Report
73
The distribution of vocational schools by enrolments and graduations for 2012 is shown in Figure 8.8. As vocational school numbers increased by nearly 20 percent in the period 2011 to 2012, and course offerings differ from year to year, enrolment and graduation numbers were not in the relatively stable relationship generally expected across two-year courses.
Figure 8.8 Distribution of MoE vocational schools by enrolments and graduations, 2012
Source: MoE supplied material.
The distribution of MoE vocational school enrolments by gender for 2012 is shown in Figure 8.9. Most females were enrolled in catering and tailoring, and males outnumbered females by about 2.5 to 1 overall.
Figure 8.9 Distribution of MoE vocational school enrolments by gender, 2012
Source: MoE supplied material.
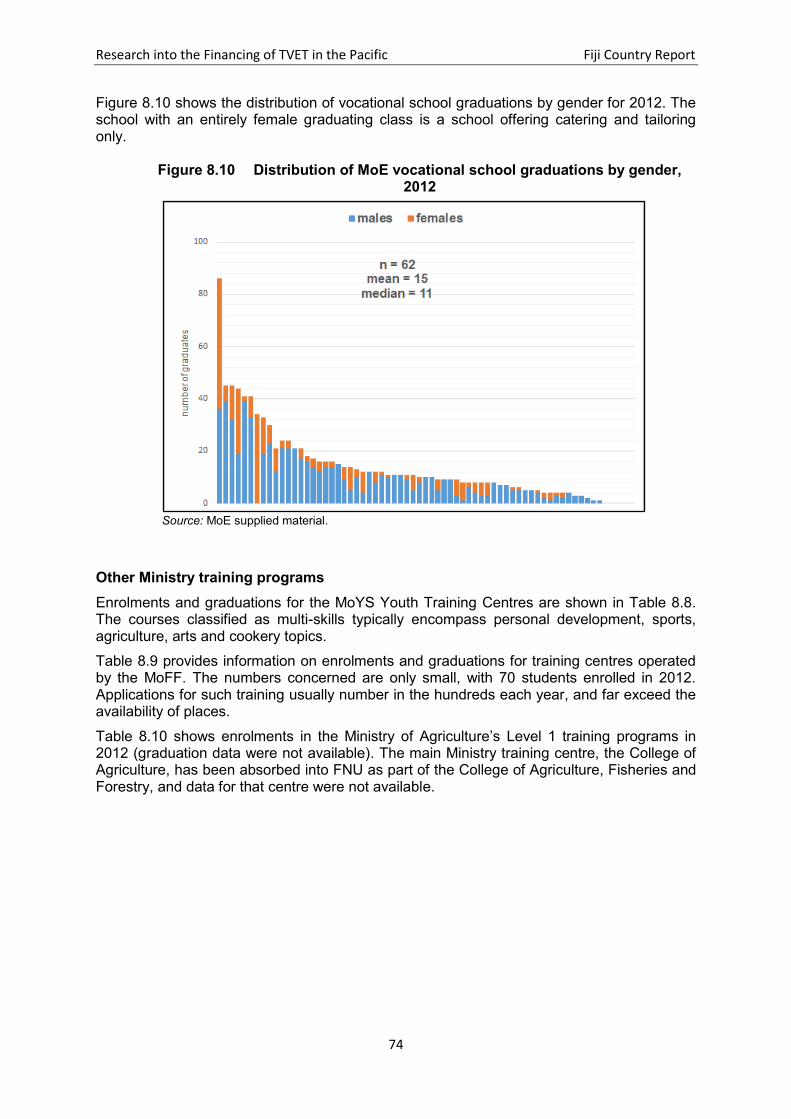
Research into the Financing of TVET in the Pacific Fiji Country Report
74
Figure 8.10 shows the distribution of vocational school graduations by gender for 2012. The school with an entirely female graduating class is a school offering catering and tailoring only.
Figure 8.10 Distribution of MoE vocational school graduations by gender, 2012
Source: MoE supplied material.
Other Ministry training programs
Enrolments and graduations for the MoYS Youth Training Centres are shown in Table 8.8. The courses classified as multi-skills typically encompass personal development, sports, agriculture, arts and cookery topics.
Table 8.9 provides information on enrolments and graduations for training centres operated by the MoFF. The numbers concerned are only small, with 70 students enrolled in 2012. Applications for such training usually number in the hundreds each year, and far exceed the availability of places.
Table 8.10 shows enrolments in the Ministry of Agriculture’s Level 1 training programs in 2012 (graduation data were not available). The main Ministry training centre, the College of Agriculture, has been absorbed into FNU as part of the College of Agriculture, Fisheries and Forestry, and data for that centre were not available.

Research into the Financing of TVET in the Pacific Fiji Country Report
75
Table 8.8 MoYS Youth Training Centres enrolments and graduations, Level 1 training programs, by gender, 2012
Training centre enrolments graduations
males females total males Females total
Yavitu Youth Training Centre
582 Carpentry 19 0 19 19 0 19
521 Small Engine Repairs 22 0 22 22 0 22
Total Yavitu Youth Training Centre 41 0 41 41 0 41
Naleba Youth Training Centre
582 Carpentry
622 Agriculture 51 0 51 51 0 51
Total Naleba Youth Training Centre 51 0 51 51 0 51
National Youth Training Centre (Nasau, Sigatoka)
582 Carpentry 22 0 22 22 0 22
622 Agriculture 30 7 37 30 7 37
622 Advanced Agriculture 5 2 7 5 2 7
010 Multi-Skills 12 38 50 12 38 50
Total National Youth Training Centre 69 47 116 69 47 116
Naqere Youth Training Centre
582 Cabinet making 15 0 15 15 0 15
543 Basic Furniture Making 15 0 15 15 0 15
010 Multi-Skills 0 12 12
Total Naqere Youth Training Centre 30 12 42 30 0 30
Total 191 59 250 191 47 238
Source: MoYS supplied material.
Table 8.9 MoFF training centres, enrolments and graduations, by gender, 2012
Training centre enrolments graduations
males females total males females Total
Mahogany Waste Wood Training
543 Waste Wood Training (Level 1)
40
40 40
40
Timber Industry Training Centre (Nasinu)
543 Waste Wood Utilisation (Level 1) 14 0 14 14
14
Forestry Training Centre (Colo-I-Suva)
623 Forestry training (Level 2) 9 7 16 9 7 16
Total 63 7 70 63 7 70
Source: MoFF supplied material.
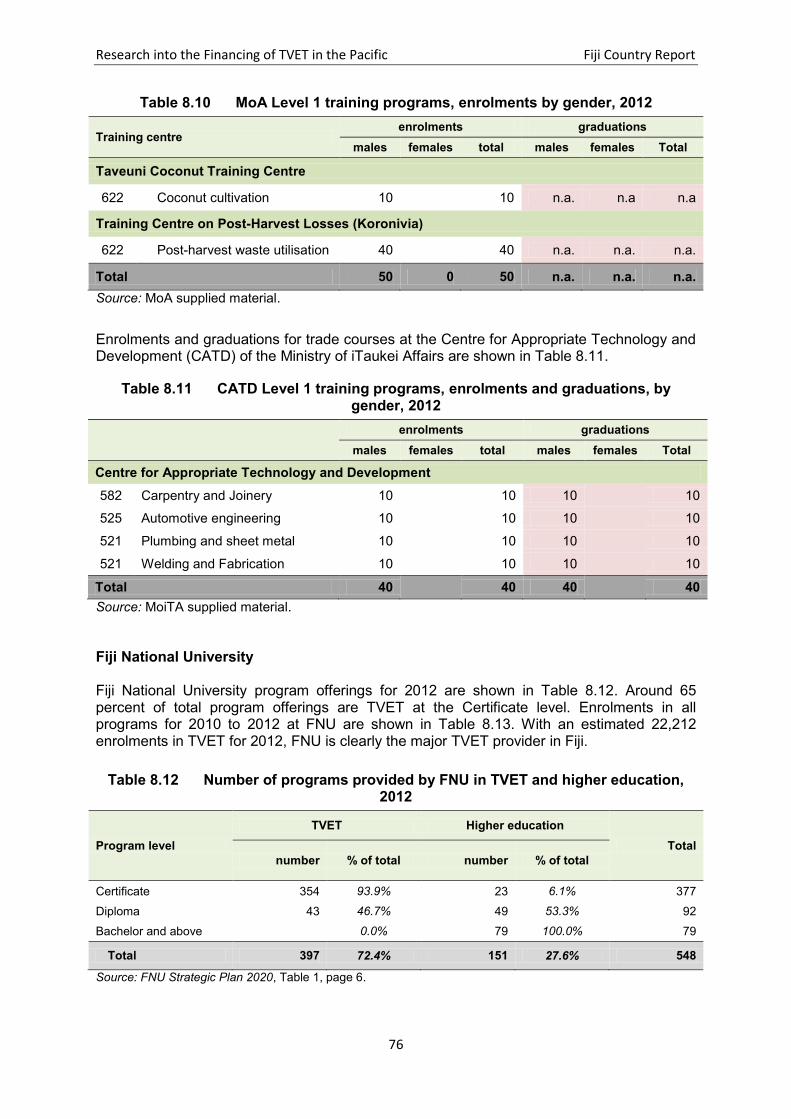
Research into the Financing of TVET in the Pacific Fiji Country Report
76
Table 8.10 MoA Level 1 training programs, enrolments by gender, 2012
Training centre enrolments graduations
males females total males females Total
Taveuni Coconut Training Centre
622 Coconut cultivation 10
10 n.a. n.a n.a
Training Centre on Post-Harvest Losses (Koronivia)
622 Post-harvest waste utilisation 40
40 n.a. n.a. n.a.
Total 50 0 50 n.a. n.a. n.a.
Source: MoA supplied material.
Enrolments and graduations for trade courses at the Centre for Appropriate Technology and Development (CATD) of the Ministry of iTaukei Affairs are shown in Table 8.11.
Table 8.11 CATD Level 1 training programs, enrolments and graduations, by gender, 2012
enrolments graduations
males females total males females Total
Centre for Appropriate Technology and Development
582 Carpentry and Joinery 10
10 10
10
525 Automotive engineering 10
10 10
10
521 Plumbing and sheet metal 10
10 10
10
521 Welding and Fabrication 10
10 10
10
Total 40
40 40
40
Source: MoiTA supplied material.
Fiji National University Fiji National University program offerings for 2012 are shown in Table 8.12. Around 65 percent of total program offerings are TVET at the Certificate level. Enrolments in all programs for 2010 to 2012 at FNU are shown in Table 8.13. With an estimated 22,212 enrolments in TVET for 2012, FNU is clearly the major TVET provider in Fiji.
Table 8.12 Number of programs provided by FNU in TVET and higher education, 2012
Program level
TVET Higher education
Total
number % of total number % of total
Certificate 354 93.9% 23 6.1% 377
Diploma 43 46.7% 49 53.3% 92
Bachelor and above
0.0% 79 100.0% 79
Total 397 72.4% 151 27.6% 548
Source: FNU Strategic Plan 2020, Table 1, page 6.

Research into the Financing of TVET in the Pacific Fiji Country Report
77
Table 8.13 FNU enrolments, all programs, 2010 to 2012
2010 2011 2012
average annual % change
estimated TVET 2012*
Total enrolments 24,993 27,886 30,660 10.8% 22,212
FTE enrolments 12,255 12,836 13,439 4.7% 9,736
Ratio of FTE to total enrolments 0.49 0.46 0.44
*Based on the assumption that enrolments in TVET courses are proportional to TVET’s share of course offerings, that is, 72.4% of the total (see Table 8.12). Source: FNU Strategic Plan 2020, Figures 1 and 2, page 6.
Table 8.14 shows FNU graduations by program for the period 2010 to 2012. The estimated number of TVET graduations appears to be low given the estimates of TVET enrolments.
Table 8.14 FNU graduations, by program, 2010 to 2012
2010 2011 2012
average annual % change
estimated TVET 2012*
Certificate 876 900 764 -6.6% 717
Diploma 1,918 2,706 1,811 -2.8% 846
Bachelor 208 204 295 19.1%
Post-graduate 130 108 143 4.9%
Total 3,132 3,918 3,013 -1.9% 1,564
*Based on the assumption that enrolments in TVET courses are proportional to TVET’s share of course offerings, that is, 72.4% of the total (see Table 8.12). Source: FNU Strategic Plan 2020, Figure 5, page 7.
Figure 8.11 shows the composition of enrolments at FNU from 2010 to 2012. Enrolments in Diploma programs comprise an estimated 60 percent of all enrolments at the university.
Figure 8.11 Composition of FNU enrolments, 2010 to 2012
Source: Table 8.12.

Research into the Financing of TVET in the Pacific Fiji Country Report
78
Private providers of TVET
Enrolments and graduations for selected private providers are shown in Table 8.15. Although male students outnumber female students, overall female participation in these particular private providers seems more even than in most of the public providers discussed previously.
Table 8.15 Selected private provider enrolments and graduations by institution, by gender, 2012
Provider enrolments as at February 2012
graduations for year ended December 2012
male female total male female total
Caregivers Services International 10 45 55 10 40 50
Dateline Business College 50 75 125 14 64 78
Marist Champagnat Institute 10 10 20 3 15 18
Montfort Boy’s Town 123 0 123 49 0 49
The Style Gallery (Fiji) Institute of Hairdressing, Health & Beauty Therapy
9 51 60 10 78 88
Tutu Rural Training Centre 313 92 405 313 92 401
Total 515 273 788 399 289 684
Source: Material provided by institutions.
Table 8.16 shows enrolments and graduations by CEDEFOP field of study for selected private providers in 2012.
Table 8.16 Selected private provider enrolments and graduations by field of study,
by gender, 2012
CEDEFOP category of training
enrolments as at February 2012 graduations for year ended
December 2012
male female male female male female
0. general programs 10 10 20 10 10 20
2. craft skills 3 10 13 3 10 13
3. business skills 4 34 38 2 28 30
4. IT skills 46 43 89 12 38 50
5. trade and technician skills 189 16 205 115 16 131
6. agricultural programs 236 62 298 236 62 294
7. health and welfare programs 17 45 62 10 45 55
8. service skills 10 53 63 11 80 91
Total 515 273 788 399 289 684
Source: Material provided by institutions.

Research into the Financing of TVET in the Pacific Fiji Country Report
79
Figure 8.12 shows selected private provider enrolments by field of study for 2012. Female participation in agriculture and trade and technical skills programs is seen as particularly low.
Figure 8.12 Selected private provider enrolments by field of study, by gender, 2012
Source: Material provided by institutions.
Australia-Pacific Technical College APTC records its data according to contract stages. Hence, data for Stage 1 (2007 to 2010) and Stage 2 (to 2012) are shown in this section.
Table 8.17 shows APTC enrolments on the Fiji campuses of the School of Trades and Technology and the School of Community and Hospitality Services, by course for Stage 1 (2007 to 2010 complete) and Stage 2 (2011 and 2012) of the contract. Stage 2 ends in 2015.

Research into the Financing of TVET in the Pacific Fiji Country Report
80
Table 8.17 APTC enrolments on the Fiji campuses, by school and course, Stage 1 and Stage 2 to 2012
AQF Level
CEDEFOP Field
course Stage 1 Stage 2
female male total female male total
School of Trades and Technology
4 141 Training and assessment 85 207 292 6 9 15
3 521 Mechanical fitting - 12 12 - 35 35
3 525 Automotive mechanical - 73 73 1 48 49
3 525 Diesel fitting 1 88 89 - 52 52
3 582 Carpentry 2 189 191 3 58 61
3 582 Painting and decorating 58 83 141 38 25 63
3 582 Wall and floor tiling 24 8 32 15 26 41
Sub-total STT 185 664 849 72 261 333
School of Community and Hospitality Services
5 761 Children's services 28 1 29
5 762 Community services work 25 18 43 21 22 43
4 141 Training and assessment 56 73 129
4 761 Youth work
9 8 17
3 761 Children's Services 106 9 115 90 4 94
3 762 Community services
14 3 17
3 762 Disability services
26 6 32
3 811 Commercial cookery 62 140 202 17 48 65
3 811 Patisserie 32 39 71 14 15 29
3 811 Hospitality operations 159 35 194 36 30 66
3 811 Hospitality supervision 47 35 82 24 16 40
3 812 Tourism operations 15 4 19
3 815 Hairdressing 37 17 54 32 9 41
Sub-total SCHS 567 371 938 283 161 444
Total APTC 752 1,035 1,787 355 422 777
Source: APTC Annual Report and Plan 2012-13, Annex 1.
Table 8.18 shows the composition of enrolments (proportions of females, Fijian nationals, and those on scholarships) on APTC’s Fiji campuses for Stage 1 and Stage 2 to 2012. The percentage of female participation is comparatively high in terms of most of the TVET providers analysed in this study.

Research into the Financing of TVET in the Pacific Fiji Country Report
81
Table 8.18 Composition of enrolments on APTC’s Fiji campuses, by school and course, Stage 1 and Stage 2 to 2012 (%)
AQF Level
CEDEFOP Field
course
percent female percent Fijian percent on scholarship
Stage 1 Stage 2 Stage 1 Stage 2 Stage 1 Stage 2
School of Trades and Technology
4 141 Training and assessment 29.1% 40.0% 81.8% 93.3% 4.1% 6.7%
3 521 Mechanical fitting 0.0% 0.0% 100.0% 85.7% 8.3% 74.3%
3 525 Automotive mechanical 0.0% 2.0% 49.3% 55.1% 93.2% 98.0%
3 525 Diesel fitting 1.1% 0.0% 83.1% 73.1% 65.2% 100.0%
3 582 Carpentry 1.0% 4.9% 48.7% 59.0% 73.8% 98.4%
3 582 Painting and decorating 41.1% 60.3% 82.3% 49.2% 39.7% 96.8%
3 582 Wall and floor tiling 75.0% 36.6% 78.1% 63.4% 84.4% 100.0%
Sub-total STT 21.8% 21.6% 71.6% 60.7% 44.9% 91.9%
School of Community and Hospitality Services
5 761 Children's services 96.6%
100.0%
96.6%
5 762 Community services work 58.1% 48.8% 37.2% 14.0% 100.0% 100.0%
4 141 Training and assessment 43.4%
82.9%
0.0%
4 761 Youth work
52.9%
0.0%
100.0%
3 761 Children's Services 92.2% 95.7% 62.6% 58.5% 98.3% 98.9%
3 762 Community services
82.4%
23.5%
100.0%
3 762 Disability services
81.3%
46.9%
96.9%
3 811 Commercial cookery 30.7% 26.2% 79.7% 53.8% 60.4% 70.8%
3 811 Hospitality operations 82.0% 54.5% 68.6% 59.1% 84.0% 50.0%
3 811 Hospitality supervision 57.3% 60.0% 59.8% 47.5% 61.0% 100.0%
3 811 Patisserie 45.1% 48.3% 73.2% 51.7% 87.3% 86.2%
3 812 Tourism operations 78.9%
68.4%
94.7%
3 815 Hairdressing 68.5% 78.0% 46.3% 56.1% 100.0% 97.6%
Sub-total SCHS 60.4% 63.7% 70.0% 47.5% 69.6% 86.7%
Total APTC 42.1% 45.7% 70.8% 53.2% 57.9% 88.9%
Source: APTC Annual Report and Plan 2012-13, Annex 1.

Research into the Financing of TVET in the Pacific Fiji Country Report
82
Table 8.19 shows graduations from APTC’s Fiji campuses by school and course for Stage 1 and Stage 2 to 2012. Of the 292 enrolments in training and assessment (Certificate IV) in Stage 1, 211 graduated and 86 percent of them were Fijian (see Table 8.20).
Table 8.19 Graduations from APTC’s Fiji campuses, by school and course, Stage 1
and Stage 2 to 2012
AQF Level
CEDEFOP Field
course Stage 1 Stage 2
female male total female male total
School of Trades and Technology
4 141 Training and assessment 56 155 211 20 33 53
3 521 Mechanical fitting - 5 5 - - -
3 525 Automotive mechanical - 50 50 - 11 11
3 525 Diesel fitting 1 55 56 1 40 41
3 582 Carpentry - 135 135 3 51 54
3 582 Painting and decorating 27 63 90 30 17 47
3 582 Wall and floor tiling 11 31 42 10 5 15
Sub-total STT 109 497 606 64 157 221
School of Community and Hospitality Services
5 761 Children's services 39 3 42
5 762 Community services work 21 13 34 - - -
4 141 Training and assessment 35 37 72
4 761 Youth work
- - -
3 761 Children's Services 100 9 109 39 2 41
3 762 Community services
- - -
3 762 Disability services
12 2 14
3 811 Commercial cookery 47 105 152 8 23 31
3 811 Hospitality operations 142 28 170 23 20 43
3 811 Hospitality supervision 45 25 70 21 13 34
3 811 Patisserie 30 30 60 7 14 21
3 812 Tourism operations 14 3 17
3 815 Hairdressing 37 17 54 22 4 26
Sub-total SCHS 510 270 780 132 78 210
Total APTC 619 767 1,386 196 235 431
Source: APTC Annual Report and Plan 2012-13, Annex 1.

Research into the Financing of TVET in the Pacific Fiji Country Report
83
The composition of the graduates from APTC’s Fiji campuses is shown in Table 8.20 for Stage 1 and Stage 2 to 2012. Noteworthy measures are the relatively high proportions of females among the graduates (44.5% overall in Stage 2 to 2012), the high proportions of scholarship holders (71.2% overall in Stage 2 to 2012), and the sizeable proportion of Fijian nationals among the graduates (59.6% overall in Stage 2 to 2012).
Table 8.20 Composition of the graduates from APTC’s Fiji campuses, by school and course, Stage 1 and Stage 2 to 2012 (%)
AQF level
CEDEFOP field
course percent female percent Fijian
percent on scholarship
Stage 1 Stage 2 Stage 1 Stage 2 Stage 1 Stage 2
School of Trades and Technology
4 141 Training and assessment 26.5% 37.7% 85.8% 67.9% 3.8% 9.4%
3 521 Mechanical fitting 0.0%
100.0%
20.0%
3 525 Automotive mechanical 0.0% 0.0% 50.0% 45.5% 96.0% 100.0%
3 525 Diesel fitting 1.8% 2.4% 78.6% 95.1% 64.3% 80.5%
3 582 Carpentry 0.0% 5.6% 52.6% 31.5% 68.1% 98.1%
3 582 Painting and decorating 30.0% 63.8% 80.0% 68.1% 53.3% 51.1%
3 582 Wall and floor tiling 26.2% 66.7% 90.5% 80.0% 88.1% 93.3%
Sub-total STT 18.0% 29.0% 73.9% 63.8% 47.2% 63.3%
School of Community and Hospitality Services
5 761 Children's services 92.9%
66.7%
97.6%
5 762 Community services work 61.8%
44.1%
100.0%
4 141 Training and assessment 48.6%
100.0%
0.0%
4 761 Youth work
3 761 Children's Services 91.7% 95.1% 61.5% 36.6% 98.2% 100.0%
3 762 Community services
3 762 Disability services
85.7%
42.9%
100.0%
3 811 Commercial cookery 30.9% 25.8% 77.0% 54.8% 67.1% 93.5%
3 811 Hospitality operations 83.5% 53.5% 66.5% 79.1% 84.7% 23.3%
3 811 Hospitality supervision 64.3% 61.8% 55.7% 52.9% 70.0% 97.1%
3 811 Patisserie 50.0% 33.3% 68.3% 61.9% 95.0% 71.4%
3 812 Tourism operations 82.4%
70.6%
94.1%
3 815 Hairdressing 68.5% 84.6% 46.3% 50.0% 100.0% 96.2%
Sub-total SCHS 65.4% 62.9% 67.8% 55.2% 77.4% 79.5%
Total APTC 44.7% 45.5% 70.5% 59.6% 64.2% 71.2%
Source: APTC Annual Report and Plan 2012-13, Annex 1.

Research into the Financing of TVET in the Pacific Fiji Country Report
84
Figure 8.13 shows enrolments on APTC’s Fiji campuses by course and gender over the period 2007 to 2012. Combined enrolments in training and assessment clearly dominate.
Figure 8.13 Enrolments on APTC’s Fiji campuses, by course and gender, 2007 to 2012
Source: APTC Annual Report and Plan 2012-13, Annex 1.
Figure 8.14 shows graduations from APTC’s Fiji campuses by course and gender for the period 2007 to 2012.
Figure 8.14 Graduations from APTC’s Fiji campuses, by course and gender,
2007 to 2012
Source: APTC Annual Report and Plan 2012-13, Annex 1.

Research into the Financing of TVET in the Pacific Fiji Country Report
85
Figure 8.15 indicates that Fijian nationals constituted the majority of enrolments in most courses on APTC’s Fiji campuses over the period 2007 to 2012.
Figure 8.15 Enrolments on APTCs Fiji campuses, by course and nationality, 2007 to 2012
Source: APTC Annual Report and Plan 2012-13, Annex 1.
Figure 8.16 shows the number of graduates from APTC’s Fiji campuses by course and nationality (Fijian and other) for the period 2007 to 2012.
Figure 8.16 Graduates from APTC’s Fiji campuses, by course and nationality, 2007 to 2012
Source: APTC Annual Report and Plan 2012-13, Annex 1.

Research into the Financing of TVET in the Pacific Fiji Country Report
86
CHAPTER 9. TVET AND EDUCATIONAL OPPORTUNITIES
9.1 EDUCATIONAL AND OTHER PATHWAYS INTO AND BEYOND TVET
The BEST program, aimed at mainstreaming TVET into secondary schools throughout the country, in order to change attitudes and raise awareness of the trades as a viable alternative for school leavers, is the government’s relatively new attempt to open alternative pathways for learning and employment (MoE ESSDP). Historically, students, and parents on their behalf, aspired to a university education and a white collar job, with the public sector the most coveted and competitive (Farchy 2011). In this scenario, TVET was seen as a poor second choice, mainly for the ‘non-academic’. The first graduates of the BEST scheme will receive their Level II certificates in late 2014 when they complete Form 7, and the scheme will operate in all secondary schools and be compulsory for all students in 2014.
BEST aside, entry levels for TVET in Fiji are remarkably diverse in theory, but scarce places and large numbers make the reality more restrictive. The diversity of admission criteria for TVET is shown in Table 9.1.
It is worth mentioning the MATUA program here. This is a genuine second chance opportunity for early school leavers to complete secondary school. The evening program is offered at a limited number of schools, and delivers the conventional school program (same curriculum, same teachers, and same exams). Some schools have allowed students to return to school after dropping out for various reasons. Sila Central Secondary, for example, has had a female student return, after giving birth to her baby, to complete Form 7 and go on to graduate as a medical doctor. Some institutions, for example USP and FNU, also offer bridging programs that will bring a student up to the required entry level. Expansion of the MATUA program, as a real second-chance education program, could help change the image of TVET as a place of last resort for academic failures
The regional provider APTC might be modelling the way in which most TVET institutions will eventually set admission criteria, as a good number of its certificate courses are open to applicants who complete a course specific, literacy, numeracy, and skills assessment. Competency-based assessment for admission would appear to be the most equitable and economic gateway to higher level competency-based training. This is because it factors in non-formal and informal educational achievement, eases the task of curriculum design, curtails course duration and scope, and gives early school leavers a second chance at formal education.
For those who successfully complete TVET programs options include graduating to work, or progression to further TVET or higher education. Dropout rates vary. For example, Suva Vocational, catering as it does mainly to female students, has a high dropout rate due to pregnancy. In order to address this, it has started young/single mothers’ courses and programs. The Forestry Training Centre on the other hand has a high completion rate given that graduates are guaranteed, in fact bound over into, employment with the Ministry of Fisheries and Forests.
Longitudinal, graduate outcome surveys and tracer studies are rare in Fiji, although APTC conducted one in 2012, but did not distinguish between campuses, so that there are no separate figures for Fiji. (APTC 2012).26 CETC has completed some studies, and a ten-year retrospective study on graduates from the Marist Champagnat Institute is being discussed with USP. As part of its QA program, FHEC is proposing tracer studies in the near future.
26
In the APTC 2012-13 Annual Report and Plan, the college reported 4,449 graduates to date, of whom 40 percent were female, and 72 percent were scholarship students. Only 76 graduates, mostly from hospitality courses, had reportedly migrated. The Graduate Tracer Survey Report 2012 indicated that 89 percent of graduates are in employment, but does not record graduate salaries.
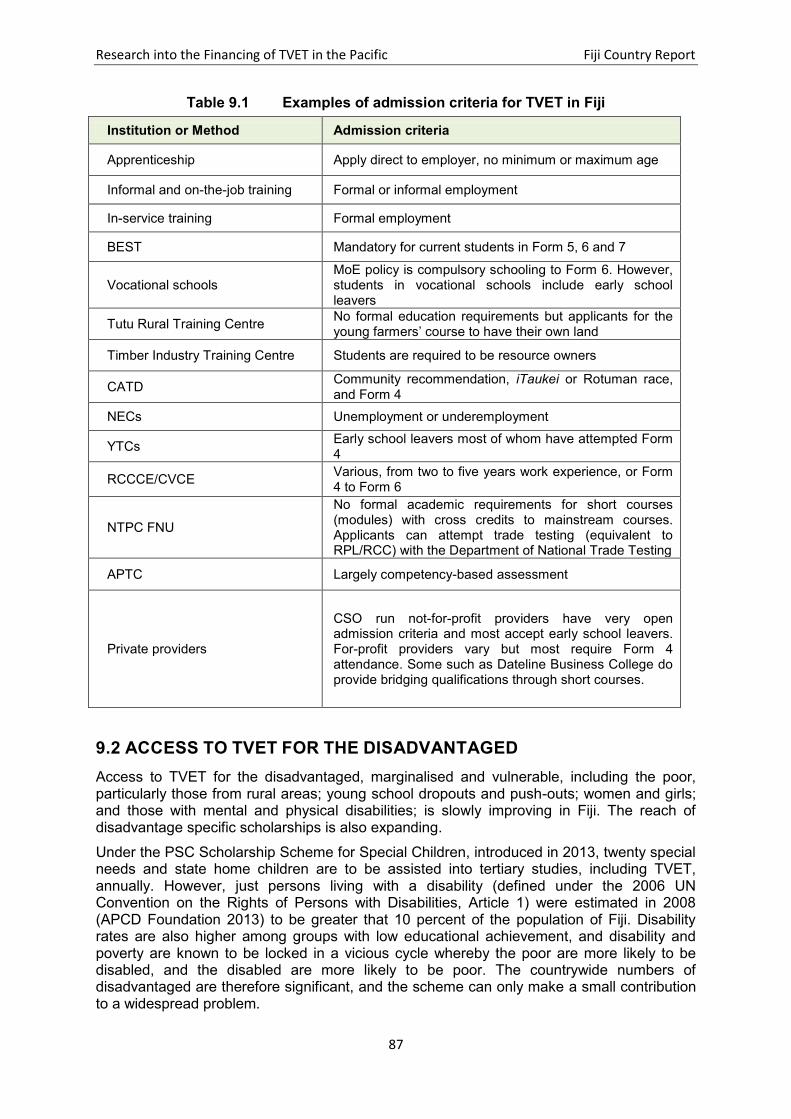
Research into the Financing of TVET in the Pacific Fiji Country Report
87
Table 9.1 Examples of admission criteria for TVET in Fiji
Institution or Method Admission criteria
Apprenticeship Apply direct to employer, no minimum or maximum age
Informal and on-the-job training Formal or informal employment
In-service training Formal employment
BEST Mandatory for current students in Form 5, 6 and 7
Vocational schools MoE policy is compulsory schooling to Form 6. However, students in vocational schools include early school leavers
Tutu Rural Training Centre No formal education requirements but applicants for the young farmers’ course to have their own land
Timber Industry Training Centre Students are required to be resource owners
CATD Community recommendation, iTaukei or Rotuman race, and Form 4
NECs Unemployment or underemployment
YTCs Early school leavers most of whom have attempted Form 4
RCCCE/CVCE Various, from two to five years work experience, or Form 4 to Form 6
NTPC FNU
No formal academic requirements for short courses (modules) with cross credits to mainstream courses. Applicants can attempt trade testing (equivalent to RPL/RCC) with the Department of National Trade Testing
APTC Largely competency-based assessment
Private providers
CSO run not-for-profit providers have very open admission criteria and most accept early school leavers. For-profit providers vary but most require Form 4 attendance. Some such as Dateline Business College do provide bridging qualifications through short courses.
9.2 ACCESS TO TVET FOR THE DISADVANTAGED
Access to TVET for the disadvantaged, marginalised and vulnerable, including the poor, particularly those from rural areas; young school dropouts and push-outs; women and girls; and those with mental and physical disabilities; is slowly improving in Fiji. The reach of disadvantage specific scholarships is also expanding.
Under the PSC Scholarship Scheme for Special Children, introduced in 2013, twenty special needs and state home children are to be assisted into tertiary studies, including TVET, annually. However, just persons living with a disability (defined under the 2006 UN Convention on the Rights of Persons with Disabilities, Article 1) were estimated in 2008 (APCD Foundation 2013) to be greater that 10 percent of the population of Fiji. Disability rates are also higher among groups with low educational achievement, and disability and poverty are known to be locked in a vicious cycle whereby the poor are more likely to be disabled, and the disabled are more likely to be poor. The countrywide numbers of disadvantaged are therefore significant, and the scheme can only make a small contribution to a widespread problem.
Research into the Financing of TVET in the Pacific Fiji Country Report
88
The approach to all education for the disabled in Fiji is based historically on a charity model. It is traditionally segregated rather than inclusive, with the emphasis being placed on primary education. As far as TVET goes, the approach has been more akin to occupational therapy than genuine preparation for the world of work. This is of concern, given that estimates of unemployment among disabled persons are as high as 87 percent (Rice 2013).
Schools and centres with TVET programs that specifically cater to disadvantaged students are:
Marist Champagnat Institute (CSO run, vocational and secondary school);
Hilton Special School (CSO run, vocational and special school);
Suva Special School (CSO run, vocational and special school);
Fiji Vocational Technical Training Centre for Persons with Disabilities ((FVTTCPD) CSO run, special school);
Veilomani Rehabilitation Centre (CSO run, vocational and special school); and
Montfort Boys’ Town (CSO run, FHEC registered).
FVTTCPD, for example, had a total of 89 students in 2012 (MoE 2013) and has an operating budget of just FJ$140,000 per year. It is grouped under the MoE special education portfolio and resourced as a primary school, along with the 16 other special schools in Fiji. The centre has three MoE teaching staff, and 10 support staff paid at the rate of just FJ$3 per hour by the management committee the Fiji National Council for Disabled Persons. The centre offers tuition free, competency-based, modularised courses, mostly franchised from FNU or based on the BEST program, in catering, sewing, carpentry, book binding, printing, agriculture and computing. Graduates have progressed to mainstream FNU courses, and some courses, such as the successful garment workers program, are integrated (rather than segregated) and have led to employment.
As another example, Suva Special School has an enrolment of 134 students in 2012. It employs14 MoE teachers and three committee-paid staff (MoE 2013). The school program consists of a primary-only stream, a blended primary and TVET subject stream, and a TVET stream. Schooling is tuition free and levies are just FJ$35 per term. Of the 50 or so students in the TVET stream (which comprises cookery, sewing, gardening, ceramics and carpentry subjects) most are completing the MoE TVET curriculum as occupational therapy, rather than preparation for work. Recently, some school alumni attended FVTTCPD as PSC scholarship students, and completed modules in carpentry and joinery. Very rarely do students go on to mainstream courses such as those offered by FNU.
Montfort Boy’s Town is an institution for poor boys, managed by the Society of Montfort Brothers of St Gabriel with campuses at Navesi and Savusavu. It offers two and three year courses in building, cabinet making, motor mechanics, fitting and machining, and electrics to 15 to 20 students per year. Boys aged 16 to 18 with a Form 4 pass are admitted and while no fees are charged, all boys are required to complete some work for their keep. On completion of their studies, trainees sit the TPAF Class III trade test.
The Marist Champagnat Institute (MCI) is also Suva based, has about 130 students and 22 teachers, and offers training to students disadvantaged on the basis of health, social or economic grounds. The institute is a special secondary school for male and female students with a learning disability. Courses offered include small engine repairs, carpentry, tailoring and catering, agriculture and care giving.
9.3 SCHOLARSHIPS
There are a variety of scholarship and student loan schemes available to applicants in Fiji. These include:
more than 50 places offered by Australia each year for students to undertake undergraduate or postgraduate studies in Australia (Australian Awards Scholarships),

Research into the Financing of TVET in the Pacific Fiji Country Report
89
and TVET to advanced diploma level in the Pacific (Australian Awards Pacific Scholarships);
25 or so general cultural scholarships from the Indian High Commission to Fiji;
United World College scholarships for young students to complete an International Baccalaureate;
provincial scholarships administered by individual provinces that have raised the appropriate funds;
limited Embassy of Japan scholarships for public servants;
NZ Pacific Scholarships for Fiji provide up to 10 postgraduate positions per year; and
a collection of international scholarships at individual institutions in Australia and overseas.
The government also funds a number of scholarships through PSC and MoiTA:
PSC Scholarship Scheme for Special Children (mostly TVET);
PSC Multi-Ethnic Affairs Scholarship Scheme for non iTaukei and Rotuman Form 7 or Foundation students, who are from economically disadvantaged families (about 120 or 10 percent of places are in TVET);
PSC Overseas/International Scholarships for Form 7 or Foundation students to study in internationally;
PSC Local Scholarships for Form 7 or Foundation students to study at a local institution (approximately 50 places or 5 percent are generally TVET);
PSC Student Loan Scheme for students from economically disadvantaged families to study at an approved institution (about 10 percent or 20 places are TVET);
PSC Tertiary Education Loan Scheme a new scheme for economically disadvantaged students enrolling in prescribed degree courses (about 5 percent or 20 places are TVET);
the new TVET and Commercial Agriculture Scholarships (1,000 TVET places and 47 agriculture at FNU);
FSM (medical and nursing) Scholarships; and
MoiTA local and international scholarships for undergraduate and postgraduate studies.

Research into the Financing of TVET in the Pacific Fiji Country Report
90
CHAPTER 10. TVET AND ECONOMIC GROWTH AND DEVELOPMENT
10.1 THE ROLE OF TVET IN ECONOMIC GROWTH AND DEVELOPMENT
TVET in Fiji has been criticised for being supply-driven regarding curriculum, and supply-side constrained in its provision, mostly at the expense of the taxpayer (MoSPNDS 2011). The problems of TVET are, however, more than problems of scale and curricula, they are problems of concept, strategy, image, governance, organisation and funding.
TVET is:
perceived by parents/guardians and students as a low status pathway to low status employment;
a low paid and low status job for teachers;
often classroom-based, time consuming and inflexible;
inputs (course and costs) and not outcomes (competency and jobs) focused;
problematic for employers who provide on-the-job training to trainees who graduate only to emigrate to higher paying economies; and
expensive, the small group and often one on one training involved in an apprenticeship of a fitter and turner, over three or four years, is more costly in terms of equipment, materials, power, floor space, instruction and supervision than, for example, putting a student, in a class of 40, through a law degree.
When any training program is being undertaken, four questions are implicitly or explicitly being answered: who teaches, who learns, what methods of training are employed, and what dispositions (knowledge, skills and attitudes) are being inculcated. The best TVET programs aim to have participants acquire the knowledge, skills and attitudes to be safe and productive, in a job, at work; and to be able to participate in lifelong learning. The resulting mix of life skills and livelihood competencies acquired are instrumental, have a short half-life, and have often taken some years to acquire.
For the value of TVET to be realised, collectively and individually, it must coincide/align with labour market demand. TVET can be relatively costly and time consuming, and individuals and businesses will not necessarily pay such high opportunity and direct costs, on the off chance of a return on investment. TVET supply needs to be directly linked to the demand for skilled workers by employers, through a comprehensive labour market information network (ADB 2008).
A system in equilibrium will have graduates achieving formal/informal employment after a minimum outlay on training (ADB 2008). While government can stimulate demand for labour, it is more usefully occupied in finding and forecasting it. Unfortunately, little is known about the demand for skilled labour in Fiji, although shortages in the finishing trades in the construction industry, in hospitality and tourism, and in formal sector jobs affected by emigration, for example, are acknowledged (MoSPNDS 2011, Farchy 2011 and ADB 2008). It is also agreed that most jobs are in the informal economy, in small-scale primary production, basic service provision, transport and vending (ADB 2008).
With 31 percent of the population living below the poverty line, unemployment estimated at up to 9 percent, underemployment widespread particularly in rural areas, and approximately 20,000 new labour force entrants each year looking at just 10,000 vacancies, Fiji needs jobs (MoSPNDS 2011). The four-year old policy of compulsory retirement for civil servants aged 55 is one response, as is the Melanesian Spearhead Group’s Skills Movement Scheme. The scheme came into force in late 2012 when the members of the Melanesian Spearhead Group -Fiji, Papua New Guinea, Vanuatu and Solomon Islands - agreed to facilitate the temporary movement of skilled workers between their countries, for the purposes of taking up offered employment. A quota of 400 people per country was agreed and a list of offers

Research into the Financing of TVET in the Pacific Fiji Country Report
91
was drawn up. Fiji offered up nursing, medical practitioner, surveyors, urban and regional planners, professional engineers, ship repairers and sea-farers positions. An economically relevant and responsive TVET system, producing the right quality and quantity of graduates, can overcome gaps in the workforce that hamper private sector development and loosen constraints on the economy. Such a system would be characterised by close employer involvement, timely intelligence on job trends, and a training supply train that is flexible (ADB 2008). Above all, effective TVET teaching and learning would be based on standards derived from extensive job analysis and stakeholder consultation, and not on notions of time served, prescribed curricula or antecedent choices.
It is an old adage in TVET that ‘the only thing worse than training people and losing them, is not training them and keeping them’. Fiji has been and will continue to lose competent workers, including nurses, teachers, care givers and security personnel, to offshore employers (Farchy 2011). However, there is some evidence in the number of new care giving courses, for example, that this is recognised as an opportunity for individuals, institutions and society. International demand for care workers is growing, institutions that can provide the required quality of training are attracting students, and remittances to Fijian families are set to grow. This is a model in miniature of the balance that can be reached between the demand for labour and the supply of competent workers.
Fiji is well on the way to addressing the most pressing issues raised here and in the ADB report Skilling the Pacific: Technical and Vocational Education and Training in the Pacific (2008). Most importantly, it has established an apex organisation, the FHEC, to lead the modernisation of TVET and has implemented the FQF. It has also commenced the work of systems wide QA and is engaged in building an evidence-based funding, registration and accreditation framework. FHEC has established ISACs and developed courses based on job analysis and stakeholder consultation.
There are 16 ISACs in partnership with FHEC and FQC, and numbers range from seven to 26 representatives. All have strong representation from FNU and the bureaucracy, and some enterprise members. The ISACs have developed just over 20 national qualifications to date from the following sectors:
agriculture;
aircraft maintenance;
automotive, electrical and electronics;
baking and patisserie;
electronic engineering;
electrical fitter mechanic;
heavy commercial vehicle mechanic and heavy mobile plant mechanic;
navigation and seamanship;
marine engineering;
refrigeration and heating, ventilation and air-conditioning;
printing;
saw doctor;
welding and fabrication;
tour guide;
beauty therapy; and
bus driver.
FQC is the custodian of national qualifications.
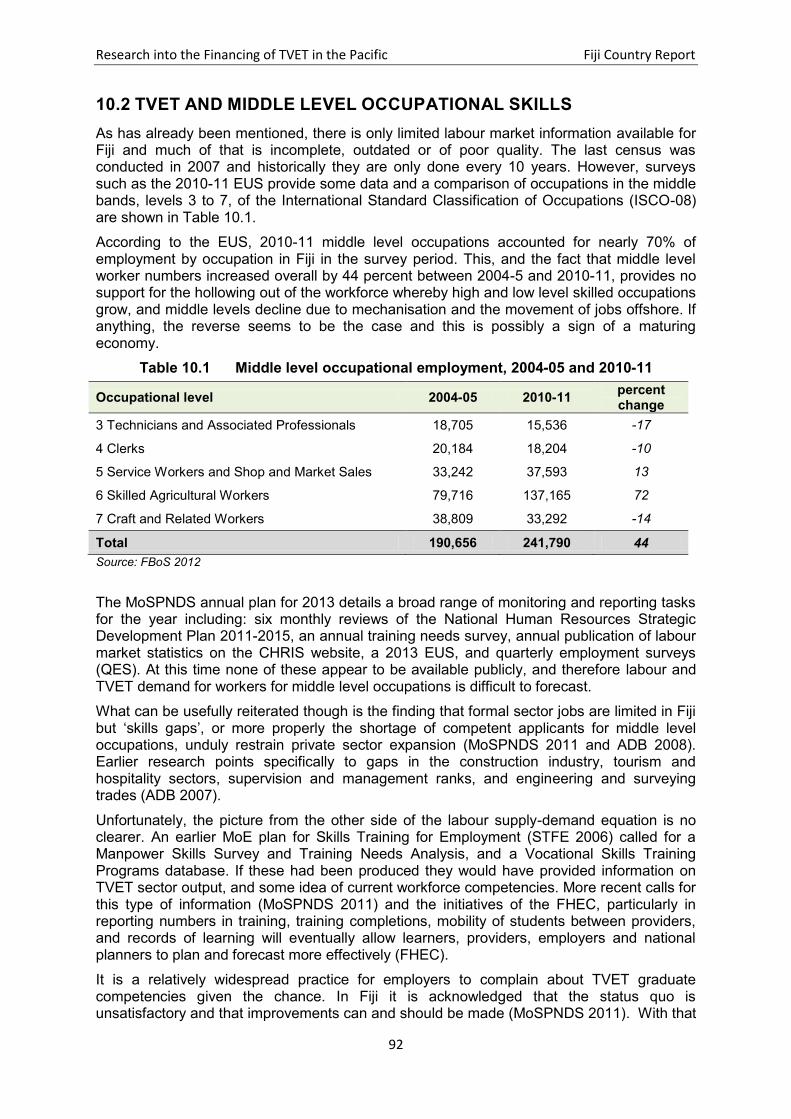
Research into the Financing of TVET in the Pacific Fiji Country Report
92
10.2 TVET AND MIDDLE LEVEL OCCUPATIONAL SKILLS
As has already been mentioned, there is only limited labour market information available for Fiji and much of that is incomplete, outdated or of poor quality. The last census was conducted in 2007 and historically they are only done every 10 years. However, surveys such as the 2010-11 EUS provide some data and a comparison of occupations in the middle bands, levels 3 to 7, of the International Standard Classification of Occupations (ISCO-08) are shown in Table 10.1.
According to the EUS, 2010-11 middle level occupations accounted for nearly 70% of employment by occupation in Fiji in the survey period. This, and the fact that middle level worker numbers increased overall by 44 percent between 2004-5 and 2010-11, provides no support for the hollowing out of the workforce whereby high and low level skilled occupations grow, and middle levels decline due to mechanisation and the movement of jobs offshore. If anything, the reverse seems to be the case and this is possibly a sign of a maturing economy.
Table 10.1 Middle level occupational employment, 2004-05 and 2010-11
Occupational level 2004-05 2010-11 percent change
3 Technicians and Associated Professionals 18,705 15,536 -17
4 Clerks 20,184 18,204 -10
5 Service Workers and Shop and Market Sales 33,242 37,593 13
6 Skilled Agricultural Workers 79,716 137,165 72
7 Craft and Related Workers 38,809 33,292 -14
Total 190,656 241,790 44
Source: FBoS 2012
The MoSPNDS annual plan for 2013 details a broad range of monitoring and reporting tasks for the year including: six monthly reviews of the National Human Resources Strategic Development Plan 2011-2015, an annual training needs survey, annual publication of labour market statistics on the CHRIS website, a 2013 EUS, and quarterly employment surveys (QES). At this time none of these appear to be available publicly, and therefore labour and TVET demand for workers for middle level occupations is difficult to forecast.
What can be usefully reiterated though is the finding that formal sector jobs are limited in Fiji but ‘skills gaps’, or more properly the shortage of competent applicants for middle level occupations, unduly restrain private sector expansion (MoSPNDS 2011 and ADB 2008). Earlier research points specifically to gaps in the construction industry, tourism and hospitality sectors, supervision and management ranks, and engineering and surveying trades (ADB 2007).
Unfortunately, the picture from the other side of the labour supply-demand equation is no clearer. An earlier MoE plan for Skills Training for Employment (STFE 2006) called for a Manpower Skills Survey and Training Needs Analysis, and a Vocational Skills Training Programs database. If these had been produced they would have provided information on TVET sector output, and some idea of current workforce competencies. More recent calls for this type of information (MoSPNDS 2011) and the initiatives of the FHEC, particularly in reporting numbers in training, training completions, mobility of students between providers, and records of learning will eventually allow learners, providers, employers and national planners to plan and forecast more effectively (FHEC).
It is a relatively widespread practice for employers to complain about TVET graduate competencies given the chance. In Fiji it is acknowledged that the status quo is unsatisfactory and that improvements can and should be made (MoSPNDS 2011). With that

Research into the Financing of TVET in the Pacific Fiji Country Report
93
in mind, FHEC stresses the requirement for continuous improvement across the system of registration, accreditation and QA. Changes here will influence providers and should quickly flow on to initial/entry level TVET training programs. However, middle level occupations and middle level qualifications require a significant element of on-the-job learning as well. Employers faced with three choices, to train existing employees, to poach new ones, or to pick winners are well advised to select the former. An efficient and effective process of workplace learning, matched with appropriate institution-based tuition, will best satisfy the pedagogical demands of middle-level TVET. Apprenticeships, traineeships and cadetships model this educational equilibrium, and because positions are created by employers they offer the potential to help balance the supply and demand sides of the labour market as well.

Research into the Financing of TVET in the Pacific Fiji Country Report
94
CHAPTER 11. QUALITY IN TVET
11.1 THE FIJI QUALIFICATIONS COUNCIL
The Higher Education Advisory Board (HEAB) was established in early 2008 with the intention of developing the higher education sector and safeguarding the interests of students, parents, providers and the nation. During the launch, it was made clear that the board’s responsibilities would encompass the whole post-secondary education and training (PSET) sector; and that the mismatch between PSET and the labour market, and the then laissez-faire approach to higher education governance would be addressed. With the commencement of the Higher Education Promulgation 2008 in early 2010, a six member Fiji Higher Education Commission (FHEC) was appointed to replace HEAB.
The Fiji Qualification Council (FQC) reports to the FHEC and, under the Higher Education (Qualifications) Regulations 2010, is responsible for developing, implementing and maintaining the Fiji National Qualifications Framework (FQF). FQC also keeps the national register of qualifications and ensures that standards are pegged against international norms. The FQF is linked to the Pacific Register of Qualifications and Standards. FHEC also houses the CAUQ (Committee for the Accreditation 0f University Qualifications) which was inaugurated in June 2013 (FHEC 2013).
The mandate for work on a national qualifications framework appears to have been provided when the Fiji National Training Act [Cap 93] 1973 was amended by the Fiji National Training (Amendment) Act 2002.The new act changed the FNTC to the TPAF and tasked the authority with developing a national qualifications framework. Work appears to have commenced in 2004 and a New Zealand consultancy (www.pinz.co.nz) was engaged in 2006 to assist in developing the qualifications framework, designing the qualifications councils and establishing a record of learning database and a qualifications database.
Registration of providers
Under the recognition and registration provisions for the regulation of award-conferring PSET institutions (detailed earlier in Chapter 5), there were 22 registered providers operating in Fiji as at October 2013 (see Table 11.1).
Accreditation of programs
The FQF is a 10-level framework for the development and classification of qualifications. The levels applicable to TVET range from Level 1 – work alone or with others on simple tasks under close supervision – to Level 6 – exercise autonomy and initiative in some activities at a professional level. The framework shown in Figure 11.1 is also used as a tool for standardising qualifications and regulating their titles.
The FQF is based on a credit system whereby one credit point is equivalent to 10 notional hours of learning: one year of full-time study, or 1,200 hours of notional learning including lectures, tutorials, practice, revision and assessment, is therefore equivalent to 120 credit points. Qualifications in the FQF have prescribed credit points at each level. For example, a basic bachelor degree is 360 credit points and would take an average student three years to complete. A certificate is 40 credit points, a diploma is 120, and a graduate certificate is 60.
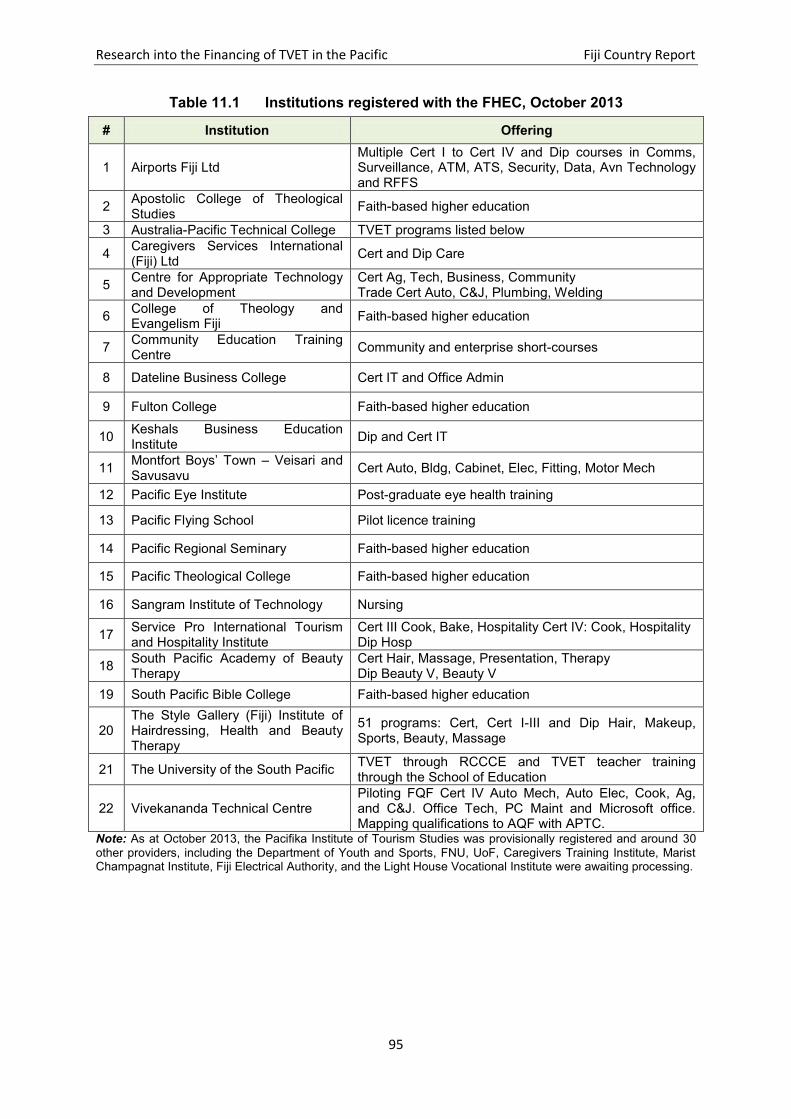
Research into the Financing of TVET in the Pacific Fiji Country Report
95
Table 11.1 Institutions registered with the FHEC, October 2013
# Institution Offering
1 Airports Fiji Ltd Multiple Cert I to Cert IV and Dip courses in Comms, Surveillance, ATM, ATS, Security, Data, Avn Technology and RFFS
2 Apostolic College of Theological Studies
Faith-based higher education
3 Australia-Pacific Technical College TVET programs listed below
4 Caregivers Services International (Fiji) Ltd
Cert and Dip Care
5 Centre for Appropriate Technology and Development
Cert Ag, Tech, Business, Community Trade Cert Auto, C&J, Plumbing, Welding
6 College of Theology and Evangelism Fiji
Faith-based higher education
7 Community Education Training Centre
Community and enterprise short-courses
8 Dateline Business College Cert IT and Office Admin
9 Fulton College Faith-based higher education
10 Keshals Business Education Institute
Dip and Cert IT
11 Montfort Boys’ Town – Veisari and Savusavu
Cert Auto, Bldg, Cabinet, Elec, Fitting, Motor Mech
12 Pacific Eye Institute Post-graduate eye health training
13 Pacific Flying School Pilot licence training
14 Pacific Regional Seminary Faith-based higher education
15 Pacific Theological College Faith-based higher education
16 Sangram Institute of Technology Nursing
17 Service Pro International Tourism and Hospitality Institute
Cert III Cook, Bake, Hospitality Cert IV: Cook, Hospitality Dip Hosp
18 South Pacific Academy of Beauty Therapy
Cert Hair, Massage, Presentation, Therapy Dip Beauty V, Beauty V
19 South Pacific Bible College Faith-based higher education
20 The Style Gallery (Fiji) Institute of Hairdressing, Health and Beauty Therapy
51 programs: Cert, Cert I-III and Dip Hair, Makeup, Sports, Beauty, Massage
21 The University of the South Pacific TVET through RCCCE and TVET teacher training through the School of Education
22 Vivekananda Technical Centre Piloting FQF Cert IV Auto Mech, Auto Elec, Cook, Ag, and C&J. Office Tech, PC Maint and Microsoft office. Mapping qualifications to AQF with APTC.
Note: As at October 2013, the Pacifika Institute of Tourism Studies was provisionally registered and around 30
other providers, including the Department of Youth and Sports, FNU, UoF, Caregivers Training Institute, Marist Champagnat Institute, Fiji Electrical Authority, and the Light House Vocational Institute were awaiting processing.

Research into the Financing of TVET in the Pacific Fiji Country Report
96
Figure 11.1 Fiji Qualifications Framework
Source: FHEC
Certificates can be taken at all levels up to level 7, and diplomas can be taken at level 5, 6 and 7. The level of a certificate is determined by beginning with the highest FQF level credits in the course of study and counting back until a total of 40 is reached. The level at which 40 is reached determines the level of the certificate (FHEC).
FHEC has recognised the distinction between national qualifications and provider qualifications. The former are packages of recognised standards that reflect a significant milestone or end point on a learning pathway. A qualification therefore represents a ‘full program of study’ (FHEC). National qualifications are developed by FQC in cooperation with Industry Standards Advisory Committees (ISACs). Registered, non-self-accrediting institutions can apply to take up a national qualification, or they must apply to have their qualifications accredited by FHEC. Self-accrediting institutions (those established under their own act) must apply to have their qualifications recorded. Where an overseas qualification is to be offered, the Fiji provider is required to provide evidence of accreditation by the appropriate overseas agency (FHEC).
Since it was launched in early 2012, there are 24 national qualifications accredited with FHEC and, at the time of writing, two more were in the stages of final approval. All of these

Research into the Financing of TVET in the Pacific Fiji Country Report
97
are TVET qualifications, and all but one are at the level of Certificate 4. It is proposed that a number of these will be piloted in 2013 and 2014 by various institutions, including the rather dynamic Vivekananda Technical College. With the exception of these national qualifications, the current crop of ‘certificates’ in the country are made up of a mixture of certificates of attendance, certificates of completion, trade certificates and higher education certificates that make for a complex array of qualifications and programs for trainees, parents/guardian and employers to interpret.
Curriculum development and validation of assessment
In developing a national qualification, FHEC standards development specialists work with the various ISACs, including industry representatives, SMEs (subject matter experts), employers, training providers and regulators, to identify the units of the qualification, and the standards of competent performance, that match the KSA (knowledge, skills and attitudes) needs of the local industry. For example, the National Certificate IV in Fitting and Machining, developed by the Fitting and Machining ISAC to FHEC/FQC, is a 49 unit, 330 credit qualification that has 111 credit points at level 4 and 10 at level 5. The remainder are at levels 1 to 3.Completion of the qualification will lead to an outcome whereby the trainee can take responsibility for carrying out a range of fitting and machining activities, where the overall goal is clear, under non-directive supervision (FHEC).
In development, which takes 12 to 18 months, unit standards are benchmarked against similar international qualifications to determine the level to which the qualification is to be assigned. Unit standards are subsequently used to frame the learning outcomes to be achieved during training, and these in turn are used by training providers to draw the curriculum. There is an element of sophistry in such a glib characterisation of the relationship here because a competency standard, essentially a statement of required performance at work, does not dictate what is to be learnt by a trainee in preparation for that, nor how it is to be taught. Contrary to popular belief, competency-based training does not detract much if at all from the trainer’s prerogative.
For each national qualification four key documents are available:
Unit Standards;
Workplace Manual;
Assessor’s Guide; and
Qualification Booklet.
Assessors are also registered with FHEC and can be trained by them. At the time of writing, there were 34 assessors registered and their role is to conduct workplace assessments of trainees pursuing national qualifications. Assessors require an AQF Certificate IV in Training and Assessment or some equivalent qualification.
Industry engagement
Government in Fiji has clearly recognised the requirement to move from supply-side to demand-side driven TVET, and has acknowledged that employers are dissatisfied with the competencies of recently trained new employees (MoSPNDS 2011). FHEC is charged with fostering cooperation among PSET institutions and establishing and maintaining linkages between those and industry. In its Business Plan 2013 the commission is seeking to achieve that through advocacy meetings with relevant industry cluster groups; consolidating partnerships with professional licensing bodies; formalising relationships across government, training providers and businesses; and establishing Industry Standards Advisory Committees (ISACs) (FHEC 2013).
ISACs have worked with FQC to develop the 26 new national qualifications (essentially a statement of units and elements of competency encompassed in a job) existing in employments as diverse as mining, security, cooking, electronics and agriculture. These are not yet developed into training packages or curricula, and are therefore some way off being

Research into the Financing of TVET in the Pacific Fiji Country Report
98
delivered as training courses. As they are, it will almost inevitably become apparent that it is not just a matter of getting employers and industry representatives to participate in job analysis, they often require assistance in articulating just what it is they require of a competent worker (ADB 2008).
At the institutional level, cooperation has not been a strong point, but it is now being more widely appreciated. Most FNU programs, for example, have extensive on-the-job training components including 12 months for certificate and diploma programs in maritime studies and six months for office administration. FNU also has strong commerce, business, employer and professional representation on the council. Interestingly FNU is also very well represented in the ISACs that have been established by FHEC.
The additional function that FHEC is scheduled to take on from 2014, that of being the conduit through which PSET institutions will receive their MoF funding, may well serve to bridge the gap between industry and the PSET sector. Part of the task given to FHEC will be to develop funding models that allocate funds on the basis of outcomes (including graduate employment outcomes) rather than historical costs (for further discussion of this proposed new role for FHEC, see Chapter 13).
11.2 TVET TEACHERS AND TEACHER TRAINING
Both FNU and USP offer TVET teacher training programs. APTC through its Fiji campus also offers the 10-unit AQF Certificate IV in Training and Assessment.
(a) FNU’s TCTVET or Teacher’s Certificate III in TVET is a 60 credit point, 12 unit program taken over four blocks. Most units are pegged at 160 hours contact, and there are three practicums in the syllabus. Other units cover teaching and learning, classroom management, communications, assessment, ethics and research skills. The program has no technical/trade content. Fees information on the FNU website is incomplete but the program would cost about FJ$2,700 for a local student and three times that for a regional one.
The BEd TVET page on FNU’s website was under construction during the fieldwork. However, the three year degree, with each year segmented into trimesters, appears to have 200 credit points of work across 28 units. Nearly two thirds of the units are compulsory and there are three practicums. Elective units for a major or double major in the degree would have to be separately costed, but using FJ$360 as an average price, the total program costs about FJ$10,000. Again, regional students would pay three times that.
(b) USP offers a BA (TVET) non-teaching qualification as a 24 course program majoring in technology, and food and nutrition. There is also a BEd Secondary (TVET) in-service program, and a BA/BSc GCEd (TVET) for pre-service students. All programs can be accessed from Form 7 or Foundation, however an articulated pathway or staircase program – diploma, degree – is available under the in-service course. USP no longer offers the certificate and diploma programs however, and has subsequently lost enrolment as most students seek to obtain their BEd at the institution where they completed their teaching certificate and diploma. Tuition fees for a basic 22 course degree, for member country students, costs about FJ$10,000 at USP.
(c) AQF Certificate IV in Training and Assessment, offered by APTC is the formal qualification required to deliver nationally accredited training and conduct assessment in the Australian TAFE sector. In Australia, the course costs as little as AU$750 and as much as AU$2,500 (depending on the institution) and it is delivered full-time or part-time, in online, correspondence, or face to face modes. Programs range in length, but one day per week over 10 weeks seems average. There are no formal entry requirements although a high level of English literacy is required. APTC
Research into the Financing of TVET in the Pacific Fiji Country Report
99
charges FJ$2,750 for the program and delivers it part-time, in four modules, for a total of 14 days, over four months, in Suva and Nadi. Applicants are required to complete a literacy assessment before enrolling.
(d) TVET teacher supply in relation to quantity is deemed to be sufficient according to MoE (perhaps the lower status of TVET prevents an oversupply?). However, teacher quality is considered poor and this is due mainly to a chronic lack of industry experience. Most teachers graduate with only their in-course workplace attachments as their experience. For example, carpentry and joinery teachers can therefore complete basic, collective tasks like standing a house frame but lack the ability to carry out, intense, complex and mostly individual tasks like setting out and profiling a house. This is a logical consequence of a short ‘apprenticeship’. Tasks that can be easily learnt on-the-job, by lending a hand are learnt. Tasks that need to observed over time and are only entrusted to the trustworthy aren’t. MoE is embarking on a program of improving TVET teacher competencies through placements at FNU during their eight week Christmas breaks. FHEC is also addressing the issue at a policy level.
Professional development for teachers and trainers
The Fiji Teachers’ Registration Board’s task is to set, maintain and promote excellence in teaching standards (MoE FTRB). It works to achieve this through promoting professional leadership in teaching, enhancing the professional status of teachers, and contributing to a high quality teaching and learning environment. The board registers all teachers, educators, volunteers, supervisors, and administrators who work with students in any school learning, coaching, training or assessment setting. Three categories of registration are available:
limited authority to teach – available to those without teaching qualifications, who have the skills or experience to assist students learn;
provisional registration – available to those who have successfully completed teacher training at a recognised institution; and
full registration – available to those who are provisionally registered, and have taught for at least one year.
TVET teachers in vocational schools, with diploma level qualifications in their respective trades and no teaching qualifications, work under the limited authority to teach and are remunerated at about FJ$11,000 per annum. A teaching diploma can add FJ$2,000 yearly to that salary, while a teaching degree will add FJ$7,000. The BEd is required to be competitive for management positions including headship. Further development is available through postgraduate education at local and international institutions, scholarships assistance can be sought through the PSC, and the MoE runs occasional workshops and short courses.
11.3 TVET WORKING ENVIRONMENT
With 2,800 employees, FNU is by far the largest provider of TVET in the country. The FNU College of Engineering, Science and Technology and the College of Business, Hospitality and Tourism absorbed the old Fiji Institute of Technology. These two colleges and the National Training and Productivity Centre now employ most TVET teachers and trainers in Fiji.
Teachers in Fiji are highly unionised - union density is estimated at 95% - and there are two unions: the Fiji Teachers’ Association; and the Fiji Teachers’ Union. These appear divided on racial grounds. Unions represent members in wage negotiations and also provide some welfare and financial assistance. Banking, loan and apartment rental services are also offered. TVET teachers are neither specifically catered to nor excluded.
Just as TVET itself labours under a poor public image, there is some concern among TVET teachers that their status is less prestigious than their ‘academic’ colleagues. This seems to

Research into the Financing of TVET in the Pacific Fiji Country Report
100
be the case for TVET program teachers in vocational schools, and for TVET subject teachers in the standard curriculum. One food and nutrition teacher even mentioned that she is often called upon to make tea when visitors arrive at the school. A carpentry teacher had a similar story about odd jobs around the school.
11.4 QUALITY ASSURANCE
The FHEC Strategic Plan 2013 shows that the commission has the overall responsibility for developing and implementing policies and procedures that ensure quality education and training, and engender stakeholder confidence in the FQF. In order to achieve those objectives, the commission carries out the following mandated functions:
to register and regulate higher education institutions according to the provisions of the legislation;
to foster and safeguard the national interest, the interest of students, parents and also of higher education providers;
to establish national standards for different qualifications; and
to provide assurances that programs developed by institutions meet national standards.
The commission also has the responsibility to develop, maintain and review QA (quality assurance) processes and systems, and to facilitate a culture of continuing improvement and consultation.
In operationalising the strategic plan, and in order to meet the recognition requirements of the Secretariat for the Pacific Board for Educational Assessment, FHEC has adopted a developmental QA process that has a baseline of ‘fit for purpose’, but also looks for continual improvement in its own performance. It holds registered PSET institutions to similar standards by ensuring that they conduct their own internal quality assessment (IQA), looking mainly at the quality and value of outputs, and by using the IQA as the framework for the FHEC conducted external quality assurance (EQA) process. Key performance questions during the EQA exercise relate to:
the value learners gain from their learning experience;
the utility of resulting qualifications for learners and other stakeholders; and
the extent to which positive longterm outcomes occur.
A methodology and instruments for EQA are being developed and the first IQA exercises are expected to take place in 2014.
The framework in Figure 11.2 shows the overall QA process expected to be fully operational by 2014. The centrepiece of the process is the integrity of the FQF itself. Steps 1 to 4 of the process, recognition and registration of providers and development and accreditation of qualifications have been commenced. Additionally, assessors have been selected and trained in preparation for Step 5.

Research into the Financing of TVET in the Pacific Fiji Country Report
101
Figure 11.2 FHEC quality assurance and continuous improvement process
Source: FHEC.


Research into the Financing of TVET in the Pacific Fiji Country Report
103
PART IV: THE FINANCING OF TVET
CHAPTER 12. OVERVIEW OF TVET FINANCING
This chapter provides an overview of funding and expenditure estimates for the TVET sector, as it has been defined for this study, using the most up-to-date data the study team was able to assemble. It begins with a summary of the funding of major providers of structured TVET programs, ones that lead to the award of certificates and diplomas, and is followed by a similar summary of expenditure patterns amongst these providers. A third section attempts to estimate expenditure on TVET as a share of GDP. It must be stressed that the purpose of this chapter is to provide a very broad picture of the resourcing of the TVET sector in Fiji, one that has hitherto not been available. It is indicative only, given the significant gaps there are in the information available to the study team, and comparisons within the sector, as depicted in this chapter, should be treated with considerable caution. For a start, the figures are not uniformly for the same period. The financial year (FY) in Fiji is the same as the calendar year, but for some providers the data obtained were for FY 2012, whilst for others they were estimates for 2013. The estimates for APTC are for FY 2013, but were modified by information relating to the Australian FY 2011-12. Another cause for caution is that the data for some provider groups are not comprehensive. The study team was only able to obtain information from a small number of private providers, and the resourcing estimates for some of the smaller training programs conducted by government ministries are only approximate. Moreover, as has been made clear in Chapter 2, very little information regarding the TVET operations of FNU were made available to the study team. The figures contained in this report as to the resourcing of these operations are inferred from the statistical information contained in the draft FNU Strategic Plan 2020.27
12.1 FUNDING OF TVET PROVISION
Table 12.1 brings together the estimates of funding in 2012-13 drawn from MoF budget estimates and from information provided by ministries and providers.28 Together they indicate that in total just over FJ$110 million of funding, from all sources, went into the TVET sector in Fiji in 2012-13. Figures 12.1 and 12.2 highlight the composition of that estimated total, by institution and by source. The salient features to emerge from Table 12.1 are:
Overall the TVET sector draws the majority of its funding from three sources – annual budget allocations from MoF, grant aid-in-kind from development partners, and tuition fees.
27
Further details are contained in Chapter 14. 28
The templates for recording information for this study for the different types of organisations involved are given in Annexes 2 to 5.

Research into the Financing of TVET in the Pacific Fiji Country Report
104
Table 12.1 Indicative funding of TVET provision in Fiji, 2012-13 (FJ$ ‘000s)
MoF
Develop assistance
tuition fees sale of
goods and services
other (including
training levy)
Total
FNU* 17,376 6,550 35,364 110 11,031 70,431
Min of Education 4,608 - 684 - - 5,292
MoYS 436 - - - 39 475
other government agencies
3,877 - - - - 3,877
private providers 1,400 862 1,430 - 645 4,336
APTC - 21,336 - - - 21,336
other regional providers
- - 1,444 - - 1,444
PSC scholarships 1,750 1,649 - - - 3,399
Total 29,446 30,396 38,922 110 11,715 110,590
* Assuming that FNU’s TVET courses are allocated pro-rata funding, that is, 72.4% of the FNU total. Source: Material provided by institutions; see also Chapter 14.
FNU is by far largest TVET institution in terms of funding in Fiji, with total funding over three times that of the next largest, APTC. This is after allowing for the fact that FNU is a dual-sector institution with a small, but growing higher education component.
FNU is able to draw its funding from a broader range of sources than can other, smaller, national and regional providers. One such source the university can draw on, the national training levy grant scheme, cannot be identified as a separate source by the study team, but its net value is assumed to be included here under the rubric ‘other’. An informal source has put the gross amount annually raised by the university from this source at around FJ$12 million.29 Its net value is what remains after employers are able to claim back their levy payments under either Method A or Method B of the grant component of the scheme (see Section 13.4 for details).
Whilst MoE vocational schools can and do charge tuition fees, other line ministry training programs are tuition free, and for them the only sources of finance are the annual MoF allocations.
The only major source of revenue outside of MoF budget allocations and grant aid-in-kind is tuition fees. It would appear that faith-based TVET providers do not rely to any significant extent on their governing bodies and their communities for financial support. Nor, as is evident in Chapter 14, is the sale of services and products a major contributor to TVET funding.30
Grant aid-in-kind from Fiji’s development partners comes principally from Australia, mostly in the form of the support given to the Fijian operations of APTC, but also in some scholarship assistance administered through PSC.
29
Batiratu.S, ‘Quest to be better’, Fiji Times Online, 6 July, 2013. 30
See Tables 14.2 and 14.4, and Figure 14.19.

Research into the Financing of TVET in the Pacific Fiji Country Report
105
Australia’s contribution through APTC is via its regional aid program (as is its scholarship assistance) and the College constitutes the only non-scholarship form of financial assistance to the TVET sector from ODA partners. There are no bilateral grant programs of assistance, nor are there any multilateral soft-loan funded capital works programs directed at the sector.
Figure 12.1 Funding of TVET, by institution, 2012-13
Source: Table 12.1
Figure 12.2 Funding of TVET, by source, 2012-13
Source: Table 12.1
Figure 12.3 shows many TVET providers in Fiji tended to rely on only one or two sources for their annual funding. It indicates that this is especially the case for regional providers and training establishments within government ministries. FNU and private providers were able to draw on a wider range of sources.

Research into the Financing of TVET in the Pacific Fiji Country Report
106
Figure 12.3 Funding of TVET, by institution and source, 2012-13
Source: Table 12.1
12.2 EXPENDITURE ON TVET PROVISION
The broad patterns of expenditure on TVET in Fiji in 2012-13 are given in Table 12.2, and Figures 12.4 and 12.5 serve to highlight their main features. Together they show the following:
as expected, total expenditure on the sector in 2012-13, of almost FJ$112 million, was broadly in line with the revenue available, and shown in Table 12.1;
also in line with Table 12.1, approximately two thirds of spending on TVET in Fiji in 210-13 was through FNU and its six colleges and centres, and if APTC is added in then 85 percent of all expenditure on TVET was via just two institutions;
very little was invested in the sector in 2012-13, in the form of capital expenditure programs. Expenditure overwhelmingly was of a recurrent nature;
overhead expenditure – ranging from administrative overheads to depreciation allowances and provisions – consumed over a quarter of expenditure in 2012-13; and
whilst expenditure on MOOE was only around half that on personnel, for TVET provision that ratio is comparatively high.

Research into the Financing of TVET in the Pacific Fiji Country Report
107
Table 12.2 Summary of expenditure on TVET provision, 2012-13
FJ$ thousand Personnel MOOE Over Total
recurrent Capital
Scholar Total
heads ships
FNU* 36,454 15,485 21,331 73,270 - - 73,270
percent of total 49.8% 21.1% 29.1% 100.0%
100.0%
Min of Education 3,753 2,513 - 6,265 148 - 6,413
percent of total 58.5% 39.2%
97.7% 2.3%
100.0%
MoYS 200 207 - 407 46 - 453
percent of total 44.2% 45.7%
89.8% 10.2%
100.0%
other government agencies
418 911 - 1,329 - - 1,329
percent of total 31.5% 68.5%
100.0%
100.0%
private providers 1,907 2,429 - 4,336 - - 4,336
percent of total 44.0% 56.0%
100.0%
100.0%
APTC 4,676 3,660 8,143 16,480 730 4,126 21,336
percent of total 21.9% 17.2% 38.2% 77.2% 3.4% 19.3% 100.0%
other regional providers 1,013 430 - 1,444 - - 1,444
percent of total 70.2% 29.8%
100.0%
100.0%
PSC scholarships - - - - - 3,399 3,399
percent of total
100.0% 100.0%
Total 48,421 25,636 29,474 103,531 924 7,525 111,980
percent of total 43.2% 22.9% 26.3% 92.5% 0.8% 6.7% 100.0%
* Assuming that FNU’s TVET courses undertake pro-rata expenditure, that is, 72.4 % of the FNU total.
Sources: material provided by institutions; also see Chapter 14.
Figure 12.4 Expenditure on TVET, by type of provider, 2012-13 (%)
Source: Table 12.2

Research into the Financing of TVET in the Pacific Fiji Country Report
108
Figure 12.5 Expenditure on TVET, by input category, 2012-13 (%)
Source: Table 12.2.
Recurrent expenditure patterns across institutions are displayed in Figure 12.6. Unlike on the revenue dimension, however, there is less variation in the pattern of recurrent expenditure between institutions. The salient features to emerge are as follows.
It is the two largest providers, FNU and APTC, that are burdened with overheads – the latter with both campus-level and institutional overheads. Overheads are not factored into TVET provision by government ministries and none of the private providers carry these costs.
APTC has a formal scholarship program explicitly provided for in its budget. Other scholarship programs, funded either from MoF budgets or through grant aid-in-kind, are managed and dispensed through PSC (see Section 13.9).
The balance between expenditure on personnel (salaries, wages and other staff emoluments, and MOOE (expenditure on teaching and training materials, utilities, routine maintenance and repairs, etc) varied considerably between providers. Each category of provider operates under a different set of conditions so there is no clear norm to which they need conform.

Research into the Financing of TVET in the Pacific Fiji Country Report
109
Figure 12.6 Recurrent expenditure on TVET, by institution and input category, 2012-13 (%)
Source: Table 12.2
12.3 ESTIMATING THE SHARE OF GDP SPENT ON TVET
To use the above figures as an approximation of the total amount of resources devoted to TVET in Fiji over 2012-13, and hence to estimate what that means as a proportion of GDP, it is necessary to keep in mind a number of factors.
It was not possible to identify all the training activities in line Ministries and agencies that could be considered as TVET. The remaining unidentified expenditure, however, is likely to be only small.
The share of total FNU annual expenditure was calculated on the assumption that expenditure on courses was proportional to the split identified in the university’s strategic plan between higher education and TVET courses. This may have resulted in either an under or over estimate of the actual distribution.
APTC is a regional institution, and whilst the expenditure identified here is for the Fiji campus, student enrolled are not solely Fijian, but are drawn from across the region. If the annual operating cost of the college was adjusted to that of an estimate of what it spent on training Fijians only, then the figure perforce would be lower.
The low response to the private provider survey, meant that a factor of 29/6 had to be applied to survey results to come up with the total estimate made in this chapter for expenditure by this group of providers. There is no way of knowing whether figures shown here are reasonable estimates or not.
Revenue raised through the national training levy-grant scheme should give a fair indication of how much employers are spending on training. As noted in Section 12.1, the unofficial estimate is that FNU collects around FJ$12 million per annum from employers through this scheme. This can probably be regarded as a minimum figure for what employers actually spend on training. To qualify as a Method A employer, an organization has to be spending at least one percent of its gross wages bill on training and, moreover, apparently a large proportion of those classified as Method B

Research into the Financing of TVET in the Pacific Fiji Country Report
110
employers do not claim under the grant component of the scheme, even when they undertake training programs.
Given these considerations, the estimate for total expenditure of FJ$112 million for 2012-13 shown in Table 12.2 needs to be treated with considerable caution. However, as a ‘ball-park’ figure it is defensible. On that basis, and given that the official estimate31 of GDP for 2012 is FJ$7,223.7 million, TVET expenditure involved around 1.55 percent of GDP. This is within the range observed in other countries in the region.
31
MoF Economic and Fiscal Update: Supplement to the 2012 Budget Address, Table 3.1.

Research into the Financing of TVET in the Pacific Fiji Country Report
111
CHAPTER 13. TVET FINANCIAL MECHANISMS
13.1 OVERVIEW OF HOW FUNDS ARE CHANNELLED INTO TVET
Figure 13.1 aims to encapsulate the complexity of financial flows into and between elements in the Fijian TVET system. It identifies the major funding sources, the major conduits through funds pass and the major recipients of the funds, those responsible for expenditure on TVET. The major revenue sources are as follows.
Government revenue raised via the Fiji Revenue and Customs Authority (FRCA).32
Development partners, via official development assistance (ODA), scholarship programs, and direct funding through the parent organisations of regional training providers.
Students and their families, via tuition and other fees and charges.
Employers, via National Training Levy and through the national apprenticeship scheme.
Owners and parent organisations of private training providers.
Purchasers of training institution produced goods and services.
The principal funding disbursement mechanisms are as follows.
MoF annual operating and capital budget allocations are provided to line Ministries with training programs and activities and to the higher education institutions. These ministries and institutions have their own internal mechanisms for channeling funds into their schools, centres and programs.
ODA, as grants-in-aid (cash grants and aid-in-kind),33 technical cooperation/assistance, and concessional soft loans are coordinated through the GoF Budget and Aid Coordinating Committee (BACC). ODA funds are channeled to line Ministries and other national bodies via the MoF budget process.
Development partner funding for regional TVET programs is channeled via the central administration of APTC in Australia and Nadi, and through the central USP administration and SPC, both in Suva.
Both development partner managed scholarship schemes, such as the Australian Awards Scholarship Scheme and the Australian Regional Development Scholarship Scheme, and nationally-funded scholarship schemes, such as and the Public Service Commission (PSC) Local Scholarship and Multi-Ethnic Affairs Scholarship schemes, have their own fund disbursement mechanisms.
The national training levy-grant scheme is administered by FNU.
The national apprenticeship program is administered by NTPC within FNU.
Student fees and other charges are collected and administered by the training providers themselves.
32
FRCA lies within the responsibility of the Ministry of Finance, and is the government’s primary revenue raising agency. 33
Grants in aid are received in two forms, cash grant or aid-in-kind. In the MoF’s cash-flow statement, only the cash grant is recorded, as it operates a cash-based accounting system (see Table 7.1).

Research into the Financing of TVET in the Pacific Fiji Country Report
112
The shareholders, church bodies and other owner/parent organisations of private training providers channel their funds through their respective governing boards and management structures.
Funds raised by training organisations through staff consultancies, the sale of other services, and from the sale of student produced items, are generally managed through and retained by, the training providers themselves.

Research into the Financing of TVET in the Pacific Fiji Country Report
113
Figure 13.1 Flow of funds into and within the TVET sector in Fiji
DE
VE
LO
PM
EN
T P
AR
TN
ER
S
G
OV
ER
NM
EN
T P
OL
ICY
, P
LA
NN
ING
AN
D B
UD
GE
TIN
G P
RO
CE
SS
ES
(see a
lso
Fig
ure
13.2
)
Au
sA
ID
B
AC
C
Mo
F
AN
NU
AL
BU
DG
ET
Mo
E
Mo
YS
Mo
LIR
E
M
oA
MoF
F
M
oW
M
o iT
F
NU
VO
CA
TIO
NA
L
SC
HO
OL
S
NT
PC
CO
LL
EG
ES
Y
OU
TH
TR
AIN
ING
C
EN
TR
ES
NA
TIO
NA
L
EM
PL
OY
ME
NT
CE
NT
RE
S
TU
TU
RU
RA
L
TR
AIN
ING
CE
NT
RE
FO
RE
ST
RY
T
RA
ININ
G
CE
NT
RE
S
CO
MM
UN
ITY
BA
SE
D S
HO
RT
CO
UR
SE
S
C
AT
D
Mo
SP
ND
S
RE
VE
NU
E R
AIS
ED
VIA
FR
CA
AP
TC
US
P
R
CC
CE
SP
C
NA
TIO
NA
L
AP
PR
EN
TIC
ES
HIP
SC
HE
ME
R
EC
OG
NIS
ED
/ R
EG
IST
ER
ED
P
RIV
AT
E
PR
OV
IDE
RS
FH
EC
S
CH
OL
AR
SH
IP
PR
OG
RA
MS
S
TU
DE
NT
S/
HO
US
EH
OL
DS
GO
VE
RN
ING
BO
DIE
S/ B
OA
RD
S/
SH
AR
EH
OL
DE
RS
,
etc
EM
PL
OY
ER
S
N
AT
ION
AL
T
RA
ININ
G
LE
VY
/GR
AN
T
SC
HE
ME
PS
C
SH
OR
T
CO
UR
SE
S
C
ET
C
IN
DU
ST
RY
O
RG
AN
ISA
TIO
NS
WO
RK
ER
S

Research into the Financing of TVET in the Pacific Fiji Country Report
114
13.2 MINISTRY OF FINANCE BUDGET PROCESSES
(a) Strategic planning and decision making machinery of government
The overall responsibility for directing and coordinating national and sectoral planning, budgeting and resourcing in Fiji is with the MoF, in conjunction with MoSPNDS. Key committees within the decision-making machinery include the Development Sub-Committee (DSC), the Macro Policy Committee (MPC), the Budget & Aid Coordinating Committee (BACC), Divisional and Provincial Development Boards (DDC and PDC), the Public Sector Reform Steering Committee (PSRSC) and the Cabinet Sub-Committee on the Budget CSB). How these bodies coordinate, and through what processes line Ministries such as MoE and MoYS must go through to get their plans approved and their budgets determined, are illustrated in Figure 13.2.
Figure 13.2 Planning and budget formulation machinery of the Government of Fiji
Source: http://www.foreignaffairs.gov.fj/trade-policy/international-cooperation/strategic-planning-and-decision-making-machinery-of-government

Research into the Financing of TVET in the Pacific Fiji Country Report
115
(b) The annual budget cycle
The four stages of the budget process are:
1. Budget formulation: the budget plan is put together by the executive branch of government;
2. Enactment: the budget plan is debated, altered, and approved by the legislative branch;
3. Execution: the budget is disbursed and its programs and activities are implemented; and
4. Auditing and assessment: when the actual expenditures of the budget are accounted for and assessed for effectiveness.
The annual budget cycle is illustrated in Figure 13.3. It begins around May/June every year, and is completed with the budget announcement on the last Friday of November.
Figure 13.3 Government of Fiji annual budget cycle
Source: Transparency International National Budget Cycle & Process Information Brochure, Fiji.
Prior to the beginning of the budget cycle in May/June, two processes are undertaken and coordinated. MoSPNDS undertakes the capital budget planning process, followed by the operating consultation and formulation process that is coordinated by the Budget division of MoF. The overall budget policies and strategies are managed by MoF, and involves the following elements. Strategic planning, review and update: May-June
Update of expenditure and revenue trends
Baseline expenditure and revenue discussed with relevant ministries and agencies
Review of selected and key revenue and expenditure policies
Strategies refined and developed for the next annual budget and within a medium term expenditure framework (MTEF)
Upper limit expenditure allocations set for each economic sector
Roll-over and re-prioritisation of capital projects
Budget strategy and targets approved by Cabinet Budget submission: July-August
May- June Strategic Planning Review & Update
(Ministries and relevant agencies)
Budget Announcement
(November – last Friday)
July - August
Budget Submission (NGO’s/Communities)
August - November
Evaluation and Assessment
of Submissions
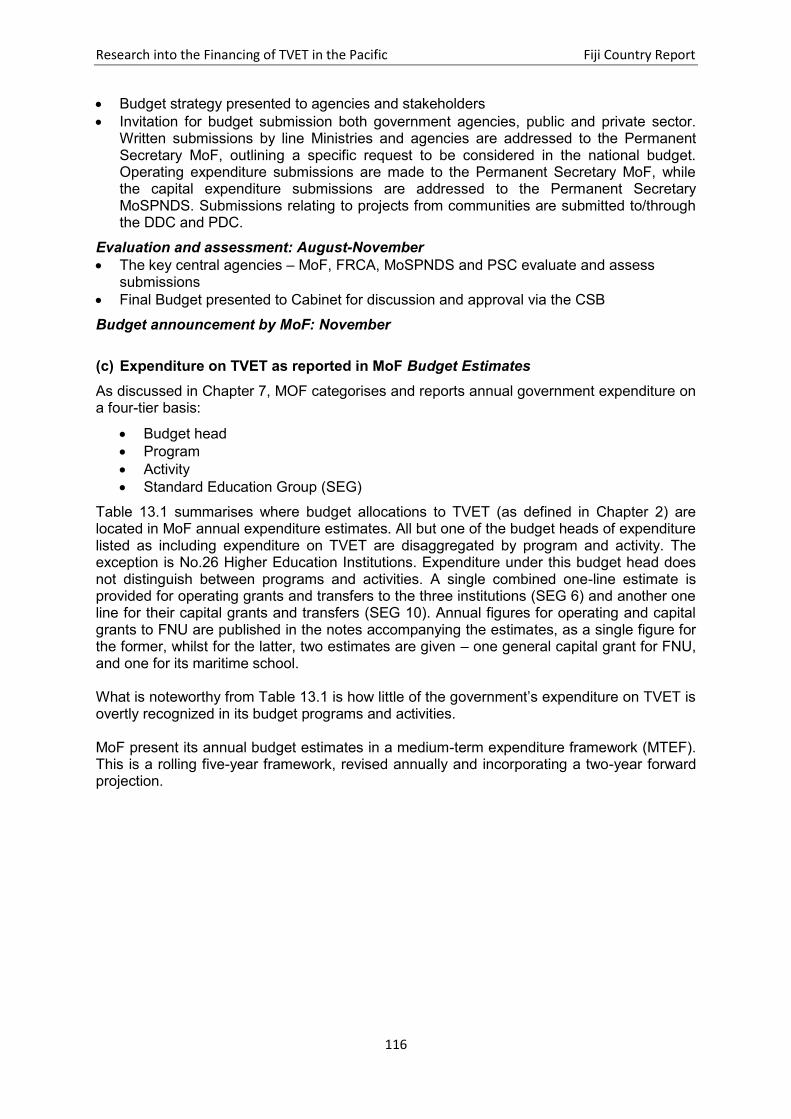
Research into the Financing of TVET in the Pacific Fiji Country Report
116
Budget strategy presented to agencies and stakeholders
Invitation for budget submission both government agencies, public and private sector. Written submissions by line Ministries and agencies are addressed to the Permanent Secretary MoF, outlining a specific request to be considered in the national budget. Operating expenditure submissions are made to the Permanent Secretary MoF, while the capital expenditure submissions are addressed to the Permanent Secretary MoSPNDS. Submissions relating to projects from communities are submitted to/through the DDC and PDC.
Evaluation and assessment: August-November
The key central agencies – MoF, FRCA, MoSPNDS and PSC evaluate and assess submissions
Final Budget presented to Cabinet for discussion and approval via the CSB
Budget announcement by MoF: November
(c) Expenditure on TVET as reported in MoF Budget Estimates
As discussed in Chapter 7, MOF categorises and reports annual government expenditure on a four-tier basis:
Budget head
Program
Activity
Standard Education Group (SEG)
Table 13.1 summarises where budget allocations to TVET (as defined in Chapter 2) are located in MoF annual expenditure estimates. All but one of the budget heads of expenditure listed as including expenditure on TVET are disaggregated by program and activity. The exception is No.26 Higher Education Institutions. Expenditure under this budget head does not distinguish between programs and activities. A single combined one-line estimate is provided for operating grants and transfers to the three institutions (SEG 6) and another one line for their capital grants and transfers (SEG 10). Annual figures for operating and capital grants to FNU are published in the notes accompanying the estimates, as a single figure for the former, whilst for the latter, two estimates are given – one general capital grant for FNU, and one for its maritime school. What is noteworthy from Table 13.1 is how little of the government’s expenditure on TVET is overtly recognized in its budget programs and activities. MoF present its annual budget estimates in a medium-term expenditure framework (MTEF). This is a rolling five-year framework, revised annually and incorporating a two-year forward projection.

Research into the Financing of TVET in the Pacific Fiji Country Report
117
Table 13.1 Location of TVET programs and activities in MOF budget papers
Ministry/agency Training program/activity Budget category
PSC Scholarships Head 2 – PSC Program 3 – PSC Activity 4 – Training division
MoiTA CATD Head 5 – MoiTA Program 1 – iTaukei affairs Activity 1 – General administration
MoLIRE NEC training activities Head 7 – MoLIRE Program 1 – Policy and administration Activity 1 – General administration
MoE Vocational schools Head 21 – MoENHCA Program 5 – Tertiary technical education Activity 1 – General administration
MoWSWPA Fiji Vocational Technical Training Centre for Persons with Disabilities
Head 24 – MoWSWPA Program 1 – Policy and administration Activity 1 – General administration
MoYS Youth training centres
Head 25 – MoYS Program 1 – Youth Activity 1 – General administration Activity 2 – Youth and development training
FNU TVET programs in colleges and schools, and in NTPC
Head 26 – Higher Education Institutions
MoPI - DoAg Tutu Rural Training Centre Head 30 – MoPI –DoA Program 1 – Policy and administration Activity 1 – General administration
MoPI - DoFF Forestry training centres Head 32 – MoPI-DoFF Program 2 - Forestry Activity 3 – Training and education
Source: Budget Estimates, 2013
13.3 LINE MINISTRY TRAINING PROVIDERS
Each of the Ministries and agencies with responsibility for funding and/or providing TVET begin their annual budget preparations in May/June, ready for submission in August/September. Their submissions need to conform to the structures and frameworks set out above, and to comply with MoF’s budget strategies and parameters. Funding for schools is primarily driven by formulae and rationing, and not submissions from schools. MoE allocates operating (MOOE) grants based on student numbers; teacher numbers are allocated based on teacher-student ratios and subject loads; and teacher salaries, as per all government employees, are set centrally with PSC. School submissions for, say capital works, are made to the relevant district office, of which there are nine in Fiji, through them to their appropriate divisional office, and eventually to the ministry. Over 8,000 established and temporary civil servant teacher salaries are paid fortnightly by direct deposit from the ministry in Suva. Temporary and relieving staff are engaged for periods of one year, and reengaged as required. Most TVET temporary staff are trade qualified, but are awaiting completion of their teaching qualification. All MoE teachers are subject to the rule of mandatory retirement at age 55. Direct school fund raising is discouraged, as it risks taking students away from their studies. Most vocational centres and schools do, however, engage in ‘grow, sew, make and sell’ activities, and MoE allows them to retain the proceeds to supplement their funding.

Research into the Financing of TVET in the Pacific Fiji Country Report
118
13.4 FNU FINANCIAL MECHANISMS
(a) Financial delegation and reporting
The FNU Council has the overall responsibility for the management of the University’s financial resources. Accountability for financial management within the University is delegated by the Council to the Financial Resources Committee (FRC) and to the Vice Chancellor who is the university’s chief accounting officer. Figure 13.4 illustrates the financial delegation and reporting lines within FNU.
Figure 13.4 Financial delegation and reporting within FNU
(b) Budget process
The annual budget process commences in January, and is based on actual annual accounts of the previous year, in time for submission to funding agencies’ deadlines. Budget planning in FNU begins in January, and is based on actual annual accounts of the previous year. It is conducted over a series of resource allocation and ‘planning and budget’ meetings, by heads of budget units and senior staff of the Finance Division, to determine spending priorities across the university, and to allocate funds in accordance with the medium term goals and strategies of FNU. Alternative draft budgets are considered by the vice chancellor before a final draft is submitted to the FRC for its scrutiny, and for approval by Council. The agreed budget proposal is then submitted to MoF and hence to CSB of Cabinet for their deliberations. Once the annual MoF operational and capital grants are approved, a process of review according to institutional priorities, the extent to which alternative sources of funds have to be tapped and/or expenditure priorities need to be reordered, is revisited by the vice chancellor, before a final FNU budget for the coming year is submitted to the FRC and Council for approval Budgetary Units are then required to keep their income and expenditure within the budgetary limits as approved by Council. (c) Internal financial mechanisms FNU is a dual-sector institution – it offers teaching and research programs within the higher education sector and training programs within TVET. Since the amalgamation of what were five stand-alone training institutions, and the then Training and Productivity Authority of Fiji
University Council
Financial Resources Committee
Vice Chancellor – Chief Accounting Officer
Director Finance
Heads of Budgetary Units (e.g Directors, Deans)

Research into the Financing of TVET in the Pacific Fiji Country Report
119
(PTAF), into the new institution in 2009-10, (see Chapter 8) the funding of and expenditure on the two sectors have become increasingly integrated.34 At least four of the five constituent colleges of FNU and the NTPC, as PTAF became within the university, offer certificate and diploma courses that fall within the scope of TVET for the purposes of this study. Mostly, these courses are offered by specific schools, divisions and departments within the colleges and NTPC and the heads of these have the responsibility for preparing budget submissions that reflect the requirements of TVET provision.
FNU receives its annual recurrent funding from MoF as a single one-line SEG 6 grant (and its capital funding through SEG 10 grants). Even though the recurrent grant was based upon a detailed operating budget submission to the CSB, once the university receives its annual grant it has the autonomy to (a) distribute the funds internally between colleges, schools and other budget heads, as it sees fit, but also (b) switch funds between SEGs. Unlike with other government ministries and agencies this means inter alia it can shift funds into personnel expenditure categories as well away from them. It has the authority to do that because FNU staff and workers are employed directly by the university, and not under the PSC, and hence has the ability to engage and terminate employees at its own discretion. Salaries, and other terms and conditions of employment of FNU staff are determined by Council.
(d) National training levy/grant scheme
The national training levy/grant scheme is administered by FNU under the provisions of the Training Act 10 of 1973, amended in 2003 and November 2010. It assumed this responsibility when TPAF was amalgamated into the university, as NTPC. The funds raised from the training levy are intended to be used primarily for in-service training of employees of levy payers, managing apprenticeship schemes, trade testing, productivity promotions and education and training in the national interest. The training levy is a statutory requirement that obligates all employers in Fiji, except those that are specifically exempted by law, but including PSC on behalf of the government, to pay a levy of one percent of gross payroll. Since the establishment of FNU, these are part of the revenue of the university. The legislation also provides for a training grant scheme to operate alongside the levy scheme, as an incentive for industrial training, wherein levy-payers can reclaim up to a maximum of 90 percent of their basic levy payment. The grants scheme, along with the levy scheme, is administered by FNU’s Finance Department, in conjunction with NTPC. Organisations can claim back funding paid under the national training levy scheme through applications to the training grant scheme. Employers have two options – they can claim back funding under the training grant scheme either through Method A or Method B, but not both:
Method A (also referred to as the ‘return on levy’ scheme). This approach is applicable to organisations that operate their own systematic training programs that cover all their employees. Method B (also referred to as the ‘daily grant’ scheme). This scheme is open to those organisations that do not have established systematic training programs for their employees.
34
Recognition that the new institution is of a dual sector nature is evident in Section 31 of FNU
Decree 2009 (as per the 2010 Amendment): ‘The Council must ensure that policies are put in place to appoint such other officers as necessary for efficient functioning of the University, including, but not restricted to, the appointment of an officer with responsibility for ensuring at all times an appropriate balance between academic education and technical/vocational education and training’.

Research into the Financing of TVET in the Pacific Fiji Country Report
120
Method A applications Each Method A application is assessed by NTPC. The assessment is based on the 10 criteria listed in Table 13.2, and the organisation is awarded points against each criterion.35 Grants are assessed as a percentage of the levy paid (up to a maximum of 90 percent). The higher the assessed score against the criteria the greater the proportion of the levy returned as a grant.
Table 13.2 Method A assessment criteria
Criteria Points
Training design and plan 33.0
1. Training policy and training needs analysis 20.0
2. Training plan 13.0
Training implementation 38.0
3. Training staff 6.0
4. Training facilities 5.0
5. Execution of training plan 27.0
Specific areas of training 17.0
6. Induction training 3.0
7. Occupational health and safety training 4.0
8. Employment relations training 4.0
9. Management and supervisory development training 6.0
Evaluation 12.0
10. Evaluation of training 12.0
Total 100.0
Method B applications Grant applications can be made by organisations for training undertaken externally by approved providers, or in-house off-the-job. The aim of this grant application method is to encourage employers to train employees in approved programs for specific occupations, without the necessity of establishing a fully dedicated in-house training facility. It is viewed, by the scheme’s administrators as being particularly attractive to small and medium-sized organisations.36 Under Method B, grants are payable to organisations on a daily basis for specific training activities. Payments are linked to the employee’s earnings. For approved training programs the grant can comprise a daily grant, for each day the trainee is away from his or her normal
35
Details of the criteria are given in TPAF Grant Scheme 5, Effective from 1 January 2010. 36
See previous footnote.

Research into the Financing of TVET in the Pacific Fiji Country Report
121
place of work, a residential grant for each night spent away from home, and provision for travel costs. Applications can cover full-time and part-time training courses at approved local training institutions or approved institutions overseas. Approved programs can include distance and flexible learning (DFL) courses, and e-Learning programs. They can also include in-house training programs that have been given ‘grant claimable’ status by NTPC. Trainees are paid their normal wages during training, are not obliged use up leave entitlements to undertake training, and do not have to compensate employers for time away from their normal duties. FNU regulations with respect to the training levy/grant scheme The main regulations for the scheme are as follows.
The Levy Order meets the definition of a government grant and shall be accounted under IAS20 Accounting for Government Grant and Disclosure of Government Assistance. In addition, IAS 20.12 requires that government grants are recognized in the profit or loss accounts on a systematic basis over the periods in which the entity recognizes as expenses and related costs for which the grants are intended to compensate.
The levy shall be treated as deferred income to the extent of 90 percent of the levy paid. The remaining 10 percent shall be treated as income to the Levy and Grants Section for the administration of levy.
The deadline for payment of grants shall be six months. Treatment of Levy from Deferred Income to Levy Income upon grant claim shall be as follows:
o For Method A Employers, upon full payment of grant claim, any residual shall be transferred to NTPC as Levy income.
o For Method B Employers, upon full payment of grants claims, only 50 percent of the residual sum shall be transferred to NTPC Levy income. The remaining 50 percent residual shall be held till the end of year for claim before transferring to income.
An interest penalty is charged monthly to all employers (except doubtful cases) who have outstanding levies and is calculated at the rate of 1 percent per month based on the individual six monthly periods outstanding until fully paid. Employers requesting for waiver of interest will have to write to the FNU requesting for a waiver based on reasons. The Vice Chancellor shall have full and final discretion for the Waiver of the Interest Penalty. He may, however, delegate full authority to the Director of Finance.
The payment of all grants is subject to the General Conditions which are laid down in the Grant Scheme Booklet. The Grants Scheme is continually revised and the latest version of the Scheme will supersede the earlier version.
The Director of Finance will approve the percentage grant to be paid. The report prepared by the Grants Assessment officer will be endorsed and the officer will prepare a payment voucher.37
37
FNU Finance Policies: Adopted 2010 – Revised December 2012, Sections 12 and 22.

Research into the Financing of TVET in the Pacific Fiji Country Report
122
(e) Apprenticeship scheme The Council of FNU is empowered to make orders, known as Training Orders, regulating the employment, training and minimum remuneration of apprentices in any particular trade or occupation, and prescribing fees, etc. An apprenticeship agreement is a three-way agreement between the apprentice (or his or her parents), the employer and the university, for a specified period of time. The apprenticeship scheme is funded through the national levy/grant scheme and administered through NTPC. The Council of FNU is also empowered to issue training orders, in relation to or regulating the employment and training of, persons other than apprentices.
13.5 PRIVATE TVET PROVIDERS
Government funding for PSET providers in Fiji is limited to selected not-for-profit (charitable) institutions that are registered with MoE. Historically, this has involved the transfer of funds from MoF to MoE, which in turn transfers funds as operating and capital grants to the institutions. Funding to most CSO and faith-based providers is largely based on a mix of some or all of student fees, fund raising, philanthropy, and aid from development partners, with some government assistance. The training centre for disabled youth, FVTTCPD, operates with three fully-funded MoE teachers and ten non-MoE staff members. The centre charges fees of just FJ$10 per term, and receives an operating grant from the ministry. It collects a grant from MSWWPA, draws funds from the Fiji National Council for Disabled Persons, engages in appeal-based fundraising and generates income from its ‘make/grow/sew and sell’ marketing. In recent times it has received capital works assistance from the Australian aid program. Despite all this, it is barely able to make its FJ$140,000 operating budget, and can pay just FJ$3 per hour to its non-MoE staff.
13.6 DEVELOPMENT PARTNER FUNDING MECHANISMS
Development partner assistance to TVET comes in two forms - as grants in aid and as direct payments under concessional loans from international development agencies. The former in turn come is two forms – cash grants, which as has been noted, are included in MoF’s cash-based budget estimates, and grant aid-in-kind which does not. Cash grants become part of general revenue and it is not possible to determine whether TVET receives any of this funding. The TVET sector does, however, receive assistance from grant aid-in-kind, through the imputed contribution that Australia makes through the Fijian operations of APTC, and through scholarships. As was shown in Chapter 7 direct payments through concessional loans are primarily directed towards large infrastructure programs. At the time of writing, the TVET sector was not receiving any such loans. The ODA Program (i) Budget & Aid Coordinating Committee (BACC)
ODA to Fiji is coordinated by the BACC, whose membership consists of:

Research into the Financing of TVET in the Pacific Fiji Country Report
123
o Permanent Secretary for Finance; o Permanent Secretary for Strategic Planning, National Development and Statistics; o Deputy Secretary, Office of Prime Minister; o Secretary for the Public Service; o Permanent Secretary for Foreign Affairs and International Co-operation; and o Deputy Secretary, Ministry of Finance.
The role of the BACC is to: o provide advice to the government on ODA; o oversee planning and implementation; o appraise and approve aid funded programs and projects; o promote dialogue with development partners; and o assess and recommend improvements to ODA mechanisms.
(ii) MoF’s ODA Unit
The secretariat of BACC is the ODA Unit within the MoF. The unit coordinates and monitors all bilateral and multilateral aid (including ADB concessional loans) received by GoF. It also conducts research into matters of policy, systems and procedures for the better management, efficient monitoring and effective coordination of aid, and the analysis of trends in the use of aid. It provides advice to BACC and Cabinet on aid matters, evaluates aid project proposals, and develops policies and procedures for management & coordination of aid. Other relevant agencies Two other government agencies have a role in the ODA process: the Development Cooperation and Facilitation Division within the Office of the Prime Minister facilitates and coordinates the implementation of projects funded through Chinese cash grants and loans, and the International Cooperation Division within the Ministry of Foreign Affairs and International Cooperation supports BACC and operates as the diplomatic contact point for ODA to Fiji. The ODA process There are three main phases: planning, disbursement and monitoring. These processes are built into MoF’s annual budget process, as outlined Section 13.2. The planning phase of the annual ODA process is illustrated in Figure 13.5, and the disbursement and monitoring phases in Figure 13.6.

Research into the Financing of TVET in the Pacific Fiji Country Report
124
Figure 13.5 ODA budget planning process
Figure 13.6 ODA disbursement and monitoring processes
Disbursement
Ministry of finance
o Assess/process applications
o Issue cheques through
budget/accounts process
Ministries and departments
o Receive notification from donors on
remittance of aid funds
o Apply for release of funds
Implementation of aid-funded projects and programs
Monitoring
GoF and donors jointly monitor and evaluate partners (site visits, progress reports, etc)
1. Baseline Budget ODA
Baseline is set by MoF and sent to all donors, ministries and departments
2. Consultations
o First round of consultations between MoF,
donors and implementing agencies
o Second round of consultations to confirm/
agree on projects to be included in the annual
budget
2A. MoF draws up ODA design list
Design list is discussed and finalised with donors and implementing agencies
3. Finalisation of aid/ODA estimates
ODA budget is finalised/confirmed with donors and included in the budget estimates
4. Budget announcement
Copies of budget documents are sent to donors

Research into the Financing of TVET in the Pacific Fiji Country Report
125
13.7 FUNDING MECHANISMS FOR THE RCCCE AND CETC
RCCCE
USP’s RCCCE, now called the Centre for Vocational and Continuing Education (CVCE) is a self-funding vocational arm of the University. One of its programs -Certificate in Early Childhood Education (ECE) - had an enrolment of 106 EFTS in 2012.
The Centre for Vocational and Continuing Education (CVCE) is a self-funding vocational arm of USP. One of its programs, the Certificate in Early Childhood Education (ECE), had an enrolment of 106 EFTS in 2012.
CVCE offers vocational qualifications from levels 3 to 6 of the FQF, NZQF and AQF. The Centre has recently added the following programs to its scope:
Certificate in Library & Information Studies (Level 4);
Certificate IV in Office Management;
Certificate IV in Human Resource Management; and
Certificate IV in Project Management.
Three more programs have been endorsed by the USP Academic Standards and Quality Committee, and await formal approval. They are:
Certificate in Community Development;
Certificate IV in Information Technology (Support); and
Professional Diploma in Business Management.
CVCE also offers over 160 CPE/CPD short courses, and has a Memorandum of Understanding with Sydney Institute of TAFE for QA on its AQF programs. Program fees vary, however, as an example, the Certificate IV in Project Management is a six module program priced at FJ$500 per module. The Certificate III in Information Systems is a three module program at FJ$400 per module.
A number of programs are offered in flexible modes, and there are plans in 2014 to work with Commonwealth of Learning (CoL), Open Polytechnic New Zealand (OPNZ), and USP’s Centre for Flexible Learning (CFL), to translate more face-to-face courses into flexible delivery modes. All CVCE programs will have pathways into higher studies offered by the University.
CETC
The Community Education Training Centre (CETC) of SPC provides a range of training to meet development needs, including courses in the area of community care for adults. The Centre’s previous mainstay course, the residential, fee-free, Certificate III in Applied Community Development, was transferred to USP in 2012. It will, however, continue to offer short courses to support women, youth and communities in the Pacific.
13.8 AUSTRALIA-PACIFIC TECHNICAL COLLEGE
APTC’s operations in Fiji include its regional headquarters in Nadi and its training campuses in Nadi and Suva. APTC is part of Australia’s regional assistance program. APTC operates campuses in PNG, Samoa and Vanuatu, as well as Fiji, and more recently in Solomon Islands.
At the time of the fieldwork, APTC was mid-way through its second four-year funding stage. It is managed for DFAT by a consortium which includes two Australian TAFE Colleges. One College is responsible for the operations of the college’s School of Trades and Technology (STT) and the other the School of Hospitality and Community Services (SHCS). The APTC’s management is responsible to a Board of Directors, who approve APTC’s annual expenditure program.

Research into the Financing of TVET in the Pacific Fiji Country Report
126
13.9 NATIONAL AND DONOR-FUNDED SCHOLARSHIPS
There are a variety of scholarship and student loan schemes available to applicants undertaking TVET programs in Fiji. These include:
Australian Awards Scholarships, and Australian Awards Pacific Scholarships;
Indian High Commission to Fiji scholarships;
United World College scholarships;
provincial scholarships administered by individual provinces that have raised the appropriate funds;
Embassy of Japan scholarships;
NZ Pacific Scholarships for Fiji; and
a collection of international scholarships at individual institutions in Australia and overseas.
MoF also funds a number of scholarships administered through the PSC and the MoiTA:
PSC Scholarship Scheme for Special Children – FJ$200,000;
PSC Multi-Ethnic Affairs Scholarship – FJ$5.5 million;
PSC Overseas/International Scholarships – FJ$2.5 million;
PSC Local Scholarships FJ$3.6 million;
PSC Student Loan Scheme – FJ$1.0 million;
PSC Tertiary Education Loan Scheme – FJ$2.0 million;
TVET and Commercial Agriculture Scholarships – FJ$5.5 million;
FSM (medical) scholarships – FJ$2.5 million; and
MoiTA local and international scholarships – FJ$10.0 million.
Funds for the student loan scheme, tertiary education loan scheme, and the recently introduced TVET and Commercial Agriculture Scholarships, are held by MoF and only paid on acquittal.
13.10 FUTURE ROLE OF FHEC
Since its formation in 2010 FHEC has quickly established itself as the regulatory and standard-setting authority for post-secondary education and training (PSET) in Fiji, through its work on the FQF, through the recognition and registration of PSET providers and the accreditation of their program and course offerings. Two other important roles it has been assigned are in the process of being developed, and the next few years will see them come to fruition.
FHEC has been mandated 11 functions. Amongst these functions are:
7. To allocate government funds marked for higher education annually for higher education institutions according to transparent and well-publicised criteria for allocation; and
9. To maintain a database of higher education information.38
The former is particularly significant, because it will transform FHEC from being a regulatory and standard-setting authority into a higher education (PSET) grants commission as well. It will become the conduit through which government funding to FNU and the other PSET providers in Fiji will be channelled. Moreover, the mandate requires FHEC to establish the allocative mechanisms and the criteria upon which they are based. FHEC has determined
38
FHEC Strategic Plan, 2012-2015, page 5. See also FHEC Annual Business Plan, 2013, page 3.

Research into the Financing of TVET in the Pacific Fiji Country Report
127
that these criteria will be those that are ‘fair and equitable, and sensitive to national priorities.’39
In the strategic plan the clear indication is that these criteria are being interpreted to mean that the proposed PSET funding model will recognize performance (outputs and outcomes) as much as costs (inputs), which have hitherto been the major drivers of government funding of PSET institutions. They call for quantitative data on performance (in terms of quality outcomes) that are able to be related to quantitative data on inputs.
The requirement that the funding model is to be based upon quantitative data relating to outputs and outcomes (eg course enrolments and completions) as well as quantitative data on inputs (eg teaching and non-teaching staff, personnel expenditure and MOOE) underscores the need for FHEC to speed up the introduction of the mandated PSET information database. Performance based funding models and well-developed information management systems go hand-in-hand. As has been noted elsewhere in this report, there is a marked lack of regularly up-dated and comprehensive statistics regarding PSET in Fiji, upon which policymakers and planners can rely.
Cabinet has approved new policy that stipulates that funding will be informed by the values of ‘fairness, equity, transparency, and quality’. Under the new scheme funding will be targeted, and it will be open to providers registered with FHEC that have minimum requirement processes and policies in operation including QA.
39
FHEC Strategic Plan, 2012-2015, page 18

Research into the Financing of TVET in the Pacific Fiji Country Report
128
CHAPTER 14. TVET FINANCIAL PATTERNS AND TRENDS
In Chapter 2, the study team identified the scope of the TVET sector in Fiji within the brief provided for the research. In Chapter 12, the major components of funding and expenditure across the sector were estimated, and Chapter 13 identified and traced the principal financial mechanisms for distributing funds across the sector and allocating expenditures. In this chapter a more detailed examination of funding and expenditure patterns is conducted, beginning with the contribution to expenditure on TVET made by the Ministry of Finance through its annual budget allocations.
14.1 MINISTRY OF FINANCE BUDGETARY ALLOCATIONS TO TVET
MoF is one of the major conduits through which funds are allocated to TVET providers and regulators. The funds come from the government’s general revenue collected by FRCA and through targeted grant aid-in-kind that is part of the country’s ODA program. Table 14.1 is a compilation of published data drawn from the MoF annual budget estimates for 2013, augmented in places with more detailed previously unpublished information. The figures are as detailed and as TVET specific as it was possible for the team to get, working together with officers of MoF. None of the figures are estimates, in the sense that they are not based, as are some of the estimates given in Chapter 12, on any assumptions made by the team. This does mean that perforce in some instances the figures overestimate the amounts allocated to TVET. This is the case, for example, with the allocations to FNU, where MoF did not require the university to provide a budget submission that allowed a distinction to be made between its higher education and TVET activities (see also Section 14.2). Another example is in the annual operating grant to FHEC. In this case the very nature of the Commission’s work makes such a distinction impractical. MoF makes annual allocations not just for the provision of TVET but also for its oversight, management and regulation. Table 14.1 includes the expenditure estimates for FHEC and for PSC, neither of which are training providers per se, but their funding is an integral part of the overall resourcing of the sector. PSC plays a key role in facilitating training within the public sector, for managing the scholarship component of TVET funding and, significantly, with contributing the public service’s component of the national training levy. This annual expenditure, in turn, becomes part of the annual funding of FNU. The university also performs a vital role as a regulator of the TVET sector, primarily through NTPC and its responsibilities with respect to the national training levy and grant scheme, the national apprenticeship scheme, and the national trade testing and certification scheme. However, expenditure allocations for these purposes are not identified by MoF, but are part of the annual operating grant the university receives (see also Section 14.2). One of the most striking features of the picture presented by Table 14.1 is the diversity and complexity of the funding of TVET that passes through the MoF. Allocations are made across the full expenditure spectrum, from direct appropriations to cover personnel expenditure and MOOE, and for capital and development programs, and appropriations that are made as block grants and transfers. The table includes allocations made out of consolidated revenue as well as from grant aid-in-kind. The latter, assistance to the TVET sector coming from development partners, is in the form of scholarships and a figure provided by Australia for the annual operating expenditure of APTC. Even though both scholarships and APTC are funded directly under the Australian government’s regional development program, they are included in the MoF’s annual accounts as an expenditure item (see also Section 14.6).

Research into the Financing of TVET in the Pacific Fiji Country Report
129
Table 14.1 Expenditure allocations to TVET from government and ODA sources, 2013 (FJ$ ‘00s)
TVET program/ activity Personnel MOOE Operating
grants Total
recurrent Capital
and devel.
Total budget
(including VAT
Grant aid-in-kind
Total
PSC training section 968.0 78.0
1,046.0 - 1,057.7
1,057.7
NTPC levy
1,249.7 1,249.7
1,249.7
1,249.7
scholarships
750.0 750.0
750.0 1,648.9 2,398.9
Public Service Commission 968.0 78.0 1,999.7 3,045.7 - 3,057.4 1,648.9 4,706.3
CATD - - 627.0 627.0 - 627.0 - 627.0
scholarships
1,000.0 1,000.0
1,000.0
1,000.0
Min. of iTaukei Affairs - - 1,627.0 1,627.0 - 1,627.0 - 1,627.0
NEC - 873.3
873.3 - 873.3
873.3
Min. of Labour - 873.3 - 873.3 - 873.3 - 873.3
annual operating grant - - 800.0 800.0 - 800.0
800.0
FHEC - - 800.0 800.0 - 800.0 - 800.0
operating expenditure - -
- -
21,336.0 21,336.0
APTC - - - - - - 21,336.0 21,336.0
vocational schools 421.1 551.0
972.1 - 1,230.4
1,230.4
mainstreaming TVET courses - 1,171.0
1,171.0 - 1,171.0
1,171.0
training grant - TVET - - 180.0 180.0 - 180.0
180.0
Montfort Boys' Town - - 780.0 780.0 - 780.0
780.0
Min. of Education 421.1 1,722.0 960.0 3,103.1 - 3,361.4 - 3,361.4
women's skills training - - 400.0 400.0 - 400.0
400.0
Yellow Ribbon training - - 100.0 100.0 - 100.0
100.0
Min. of W,SW and PA - - 500.0 500.0 - 500.0 - 500.0
YTC upgrades - -
- 220.0 220.0
220.0
Youth 777.4 1,300.8
2,078.2 - 2,210.7 25.0 2,235.7
Min. of Youth and Sport 777.4 1,300.8 - 2,078.2 220.0 2,430.7 25.0 2,455.7
FNU operating grant 14,400.0 9,600.0
24,000.0 3,000.0 27,000.0
27,000.0
FNU maritime school - -
- 1,000.0 1,000.0
1,000.0
Fiji National University 14,400.0 9,600.0 - 24,000.0 4,000.0 28,000.0 - 28,000.0
Tutu rural training centre - - 350.0 350.0 - 350.0
350.0
Taveuni training centre 20.0 75.0
95.0 5.0 100.0
100.0
Koronivia training centre 60.0 40.0
100.0 - 100.0
100.0
Farm management training 70.0 30.0
100.0 - 100.0
100.0
Dep't of Agriculture 150.0 145.0 350.0 645.0 5.0 650.0 - 650.0
Forestry training 263.4 319.7
583.1 - 631.1
631.1
Dep't of Forest and Fish 263.4 319.7 - 583.1 - 631.1 - 631.1
Centre for SME development - - 500.0 500.0 - 500.0
500.0
Cooperative business training 88.3 45.1
133.4 - 140.2
140.2
Min. of Industry and Trade 88.3 45.1 500.0 633.4 - 640.2 - 640.2
Estimated public expenditure on TVET
17,068.2 14,083.9 6,736.7 37,888.8 4,225.0 42,571.1 23,009.8 65,580.9
percent of MoF total government budget
2.9% 5.4% 1.9% 3.1% 0.6% 2.1% 14.8% 3.0%
Source: MoF Budget Estimates, 2013.
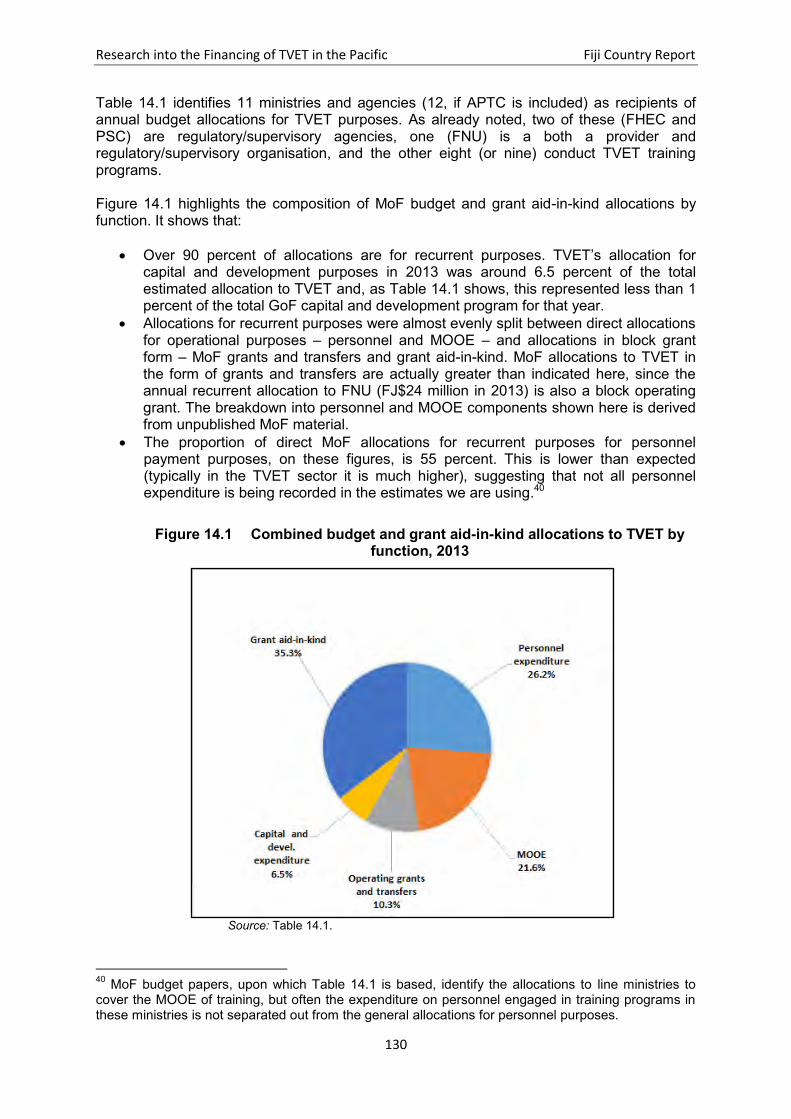
Research into the Financing of TVET in the Pacific Fiji Country Report
130
Table 14.1 identifies 11 ministries and agencies (12, if APTC is included) as recipients of annual budget allocations for TVET purposes. As already noted, two of these (FHEC and PSC) are regulatory/supervisory agencies, one (FNU) is a both a provider and regulatory/supervisory organisation, and the other eight (or nine) conduct TVET training programs. Figure 14.1 highlights the composition of MoF budget and grant aid-in-kind allocations by function. It shows that:
Over 90 percent of allocations are for recurrent purposes. TVET’s allocation for capital and development purposes in 2013 was around 6.5 percent of the total estimated allocation to TVET and, as Table 14.1 shows, this represented less than 1 percent of the total GoF capital and development program for that year.
Allocations for recurrent purposes were almost evenly split between direct allocations for operational purposes – personnel and MOOE – and allocations in block grant form – MoF grants and transfers and grant aid-in-kind. MoF allocations to TVET in the form of grants and transfers are actually greater than indicated here, since the annual recurrent allocation to FNU (FJ$24 million in 2013) is also a block operating grant. The breakdown into personnel and MOOE components shown here is derived from unpublished MoF material.
The proportion of direct MoF allocations for recurrent purposes for personnel payment purposes, on these figures, is 55 percent. This is lower than expected (typically in the TVET sector it is much higher), suggesting that not all personnel expenditure is being recorded in the estimates we are using.40
Figure 14.1 Combined budget and grant aid-in-kind allocations to TVET by
function, 2013
Source: Table 14.1.
40
MoF budget papers, upon which Table 14.1 is based, identify the allocations to line ministries to cover the MOOE of training, but often the expenditure on personnel engaged in training programs in these ministries is not separated out from the general allocations for personnel purposes.

Research into the Financing of TVET in the Pacific Fiji Country Report
131
The composition of MoF budget and grant aid-in-kind allocations by ministry and agency is shown in Figures 14.2 and 14.3. The former focuses upon the composition of the budget estimates to TVET and the latter shows how that changes when grant aid-in-kind is included.
Figure 14.2 Budget allocations to TVET, by ministry and agency, 2013
Source: Table 14.1
Figure 14.3 Combined budget and grant aid-in-kind allocations to TVET by
ministry and agency, 2013
Source: Table 14.1

Research into the Financing of TVET in the Pacific Fiji Country Report
132
Figure 14.2 illustrates the dominant role of FNU in the TVET sector in Fiji. Even though there are 11 government ministries and agencies receiving budget allocations for TVET purposes, FNU is in receipt of almost two-thirds of that amount. Together the two regulatory/supervisory bodies (PSC and FHEC) account for another 13 percent, leaving the remainder, including MoE and its 87 vocational schools, sharing slightly less than one-quarter of the annual TVET allocation. The only organisation that is close to FNU in terms of the size of public funding (budget plus grant aid-in-kind) that it attracts for TVET is APTC, and when its funding and expenditure is added in, as in Figure 14.3, the two providers together account for three-quarters of the total. The relatively limited funding for other providers is one of the most striking features of the TVET sector in Fiji. Because of their different roles in the TVET sector, differences in the relative importance of the training function in their respective ministries and agencies, and the relative importance of the budget and grant aid-in-kind in their funding, the functional composition of the expenditure allocations for TVET purposes in the twelve ministries and agencies differ substantially. This is illustrated in Figure 14.4.
Figure 14.4 Composition of public expenditure allocations to TVET, by function, 2013
Source Table 14.1
The annual expenditure on TVET that is budgeted for by MoF out of consolidated revenue and from grant aid-in-kind, needs to be set in context. Figure 14.5 shows that the estimated FJ$42.5 million total budget allocation to TVET in 2013 represented about 2 percent of the total budget for that year. Figure 14.6 shows the estimated contribution to the sector by APTC and scholarships directed at TVET make up about 15 percent of grant aid-in-kind in

Research into the Financing of TVET in the Pacific Fiji Country Report
133
2013, but even when that is added in, it is clear from Figure 14.7 that the sector only accounted for about 3 percent of the combined total MoF allocation.
Figure 14.5 Estimated MoF expenditure on TVET as a percentage of total budget expenditure, 2013
Source: MoF Budget Estimates, 2013
Figure 14.6 Estimated expenditure on TVET programs, as a percentage of total grant aid-in-kind, 2013
Source: MoF Budget Estimates, 2013
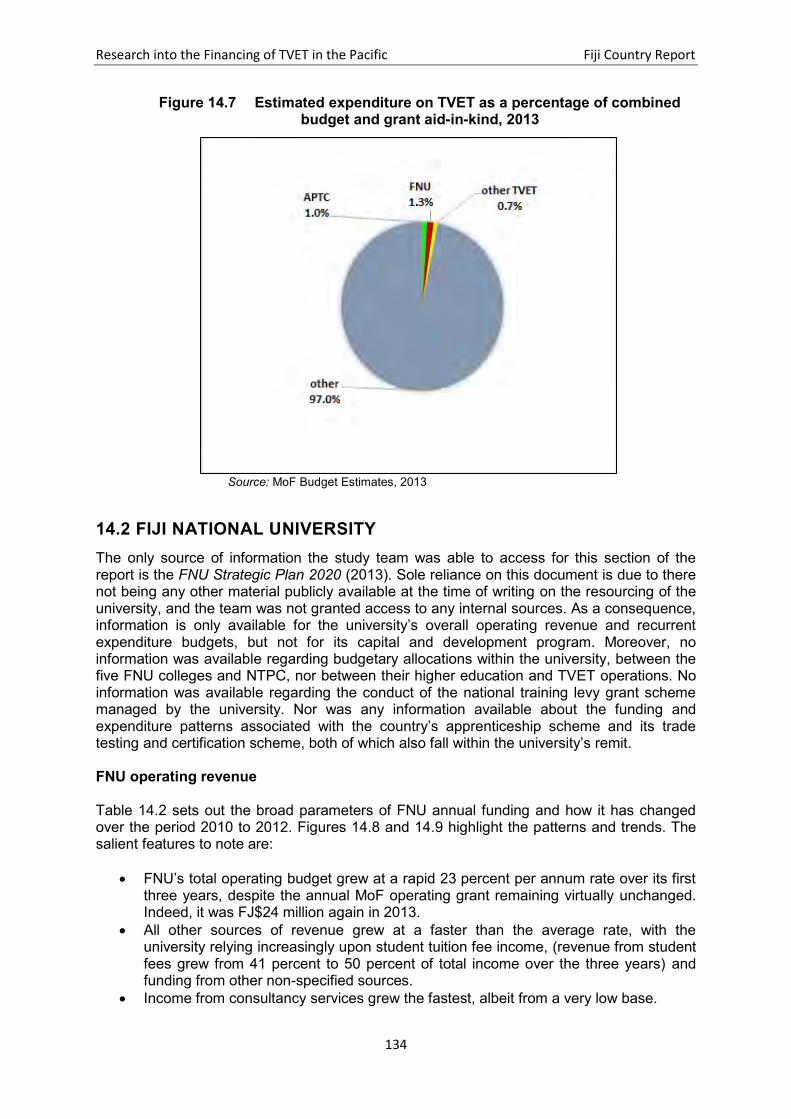
Research into the Financing of TVET in the Pacific Fiji Country Report
134
Figure 14.7 Estimated expenditure on TVET as a percentage of combined budget and grant aid-in-kind, 2013
Source: MoF Budget Estimates, 2013
14.2 FIJI NATIONAL UNIVERSITY
The only source of information the study team was able to access for this section of the report is the FNU Strategic Plan 2020 (2013). Sole reliance on this document is due to there not being any other material publicly available at the time of writing on the resourcing of the university, and the team was not granted access to any internal sources. As a consequence, information is only available for the university’s overall operating revenue and recurrent expenditure budgets, but not for its capital and development program. Moreover, no information was available regarding budgetary allocations within the university, between the five FNU colleges and NTPC, nor between their higher education and TVET operations. No information was available regarding the conduct of the national training levy grant scheme managed by the university. Nor was any information available about the funding and expenditure patterns associated with the country’s apprenticeship scheme and its trade testing and certification scheme, both of which also fall within the university’s remit. FNU operating revenue Table 14.2 sets out the broad parameters of FNU annual funding and how it has changed over the period 2010 to 2012. Figures 14.8 and 14.9 highlight the patterns and trends. The salient features to note are:
FNU’s total operating budget grew at a rapid 23 percent per annum rate over its first three years, despite the annual MoF operating grant remaining virtually unchanged. Indeed, it was FJ$24 million again in 2013.
All other sources of revenue grew at a faster than the average rate, with the university relying increasingly upon student tuition fee income, (revenue from student fees grew from 41 percent to 50 percent of total income over the three years) and funding from other non-specified sources.
Income from consultancy services grew the fastest, albeit from a very low base.

Research into the Financing of TVET in the Pacific Fiji Country Report
135
Around 10 percent of FNU’s revenue in 2012 came from development assistance, but there were no details available as to the source and for what purpose it was provided.
Table 14.2 FNU sources of operating revenue, 2010 to 2012 (FJ$)
Source of revenue 2010 2011 2012
average annual
percentage change
Government grant 24,581,487 21,000,000 24,000,000 -1.2%
Student fees 26,274,168 36,844,992 48,845,298 36.3%
Development assistance 5,714,462 11,175,329 9,046,387 25.8%
Consultancy income 22,361 92,280 151,911 160.6%
Other income 7,405,637 10,568,047 15,236,868 43.4%
Total 63,998,115 79,680,648 97,280,464 23.3%
Source: FNU Strategic Plan 2020, Table 3, page 7.
Figure 14.8 FNU sources of operating revenue, 2010 to 2012
Source: Table 14.2.

Research into the Financing of TVET in the Pacific Fiji Country Report
136
Figure 14.9 Composition of FNU operating revenue, 2010 to 2012
Source: Table 14.2
FNU recurrent expenditure Table 14.3 provides a broad picture of the functional composition of FNU recurrent expenditure from 2010 to 2012, and Figures 14 10 and 14.11 highlight the patterns and trends.
Table 14.3 FNU recurrent expenditure by function, 2010 to 2012 (FJ$)
2010 2011 2012
average annual
percentage change
Staff costs 35,791,557 46,378,693 50,351,182 18.6%
Operating costs 12,468,807 22,446,212 21,387,715 31.0%
Depreciation and provision 7,008,570 9,082,953 10,205,224 20.7%
Other 9,400,903 18,500,066 19,257,869 43.1%
Total 64,669,837 96,407,924 101,201,990 25.1%
Source: FNU Strategic Plan 2020, Table 3, page 7.
The information shows that FNU’s expenditure outgrew revenue over the period, thus increasing in absolute and relative terms the operating deficit. Over the period personnel expenditure remained the dominant expenditure category, although it grew at the slowest rate of all four categories identified. MOOE grew substantially in absolute and relative terms, but the unspecified expenditure category ‘other’ grew the most rapidly – doubling over the period, and increasing its share of recurrent expenditure from less than 15 percent to almost 20 percent.
Research into the Financing of TVET in the Pacific Fiji Country Report
137
Figure 14.10 FNU expenditure by function, 2010 to 2012
Source: Table 14.3
Figure 14.11 Composition of FNU expenditure, 2010 to 2012
Source: Table 14.3

Research into the Financing of TVET in the Pacific Fiji Country Report
138
14.3 MINISTRY OF EDUCATION VOCATIONAL SCHOOLS
The study team was able to obtain from MoE revenue and expenditure data that covered all 87 vocational schools under its administration. Even though all but four are owned by non-government bodies – church organisations mainly (see Chapter 8) – little, if any, of their funding come from these parent bodies. Sources of revenue Table 14.4 provides details of the aggregate revenue that was available to fund the operations and capital works programs in vocational schools in 2012, and what that translated to in terms of average funding per school. Figure 14.12 shows the relative contribution made by each funding source. The key features of vocational school funding are:
Only an estimated FJ$4.37 million, or about FJ$49,000 per school, was available to finance vocational training in these schools in 2012.
The bulk of that funding was from MoF budget allocations directed through MoE. Only 16 percent came from tuition fees.41 Individual schools could also raise revenue from the sale of products, principally from vegetable gardens developed and maintained by students on school sites, but the team was not able to obtain an estimate of how much was raised in this way.
Most of the MoF funding came under the budget standard expenditure groups (SEG) 1 and 2 for personnel purposes. This constituted 78 percent of the total funding available. SEG 3 to 7, for MOOE purposes, and SEG 8 and 9 for capital programs, made up the rest.
Table 14.4 Revenue sources of MoE vocational schools, 2012 (FJ$)
SEG
1 and 2* SEG
3 to 7* SEG
8 and 9* fee
income Total
Total income 3,331,452 106,188 147,666 684,493 4,269,799
Average per school 38,293 1,539 9,844 8,347 49,078
*Standard Expenditure Groups of MoF annual budget allocations. Source: MoE supplied material.
Vocational schools under the aegis of MoE vary substantially in size, in terms of enrolments and the number of vocational programs they offer (see Chapter 8). Figure 14.13 illustrates how these differences are reflected in the spread of funding across the 87 schools. What is most apparent from this figure is just how skewed is the distribution of funding, and how small some of these schools are in terms of revenue as much as anything else. Approximately two-thirds have income below the average, and almost half have incomes of 50 percent or less of the average. It is also apparent that there were considerable variations in the actual and relative contributions of tuition fees to school budgets.
41
Whilst government schooling is officially tuition-free, the 84 privately-owned vocational schools can and do charge fees.

Research into the Financing of TVET in the Pacific Fiji Country Report
139
Figure 14.12 Revenue sources of MoE vocational schools, 2012
Source: Table 14.4
Figure 14.13 Revenue sources of MoE vocational schools, by school, 2012
*Standard Expenditure Groups of MoF annual budget allocations Source: Material provided by MoE.
SEG 1 and 278.0%
SEG 3 to 72.5%
SEG 8 and 93.5%
fee income16.0%

Research into the Financing of TVET in the Pacific Fiji Country Report
140
Expenditure patterns It is the clear policy and practice of MoE that vocational schools could neither exceed their annual budget allocations nor build up surpluses. That has meant that annual school expenditures equate with annual school revenues. This is illustrated in Table 14.5 for the year 2012, where the totals are the same as shown in Table 14.4. What is revealing however, in Table 14.5, and illustrated in Figure 14.14 is (a) the majority of teaching and other staff in vocational schools are ‘government wage earners’ or contract staff (SEG 2) not establishment staff (SEG1), and (b) that revenue collected by schools through tuition fees (and presumably through the proceeds of produce sales) go to bolster the MOOE component of their operations. MoE’s capital development program is only comparatively small. Figure 14.13 shows that only a limited number of schools were recipients of capital programs in 2012, and this is typical.
Table 14.5 Expenditure on MoE vocational schools, 2012 (FJ$)
Salaries, wages and other emoluments
MOOE Total
recurrent Capital
exp Total Exp Establish
staff
Gov’t wage
earners Total staff
Total expenditure 1,405,276 1,926,176 3,331,452 790,681 4,122,133 147,666 4,269,799
Percent of recurrent expenditure
34.09% 46.73% 80.82% 19.18% 100.00%
Average per school 22,666 23,490 38,293 9,088 47,381 1,697 49,078
Source: Material provided by MoE.
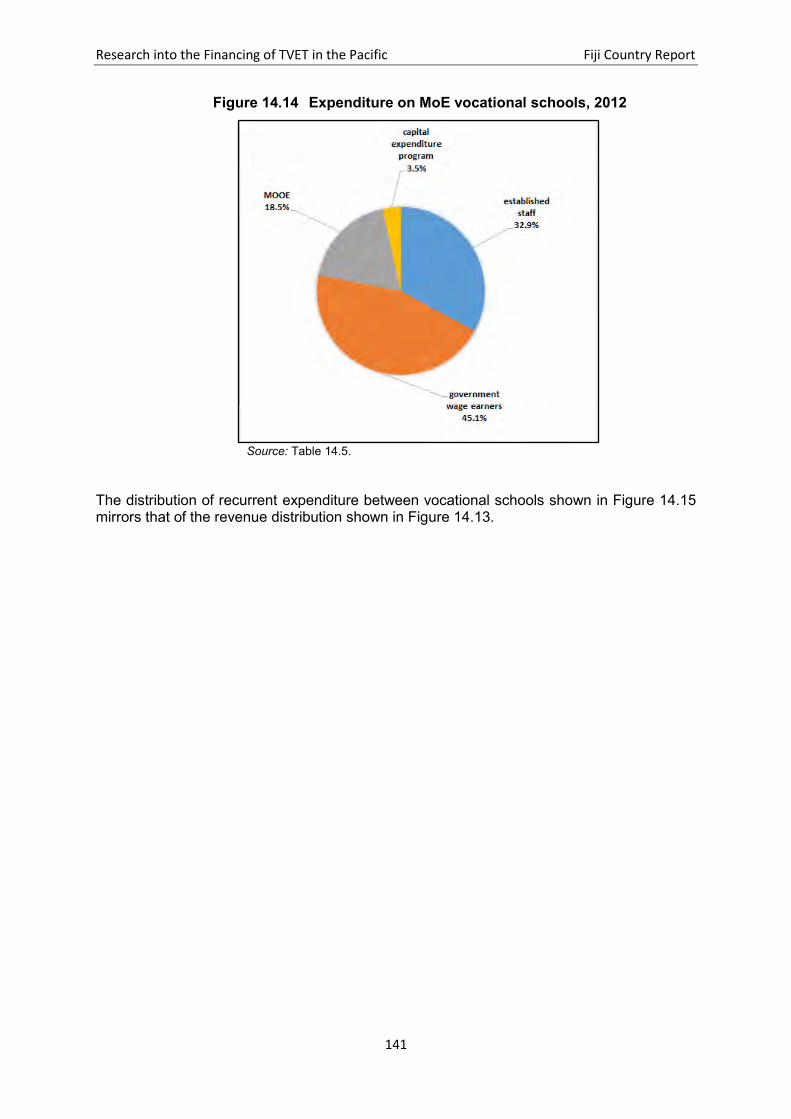
Research into the Financing of TVET in the Pacific Fiji Country Report
141
Figure 14.14 Expenditure on MoE vocational schools, 2012
Source: Table 14.5.
The distribution of recurrent expenditure between vocational schools shown in Figure 14.15 mirrors that of the revenue distribution shown in Figure 14.13.

Research into the Financing of TVET in the Pacific Fiji Country Report
142
Figure 14.15 MoE recurrent expenditure on vocational schools, by school, 2012
Source: Material provided by MoE.
Recurrent expenditure differs across vocational schools primarily on the basis of the number of staff employed in each school, and this in turn is determined by the number of enrolments in each school and the number of vocational programs offered. MoE apply the additional criteria of program type (field of training) and school location (proximity to a ‘parent’ secondary school, for example) when allocating the SEG 3 to 7 expenditure grant. The study team was able to plot variations in vocational school recurrent expenditure variations against student enrolments and the number of programs provided. The results are shown in Figures 14.16 and 14.17. What they show is the marked skewness in the distribution of funding allocations and spending across schools, observed in the distribution of student enrolments. The issue of the diseconomies of small-scale delivery of courses is taken up further in Chapter 16.
Figure 14.16 The relationship between recurrent expenditures per vocational school and the number of students enrolled, 2012
Source: Material provided by MoE.
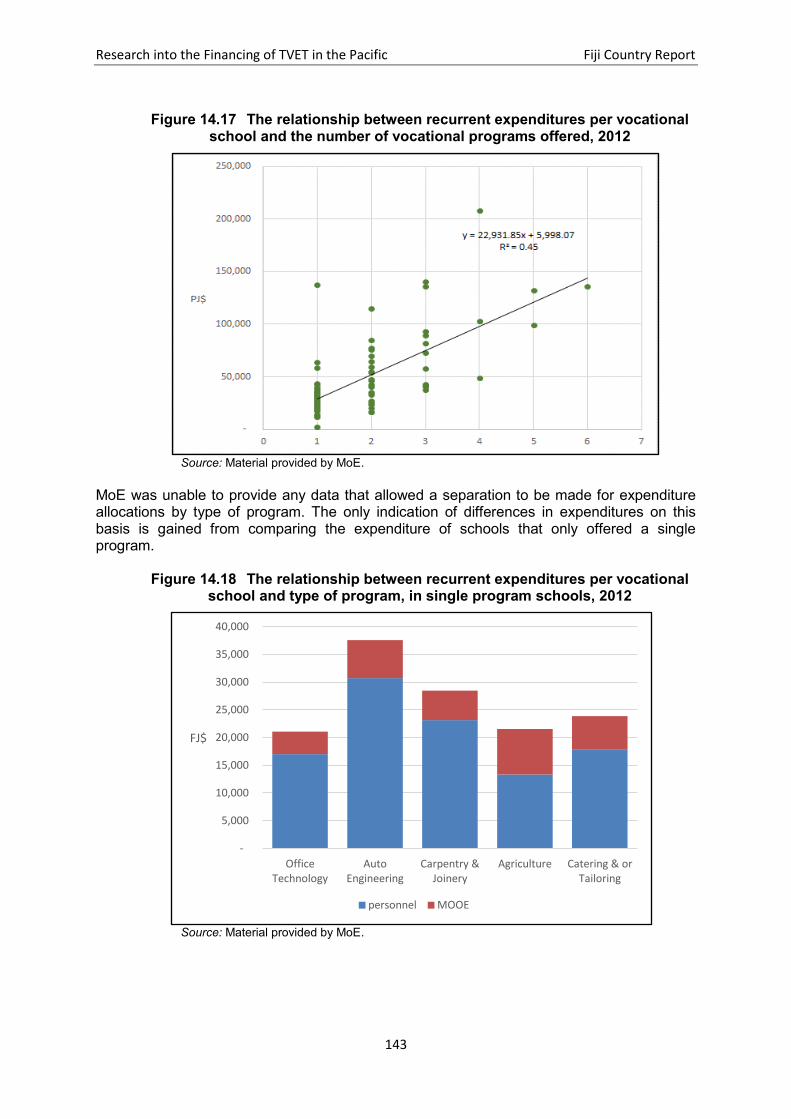
Research into the Financing of TVET in the Pacific Fiji Country Report
143
Figure 14.17 The relationship between recurrent expenditures per vocational
school and the number of vocational programs offered, 2012
Source: Material provided by MoE.
MoE was unable to provide any data that allowed a separation to be made for expenditure allocations by type of program. The only indication of differences in expenditures on this basis is gained from comparing the expenditure of schools that only offered a single program.
Figure 14.18 The relationship between recurrent expenditures per vocational
school and type of program, in single program schools, 2012
Source: Material provided by MoE.
-
5,000
10,000
15,000
20,000
25,000
30,000
35,000
40,000
Office Technology
Auto Engineering
Carpentry & Joinery
Agriculture Catering & or Tailoring
FJ$
personnel MOOE

Research into the Financing of TVET in the Pacific Fiji Country Report
144
The average expenditure of single program schools, by type of course provided, are given in Figure 14.18. It shows that the two most technical courses, Automotive and Carpentry, had the highest levels of expenditure. The differences, however, are mostly due to variations in the personnel component of expenditure, and not MOOE. This is as much indicative of the differences in teacher inputs and hence student numbers as any further weighting given on the basis of field of training.
14.4 OTHER GOVERNMENT TRAINING PROGRAMS
As with MoE and its vocational schools, the approach taken by the study team to obtain financial data relating to the training activities of other line Ministries was firstly to work though MoF and its published and unpublished data sources, and then to liaise with staff in the respective ministries themselves. The advice was that approaching the ministry training centres and program organisers directly would not be that fruitful, not because they would not cooperate, but mainly because most were not cost centres, and hence would not hold the sort of information the team was seeking. Obtaining data even at the ministry and department level in some instances also presented difficulties for much the same reason. Training is not always a separate expenditure program or activity. Tables 14.6 to 14.10 summarise the information the team was able to assemble on revenue and expenditure on TVET-type training undertaken in other line Ministries. (a) Ministry of Youth and Sports
Table 14.6 MoYS Youth Training Centre revenue sources, 2012 (FJ$)
MoYS Youth Training Centre
MoF grants
Other income
Total income Operating
grants Capital grants
Yavitu Youth Training Centre 57,407 46,000 103,407
Naleba Youth Training Centre 33,982 33,982
National Youth Training Centre (Nasau, Sigatoka) 340,449 39,170 379,619
Naqere Youth Training Centre 3,982 3,982
Total MoYS 435,820 46,000 39,170 520,990
Source: Material provided by MoYS.
Table 14.7 MoYS Youth Training Centre expenditure, 2012 (FJ$)
MoYS Youth Training Centre
Salaries, wages and other emoluments
MOOE Total
recurrent Capital
exp Total Exp
Establish staff
Gov’t wage
earners Total staff
Yavitu Youth Training Centre
18,208 13,681 31,889 14,822 46,711 46,000 92,711
Naleba Youth Training Centre
4,761 4,761 16,420 21,181 - 21,181
National Youth Training Centre (Nasau, Sigatoka)
51,610 102,479 154,089 166,763 320,852 - 320,852
Naqere Youth Training Centre
9,418 9,418 8,770 18,188 - 18,188
Total MoYS 79,236 120,921 200,157 206,775 406,932 46,000 452,932
Source: Material provided by MoYS.

Research into the Financing of TVET in the Pacific Fiji Country Report
145
(b) Ministry of iTaukei Affairs
Table 14.8 MoiTA training program expenditure, 2012 (FJ$)
Salaries, wages and other emoluments
MOOE Total
recurrent Capital
exp Total Exp
Establish staff
Gov’t wage
earners Total staff
Centre for Appropriate Technology and Development
69,000 48,000 117,000 410,500 527,500 - 527,500
Total 69,000 48,000 117,000 410,500 527,500 - 527,500
Source: Material provided by MoiTA.
(c) Ministry of Primary Industry
Table 14.9 DoFF training program expenditure, 2012 (FJ$)
Salaries, wages and other emoluments
MOOE Total
recurrent Capital
exp Total Exp
Establish staff
Gov’t wage
earners Total staff
Timber Industry Training Centre
90,626 90,626 210,874 301,500 - 301,500
Forestry Training Centre- Colo-I-Suva
60,000 60,000 140,000 200,000 - 200,000
Total DoFF 150,626 - 150,626 350,874 501,500 - 501,500
Source: Material provided by DoFF.
Table 14.10 DoA training program expenditure, 2012, 2012 (FJ$)
Salaries, wages and other emoluments
MOOE Total
recurrent Capital
exp Total Exp
Establish staff
Gov’t wage
earners Total staff
Taveuni Coconut Training Centre
20,000 80,000 100,000 - 100,000
Farm Management System Training
70,000 30,000 100,000 - 100,000
Training Centre on Post harvest losses
60,000 60,000 40,000 100,000 - 100,000
Total DoA 150,000 150,000 150,000 300,000 - 300,000
Source: Material provided by DoA.
14.5 PRIVATE TVET PROVIDERS
Chapter 8 lists the 26 private providers that offer programs that fall within the definition of TVET used for this study. The list was obtained from FHEC, as all 26 are either registered with FHEC, or are in the process of doing so. Private TVET providers are generally of three types: they are either run by CSOs and NGOs, or by faith-based organisations, or operate on a for-profit basis.
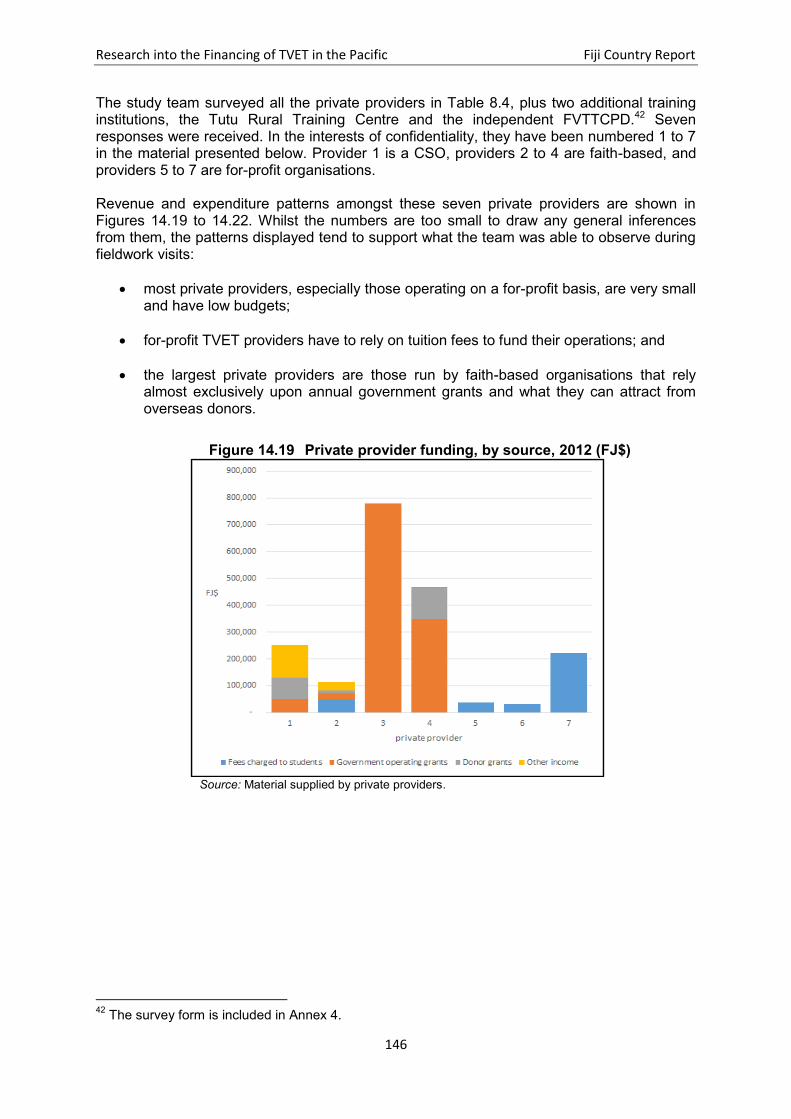
Research into the Financing of TVET in the Pacific Fiji Country Report
146
The study team surveyed all the private providers in Table 8.4, plus two additional training institutions, the Tutu Rural Training Centre and the independent FVTTCPD.42 Seven responses were received. In the interests of confidentiality, they have been numbered 1 to 7 in the material presented below. Provider 1 is a CSO, providers 2 to 4 are faith-based, and providers 5 to 7 are for-profit organisations. Revenue and expenditure patterns amongst these seven private providers are shown in Figures 14.19 to 14.22. Whilst the numbers are too small to draw any general inferences from them, the patterns displayed tend to support what the team was able to observe during fieldwork visits:
most private providers, especially those operating on a for-profit basis, are very small and have low budgets;
for-profit TVET providers have to rely on tuition fees to fund their operations; and
the largest private providers are those run by faith-based organisations that rely almost exclusively upon annual government grants and what they can attract from overseas donors.
Figure 14.19 Private provider funding, by source, 2012 (FJ$)
Source: Material supplied by private providers.
42
The survey form is included in Annex 4.
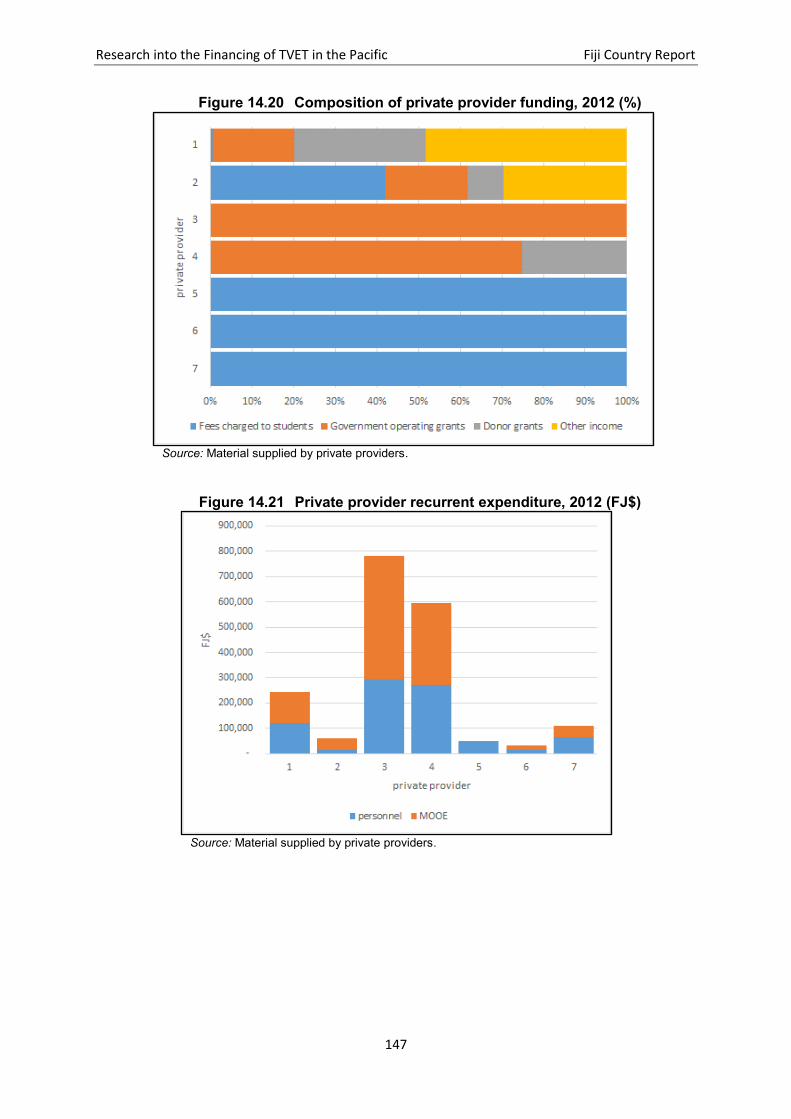
Research into the Financing of TVET in the Pacific Fiji Country Report
147
Figure 14.20 Composition of private provider funding, 2012 (%)
Source: Material supplied by private providers.
Figure 14.21 Private provider recurrent expenditure, 2012 (FJ$)
Source: Material supplied by private providers.

Research into the Financing of TVET in the Pacific Fiji Country Report
148
Figure 14.22 Composition of private provider recurrent expenditure, 2012 (%)
Source: Material supplied by private providers.
14.6 AUSTRALIA-PACIFIC TECHNICAL COLLEGE
APTC is a regional TVET provider with campuses in five Pacific countries, including Fiji.43 It is funded as part of Australia’s regional aid program. It is managed by an Australian-based consortium of two TAFE Colleges. These Colleges are respectively responsible for the operations of APTC’s two schools – the School of Trades and Technology (STT) and the School of Hospitality and Community Services (SHCS). Seconding experienced training staff from their Australian bases to lead regional training programs that meet Australian standards, is part of their approach. APTC’s regional headquarters are in Nadi. The expenditure figures shown in Table 14.11 include the pro-rata cost of the Australian-based and regional management overheads of APTC. Each of the schools in each of the campus countries also has its own management expenditures, and those for its Fiji operations are included here as well. Table 14.11 shows that whilst the recurrent costs of delivery TVET programs on the Fijian campuses were around FJ$7.7 million in 2011-12, the total cost of APTC operations in the country, factoring in the local scholarship and capital development programs, and the college’s management overheads at the campus and regional levels, brought the cost up to approximately FJ$19.7 million for the year.44 Figures 14.23 to 14.25 show the proportion of this combined operational and pro-rata annual allocation by course, function and input category.
43
At the time of the fieldwork, the APTC campus in Solomon Islands was in its planning phase. 44
The figures given here are for Australian FY 2011-12, and were supplied directly by APTC. The figures shown in Chapter 12 and in Section 14.1 are those that come via MoF budget documents for Fijian FY 2013.

Research into the Financing of TVET in the Pacific Fiji Country Report
149
Table 14.11 APTC training program expenditure by location and function, 2011-2012 (FJ$)
Expenditure category
program delivery management
Total
STT SHCS Fiji
campus operations
College overheads*
personnel 1,689,635 2,634,047 1,142,023 2,705,174 8,170,880
operating expenditure 2,070,937 1,313,336 2,663,109 1,018,330 7,065,712
total recurrent 3,760,573 3,947,383 3,805,132 3,723,504 15,236,592
scholarship program - - 3,814,876 - 3,814,876
capital expenditure - - - 674,984 674,984
Total operations 3,760,573 3,947,383 7,620,007 4,398,488 19,726,451
*Estimated share of the cost of the Nadi head-office and Australian-based operations. Source: Material provided by APTC.
Figure 14.23 APTC Fiji program delivery expenditure, by course, 2011-2012 (FJ$)
Source: Material provided by APTC
.

Research into the Financing of TVET in the Pacific Fiji Country Report
150
Figure 14.24 Estimated expenditure on APTC’s Fiji operations by function, 2011-2012 (%)
Source: Material provided by APTC.
Figure 14.25 Estimated expenditure on APTC’s Fiji operations by input category, 2011-2012 (%)
Source: Material provided by APTC.

Research into the Financing of TVET in the Pacific Fiji Country Report
151
14.7 OTHER REGIONAL TVET PROVIDERS
(a) RCCCE (USP)
As noted in Chapter 13, RCCCE is a self-funding centre within USP, and does nor receive any financial support from the university’s central administration.
Table 14.12 RCCCE revenue and expenditure, 2012 (FJ$)
Revenue
Tuition fees 594,022
Total revenue 594,022
Recurrent expenditure
Personnel 270,437
MOOE 323,585
Total expenditure 594,022
Source: Material supplied by USP.
(b) CETC (SPC)
The annual report for SPC shows income from member governments, non-members, rents and canteen operations of FJ$33 million for 2012. Expenditure by CETC on programs was FJ$849,542. Wages and rents are not included.

Research into the Financing of TVET in the Pacific Fiji Country Report
152
CHAPTER 15. EMPLOYER PROVIDED AND FUNDED TRAINING
The aim of this study into the financing of TVET in the Pacific is, as far as is feasible, to map all sources of funding and all types expenditure that fall within its scope. Integral to this is the examination of training provded by employers themselves for their workers.
15.1 EXISTING SOURCES OF INFORMATION
FBoS does not conduct regular employer surveys that are designed to elicit information on the extent and resourcing of training in the workplace. Neither MoLIRE nor MoIT undertake any systematic data collection on this critical area of labour force activity. At the time of writing, the only sources of information available were, on the one hand, as a by-product of the national levy-grant scheme and, on the other, from a one-off international survey of enterprises.
Training levy-grant scheme administrative data
Routine annual data collections by FNU in the administration of the national training levy-grant scheme, as outlined in Section 13.4, yields an abundance of information on the extent and resourcing of training by and within organisations large and small across the spectrum of employers in Fiji.
To gain recompense under Method A grant applications employers have to meet stringent criteria set by NTPC (see Table 13.2), and organisations that wish to avail themselves of the provisions under Method B have to go through a similar process. However, the data so generated are not made available publicly, even in broad statistical format. Neither the university, nor the National Training and Productivity Centre Advisory Board, which oversees the management of the levy-grant scheme on behalf of employers, have as yet published annual reports on its operations. Neither body granted access by the study team to any administrative information when requested.
In lieu of this, the only gauge the study team had as to the extent of training amongst employers came from press reports such as in the recent article in Fiji Times Online, where it was stated that ‘the NTPC, on an average, collected about FJ$12 million in a year from levies, (and that), of the 6,557 registered employers, 57 belonged to the Method A category. The remainder are Method B employers’.45
World Bank-International Finance Corporation Enterprise Survey, 2009
Between June 2009 and March 2010, 164 organisations in Fiji participated in a large multi-country survey of enterprises.46 Amongst an array of questions asked of participants, to do with conducting business in the country, were two questions regarding workforce training. To the question of how many of the participants offered employees formal training, the answer was 58.1 percent (this compared favourably with 45.2 percent across East Asia and the Pacific, and 35.2 percent for all countries covered by the survey). Unfortunately, no answer was recorded for Fiji to the question of what proportion of the participants’ workforces were offered formal training.
With such a paucity of current, comprehensive data, the employer survey component of the research approach that has been adopted across the country studies in this program has the potential to be particularly useful in Fiji.
45
Batiratu,S ‘Quest to be better”, Fiji Times Online, July 6, 2013 46
World Bank-International Finance Corporation Enterprise Surveys: Fiji Country Profile, 2009, see also http://www.enterprisesurveys.org/Data/ExploreEconomies/2009/fiji#workforce

Research into the Financing of TVET in the Pacific Fiji Country Report
153
15.2 PILOT SURVEY OF EMPLOYER FUNDED TRAINING
The purpose of this aspect of the study is to propose a way of filling this information gap, by devising and conducting a small pilot study of enterprises that specifically focuses on obtaining information about their own training programs for new recruits and existing employees, and about who conducts them and how they are funded.
The study team consulted FBoS before conducting the survey, and sought the advice of both the Fiji Commerce and Employers’ Federation (FCEF) and the Fiji Hotel and Tourism Association (FHTA).
Methodology
(a) Survey instrument
The questionnaire that was used in this exercise is contained in Annex 5. It is based on the standard format used in other country studies, suitably modified for Fiji.
It seeks information relating to three broad areas of the enterprises’ operations:
(i) general background and workforce characteristics– type of enterprise; industry;; annual turnover; annual wages bill; size of workforce and its gender and full-time/part-time composition; and
(ii) training profile – number and trades of apprentices; amount and type of training given to workers; annual expenditure on training provision and trainee support.
Wherever appropriate, standard international classification systems were used in the survey instrument design.47
(b) Survey participant selection
The decision was taken, in Fiji as elsewhere, for the study team to conduct the survey using its own resources, and not to burden FBoS with additional un-scheduled activities. Given the constraints of time and resources the study team faced, this perforce meant that the survey was conducted on a very small scale
The approach taken was to survey a representative selection, but not a random sample, of medium-size to large employers, from both the SOE and private corporate sectors, and from across economic sectors. This was done with the assistance of FCEF. Working with Federation personnel, a list of fifty suitable employers was drawn up from amongst their membership.
The team, of course, was well aware that in adopting this approach it could not draw any statistical inferences from the survey about the whole population of enterprises in Fiji. Only qualified statements about findings can be made.
(c) Survey administration, and data collection and storage
Limited time and resources also dictated that the study team had to opt for administering the survey by letter and by email. Survey instruments, together with covering letters, were distributed to all participants in this way. A secondary, follow-up reminder letter/email was sent out, this time with a covering letter from FCEF, a few weeks after the initial approach.
In both instances confidentiality was stressed. It was emphasized that the completed questionnaires, and the database into which their contents were to be fed, would be kept secure, and in the subsequent analyses it would not be possible to identify individual participant data.
This survey method is well-known as being the one least likely to elicit a reasonable response rate. ‘Cold calling,’ without a personal follow-up, is inherently risky in this respect, and this survey proved to be no exception. At the completion of the fieldwork, only six
47
See Annexes 5 and 6.

Research into the Financing of TVET in the Pacific Fiji Country Report
154
responses had been received. The risk of widespread non-response was probably accentuated in this instance by the fact that much of the information the survey was requesting the participants already had to supply to NTPC in relation to the training levy-grant scheme. This, non-compulsory, additional request perhaps looked a little too much like unnecessary duplication.
(d) Survey findings
Despite the small number of respondents the survey did come up with some useful pointers to the sort of information a larger survey using the same instrument would yield.
Table 15.1 summarises the six respondents, in terms of their economic sector and size. In Tables 15.2 and 15.3 the respondents are ranked, from largest to smallest, by their annual revenue, but are numbered to respect confidentiality.
Table 15.1 Employer training survey, respondent characteristics
Economic sector
1 tourism industry
1 public utilities
1 government agency
3 manufacturing sector
Annual revenue
2 above FJ$100 million
1 between FJ$10 and 100 million
3 below FJ$10 million
Table 15.2 indicates that amongst the respondents the nature and variety of training was extensive, even the Method B employers relied on more than one form of training. The most widespread forms were unstructured on-the-job training, in-house training using external trainers, and off-site training using FNU trainers. Only the two largest organisations had formal apprenticeship schemes.
The patterns of expenditure on training shown in Table 15.3 suggest that the resources employers devote to the training of their workforces can be quite considerable:
Whilst the national training levy is an important training expense, on average it amounted to less than thirty percent of what respondents spent on training in a year. The pattern, however, varied considerably between respondents, and there was no discernible difference between Method A and Method B employers.
The largest component of expenditure, on average was on the enterprise’s own training staff and facilities, and together with spending on external trainers and providers, they amounted to around half the total expenditure on training.
All respondents reported that trainees received their full wage entitlements during training.
On average, the amount of their training levy payments respondents reported being reimbursed in the form of training grants varied depending upon whether they were Method A and Method B employers, but the difference was not clear cut. Whilst one Method A respondent reported a reimbursement of over 80 percent, another reported that it was less than 50 percent.

Research into the Financing of TVET in the Pacific Fiji Country Report
155
Table 15.2 Training programs conducted by survey respondents
respondents ranked by total annual revenue 2012 average
1 2 3 4 5 6
Employer characteristics
number employed 661 1,739 546 350 118 788 700
percent female n s 4.3% n s 80.6% 32.2% 46.6% 18.1%
wages bill as percent of total revenue 5.9% 19.2% 22.6% 26.0% 20.1% n s 11.8%
Training program
apprenticeship scheme Yes Yes n s No No No
training levy/grant scheme status Method
A Method
A Method
A Method
B Method
B Method
A
Training mode
in house with own trainers x x n s
x x
in house with external trainers x x n s x x x
off-site using external trainers
FNU x x n s x x x
APTC
x n s
other public or regional x x n s
x
private training provider x
n s
x
Industry association x x n s
x
equipment and/or product supplier
x x n s
x x
other external provider x
n s
x
unstructured on-the-job training x x n s x x x
n s = not stated
Table 15.3 Training expenditures and cost recovery by survey respondents (FJ$)
respondents ranked by total annual revenue 2012 average (FJ$)
percent of total 1 2 3 4 5 6
Expenditure on training
National Training Levy X X X X X X 159,615 28.4%
apprenticeship training scheme fees X X
133,472 7.9%
expenditure on own training staff and facilities X X
X X X 276,047 32.8%
expenditure on external trainers and providers X X
X X X 229,940 20.5%
employee training fee reimbursements or subsidies
X X 22,398 1.3%
reimbursement or subsidy of other employee training costs
X X 153,411 9.1%
trainees paid full wage during training Yes Yes n s Yes Yes Yes
Cost recovery
National Training Grant X X X X X X
training grant as a percentage of training levy 82.4% 46.4% n s 4.8% 66.7% 57.3% 59.3%
fees charged to trainees X
X
other
X
n s = not stated

Research into the Financing of TVET in the Pacific Fiji Country Report
156
CHAPTER 16. TRAINING COSTS AND EFFICIENCIES
16.1 UNIT COSTS OF TVET DELIVERY
For policy and planning purposes, estimates of unit costs of delivering courses at different levels and in different fields of study are important instruments, since they provide a solid basis upon which to compare alternative expenditure programs in terms of their internal efficiency (cost effectiveness) and against their actual and expected outcomes (cost-benefit ratios). An important element in the research brief for this study relates to the unit costs of TVET delivery. The study team therefore, wherever it was possible, collected data that enabled it to make the necessary calculations. Four unit cost measures have been employed:
Costs per student;
Costs per graduate;
Costs per training hour; and
Costs per student training hour.
Each measure highlights a different aspect of the operations of the TVET provider. The first of these – cost per student – is the standard measure of unit costs, and can be applied across the whole PSET range. It provides an indication of the impact of varying input combinations, of differences in, say, the cost of employing teaching and other staff, and of the internal efficiency of course delivery. Cost per hour of training or tuition and cost per student hour also can be used for these purposes, but are more particularly applicable to the delivery of TVET courses. In higher education and other PSET programs, which are conducted on an annual or semester basis, with standard numbers of classes per week, the number of contact hours per course is often of secondary importance to their duration. In TVET, the number of training hours involved is often more important than the period over which the course is to run. Moreover, the number of hours and type of training individual students are required to do can be modified by course administrators according to the applicants’ assessed levels of prior learning and experience (hence the advertising of course lengths in terms of the maximum number of training hours involved). Moreover, estimated costs per training hour and per student training hour are particularly useful as standard measures of comparison across the diversity of fields and levels that typically are found in TVET sectors, and in the mix of short and long courses and alternative delivery modes that are present in their delivery. Costs per graduate provide not only a measure of the internal effectiveness of a program, but also are akin to the costing measure most are familiar with when looking at, say, the cost of producing a tonne of rice, a motor vehicle or an occupant-room night of accommodation. It is the cost per unit of output – a summary measure of the inputs needed to produce a unit of output. This makes this measure particularly useful in cost-benefit analyses of education and training, and as an essential ingredient in the analysis of the external efficiency of training.

Research into the Financing of TVET in the Pacific Fiji Country Report
157
Data requirements and availability Access to statistical information that is sufficiently detailed and disaggregated to enable individual courses to be identified is the objective. The ideal would be if this information was available for all TVET courses offered across the board. The requirement is for the following elements.
Detailed recurrent and capital cost figures at the lowest budget level (budget sub-unit or cost centre) to which they are routinely devolved.
A mechanism that can be used for further disaggregation is required if this expenditure breakdown is still at a higher than individual course level. The number of teachers or teaching hours per course (and hence estimated staffing costs) can be used for this purpose, with the assumption that other costs (MOOE) are likely to be distributed between courses in the same proportions.
A means is also needed to apportion between courses the overhead costs involved in the management and administration of the institution and its respective schools, departments, etc. The proportion of total student enrolments in each course can be used for this purpose.
Capital costs incurred in any one year need to be annualised over the expected life of the asset (building, piece of equipment or machinery, etc)48
Student enrolments and graduations need to be recorded the same financial year basis as the expenditure data
Graduation data should make clear whether what is being recorded is successful graduations (eg those certificated), course completions or a combination of both.
Maximum course hours need to be recorded per year, or per course if its duration is less than a year.
For the TVET sector in Fiji, the study team was able to assemble sufficient data to estimate the following measures of unit costs for 2011-2012 (see Table 16.1).
Table 16.1 Unit cost calculations by type of TVET provider
Provider by
course per
student per
graduate per hour
per student
hour
MoE vocational schools no yes yes yes yes
MoYS youth training centres no yes yes one only one only
Other ministry training programs no no no no no
FNU total all university programs no yes yes no no
FNU college programs no no no no no
NTPC programs no no no no no
Private providers (six only) no yes yes no no
APTC both schools yes yes yes yes yes
Other regional providers no no no no no
48 Capital expenditure is annualised, using the formula
a (r, n) = [r(1+r)n]/[(1+r)
n-1]
where (a) is the annualisation factor, (r) is the rate of interest and (n) is the estimated life-span of the asset. In this exercise, the rate of interest was taken as 5 percent, and the life of capital works assumed to be 25 years. See, for example Tilak,J.B.G., ‘Measurement of Training Costs’, in Tuijnman, A.C. edited International Encyclopaedia of Adult Education and Training, 2
nd Edition,
Pergamon, 1996, page 875

Research into the Financing of TVET in the Pacific Fiji Country Report
158
Government TVET schools and centres, and private providers Table 16.2 presents the results of unit cost calculations for MoE’s vocational schools, for MoYS’s youth training centres and for the six private providers for which the team had sufficient data. It was not possible for any of these providers for the study team to distinguish unit costs between courses. It is apparent from Table 16.1 that the smaller TVET providers in both the government and private provider sectors have very low levels of resourcing. Most provide training for a cost of between FJ$1,000 and FJ$3,000 per student annum, and some at even lower levels. Perhaps more tellingly, the table reveals that there were wide variations in the costs providers incurred in producing graduates. Table 16.2 Estimated unit costs of TVET delivery, by selected providers, 2012 (FJ$)
Provider cost per student
cost per graduate
cost per hour
cost per student
hour
MoE vocational schools
average for vocational schools 1,621 4,533 34.08 1.41
MoYS youth training centres
Yavitu Youth Training Centre 2,261 2,261
Naleba Youth Training Centre 415 415
National Youth Training Centre (Nasau, Sigatoka)
2,766 2,766
Naqere Youth Training Centre 433 606 80.84 1.92
average per YTC 1,812 1,903
Private providers
Caregivers Services International 919 1,011
Dateline Business College 146 233
Marist Champagnat Institute 3,100 3,444
Montfort Boy’s Town 3,659 9,184
The Style Gallery (Fiji) Institute of Hairdressing, Health & Beauty Therapy
1,834 1,251
Tutu Rural Training Centre 1,467 1,481
average per private provider 2,050 2,362
Source: material provided by ministries and institutions
Table 16.2 and Figure 16.1 show how each of the four unit cost measures varied between MoE’s vocational schools. Highly skewed patterns are evident. In a small number of schools unit expenditure levels are relatively high but, for the most part, vocational schools delivered their programs with few resources per student and per hour of delivery.

Research into the Financing of TVET in the Pacific Fiji Country Report
159
Table 16.3 Variations in the unit costs of delivery in MoE vocational schools, 2012 (FJ$)
(a) cost per student No. of
schools
5,000 and above 4
4,000 to less than 5,000 2
3,000 to less than 4,000 9
2,000 to less than 3,000 11
1,000 to less than 2,000 29
less than 1,000 16
number of observations 71
mean 2,032.30
median 1,555.50
(b) cost per graduate
15,000 and above 2
10,000 to less than 15,000 2
5,000 to less than 10,000 26
less than 5,000 32
number of observations 62
mean 6,021.00
median 4,783.00
(c) cost per hour
100 and above 1
80 to less than 100 6
60 to less than 80 5
40 to less than 60 11
20 to less than 40 35
less than 20 29
number of observations 87
mean 34.08
median 25.00
(d) cost per student hour
4.00 and above 1
3.00 to less than 4.00 4
2.00 to less than 3.00 10
1.00 to less than 2.00 24
less than 1.00 32
number of observations 71
mean 1.41
median 1.08
Source: Material provided by MoE.

Research into the Financing of TVET in the Pacific Fiji Country Report
160
Figure 16.1 Unit costs of delivery in MoE vocational schools, 2012 (FJ$)
Source: Material provided by Ministries and institutions.
Fiji National University For reasons canvassed elsewhere in this report, the study team was unable to calculate and analyse unit cost variations between the wide range of TVET programs offered by FNU, or to compare them with other national and regional providers. The only impression the study team was able to get of these internal and external efficiency measures as they applied to FNU was by making use of the broad figures contained in the one document that was available, the FNU Strategy Plan 2020. These figures are, however, so broad and so non-course specific, incorporating both higher education as well as TVET programs, that caution needs to be exercised when interpreting the estimates contained in Table 16.4. That said, however, the table appears to show that unit costs increased over the period, but whilst the costs per enrolled student at FNU in 2011 and 2012 were not dissimilar to those in other national TVET providers (see Table 16.2), costs per student on an FTE basis were considerably higher. What is even more noticeable is that costs per graduate appear, on these figures, to be not that much lower than those for APTC courses, especially when the comparison is with APTC’s operations before college overheads are factored in (see Tables 16. 5 and 16.6).

Research into the Financing of TVET in the Pacific Fiji Country Report
161
Table 16.4 FNU estimated costs per student and graduate, all programs – 2010 to 2012 (FJ$)
2010 2011 2012
total expenditure 64,669,837 96,407,924 101,201,990
enrolments 24,993 27,886 30,660
FTES 12,255 12,836 13,439
graduations 3,132 3,918 3,013
unit cost estimates
per enrolled student 2,588 3,457 3,301
per FTES 5,277 7,511 7,530
per graduate 20,648 24,606 33,588
Source: FNU Strategic Plan 2020
Australia-Pacific Technical College APTC was the only provider for which unit costs could be calculated on a program by program basis. The figures contained in Tables 16.5 and 16.6 are based on a common data set supplied by the APTC management in Australia and Nadi in 2012 for all its operations across the region, not just those in Fiji. The figures here are therefore directly comparable with those shown for APTC’s operations in the other country study reports in this research program.
Table 16.5 APTC direct operating cost per unit, by course, 2011-12 (FJ$)
cost per student
cost per graduate
cost per hour
cost per student
hour
School of trades and technology (STT)
Automotive mechanical technology 33,872 65,626 858 27.67
Engineering – diesel fitting 10,609 22,825 374 10.52
Engineering – mechanical trade (fitting and machining)
3,924 26,684 132 3.89
Carpentry 10,896 8,626 406 10.68
Painting and decorating 11,477 12,707 346 11.18
Wall and floor tiling 14,289 32,578 474 16.63
Total School of trades and technology 13,824 21,723 - -
School of hospitality and community services (SHCS)
Hairdressing 13,296 14,094 331 12.48
Hospitality operations 14,564 25,070 1,318 25.11
Hospitality – commercial cookery 13,649 17,760 861 15.94
Hospitality - patisserie 6,342 9,802 258 10.13
Hospitality supervision 1,270 1,799 47 1.85
Children’s services 7,402 10,272 849 12.48
Disability work 5,520 8,041 134 3.99
Home and community care/ aged care 1,356 3,002 64 2.06
Community Services 19,352 19,352 415 24.40
Total School of hospitality and community services
8,352 11,437 - -
Total all APTC programs in FIJI 10,245 14,681 - -
Source: Material provided by APTC.

Research into the Financing of TVET in the Pacific Fiji Country Report
162
Table 16.6 APTC total recurrent cost per unit, by course, 2011-12 (FJ$)
cost per student
cost per graduate
cost per hour
cost per student
hour
School of trades and technology (STT)
Automotive mechanical technology 54,263 105,135 1,374 44.33
Engineering – diesel fitting 31,000 66,698 1,092 30.75
Engineering – mechanical trade (fitting and machining)
24,316 165,348 820 24.12
Carpentry 40,344 31,939 1,503 39.55
Painting and decorating 40,924 45,309 1,235 39.85
Wall and floor tiling 43,736 99,718 1,451 50.92
Total School of trades and technology 38,675 60,775 - -
School of hospitality and community services (SHCS)
Tourism operations 12,603 14,085 521 27.40
Hairdressing 25,875 27,427 644 24.30
Hospitality operations 27,143 46,722 2,457 46.80
Hospitality – commercial cookery 26,227 34,127 1,655 30.64
Hospitality - patisserie 18,921 29,242 771 30.23
Hospitality supervision 13,849 19,619 516 20.22
Children’s services 18,466 25,626 2,118 31.14
Disability work 16,585 24,156 401 11.97
Home and community care/ aged care 12,420 27,502 585 18.88
Community Services 30,417 30,417 652 38.36
Children’s services – early childhood 11,064 11,064 203 9.22
Total School of hospitality and community services
20,238 27,711 - -
Total all APTC programs in FIJI 26,614 38,139 - -
Source: Material provided by APTC.
The figures in Table 16.5 show the unit costs of delivery within the classroom and workshop, and exclude school, campus and college costs. Those in Table 16.6 are inclusive of all costs. The salient features to arise out of these two tables relating to APTC are as follows.
Costs per student in courses conducted by STT are, not unexpectedly, generally higher than those conducted by SHCS, since MOOE tend to be higher in the former. These relative differences are reflected in costs per graduate and are much the same when overhead costs are apportioned.
The differences between the courses conducted by the two schools are not as pronounced when differences in training hours are factored into the calculations.
The impact of adding in the college’s overhead expenses, those associated with campus management, and the Nadi and Australian based administration of what is a large regional operation, upon the unit cost of delivery, is obviously substantial. APTC carries a higher overhead component than does any of the national TVET providers.
Unit costs of delivery in APTC also are inherently greater than national providers because it has conducted most of its front-end operations (classroom and workshop instruction and campus management) using Australian staff on temporary attachment.
Research into the Financing of TVET in the Pacific Fiji Country Report
163
16.2 WHO BEARS THESE COSTS AND WHO BENEFITS?
The analysis of unit costs and the factors at play in their variability has come up with a mixed picture with respect to what can be inferred about the internal efficiency of TVET providers in Fiji. It is not possible to tell from looking at these figures how efficiently and effectively the institutions are marshalling their resources to produce quality TVET training. To determine whether training programs are employing best-practice, least-cost, waste-minimising practices (including minimizing drop-out and maximizing continuation and successful completion rates) would require more time and resources than were available to this study.
One observation can, however, be made. Table 16.2 shows that on all four unit cost measures, that majority of MoE vocational schools operate at below average resourcing.. These figures beg the question as to what is an acceptable level of resourcing of these, albeit, basic level TVET programs. What is the appropriate benchmark? If meeting that level of resourcing cannot be accomplished within the budgetary boundaries set by MoF and internally by MoE, and if non-budgetary sources of income (such as fees and from the sale of school-produced produce) cannot easily be expanded, then more cost-effective delivery might be achieved by consolidating the delivery of TVET programs in a smaller number of larger, strategically located centres.
Two further questions are raised, however: who actually bears these costs of TVET provision, and who benefits? As to the former, the immediate answer is that the institutions must find the funds to meet these costs of production. But that in turn points to the sources of those funds, and prompts the further question of whether they are getting value for money. As is evident from Chapters 12 and 14, the principal sources of funds for the TVET sector are:
Fijian government general revenue, via MoF budget allocations;
development partners, through grant aid-in-kind;
students and their families via tuition and other fees;
employers in the public and private corporate sectors though national training levies; and
purchasers of goods and services (other than training) provided by TVET institutions.
All these groups have their particular set of expectations regarding their involvement in the financing of TVET, but with the exception perhaps of the final group, all have an interest in the prospects of the sector’s graduates. As the tables in this chapter demonstrate, the annual costs of producing those graduates vary considerably, with no discernible pattern emerging, especially with respect to the level and fields of technical and vocational skills in which they have been trained. The major national policy and planning document that provides the framework within which TVET will develop over the short to medium term is the National Strategic Human Resource Plan 2011–2015.49 This acknowledges the important role TVET is to play in middle-level skills development in Fiji, and the need for providers to be working closely with industry to ensure that graduates have the skills and aptitudes that are needed. However, little in the way of specific objectives, targets or actions are put forward for the sector.
The key intersection between the TVET sector and employers is, the national training levy-grant scheme that has been operating for the last four decades or so. It is now under the auspices of FNU and reports regularly to the National Training and Productivity Centre Advisory Board. At the time of writing, however, very little information about the operations or impact of the scheme was publicly available.
49
MSPNDS National Strategic Human Resource Plan 2011 – 2015 August 2011

Research into the Financing of TVET in the Pacific Fiji Country Report
164
Tracer studies and graduate surveys are the standard tools used to monitor the employability of graduates. Employer surveys provide feedback from employers and prospective employers on the relevance and suitability of the programs conducted by training providers. APTC has conducted both graduate and employer surveys and the latest of these are published on the college’s website.50 A total of 299 Fijians were surveyed for the graduate survey (43 percent response rate) and 50 Fijian employers were interviewed for the employer satisfaction survey (30 percent response rate). Unfortunately no Fiji-specific breakdown is given in the analyses, so their published data cannot be used for inter-campus comparisons, or for comparisons with national providers. The study team was not aware of any similar surveys having been conducted amongst other TVET provider graduates. Regular surveying of these entrant and re-entrants into the labour market should be a priority in any future planning for the TVET sector.
50
APTC, Graduate Tracer Survey Report – 2012, 15th November, 2012, and Employer Survey Report – 2012, 23rd August, 2012.

Research into the Financing of TVET in the Pacific Fiji Country Report
165
PART V: ISSUES AND POLICY CONSIDERATIONS
CHAPTER 17. ISSUES AND POLICY CONSIDERATIONS
This is a study of the financing of TVET in Fiji, but issues of finance cannot easily be separated from those of policy and planning. They are essentially two sides to the same coin – policy and planning can be reduced to earnest intentions and empty gestures without adequate financial backing, and finances can easily be frittered away or be in danger of being wasted if not conducted within a firm policy and planning framework. This applies to TVET in Fiji as much as it does anywhere else.
17.1 A SECTOR IN A STATE OF FLUX
Much has changed in the TVET sector in Fiji in recent years.
From 2008 APTC has been offering from its Fijian campuses a range of AQF Certificate III, IV and diploma courses, levels of skills training hitherto not available.
In 2010 six of the country’s long-standing public post-school education and training (PSET) institutions were merged to create FNU. Included amongst these was FIT, the country’s leading TVET provider. Its programs were split between two new FNU colleges – the College of Engineering, Science and Technology and the College of Business, Hospitality and Tourism Studies.
In 2011 the Training and Productivity Authority of Fiji (TPAF), the body responsible, since 1973, not only for providing a wide-range of TVET short-course programs but also for managing the national training levy-grant scheme and the country’s apprenticeship scheme, was also merged into the university as NTPC.
In 2010 FHEC was established with the mandate to regulate the PSET sector – to develop and maintain the FQF, to recognise and register all PSET providers, whether they be in the public regional or private domains, and to accredit their courses.
From 2014 FHEC will take on the additional role of being the conduit through which MoF funding of PSET (including FNU) will be channelled.
From 2014 MoE, responsible for school-level TVET programs, is separating TVET out from Curriculum as a department in its own right, and is accelerating its mainstreaming of TVET into the secondary curriculum.
Together these amount to a momentous rearrangement and realignment of the TVET sector. They are taking time to be worked through, and they present challenges as well as opportunities.
Through these developments Fiji has the opportunity to develop a strong coherent TVET sector that can meet the skill needs of its domestic industries and to equip Fijian workers to compete successfully for skilled employment across the region and in neighbouring countries such as Australia and New Zealand.
The challenge is for the constituent parts of the sector to work together harmoniously, developing synergies, sharing resources and creating pathways.
One difficulty that will need to be overcome in developing a comprehensive approach to TVET policy, planning and financing is the continued separation between advanced level

Research into the Financing of TVET in the Pacific Fiji Country Report
166
programs, under the purview of FHC and basic level TVET that remains outside FHEC’s aegis, in the hands of the school-level focussed administration of MoE and scattered across range of other line Ministries.
Another challenge is the effective integration of the agglomeration of functions within FNU into a coherent and balanced approach to TVET development in Fiji. The changes introduced over the last few years have created an organisation that not only dominates provision of PSET (including TVET) courses at the Certificate 3 level and above (FQF 3 to 10), but in addition manages the short-course training programs of NTPC, the National Trade Testing and the National Apprenticeship Training Schemes, and the administration of the National Training Levy Grant Scheme. How sustainable this arrangement is will have a marked bearing on the way in which TVET develops over the next decade.
17.2 THE CRUCIAL ROLE OF FHEC
FHEC, as the umbrella body, is crucial to the success of this new TVET environment. It is vital that its independence and standing is enhanced, and that it is accorded the authority, and given the resources, to do its job properly. The mandate it has been given is wide, and it organisation cannot be run on a shoestring.
Its mandate is also multifaceted, and its staffing needs be tailored to match this. The Commission needs to be able to recruit a broader spectrum of staff, for example, middle to senior level personnel with expertise and experience in data collection and statistical analysis, and in economics and financial management. They also need to build up their familiarity, not just with the education and training sector, but also with the operations and functioning of labour markets, industry investment strategies and programs, government budgetary procedures, and the strategies and plans of international development partners.
The ongoing and working relationship between FHEC and FNU will be crucial to the successful development of TVET and of PSET more generally. However, FHEC will need work closely with MoE, as the major provider of basic level (Certificate 1 and 2) TVET programs, and also to build on its relationships with industry. These are already present through the ISACs, but they need a broader focus than just on competency standards. Good and close working relationships need also to be developed and maintained with the other ministries and agencies with responsibility for economic and employment growth and development – especially MoSPNDS, MoLIRE and MoIT.
TVET, and PSET more generally, has a vital role to play in meeting the aspirations of young people, and of creating greater opportunities for their social and economic advancement, but the unless the sector’s management is harnessed to economic development and employment creation, primarily within the private sector, it cannot play its full role and satisfy the expectations the country has of it. FHEC needs to be fully engaged with what the country needs in this respect, and not adopt a passive role.
17.3 THE IMPORTANCE OF INFORMATION
Indispensable to the enhanced role of FHEC and to the policy and planning of TVET (and PSET more generally) is a much greater volume of and accessibility to comprehensive reliable and frequently up-dated information. For that information to be of greatest use in the policy and planning process it needs to be freely available, nowadays via official websites, to all those who have contributed to it and for all those who wish to use it.
One of the most striking impediments to the analysis of the current state of the TVET sector in Fiji is the poor state of the publicly accessible statistical information base. In Chapter 2 of this report, the study team summarised its findings in this respect. Table 2.1 quite

Research into the Financing of TVET in the Pacific Fiji Country Report
167
graphically demonstrated how little quantitative data there is publicly available from official sources, even for the most basic of variables such as annual enrolments and numbers graduating from training programs. In a lot of instances, the study team subsequently found that this was not because information was being deliberately withheld, but because either it was not being collected on any systematic basis, or because what was being generated was not being processed and published, due either to a lack of call for it, or a lack of resources.
FHEC is in a position to rectify this situation with respect to the PSET sector. Indeed it is part of its mandate to do so. Data collection, analysing, processing and publishing, however, does not come cheap, as FBoS can attest, so this is further reason why FHEC, if it is to fulfil this aspect of its mandate, must be adequately funded.
One of the first tasks the Samoan Qualifications Authority, a body with a very similar mandate to that of FHEC, undertook when it was established was to instigate an annual PSET statistical bulletin. Its value has been inestimable.
Just as important to the development of the TVET sector is access by policymakers and planners to comprehensive reliable and frequently up-dated information regarding employment patterns and trends, the occupational composition of the workforce and of those either emigrating or leaving the country to seek temporary employment elsewhere. Policymakers and planners do not have this crucial tool.
17.4 RESOURCING THE SECTOR
TVET providers rely on four major funding sources:
Government;
development partners;
employers; and
students and their families
Unlike in some countries in the region, church and other community organisations do not appear to have a large role in subsidising training programs in Fiji, and entrepreneurial activities of training providers do not account for a significant source of funding. FNU franchises its training programs to other providers, but no details are available as to how much this contributes to the university’s revenue.
MoF’s budget allocation framework – of heads, functions and activities - provides a perfectly adequate structure within which public funding of TVET could be identified, allowing policy makers and planners to track the flow of funds to the sector. Currently, however, it is difficult to do so. This would appear to be because (a) policy with respect to the sector rarely if ever moves beyond broad objectives, (b) planning rarely, if ever, generates any specific annual targets, and (c) very few elements of TVET expenditure show up clearly in MoF budget estimates as either programs or as activities.
The most noticeable example of this is FNU itself. In MoF’s budget estimates, the annual allocations the university receives (by far the largest public allocation to the PSET sector), appear as part of a single summary line – ‘higher education institutions’ – along with the annual grants to USP and UoF. Internal MoF material does not seem to yield much more information than this. For public policy and planning purposes, this is not nearly sufficient information.
Development partner contributions to TVET have the potential to come in three forms: as cash grants; as grant aid-in–kind; or as ‘direct payments’ - funding from soft loans from international lending agencies such as ADB.
Funding from the first of these is total budget support, so it cannot be traced to any one head, function or activity. The TVET sector has not, at least in recent years, been the

Research into the Financing of TVET in the Pacific Fiji Country Report
168
recipient of direct payment assistance. Neither ADB nor the World Bank have been active in the sector. It does, however, receive assistance in the form of grant aid-in-kind.
According to MoF’s latest budget expenditure estimates, the only grant aid-in-kind received by the TVET sector recently has been from Australia through its regional program – an imputed figure for APTC’s annual operational expenditure in Fiji, and elements of its regional scholarship scheme. FNU, in its strategy plan, lists development assistance of another FJ$25 million or so over the period 2010 to 2012, but no further details were forthcoming.
Given the importance of the sector to Fiji’s economic and social growth and development, funding from this quarter seems somewhat small and patchy. The problem appears to be that there is no coordinated and coherent strategy either directed by the sector itself with, say, FNU taking the lead, or by the policymakers and planners in MoSPNDS, MoE, MoLIRE or FHEC, to garner a medium to long-term commitment from development partners to support the sector.
Australia is Fiji’s major international development partner, yet the only assistance it provides the sector is through its regional program. The contribution through APTC is, of course, very important, however, the TVET sector does not receive from Australia’s bilateral assistance program for Fiji, any specific support directed at or through the country’s national providers, such as FNU and MoE’s 87 (mostly small uneconomically run) vocational schools, or through its regulatory bodies such as FHEC. This deficiency does not go unnoticed within the TVET sector in Fiji.
Ever since it was established in 1973, the national training levy-grant scheme has been a major funding source for TVET in Fiji. It has funded, through the levy, training that employers either could not or would not provide to their employees, and acted as an incentive, through the grant, for employers to undertake responsibility for their own training. It continues to perform these dual functions, even though the scheme has been, along with its operator NTPC, absorbed into FNU.
Details of the current operations of the training levy-grant scheme are not disclosed on an official basis to the public, nor to its contributor/recipients, so it is not possible to gauge how effective it is in either role. It is said that FNU raises around FJ$12 million per annum from the scheme, but how this is spent and how much is reimbursed to employers, through either Method A or Method B, the team was unable to ascertain.
It appears that only about one percent of the employers registered with NTPC qualify as Method A employers, and are therefore entitled to have up to 90 percent of their levies reimbursed. This appears particularly low, especially for a scheme that has been operating for 40 years. This suggests that the scheme has not been particularly successful, at least in its objective of raising the participation of employers themselves in the training of their workforces. Perhaps NTPC has set the bar too high for Method A qualification. Only Method A enterprises are eligible for general levy refunds. All other enterprises have to undertake lengthy application procedures to obtain recompense for each specific training activity. Feedback received during consultations indicated that there is a strong discouragement effect in this. It is not difficult, nevertheless, to see why employers might regard the training levy-grant scheme as just another tax.
In any event, until the operations of the scheme are more transparent, and more information is made available for policymakers and planners to analyse, it is not possible to gauge whether it is performing effectively, whether the levy needs to be raised from its present one percent of gross wages, or whether the scheme is worth emulating in other countries in the region.
Student fees are not an option as a revenue source for school-level TVET programs such as those offered by MoE’s vocational schools. Tuition up to the end of secondary education in Fiji is free. Both FNU and APTC charge fees, but the latter’s scholarship scheme is so widely applicable that the college does raise much, if anything, from this source. FNU, on

Research into the Financing of TVET in the Pacific Fiji Country Report
169
the other hand, relies for around half of its income on student fees. Private providers vary in their dependence upon student fees – those in receipt of government assistance generally either waive fees completely or levy them at way below cost-recovery levels. On the other hand private for-profit providers not only have to rely on fees for cost-recovery, but also be be able to make enough to warrant staying in business.
As a major source of funding, however, it is difficult to see much potential for increase coming from student fees. The policy of fee-free schooling up to the end of the secondary level is not about to be reversed; APTC is unlikely to change its business model, in the short-term at least; FNU has increased fee revenue by 36 percent per annum since its inception, so that fees contribute about half of all its revenue, so it is difficult to see that expansion being sustained. The rest of the sector is so small that any changes fee revenues there, important though they may be to particular providers, would only have a marginal effect on the total.
When all sources of revenue are factored in the study team estimated that total expenditure on TVET is presently around 1.5 to 1.6 percent percent of GDP. That is not high, by regional standards, and could be increased, if policymakers and planners both within the sector and at a central government level, can make the case for a substantial injection of resources over the medium to long term. Given the sector’s, not fully realised or demonstrated, importance to the economic and social development of the country, that case should not be difficult to make, especially if it is done in a concerted and coordinated fashion, and not with one institution seeking to out-compete one another.
The two sources with the most potential are the government itself – TVET routinely only attracts around two percent of the annual operating budget – and Fiji’s development partners. At the time of writing, TVET accounted for about 15 percent of grant aid-in-kind, very little of which seems to be allocated to national providers, and the sector did not receive any assistance at all from donor soft loans.
Until more information on and analyses of the national levy-grant scheme are forthcoming, it is not possible to say whether industry and employers should be asked to increase spending on the scheme.

Research into the Financing of TVET in the Pacific Fiji Country Report
170
REFERENCES
Fiji government agency publications and documents Fiji Bureau of Statistics (2012) Employment and Unemployment Survey (EUS) 2010-2011, Preliminary Findings, December. Fiji Bureau of Statistics, Household Income and Expenditure Survey (HIES) 2008-2009. Fiji Bureau of Statistics, Key Statistics, December 2012. Fiji Bureau of Statistics, Annual Business Plan 2013. Fiji Higher Education Commission (2013) Higher Education Newsletter, 4:2, June. Fiji Higher Education Commission, Policy on the Registration of Qualifications on the Fiji Qualifications Framework. Fiji Higher Education Commission, Strategic Plan, 2012-2015. Fiji National University, FNU Finance Policies, Adopted 2010 - Revised December 2012. Fiji National University, FNU Strategic Plan 2020, Government of Fiji (2013) BEST Program to Enhance TVET in Schools, Press Release. Investment Fiji, Sector Spotlight, at www.investmentfiji.org.fj. Ministry of Education (2001) Directions for Education in the Fiji Islands, Report of the Fiji Islands Education Commission/Panel, Government Printer, Fiji. Ministry of Education, National Heritage, Culture and Arts, Annual Business Plan 2013. Ministry of Education, National Heritage, Culture and Arts, Annual Corporate Plan for Financial Year ended 31 December 2013. Ministry of Education, National Heritage, Culture and Arts, Youth and Sports, Education Sector Strategic Development Plan (ESSDP) 2012-2014. Ministry of Education, National Heritage, Culture and Arts, Youth and Sports, Annual Report, 2012. Ministry of Education, National Heritage, Culture and Arts, Youth and Sports, Strategic Direction of TVET, 2008-2012. Ministry of Education, National Heritage, Culture and Arts, Youth and Sports, Education Sector Strategic Development Plan 2012-2014. Ministry of Education, National Heritage, Culture and Arts, Youth and Sports, Annual Corporate Plan for the Financial Year ended 31 December 2012. Ministry of Finance, Annual Corporate Plan, 2013. Ministry of Finance, Budget Estimates, 2013. Ministry of Finance (2012) Economic and Fiscal Update – Supplement to 2013 Budget Address, November. Ministry of Finance, Economic and Fiscal Update – Supplement to the 2012 Budget Address. Ministry of Finance (1970) Fiji’s 6th Development Plan 1971-1975, Central Planning Office. Ministry of Labour, Industrial Relations and Employment, Annual Corporate Plan, 2012. Ministry of National Planning (2009) Fiji’s National Development Policy Framework: Roadmap for Democracy and Sustainable Social and Economic Development 2010-2014 – A Better Fiji for All (RDSSED), December. Ministry of Strategic Planning, National Development and Statistics, Annual Corporate Plan for Financial Year ended 31 December 2012. Ministry of Strategic Planning, National Development and Statistics (2011) National Strategic Human Resource Plan, 2011-2015, (NSHRDP), August. Ministry of Tourism, Tourism Performance, 2012, Republic if Fiji. Ministry of Youth and Sports, Situational Analysis of Youths in Fiji, 2011 Report. Public Service Commission: Strategic Plan, 2011-2014. Fiji government legislation, regulations and orders Constitution of the Republic of Fiji (2003). Fiji National Training Act (1973 Cap 93). Fiji National Training (Amendment) Act (No 24 of 2002). Fiji National Training Levy Order (1973).

Research into the Financing of TVET in the Pacific Fiji Country Report
171
Higher Education Promulgation (No 24 of 2008). The Fiji National University Decree (No 39 of 2009). The Fiji National University (Amendment) Decree (No 58 of 2010). Pacific regional documents Pacific Islands Forum Secretariat (2009), Pacific Education Development Framework (PEDF) 2009-2015. Pacific Islands Forum Secretariat (2007) Pacific Plan for Strengthening Regional Cooperation and Integration. Pacific Islands Forum Secretariat (2009) Forum Education Ministers', Pacific Education Development Framework. Australian Government documents AusAID (2013) Australian aid to Fiji: working together for better health, better education, better livelihoods. AusAID (2013) Regional Program Annex to PESDA – Discussion Paper, July. AusAID (2013) Review of Australian and New Zealand Support for the University of the South Pacific, 2010-2012, Draft version 3.1, ERF, January. AusAID (2013) The Pacific Education and Skills Development Agenda and Delivery Strategy 2013-2021, August. AusAID (2012), Fiji Country Strategy 2012-2014. AusAID (2012) Pacific Tertiary Education Strategy 2020, Draft 4, 25 June. AusAID (2012) The Fiji Annual Program Performance Report 2011, September. AusAID Education Resource Facility (2012) Current Issues in Education paper, Skills Development and Technical and Vocational Education, November. AusAID (2011) Pacific Education and Skills Development Agenda (PESDA): guidance on education and skills development across the Pacific, June. AusAID (2011) Research into the financing of Technical and Vocational Education and Training in the Pacific, Research Brief. AusAID (2010) Australia’s regional aid program to the Pacific 2011-2015, December. AusAID (2008) Pacific Partnerships for Development with Pacific Island Countries (Port Moresby Declaration). Other Australian agency documents Department of Foreign Affairs and Trade, Fiji Factsheet, at www.dfat.gov.au/geo/fs/fiji.pdf Other international agency documents Asia Development Bank (2013) Fiji Fact Sheet, April, at www.adb.org/publications/fiji-fact-sheet. Asia Development Bank (2012) Fiji 2012: revitalizing the economy, ADB and AusAID, Manilla. Asia Development Bank (2012) Fiji Fact Sheet, December, at www.adb.org/countries/fiji/main. Asia Development Bank (2008) Skilling the Pacific: Technical and Vocational Education and Training in the Pacific, prepared for the Pacific Islands Forum Secretariat by R. Johanson, P. Brady, A. Gorham and C. Voight-Graft. Asia Development Bank (2007) Technical-Vocational Skills Development in Fiji, Technical Assistance for Implementation of Pacific Education Strategy: Skills Development, prepared for Pacific Islands Forum Secretariat by P. Brady, A. Gorham, R. Johanson, and E. Naisele. Asia Pacific Development Centre on Disability, Country Profile: Fiji, at www.apcdfoundation.org/?q=content/Fiji. Embassy of Japan in the Republic of Fiji (2012), Japan’s ODA: Rolling Plan for the Republic of Fiji, April.
European Centre for the Development of Vocational Training (CEDEFOP) (1999) Fields of Training Manual, Eurostat.

Research into the Financing of TVET in the Pacific Fiji Country Report
172
International Finance Corporation-World Bank (2009) Enterprise Survey – Fiji. International Labour Office, Fact Sheet – Fiji, at www.ilo.org/wcmsp5/groups/public@asia/@ro-bangkok/@ilo-suva. International Labour Office (2008) International Standard Classification of Occupations (ISCO-08).
United Nations Development Program, Human Development Ranking, Human Development Index 2012, at www.undp.org/en/statistics. Transparency International National Budget Cycle & Process Information, brochure, Fiji. UNESCO Institute for Statistics, Education (all levels) profile – Fiji, UIS Statistics in Brief, at www.uis.unesco.org. United Nations Educations, Scientific and Cultural Organisation (2012) Transforming Technical and Vocational Education and Training, Working document of the 3rd International Congress, at www.unesco.org/new/en/themes/education-building-blocks/technical-vocational-education-training-tvet/third-international-congress-on-tvet. United Nations Educations, Scientific and Cultural Organisation (2008) Education for All: mid-decade assessment report – Fiji, for the Ministry of Education, National Heritage, Culture and Arts. United Nations Educations, Scientific and Cultural Organisation, World Data on Education, 7th edition, 2010/11, International Bureau of Education, at www.ibe.unesco.org/en/services/online-materials/world-data-on-education. World Bank (2013) World development Indicators, at www.worldbank.org/country/fiji. World Bank – International Finance Corporation (2013) Doing Business 2013: Smarter regulations for small and medium size enterprises. World Bank – International Finance Corporation (2009) Enterprise Surveys: Fiji Country Profile. World Bank (2011) Labour Markets in the Pacific Islands, prepared by E. Farchy. World Travel and Tourism Council, Fiji Economic Impact Report, at www.wttc.org/research/economic-impact-research/country-reports/f/fiji/ Other sources Australia-Pacific Technical College (2012) Employer Survey Report, August. Australia-Pacific Technical College (2012) Graduate Tracer Survey Report, November. Australia-Pacific Technical College (2011) Graduate Tracer Survey Report, June. Australia-Pacific Technical College, APTC Annual Report and Plan: Report 1 July 2011 to 31 December 2011; Plan 1 January 2012 to 30 June 2012. Australia-Pacific Technical College, APTC 2012-13 Annual Report and Plan. Australia-Pacific Technical College, APTC 6-Monthly Progress Report, June 2012. Australia-Pacific Technical College, APTC Quarterly Activity Report, Quarter 1 (January – March) 2013. Batiratu S. (2013) ‘Quest to be better’, Fiji Times Online, 6 July. Brown A.M. (2009) Reporting Performance of Fiji Public Sector between the Coups, Financial Reporting, Regulation and Governance, 8:1, Curtin Business School. Centre for Appropriate Technology and Development, Training programs, prospectus. Chandra R. (2009) Higher Education Developments in Fiji: global, regional and national imperatives and issues of quality and affordability. Farchy E. (2011) Labour Markets in the Pacific Islands, World Bank. Fiji Council of Social Services, Annual Report 2010-2011, Suva. Fiji Teachers’ Association, Benefits enjoyed by members, brochure. Fiji Teachers’ Union, Why we need the union, brochure. Global Integrity, Global Integrity Index, at www.globalintegrity.org/globalIndex.cfm. Gopal A. (2013) ‘Bright futures ahead’, Fiji Times, 30 September. Heritage Foundation, 2013 Index of Economic Freedom, at www.heritage.org/index/country/fiji.

Research into the Financing of TVET in the Pacific Fiji Country Report
173
International Accounting Standard 20, Accounting for Government Grant and Disclosure of Government Assistance at www.iasplus.com/en/standards/ias/ias20. Khan S.N. (2012) Student expectations at tertiary in situations: a case study of FNU, Tertiary Education and Management, 18:3. Lerman R.I. (2013) ‘Skill development in middle level occupations: the role of apprenticeship training’, IZA Policy Paper, No 61. Malo M. (2013) ‘Jobless rate shock’, Fiji Times Online, 3 June. McGregor A. Tara L. Bamford G. and McGregor K. (2011) The Tutu Rural Training Centre: lessons in non-formal adult education for self-employment in agriculture, United Nations. Montfort Boys’ Town, Training programs, prospectus. Nair R. (2011) Australia-Pacific Technical College (APTC), Submission to Australian Government Independent Review of Aid Effectiveness, June. Nair R. Critical Analysis of the Australian-Pacific Technical College (APTC), unpublished. Nasiko (2013) ‘Wage survey sets standard’, The Fiji Times, 18 October. National Council for Building a Better Fiji (2008) People’s Charter for Change, Peace and Progress (PCCPP), Fiji. Nilan P. Cavu P. Tagicakiverata I. and Hazelman E. (2006) Whitecollar work: career ambitions of Fiji final year students, International Education Journal, 7:7. Panapasa G. (2013) Millions flow in, Fiji Times Online, 11 April. Price Waterhouse Coopers (2010) Fiji National Budget 2011, December. Rawalai L. (2013) ‘Worker training the focus’, Fiji Times Online, 20 May. Rice S. (2013) ‘Hope for people with disabilities’, Fiji Times Online, 5 June. Scarr D. (1984) Fiji: a Short History, George Allen and Unwin, Sydney. Seng L.S. (2011) Case Study on National Policies Linking TVET with Economic Expansion: lessons from Singapore, UNESCO. Sharma A. and Naisele E. (2008) Technical Vocational Education and Training: ‘The Master Key’ – Review of Functions of FIT, TPAF and Other TVET Providers, for the Ministry of Education, National Heritage, Culture and Arts, June. The University of Fiji (2010) Strategic Plan 2012-2014: creating a culture of excellence. The University of the South Pacific, Annual Report, 2012. The University of the South Pacific (2012) Council Approved Annual Plan, 2013, November. The University of the South Pacific (2012) University Grants Committee, Report: 2013-2015 Triennium, September. The University of the South Pacific, Strategic Plan 2013-2018. Tilak J.B.G. (1996) ‘Measurement of training costs’, in A.C. Tuijnman Ed, International Encyclopedia of Adult Education and Training, 2nd ed, Pergamon. Training and Productivity Authority of Fiji, Grant Scheme 5, Effective from 1 January 2010. US Department of State, Fiji: Country Specific Information, at www.state.gov. Whiteside B. (2013) Keynote address, Fiji Economy Update 2013, Holiday Inn, Suva, 20 August. Websites eeas.europa.eu/fiji/index_en.htm www.adb.org/countries/fiji www.cia.gov/library/publications/the-world-factbook/geos/fj.html www.data.un.org www.aid.govt.nz/where-we-work/pacific/fiji www.enterprisesurveys.org/Data/ExploreEconomies/2009/fiji#workforce--sector www.fiji.chris.gov.fj www.fnu.ac.fj www.foreignaffairs.gov.fj/trade-policy/international-cooperation/oda-to-fiji

Research into the Financing of TVET in the Pacific Fiji Country Report
174
www.foreignaffairs.gov.fj/trade-policy/international-cooperation/strategic-planning-and-decision-making-machinery-of-government www.globalintegrity.org www.pinz.co.nz www.stats.fiji.gov.fj www.sugaronline.com www.unevoc.unesco.org/worldtvetdatabase.php

Research into the Financing of TVET in the Pacific Fiji Country Report
175
ANNEX 1. RESEARCH SCOPE AND OBJECTIVES
This Annex sets out the definition of TVET applied in this study, and the research questions the study sought answers to. They were provided by the Research Brief - Research into Financing of Technical and Vocational Education and Training (TVET) in the Pacific - Research Brief, AusAID, 2011 (pages 8-10).
Research scope
For the purpose of this research, TVET is defined as follows:
Post-secondary education and training programs designed to develop vocational skills. Degree and higher-level programs, and subjects delivered as part of general education by secondary schools, are not included in this definition.
The research will encompass the following formal and non-formal learning. Informal (non-structured) learning is excluded:
TVET at upper secondary school level (at and above Year 4) that is provided in specialist vocational secondary schools but not the provision of practical subjects within general education;51
Post-secondary non-tertiary TVET provided for school leavers in specialist vocational colleges/centres;
Post-secondary tertiary TVET up to Bachelor level programs;
Structured training for both the formal waged economy and informal labour market;
Structured training for pre-employment and for existing workers;
Structured training provided on- and off-the-job, including apprenticeships;
Enterprise-based, community-based and institution-based TVET;
Structured training funded from public, private, community or external sources; and
Structured training provided under the auspices of the Ministries of Education, Labour, Youth Development, Maritime, Fisheries and Tourism and Hospitality.
Research objectives
The following research objectives represent the minimum that the successful tenderer must
cover; they will be refined in the design process (i.e. stage 1 of the project).
Sources of funding (revenues)
What are the current public and private sources of capital and recurrent funding for TVET? A broad view is required and could include trainees, employers, the state, community (local, religious, ethnic and other communities), and international agencies (donors and NGOs). Funding for the Australia-Pacific Technical College (APTC) should be included in calculations.
What is the relative contribution from each source in terms of the overall funding of TVET?
What is the level of reliance on donor funding?
What is the level of reliance on foreign private funding, and are there strategies in place to limit risks if there is a danger of funding being removed at short notice as investment decisions change?
What non-financial inputs are provided for TVET, from what sources, and what is their estimated value?
Expenditure
What is the overall level of public and private expenditure on TVET?
51 In the Pacific these practical subjects within the general secondary curriculum include Design and Technology,
Agricultural Science, Food & Textiles, Visual Arts, Fine Arts, Computer Studies.

Research into the Financing of TVET in the Pacific Fiji Country Report
176
What is the total government expenditure on TVET as a proportion of total government expenditure and what is the relative contribution of national and provincial governments?
What is TVET’s share of the education sector budget?
To what extent is there a gap between budget allocation to TVET and expenditure?
Where is expenditure directed, and through what allocative mechanisms?
What proportion of expenditure on TVET could be defined as quality related expenditures (e.g., teaching and learning materials and assessment, teacher/trainer professional development?)
Cost of TVET Services52
What is the most useful unit of analysis for assessing the costs of TVET services?53
What are the TVET services provided for the recurrent funds expended, and can they be quantified?54
What are the comparative costs of TVET between different types of providers (e.g. government and non-government, small and large, education institutions, and employer based training), levels of training, fields of training, course duration, mode of delivery, and geographic location?
What proportions of total costs are costs of wages and salaries, materials/consumables, and infrastructure?
What is the cost of capital?
What areas offer the greatest potential for improved cost efficiency?
Financing Mechanisms
What funding mechanisms are currently being used in Pacific Island countries to finance or co-finance TVET? Such mechanisms could include the following: input-oriented or output-oriented financing, voucher systems, individual training fees and subsistence allowances (student loans, fellowships, scholarships or grants), traditional apprenticeship schemes or other co-financing arrangements such as work placements; employer training incentives (training cost reimbursement schemes, income tax rebate incentives, payroll-levy exemption), matching grants, self-financing of training institutions through fee-for-service and other revenue generating activities.
How efficient and effective are these different mechanisms? o To what extent are they responsive to demand from industry, communities
and individuals? o To what extent are they being used to promote inclusion of groups at risk of
labour market and social exclusion?
How successful are these mechanisms in providing the country with a predictable and sustainable source of financing for skills development?
What policy measures are in place to improve diversification and sustainability in funding mechanisms?
Is the existing funding model sustainable if access to TVET is to be expanded?
What changes would ensure more financially sustainable and demand-based national TVET systems.
52 Analysis of the costs of services should take into account the methodology used by Minford etc al (2010) for the Tonga
education sector. 53 Outputs will need to be defined but may be measured based on student guided hours, equivalent full-time students,
graduates by level and funding rates. 54 The issue of the comparability will be a complex one given the varying stages of implementation of competency based
training (CBT) across the Pacific, the absence of comparability of national qualifications, and the differing quality of learning outcomes. These issues will need to be factored into the methodology used for costing.

Research into the Financing of TVET in the Pacific Fiji Country Report
177
ANNEX 2. TEMPLATES FOR LINE MINISTRY TVET PROVIDERS
I. MINISTRY OF EDUCATION VOCATIONAL SCHOOLS
MoE Enrolments & graduates
Enrolments in and graduates from Ministry of Education Vocational Schools 2012
A. Total enrolments
B. Graduates
A. Total enrolments in 2012
Co
de n
o.
Dis
tric
t
Are
a
Sch
oo
l
Sch
oo
l L
oc
ati
on
School type
Total
DISCIPLINE
Auto Engineering
Welding Fabrication
Carpentry & Joinery
Catering & or Tailoring
Office Technology
Agriculture Woodcraft Computer Marine
Pu
bli
c
Pri
vate
/GF
To
tal
M
F
To
tal
M
F
To
tal
M
F
To
tal
M
F
To
tal
M
F
To
tal
M
F
To
tal
M
F
To
tal
M
F
To
tal
M
F
To
tal
M
F
1
-
-
-
-
-
-
-
-
-
-
-
-
B. Graduates 2012
Co
de n
o.
Dis
tric
t
Are
a
Sch
oo
l
Sch
oo
l L
oc
ati
on
School type
Total
DISCIPLINE
Auto Engineering
Welding Fabrication
Carpentry & Joinery
Catering & or Tailoring
Office Technology
Agriculture Woodcraft Computer Marine
Pu
bli
c
Pri
vate
/GF
To
tal
M
F
To
tal
M
F
To
tal
M
F
To
tal
M
F
To
tal
M
F
To
tal
M
F
To
tal
M
F
To
tal
M
F
To
tal
M
F
To
tal
M
F
-
-
-
-
-
-
-
-
-
-
-
-

Research into the Financing of TVET in the Pacific Fiji Country Report
178
MoE Full-time equivalent staff
Staffing of Ministry of Education Vocational Schools 2012
Full-time equivalent staff*
Code no. District Area School School
Location
School type
Full-time equivalent staff*
Teaching staff Non-teaching staff Total staff
Public Private/GF Total M F Total M F Total M F
[*] A staff member employed full-time = 1 FTE; a staff member employed on a half-time basis = 0.5 FTE, etc
MoE Finances
Revenue and Expenditure for Ministry of Education Vocational Schools 2012 (FJ$)
Code n
o.
Dis
tric
t
Are
a
School
School Locato
n
School type
Revenue Expenditure
Government
operating
grants
Government
capital grants
Fees charged to
students
Fees charged to employers
Financial
support
from industry[1]
Other revenue[2]
Total revenue
Salaries, wages and other emoluments
Other operati
ng expenditure
Total recurre
nt expenditure
Development
expenditure[4]
Capital expendit
ure[5]
Total Expenditure Pu
blic Private/GF
Teaching/training staff[3]
Administration, general and all other non-
teaching staff
Total staff
emoluments
-
-
-
-
[1] Any cash support from industry (other than payment of course fees for their workers), and support in kind if a money value can be assigned to it. [2] Include here income from selling goods and services produced by the institution. [3] Emoluments include salaries, wages, living allowances, leave fares, pension contributions etc. [4] Annual expenditure on staff development, developing new courses, etc [5] Expenditure on the purchase of items costing FJ$2000 or more and having a useful life of one year or more., eg building extensions, equipment purchases, purchase of vehicles.

Research into the Financing of TVET in the Pacific Fiji Country Report
179
MINISTRY OF YOUTH AND SPORTS - YOUTH TRAINING CENTRES
Duration of training
Code no. Division Area Centre
Type of training program
Program A Program B Program C Program D
duration duration duration duration
weeks hours of training
weeks hours of training
weeks hours of training
weeks hours of training
1
Enrolments
Co
de
no
.
Dis
tric
t
Are
a
Cen
tre
Total
Type of training program
Program A Program B Program C Program D
Total M F Total M F Total M F Total M F Total M F
1
-
-
- - - - -
Graduates
Co
de
no
.
Dis
tric
t
Are
a
Cen
tre
Total
Type of training program
Program A Program B Program C Program D
Total M F Total M F Total M F Total M F Total M F
1
-
-
- - - - -

Research into the Financing of TVET in the Pacific Fiji Country Report
180
Full-time equivalent staff
Code no. Division Area Centre
Full-time equivalent staff
Teaching staff Non-teaching staff Total staff
Total M F Total M F Total M F
- - - - -
Finances
Revenue and Expenditure for Ministry of Youth and Sports - Youth Training Centres, 2012-13 (FJ$)
Code no.
Division
Area
Centre
Revenue Expenditure
Government operat
ing grants
Government capital grants
Fees
charged to
job-seekers
Fees charged to employers
Financial
support
from industry[1]
Other revenue[2]
Total
revenue
Salaries, wages and other emoluments
Other operat
ing expenditure
Total recurr
ent expenditure
Development expenditure[4]
Capital expenditure[5]
Total Expenditure
Teaching/training staff[3]
Administration, general and all other non-
teaching staff
Total staff
emoluments
[1] Any cash support from industry (other than payment of course fees for their workers), and support in kind if a money value can be assigned to it. [2] Include here income from selling goods and services produced by the institution. [3] Emoluments include salaries, wages, living allowances, leave fares, pension contributions etc. [4] Annual expenditure on staff development, developing new courses, etc [5] Expenditure on the purchase of items costing x local currency or more and having a useful life of one year or more., eg building extensions, equipment purchases, purchase of vehicles.

Research into the Financing of TVET in the Pacific Fiji Country Report
181
ANNEX 3. TEMPLATES FOR FIJI NATIONAL UNIVERSITY
Summary
FIJI NATIONAL UNIVERSITY
SUMMARY OF FINANCES – 2012
[FJ$] Revenue (all sources) Expenditure
Recurrent funding
Development funding
Capital funding
Total Recurrent
expenditure Development expenditure
Capital expenditure
Total
College of Agriculture Fisheries and Forestry
College of Business, Hospitality and Tourism
College of Engineering, Science and Technology
College of Humanities and Education
College of Medicine, Nursing and Health Science
National Training and Productivity Centre
Central and un-allocated funding and expenditure
Total FNU

Research into the Financing of TVET in the Pacific Fiji Country Report
182
RECURRENT(OPERATING) PROGRAMS
RECURRENT(OPERATING) PROGRAMS
Revenue (all sources) Expenditure
2011 2012 2013 (est.) 2011 2012 2013 (est.)
College of Agriculture Fisheries and Forestry
College of Business, Hospitality and Tourism
College of Engineering, Science and Technology
College of Humanities and Education
College of Medicine, Nursing and Health Science
National Training and Productivity Centre
Central and un-allocated funding and expenditure
Total FNU

Research into the Financing of TVET in the Pacific Fiji Country Report
183
DEVELOPMENT PROGRAMS
DEVELOPMENT PROGRAMS
Revenue (all sources) Expenditure
2011 2012 2013 (est.) 2011 2012 2013 (est.)
College of Agriculture Fisheries and Forestry
College of Business, Hospitality and Tourism
College of Engineering, Science and Technology
College of Humanities and Education
College of Medicine, Nursing and Health Science
National Training and Productivity Centre
Central and un-allocated funding and expenditure
Total FNU

Research into the Financing of TVET in the Pacific Fiji Country Report
184
CAPITAL PROGRAMS
CAPITAL PROGRAMS
Revenue (all sources) Expenditure
2011 2012 2013 (est.) 2011 2012 2013 (est.)
College of Agriculture Fisheries and Forestry
College of Business, Hospitality and Tourism
College of Engineering, Science and Technology
College of Humanities and Education
College of Medicine, Nursing and Health Science
National Training and Productivity Centre
Central and un-allocated funding and expenditure
Total FNU
Research into the Financing of TVET in the Pacific Fiji Country Report
185
ALL PROGRAMS
ALL PROGRAMS
Revenue (all sources) Expenditure
2011 2012 2013 (est.) 2011 2012 2013 (est.)
College of Agriculture Fisheries and Forestry
College of Business, Hospitality and Tourism
College of Engineering, Science and Technology
College of Humanities and Education
College of Medicine, Nursing and Health Science
National Training and Productivity Centre
Central and un-allocated funding and expenditure
Total FNU

Research into the Financing of TVET in the Pacific Fiji Country Report
186
FNU REVENUE
A. CONSOLIDATED FNU REVENUE
Source of funds (FJ$) 2011 actual 2012 actual 2013(est.)
Annual Ministry of Finance operating grants
recurrent (operating) grant
capital grant
all other MoF appropriations
Total MoF annual appropriations
National Training Levy allocations
Direct funding (ODA) from international donors
earmarked for TVET operations
all other direct donor assistance
Total direct ODA funding
Income from student fees
from TVET program students
from other FNU students

Research into the Financing of TVET in the Pacific Fiji Country Report
187
Total student fees
Revenue from the sale of services or products
from TVET operations
from other FNU activities
Total revenue from sales
Other revenue sources
related to TVET programs
all other sources
Total other sources
Total annual funding- all sources

Research into the Financing of TVET in the Pacific Fiji Country Report
188
B. COLLEGES
B. College of Agriculture Fisheries and Forestry C. College of Business, Hospitality and Tourism D. College of Engineering, Science and Technology E. College of Humanities and Education F. College of Medicine, Nursing and Health Science G. National Training and Productivity Centre
Source of funds (FJ$)
2011 2012 2013
actual actual (est.)
FNU allocations
recurrent (operating) grant
capital grant
all other FNU appropriations
Total FNU annual appropriations
National Training Levy allocations
Direct funding (ODA) from international donors
earmarked for CAFF operations
share of FNU donor assistance
Total direct ODA funding

Research into the Financing of TVET in the Pacific Fiji Country Report
189
Income from student fees
from TVET program students
from other CAFF students
Total student fees
Revenue from the sale of services or products
from TVET operations
from other CAFF activities
Total revenue from sales
Other revenue sources
related to TVET programs
all other sources
Total other sources
Total annual funding- all sources
Research into the Financing of TVET in the Pacific Fiji Country Report
190
FNU EXPENDITURE
A. CONSOLIDATED FNU REVENUE
Expenditure category (FJ$)
2011 2012 2013
actual actual (est.)
Routine recurrent/operational expenditure
Wages, salaries and other staff emoluments
salaries and other emoluments of teaching/training staff directly involved in TVET programs
salaries and other emoluments of other FNU teaching staff
wages, salaries and other emoluments of non-teaching staff (including admin, general and management staff at the central/college/school levels)
Total wages, salaries, etc
Other non-labour operating expenditure (consumables, utilities, maintenance, etc)
directly associated with provision of TVET programs
incurred in other FNU teaching programs and in non-teaching/training functions at the central/college/school admin level
Total non-labour operating expenditure
Total routine recurrent operating expenditure
Development expenditure (including staff development)
Research into the Financing of TVET in the Pacific Fiji Country Report
191
development/introduction of new TVET programs and/or upgrading of existing TVET courses
staff/professional development programs
other development items
Total development expenditure
Capital expenditure (expenditure on civil works, equipment, machinery, etc)
directly related to TVET operations
other capital expenditure
Total capital expenditure
Total annual expenditure – all categories

Research into the Financing of TVET in the Pacific Fiji Country Report
192
B. COLLEGES
B. College of Agriculture Fisheries and Forestry C. College of Business, Hospitality and Tourism D. College of Engineering, Science and Technology E. College of Humanities and Education F. College of Medicine, Nursing and Health Science G. National Training and Productivity Centre
Expenditure category (FJ$)
2011 2012 2013
actual actual (est.)
Routine recurrent/operational expenditure
Wages, salaries and other staff emoluments
salaries and other emoluments of teaching/training staff directly involved in TVET programs
salaries and other emoluments of other FNU teaching staff
wages, salaries and other emoluments of non-teaching staff (including admin, general and management staff at the central/college/school levels)
Total wages, salaries, etc
Other non-labour operating expenditure (consumables, utilities, maintenance, etc)
directly associated with provision of TVET programs
incurred in other FNU teaching programs and in non-teaching/training functions at the central/college/school admin level
Total non-labour operating expenditure
Total routine recurrent operating expenditure

Research into the Financing of TVET in the Pacific Fiji Country Report
193
Development expenditure (including staff development)
development/introduction of new TVET programs and/or upgrading of existing TVET courses
staff/professional development programs
other development items
Total development expenditure
Capital expenditure (expenditure on civil works, equipment, machinery, etc)
directly related to TVET operations
other capital expenditure
Total capital expenditure
Total annual expenditure – all categories

Research into the Financing of TVET in the Pacific Fiji Country Report
194
FNU EXPENDITURE 2012
Salaries, wages and other emoluments
Other operating
expenditure[4]
Total recurrent
expenditure
Development expenditure[
5]
Capital expenditure[
6]
Total Expenditur
e
Teaching/training staff[3]
Administration, general
and all other non-teaching
staff
Total staff emolument
s
College of
Department of
-
-
-
-
-
-
-
-
-
-
-
-
Research into the Financing of TVET in the Pacific Fiji Country Report
195
FNU STAFFING A. Total FNU
Staff category
Full-time equivalent staffing numbers
(as at February 1)
2011 2012 2013
FNU academic/teaching training staff
Teaching/training staff directly involved in TVET programs
Other FNU teaching (academic) staff
Total academic/teaching training staff
FNU administrative/general support staff
FNU administrative/general support staff
Total FNU administrative/general support staff
Total FNU staff – all categories

Research into the Financing of TVET in the Pacific Fiji Country Report
196
B. Colleges
Staff category
Full-time equivalent staffing numbers
(as at February 1)
2011 2012 2013
Academic/teaching training staff
Teaching/training staff directly involved in TVET programs
Other teaching (academic) staff
Total academic/teaching training staff
Administrative/general support staff
Administrative/general support staff
Total administrative/general support staff
Total staff – all categories

Research into the Financing of TVET in the Pacific Fiji Country Report
197
Courses and students
TVET program name and description
Level (eg Cert III)
Program Fee
(FJ$)
Max. no of
student contact hours
Duration (e.g. 2
yrs part-time)
No. of teaching
staff (FTE.)
Enrolments as at February 1 2012 Graduations for year ended December
31 2012
Male Female Total Male Female Total
College of
Department of
Qualification

Research into the Financing of TVET in the Pacific Fiji Country Report
198
ANNEX 4. PRIVATE PROVIDER SURVEY INSTRUMENT
RESEARCH INTO THE FINANCE OF TVET IN THE PACIFIC
FIJI COUNTRY STUDY
DATA REQUEST FROM TRAINING PROVIDER NAME OF PROVIDER: NAME OF RESPONDENT: POSITION IN ORGANISATION: Please supply the following information regarding your operations in the period 2011 to 2013. Annual income and expenditure on the provision of training: 2011 to 2013
FJ$ Financial Year (FY)
Revenue 2011 2012 estimate
2013
Fees charged to students
Fees charged to employers
Financial support from governing body (owner, church board of education, etc)
Financial support from industry55
Government grants
Grants from donors (eg AusAID, EU, etc)
Other income56
Total income
Expenditure
Item of Expense - - -
Salaries, wages and other emoluments - - -
Teaching/training/instructional staff57
Administration, general and all other non-teaching staff
Total staff emoluments
Other operating expenditure
Total recurrent expenditure
Development expenditure58
Capital expenditure59
Total Expenditure
55
Any cash support from industry (other than payment of course fees for their workers), and support in kind if a money value can be assigned to it. 56
Include here income from selling goods and services produced by the institution. 57
Emoluments include salaries, wages, living allowances, leave fares, pension contributions etc. 58
Annual expenditure on staff development, developing new courses, etc 59
Expenditure on the purchase of items costing FJ$2,000 local currency or more and having a useful life of one year or more, eg building extensions, equipment purchases, purchase of vehicles.

Research into the Financing of TVET in the Pacific Fiji Country Report
199
Number of staff employed by training provider, as at 1February, 2011-2013
Teaching year 2011 2012 2013
Staff category Full-time
equivalent (FTE)
60
Full-time equivalent
(FTE)61
Full-time
62
Part-time
63
Full-time equivalent
(FTE)64
Teaching staff (lecturers and instructors)
Non-teaching staff (administration and general staff)
Total number employed
TVET programs offered by the training provider in 2012
TVET program/course
name and description
level65
course fee FJ$
max. no of student contact
hours
no. of
teaching staff (FTE
)
Total enrolments as at June 30, 2012
graduations for year ended December
2012
M F T M F T
Example - Carpentry
Cert II
200 720
4 75 5 80 36 2 38
60
A staff member employed full-time = 1FTE; a staff member employed on a half-time basis = 0.5 FTE, etc 61
A staff member employed full-time = 1FTE; a staff member employed on a half-time basis = 0.5 FTE, etc 62
Employed for 35 hours or more per week 63
Employed for less than 35 hours a week or on a casual basis 64
A staff member employed full-time = 1FTE; a staff member employed on a half-time basis = 0.5 FTE, etc 65
Stipulate whether certificate or diploma level or, if more precise, state which qualification framework (eg FQF)

Research into the Financing of TVET in the Pacific Fiji Country Report
200
Please briefly describe your institution (background, history, organizational structure, future plans):
Please list minimum entry requirements for your various programs/course:
Is your Institution recognized and/or registered with the Fiji Higher Education Commission? If it is not, o you intend to apply?
Any queries, please contact Ms Manaini Rokovunisei at [email protected]
THANK YOU

Research into the Financing of TVET in the Pacific Fiji Country Report
201
ANNEX 5. ENTERPRISE TRAINING EXPENDITURE SURVEY
RESEARCH INTO THE FINANCING TVET IN THE PACIFIC FIJI COUNTRY STUDY 2013
Return number:
Please note, that information you provide us will be treated with the strictest confidentiality, and the enterprise will not be identifiable in any of the results of the survey.
NAME OF ENTERPRISE : ADDRESS
Location … ………………………………………………………………………………. Telephone number………………………………………………………………………. Fax number………………………………………………………………………………. Email address……… ……………………………………………………………………
NAME OF PRINCIPAL CONTACT… ………………………………………………………
POSITION IN ENTERPRISE: ……………………………………………………………….

Research into the Financing of TVET in the Pacific Fiji Country Report
202
1 What is the main industry sector in which the enterprise operates, (eg manufacturing, mining, tourism)?
…………………………………………………………………………………………………………….
2 Please provide estimates of the following for the latest three financial years. (FJ$ thousands)
Item 2010 2011 2012
What was the enterprise’s annual total revenue or total budget?
What was the enterprise’s annual ‘wages bill’ ? (i.e. its annual expenditure on wages, salaries and other employee emoluments)
3 What was the number of people employed by the establishment, as at December 31,
over the last three years?
2010 2011 2012
Full-time employees- (those working 35 hours or more a week on average)
Females
Males
Sub-total
Part-time and casual workers- (those working less than 35 hour a week on average or on contract)
Females
Males
Sub-total
All Employees
Females
Males
Total
4. Does the enterprise have an apprenticeship program? (please tick)
Yes
No

Research into the Financing of TVET in the Pacific Fiji Country Report
203
5. If yes, then how many in each of the following trades did it employ in 2012?
Trade
Aircraft Maintenance
Automotive Electrical
Automotive Mechanic
Boiler making
Carpentry
Cook
Electrical Fitter Mechanic
Electronics
Fitting and Machining 5
Heavy Commercial Vehicle Mechanic
Heavy Mobile Plant Mechanic
Industrial Sewing Machinery Mechanic
Joinery and Cabinet Making
Marine Engineering
Navigation and Seamanship
Panel Beating
Plant Maintenance Engineering
Printing
Refrigeration and Air conditioning
Saw Doctor
Shipwright
Welding and Fabricating
Others (Please specify)
6. Please indicate if the enterprise undertook any training other than through its apprenticeship program in 2012
Please tick
In house structured training using own training staff and facilities
e.g. internal workshops, lectures, etc; computer assisted training programs; other training courses, etc
In house structured training using external training providers
e.g. internal workshops, lectures, etc; computer assisted training programs; other training courses, etc
Off-site structured training programs conducted by external training providers
FNU
APTC
Other public or regional provider
Private training provider under FHEC
Industry or professional association

Research into the Financing of TVET in the Pacific Fiji Country Report
204
Equipment and/or product manufacturer/supplier
Other external provider (please specify) …………………………………………………………………..
Unstructured training arrangements
For example, on-the-job training as the need arises
7. Please provide an estimate of gross expenditure on training in 2012
Expenditure item FJ$
National Training Levy
Apprenticeship training scheme fees
Expenditure on enterprise’s own training staff and facilities
Expenditure on external trainers and training providers
Employee wage subsidies whilst undertaking training
Employee training fee reimbursements or subsidies
Reimbursement or subsidy of other employee training costs, eg travel costs, tools and materials, etc
Other
Estimated gross expenditure on training
8. What avenues, if any, were available in 2012 to enable the enterprise to reduce the net cost of training?
Item FJ$
Reimbursement of National Training Levy
Fees charged to trainees
Other (please specify) …………………………………………………………………………..
Estimated total
9. Are employees paid their full wage and other benefits during time on training?
Please tick
Yes
No
10. If not, then please specify approximate percentage, for example 50%, 75%
Percent

Research into the Financing of TVET in the Pacific Fiji Country Report
205
11. Under the National Levy Scheme, is this organization a Method A or Method B trainer?
Please tick
Method A
Method B
NO FURTHER QUESTIONS THANK YOU
………………………………………………………………………………………………………………… OFFICE USE ONLY
Date of First Interview……………………………………………………………………………………….
Date(s) of follow up visits…………….……………………………………………………………………..
Questionnaire Completed……………………………………………………………………… Yes/No

Research into the Financing of TVET in the Pacific Fiji Country Report
206
ANNEX 6. CLASSIFICATION AND CODING SYSTEMS USED IN DATA
COLLECTION AND RECORDING
International classification and coding systems were applied in this study for the following variables:
fields of training
occupations
industries
1. Fields of training
0 General Programs
010 Basic programs 080 Literacy and numeracy 090 Personal development
1 Education 141 Teaching and training 142 Education science
2 Humanities and the arts 211 Fine arts 212 Music and performing arts 213 Audio-visual techniques and media production 214 Design 215 Craft skills 221 Religion and theology 222 Foreign languages and cultures 223 Mother tongue 224 History, philosophy and related subjects
3 Social sciences, business and law 310 Social and behavioural science 321 Journalism and reporting 322 Library, information, archive 341 Wholesale and retail sales 342 Marketing and advertising 343 Finance, banking, insurance 344 Accounting and taxation 345 Management and administration 346 Secretarial and office work 347 Working life 380 Law
4 Science
420 Life science 440 Physical science 460 Mathematics and statistics 481 Computer science 482 Computer use
5 Engineering, manufacturing and construction 521 Mechanics and metal work 522 Electricity and energy 523 Electronics and automation

Research into the Financing of TVET in the Pacific Fiji Country Report
207
524 Chemical and process 525 Motor vehicles, ships and aircraft 541 Food processing processing 542 Textiles, clothes, footwear, leather 543 Materials (wood, paper, plastic, glass) 544 Mining and extraction 581 Architecture and town planning 582 Building and civil engineering
6 Agriculture 621 Crop and livestock production and fishery 622 Horticulture 623 Forestry 624 Fisheries 640 Veterinary
7 Health and welfare 721 Medicine 722 Medical services 723 Nursing 724 Dental studies 761 Child care and youth services 762 Social work and counselling
8 Services 811 Hotel, restaurant and catering 812 Travel, tourism and leisure 813 Sports 814 Domestic services 815 Hair and beauty services 840 Transport services 850 Environmental protection 861 Protection of property and persons 862 Occupational health and safety 863 Military
9 Not known Source: European Centre for the Development of Vocational Training (CEDEFOP) Fields of Training Manual, Eurostat, 1999,
2. Occupations
1 Managers
11 Chief executives, senior officials and legislators
12 Administrative and commercial managers
13 Production and specialized services managers
14 Hospitality, retail and other services managers
2 Professionals
21 Science and engineering professionals
22 Health professionals
23 Teaching professionals
24 Business and administration professionals

Research into the Financing of TVET in the Pacific Fiji Country Report
208
25 Information and communications technology professionals
26 Legal, social and cultural professionals
3 Technicians and associate professionals
31 Science and engineering associate professionals
32 Health associate professionals
33 Business and administration associate professionals
34 Legal, social, cultural and related associate professionals
35 Information and communications technicians
4 Clerical support workers
41 General and keyboard clerks
42 Customer services clerks
43 Numerical and material recording clerks
44 Other clerical support workers
5 Service and sales workers
51 Personal service workers
52 Sales workers
53 Personal care workers
54 Protective services workers
6 Skilled agricultural, forestry and fishery workers
61 Market-oriented skilled agricultural workers
62 Market-oriented skilled forestry, fishing and hunting workers
63 Subsistence farmers, fishers, hunters and gatherers
7 Craft and related trades workers
71 Building and related trades workers, excluding electricians
72 Metal, machinery and related trades workers
73 Handicraft and printing workers
74 Electrical and electronic trades workers
75 Food processing, wood working, garment and other craft and related trades workers
8 Plant and machine operators, and assemblers
81 Stationary plant and machine operators
82 Assemblers
83 Drivers and mobile plant operators
9 Elementary occupations
91 Cleaners and helpers
92 Agricultural, forestry and fishery labourers
93 Labourers in mining, construction, manufacturing and transport
94 Food preparation assistants

Research into the Financing of TVET in the Pacific Fiji Country Report
209
95 Street and related sales and service workers
96 Refuse workers and other elementary workers
0 Armed forces occupations
01 Commissioned armed forces officers
02 Non-commissioned armed forces officers
03 Armed forces occupations, other ranks
Source: ILO International Standard Classification of Occupations, 2008 (ISCO-08)
3. Industries
A. Agriculture, Forestry and Fishing B. Mining C. Manufacturing D. Electricity, Gas and Water Supply E. Construction F. Wholesale Trade G. Retail Trade H. Accommodation, Cafes and Restaurants I. Transport and Storage J. Communication Services K. Finance and Insurance L. Property and Business Services M. Government Administration and Defence N. Education O. Health and Community Services P. Cultural and Recreational Services Q. Personal and Other Services
Source: ABS, Australian and New Zealand Standard Industrial Classification (ANZSIC),
1993
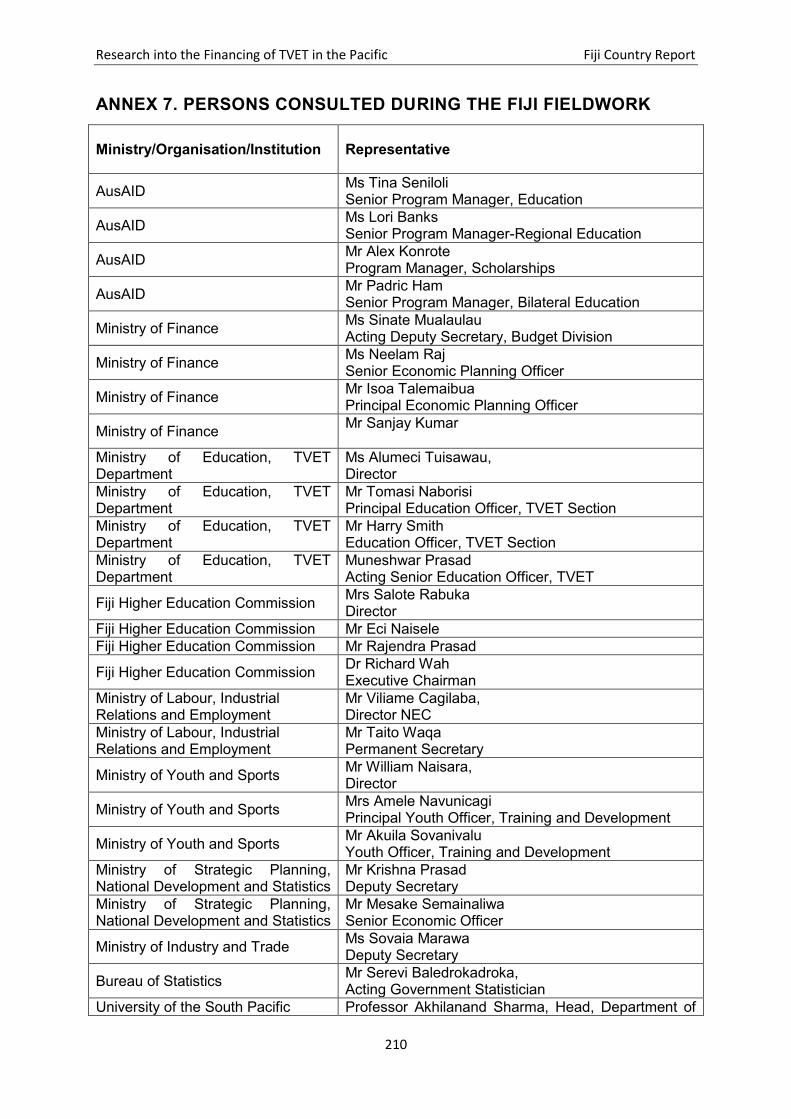
Research into the Financing of TVET in the Pacific Fiji Country Report
210
ANNEX 7. PERSONS CONSULTED DURING THE FIJI FIELDWORK
Ministry/Organisation/Institution Representative
AusAID Ms Tina Seniloli Senior Program Manager, Education
AusAID Ms Lori Banks Senior Program Manager-Regional Education
AusAID Mr Alex Konrote Program Manager, Scholarships
AusAID Mr Padric Ham Senior Program Manager, Bilateral Education
Ministry of Finance Ms Sinate Mualaulau Acting Deputy Secretary, Budget Division
Ministry of Finance Ms Neelam Raj Senior Economic Planning Officer
Ministry of Finance Mr Isoa Talemaibua Principal Economic Planning Officer
Ministry of Finance Mr Sanjay Kumar
Ministry of Education, TVET Department
Ms Alumeci Tuisawau, Director
Ministry of Education, TVET Department
Mr Tomasi Naborisi Principal Education Officer, TVET Section
Ministry of Education, TVET Department
Mr Harry Smith Education Officer, TVET Section
Ministry of Education, TVET Department
Muneshwar Prasad Acting Senior Education Officer, TVET
Fiji Higher Education Commission Mrs Salote Rabuka Director
Fiji Higher Education Commission Mr Eci Naisele
Fiji Higher Education Commission Mr Rajendra Prasad
Fiji Higher Education Commission Dr Richard Wah Executive Chairman
Ministry of Labour, Industrial Relations and Employment
Mr Viliame Cagilaba, Director NEC
Ministry of Labour, Industrial Relations and Employment
Mr Taito Waqa Permanent Secretary
Ministry of Youth and Sports Mr William Naisara, Director
Ministry of Youth and Sports Mrs Amele Navunicagi Principal Youth Officer, Training and Development
Ministry of Youth and Sports Mr Akuila Sovanivalu Youth Officer, Training and Development
Ministry of Strategic Planning, National Development and Statistics
Mr Krishna Prasad Deputy Secretary
Ministry of Strategic Planning, National Development and Statistics
Mr Mesake Semainaliwa Senior Economic Officer
Ministry of Industry and Trade Ms Sovaia Marawa Deputy Secretary
Bureau of Statistics Mr Serevi Baledrokadroka, Acting Government Statistician
University of the South Pacific Professor Akhilanand Sharma, Head, Department of

Research into the Financing of TVET in the Pacific Fiji Country Report
211
Ministry/Organisation/Institution Representative
Education
University of the South Pacific Hasmukh Lal Director- RCCCE
PATVET Dr Isimeli Tagicakiverata, Pacific Association of TVET
Fiji National University Dr Ganesh Chand Vice Chancellor
National Training and Productivity Centre, FNU
Dr Kamlesh Shashi Prakash Director
Fiji National University Dr Michael Gregory Director Planning
Fiji Commerce and Employers Federation
Mr Nesbitt Hazelman CEO
Fiji Hotel and Tourism Association Mr Michael Wong CEO
Public Service Commission Mr Iliesa Lutu Deputy Secretary
Public Service Commission Ms Alumeci Korobiau Director- Scholarships
Public Service Commission Mr Ajay Singh Director-CTD
Montfort Boys’ Town Brother Paul Shaji Director
Fiji Vocational Technical and Training Centre for Persons with Disabilities
Mr Jone Robanakadavu Centre Manager
Fiji Council of Social Services Mr Hasan Khan Director
Fiji Council of Social Services Mr Neil Maharaj Projects Officer
National Centre for Small Microenterprise Development
Mr Ravi Chand Director
International Labour Organisation Mr Edward Bernard
Marist Champagne Institute Mr Francis Varea Principal

Research into the Financing of TVET in the Pacific Fiji Country Report
212
ANNEX 8. MEMBERSHIP OF THE NATIONAL REFERENCE GROUP
Ministry/Organisation/Institution Representative
Ministry of Finance Madam Chair- Ms Sinate Mualaulau Acting Deputy Secretary
Ministry of Education, TVET Department
Ms Alumeci Tuisawau, Director
Fiji Higher Education Commission Mrs Salote Rabuka Director
Ministry of Labour, Industrial Relations and Employment
Mr Viliame Cagilaba, Director NEC
Ministry of Youth and Sports Mr William Naisara, Director
Ministry of Women, Social Welfare and Poverty Alleviation
Ms Luse Qereqeretabua, Principal Research Officer
Ministry of Strategic Planning, National Development and Statistics
Mr Krishna Prasad Deputy Secretary
Bureau of Statistics Mr Serevi Baledrokadroka, Acting Government Statistician
University of the South Pacific Professor Akhilanand Sharma, Head, Department of Education
PATVET Dr Isimeli Tagicakiverata, Pacific Association of TVET
National Training and Productivity Centre, FNU
Dr Kamlesh Shashi Prakash Director
Fiji National University Dr Michael Gregory Director Planning
Fiji Commerce and Employers Federation
Mr Nesbitt Hazelman CEO
Fiji Hotel and Tourism Association Mr Michael Wong CEO

The project Research into the Financing of Technical and Vocational Education and Training (TVET) in the Pacific was managed by the Australian Council for Educational Research (ACER) and Scope Global on behalf of the Australian Government. The project was undertaken between 2012 and 2014 under contract to the Australian Government, initially through AusAID and then the Department of Foreign Affairs and Trade (DFAT).
The study was conducted in seven Pacific countries: Fiji; Kiribati; Papua New Guinea; Samoa; Solomon Islands; Tonga; and Vanuatu. The aims of the research were to produce, in conjunction with host country governments and TVET stakeholders, comprehensive analyses of the systems for financing TVET and discussions of policies through which the financing of TVET could be made more efficient and effective. This volume is one of the seven country reports produced by the study.
ISBN 978-1-74286-281-1
9 781742 862811