
Research into the costs of vehicle exhaust gases from the
18
African Journal of Business Management Vol. 5(22), pp. 9304-9321, 30 September, 2011 Available online at http://www.academicjournals.org/AJBM DOI: 11.5897/AJBM11.949 ISSN 1993-8233 ©2011 Academic Journals Full Length Research Paper Research into the costs of vehicle exhaust gases from the standpoint of using natural gas-powered buses Ivan Ivković 1 *, Željko Janjoš 2 , Srećko Žeželj 1 and Vojkan Jovanović 1 1 Department of Road Transport, the Faculty of Transport and Traffic Engineering, University of Belgrade, Serbia. 2 City Net Ltd, Agency for Consulting and Management, Belgrade, Serbia. Accepted 12 July 2011 This paper aims at analysing the costs of motor vehicle exhaust gases with particular reference to natural gas-powered buses in intercity passenger transport in the territory of the Republic of Serbia. For defining and forecasting transport demands, expressed in the number of vehicles per day at each section of the created multimodal transport network, Transtools application is used, specially adapted for the territory of the Republic of Serbia. By applying the Highway Design and Maintenance (HDM) model and regression analysis, the functional dependency between the speed of a vehicle and fuel consumption is established for each of the following categories: passenger car, bus, light truck, medium truck, heavy truck, articulated truck, according to the type of the terrain and International Roughness Indicator (IRI) of the road. By estimating the unit costs of NO x , NMVOC, SO x , PM, CO, CO 2 and CH 4 pollutants and by estimating the average factors of exhaust emissions expressed in a gram of pollutant/gram of burnt fuel, according to all vehicle categories, the analysis of exhaust gas emission costs is conducted for three different scenarios. Key words: Exhaust gas emissions, compressed natural gas (CNG) bus, diesel bus, emission cost, transport network. INTRODUCTION The problem of environmental pollution from vehicle exhaust emissions, caused by traffic, has existed ever since the motor vehicle was launched. It is beyond any doubt that this problem has become common by the gradual development of traffic and increase in the degree of motorisation, and in time it has become the issue organisations for environmental protection deal with. One of the results of environmental considerations is related to standards on maximum allowed noxious exhaust gas emissions produced by motor vehicles. Current standards and those which will be applied in the near future (EURO V – has been applied since October 2008 and EURO VI – will be applied from January 2013) prescribe low values of pollutant emissions and they will definitely affect the application of contemporary technical devices by means of which these values will be reached, such as: the latest system of fuel supply in diesel engines – common rail; the application of installations for treating *Corresponding author. E-mail: [email protected]. Tel: +381 11 3091 291. exhaust gases: three-way, oxidation, de NO x catalytic converters, PM filters...; the application of alternative fuels (Petrović et al., 2009; Filipović et al., 2009; Mudgal et al., 2011). On the other hand, if the transport service has already been met, the impact of vehicles on the environment is taken into consideration by defining external costs in the transport sector. External costs are made due to societal and economic activities of one group of individuals. However, the other group of individuals who appear as indirect or direct users of realised activities, that is, the transport service of the first group of individuals, covers the costs. With respect to the mitigation of negative consequences that follow the realisation of the transport process, external costs do not apply to an individual that is, the direct user of the transport service when wear and tear and the energy cost of vehicle use, own time costs, transport fares and transport taxes and charges occur. Conversely, external costs entail costs which include society as a whole and it is then that we most frequently talk of: the costs of noxious exhaust gas emissions, congestion and scarcity costs, traffic accidents costs, noise costs, climate change costs, costs for nature and
Transcript of Research into the costs of vehicle exhaust gases from the

African Journal of Business Management Vol. 5(22), pp. 9304-9321, 30 September, 2011 Available online at http://www.academicjournals.org/AJBM DOI: 11.5897/AJBM11.949 ISSN 1993-8233 ©2011 Academic Journals
Full Length Research Paper
Research into the costs of vehicle exhaust gases from the standpoint of using natural gas-powered buses
Ivan Ivković1*, Željko Janjoš2, Srećko Žeželj1 and Vojkan Jovanović1
1Department of Road Transport, the Faculty of Transport and Traffic Engineering, University of Belgrade, Serbia.
2City Net Ltd, Agency for Consulting and Management, Belgrade, Serbia.
Accepted 12 July 2011
This paper aims at analysing the costs of motor vehicle exhaust gases with particular reference to natural gas-powered buses in intercity passenger transport in the territory of the Republic of Serbia. For defining and forecasting transport demands, expressed in the number of vehicles per day at each section of the created multimodal transport network, Transtools application is used, specially adapted for the territory of the Republic of Serbia. By applying the Highway Design and Maintenance (HDM) model and regression analysis, the functional dependency between the speed of a vehicle and fuel consumption is established for each of the following categories: passenger car, bus, light truck, medium truck, heavy truck, articulated truck, according to the type of the terrain and International Roughness Indicator (IRI) of the road. By estimating the unit costs of NOx, NMVOC, SOx, PM, CO, CO2 and CH4 pollutants and by estimating the average factors of exhaust emissions expressed in a gram of pollutant/gram of burnt fuel, according to all vehicle categories, the analysis of exhaust gas emission costs is conducted for three different scenarios. Key words: Exhaust gas emissions, compressed natural gas (CNG) bus, diesel bus, emission cost, transport network.
INTRODUCTION The problem of environmental pollution from vehicle exhaust emissions, caused by traffic, has existed ever since the motor vehicle was launched. It is beyond any doubt that this problem has become common by the gradual development of traffic and increase in the degree of motorisation, and in time it has become the issue organisations for environmental protection deal with.
One of the results of environmental considerations is related to standards on maximum allowed noxious exhaust gas emissions produced by motor vehicles. Current standards and those which will be applied in the near future (EURO V – has been applied since October 2008 and EURO VI – will be applied from January 2013) prescribe low values of pollutant emissions and they will definitely affect the application of contemporary technical devices by means of which these values will be reached, such as: the latest system of fuel supply in diesel engines – common rail; the application of installations for treating
*Corresponding author. E-mail: [email protected]. Tel: +381 11 3091 291.
exhaust gases: three-way, oxidation, de NOx catalytic converters, PM filters...; the application of alternative fuels (Petrović et al., 2009; Filipović et al., 2009; Mudgal et al., 2011).
On the other hand, if the transport service has already been met, the impact of vehicles on the environment is taken into consideration by defining external costs in the transport sector. External costs are made due to societal and economic activities of one group of individuals. However, the other group of individuals who appear as indirect or direct users of realised activities, that is, the transport service of the first group of individuals, covers the costs. With respect to the mitigation of negative consequences that follow the realisation of the transport process, external costs do not apply to an individual that is, the direct user of the transport service when wear and tear and the energy cost of vehicle use, own time costs, transport fares and transport taxes and charges occur. Conversely, external costs entail costs which include society as a whole and it is then that we most frequently talk of: the costs of noxious exhaust gas emissions, congestion and scarcity costs, traffic accidents costs, noise costs, climate change costs, costs for nature and
landscape, costs for soil and water pollution, external costs in sensitive areas, costs of up- and downstream processes, costs of energy dependency (EEA, 2007; Schreyer et al., 2008; Bickel et al., 1997; Maibach et al., 2008).
Taking the aforementioned points into consideration, this paper will conduct an analysis of external costs in the transport sector. These costs refer to air pollution and climate change costs from the aspect of using natural gas as an alternative propellant fuel for buses. The research is conducted for the transport network in the territory of the Republic of Serbia according to different scenarios.
NATURAL GAS IN THE TRANSPORT SECTOR Using gaseous fuels for powering internal combustion engines is not uncommon. When an efficient internal combustion engine was developed about 60 years ago, it was logically concluded that its operation requires gaseous fuel due to its beneficial properties: more complete combustion, minimal excess air rate in comparison with any other fuel type, high heating value of fuel, fuel mixture preparation, resistance to engine knocking, etc. Still, it was soon concluded that gaseous fuels are much easier to handle, especially when engines are fuelled by petrol which meant that gaseous fuels were mainly used in stationary engines located near gas deposits or particular storage areas.
The centennial and widespread exploitation of liquid fuels, gasoline and diesel, in traffic has led to certain unpleasant consequences. The first being the dwindling of liquid fuel reserves and their increasingly striking deficit on the market. The other being rising air and environmental pollution which is the result of increasingly inadequate fuel combustion and unoptimised energy substance quality. Modern demands set by the latest standards on gasoline and diesel quality make them increasingly expensive and more problematic on the world market. For these reasons, since the 1980s, a great deal of continual effort has been made to find alternative fuels which would replace conventional fuels. The most widely used and well known alternative fuels used for powering motor vehicles are: compressed natural gas (CNG), liquefied natural gas (LNG), liquefied petroleum gas (LPG), methanol, ethanol, hydrogen, methyl esters, oils extracted from oilseed rape, etc (Matijosius and Sokolovskij, 2009).
Of all the aforementioned options, there has been a growing interest in natural gas as the fuel for internal combustion engines, due to inherent changes in supply, that is, the availability of natural gas as well as technological development in storing. Apart from these basic criteria, there is a set of others, ecological, economic, transportation and safety criteria in the world by means of which an estimate of alternative solution suitability for the use in the transport sector can be made.
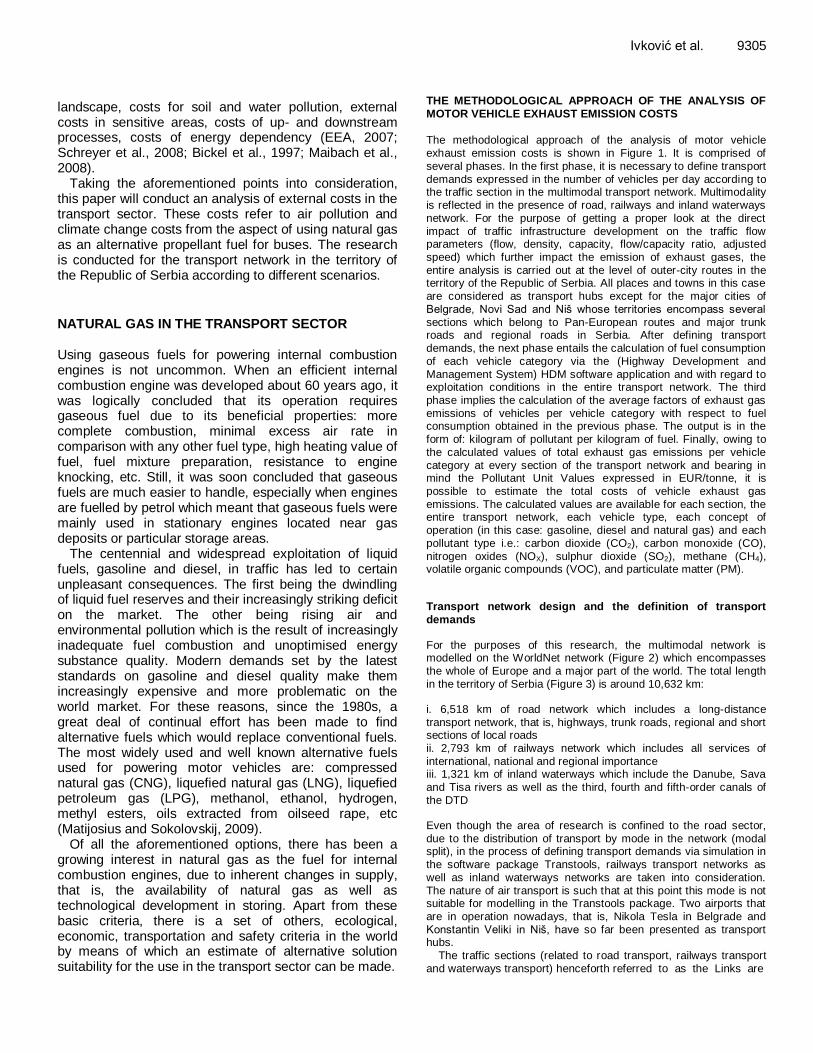
Ivković et al. 9305 THE METHODOLOGICAL APPROACH OF THE ANALYSIS OF MOTOR VEHICLE EXHAUST EMISSION COSTS
The methodological approach of the analysis of motor vehicle exhaust emission costs is shown in Figure 1. It is comprised of
several phases. In the first phase, it is necessary to define transport demands expressed in the number of vehicles per day according to the traffic section in the multimodal transport network. Multimodality is reflected in the presence of road, railways and inland waterways network. For the purpose of getting a proper look at the direct impact of traffic infrastructure development on the traffic flow parameters (flow, density, capacity, flow/capacity ratio, adjusted speed) which further impact the emission of exhaust gases, the entire analysis is carried out at the level of outer-city routes in the territory of the Republic of Serbia. All places and towns in this case are considered as transport hubs except for the major cities of Belgrade, Novi Sad and Niš whose territories encompass several sections which belong to Pan-European routes and major trunk roads and regional roads in Serbia. After defining transport demands, the next phase entails the calculation of fuel consumption of each vehicle category via the (Highway Development and Management System) HDM software application and with regard to exploitation conditions in the entire transport network. The third phase implies the calculation of the average factors of exhaust gas emissions of vehicles per vehicle category with respect to fuel consumption obtained in the previous phase. The output is in the form of: kilogram of pollutant per kilogram of fuel. Finally, owing to the calculated values of total exhaust gas emissions per vehicle category at every section of the transport network and bearing in mind the Pollutant Unit Values expressed in EUR/tonne, it is possible to estimate the total costs of vehicle exhaust gas
emissions. The calculated values are available for each section, the entire transport network, each vehicle type, each concept of operation (in this case: gasoline, diesel and natural gas) and each pollutant type i.e.: carbon dioxide (CO2), carbon monoxide (CO), nitrogen oxides (NOX), sulphur dioxide (SO2), methane (CH4), volatile organic compounds (VOC), and particulate matter (PM).
Transport network design and the definition of transport
demands
For the purposes of this research, the multimodal network is modelled on the WorldNet network (Figure 2) which encompasses the whole of Europe and a major part of the world. The total length in the territory of Serbia (Figure 3) is around 10,632 km:
i. 6,518 km of road network which includes a long-distance
transport network, that is, highways, trunk roads, regional and short sections of local roads ii. 2,793 km of railways network which includes all services of international, national and regional importance iii. 1,321 km of inland waterways which include the Danube, Sava and Tisa rivers as well as the third, fourth and fifth-order canals of the DTD
Even though the area of research is confined to the road sector,
due to the distribution of transport by mode in the network (modal split), in the process of defining transport demands via simulation in the software package Transtools, railways transport networks as well as inland waterways networks are taken into consideration. The nature of air transport is such that at this point this mode is not suitable for modelling in the Transtools package. Two airports that are in operation nowadays, that is, Nikola Tesla in Belgrade and Konstantin Veliki in Niš, have so far been presented as transport hubs.
The traffic sections (related to road transport, railways transport and waterways transport) henceforth referred to as the Links are

9306 Afr. J. Bus. Manage.
Figure 1. The methodological approach of the analysis of vehicle exhaust gas emission costs.
divisions within the multimodal network, that is, their character is one of a route or railways section with homogeneous technical and exploitation properties. Every link within road, railways and inland waterways network has 55, 39, 23 properties, respectively. These properties are indicative of technical and exploitation characteristics of that same link (Figure 3). Some of the most important properties on road network include: the Identification number of the section (ID_TT), link length, free speed, road class, terrain type, the number of lanes in forward direction (LanesFor), the number of lanes in backward direction (LanesBack), the hourly traffic capacity in the
forward direction (LaneHCFor), the hourly traffic capacity in the backward direction (LaneHCBack), country border.
For defining transport demands in the transport network, the Transtools package for modelling is used, that is, the application adjusted for the territory of the Republic of Serbia. The four step model (generation/distribution/mode split/assignment) is calibrated for the base year (in this case it is the year of 2009) so that the properties of traffic flow, according to the model link, are consistent with the characteristics of transport of the same section obtained by calculation under real conditions. Apart from the modelled transport

Ivković et al. 9307
Figure 2. Multimodal transport network at European level used in the research.
network, some of the most important input data necessary for the
Transtools operation include: i. The adopted zone system which consists of 25 districts with data related to every district: the name of the district, the population, the size of a household, the number of passenger cars, the number of employees, persons in car owning households and non car owning households; ii. The data on travelling for the base year: the origin and destination according to transport modes, the purpose of travelling (work or other), the degree of motorisation, the generation of travelling from home; iii. The OD matrices of freight transport for the base year; iv. The variables according to scenarios. Output results for each section of the transport network include the following data: link identifier, link type based on functional classes, terrain type, International Roughness Indicator (IRI), unadjusted
passenger speed, unadjusted freight speed, adjusted passenger speed, adjusted freight speed, daily cars, daily buses, daily light trucks, daily medium trucks, daily heavy trucks, daily articulated
trucks, hourly capacity in PCU (Passenger Car Unit) and intensity to
capacity Ratio. The calculation of fuel consumption in the transport network The calculation of fuel consumption in the first step entails the calculation of conventional fuel consumption, diesel and gasoline, for all vehicle categories and different exploitation conditions. For this purpose, the HDM software package was used. For this model to operate, it is necessary to obtain the following pieces of information: on vehicle utilisation, average service life, the average number of transported passengers and the number of transported tonnes. The data used for the purpose of this research are given in Table 1 (Statistical Office of the Republic of Serbia, 2009).
Input values enable the calculation of fuel consumption for all vehicle categories at different speeds on the basis of the HDM model. On the basis of pairings (speed, fuel consumption) and by
means of regression analysis, the functional dependency of fuel consumption on vehicle speed is established. The function FC (fuel consumption) = f (v) is a second degree polynomial, Equation (1):

9308 Afr. J. Bus. Manage.
Figure 3. Modelled road transport network in the territory of the Republic of Serbia.
(1) Where, a, b and c = regression parameters; V = the velocity expressed in km/h.
Average road characteristics for every terrain type while determining fuel consumption are given in Table 2 (Statistical Office of the Republic of Serbia, 2009). By means of regression analysis 84 different speed and fuel consumption ratios are obtained for six vehicle categories according to every terrain type (flat, rolling and mountainous) and for each of the 4 values of IRI (2, 5, 8 and 12).
The results of this analysis are shown in detail in Table 3.
In the second step, it is necessary to determine compressed natural gas consumption equivalent to diesel fuel consumption in the form of:
(2)
The volumetric calorific value of natural gas is 38-41 MJ/m3 and of
diesel fuel 42.5 MJ/dm3 which means that for the same amount of
energy consumed the theoretical relationship is established (Pelkmans et al., 2001a; Department of Energy, 2002):
FC = a + b ∙ V + c ∙ V2
1[lit] of diesel fuel
100[km]=
x ∙ 1[m3] natural gas
100[km]

Ivković et al. 9309
Table 1. Average characteristics of using different vehicle categories.
Item Unit Passenger
car Bus
Light
truck
Medium
truck
Heavy
truck
Articulated
truck
Average annual utilisation (Km) 12000 80000 40000 40000 55000 80000
Average annual utilisation (Hours) 300 2000 2000 2000 2000 2000
Average service life (Years) 15 14 14 14 14 15
Age of vehicle in kilometres (Km) 180000 1120000 560000 560000 770000 1120000
Average No. of passengers per vehicle (No). 2 36 0 0 0 0
Average tonnes transported per vehicle (Tonnes) 0 0 6 6 18 18
Table 2. Average road characteristics according to terrain type.
Average road characteristics Unit Two lane roads Motorways
Flat Rolling Mountain Flat Rolling
Rise + Fall (m/km) 10 15 25 3 25
Average horizontal curvature (deg/km) 15 75 150 15 25
Average altitude of terrain (m) 100 200 500 100 200
Speed limit (km/h) 80 80 60 120 120
1[𝑙𝑖𝑡] 𝑜𝑓 𝑑𝑖𝑒𝑠𝑒𝑙 𝑓𝑢𝑒𝑙
100[𝑘𝑚]=
(1.03 ÷ 1,11) ∙ 1[𝑚3] 𝑛𝑎𝑡𝑢𝑟𝑎𝑙 𝑔𝑎𝑠
100[𝑘𝑚]
(3)
However, under real conditions of exploitation this relationship is not constant and it depends on different
factors such as transport factors (the transport volume expressed in the number of transported passengers per hour, vehicle mode, the time of vehicle operation, the conditions of technical maintenance), road factors (the elements of profile and itinerary, the type and condition of pavement, traffic flow characteristics), natural climatic conditions (environmental temperature, pavement wetness, visibility) and the quality of energy substances. In urban conditions, according to the research conducted in the territory of the city of Belgrade in 2008, the value of the fuel equivalent is between 1.12-1.18 (GSP, 2009).
The process of determining the fuel equivalent, used in this paper, is carried out on the basis of research on the fuel consumption of CNG IK104 buses with a factory-made engine optimised for using RABA G10 DE-TURBO natural
gas. The research was conducted in the period of three years from 2001 to 2003 on intercity routes Belgrade-Jagodina-Belgrade, Belgrade-Vrnjačka Banja-Belgrade and Belgrade-Loznica-Belgrade (Stevanović et al., 2004). Obtained research results are provided in Table 4.
The results of Table 4 have been compared with the
results of the fuel consumption of diesel powered buses at the same sections (Table 5). The results have been obtained by simulation in the Transtools (when bus transport demands are determined in the network) and consequently by using the HDM model (when fuel consumption is directly calculated by taking into account the adjusted speed of the bus which depends on transport demands in the network, terrain type and IRI). By comparing average fuel consumption of the CNG bus and diesel bus from Tables 4 and 5, the value of the fuel equivalent has been adopted:
𝐹𝐸 =29,01 [𝑚3𝐶𝑁𝐺/100𝑘𝑚 ]
26,93 [𝑙𝑖𝑡 𝑑𝑖𝑒𝑠𝑒𝑙 /100𝑘𝑚 ]= 1,08 (4)
The calculation of pollutant unit costs
In the procedure of calculating and analysing the costs of exhaust gas emissions, it is necessary to determine the unit costs of pollutants expressed in EUR/tonne. Several research projects and models which define and estimate external costs in the transport sector have been carried out in Europe since 2004. The most important include: HEATCO (Developing Harmonised European Approaches for Transport Costing and Project Assessment, 6th Framework Programme), CAFE CBA (Clean Air for Europe Programme, Cost Benefit Analysis of Air Quality),
TREMOVE policy assessment model, ASSET (Assessing Sensitiveness to Transport) GRACE (Generalisation of Research on Accounts and Cost Estimation, 6th Framework Programme). Some results of these projects are summed up in the IMPACT 2008 project from which came an Handbook on Estimation of External Costs in the Transport Sector. Following the Handbook, it is possible to
acquire the unit costs of pollutants in the form of EUR/tonne; these costs take into consideration the

9310 Afr. J. Bus. Manage.
Table 3. Calculated values of regression factors for determining fuel consumption of the vehicles.
Terrain IRI Regression coefficients
Cars
gasoline
Cars
diesel Bus
Light
truck
Medium
truck
Heavy
truck Articulated truck
Flat 2
a 0.1388564 0.1231656 0.3491178 0.1829522 0.2051383 0.4446695 0.5569924
b -0.0024858 -0.0022049 -0.0063880 -0.0030710 -0.0034635 -0.0086879 -0.0102722
c 0.0000162 0.0000143 0.0000596 0.0000323 0.0000353 0.0000744 0.0000871
R2
0.9789478 0.9652143 0.9779548 0.9843259 0.9847257 0.9423554 0.9645856
Flat 5
a 0.1469614 0.1303547 0.3652890 0.1892284 0.2102811 0.4612519 0.5828304
b -0.0027684 -0.0024556 -0.0066814 -0.0032266 -0.0036590 -0.0091280 -0.0107925
c 0.0000187 0.0000163 0.0000616 0.0000340 0.0000371 0.0000784 0.0000907
R2 0.9265652 0.9356899 0.9754784 0.9854125 0.9854125 0.9530278 0.9946585
Flat 8
a 0.1564186 0.1387433 0.3878647 0.1956869 0.2131787 0.5007172 0.6128304
b -0.0031556 -0.0027990 -0.0070895 -0.0034704 -0.0038246 -0.0108280 -0.0110025
c 0.0000230 0.0000202 0.0000651 0.0000371 0.0000397 0.0000976 0.0000967
R2 0.9922658 0.9898856 0.9856321 0.9842570 0.9815224 0.9980237 0.9784459
Flat 12
a 0.1682616 0.1492480 0.3888569 0.2035117 0.2238993 0.5097172 0.6750154
b -0.0036718 -0.0032569 -0.0050679 -0.0037954 -0.0043060 -0.0108880 -0.0131484
c 0.0000288 0.0000251 0.0000497 0.0000412 0.0000456 0.0001001 0.0001211
R2 0.9999848 0.9984521 0.9996521 0.9996523 0.9962548 0.9685500 0.9702146
Rolling 2
a 0.1462474 0.1297214 0.3477103 0.1883172 0.2140197 0.4689726 0.5803301
b -0.0026835 -0.0023803 -0.0059521 -0.0032437 -0.0037794 -0.0092784 -0.0105975
c 0.0000178 0.0000156 0.0000565 0.0000341 0.0000382 0.0000802 0.0000906
R2 0.9598995 0.9632513 0.9900125 0.9815445 0.9887325 0.9668541 0.9658897
Rolling 5
a 0.1516767 0.1345373 0.3635944 0.1921947 0.2179097 0.4760116 0.5928304
b -0.0028890 -0.0025626 -0.0062126 -0.0033510 -0.0038868 -0.0095088 -0.0106895
c 0.0000198 0.0000173 0.0000588 0.0000354 0.0000394 0.0000826 0.0000907
R2 0.9588745 0.9547841 0.9885474 0.9868552 0.9888451 0.9668923 0.9701444
Rolling 8
a 0.1700187 0.1508066 0.3808569 0.2031612 0.2298257 0.5217172 0.6800154
b -0.0036991 -0.0032811 -0.0051779 -0.0038331 -0.0044798 -0.0109880 -0.0130484
c 0.0000291 0.0000250 0.0000497 0.0000416 0.0000470 0.0001007 0.0001211
R2 0.9925146 0.9856327 0.9921549 0.9851254 0.9891548 0.9947886 0.9954166

Ivković et al. 9311
Table 3 contd.
Rolling 12
a 0.1928377 0.1585409 0.4235996 0.2261704 0.2508367 0.5597050 0.7246851
b -0.0049595 -0.0038290 -0.0068191 -0.0050289 -0.0056608 -0.0128762 -0.0148966
c 0.0000466 0.0000349 0.0000735 0.0000589 0.0000639 0.0001317 0.0001619
R2 0.9995418 0.9736526 0.9932525 0.9995632 0.9997548 0.9986475 0.9963333
Mountain 2
a 0.1565948 0.1388996 0.3597162 0.2000523 0.2234916 0.4720116 0.6028304
b -0.0030675 -0.0027208 -0.0044609 -0.0036787 -0.0039763 -0.0095088 -0.0107025
c 0.0000214 0.0000188 0.0000437 0.0000382 0.0000401 0.0000849 0.0000926
R2 0.9617459 0.9632523 0.9652321 0.9888445 0.9927563 0.9855630 0.9844745
Mountain 5
a 0.1589341 0.1409745 0.3697162 0.2024159 0.2261550 0.5107172 0.6158304
b -0.0031656 -0.0028079 -0.0044713 -0.0037326 -0.0040219 -0.0108880 -0.0108025
c 0.0000225 0.0000197 0.0000439 0.0000391 0.0000407 0.0000991 0.0000966
R2 0.9701545 0.9685453 0.9712570 0.9879665 0.9914254 0.9889980 0.9896523
Mountain 8
a 0.1719739 0.1525409 0.3918569 0.2112094 0.2355231 0.5247172 0.6940154
b -0.0037528 -0.0033287 -0.0050779 -0.0041227 -0.0043600 -0.0109682 -0.0130504
c 0.0000296 0.0000256 0.0000497 0.0000444 0.0000458 0.0001022 0.0001212
R2 0.9939855 0.9932521 0.9897546 0.9879556 0.9860214 0.9985456 0.9658780
Mountain 12
a 0.1944455 0.1605409 0.4325996 0.2351771 0.2597035 0.5747050 0.7546851
b -0.0049410 -0.0038290 -0.0067191 -0.0052965 -0.0056551 -0.0128762 -0.0155966
c 0.0000470 0.0000357 0.0000735 0.0000617 0.0000638 0.0001327 0.0001724
R2 0.9999479 0.9981442 0.9997523 0.9985452 0.9993521 0.9985446 0.9889980
negative consequences of traffic such as: the adverse effect on human health (mortality, morbidity), the impacts on buildings and materials from air pollutants, crop losses in agriculture and impacts on the biosphere, the impacts on
biodiversity and ecosystems, climate change. The Handbook provides estimated unit costs of pollutant
values for each of the 27 countries of the European Union, that is, for NOx, SOx, VOC and PM. Since the Republic of Serbia is not an EU member state and there are no available data, for the purpose of this research two values of unit costs are obtained; they are calculated by
pondering, in the first case, the number of citizens with respect to 27 countries of the EU, and in the second case,
the GDP per a citizen, also with respect to 27 countries of the EU. The final values are obtained by averaging the two previously calculated values. The results of the calculation and average adopted value of pollutant unit costs are listed
in Table 6. The unit costs of CH4 and CO pollutants, which cause
global warming, are determined according to the unit cost of carbon dioxide and a corresponding Global Warming Potential (GWP) of a certain pollutant. In the first step, the central value of carbon dioxide of 25 EUR/tonne is adopted according to the Handbook, Impact 2008. In the second
step, methane and carbon monoxide emission is transformed into an equivalent emission of carbon dioxide
by using the GWP. The values of the GWP for methane and carbon monoxide are 23 and 1.9 respectively (IPCC, 2007; Maibach et al., 2008), which means that the unit costs of these two pollutants are as follows: for methane
575 EUR/tonne and for carbon monoxide 47.5 EUR/tonne. It is necessary to underline that carbon monoxide, which appears as a by-product of incomplete fuel consumption, is not a primary pollutant from the aspect of global warming, it, in fact, indirectly prevents methane and troposphere ozone reduction through chemical reactions with other atmospheric components (e.g. the hydroxyl radical, OH)
(EPA, 2008). From this standpoint and taking into consideration the area of research in the paper, that is, the

9312 Afr. J. Bus. Manage.
Table 4. Research results of natural gas consumption of IK104 CNG buses under real condit ions.
Location
Kilometres travelled
(km)
Gas pressure in tanks place of
origin-destination
(bar)
Gas temperature in tanks place of
origin-destination (ºC)
The amount of gas in tanks, place of origin-destination
(m3)
Total fuel consumption
(m3)
Average fuel consumption
(m3/100 km)
Direction: Belgrade-Jagodina 159 195/150 9/15 187.28/141.28 46.00 28.93
Direction: Jagodina-Belgrade 158 150/100 15/10 140.28/96.17 45.11 28.55
Direction: Belgrade-Vrnjačka Banja 215 160/100 23/24 146.57/91.64 54.93 25.54
Direction: Vrnjačka Banja-Belgrade 222 98/25 21/24 91.03/23.60 67.43 30.37
Direction: Loznica-Belgrade 140 101/50 26/24 92.22/46.28 45.94 32.81
Average overall consumption 29.01
fact that the analysis of the costs of exhaust emission gases is carried out for the network of intercity
thoroughfares and not at the level of urban areas where CO has a major impact on human health, an adverse effect of carbon monoxide on the environment is perceived through its impact on global warming.
The calculation of average factors of vehicle exhausts gas emissions
The average factor of exhaust gas emissions includes the average emission of CO, NOx, NMVOC, CH4, PM, CO2, SOx pollutants for each relevant vehicle category, that is, passenger cars, buses, light medium and heavy trucks and
articulated trucks expressed in a gram of pollutant per kilogram of burnt fuel. For these values to be obtained and bearing in mind that the transport model for the simulation of transport demands includes traffic flows of passengers and goods whose origin and destination are outside the territory of the Republic of Serbia, the analysis and calculation of emission factors are acquired on the basis of data from EMEP/EEA Air Pollutant Emission Inventory Guidebook issued by the European Environment Agency. This Guidebook contains the methodology on the basis of which emission factors for each pollutant are determined as a function of fuel consumption. The methodology was initially developed within the 1985 Corinair project and it
has been updated several times since then (within the 1991 Corinair project and within the COPERT software of 1997, 2000 and 2007). The data are acquired f or 21
countries of the EU. The calculation of average values of the emissions from CO, NOx, NMVOC, CH4 and PM
pollutants in the function of fuel consumption shows a small difference between 21 monitored countries. Adopted values of average emission factors are listed in Table 7.
Sulphur dioxide emissions according to the Air Pollutant Emission Inventory Guidebook are estimated using the following formula:
𝐸𝑆𝑂2,𝑗𝐶𝐴𝐿𝐶 = 2 ∙ 𝑘𝑆,𝑚 ∙ 𝐹𝐶𝑗 ,𝑚
𝐶𝐴𝐿𝐶 , (5)
Where. 𝐸𝑆𝑂2,𝑗𝐶𝐴𝐿𝐶 = sulphur dioxide emission in kilogram; kS,m
= weight related sulphur content ("S") in fuel of type "m".
According to the literature, values of kS,m for gasoline and diesel fuel are: kS,gasoline = 340 mg/kg , kS,diesel = 350 mg/kg
(Genčić and Radovanović, 2008). 𝐹𝐶𝑗 ,𝑚𝐶𝐴𝐿𝐶 = calculated fuel
consumption of vehicle category "j" using fuel "m". While estimating emission factors of CNG bus exhaust
gases, it is necessary to take into consideration that the emission of harmful substances is dependent on the gas
supply system for engines that is, the way combustion mixture is formed, exploitation conditions, natural gas content and exhaust gas treatment (Ivković and Žeželj, 2009). The variants of the gas supply system for engines are based on the possibility of using:
i. The Otto engine with alternative power supply (either gasoline or gas power by installing a tank or an installation for supplying the engine with gas – the so-called bi-fuel);
ii. Diesel engines with diesel fuel and natural gas, by simultaneously blending diesel fuel and natural gas – the
so-called dual-fuel); iii. The engine optimised for natural gas operation. In this case, two concepts for the preparation of combustion mixture are possible: the preparation of stoichiometric mixture of gas and air (λ=1) and the preparation of lean mixture of gas and air (λ>1, λ=1.4-1.6).
Measuring and examining of bus exhaust gases can be performed, with mobile equipment, while the vehicle is in motion on the road or in laboratories where the simulation of exploitation conditions, vehicles are exposed to during a real-world ride, is performed (Pelkmans et al., 2001b). The simulation is realised in two ways by means of an engine and chassis dynamometer. Exploitation conditions are defined by means of corresponding test cycles. Every test cycle is described in terms of corresponding parameters such as: the duration of the cycle, trip length, maximum bus travelling speed, average speed, a number of stops per kilometre, average speed with no stops, mean and maximum acceleration, etc. Exhaust gas emissions depend on all these parameters and are consequently conditioned by a test type the vehicle complies with.
Natural gas content is changeable. Methane is the main component and its molar proportion in natural gas is between 80 and 90% (Hesterberg et al., 2008; Department of Enegy, 2002). Depending on gas content, its
characteristics as the fuel for vehicles are modified. The modification of gas properties has as its direct consequence a change in vehicle performances and as its
Ivković et al. 9313 Table 5. Fuel consumption of diesel buses, obtained by simulation at Belgrade-Jagodina, Belgrade-Loznica, Belgrade-Vr.Banja sections.
Link ID Terrain IRI Link
length (km)
Adjusted bus speed
(km/h)
Transport demand per link
(bus/day)
fuel consumption
per network link (l/day)
Fuel consumption
diesel bus
(l/100 km)
Itinerary
Bgd-Jgd
Itinerary
Bgd-Lzn
Itinerary
Bgd-V.Bnj
74520 1 2 24.35 57.44 147 656.56 18.34 +
74537 1 2 21.04 99.31 407 2652.63 30.98 + +
74566 1 2 9.95 99.32 484 1492.03 30.98 +
74567 1 5 4.49 59.91 23 19.30 18.67 +
74570 1 2 11.30 99.38 392 1370.69 30.94 +
74583 1 2 6.86 99.52 395 836.66 30.88 + +
74592 1 2 10.37 99.10 511 1646.96 31.08 + +
74599 1 2 27.05 52.84 275 1399.96 18.82 +
74600 1 2 12.10 99.38 439 1643.70 30.94 + +
74607 1 2 6.79 39.88 411 522.93 18.73 + +
74615 1 2 22.15 99.28 449 3082.18 30.99 + +
74618 1 2 40.16 99.93 228 2808.88 30.68 +
74620 1 2 14.29 99.62 448 1973.58 30.83 +
74623 2 2 35.59 58.91 70 486.87 19.54 +
74625 1 2 6.82 99.84 226 473.66 30.72 +
74679 1 2 10.36 97.29 602 1993.40 31.96 + +
74683 1 2 46.79 51.84 176 1538.02 18.68 +
74684 1 2 9.16 49.75 281 486.03 18.88 +
74689 2 2 23.62 96.18 568 4514.17 33.65 + +
74690 1 2 23.30 99.73 376 2695.81 30.77 + +
Average
consumption 26.93
indirect consequence raised or reduced harmful substance emissions. The magnitude of all changes is mostly affected by thermal power, the necessary amount of air for
combustion (for both mixture types λ=1 and λ>1), operation characteristics (octane number, methane, that is, cetane number).
In order to reduce noxious gas emissions within CNG bus exhaust systems, oxidation catalysts for the reduction of carbon monoxide, hydrocarbon and particulate matter (PM) are installed in λ>1 concept, and a three-way catalyst
for the reduction of nitrogen oxides, carbon monoxide and hydrocarbon in λ=1 concept.
So far a large number of papers tackling the research into CNG bus exhaust emissions have been published around the world but it is difficult to find data unified in the
way that it is shown in Table 7, and according to the corresponding gas powered engine concepts. Bearing this in mind as well as the previously described facts which have an impact on pollutant emissions, the adoption of exhaust gas emission factors of CNG buses is performed on the basis of several pieces of research, which are compatible with the aim of the research of this paper
(Table 8) (Ayala et al., 2003; Kado et al., 2005; Okamoto et al., 2006; Hesterberg et al., 2008, 2009; Pelkmans et al.,
2001a).
RESULTS AND DISCUSSION Research and calculation of vehicle exhaust emission costs, from the standpoint of using CNG buses for passenger transport in outer-city net-work, are carried out according to three different scenarios. The first scenario (Base Scenario)

9314 Afr. J. Bus. Manage.
Table 6. Pollutant unit costs.
Pollutant unit costs NOx
(eur/tonne)
NMVOC
(eur/tonne)
SOx
(eur/tonne)
PM2.5 (exhaust)
(eur/tonne)
Ponder: the number of citizens 5443.67 1075.73 6763.93 59125.46
Ponder: GDP/citizen 4967.65 1148.21 6246.21 56564.73
Average 5205.66 1111.97 6505.07 57845.09
Table 7. Adopted mean values of exhaust gas emission factors per vehicle category (gram of pollutant/kg of fuel).
Vehicle category CO NOx NMVOC CH4 PM CO2 (*1000)
Passenger cars gasoline 73.84 7.80 7.90 0.71 0.03 3.18
Passenger cars diesel 3.15 11.36 0.66 0.06 0.93 3.14
Buses 10.06 36.31 3.15 0.41 1.43 3.14
Light truck 8.14 15.87 1.72 0.09 1.85 3.14
Medium track 7.40 24.34 1.33 0.18 1.34 3.14
Heavy truck 6.67 32.81 0.94 0.27 0.83 3.14
Articulated truck 6.67 32.81 0.94 0.27 0.83 3.14
Table 8. Adopted values of exhaust gas emission factors of CNG buses (gram of pollutant/m3NG).
CNG buses CO NOx NMVOC CH4 PM CO2
CNG bus, λ=1, without a catalyst 9.07 17.05 0.54 6.39 0.03 1733.21
CNG bus, λ>1, with an oxygen catalyst 0.80 11.04 0.003 12.79 0.018 1560.37
CNG bus, λ=1, with a three-way catalyst 1.65 6.34 0.004 2.26 0.03 1887.18
includes transport demands in the transport network which were in effect in 2009, with an existing transport infrastructure. The second scenario (DoMin Scenario) includes transport demands in the transport network obtained by simulation in the Transtools transport model for 2027, they are obtained on the basis of origin-destination matrices of goods and passenger exchange between zones defined within or outside the territory of the Republic of Serbia for 2027 (according to the WorldNet database integrated into the Transtools model), that is, both national and international flows are included. According to this scenario, minimum investments in transport infrastructure are envisaged that is, the investments in current projects (Belgrade bypass: sector A Batajnica-Dobanovci, sector 5 Orlovača-Avalski put and sector 6 Avalski put-Bubanj Potok) and the investments in local and trunk road network maintenance. The third scenario (Total Scenario) includes the same as the DoMin Scenario, transport demands in the transport network for 2027 as well as 12 potential development projects in the road transport network (Figure 4) that is, 15 development projects in the railways network for the reasons stated in the first point of the paper. Apart from calculating the direct value of exhaust gas emission
costs, the aim of the selected scenarios is to carry out an analysis of the extent different transport conditions, which occur as a result of the completion of development projects in the road transport network, in the outer-city transport of passengers using CNG buses, have an effect on exhaust gas emission costs.
The results of the completed transport operation expressed in vehicle-kilometres travelled per year for the entire road transport network in the territory of Serbia are given in Table 9. In the first, Base Scenario, that is, in 2009, the transport operation of 7.97 million vehicle-kilometres was realised. The transport operation with the highest percentage of 6.59 billion vehicle-kilometres corresponds to the category of passenger cars while the transport operation for the category of buses and all truck vehicles equals 259 million and 1.12 billion vehicle-kilometres respectively. By means of data analysis in relation to the DoMin Scenario (2027) it can be noted that the realised transport operation has increased with respect to all vehicle categories with a growth rate of 201.20% for passenger cars, 17.26% for buses, 134.78% in total, for trunk vehicles, which is a result of the upward trend of socio-economic indicators until the year of 2027. An increase in the transport operation of passenger cars

Ivković et al. 9315
Figure 4. Development projects in the total scenario.
Table 9. Realised transport operation for different vehicle categories according to different scenarios.
Veh. km/year (in millions) Base scenario DoMin scenario Total scenario
PC gasoline 3430 10330 11993
PC diesel 3166 9535 11071
Bus 259 304 200
Total pass. v. 6854 20169 23264
L. truck 79 186 177
M. truck 222 520 494
H. truck 349 820 779
A. truck 470 1103 1048
Total fr. Veh. 1120 2630 2498
Total all veh. 7974 22799 25762
with respect to the DoMin Scenario by 16.10% is typical of the Total Scenario, as well as the decrease of bus vehicle-kilometres by 34.01%. As it has already been
noted, the Total Scenario encompasses 12 potential development projects in the road sector, which consti-tutes the main reason for redirecting a certain number of

9316 Afr. J. Bus. Manage.
Figure 5. Distribution of exhaust gas emission costs for the base scenario.
passengers from the bus mode of transport to passenger car transport. The main reason for this is primarily related to the improvement of the level of service at certain sections of the road transport network, which feature in projects and in which total travel time from origin to destination is decreased due to an increase in speed of passenger cars. Since the Total Scenario encompasses the completion of infrastructural projects in the railways transport network, the redistribution by mode of goods flows from the road sector to the railways sector has occurred, which has brought about the decrease of freight vehicle-kilometres by 5.01% with respect to the DoMin Scenario.
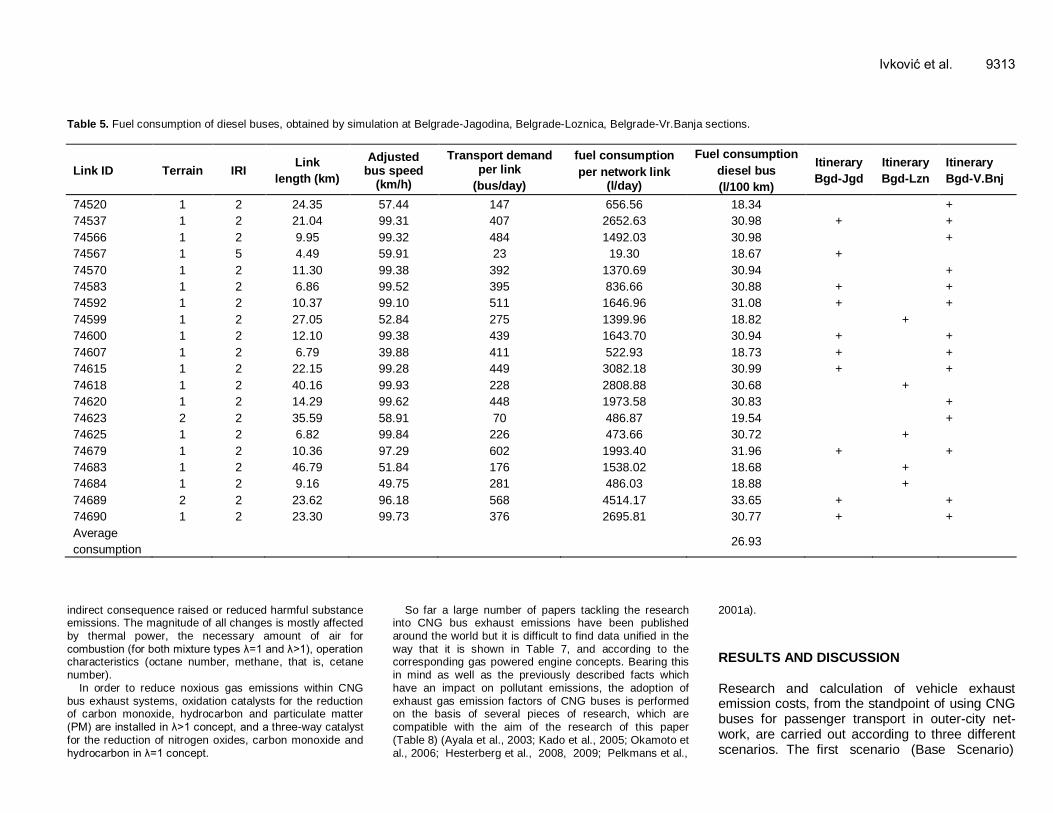
The distribution of exhaust gas emission costs according to different scenarios and different vehicle categories were shown in Figures 5, 6 and 7. The total exhaust gas emission costs of all vehicles in the entire transport network in the Base Scenario amount to 134.81 million euros. Passenger cars have the largest aggregate share in total costs with 39% and this is mostly due to carbon dioxide emission costs of 20.44 million euros, nitrogen oxides costs of 5.43 million euros, in relation to gasoline powered cars, and carbon dioxide costs of 9.22 million euros, nitrogen oxide costs of 6.95 million euros, PM costs of 6.28 million euros, in relation to diesel powered passenger cars. Exhaust gas emission costs of buses amount to 18.81 million euros, while in the case of trunk vehicles, articulated trucks and heavy trucks have the greatest share of 34.53 million euros, that is, 19.6 million euros. With respect to the Base Scenario, the structure of costs in the DoMin Scenario is somewhat modified. An increase in the emission costs of passenger cars is noted, from 39 to 49% in total value due to the
transport operation increase and in part due to raised fuel consumption (average consumption expressed in l/vehicle-kilometre) by 8.47%. The volume of the transport operation of buses is increased by 45 million vehicle-kilometres which caused an increase in emission costs by 17.37%. The percentage share of costs within the total amount for the DoMin Scenario which comes from trunk vehicles is decreased from 47 to 44%. The completion of development projects in the Total Scenario caused considerable differences regarding the redistribu-tion of costs in relation to all vehicle categories. The emission costs of passenger cars rose to 55% compared to total costs, bus emission costs decreased to 4% compared to total costs due to the smaller number of vehicle-kilometres travelled that is, a more substantial redirection of passengers to passenger cars in the amount of 34.21%. Owing to the application of development projects in the railways transport network and redistribution of goods flow to this mode of transport, a partial reduction in truck vehicle costs occurred in the Total Scenario. The reduction percentages are: 1.20% for light trucks, 1.71% for medium trucks, 4.35% for heavy trucks and 5.34% for articulated trucks.
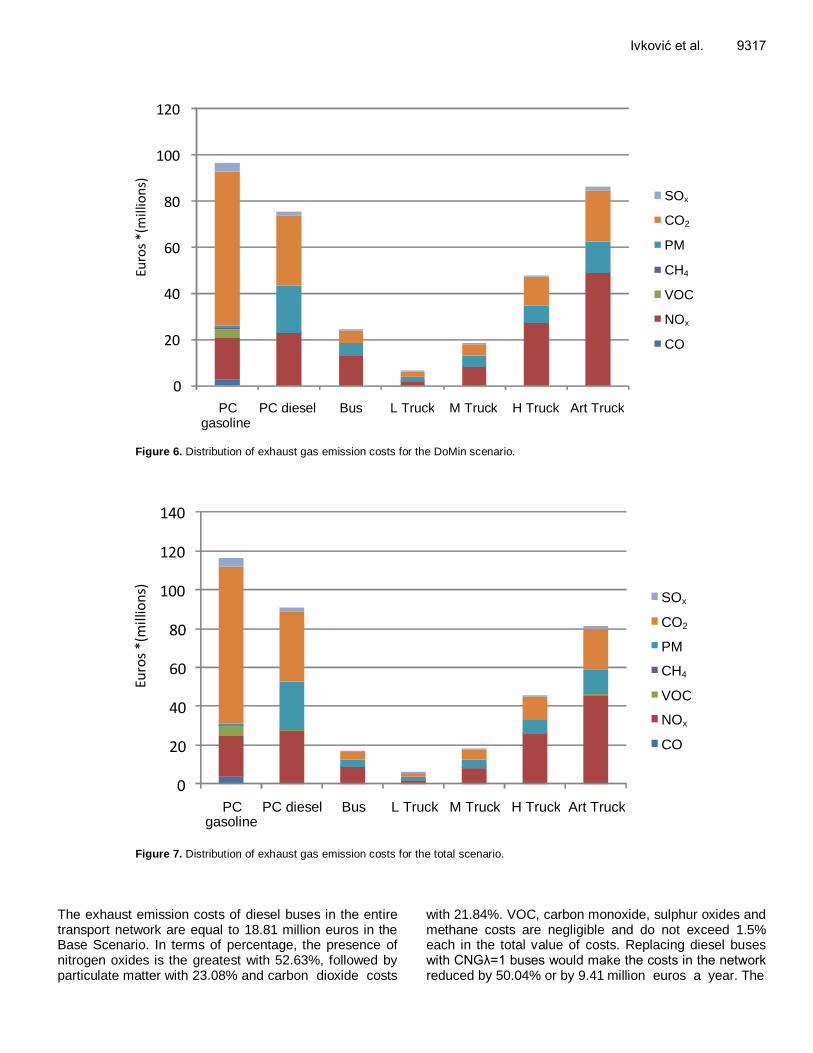
The exhaust emissions from diesel powered buses and gas powered buses (three variants: CNGλ=1 buses with the stoichiometric preparation of combustion mixture, CNGλ>1 buses with the preparation of lean-mixture combustion equipped with an oxygen catalyst, and CNGλ=1 buses with a three-way catalyst) in the entire transport network, per year, were given in Tables 10, 11 and 12. Exhaust gas emission costs of diesel powered buses and gas powered buses are shown in Figures 8, 9 and 10.
0
5
10
15
20
25
30
35
40
PC gasoline
PC diesel Bus L Truck M Truck H Truck Art Truck
Euros (i n millio ns)
SOx
CO2
PM
CH4
VOC
NOx
CO
Euro
s *(
mill
ion
s)
*(m
illio
ns)
Ivković et al. 9317
Figure 6. Distribution of exhaust gas emission costs for the DoMin scenario.
Figure 7. Distribution of exhaust gas emission costs for the total scenario.
The exhaust emission costs of diesel buses in the entire transport network are equal to 18.81 million euros in the Base Scenario. In terms of percentage, the presence of nitrogen oxides is the greatest with 52.63%, followed by particulate matter with 23.08% and carbon dioxide costs
with 21.84%. VOC, carbon monoxide, sulphur oxides and methane costs are negligible and do not exceed 1.5% each in the total value of costs. Replacing diesel buses with CNGλ=1 buses would make the costs in the network reduced by 50.04% or by 9.41 million euros a year. The
0
20
40
60
80
100
120
PC gasoline
PC diesel Bus L Truck M Truck H Truck Art Truck
Euros (i n millio ns)
SOx
CO2
PM
CH4
VOC
NOx
CO
Euro
s *(
mill
ion
s)
0
20
40
60
80
100
120
140
PC gasoline
PC diesel Bus L Truck M Truck H Truck Art Truck
Euros (i n millio ns)
SOx
CO2
PM
CH4
VOC
NOx
CO
Euro
s *(
mill
ion
s)
*(m
illio
ns)

9318 Afr. J. Bus. Manage.
Table 10. Exhaust gas emission from diesel and CNG powered buses for the base scenario.
Tonne/year base scenario CNGλ=1 Bus CNGλ>1 Bus, oc CNGλ=1 Bus, twc Diesel bus
CO 615.12 57.23 112.18 526.98
Nox 1155.53 785.40 429.71 1901.65
VOC 37.06 0.25 0.28 164.74
CH4 433.11 910.37 153.47 21.60
PM 2.17 1.30 2.16 75.05
CO2 117420.66 110996.88 127851.68 164312.38
Sox - - - 36.67
oc, Oxygen catalyse; twc, three-way catalyst.
Table 11. Exhaust gas emission from diesel and CNG powered buses for the DoMin scenario.
Tonne/year DoMin scenario
CNGλ=1 Bus CNGλ>1 Bus, oc CNGλ=1 Bus, twc Diesel bus
CO 794.61 73.93 144.92 680.75
Nox 1492.70 1014.57 555.09 2456.54
VOC 47.88 0.32 0.36 212.82
CH4 559.48 1176.00 198.25 27.90
PM 2.81 1.68 2.80 96.95
CO2 151683.35 143385.14 165158.07 212257.80
Sox - - - 47.36
oc, Oxygen catalyse; twc, three-way catalyst.
Table 12. Exhaust gas emissions from diesel and CNG powered buses for the total scenario.
Tonne/year total scenario CNGλ=1 Bus CNGλ>1 Bus, oc CNGλ=1 Bus, twc Diesel bus
CO 552.70 51.42 100.80 473.50
Nox 1038.26 705.69 386.10 1708.67
VOC 33.30 0.22 0.25 148.03
CH4 389.15 817.98 137.89 19.41
PM 1.95 1.17 1.94 67.43
CO2 105504.49 99732.62 114876.94 147637.51
Sox - - - 32.94
oc, Oxygen catalyse; twc, three-way catalyst.
biggest savings are achieved in reducing particulate matter costs by 4.21 million euros and nitrogen oxides by 3.88 million euros. Approximately the same carbon monoxide emission as with diesel powered buses is typical of this power concept as well as increased methane emissions, which makes the costs of this pollutant rise by 0.24 million euros. Using the other variant of CNG powered buses with the preparation of lean mixture for combustion, total emission costs are reduced by 63.31% or 11.34 million euros. Cost reduction is evident in all pollutants (5.81 million euros for nitrogen oxides, 4.27 million for particulate matter and 1.33 million euros for carbon monoxide) barring methane whose
costs are higher compared to CNGλ=1 buses by 53.70% or 0.27 million euros. Finally, the lowest exhaust gas emission costs while transporting passengers by bus would be achieved by using CNGλ=1 buses with a three-way catalyst.
The total costs of this concept are 5.65 million euros and by 69.95% lower than is the case with using diesel powered buses. Based on the results from the Figure 8, an increase in the emission costs for methane by 0.075 million euros against diesel powered buses is noted. As with the previous two variants of CNG bus concepts, the biggest savings are achieved on the basis of reducing costs of nitrogen oxide, particulate matter and carbon
Ivković et al. 9319
Figure 8. Exhaust gas emission costs of buses for the base scenario.
Figure 9. Exhaust gas emission costs of buses for the DoMin scenario.
dioxide emissions bearing in mind that the effects are more noticeable if exhaust gases are treated by a three-way catalyst. Due to the fact that there are no sulphur or sulphur compounds in natural gas, and on the basis of this pollutant, the reduction in emission costs by 0.24 million euros is achieved for all three CNG bus variants. Total exhaust gas emission costs of diesel powered buses in the DoMin Scenario are increased in relation to
the Base Scenario by 29.17% that is, 5.48 million euros. The reason for this is an increase in transport operation by 17.37% and averagely greater fuel consumption at the level of the entire transport network from 0.24 l/vehicle- kilometre in the Base Scenario to 0.27 l/vehicle-kilometre in the DoMin Scenario. By using CNGλ=1 buses, CNG λ>1 with an oxidation catalyst and CNGλ=1 bus with a three-way catalyst, exhaust gas emission costs are
0
2
4
6
8
10
12
14
16
18
20
CNG Bus, λ=1 CNG Bus,λ>1,oc CNG Bus, λ=1, twc
Diesel Bus
Euro
s (in
mill
ions)
Sox
CO2
PM
CH4
VOC
Nox
CO
CH4
C02
CH4
CO2
0
2
4
6
8
10
12
14
16
18
20
22
24
26
CNG Bus, λ=1 CNG Bus,λ>1,oc CNG Bus, λ=1, twc
Diesel Bus
Euro
s (in
mill
ions)
Sox
CO2
PM
CH4
VOC
Nox
CO
CH4
CO2

9320 Afr. J. Bus. Manage.
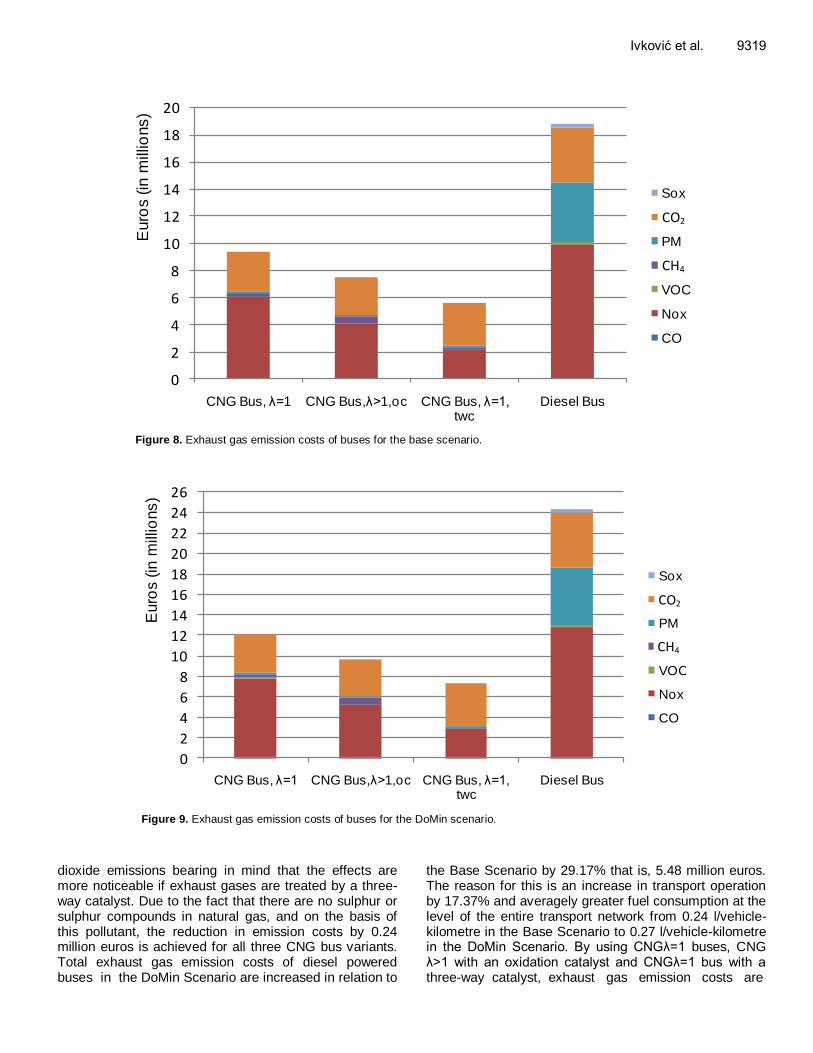
Figure 10. Exhaust gas emission costs of buses for the total scenario.
reduced by 12.15, 14.65 and 16.99 million euros, respectively.
According to the Total Scenario and on the basis of the data from Table 9, a decline in the realised bus transport operation at 200 million vehicle-kilometres can be noted, which is 59 million kilometres less than in the Base Scenario and 104 million vehicle-kilometres less than in the DoMin Scenario. The result of this fact is the reduction in total exhaust gas emission costs with respect to the Base Scenario (by 1.91 million euros) and with respect to the DoMin Scenario (by 7.40 million euros). However, barring the completed projects in the road sector, an increase in exhaust gas emission costs of buses per vehicle-kilometre is recorded with respect to two previous scenarios, it equals 0.084 euros/vehicle-kilometre for diesel powered buses (in the Base Scenario, it is 0.072 euros/vehicle-kilometre, in the DoMin Scenario it is 0.079 euros/vehicle-kilometre), CNGλ=1 buses 0.042 euros/vehicle-kilometre (in the Base Scenario it is 0.036 euros/vehicle-kilometre, in the DoMin Scenario 0.040 euros/vehicle-kilometre), CNGλ>1 buses with an oxidation catalyst 0.033 euros/vehicle-kilometre (in the Base Scenario it is 0.029 euros/vehicle-kilometre, in the DoMin Scenario 0.031 euros/vehicle-kilometre) and CNGλ=1 buses with a three-way catalyst 0.025 euros/vehicle-kilometre (in the Base Scenario it is 0.021 euros/vehicle-kilometre, in the DoMin Scenario 0.024 euros/vehicle-kilometre).
The reason for the increase in these values primarily lies in the higher speed of buses at road network sections that are included in the project, which results in greater fuel consumption. Furthermore, viewed at the level of the entire transport network barring the sections included in the Total Scenario project, the “traffic flow of a section/section capacity’’ ratio does not have a high enough value for the DoMin Scenario with respect to the same indicator in the Total Scenario for the fuel consumption of buses, and by extension, emission costs per vehicle-kilometres in the DoMin Scenario to be greater compared to the Total Scenario. Conclusions Using natural gas powered buses in intercity passenger transport, total exhaust gas emission costs are reduced from 50 to 70% compared to diesel powered buses, which is dependent on CNG bus concept that is, the way of preparing combustion mixture. The treatment of exhaust gases by means of a three-way catalyst in CNG buses with stoichiometric preparation of the mixture and oxidation catalyst in a CNG bus with the preparation of lean mixture, reduces exhaust gas emission costs by 20% that is, 10% compared to a CNG bus with no exhaust gases treatment. With respect to all three CNG power concepts, the biggest savings are achieved
0
2
4
6
8
10
12
14
16
18
20
CNG Bus, λ=1 CNG Bus,λ>1,oc CNG Bus, λ=1, twc
Diesel Bus
Euro
s (in
millio
ns)
Sox
CO2
PM
CH4
VOC
Nox
CO
Euro
s *(
mill
ions
)
0
2
4
6
8
10
12
14
16
18
20
CNG Bus, ?=1 CNG Bus, ?> 1 , oc CNG Bus, ?=1, twc
Diesel Bus
Euros (i n millio ns)
SOx
CO2
PM
CH 4
VOC
Nox
CO
Euros *(millions)

through the cost reduction of particulate matter, nitrogen oxides and carbon dioxide. Since the analysis was carried out for different exploitation conditions, simulated in three different scenarios, it is possible to conclude that an increase in bus speed at some sections of the transport network which are included in the Total Scenario project has an effect on the increase of exhaust emission costs expressed in euros/vehicle-kilometres in relation with the Base and DoMin Scenario. In other words, higher values of Intensity to Capacity Ratio (for the Base and DoMin scenario) do not distinctly make exhaust gas emission costs of buses per vehicle-kilometre in the Total Scenario lower than costs of the two previous scenarios. ACKNOWLEDGEMENT This paper is based on the project TR36027: "Software development and national database for strategic management and development of transportation means and infrastructure in road, rail, air and inland waterways transport using the European transport network models" which is supported by the Ministry of science and technological development of Republic of Serbia (2011-2014). REFERENCES
Ayala A, Kado N, Okamoto R, Gebel M, Rieger P, Kobayashi R,
Kuzmicky P (2003). CNG and diesel transit bus emissions in review.
9th Diesel Engine Emissions Reduction Conference. Newport, Rhode Island. August 24-28. CD edition.
Bickel P, Schmid S, Krewitt W, Friedrich R (1997). External costs of
transport in externe. Publishable Report, p. 24. Department of Enegy (2002). Compressed Natural Gas. Freedom CAR
and Vehicle Technologies Program. U.S. CD edition.
EEA-European Environment Agency (2007). Emission Inventory Guidebook. 151 p. Available from internet: <http://www.eea.europa.eu>.
EPA-Environmental Protection Agency (2008). Inventory of U.S.
Greenhouse Gas Emissions and Sinks: 1990 – 2006.Washington, U.S. April 15. Available from internet: <www.epa.gov>.
Filipović S, Tica S, Živanović P, Milovanović B (2009). Comparative
analysis of the basic features of the expected and perceived quality of mass passenger public transport service in Belgrade. Transport, 24(4): 265-273.
Genčić I, Radovanović B (2008). Quality of liquid fossil fuels in Republic of Serbia. Conference Post oil economy - why, how and when. Belgrade, Serbia. December 1. CD edition.
GSP (2009). Exploitation of bus MAZ-BIK-203 CNG-S in GSP Beograd. Belgrade, Serbia, p. 25.
Hesterberg T, Bunn W, Lapin C (2009). An evaluation of criteria for
selecting vehicles fueled with diesel or compressed natural gas. Sustainability: Science, Practice, Policy, 5(1): 20-30.
Ivković et al. 9321 Hesterberg T, Lapin C, Bunn W (2008). A comparison of emissions from
vehicles fueled with diesel or compressed natural gas. Environ. Sci. Technol., 42(17): 6437-6445.
IPCC-International Panel on Climate Change (2007). Climate change 2001: working group I: the scientific basis, Section 4, Table 6.7. Available from internet: http://www.ipcc.ch.
Ivković I, Žeželj S, (2009). Performances of the bus subsystem in Mass Public Transportation in terms of implementation of alternative fuel drive. 24th Conference, Maintenance of the Machine and Equipment.
Budva, Montenegro. June 11. 2009, CD edition. Kado N, Okamoto R, Kuzmicky P, Kobayashi R, Ayala A, Gebel M,
Rieger P, Maddox C, Zafonte L (2005). Emissions of toxic pollutants
from compressed natural gas and low sulfur diesel-fueled heavy-duty transit buses tested over multiple driving cycles. Environ. Sci. Technol., 39(19): 7638-7649.
Maibach M, Schreyer C, Sutter D, Van Essen H, Boon B, Smokers R, Schroten A, Doll C, Pawlowska B, Bak M (2008). Handbook on estimation of external costs in the transport sector. 336 p. Available
from internet: http://www.infras.ch. Matijosius J, Sokolovskij E (2009). Research into the quality of fuels and
their biocomponents. Transport, 24(3): 212-217.
Mudgal A, Gopalakrishnan K, Hallmark S (2011). Prediction of emissions from biodiesel fueled transit buses using artificial neural networks. Int. J. Traffic Transp. Engr., 1(2): 115-131.
Okamoto R, Kado N, Kuzmicky P, Ayala A, Kobayashi R (2006). Unregulated emissions from compressed natural gas (CNG) transit buses configured with and without oxidation catalyst. Environ. Sci.
Technol., 40(1): 332-341. Pelkmans L, De Keukeleere D, Bruneel H, Lenaers G (2001a).
Influence of vehicle test cycle characteristics on fuel consumption
and emissions of city buses. International Spring Fuels and Lubricants Meeting, Session: General Emissions (Part A&B). Orlando, Forida. May 7. Available from internet:
<http://papers.sae.org>. Pelkmans L, De Keukeleere D, Lenaers G (2001b). Emission and fuel
consumption of natural gas powered city buses versus diesel buses
in real city traffic. Urban Transport VII, Transaction: The Built Environment 52. Wessex Institute of Technology, United Kingdom. Available from internet: http://library.witpress.com.
Petrović J, Ivković I, Vujacić I, Žeželj S (2009). Possibilities of buses on alternative fuel in public urban transport in Belgrade. Technol. Econ. Dev. Econ., 15(1): 78-89.
Schreyer C, Maibach M, Guyer M (2008). Update external costs of transport 2005 for eu27. p. 31.
Statistical Office of the Republic of Serbia (2009). Transport, storage
and communications, 534: 125. Stevanović A, Nijemčević S, Žeželj S (2004). The analysis of
exploitation data on board bus IK104- CNG. NIS Energogas and Ikarbus A.D. Belgrade, Serbia, p. 45.